Oronogo, MO Map & Demographics
Oronogo Map
Oronogo Overview
$30,509
PER CAPITA INCOME
$93,375
AVG FAMILY INCOME
$85,143
AVG HOUSEHOLD INCOME
18.9%
WAGE / INCOME GAP [ % ]
81.1¢/ $1
WAGE / INCOME GAP [ $ ]
0.34
INEQUALITY / GINI INDEX
2,597
TOTAL POPULATION
1,271
MALE POPULATION
1,326
FEMALE POPULATION
95.85
MALES / 100 FEMALES
104.33
FEMALES / 100 MALES
35.5
MEDIAN AGE
3.3
AVG FAMILY SIZE
2.9
AVG HOUSEHOLD SIZE
1,319
LABOR FORCE [ PEOPLE ]
70.6%
PERCENT IN LABOR FORCE
2.3%
UNEMPLOYMENT RATE
Oronogo Zip Codes
Oronogo Area Codes
Income in Oronogo
Income Overview in Oronogo
Per Capita Income in Oronogo is $30,509, while median incomes of families and households are $93,375 and $85,143 respectively.
| Characteristic | Number | Measure |
| Per Capita Income | 2,597 | $30,509 |
| Median Family Income | 692 | $93,375 |
| Mean Family Income | 692 | $97,971 |
| Median Household Income | 910 | $85,143 |
| Mean Household Income | 910 | $86,041 |
| Income Deficit | 692 | $0 |
| Wage / Income Gap (%) | 2,597 | 18.87% |
| Wage / Income Gap ($) | 2,597 | 81.13¢ per $1 |
| Gini / Inequality Index | 2,597 | 0.34 |
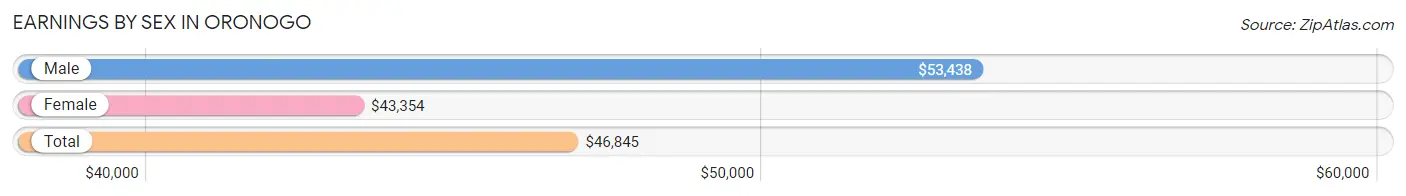
Earnings by Sex in Oronogo
Average Earnings in Oronogo are $46,845, $53,438 for men and $43,354 for women, a difference of 18.9%.
| Sex | Number | Average Earnings |
| Male | 665 (49.4%) | $53,438 |
| Female | 682 (50.6%) | $43,354 |
| Total | 1,347 (100.0%) | $46,845 |
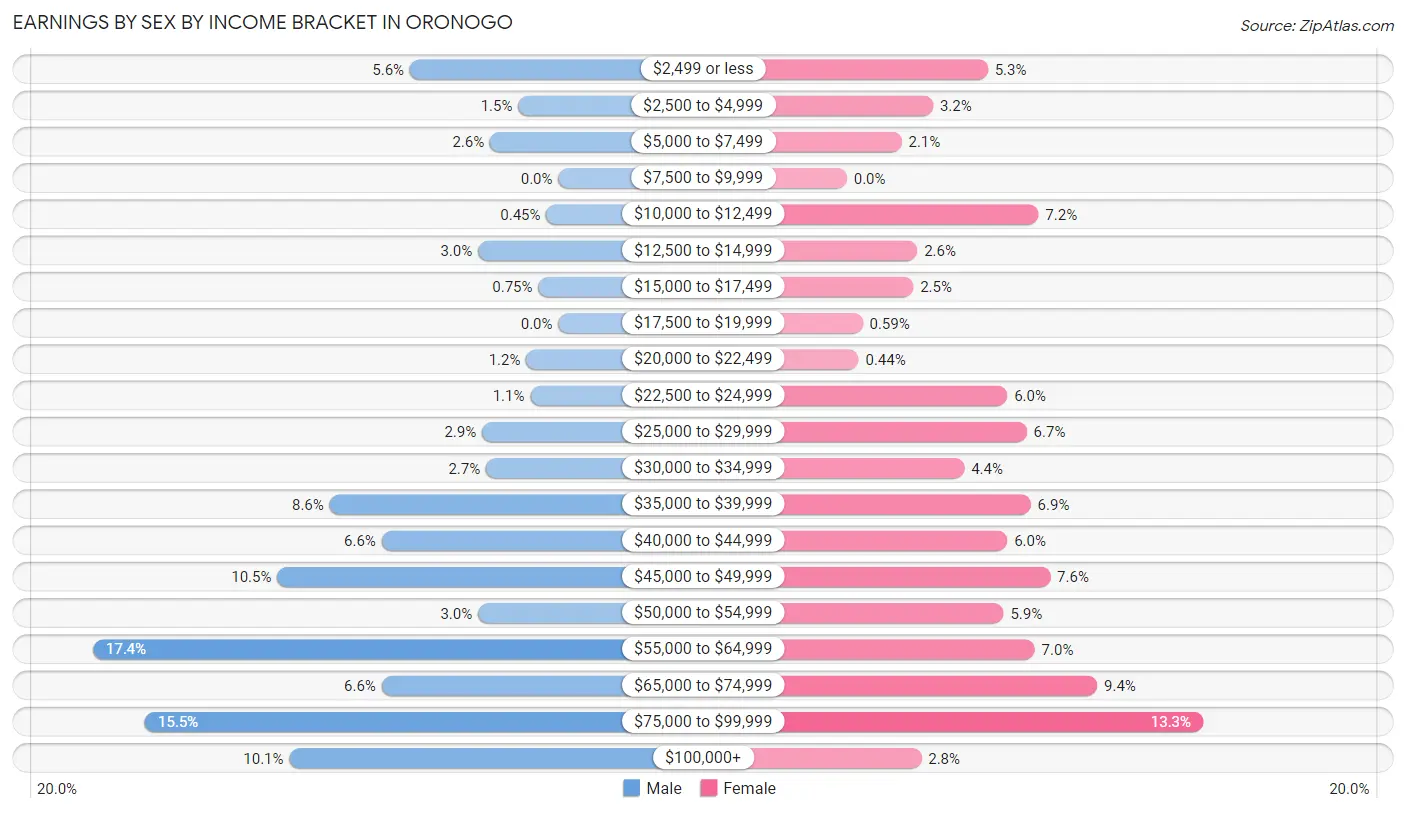
Earnings by Sex by Income Bracket in Oronogo
The most common earnings brackets in Oronogo are $55,000 to $64,999 for men (116 | 17.4%) and $75,000 to $99,999 for women (91 | 13.3%).
| Income | Male | Female |
| $2,499 or less | 37 (5.6%) | 36 (5.3%) |
| $2,500 to $4,999 | 10 (1.5%) | 22 (3.2%) |
| $5,000 to $7,499 | 17 (2.6%) | 14 (2.1%) |
| $7,500 to $9,999 | 0 (0.0%) | 0 (0.0%) |
| $10,000 to $12,499 | 3 (0.4%) | 49 (7.2%) |
| $12,500 to $14,999 | 20 (3.0%) | 18 (2.6%) |
| $15,000 to $17,499 | 5 (0.7%) | 17 (2.5%) |
| $17,500 to $19,999 | 0 (0.0%) | 4 (0.6%) |
| $20,000 to $22,499 | 8 (1.2%) | 3 (0.4%) |
| $22,500 to $24,999 | 7 (1.1%) | 41 (6.0%) |
| $25,000 to $29,999 | 19 (2.9%) | 46 (6.7%) |
| $30,000 to $34,999 | 18 (2.7%) | 30 (4.4%) |
| $35,000 to $39,999 | 57 (8.6%) | 47 (6.9%) |
| $40,000 to $44,999 | 44 (6.6%) | 41 (6.0%) |
| $45,000 to $49,999 | 70 (10.5%) | 52 (7.6%) |
| $50,000 to $54,999 | 20 (3.0%) | 40 (5.9%) |
| $55,000 to $64,999 | 116 (17.4%) | 48 (7.0%) |
| $65,000 to $74,999 | 44 (6.6%) | 64 (9.4%) |
| $75,000 to $99,999 | 103 (15.5%) | 91 (13.3%) |
| $100,000+ | 67 (10.1%) | 19 (2.8%) |
| Total | 665 (100.0%) | 682 (100.0%) |
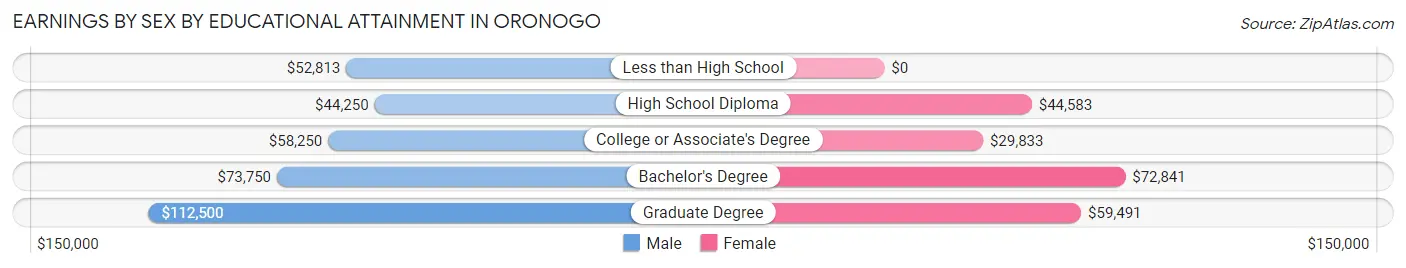
Earnings by Sex by Educational Attainment in Oronogo
Average earnings in Oronogo are $58,018 for men and $45,513 for women, a difference of 21.5%. Men with an educational attainment of graduate degree enjoy the highest average annual earnings of $112,500, while those with high school diploma education earn the least with $44,250. Women with an educational attainment of bachelor's degree earn the most with the average annual earnings of $72,841, while those with college or associate's degree education have the smallest earnings of $29,833.
| Educational Attainment | Male Income | Female Income |
| Less than High School | $52,813 | $0 |
| High School Diploma | $44,250 | $44,583 |
| College or Associate's Degree | $58,250 | $29,833 |
| Bachelor's Degree | $73,750 | $72,841 |
| Graduate Degree | $112,500 | $59,491 |
| Total | $58,018 | $45,513 |
Family Income in Oronogo
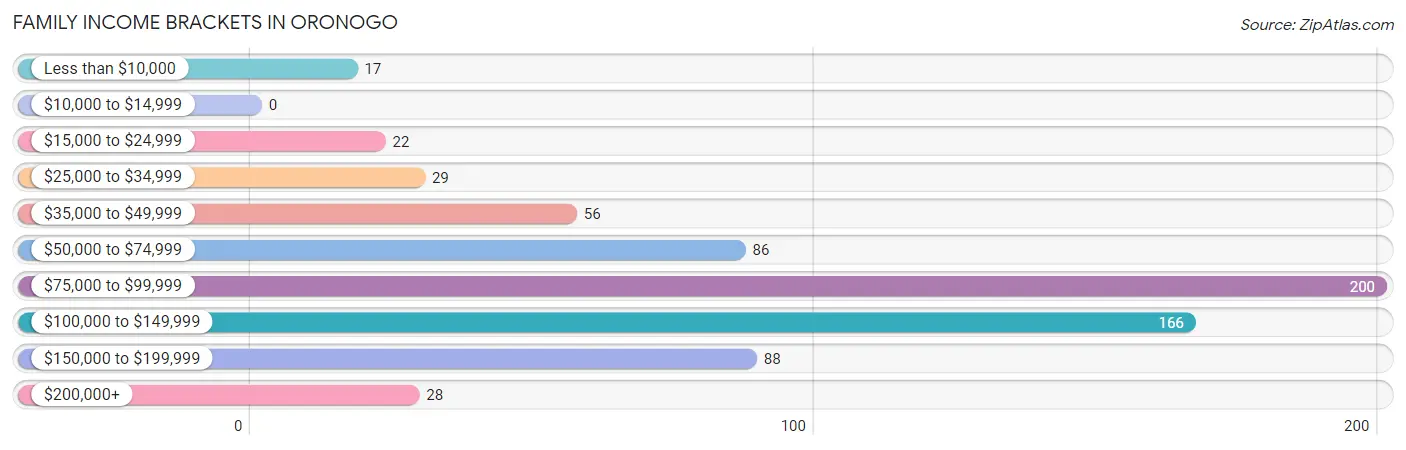
Family Income Brackets in Oronogo
According to the Oronogo family income data, there are 200 families falling into the $75,000 to $99,999 income range, which is the most common income bracket and makes up 28.9% of all families.
| Income Bracket | # Families | % Families |
| Less than $10,000 | 17 | 2.5% |
| $10,000 to $14,999 | 0 | 0.0% |
| $15,000 to $24,999 | 22 | 3.2% |
| $25,000 to $34,999 | 29 | 4.2% |
| $35,000 to $49,999 | 56 | 8.1% |
| $50,000 to $74,999 | 86 | 12.4% |
| $75,000 to $99,999 | 200 | 28.9% |
| $100,000 to $149,999 | 166 | 24.0% |
| $150,000 to $199,999 | 88 | 12.7% |
| $200,000+ | 28 | 4.0% |
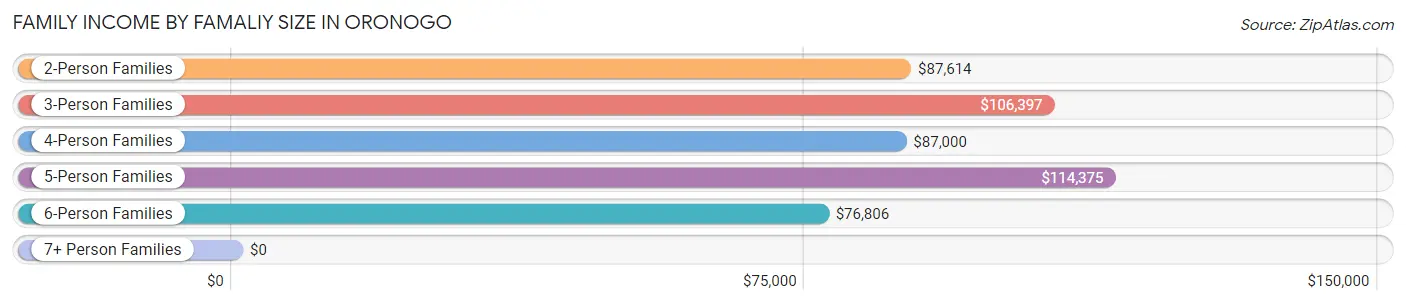
Family Income by Famaliy Size in Oronogo
5-person families (63 | 9.1%) account for the highest median family income in Oronogo with $114,375 per family, while 2-person families (287 | 41.5%) have the highest median income of $43,807 per family member.
| Income Bracket | # Families | Median Income |
| 2-Person Families | 287 (41.5%) | $87,614 |
| 3-Person Families | 163 (23.5%) | $106,397 |
| 4-Person Families | 156 (22.5%) | $87,000 |
| 5-Person Families | 63 (9.1%) | $114,375 |
| 6-Person Families | 23 (3.3%) | $76,806 |
| 7+ Person Families | 0 (0.0%) | $0 |
| Total | 692 (100.0%) | $93,375 |
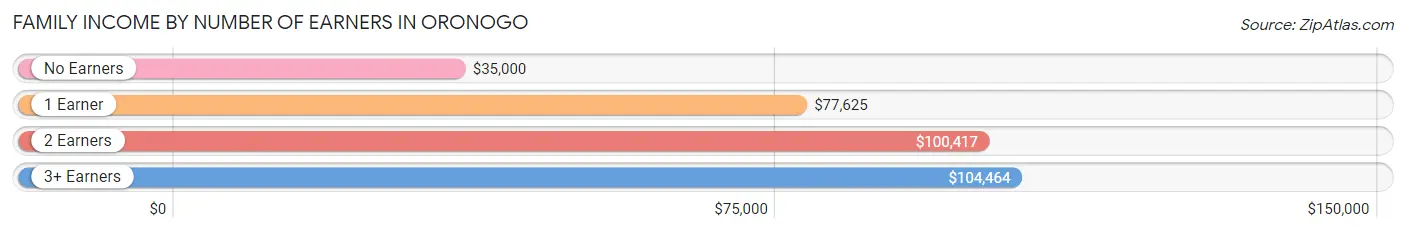
Family Income by Number of Earners in Oronogo
The median family income in Oronogo is $93,375, with families comprising 3+ earners (70) having the highest median family income of $104,464, while families with no earners (86) have the lowest median family income of $35,000, accounting for 10.1% and 12.4% of families, respectively.
| Number of Earners | # Families | Median Income |
| No Earners | 86 (12.4%) | $35,000 |
| 1 Earner | 171 (24.7%) | $77,625 |
| 2 Earners | 365 (52.7%) | $100,417 |
| 3+ Earners | 70 (10.1%) | $104,464 |
| Total | 692 (100.0%) | $93,375 |
Household Income in Oronogo
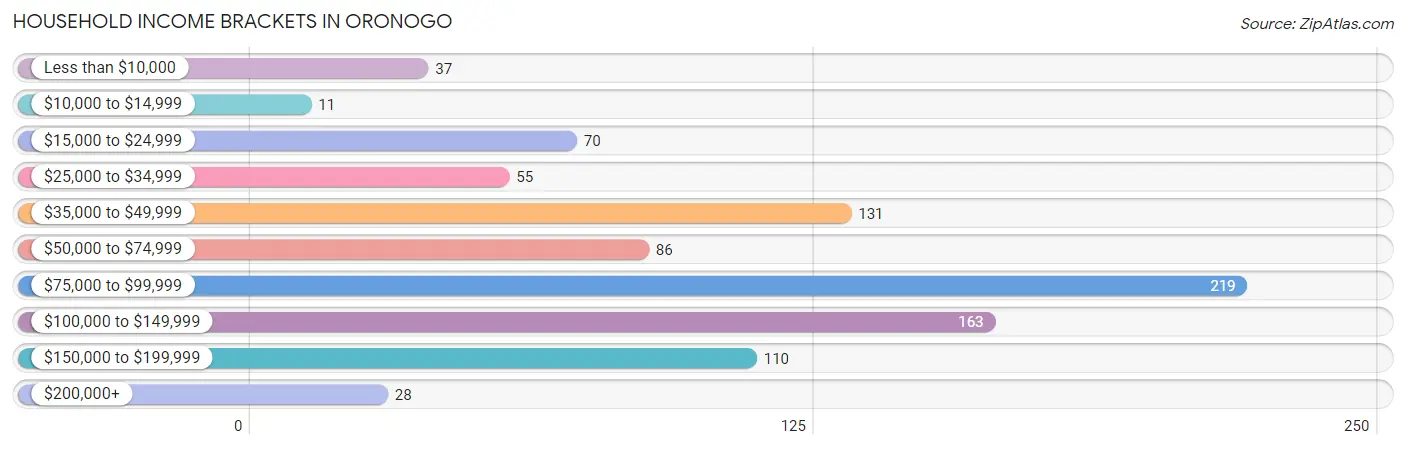
Household Income Brackets in Oronogo
With 219 households falling in the category, the $75,000 to $99,999 income range is the most frequent in Oronogo, accounting for 24.1% of all households. In contrast, only 11 households (1.2%) fall into the $10,000 to $14,999 income bracket, making it the least populous group.
| Income Bracket | # Households | % Households |
| Less than $10,000 | 37 | 4.1% |
| $10,000 to $14,999 | 11 | 1.2% |
| $15,000 to $24,999 | 70 | 7.7% |
| $25,000 to $34,999 | 55 | 6.0% |
| $35,000 to $49,999 | 131 | 14.4% |
| $50,000 to $74,999 | 86 | 9.5% |
| $75,000 to $99,999 | 219 | 24.1% |
| $100,000 to $149,999 | 163 | 17.9% |
| $150,000 to $199,999 | 110 | 12.1% |
| $200,000+ | 28 | 3.1% |
Household Income by Householder Age in Oronogo
The median household income in Oronogo is $85,143, with the highest median household income of $95,469 found in the 25 to 44 years age bracket for the primary householder. A total of 471 households (51.8%) fall into this category. Meanwhile, the 15 to 24 years age bracket for the primary householder has the lowest median household income of $0, with 14 households (1.5%) in this group.
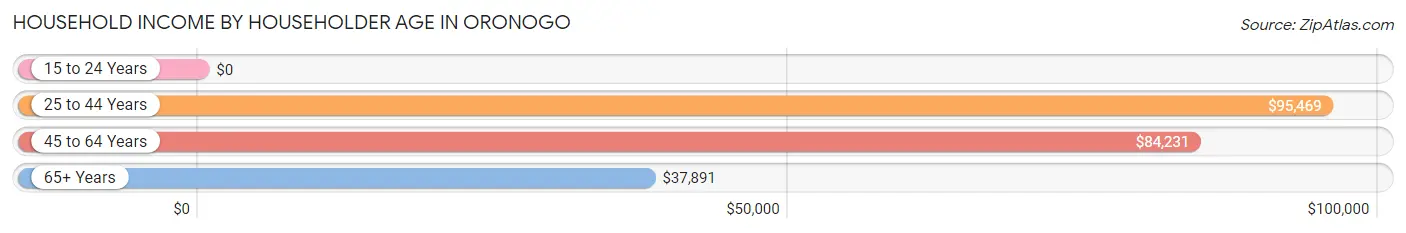
| Income Bracket | # Households | Median Income |
| 15 to 24 Years | 14 (1.5%) | $0 |
| 25 to 44 Years | 471 (51.8%) | $95,469 |
| 45 to 64 Years | 262 (28.8%) | $84,231 |
| 65+ Years | 163 (17.9%) | $37,891 |
| Total | 910 (100.0%) | $85,143 |
Poverty in Oronogo
Income Below Poverty by Sex and Age in Oronogo
With 7.0% poverty level for males and 5.7% for females among the residents of Oronogo, 65 to 74 year old males and 5 year old females are the most vulnerable to poverty, with 28 males (28.9%) and 5 females (35.7%) in their respective age groups living below the poverty level.
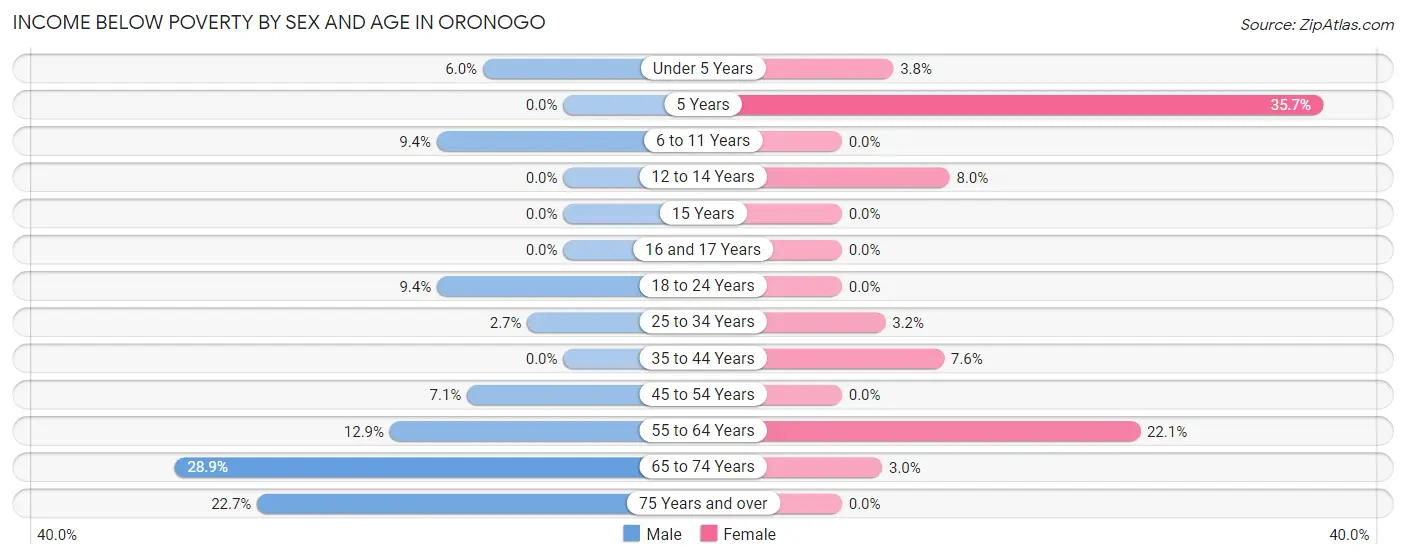
| Age Bracket | Male | Female |
| Under 5 Years | 4 (6.0%) | 5 (3.8%) |
| 5 Years | 0 (0.0%) | 5 (35.7%) |
| 6 to 11 Years | 20 (9.4%) | 0 (0.0%) |
| 12 to 14 Years | 0 (0.0%) | 4 (8.0%) |
| 15 Years | 0 (0.0%) | 0 (0.0%) |
| 16 and 17 Years | 0 (0.0%) | 0 (0.0%) |
| 18 to 24 Years | 3 (9.4%) | 0 (0.0%) |
| 25 to 34 Years | 4 (2.7%) | 8 (3.2%) |
| 35 to 44 Years | 0 (0.0%) | 20 (7.6%) |
| 45 to 54 Years | 8 (7.1%) | 0 (0.0%) |
| 55 to 64 Years | 17 (12.9%) | 29 (22.1%) |
| 65 to 74 Years | 28 (28.9%) | 4 (3.0%) |
| 75 Years and over | 5 (22.7%) | 0 (0.0%) |
| Total | 89 (7.0%) | 75 (5.7%) |
Income Above Poverty by Sex and Age in Oronogo
According to the poverty statistics in Oronogo, males aged 5 years and females aged 6 to 11 years are the age groups that are most secure financially, with 100.0% of males and 100.0% of females in these age groups living above the poverty line.
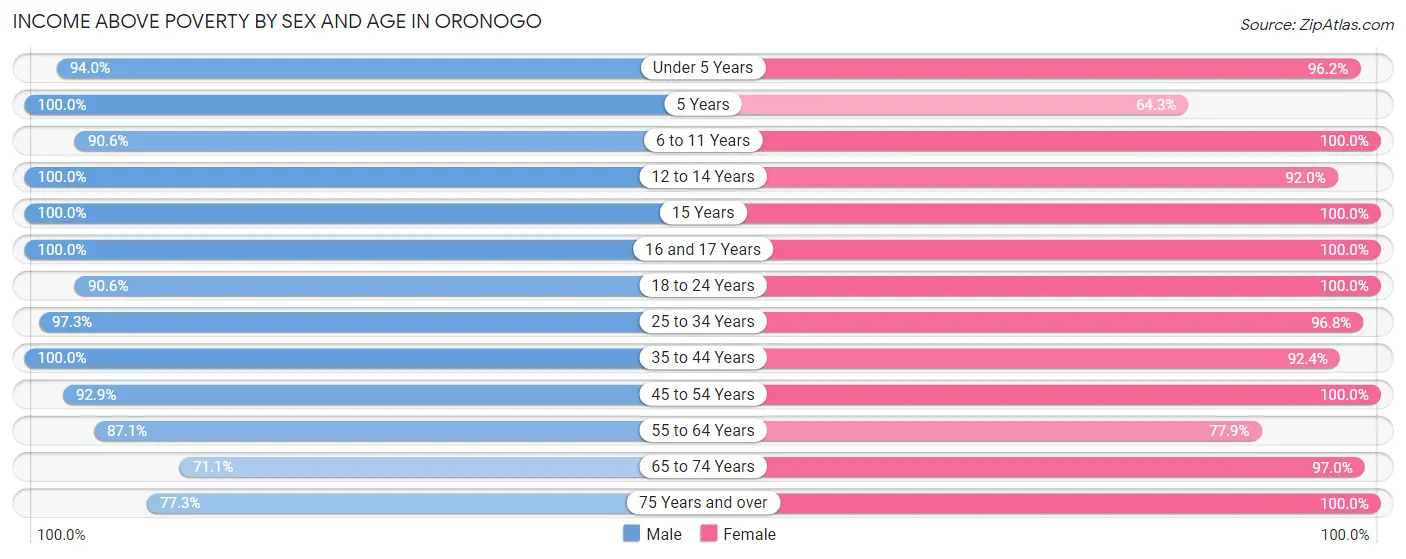
| Age Bracket | Male | Female |
| Under 5 Years | 63 (94.0%) | 126 (96.2%) |
| 5 Years | 52 (100.0%) | 9 (64.3%) |
| 6 to 11 Years | 193 (90.6%) | 84 (100.0%) |
| 12 to 14 Years | 66 (100.0%) | 46 (92.0%) |
| 15 Years | 20 (100.0%) | 32 (100.0%) |
| 16 and 17 Years | 27 (100.0%) | 52 (100.0%) |
| 18 to 24 Years | 29 (90.6%) | 36 (100.0%) |
| 25 to 34 Years | 146 (97.3%) | 240 (96.8%) |
| 35 to 44 Years | 281 (100.0%) | 244 (92.4%) |
| 45 to 54 Years | 104 (92.9%) | 120 (100.0%) |
| 55 to 64 Years | 115 (87.1%) | 102 (77.9%) |
| 65 to 74 Years | 69 (71.1%) | 130 (97.0%) |
| 75 Years and over | 17 (77.3%) | 30 (100.0%) |
| Total | 1,182 (93.0%) | 1,251 (94.3%) |
Income Below Poverty Among Married-Couple Families in Oronogo
The poverty statistics for married-couple families in Oronogo show that 4.1% or 22 of the total 531 families live below the poverty line. Families with 3 or 4 children have the highest poverty rate of 9.1%, comprising of 5 families. On the other hand, families with 1 or 2 children have the lowest poverty rate of 0.0%, which includes 0 families.
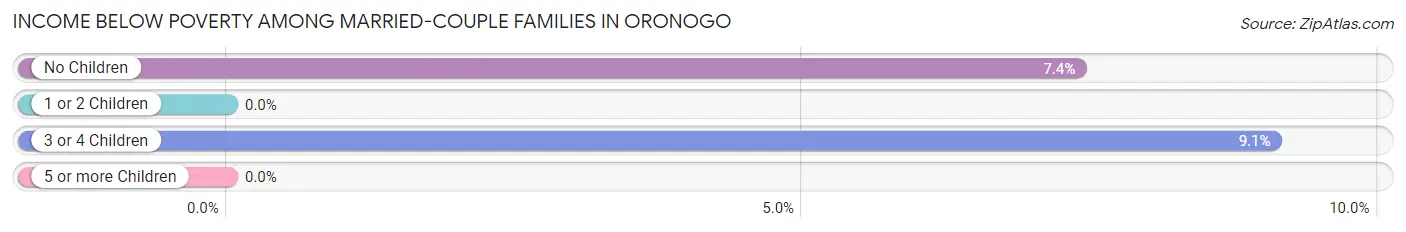
| Children | Above Poverty | Below Poverty |
| No Children | 213 (92.6%) | 17 (7.4%) |
| 1 or 2 Children | 246 (100.0%) | 0 (0.0%) |
| 3 or 4 Children | 50 (90.9%) | 5 (9.1%) |
| 5 or more Children | 0 (0.0%) | 0 (0.0%) |
| Total | 509 (95.9%) | 22 (4.1%) |
Income Below Poverty Among Single-Parent Households in Oronogo
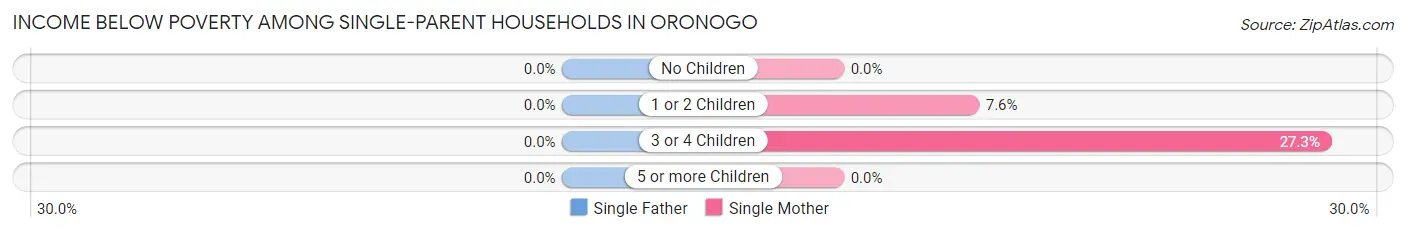
| Children | Single Father | Single Mother |
| No Children | 0 (0.0%) | 0 (0.0%) |
| 1 or 2 Children | 0 (0.0%) | 4 (7.5%) |
| 3 or 4 Children | 0 (0.0%) | 3 (27.3%) |
| 5 or more Children | 0 (0.0%) | 0 (0.0%) |
| Total | 0 (0.0%) | 7 (5.5%) |
Income Below Poverty Among Married-Couple vs Single-Parent Households in Oronogo
The poverty data for Oronogo shows that 22 of the married-couple family households (4.1%) and 7 of the single-parent households (4.3%) are living below the poverty level. Within the married-couple family households, those with 3 or 4 children have the highest poverty rate, with 5 households (9.1%) falling below the poverty line. Among the single-parent households, those with 3 or 4 children have the highest poverty rate, with 3 household (27.3%) living below poverty.
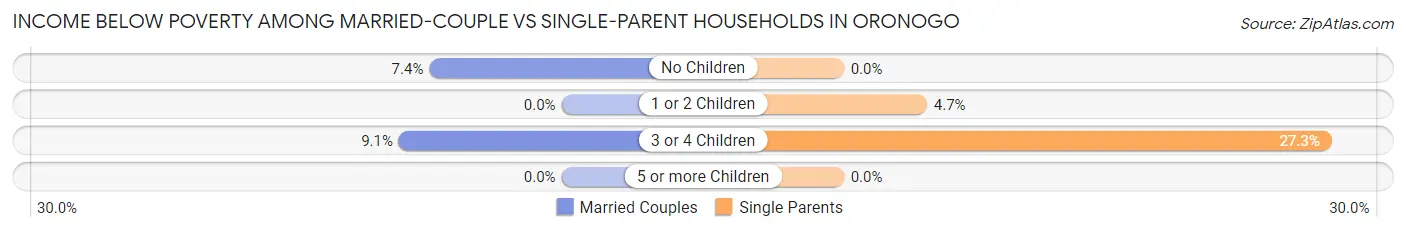
| Children | Married-Couple Families | Single-Parent Households |
| No Children | 17 (7.4%) | 0 (0.0%) |
| 1 or 2 Children | 0 (0.0%) | 4 (4.6%) |
| 3 or 4 Children | 5 (9.1%) | 3 (27.3%) |
| 5 or more Children | 0 (0.0%) | 0 (0.0%) |
| Total | 22 (4.1%) | 7 (4.3%) |
Race in Oronogo
The most populous races in Oronogo are White / Caucasian (2,404 | 92.6%), Two or more Races (120 | 4.6%), and Hispanic or Latino (46 | 1.8%).
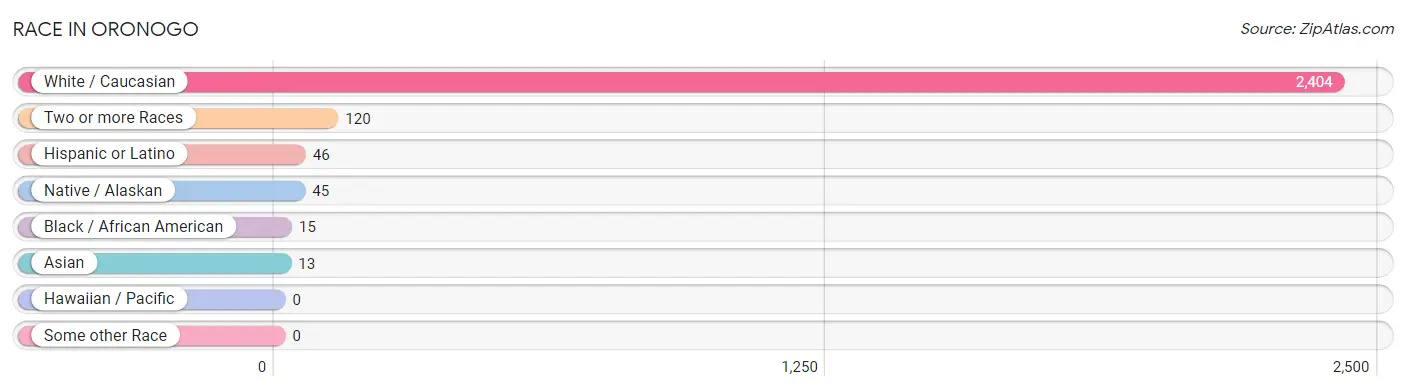
| Race | # Population | % Population |
| Asian | 13 | 0.5% |
| Black / African American | 15 | 0.6% |
| Hawaiian / Pacific | 0 | 0.0% |
| Hispanic or Latino | 46 | 1.8% |
| Native / Alaskan | 45 | 1.7% |
| White / Caucasian | 2,404 | 92.6% |
| Two or more Races | 120 | 4.6% |
| Some other Race | 0 | 0.0% |
| Total | 2,597 | 100.0% |
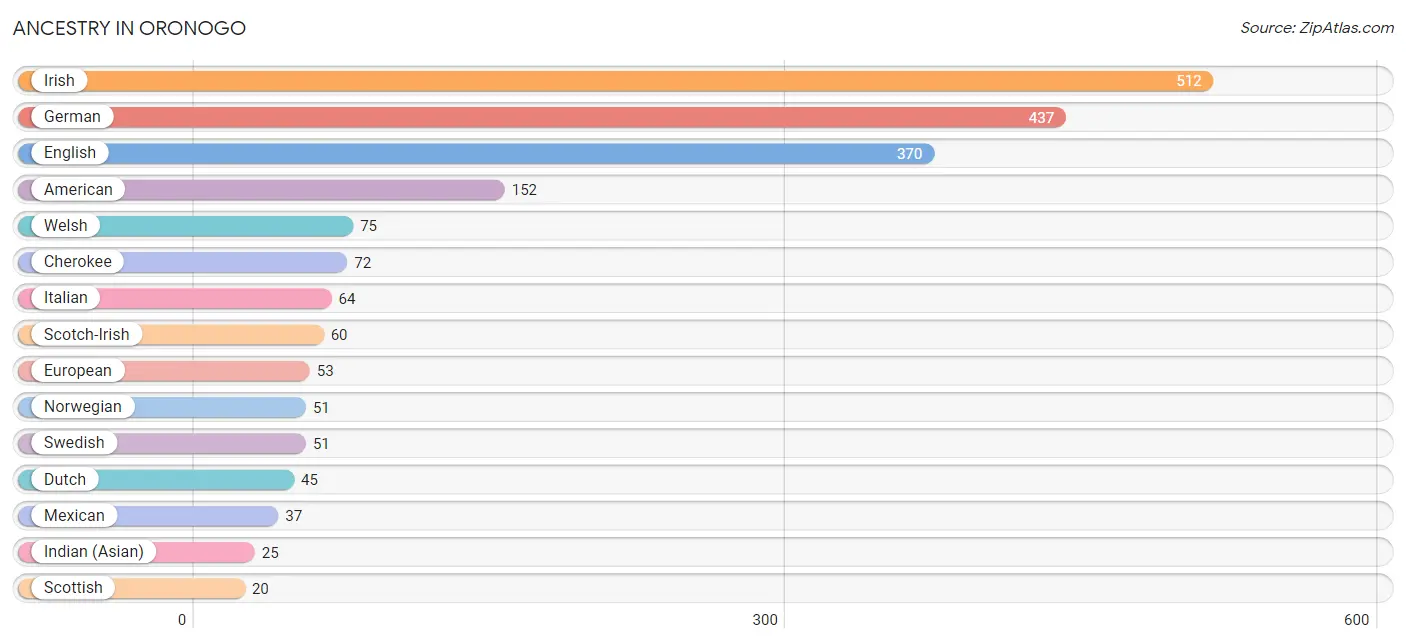
Ancestry in Oronogo
The most populous ancestries reported in Oronogo are Irish (512 | 19.7%), German (437 | 16.8%), English (370 | 14.2%), American (152 | 5.9%), and Welsh (75 | 2.9%), together accounting for 59.5% of all Oronogo residents.
| Ancestry | # Population | % Population |
| American | 152 | 5.9% |
| British | 15 | 0.6% |
| Canadian | 14 | 0.5% |
| Central American | 9 | 0.4% |
| Cherokee | 72 | 2.8% |
| Croatian | 6 | 0.2% |
| Dutch | 45 | 1.7% |
| English | 370 | 14.2% |
| European | 53 | 2.0% |
| French | 6 | 0.2% |
| German | 437 | 16.8% |
| Greek | 8 | 0.3% |
| Indian (Asian) | 25 | 1.0% |
| Irish | 512 | 19.7% |
| Italian | 64 | 2.5% |
| Kenyan | 10 | 0.4% |
| Mexican | 37 | 1.4% |
| Navajo | 7 | 0.3% |
| Norwegian | 51 | 2.0% |
| Panamanian | 9 | 0.4% |
| Polish | 15 | 0.6% |
| Scotch-Irish | 60 | 2.3% |
| Scottish | 20 | 0.8% |
| Subsaharan African | 10 | 0.4% |
| Swedish | 51 | 2.0% |
| Swiss | 7 | 0.3% |
| Welsh | 75 | 2.9% |
| Yugoslavian | 7 | 0.3% | View All 28 Rows |
Immigrants in Oronogo
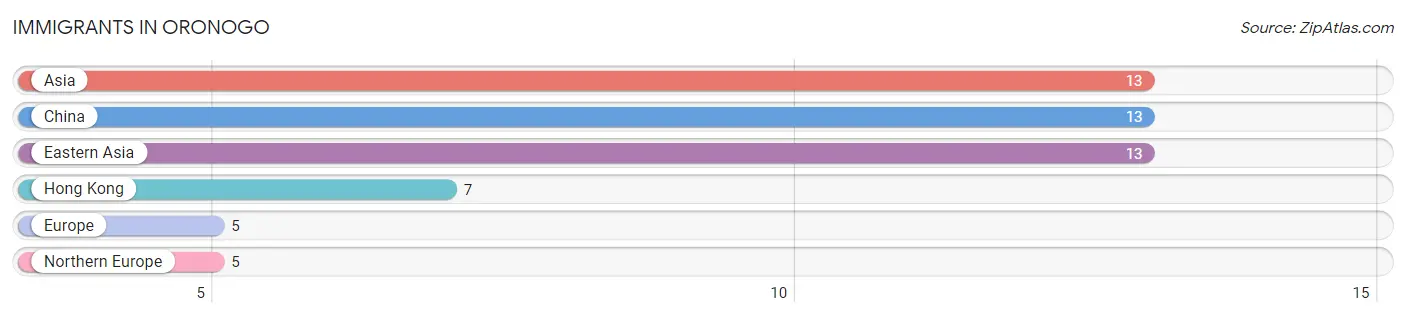
The most numerous immigrant groups reported in Oronogo came from Asia (13 | 0.5%), China (13 | 0.5%), Eastern Asia (13 | 0.5%), Hong Kong (7 | 0.3%), and Europe (5 | 0.2%), together accounting for 2.0% of all Oronogo residents.
| Immigration Origin | # Population | % Population |
| Asia | 13 | 0.5% |
| China | 13 | 0.5% |
| Eastern Asia | 13 | 0.5% |
| Europe | 5 | 0.2% |
| Hong Kong | 7 | 0.3% |
| Northern Europe | 5 | 0.2% | View All 6 Rows |
Sex and Age in Oronogo
Sex and Age in Oronogo
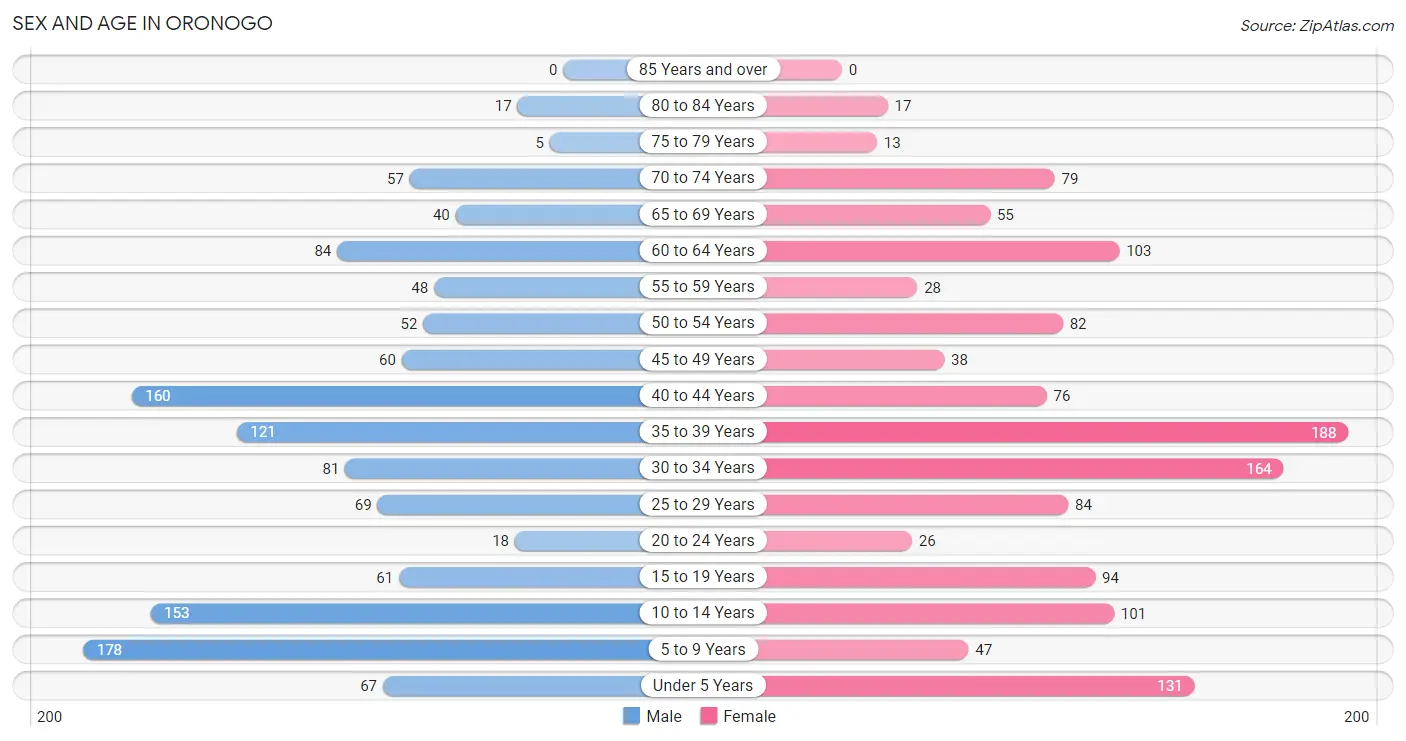
The most populous age groups in Oronogo are 5 to 9 Years (178 | 14.0%) for men and 35 to 39 Years (188 | 14.2%) for women.
| Age Bracket | Male | Female |
| Under 5 Years | 67 (5.3%) | 131 (9.9%) |
| 5 to 9 Years | 178 (14.0%) | 47 (3.5%) |
| 10 to 14 Years | 153 (12.0%) | 101 (7.6%) |
| 15 to 19 Years | 61 (4.8%) | 94 (7.1%) |
| 20 to 24 Years | 18 (1.4%) | 26 (2.0%) |
| 25 to 29 Years | 69 (5.4%) | 84 (6.3%) |
| 30 to 34 Years | 81 (6.4%) | 164 (12.4%) |
| 35 to 39 Years | 121 (9.5%) | 188 (14.2%) |
| 40 to 44 Years | 160 (12.6%) | 76 (5.7%) |
| 45 to 49 Years | 60 (4.7%) | 38 (2.9%) |
| 50 to 54 Years | 52 (4.1%) | 82 (6.2%) |
| 55 to 59 Years | 48 (3.8%) | 28 (2.1%) |
| 60 to 64 Years | 84 (6.6%) | 103 (7.8%) |
| 65 to 69 Years | 40 (3.2%) | 55 (4.2%) |
| 70 to 74 Years | 57 (4.5%) | 79 (6.0%) |
| 75 to 79 Years | 5 (0.4%) | 13 (1.0%) |
| 80 to 84 Years | 17 (1.3%) | 17 (1.3%) |
| 85 Years and over | 0 (0.0%) | 0 (0.0%) |
| Total | 1,271 (100.0%) | 1,326 (100.0%) |
Families and Households in Oronogo
Median Family Size in Oronogo
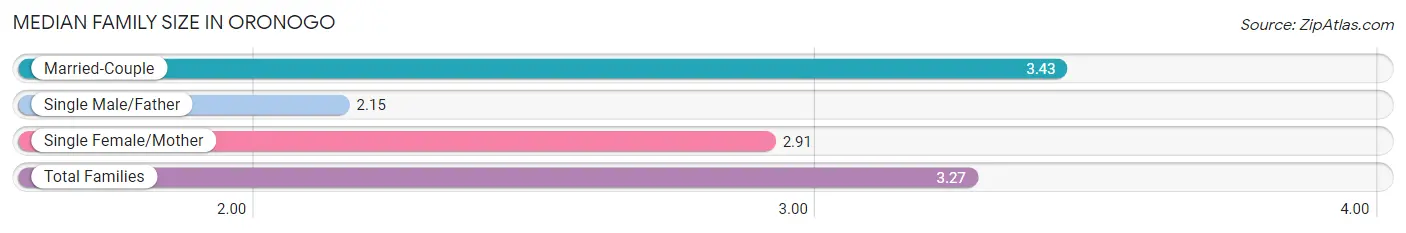
The median family size in Oronogo is 3.27 persons per family, with married-couple families (531 | 76.7%) accounting for the largest median family size of 3.43 persons per family. On the other hand, single male/father families (33 | 4.8%) represent the smallest median family size with 2.15 persons per family.
| Family Type | # Families | Family Size |
| Married-Couple | 531 (76.7%) | 3.43 |
| Single Male/Father | 33 (4.8%) | 2.15 |
| Single Female/Mother | 128 (18.5%) | 2.91 |
| Total Families | 692 (100.0%) | 3.27 |
Median Household Size in Oronogo
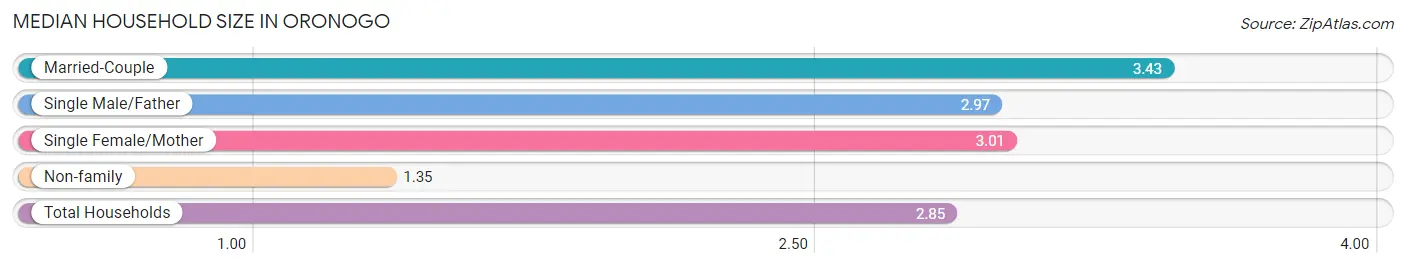
The median household size in Oronogo is 2.85 persons per household, with married-couple households (531 | 58.4%) accounting for the largest median household size of 3.43 persons per household. non-family households (218 | 24.0%) represent the smallest median household size with 1.35 persons per household.
| Household Type | # Households | Household Size |
| Married-Couple | 531 (58.4%) | 3.43 |
| Single Male/Father | 33 (3.6%) | 2.97 |
| Single Female/Mother | 128 (14.1%) | 3.01 |
| Non-family | 218 (24.0%) | 1.35 |
| Total Households | 910 (100.0%) | 2.85 |
Household Size by Marriage Status in Oronogo
Out of a total of 910 households in Oronogo, 692 (76.0%) are family households, while 218 (24.0%) are nonfamily households. The most numerous type of family households are 2-person households, comprising 265, and the most common type of nonfamily households are 1-person households, comprising 150.
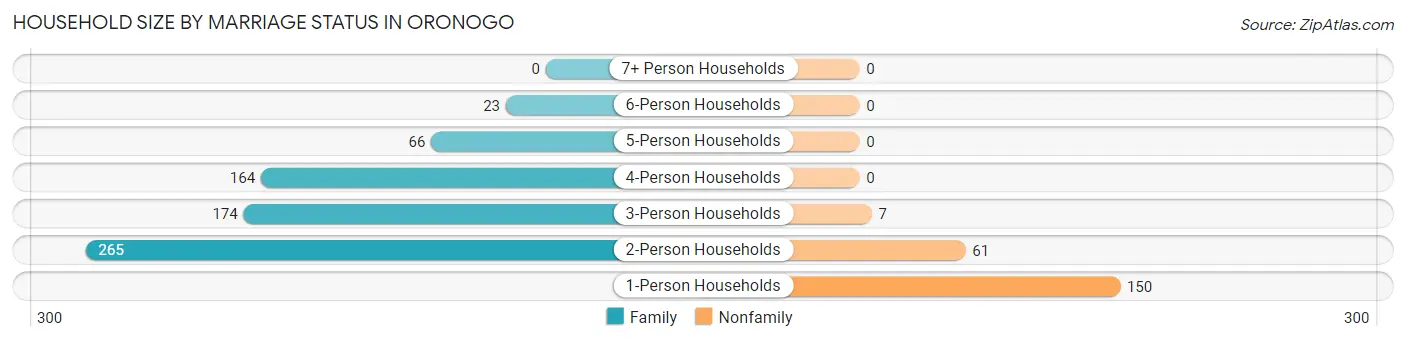
| Household Size | Family Households | Nonfamily Households |
| 1-Person Households | - | 150 (16.5%) |
| 2-Person Households | 265 (29.1%) | 61 (6.7%) |
| 3-Person Households | 174 (19.1%) | 7 (0.8%) |
| 4-Person Households | 164 (18.0%) | 0 (0.0%) |
| 5-Person Households | 66 (7.2%) | 0 (0.0%) |
| 6-Person Households | 23 (2.5%) | 0 (0.0%) |
| 7+ Person Households | 0 (0.0%) | 0 (0.0%) |
| Total | 692 (76.0%) | 218 (24.0%) |
Female Fertility in Oronogo
Fertility by Age in Oronogo
Average fertility rate in Oronogo is 56.0 births per 1,000 women. Women in the age bracket of 20 to 34 years have the highest fertility rate with 84.0 births per 1,000 women. Women in the age bracket of 20 to 34 years acount for 59.0% of all women with births.
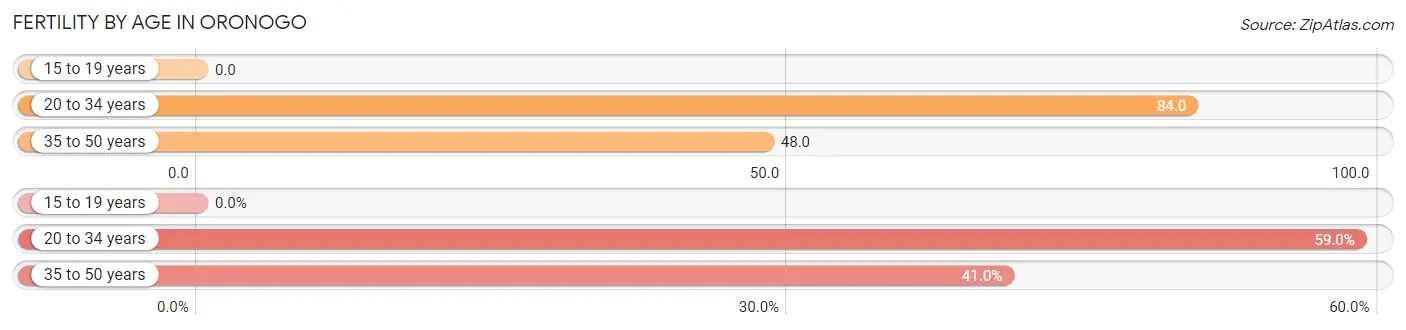
| Age Bracket | Women with Births | Births / 1,000 Women |
| 15 to 19 years | 0 (0.0%) | 0.0 |
| 20 to 34 years | 23 (59.0%) | 84.0 |
| 35 to 50 years | 16 (41.0%) | 48.0 |
| Total | 39 (100.0%) | 56.0 |
Fertility by Age by Marriage Status in Oronogo
76.9% of women with births (39) in Oronogo are married. The highest percentage of unmarried women with births falls into 20 to 34 years age bracket with 39.1% of them unmarried at the time of birth, while the lowest percentage of unmarried women with births belong to 35 to 50 years age bracket with 0.0% of them unmarried.
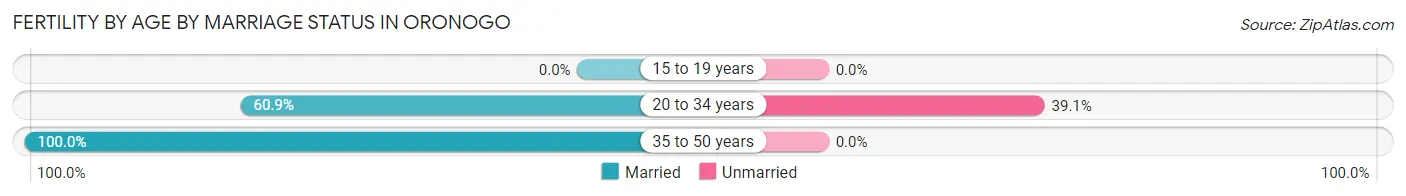
| Age Bracket | Married | Unmarried |
| 15 to 19 years | 0 (0.0%) | 0 (0.0%) |
| 20 to 34 years | 14 (60.9%) | 9 (39.1%) |
| 35 to 50 years | 16 (100.0%) | 0 (0.0%) |
| Total | 30 (76.9%) | 9 (23.1%) |
Fertility by Education in Oronogo
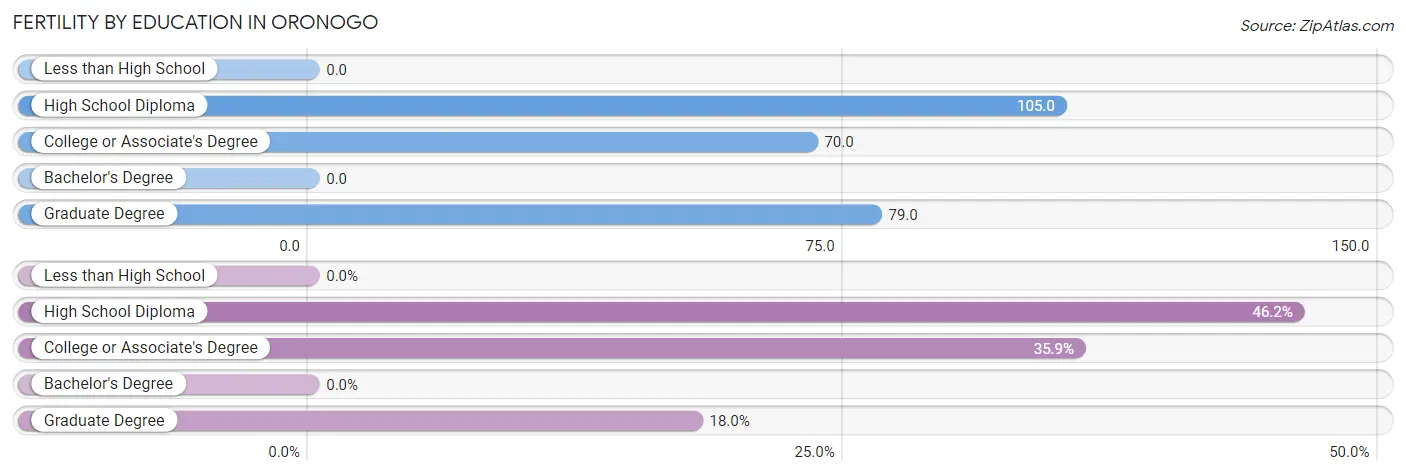
| Educational Attainment | Women with Births | Births / 1,000 Women |
| Less than High School | 0 (0.0%) | 0.0 |
| High School Diploma | 18 (46.2%) | 105.0 |
| College or Associate's Degree | 14 (35.9%) | 70.0 |
| Bachelor's Degree | 0 (0.0%) | 0.0 |
| Graduate Degree | 7 (17.9%) | 79.0 |
| Total | 39 (100.0%) | 56.0 |
Fertility by Education by Marriage Status in Oronogo
23.1% of women with births in Oronogo are unmarried. Women with the educational attainment of college or associate's degree are most likely to be married with 100.0% of them married at childbirth, while women with the educational attainment of high school diploma are least likely to be married with 50.0% of them unmarried at childbirth.
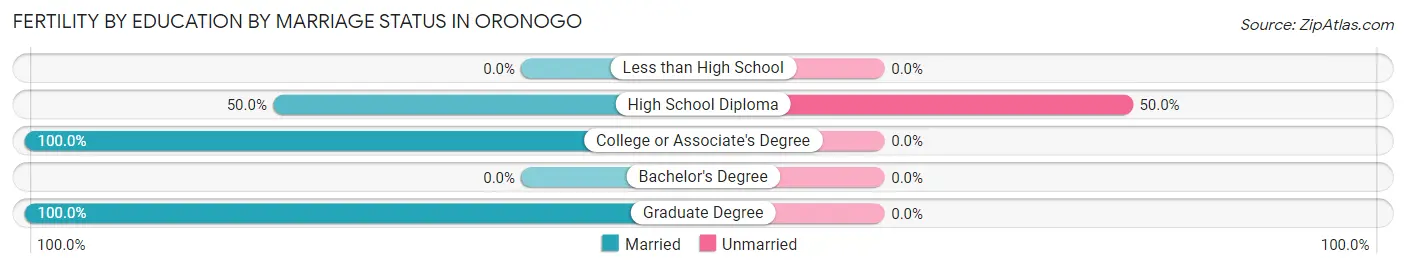
| Educational Attainment | Married | Unmarried |
| Less than High School | 0 (0.0%) | 0 (0.0%) |
| High School Diploma | 9 (50.0%) | 9 (50.0%) |
| College or Associate's Degree | 14 (100.0%) | 0 (0.0%) |
| Bachelor's Degree | 0 (0.0%) | 0 (0.0%) |
| Graduate Degree | 7 (100.0%) | 0 (0.0%) |
| Total | 30 (76.9%) | 9 (23.1%) |
Employment Characteristics in Oronogo
Employment by Class of Employer in Oronogo
Among the 1,289 employed individuals in Oronogo, private company employees (918 | 71.2%), not-for-profit organizations (144 | 11.2%), and local government employees (105 | 8.2%) make up the most common classes of employment.
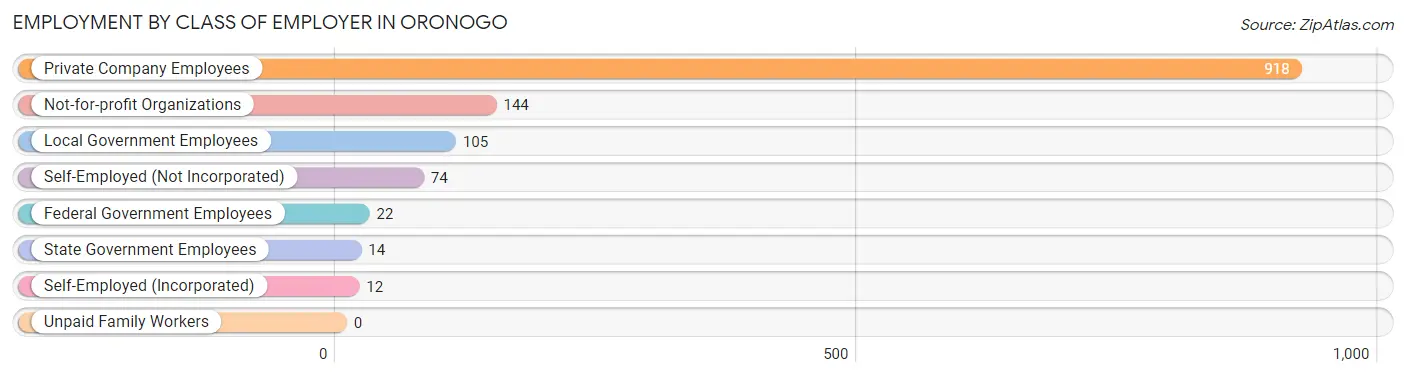
| Employer Class | # Employees | % Employees |
| Private Company Employees | 918 | 71.2% |
| Self-Employed (Incorporated) | 12 | 0.9% |
| Self-Employed (Not Incorporated) | 74 | 5.7% |
| Not-for-profit Organizations | 144 | 11.2% |
| Local Government Employees | 105 | 8.2% |
| State Government Employees | 14 | 1.1% |
| Federal Government Employees | 22 | 1.7% |
| Unpaid Family Workers | 0 | 0.0% |
| Total | 1,289 | 100.0% |
Employment Status by Age in Oronogo
According to the labor force statistics for Oronogo, out of the total population over 16 years of age (1,868), 70.6% or 1,319 individuals are in the labor force, with 2.3% or 30 of them unemployed. The age group with the highest labor force participation rate is 25 to 29 years, with 96.7% or 148 individuals in the labor force. Within the labor force, the 16 to 19 years age range has the highest percentage of unemployed individuals, with 10.4% or 7 of them being unemployed.
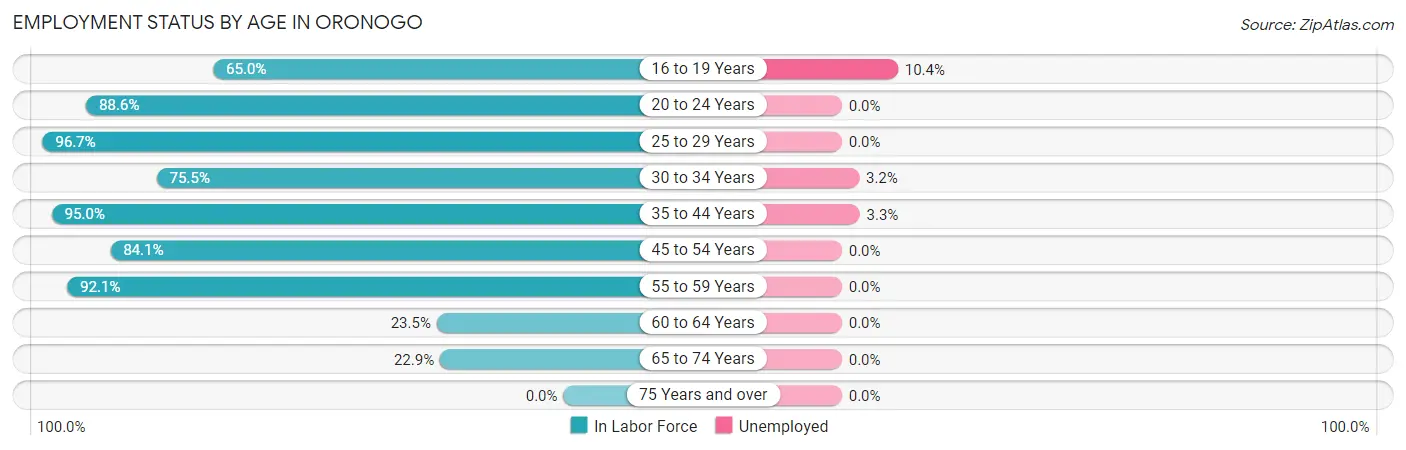
| Age Bracket | In Labor Force | Unemployed |
| 16 to 19 Years | 67 (65.0%) | 7 (10.4%) |
| 20 to 24 Years | 39 (88.6%) | 0 (0.0%) |
| 25 to 29 Years | 148 (96.7%) | 0 (0.0%) |
| 30 to 34 Years | 185 (75.5%) | 6 (3.2%) |
| 35 to 44 Years | 518 (95.0%) | 17 (3.3%) |
| 45 to 54 Years | 195 (84.1%) | 0 (0.0%) |
| 55 to 59 Years | 70 (92.1%) | 0 (0.0%) |
| 60 to 64 Years | 44 (23.5%) | 0 (0.0%) |
| 65 to 74 Years | 53 (22.9%) | 0 (0.0%) |
| 75 Years and over | 0 (0.0%) | 0 (0.0%) |
| Total | 1,319 (70.6%) | 30 (2.3%) |
Employment Status by Educational Attainment in Oronogo
According to labor force statistics for Oronogo, 80.7% of individuals (1,160) out of the total population between 25 and 64 years of age (1,438) are in the labor force, with 2.0% or 23 of them being unemployed. The group with the highest labor force participation rate are those with the educational attainment of bachelor's degree or higher, with 83.5% or 384 individuals in the labor force. Within the labor force, individuals with high school diploma education have the highest percentage of unemployment, with 7.4% or 23 of them being unemployed.
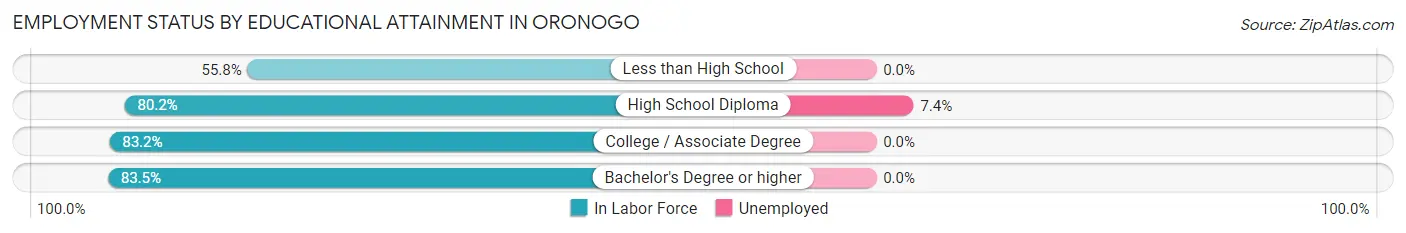
| Educational Attainment | In Labor Force | Unemployed |
| Less than High School | 53 (55.8%) | 0 (0.0%) |
| High School Diploma | 311 (80.2%) | 29 (7.4%) |
| College / Associate Degree | 412 (83.2%) | 0 (0.0%) |
| Bachelor's Degree or higher | 384 (83.5%) | 0 (0.0%) |
| Total | 1,160 (80.7%) | 29 (2.0%) |
Employment Occupations by Sex in Oronogo
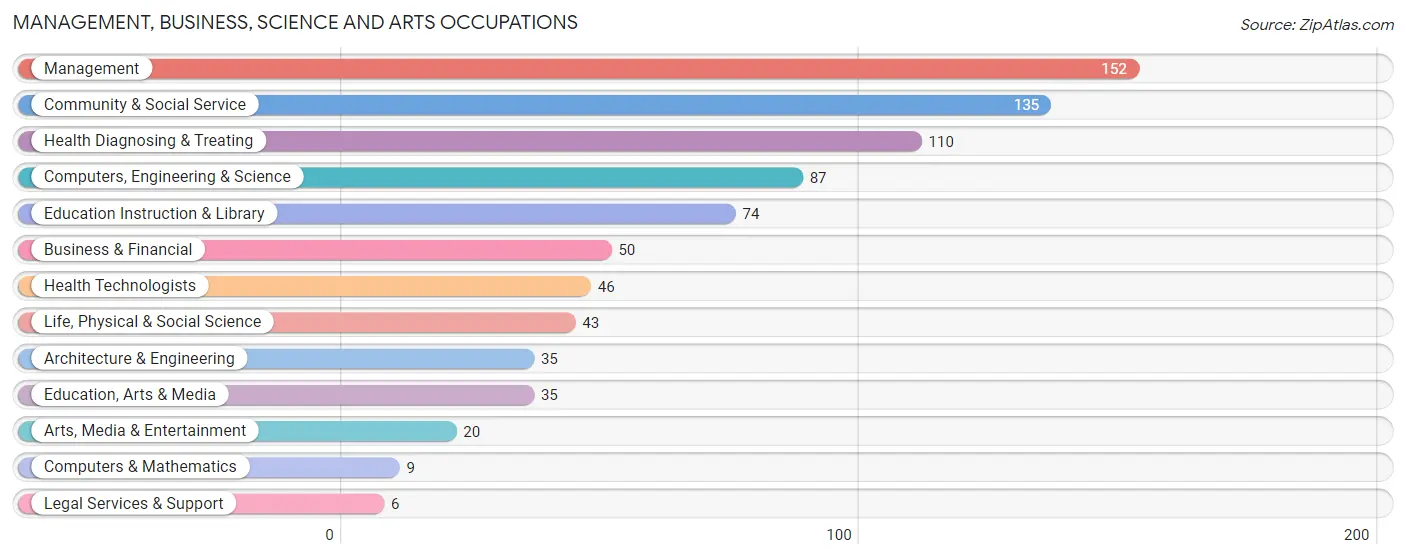
Management, Business, Science and Arts Occupations
The most common Management, Business, Science and Arts occupations in Oronogo are Management (152 | 11.8%), Community & Social Service (135 | 10.5%), Health Diagnosing & Treating (110 | 8.5%), Computers, Engineering & Science (87 | 6.8%), and Education Instruction & Library (74 | 5.7%).
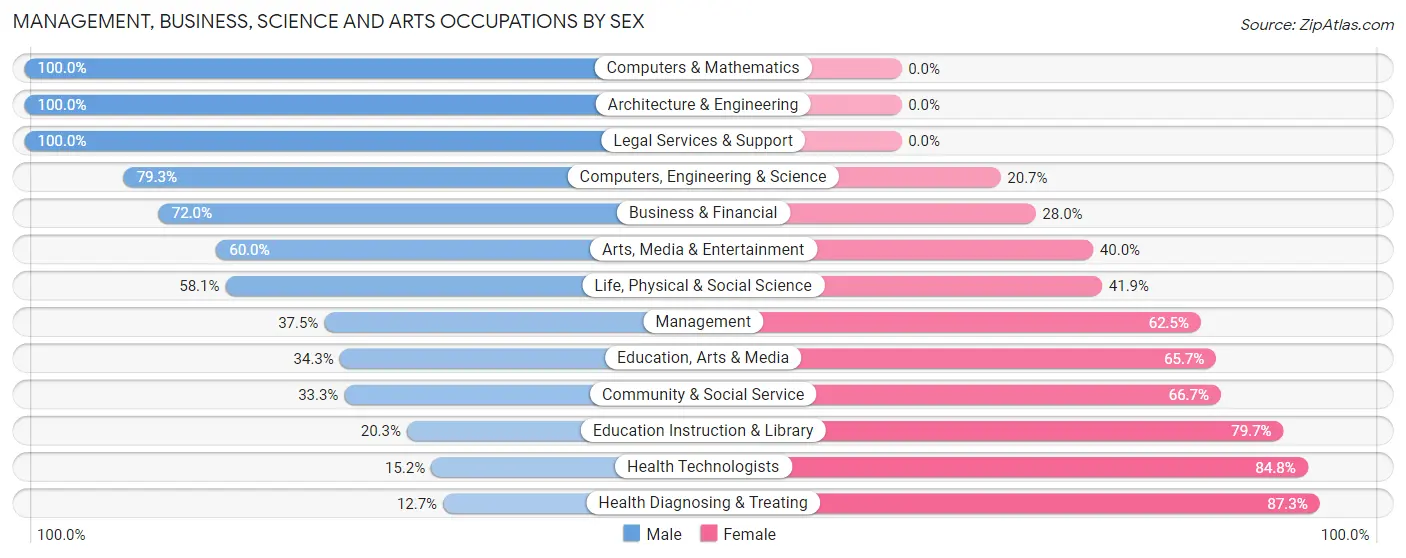
Management, Business, Science and Arts Occupations by Sex
Within the Management, Business, Science and Arts occupations in Oronogo, the most male-oriented occupations are Computers & Mathematics (100.0%), Architecture & Engineering (100.0%), and Legal Services & Support (100.0%), while the most female-oriented occupations are Health Diagnosing & Treating (87.3%), Health Technologists (84.8%), and Education Instruction & Library (79.7%).
| Occupation | Male | Female |
| Management | 57 (37.5%) | 95 (62.5%) |
| Business & Financial | 36 (72.0%) | 14 (28.0%) |
| Computers, Engineering & Science | 69 (79.3%) | 18 (20.7%) |
| Computers & Mathematics | 9 (100.0%) | 0 (0.0%) |
| Architecture & Engineering | 35 (100.0%) | 0 (0.0%) |
| Life, Physical & Social Science | 25 (58.1%) | 18 (41.9%) |
| Community & Social Service | 45 (33.3%) | 90 (66.7%) |
| Education, Arts & Media | 12 (34.3%) | 23 (65.7%) |
| Legal Services & Support | 6 (100.0%) | 0 (0.0%) |
| Education Instruction & Library | 15 (20.3%) | 59 (79.7%) |
| Arts, Media & Entertainment | 12 (60.0%) | 8 (40.0%) |
| Health Diagnosing & Treating | 14 (12.7%) | 96 (87.3%) |
| Health Technologists | 7 (15.2%) | 39 (84.8%) |
| Total (Category) | 221 (41.4%) | 313 (58.6%) |
| Total (Overall) | 646 (50.1%) | 643 (49.9%) |
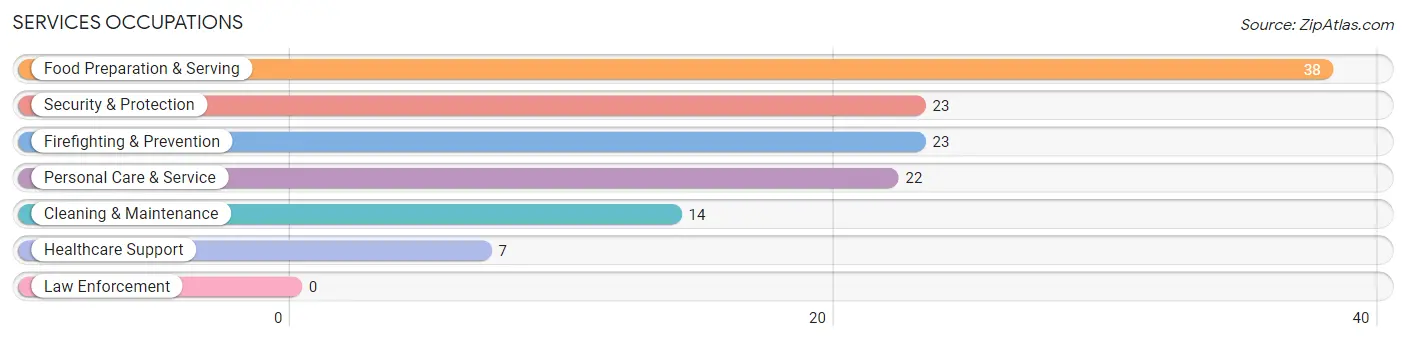
Services Occupations
The most common Services occupations in Oronogo are Food Preparation & Serving (38 | 2.9%), Security & Protection (23 | 1.8%), Firefighting & Prevention (23 | 1.8%), Personal Care & Service (22 | 1.7%), and Cleaning & Maintenance (14 | 1.1%).
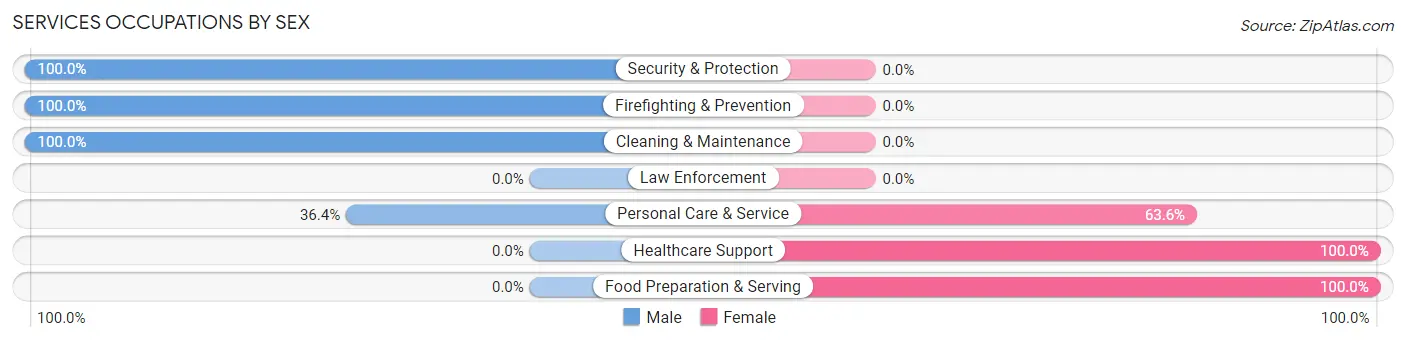
Services Occupations by Sex
Within the Services occupations in Oronogo, the most male-oriented occupations are Security & Protection (100.0%), Firefighting & Prevention (100.0%), and Cleaning & Maintenance (100.0%), while the most female-oriented occupations are Healthcare Support (100.0%), Food Preparation & Serving (100.0%), and Personal Care & Service (63.6%).
| Occupation | Male | Female |
| Healthcare Support | 0 (0.0%) | 7 (100.0%) |
| Security & Protection | 23 (100.0%) | 0 (0.0%) |
| Firefighting & Prevention | 23 (100.0%) | 0 (0.0%) |
| Law Enforcement | 0 (0.0%) | 0 (0.0%) |
| Food Preparation & Serving | 0 (0.0%) | 38 (100.0%) |
| Cleaning & Maintenance | 14 (100.0%) | 0 (0.0%) |
| Personal Care & Service | 8 (36.4%) | 14 (63.6%) |
| Total (Category) | 45 (43.3%) | 59 (56.7%) |
| Total (Overall) | 646 (50.1%) | 643 (49.9%) |
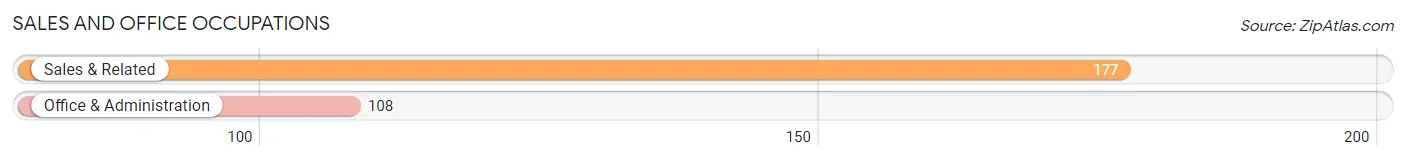
Sales and Office Occupations
The most common Sales and Office occupations in Oronogo are Sales & Related (177 | 13.7%), and Office & Administration (108 | 8.4%).
Sales and Office Occupations by Sex
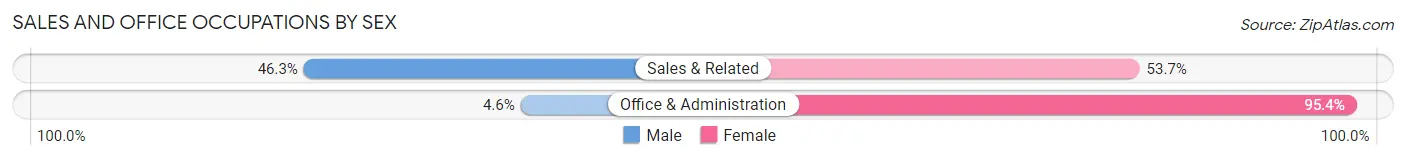
| Occupation | Male | Female |
| Sales & Related | 82 (46.3%) | 95 (53.7%) |
| Office & Administration | 5 (4.6%) | 103 (95.4%) |
| Total (Category) | 87 (30.5%) | 198 (69.5%) |
| Total (Overall) | 646 (50.1%) | 643 (49.9%) |
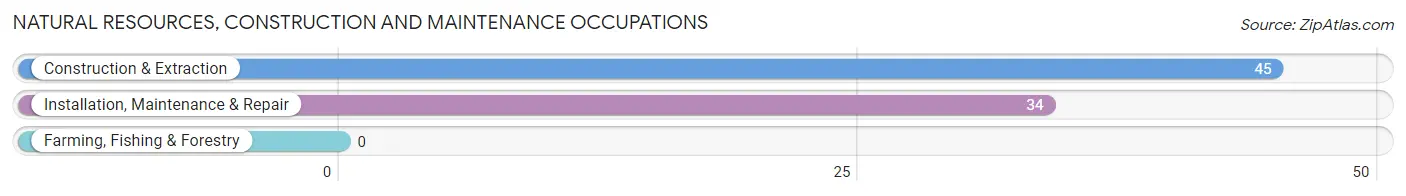
Natural Resources, Construction and Maintenance Occupations
The most common Natural Resources, Construction and Maintenance occupations in Oronogo are Construction & Extraction (45 | 3.5%), and Installation, Maintenance & Repair (34 | 2.6%).
Natural Resources, Construction and Maintenance Occupations by Sex
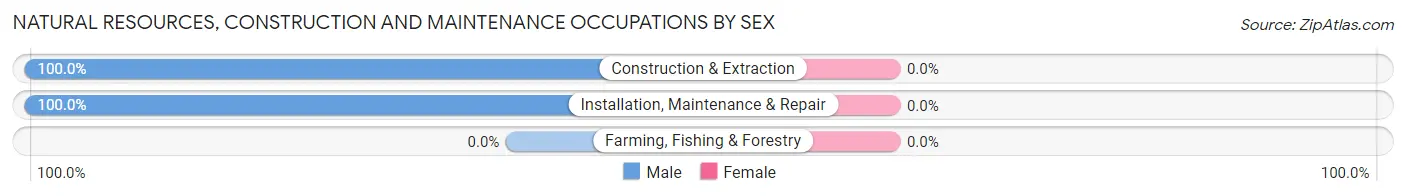
| Occupation | Male | Female |
| Farming, Fishing & Forestry | 0 (0.0%) | 0 (0.0%) |
| Construction & Extraction | 45 (100.0%) | 0 (0.0%) |
| Installation, Maintenance & Repair | 34 (100.0%) | 0 (0.0%) |
| Total (Category) | 79 (100.0%) | 0 (0.0%) |
| Total (Overall) | 646 (50.1%) | 643 (49.9%) |
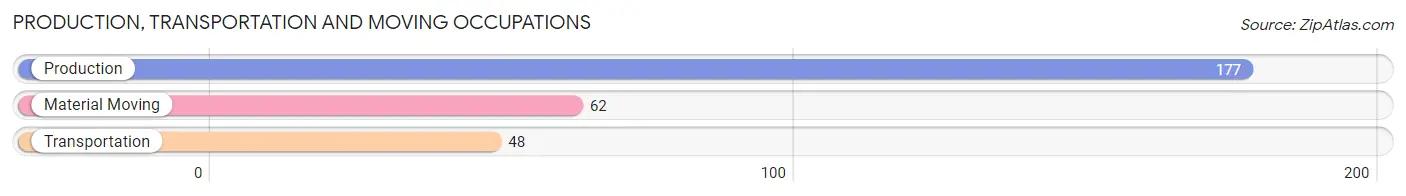
Production, Transportation and Moving Occupations
The most common Production, Transportation and Moving occupations in Oronogo are Production (177 | 13.7%), Material Moving (62 | 4.8%), and Transportation (48 | 3.7%).
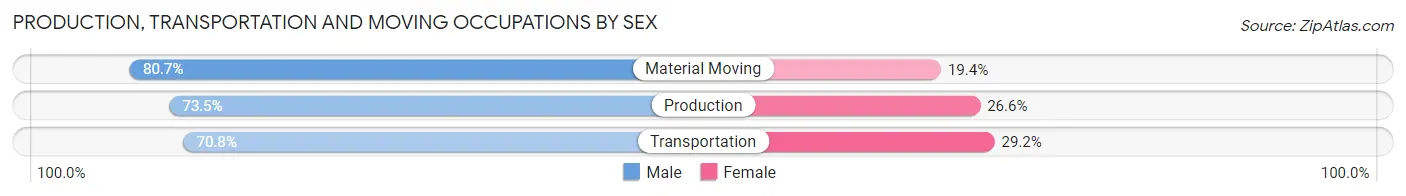
Production, Transportation and Moving Occupations by Sex
| Occupation | Male | Female |
| Production | 130 (73.5%) | 47 (26.6%) |
| Transportation | 34 (70.8%) | 14 (29.2%) |
| Material Moving | 50 (80.6%) | 12 (19.4%) |
| Total (Category) | 214 (74.6%) | 73 (25.4%) |
| Total (Overall) | 646 (50.1%) | 643 (49.9%) |
Employment Industries by Sex in Oronogo
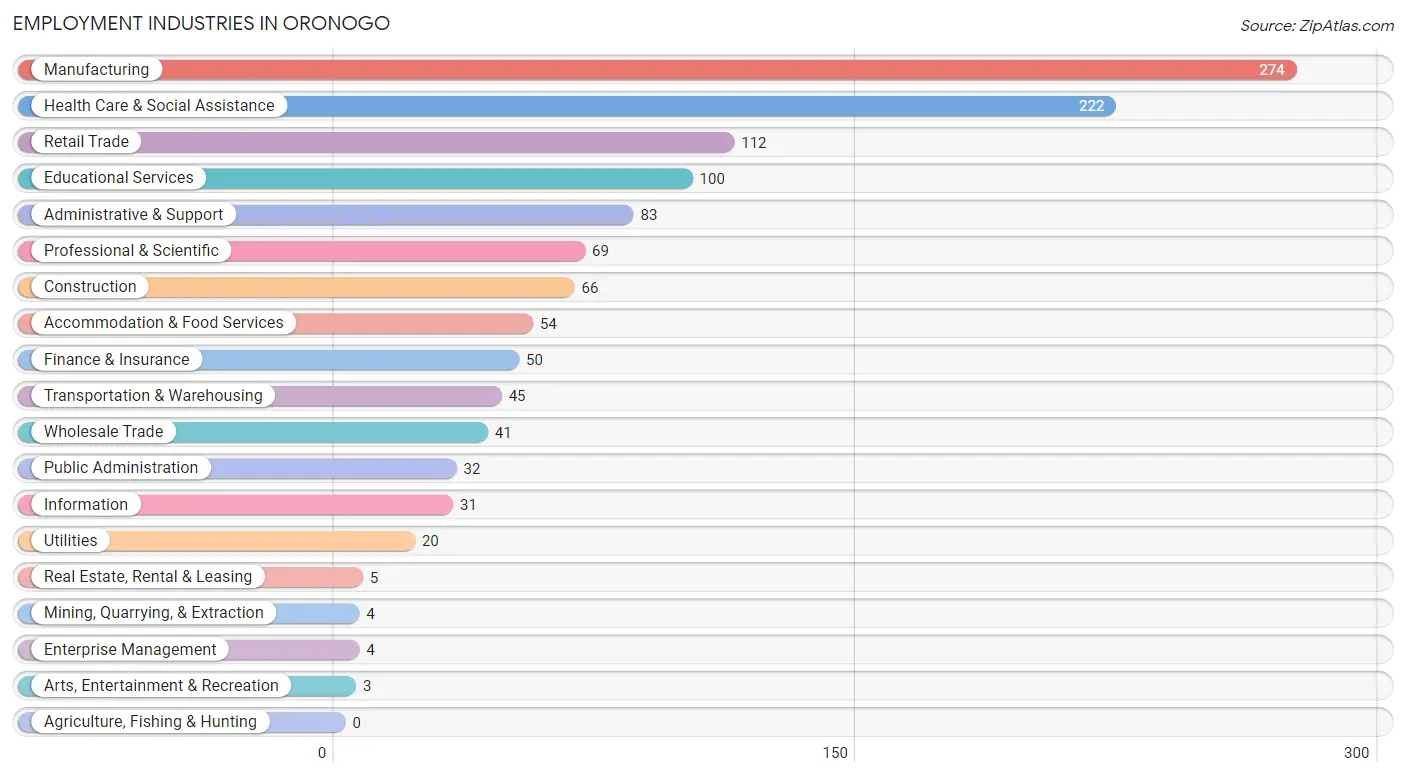
Employment Industries in Oronogo
The major employment industries in Oronogo include Manufacturing (274 | 21.3%), Health Care & Social Assistance (222 | 17.2%), Retail Trade (112 | 8.7%), Educational Services (100 | 7.8%), and Administrative & Support (83 | 6.4%).
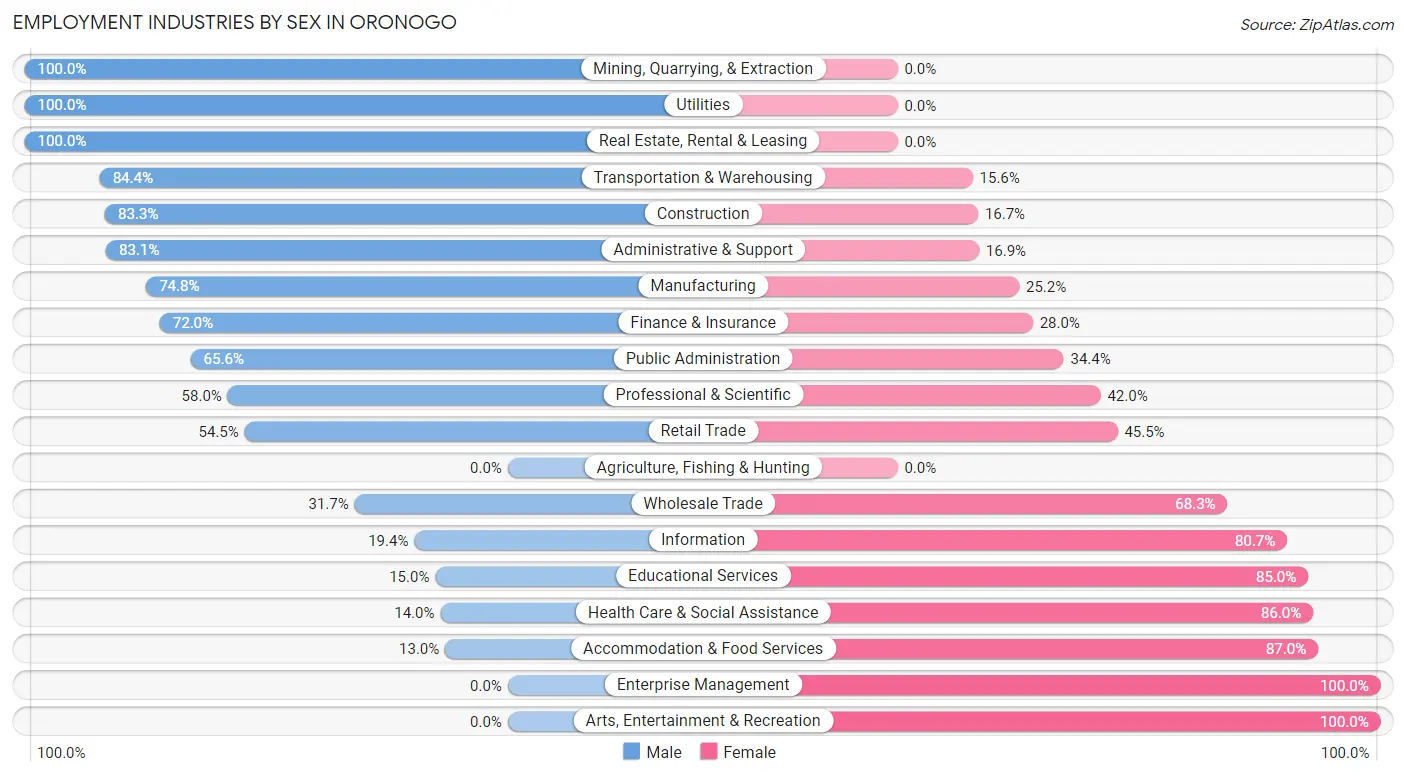
Employment Industries by Sex in Oronogo
The Oronogo industries that see more men than women are Mining, Quarrying, & Extraction (100.0%), Utilities (100.0%), and Real Estate, Rental & Leasing (100.0%), whereas the industries that tend to have a higher number of women are Enterprise Management (100.0%), Arts, Entertainment & Recreation (100.0%), and Accommodation & Food Services (87.0%).
| Industry | Male | Female |
| Agriculture, Fishing & Hunting | 0 (0.0%) | 0 (0.0%) |
| Mining, Quarrying, & Extraction | 4 (100.0%) | 0 (0.0%) |
| Construction | 55 (83.3%) | 11 (16.7%) |
| Manufacturing | 205 (74.8%) | 69 (25.2%) |
| Wholesale Trade | 13 (31.7%) | 28 (68.3%) |
| Retail Trade | 61 (54.5%) | 51 (45.5%) |
| Transportation & Warehousing | 38 (84.4%) | 7 (15.6%) |
| Utilities | 20 (100.0%) | 0 (0.0%) |
| Information | 6 (19.4%) | 25 (80.6%) |
| Finance & Insurance | 36 (72.0%) | 14 (28.0%) |
| Real Estate, Rental & Leasing | 5 (100.0%) | 0 (0.0%) |
| Professional & Scientific | 40 (58.0%) | 29 (42.0%) |
| Enterprise Management | 0 (0.0%) | 4 (100.0%) |
| Administrative & Support | 69 (83.1%) | 14 (16.9%) |
| Educational Services | 15 (15.0%) | 85 (85.0%) |
| Health Care & Social Assistance | 31 (14.0%) | 191 (86.0%) |
| Arts, Entertainment & Recreation | 0 (0.0%) | 3 (100.0%) |
| Accommodation & Food Services | 7 (13.0%) | 47 (87.0%) |
| Public Administration | 21 (65.6%) | 11 (34.4%) |
| Total | 646 (50.1%) | 643 (49.9%) |
Education in Oronogo
School Enrollment in Oronogo
The most common levels of schooling among the 685 students in Oronogo are middle school (225 | 32.9%), elementary school (167 | 24.4%), and high school (151 | 22.0%).
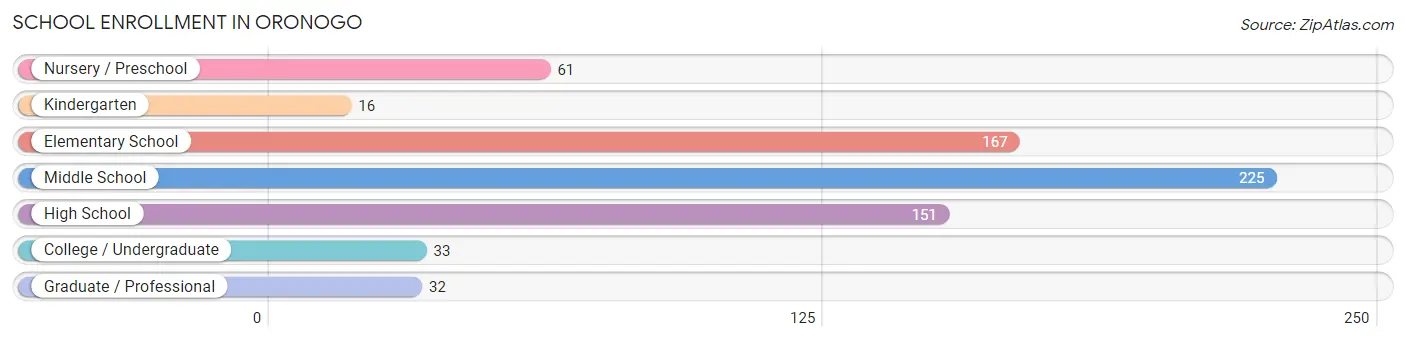
| School Level | # Students | % Students |
| Nursery / Preschool | 61 | 8.9% |
| Kindergarten | 16 | 2.3% |
| Elementary School | 167 | 24.4% |
| Middle School | 225 | 32.9% |
| High School | 151 | 22.0% |
| College / Undergraduate | 33 | 4.8% |
| Graduate / Professional | 32 | 4.7% |
| Total | 685 | 100.0% |
School Enrollment by Age by Funding Source in Oronogo
Out of a total of 685 students who are enrolled in schools in Oronogo, 40 (5.8%) attend a private institution, while the remaining 645 (94.2%) are enrolled in public schools. The age group of 35 years and over has the highest likelihood of being enrolled in private schools, with 22 (57.9% in the age bracket) enrolled. Conversely, the age group of 5 to 9 year old has the lowest likelihood of being enrolled in a private school, with 189 (100.0% in the age bracket) attending a public institution.
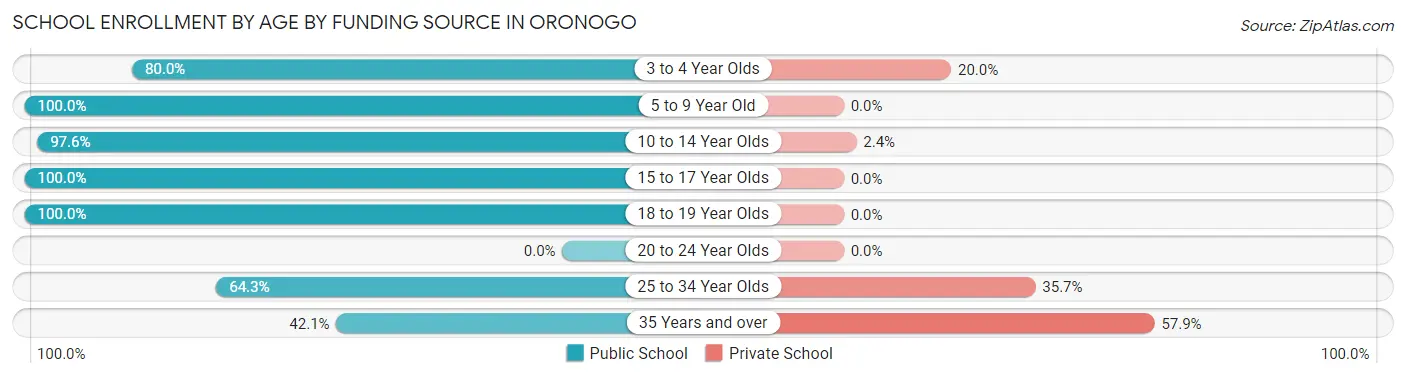
| Age Bracket | Public School | Private School |
| 3 to 4 Year Olds | 28 (80.0%) | 7 (20.0%) |
| 5 to 9 Year Old | 189 (100.0%) | 0 (0.0%) |
| 10 to 14 Year Olds | 248 (97.6%) | 6 (2.4%) |
| 15 to 17 Year Olds | 131 (100.0%) | 0 (0.0%) |
| 18 to 19 Year Olds | 24 (100.0%) | 0 (0.0%) |
| 20 to 24 Year Olds | 0 (0.0%) | 0 (0.0%) |
| 25 to 34 Year Olds | 9 (64.3%) | 5 (35.7%) |
| 35 Years and over | 16 (42.1%) | 22 (57.9%) |
| Total | 645 (94.2%) | 40 (5.8%) |
Educational Attainment by Field of Study in Oronogo
Business (93 | 16.3%), education (88 | 15.4%), bio, nature & agricultural (71 | 12.4%), arts & humanities (63 | 11.0%), and physical & health sciences (58 | 10.2%) are the most common fields of study among 571 individuals in Oronogo who have obtained a bachelor's degree or higher.
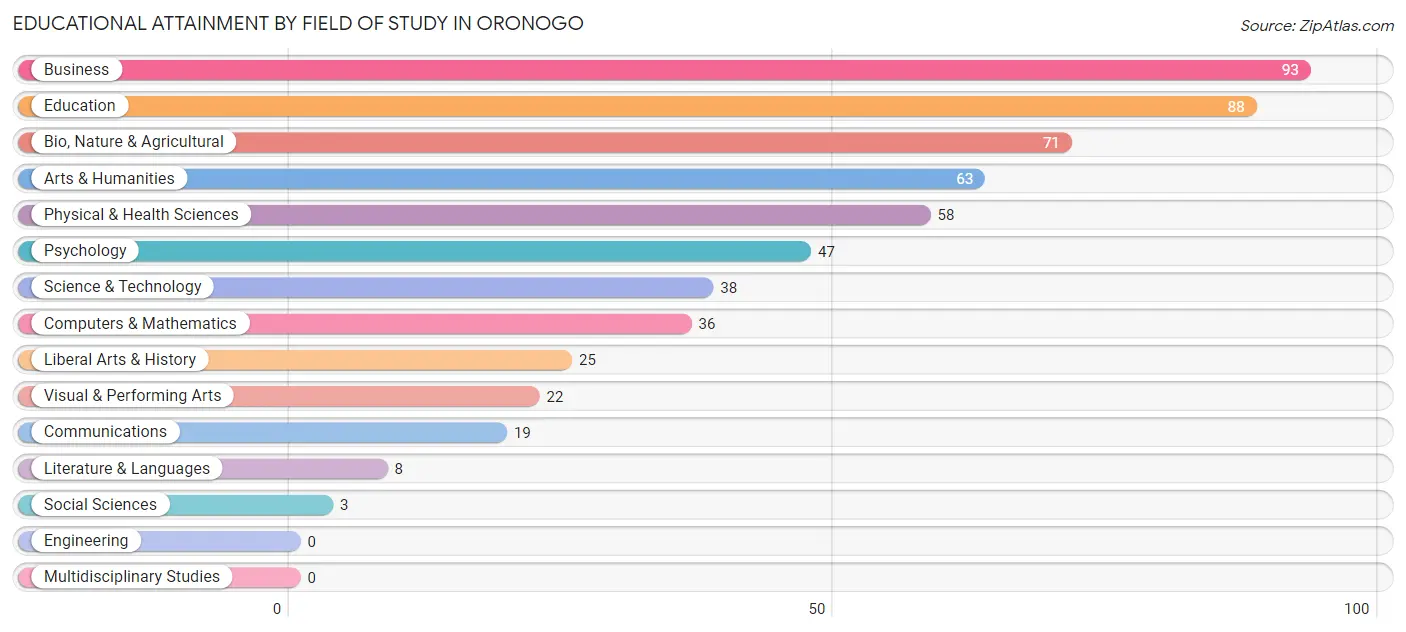
| Field of Study | # Graduates | % Graduates |
| Computers & Mathematics | 36 | 6.3% |
| Bio, Nature & Agricultural | 71 | 12.4% |
| Physical & Health Sciences | 58 | 10.2% |
| Psychology | 47 | 8.2% |
| Social Sciences | 3 | 0.5% |
| Engineering | 0 | 0.0% |
| Multidisciplinary Studies | 0 | 0.0% |
| Science & Technology | 38 | 6.7% |
| Business | 93 | 16.3% |
| Education | 88 | 15.4% |
| Literature & Languages | 8 | 1.4% |
| Liberal Arts & History | 25 | 4.4% |
| Visual & Performing Arts | 22 | 3.8% |
| Communications | 19 | 3.3% |
| Arts & Humanities | 63 | 11.0% |
| Total | 571 | 100.0% |
Transportation & Commute in Oronogo
Vehicle Availability by Sex in Oronogo
The most prevalent vehicle ownership categories in Oronogo are males with 2 vehicles (336, accounting for 52.0%) and females with 2 vehicles (270, making up 52.3%).
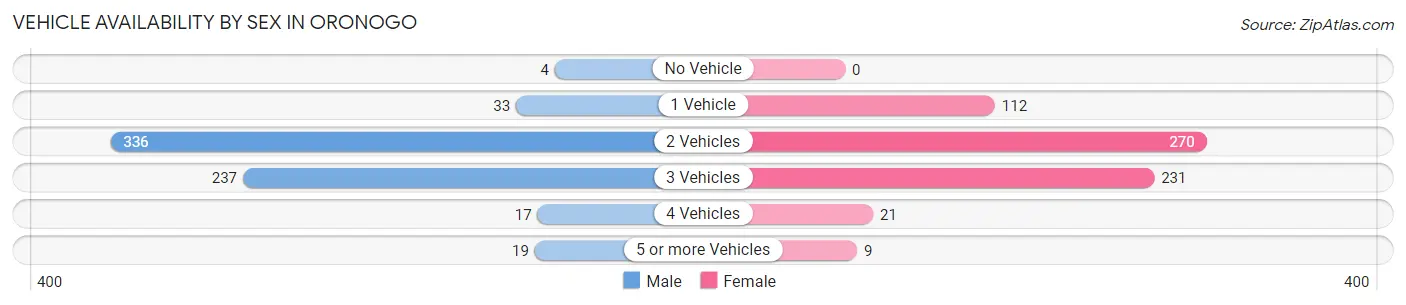
| Vehicles Available | Male | Female |
| No Vehicle | 4 (0.6%) | 0 (0.0%) |
| 1 Vehicle | 33 (5.1%) | 112 (17.4%) |
| 2 Vehicles | 336 (52.0%) | 270 (42.0%) |
| 3 Vehicles | 237 (36.7%) | 231 (35.9%) |
| 4 Vehicles | 17 (2.6%) | 21 (3.3%) |
| 5 or more Vehicles | 19 (2.9%) | 9 (1.4%) |
| Total | 646 (100.0%) | 643 (100.0%) |
Commute Time in Oronogo
The most frequently occuring commute durations in Oronogo are 15 to 19 minutes (273 commuters, 23.9%), 20 to 24 minutes (247 commuters, 21.7%), and 25 to 29 minutes (136 commuters, 11.9%).
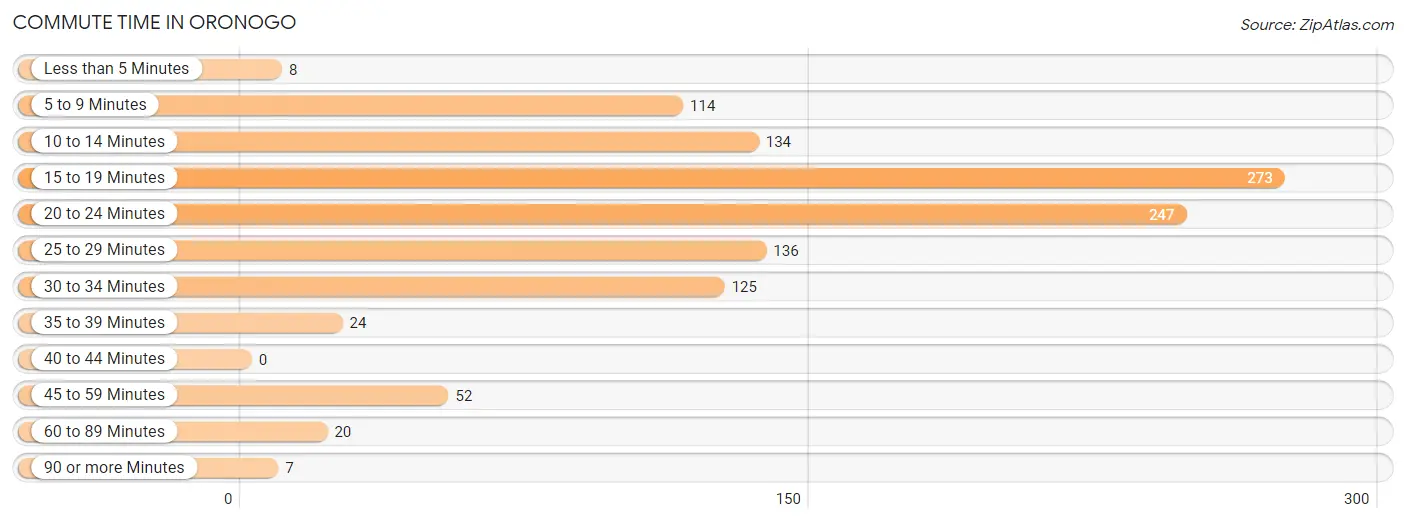
| Commute Time | # Commuters | % Commuters |
| Less than 5 Minutes | 8 | 0.7% |
| 5 to 9 Minutes | 114 | 10.0% |
| 10 to 14 Minutes | 134 | 11.7% |
| 15 to 19 Minutes | 273 | 23.9% |
| 20 to 24 Minutes | 247 | 21.7% |
| 25 to 29 Minutes | 136 | 11.9% |
| 30 to 34 Minutes | 125 | 11.0% |
| 35 to 39 Minutes | 24 | 2.1% |
| 40 to 44 Minutes | 0 | 0.0% |
| 45 to 59 Minutes | 52 | 4.6% |
| 60 to 89 Minutes | 20 | 1.8% |
| 90 or more Minutes | 7 | 0.6% |
Commute Time by Sex in Oronogo
The most common commute times in Oronogo are 15 to 19 minutes (173 commuters, 28.4%) for males and 20 to 24 minutes (124 commuters, 23.4%) for females.
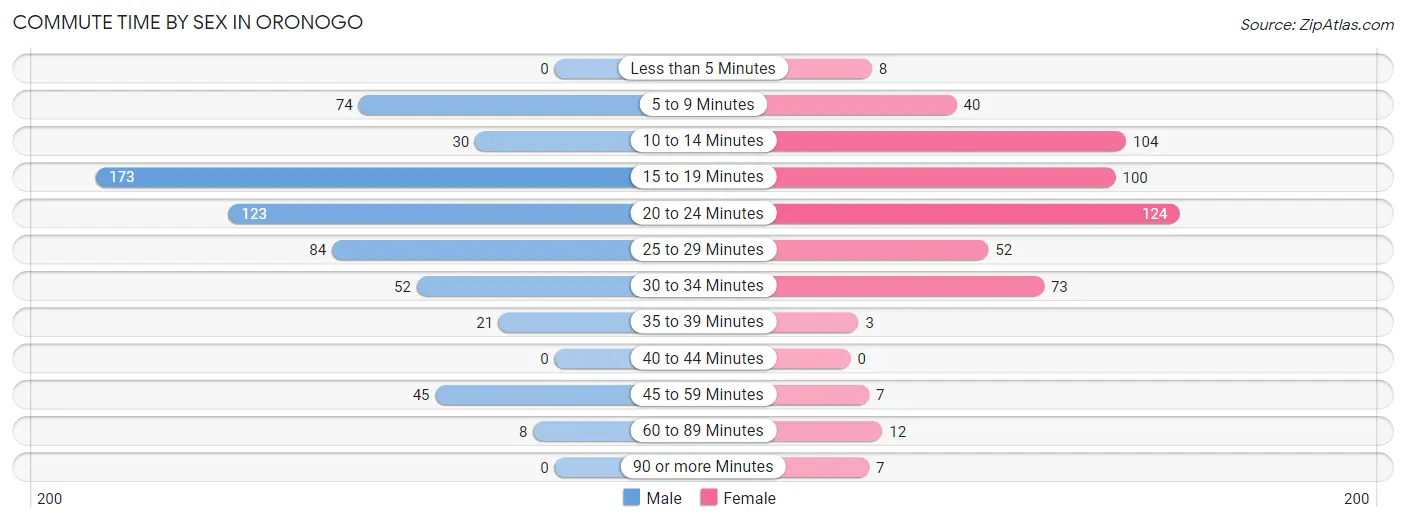
| Commute Time | Male | Female |
| Less than 5 Minutes | 0 (0.0%) | 8 (1.5%) |
| 5 to 9 Minutes | 74 (12.1%) | 40 (7.5%) |
| 10 to 14 Minutes | 30 (4.9%) | 104 (19.6%) |
| 15 to 19 Minutes | 173 (28.4%) | 100 (18.9%) |
| 20 to 24 Minutes | 123 (20.2%) | 124 (23.4%) |
| 25 to 29 Minutes | 84 (13.8%) | 52 (9.8%) |
| 30 to 34 Minutes | 52 (8.5%) | 73 (13.8%) |
| 35 to 39 Minutes | 21 (3.4%) | 3 (0.6%) |
| 40 to 44 Minutes | 0 (0.0%) | 0 (0.0%) |
| 45 to 59 Minutes | 45 (7.4%) | 7 (1.3%) |
| 60 to 89 Minutes | 8 (1.3%) | 12 (2.3%) |
| 90 or more Minutes | 0 (0.0%) | 7 (1.3%) |
Time of Departure to Work by Sex in Oronogo
The most frequent times of departure to work in Oronogo are 7:00 AM to 7:29 AM (109, 17.9%) for males and 6:30 AM to 6:59 AM (100, 18.9%) for females.
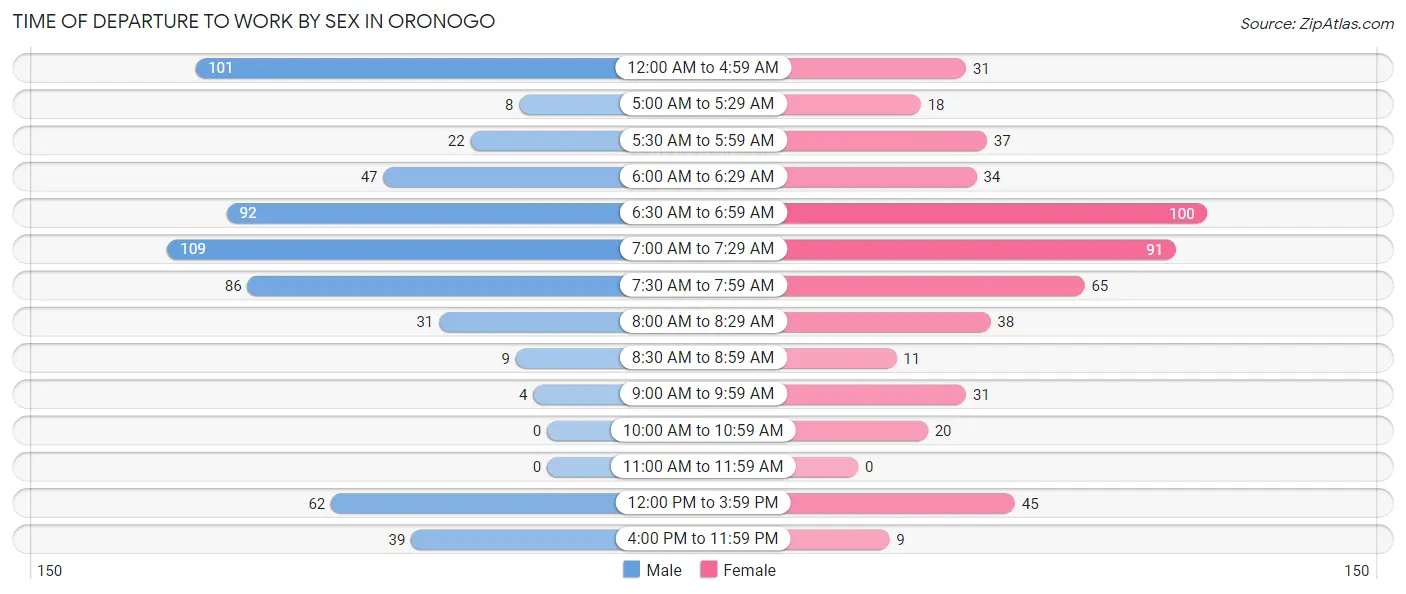
| Time of Departure | Male | Female |
| 12:00 AM to 4:59 AM | 101 (16.6%) | 31 (5.9%) |
| 5:00 AM to 5:29 AM | 8 (1.3%) | 18 (3.4%) |
| 5:30 AM to 5:59 AM | 22 (3.6%) | 37 (7.0%) |
| 6:00 AM to 6:29 AM | 47 (7.7%) | 34 (6.4%) |
| 6:30 AM to 6:59 AM | 92 (15.1%) | 100 (18.9%) |
| 7:00 AM to 7:29 AM | 109 (17.9%) | 91 (17.2%) |
| 7:30 AM to 7:59 AM | 86 (14.1%) | 65 (12.3%) |
| 8:00 AM to 8:29 AM | 31 (5.1%) | 38 (7.2%) |
| 8:30 AM to 8:59 AM | 9 (1.5%) | 11 (2.1%) |
| 9:00 AM to 9:59 AM | 4 (0.7%) | 31 (5.9%) |
| 10:00 AM to 10:59 AM | 0 (0.0%) | 20 (3.8%) |
| 11:00 AM to 11:59 AM | 0 (0.0%) | 0 (0.0%) |
| 12:00 PM to 3:59 PM | 62 (10.2%) | 45 (8.5%) |
| 4:00 PM to 11:59 PM | 39 (6.4%) | 9 (1.7%) |
| Total | 610 (100.0%) | 530 (100.0%) |
Housing Occupancy in Oronogo
Occupancy by Ownership in Oronogo
Of the total 910 dwellings in Oronogo, owner-occupied units account for 799 (87.8%), while renter-occupied units make up 111 (12.2%).
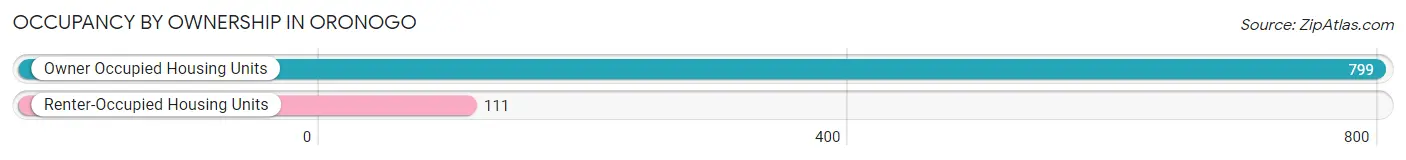
| Occupancy | # Housing Units | % Housing Units |
| Owner Occupied Housing Units | 799 | 87.8% |
| Renter-Occupied Housing Units | 111 | 12.2% |
| Total Occupied Housing Units | 910 | 100.0% |
Occupancy by Household Size in Oronogo
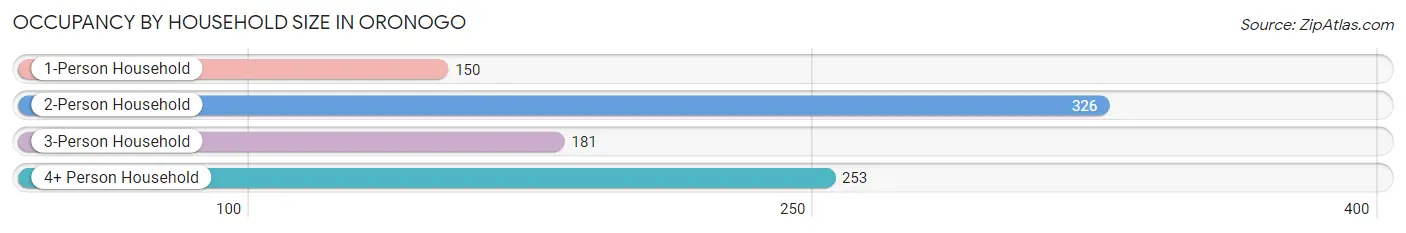
| Household Size | # Housing Units | % Housing Units |
| 1-Person Household | 150 | 16.5% |
| 2-Person Household | 326 | 35.8% |
| 3-Person Household | 181 | 19.9% |
| 4+ Person Household | 253 | 27.8% |
| Total Housing Units | 910 | 100.0% |
Occupancy by Ownership by Household Size in Oronogo
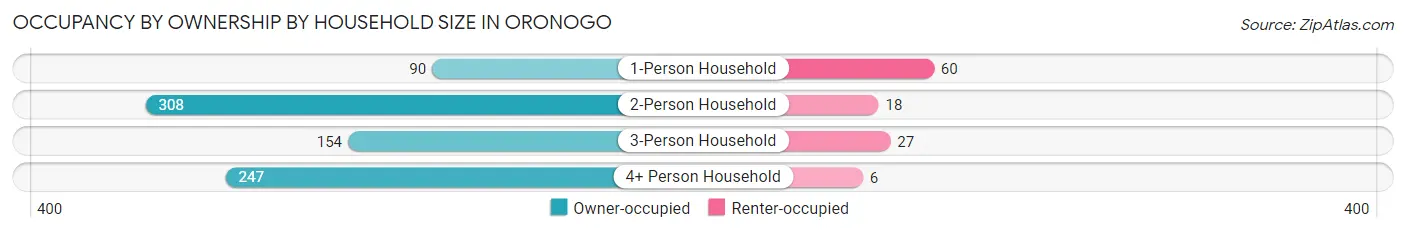
| Household Size | Owner-occupied | Renter-occupied |
| 1-Person Household | 90 (60.0%) | 60 (40.0%) |
| 2-Person Household | 308 (94.5%) | 18 (5.5%) |
| 3-Person Household | 154 (85.1%) | 27 (14.9%) |
| 4+ Person Household | 247 (97.6%) | 6 (2.4%) |
| Total Housing Units | 799 (87.8%) | 111 (12.2%) |
Occupancy by Educational Attainment in Oronogo
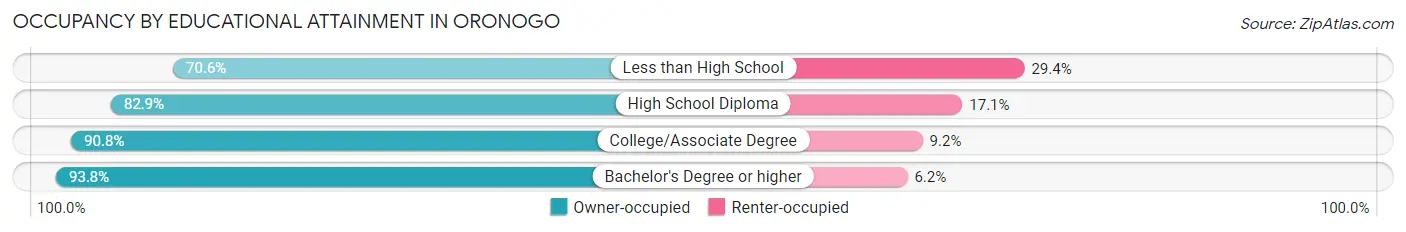
| Household Size | Owner-occupied | Renter-occupied |
| Less than High School | 48 (70.6%) | 20 (29.4%) |
| High School Diploma | 228 (82.9%) | 47 (17.1%) |
| College/Associate Degree | 266 (90.8%) | 27 (9.2%) |
| Bachelor's Degree or higher | 257 (93.8%) | 17 (6.2%) |
Occupancy by Age of Householder in Oronogo
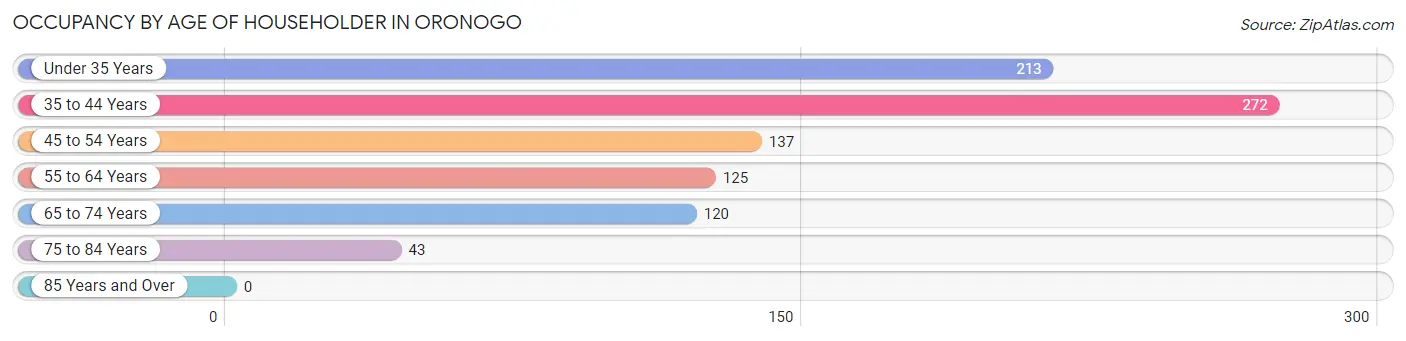
| Age Bracket | # Households | % Households |
| Under 35 Years | 213 | 23.4% |
| 35 to 44 Years | 272 | 29.9% |
| 45 to 54 Years | 137 | 15.0% |
| 55 to 64 Years | 125 | 13.7% |
| 65 to 74 Years | 120 | 13.2% |
| 75 to 84 Years | 43 | 4.7% |
| 85 Years and Over | 0 | 0.0% |
| Total | 910 | 100.0% |
Housing Finances in Oronogo
Median Income by Occupancy in Oronogo
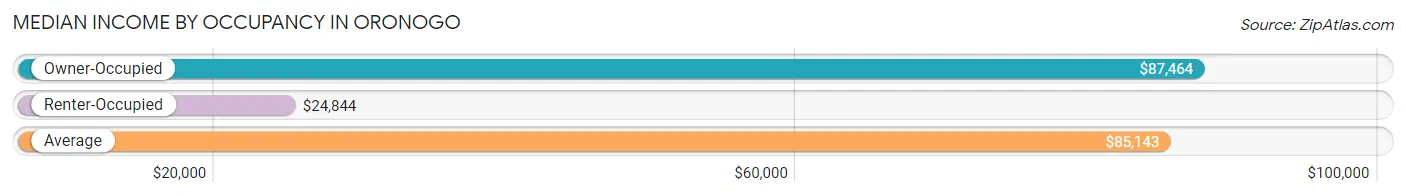
| Occupancy Type | # Households | Median Income |
| Owner-Occupied | 799 (87.8%) | $87,464 |
| Renter-Occupied | 111 (12.2%) | $24,844 |
| Average | 910 (100.0%) | $85,143 |
Occupancy by Householder Income Bracket in Oronogo
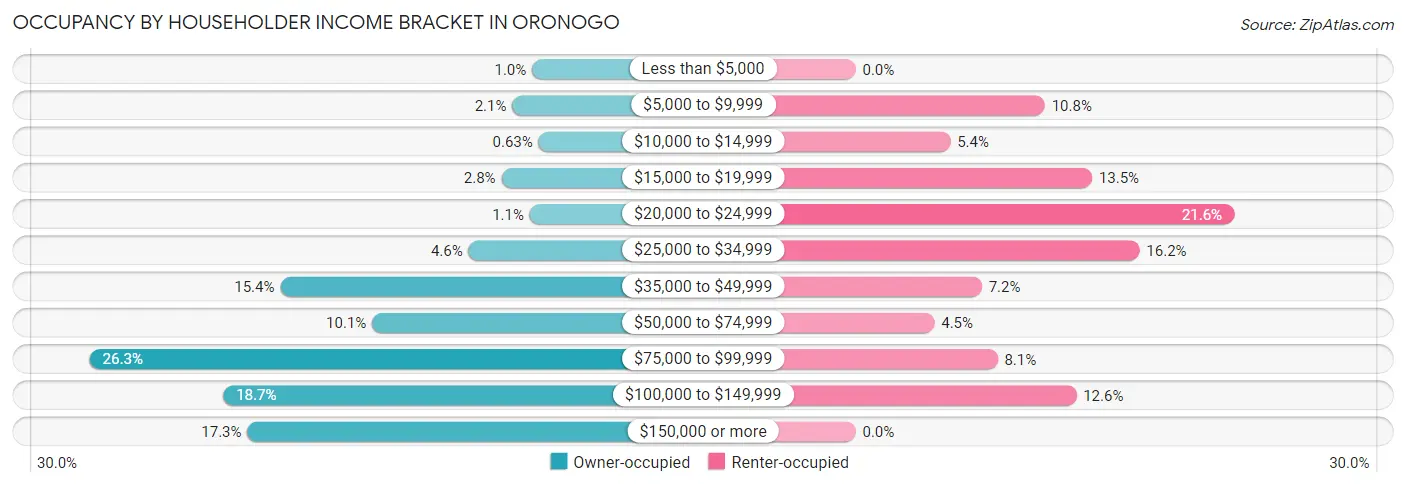
| Income Bracket | Owner-occupied | Renter-occupied |
| Less than $5,000 | 8 (1.0%) | 0 (0.0%) |
| $5,000 to $9,999 | 17 (2.1%) | 12 (10.8%) |
| $10,000 to $14,999 | 5 (0.6%) | 6 (5.4%) |
| $15,000 to $19,999 | 22 (2.8%) | 15 (13.5%) |
| $20,000 to $24,999 | 9 (1.1%) | 24 (21.6%) |
| $25,000 to $34,999 | 37 (4.6%) | 18 (16.2%) |
| $35,000 to $49,999 | 123 (15.4%) | 8 (7.2%) |
| $50,000 to $74,999 | 81 (10.1%) | 5 (4.5%) |
| $75,000 to $99,999 | 210 (26.3%) | 9 (8.1%) |
| $100,000 to $149,999 | 149 (18.6%) | 14 (12.6%) |
| $150,000 or more | 138 (17.3%) | 0 (0.0%) |
| Total | 799 (100.0%) | 111 (100.0%) |
Monthly Housing Cost Tiers in Oronogo
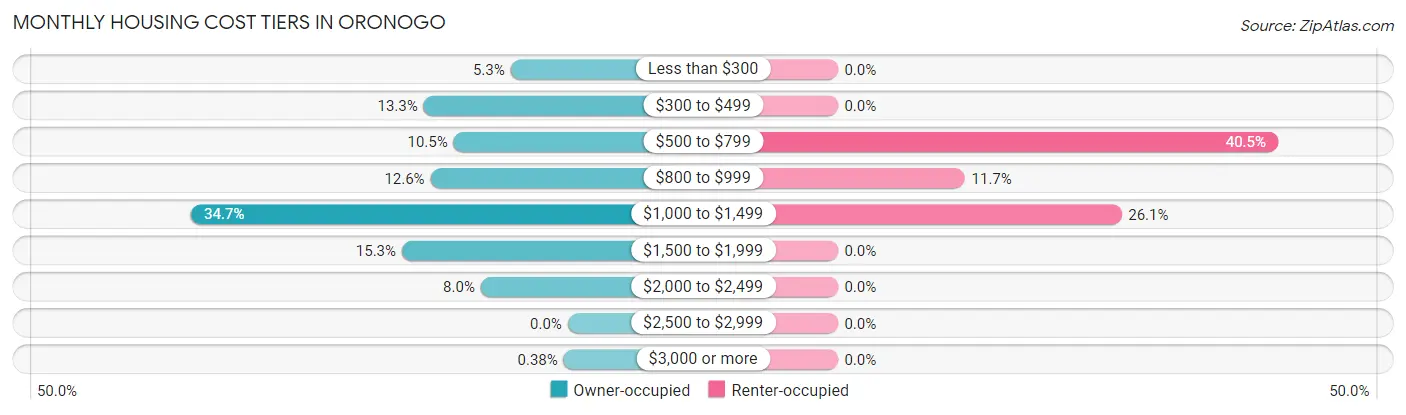
| Monthly Cost | Owner-occupied | Renter-occupied |
| Less than $300 | 42 (5.3%) | 0 (0.0%) |
| $300 to $499 | 106 (13.3%) | 0 (0.0%) |
| $500 to $799 | 84 (10.5%) | 45 (40.5%) |
| $800 to $999 | 101 (12.6%) | 13 (11.7%) |
| $1,000 to $1,499 | 277 (34.7%) | 29 (26.1%) |
| $1,500 to $1,999 | 122 (15.3%) | 0 (0.0%) |
| $2,000 to $2,499 | 64 (8.0%) | 0 (0.0%) |
| $2,500 to $2,999 | 0 (0.0%) | 0 (0.0%) |
| $3,000 or more | 3 (0.4%) | 0 (0.0%) |
| Total | 799 (100.0%) | 111 (100.0%) |
Physical Housing Characteristics in Oronogo
Housing Structures in Oronogo
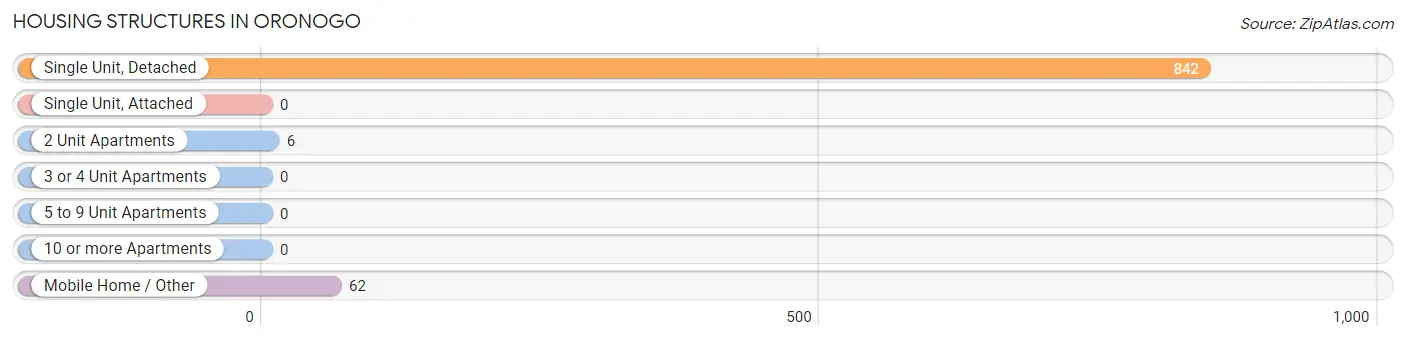
| Structure Type | # Housing Units | % Housing Units |
| Single Unit, Detached | 842 | 92.5% |
| Single Unit, Attached | 0 | 0.0% |
| 2 Unit Apartments | 6 | 0.7% |
| 3 or 4 Unit Apartments | 0 | 0.0% |
| 5 to 9 Unit Apartments | 0 | 0.0% |
| 10 or more Apartments | 0 | 0.0% |
| Mobile Home / Other | 62 | 6.8% |
| Total | 910 | 100.0% |
Housing Structures by Occupancy in Oronogo
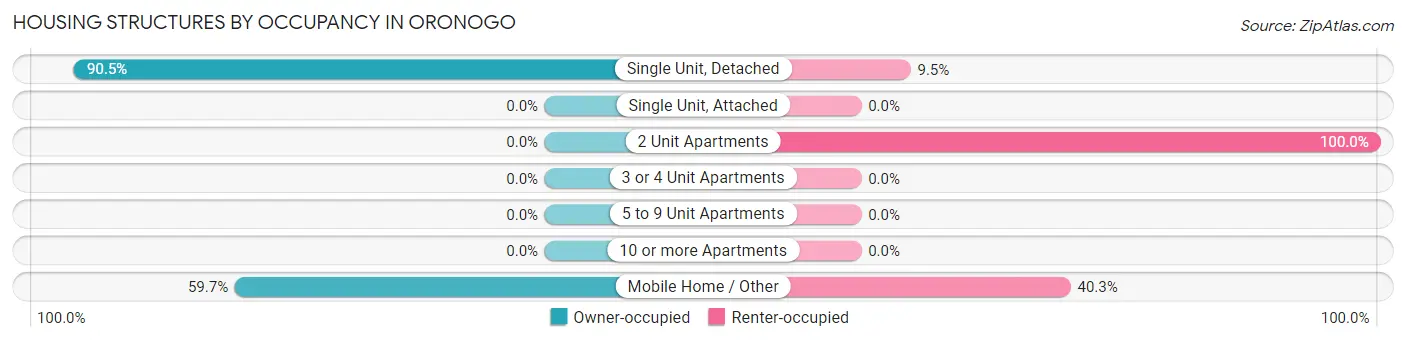
| Structure Type | Owner-occupied | Renter-occupied |
| Single Unit, Detached | 762 (90.5%) | 80 (9.5%) |
| Single Unit, Attached | 0 (0.0%) | 0 (0.0%) |
| 2 Unit Apartments | 0 (0.0%) | 6 (100.0%) |
| 3 or 4 Unit Apartments | 0 (0.0%) | 0 (0.0%) |
| 5 to 9 Unit Apartments | 0 (0.0%) | 0 (0.0%) |
| 10 or more Apartments | 0 (0.0%) | 0 (0.0%) |
| Mobile Home / Other | 37 (59.7%) | 25 (40.3%) |
| Total | 799 (87.8%) | 111 (12.2%) |
Housing Structures by Number of Rooms in Oronogo
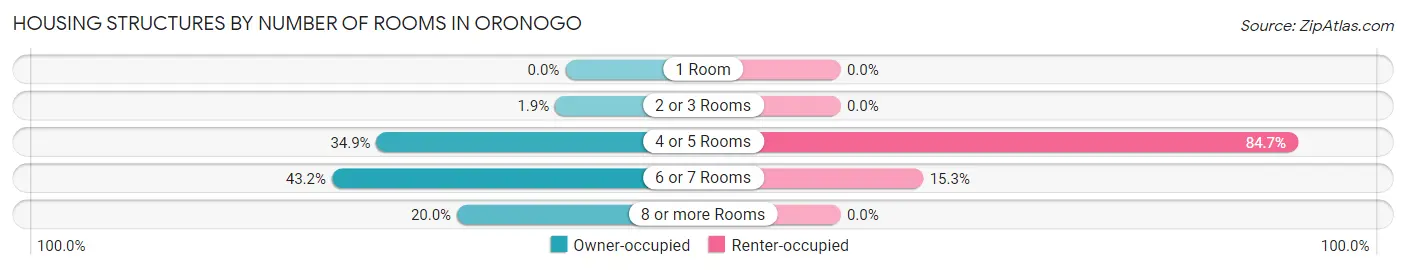
| Number of Rooms | Owner-occupied | Renter-occupied |
| 1 Room | 0 (0.0%) | 0 (0.0%) |
| 2 or 3 Rooms | 15 (1.9%) | 0 (0.0%) |
| 4 or 5 Rooms | 279 (34.9%) | 94 (84.7%) |
| 6 or 7 Rooms | 345 (43.2%) | 17 (15.3%) |
| 8 or more Rooms | 160 (20.0%) | 0 (0.0%) |
| Total | 799 (100.0%) | 111 (100.0%) |
Housing Structure by Heating Type in Oronogo
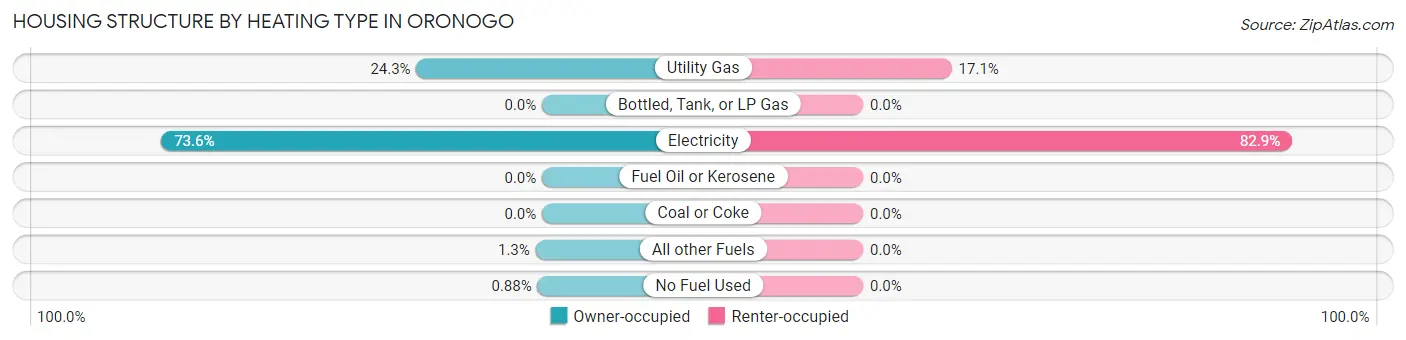
| Heating Type | Owner-occupied | Renter-occupied |
| Utility Gas | 194 (24.3%) | 19 (17.1%) |
| Bottled, Tank, or LP Gas | 0 (0.0%) | 0 (0.0%) |
| Electricity | 588 (73.6%) | 92 (82.9%) |
| Fuel Oil or Kerosene | 0 (0.0%) | 0 (0.0%) |
| Coal or Coke | 0 (0.0%) | 0 (0.0%) |
| All other Fuels | 10 (1.3%) | 0 (0.0%) |
| No Fuel Used | 7 (0.9%) | 0 (0.0%) |
| Total | 799 (100.0%) | 111 (100.0%) |
Household Vehicle Usage in Oronogo
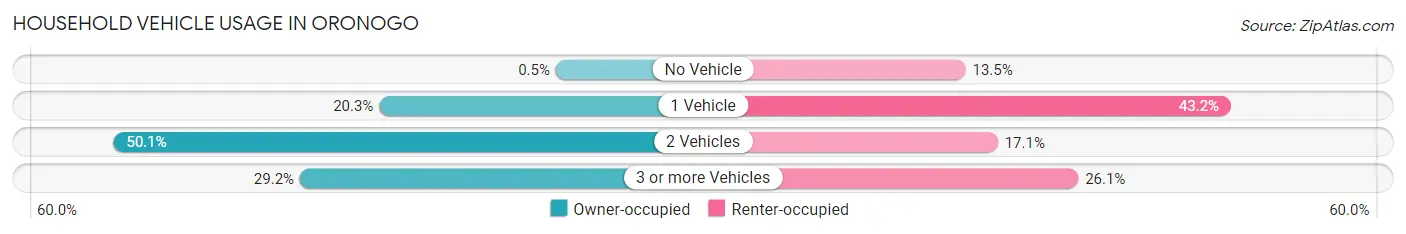
| Vehicles per Household | Owner-occupied | Renter-occupied |
| No Vehicle | 4 (0.5%) | 15 (13.5%) |
| 1 Vehicle | 162 (20.3%) | 48 (43.2%) |
| 2 Vehicles | 400 (50.1%) | 19 (17.1%) |
| 3 or more Vehicles | 233 (29.2%) | 29 (26.1%) |
| Total | 799 (100.0%) | 111 (100.0%) |
Real Estate & Mortgages in Oronogo
Real Estate and Mortgage Overview in Oronogo
| Characteristic | Without Mortgage | With Mortgage |
| Housing Units | 228 | 571 |
| Median Property Value | $179,600 | $179,200 |
| Median Household Income | $48,875 | $99 |
| Monthly Housing Costs | $403 | $0 |
| Real Estate Taxes | $964 | $11 |
Property Value by Mortgage Status in Oronogo
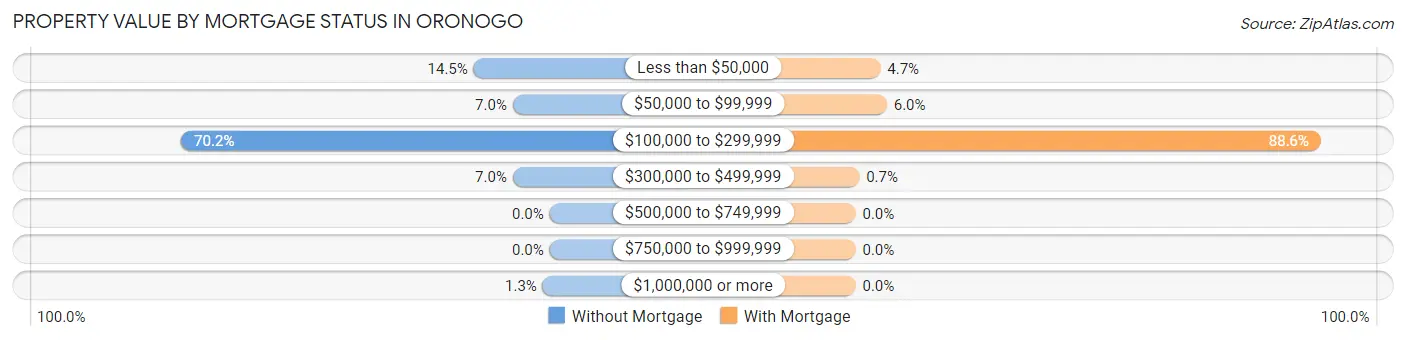
| Property Value | Without Mortgage | With Mortgage |
| Less than $50,000 | 33 (14.5%) | 27 (4.7%) |
| $50,000 to $99,999 | 16 (7.0%) | 34 (5.9%) |
| $100,000 to $299,999 | 160 (70.2%) | 506 (88.6%) |
| $300,000 to $499,999 | 16 (7.0%) | 4 (0.7%) |
| $500,000 to $749,999 | 0 (0.0%) | 0 (0.0%) |
| $750,000 to $999,999 | 0 (0.0%) | 0 (0.0%) |
| $1,000,000 or more | 3 (1.3%) | 0 (0.0%) |
| Total | 228 (100.0%) | 571 (100.0%) |
Household Income by Mortgage Status in Oronogo
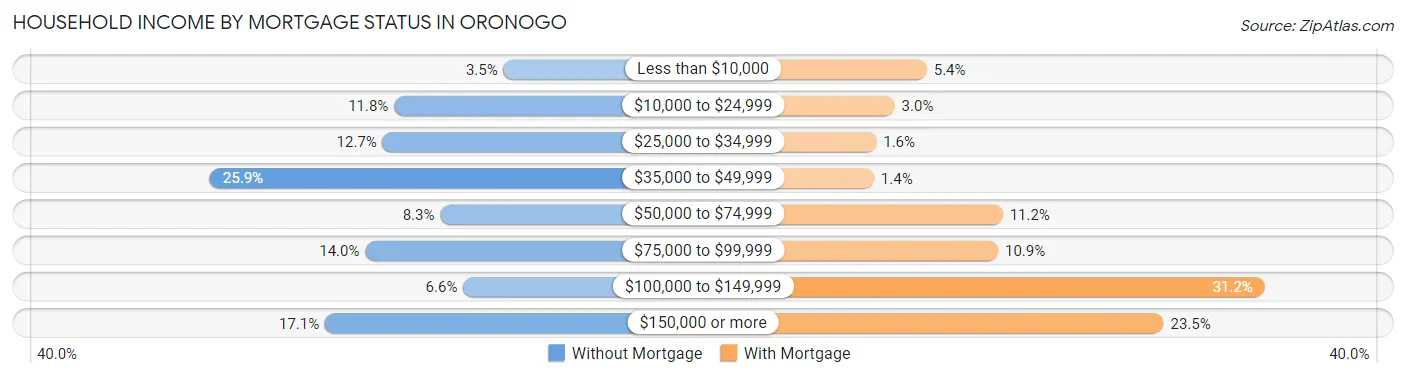
| Household Income | Without Mortgage | With Mortgage |
| Less than $10,000 | 8 (3.5%) | 31 (5.4%) |
| $10,000 to $24,999 | 27 (11.8%) | 17 (3.0%) |
| $25,000 to $34,999 | 29 (12.7%) | 9 (1.6%) |
| $35,000 to $49,999 | 59 (25.9%) | 8 (1.4%) |
| $50,000 to $74,999 | 19 (8.3%) | 64 (11.2%) |
| $75,000 to $99,999 | 32 (14.0%) | 62 (10.9%) |
| $100,000 to $149,999 | 15 (6.6%) | 178 (31.2%) |
| $150,000 or more | 39 (17.1%) | 134 (23.5%) |
| Total | 228 (100.0%) | 571 (100.0%) |
Property Value to Household Income Ratio in Oronogo
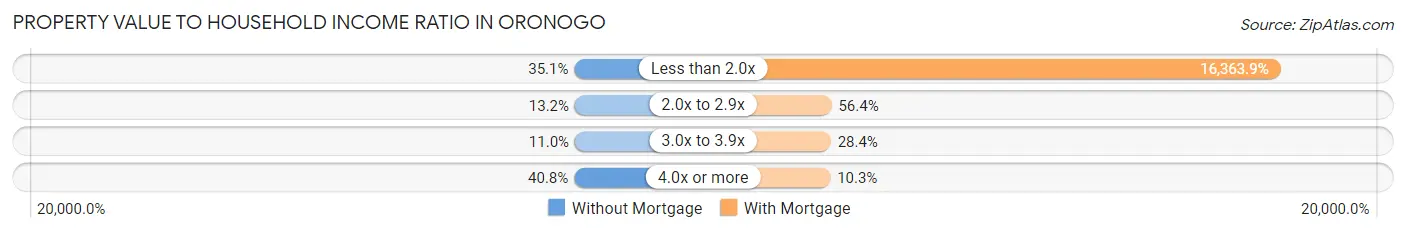
| Value-to-Income Ratio | Without Mortgage | With Mortgage |
| Less than 2.0x | 80 (35.1%) | 93,438 (16,363.9%) |
| 2.0x to 2.9x | 30 (13.2%) | 322 (56.4%) |
| 3.0x to 3.9x | 25 (11.0%) | 162 (28.4%) |
| 4.0x or more | 93 (40.8%) | 59 (10.3%) |
| Total | 228 (100.0%) | 571 (100.0%) |
Real Estate Taxes by Mortgage Status in Oronogo
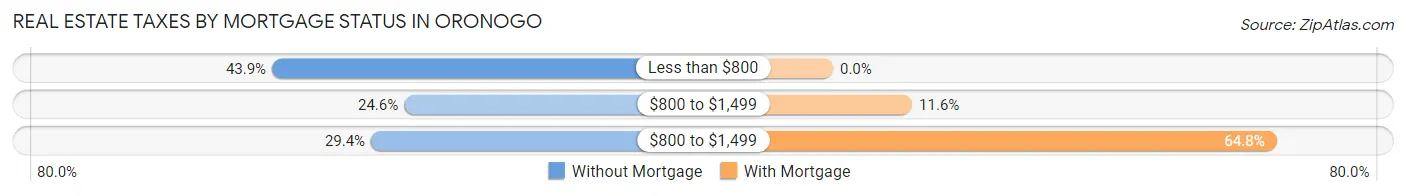
| Property Taxes | Without Mortgage | With Mortgage |
| Less than $800 | 100 (43.9%) | 0 (0.0%) |
| $800 to $1,499 | 56 (24.6%) | 66 (11.6%) |
| $800 to $1,499 | 67 (29.4%) | 370 (64.8%) |
| Total | 228 (100.0%) | 571 (100.0%) |
Health & Disability in Oronogo
Health Insurance Coverage by Age in Oronogo
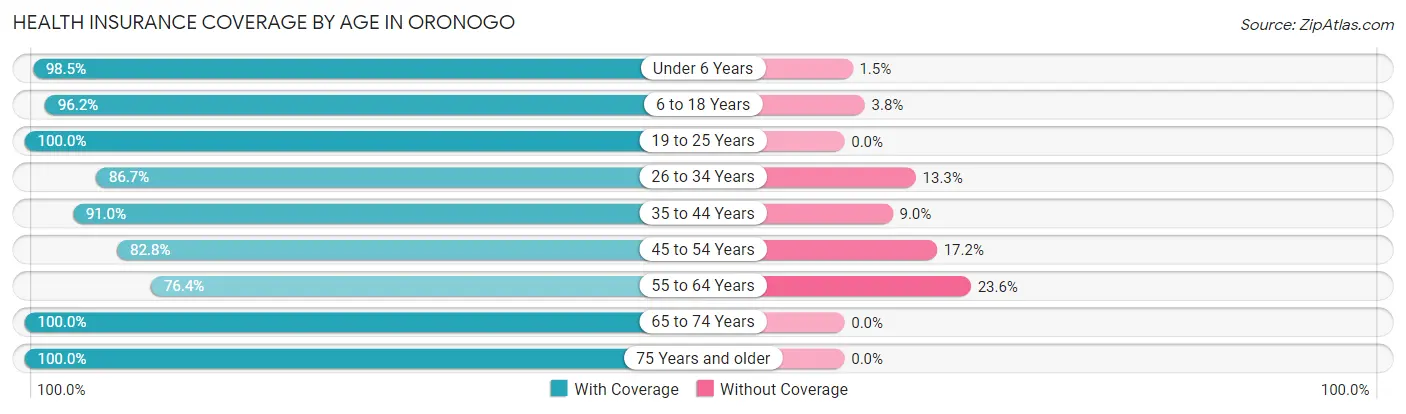
| Age Bracket | With Coverage | Without Coverage |
| Under 6 Years | 260 (98.5%) | 4 (1.5%) |
| 6 to 18 Years | 533 (96.2%) | 21 (3.8%) |
| 19 to 25 Years | 65 (100.0%) | 0 (0.0%) |
| 26 to 34 Years | 339 (86.7%) | 52 (13.3%) |
| 35 to 44 Years | 496 (91.0%) | 49 (9.0%) |
| 45 to 54 Years | 192 (82.8%) | 40 (17.2%) |
| 55 to 64 Years | 201 (76.4%) | 62 (23.6%) |
| 65 to 74 Years | 231 (100.0%) | 0 (0.0%) |
| 75 Years and older | 52 (100.0%) | 0 (0.0%) |
| Total | 2,369 (91.2%) | 228 (8.8%) |
Health Insurance Coverage by Citizenship Status in Oronogo
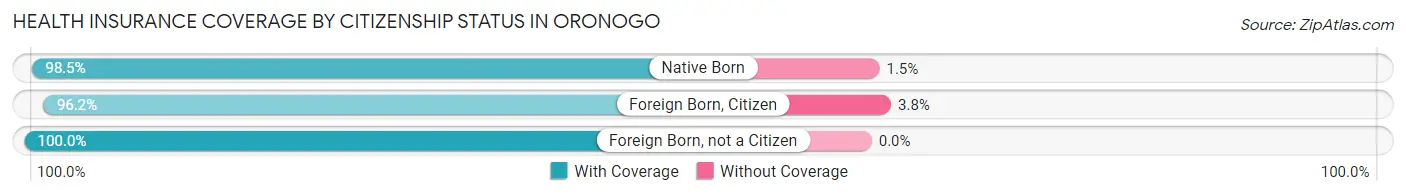
| Citizenship Status | With Coverage | Without Coverage |
| Native Born | 260 (98.5%) | 4 (1.5%) |
| Foreign Born, Citizen | 533 (96.2%) | 21 (3.8%) |
| Foreign Born, not a Citizen | 65 (100.0%) | 0 (0.0%) |
Health Insurance Coverage by Household Income in Oronogo
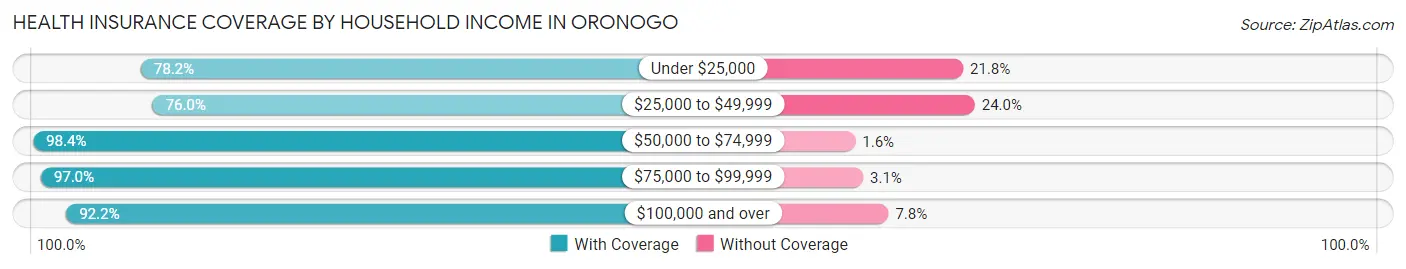
| Household Income | With Coverage | Without Coverage |
| Under $25,000 | 122 (78.2%) | 34 (21.8%) |
| $25,000 to $49,999 | 282 (76.0%) | 89 (24.0%) |
| $50,000 to $74,999 | 306 (98.4%) | 5 (1.6%) |
| $75,000 to $99,999 | 762 (97.0%) | 24 (3.0%) |
| $100,000 and over | 897 (92.2%) | 76 (7.8%) |
Public vs Private Health Insurance Coverage by Age in Oronogo
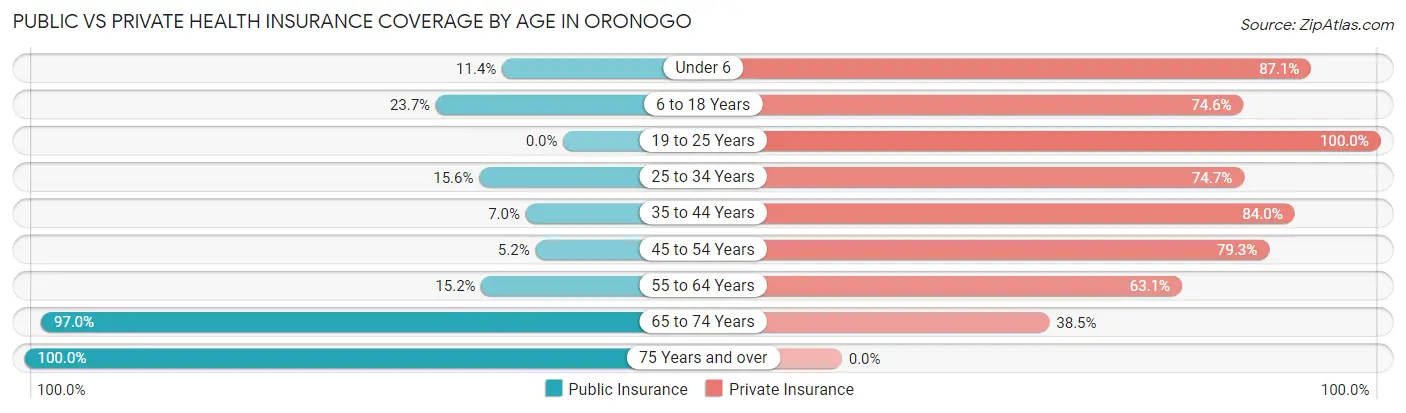
| Age Bracket | Public Insurance | Private Insurance |
| Under 6 | 30 (11.4%) | 230 (87.1%) |
| 6 to 18 Years | 131 (23.6%) | 413 (74.6%) |
| 19 to 25 Years | 0 (0.0%) | 65 (100.0%) |
| 25 to 34 Years | 61 (15.6%) | 292 (74.7%) |
| 35 to 44 Years | 38 (7.0%) | 458 (84.0%) |
| 45 to 54 Years | 12 (5.2%) | 184 (79.3%) |
| 55 to 64 Years | 40 (15.2%) | 166 (63.1%) |
| 65 to 74 Years | 224 (97.0%) | 89 (38.5%) |
| 75 Years and over | 52 (100.0%) | 0 (0.0%) |
| Total | 588 (22.6%) | 1,897 (73.1%) |
Disability Status by Sex by Age in Oronogo
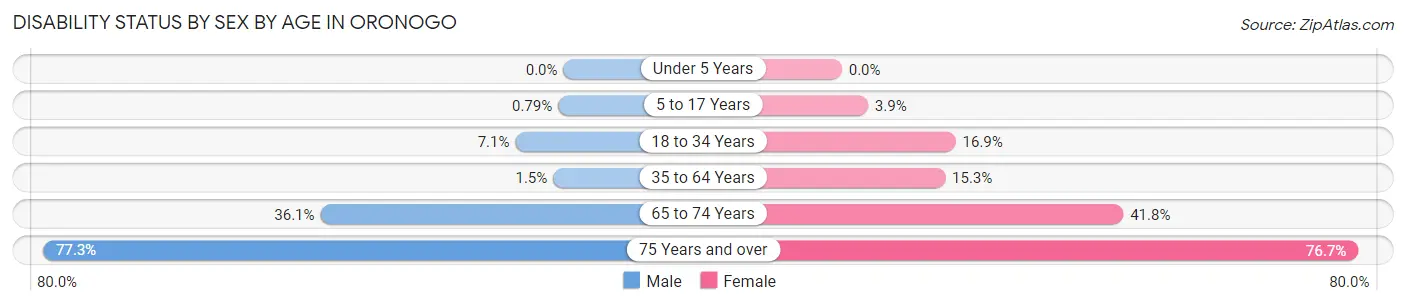
| Age Bracket | Male | Female |
| Under 5 Years | 0 (0.0%) | 0 (0.0%) |
| 5 to 17 Years | 3 (0.8%) | 9 (3.9%) |
| 18 to 34 Years | 13 (7.1%) | 48 (16.9%) |
| 35 to 64 Years | 8 (1.5%) | 79 (15.3%) |
| 65 to 74 Years | 35 (36.1%) | 56 (41.8%) |
| 75 Years and over | 17 (77.3%) | 23 (76.7%) |
Disability Class by Sex by Age in Oronogo
Disability Class: Hearing Difficulty
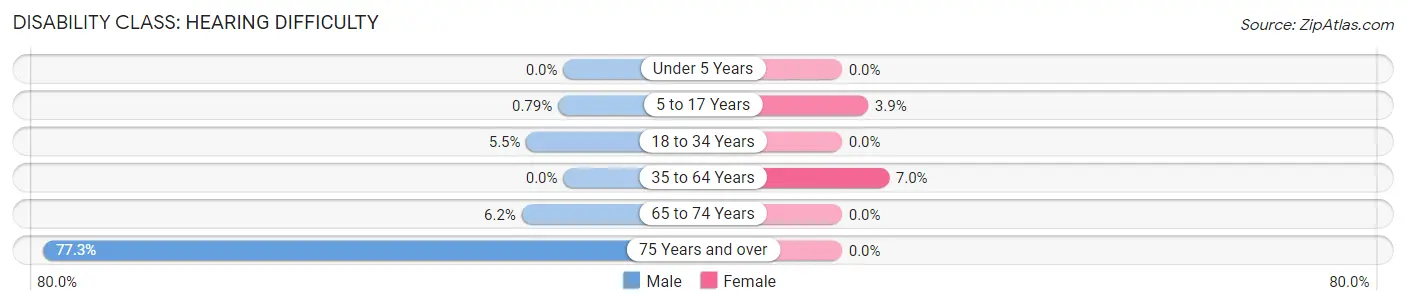
| Age Bracket | Male | Female |
| Under 5 Years | 0 (0.0%) | 0 (0.0%) |
| 5 to 17 Years | 3 (0.8%) | 9 (3.9%) |
| 18 to 34 Years | 10 (5.5%) | 0 (0.0%) |
| 35 to 64 Years | 0 (0.0%) | 36 (7.0%) |
| 65 to 74 Years | 6 (6.2%) | 0 (0.0%) |
| 75 Years and over | 17 (77.3%) | 0 (0.0%) |
Disability Class: Vision Difficulty
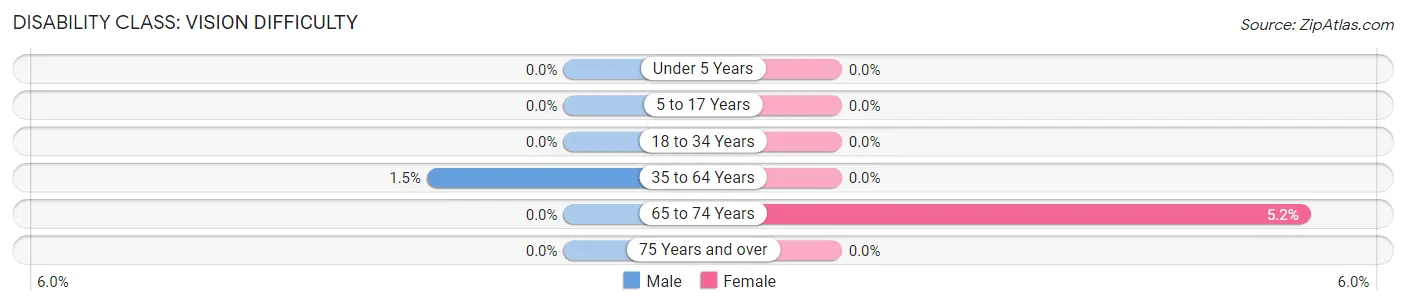
| Age Bracket | Male | Female |
| Under 5 Years | 0 (0.0%) | 0 (0.0%) |
| 5 to 17 Years | 0 (0.0%) | 0 (0.0%) |
| 18 to 34 Years | 0 (0.0%) | 0 (0.0%) |
| 35 to 64 Years | 8 (1.5%) | 0 (0.0%) |
| 65 to 74 Years | 0 (0.0%) | 7 (5.2%) |
| 75 Years and over | 0 (0.0%) | 0 (0.0%) |
Disability Class: Cognitive Difficulty
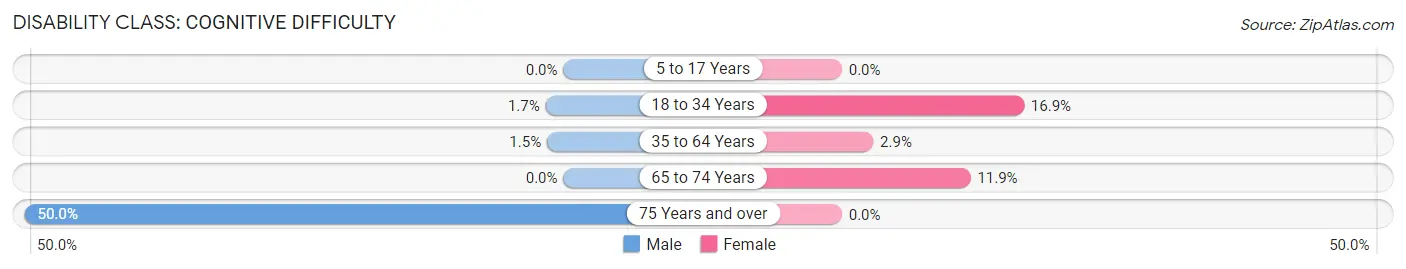
| Age Bracket | Male | Female |
| 5 to 17 Years | 0 (0.0%) | 0 (0.0%) |
| 18 to 34 Years | 3 (1.7%) | 48 (16.9%) |
| 35 to 64 Years | 8 (1.5%) | 15 (2.9%) |
| 65 to 74 Years | 0 (0.0%) | 16 (11.9%) |
| 75 Years and over | 11 (50.0%) | 0 (0.0%) |
Disability Class: Ambulatory Difficulty
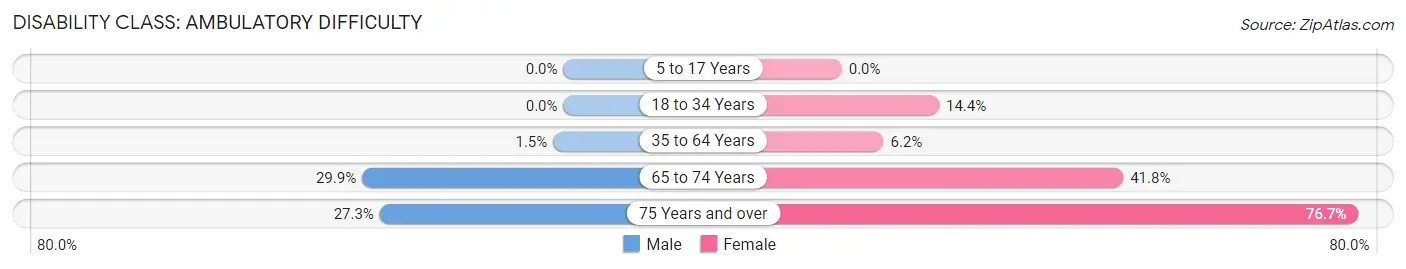
| Age Bracket | Male | Female |
| 5 to 17 Years | 0 (0.0%) | 0 (0.0%) |
| 18 to 34 Years | 0 (0.0%) | 41 (14.4%) |
| 35 to 64 Years | 8 (1.5%) | 32 (6.2%) |
| 65 to 74 Years | 29 (29.9%) | 56 (41.8%) |
| 75 Years and over | 6 (27.3%) | 23 (76.7%) |
Disability Class: Self-Care Difficulty
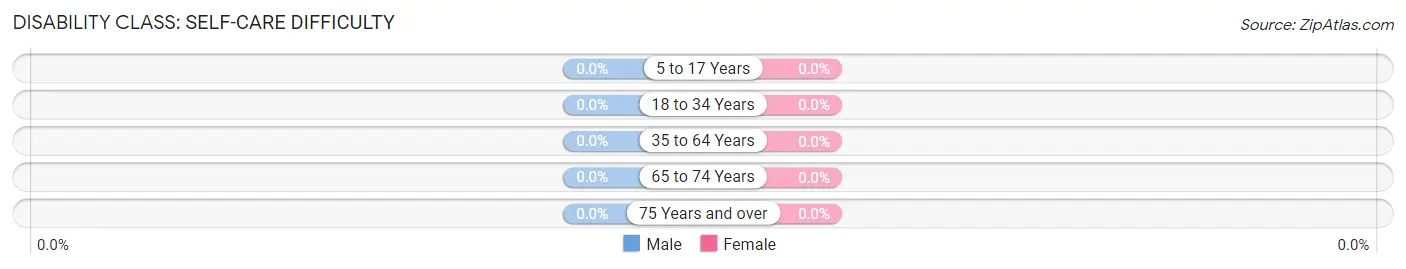
| Age Bracket | Male | Female |
| 5 to 17 Years | 0 (0.0%) | 0 (0.0%) |
| 18 to 34 Years | 0 (0.0%) | 0 (0.0%) |
| 35 to 64 Years | 0 (0.0%) | 0 (0.0%) |
| 65 to 74 Years | 0 (0.0%) | 0 (0.0%) |
| 75 Years and over | 0 (0.0%) | 0 (0.0%) |
Technology Access in Oronogo
Computing Device Access in Oronogo
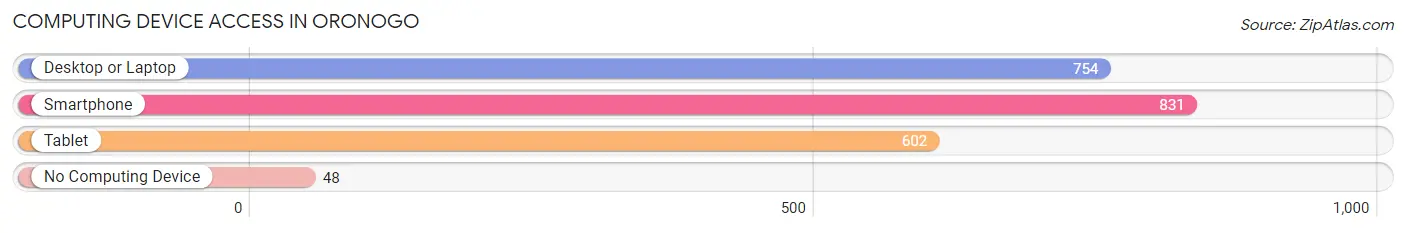
| Device Type | # Households | % Households |
| Desktop or Laptop | 754 | 82.9% |
| Smartphone | 831 | 91.3% |
| Tablet | 602 | 66.1% |
| No Computing Device | 48 | 5.3% |
| Total | 910 | 100.0% |
Internet Access in Oronogo
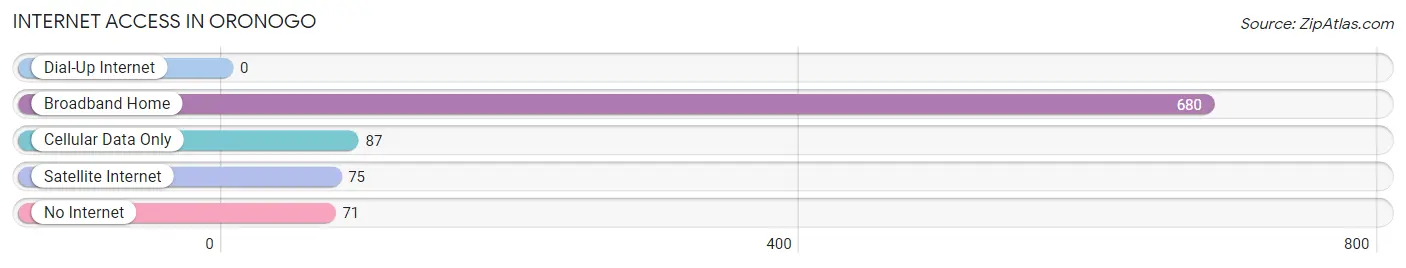
| Internet Type | # Households | % Households |
| Dial-Up Internet | 0 | 0.0% |
| Broadband Home | 680 | 74.7% |
| Cellular Data Only | 87 | 9.6% |
| Satellite Internet | 75 | 8.2% |
| No Internet | 71 | 7.8% |
| Total | 910 | 100.0% |
Oronogo Summary
Oronogo is a small city located in Jasper County, Missouri. It is situated in the southwestern corner of the state, about 20 miles south of Joplin. The city has a population of 1,845 people, according to the 2010 census.
History
Oronogo was founded in 1883 by the Missouri Pacific Railroad. The city was named after a Native American chief of the same name. The chief was a member of the Osage tribe, which had inhabited the area for centuries. The city was incorporated in 1887.
In the early 1900s, Oronogo was a thriving mining town. The city was home to several coal mines, which provided employment for many of the residents. The mines were eventually closed in the 1950s, and the city's economy shifted to agriculture and manufacturing.
Geography
Oronogo is located in the Ozark Plateau region of Missouri. The city is situated on the banks of the Spring River, which flows through the city. The city is surrounded by rolling hills and wooded areas. The climate is humid subtropical, with hot summers and mild winters.
Economy
Oronogo's economy is largely based on agriculture and manufacturing. The city is home to several large farms, which produce a variety of crops, including corn, soybeans, and wheat. The city is also home to several manufacturing companies, which produce a variety of products, including furniture, clothing, and automotive parts.
Demographics
According to the 2010 census, Oronogo has a population of 1,845 people. The racial makeup of the city is 94.3% White, 2.2% African American, 0.7% Native American, 0.3% Asian, and 2.5% from other races. The median household income is $37,917, and the median age is 38.7 years.
Conclusion
Oronogo is a small city located in Jasper County, Missouri. It was founded in 1883 and was once a thriving mining town. Today, the city's economy is largely based on agriculture and manufacturing. The city has a population of 1,845 people, and the median household income is $37,917. Oronogo is a great place to live, work, and raise a family.
Common Questions
What is Per Capita Income in Oronogo?
Per Capita income in Oronogo is $30,509.
What is the Median Family Income in Oronogo?
Median Family Income in Oronogo is $93,375.
What is the Median Household income in Oronogo?
Median Household Income in Oronogo is $85,143.
What is Income or Wage Gap in Oronogo?
Income or Wage Gap in Oronogo is 18.9%.
Women in Oronogo earn 81.1 cents for every dollar earned by a man.
What is Inequality or Gini Index in Oronogo?
Inequality or Gini Index in Oronogo is 0.34.
What is the Total Population of Oronogo?
Total Population of Oronogo is 2,597.
What is the Total Male Population of Oronogo?
Total Male Population of Oronogo is 1,271.
What is the Total Female Population of Oronogo?
Total Female Population of Oronogo is 1,326.
What is the Ratio of Males per 100 Females in Oronogo?
There are 95.85 Males per 100 Females in Oronogo.
What is the Ratio of Females per 100 Males in Oronogo?
There are 104.33 Females per 100 Males in Oronogo.
What is the Median Population Age in Oronogo?
Median Population Age in Oronogo is 35.5 Years.
What is the Average Family Size in Oronogo
Average Family Size in Oronogo is 3.3 People.
What is the Average Household Size in Oronogo
Average Household Size in Oronogo is 2.9 People.
How Large is the Labor Force in Oronogo?
There are 1,319 People in the Labor Forcein in Oronogo.
What is the Percentage of People in the Labor Force in Oronogo?
70.6% of People are in the Labor Force in Oronogo.
What is the Unemployment Rate in Oronogo?
Unemployment Rate in Oronogo is 2.3%.