Mountain View, MO Map & Demographics
Mountain View Map
Mountain View Overview
$20,910
PER CAPITA INCOME
$53,958
AVG FAMILY INCOME
$43,611
AVG HOUSEHOLD INCOME
9.8%
WAGE / INCOME GAP [ % ]
90.2¢/ $1
WAGE / INCOME GAP [ $ ]
0.43
INEQUALITY / GINI INDEX
2,558
TOTAL POPULATION
1,126
MALE POPULATION
1,432
FEMALE POPULATION
78.63
MALES / 100 FEMALES
127.18
FEMALES / 100 MALES
43.9
MEDIAN AGE
3.0
AVG FAMILY SIZE
2.5
AVG HOUSEHOLD SIZE
953
LABOR FORCE [ PEOPLE ]
46.2%
PERCENT IN LABOR FORCE
2.6%
UNEMPLOYMENT RATE
Mountain View Zip Codes
Mountain View Area Codes
Income in Mountain View
Income Overview in Mountain View
Per Capita Income in Mountain View is $20,910, while median incomes of families and households are $53,958 and $43,611 respectively.
| Characteristic | Number | Measure |
| Per Capita Income | 2,558 | $20,910 |
| Median Family Income | 611 | $53,958 |
| Mean Family Income | 611 | $53,805 |
| Median Household Income | 972 | $43,611 |
| Mean Household Income | 972 | $48,642 |
| Income Deficit | 611 | $0 |
| Wage / Income Gap (%) | 2,558 | 9.76% |
| Wage / Income Gap ($) | 2,558 | 90.24¢ per $1 |
| Gini / Inequality Index | 2,558 | 0.43 |
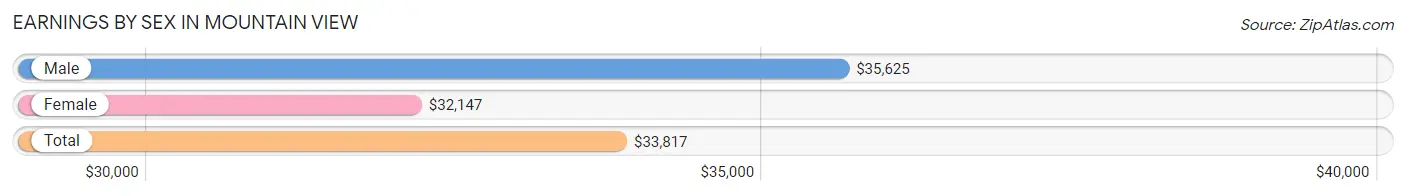
Earnings by Sex in Mountain View
Average Earnings in Mountain View are $33,817, $35,625 for men and $32,147 for women, a difference of 9.8%.
| Sex | Number | Average Earnings |
| Male | 432 (43.1%) | $35,625 |
| Female | 571 (56.9%) | $32,147 |
| Total | 1,003 (100.0%) | $33,817 |
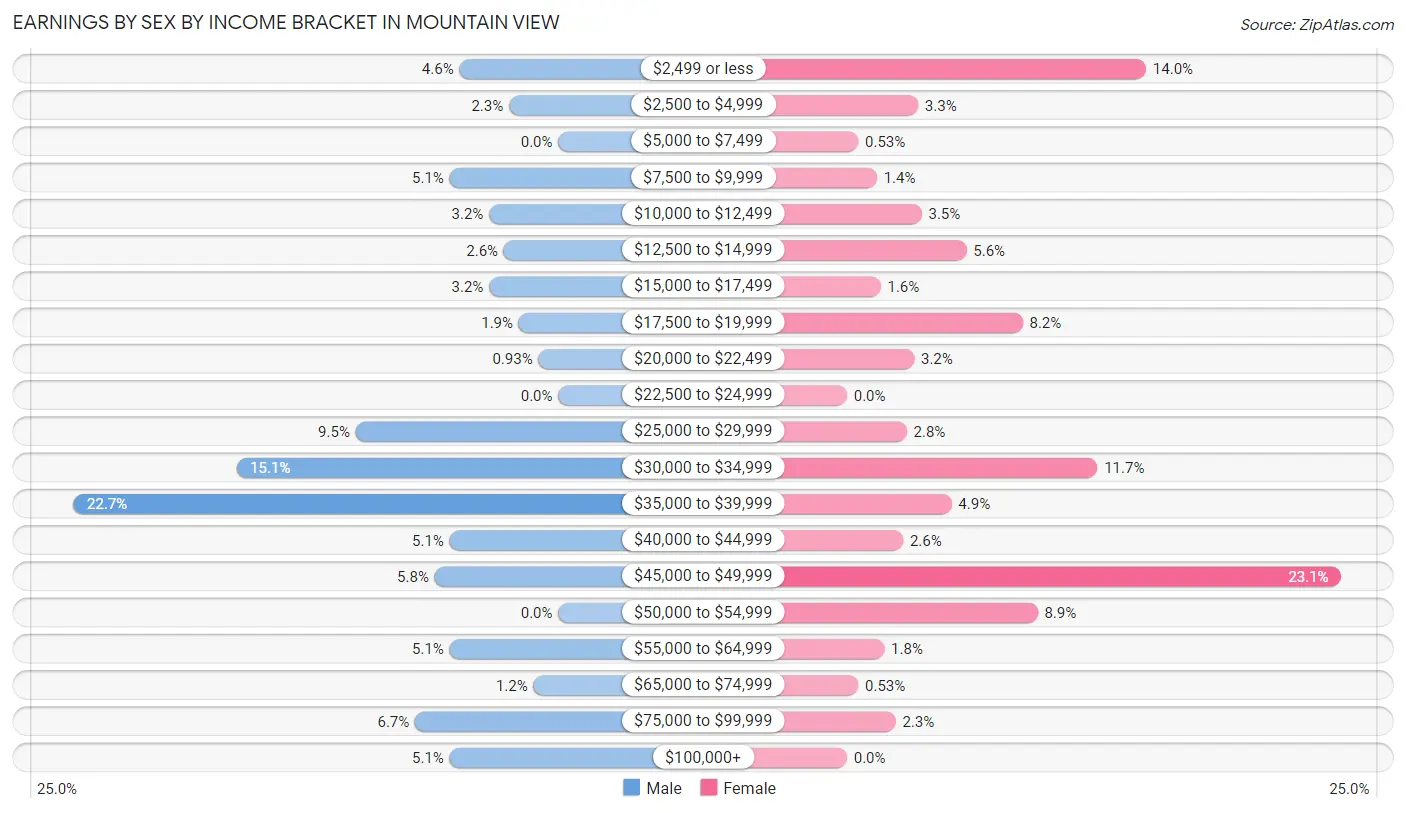
Earnings by Sex by Income Bracket in Mountain View
The most common earnings brackets in Mountain View are $35,000 to $39,999 for men (98 | 22.7%) and $45,000 to $49,999 for women (132 | 23.1%).
| Income | Male | Female |
| $2,499 or less | 20 (4.6%) | 80 (14.0%) |
| $2,500 to $4,999 | 10 (2.3%) | 19 (3.3%) |
| $5,000 to $7,499 | 0 (0.0%) | 3 (0.5%) |
| $7,500 to $9,999 | 22 (5.1%) | 8 (1.4%) |
| $10,000 to $12,499 | 14 (3.2%) | 20 (3.5%) |
| $12,500 to $14,999 | 11 (2.5%) | 32 (5.6%) |
| $15,000 to $17,499 | 14 (3.2%) | 9 (1.6%) |
| $17,500 to $19,999 | 8 (1.8%) | 47 (8.2%) |
| $20,000 to $22,499 | 4 (0.9%) | 18 (3.2%) |
| $22,500 to $24,999 | 0 (0.0%) | 0 (0.0%) |
| $25,000 to $29,999 | 41 (9.5%) | 16 (2.8%) |
| $30,000 to $34,999 | 65 (15.0%) | 67 (11.7%) |
| $35,000 to $39,999 | 98 (22.7%) | 28 (4.9%) |
| $40,000 to $44,999 | 22 (5.1%) | 15 (2.6%) |
| $45,000 to $49,999 | 25 (5.8%) | 132 (23.1%) |
| $50,000 to $54,999 | 0 (0.0%) | 51 (8.9%) |
| $55,000 to $64,999 | 22 (5.1%) | 10 (1.8%) |
| $65,000 to $74,999 | 5 (1.2%) | 3 (0.5%) |
| $75,000 to $99,999 | 29 (6.7%) | 13 (2.3%) |
| $100,000+ | 22 (5.1%) | 0 (0.0%) |
| Total | 432 (100.0%) | 571 (100.0%) |
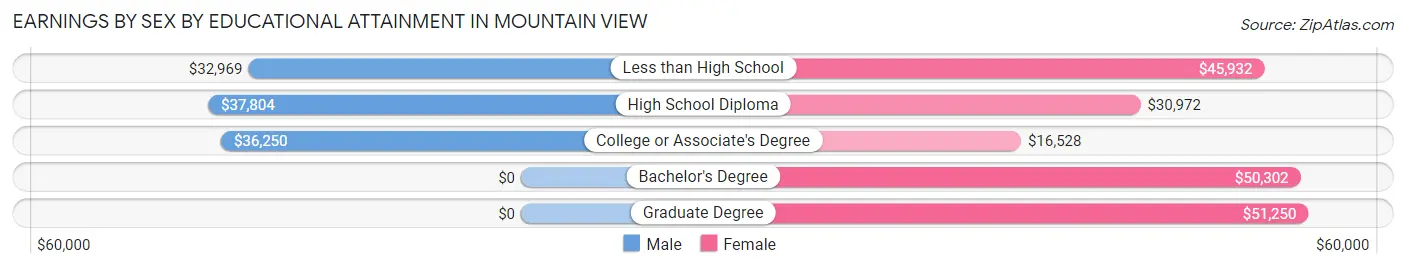
Earnings by Sex by Educational Attainment in Mountain View
Average earnings in Mountain View are $36,384 for men and $32,404 for women, a difference of 10.9%. Men with an educational attainment of high school diploma enjoy the highest average annual earnings of $37,804, while those with less than high school education earn the least with $32,969. Women with an educational attainment of graduate degree earn the most with the average annual earnings of $51,250, while those with college or associate's degree education have the smallest earnings of $16,528.
| Educational Attainment | Male Income | Female Income |
| Less than High School | $32,969 | $45,932 |
| High School Diploma | $37,804 | $30,972 |
| College or Associate's Degree | $36,250 | $16,528 |
| Bachelor's Degree | - | - |
| Graduate Degree | - | - |
| Total | $36,384 | $32,404 |
Family Income in Mountain View
Family Income Brackets in Mountain View
According to the Mountain View family income data, there are 170 families falling into the $50,000 to $74,999 income range, which is the most common income bracket and makes up 27.8% of all families.
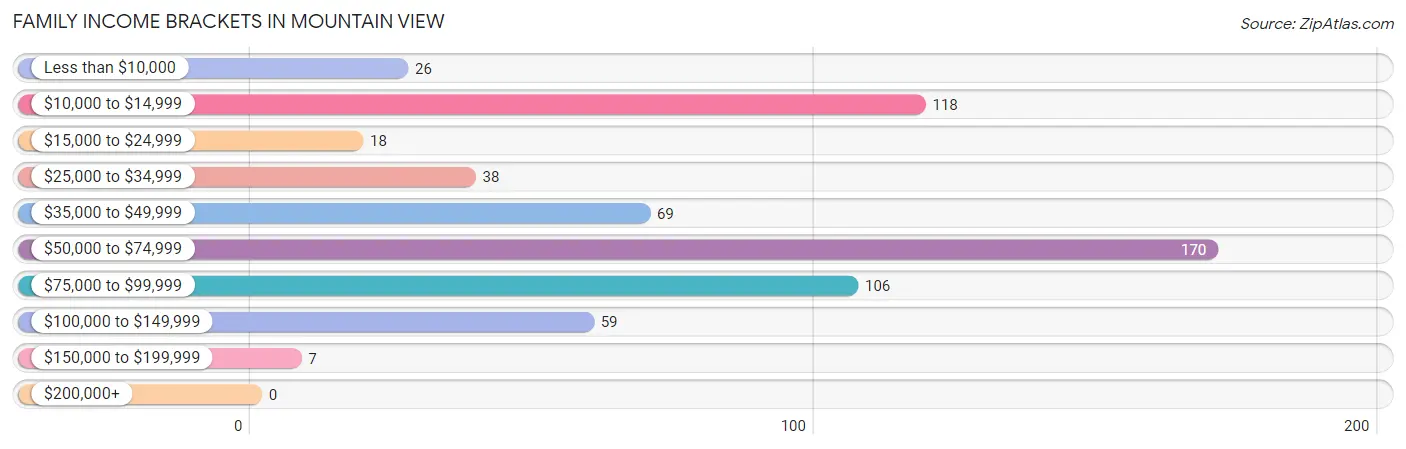
| Income Bracket | # Families | % Families |
| Less than $10,000 | 26 | 4.3% |
| $10,000 to $14,999 | 118 | 19.3% |
| $15,000 to $24,999 | 18 | 2.9% |
| $25,000 to $34,999 | 38 | 6.2% |
| $35,000 to $49,999 | 69 | 11.3% |
| $50,000 to $74,999 | 170 | 27.8% |
| $75,000 to $99,999 | 106 | 17.3% |
| $100,000 to $149,999 | 59 | 9.7% |
| $150,000 to $199,999 | 7 | 1.1% |
| $200,000+ | 0 | 0.0% |
Family Income by Famaliy Size in Mountain View
4-person families (75 | 12.3%) account for the highest median family income in Mountain View with $89,712 per family, while 2-person families (361 | 59.1%) have the highest median income of $26,525 per family member.
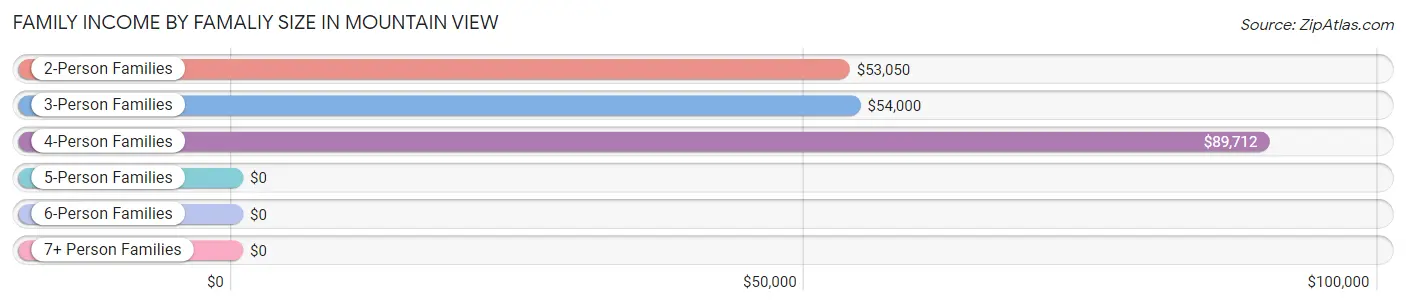
| Income Bracket | # Families | Median Income |
| 2-Person Families | 361 (59.1%) | $53,050 |
| 3-Person Families | 140 (22.9%) | $54,000 |
| 4-Person Families | 75 (12.3%) | $89,712 |
| 5-Person Families | 12 (2.0%) | $0 |
| 6-Person Families | 23 (3.8%) | $0 |
| 7+ Person Families | 0 (0.0%) | $0 |
| Total | 611 (100.0%) | $53,958 |
Family Income by Number of Earners in Mountain View
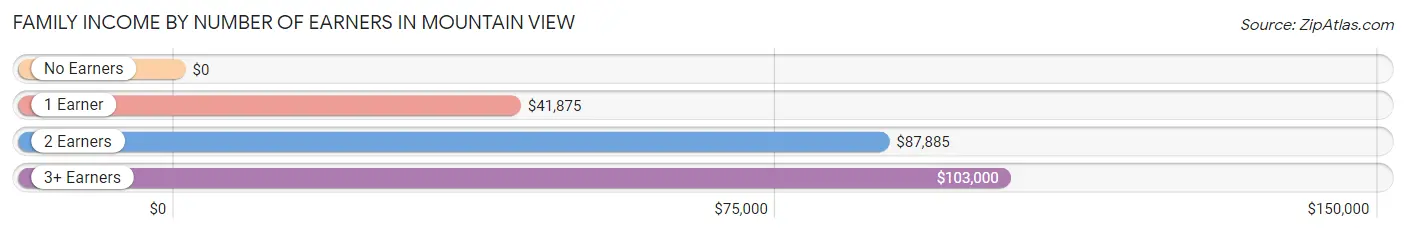
| Number of Earners | # Families | Median Income |
| No Earners | 261 (42.7%) | $0 |
| 1 Earner | 168 (27.5%) | $41,875 |
| 2 Earners | 148 (24.2%) | $87,885 |
| 3+ Earners | 34 (5.6%) | $103,000 |
| Total | 611 (100.0%) | $53,958 |
Household Income in Mountain View
Household Income Brackets in Mountain View
With 233 households falling in the category, the $50,000 to $74,999 income range is the most frequent in Mountain View, accounting for 24.0% of all households. In contrast, only 5 households (0.5%) fall into the $200,000+ income bracket, making it the least populous group.
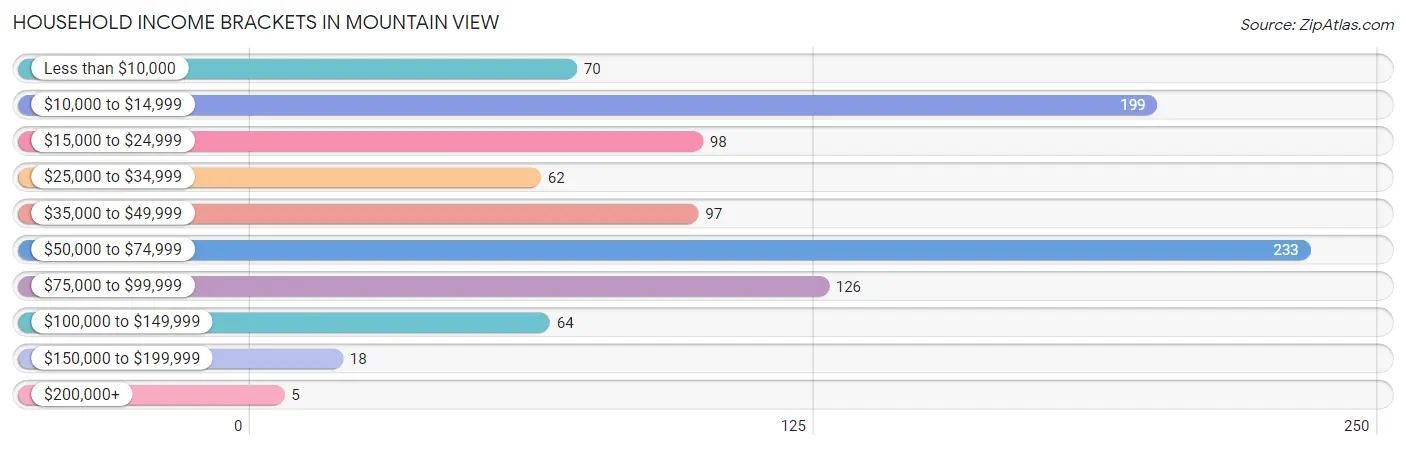
| Income Bracket | # Households | % Households |
| Less than $10,000 | 70 | 7.2% |
| $10,000 to $14,999 | 199 | 20.5% |
| $15,000 to $24,999 | 98 | 10.1% |
| $25,000 to $34,999 | 62 | 6.4% |
| $35,000 to $49,999 | 97 | 10.0% |
| $50,000 to $74,999 | 233 | 24.0% |
| $75,000 to $99,999 | 126 | 13.0% |
| $100,000 to $149,999 | 64 | 6.6% |
| $150,000 to $199,999 | 18 | 1.9% |
| $200,000+ | 5 | 0.5% |
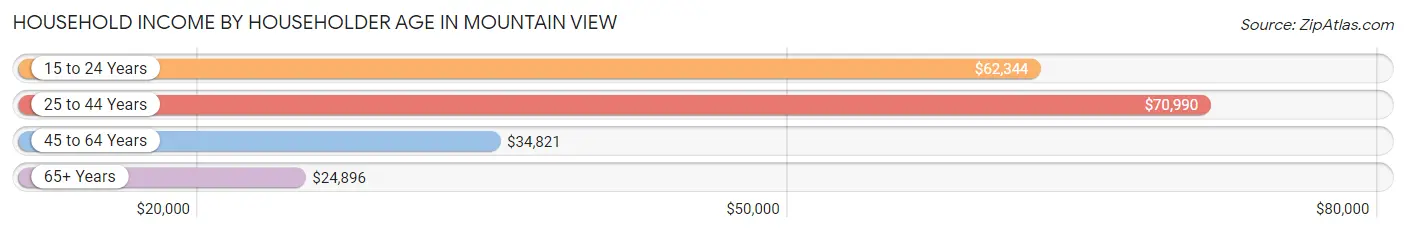
Household Income by Householder Age in Mountain View
The median household income in Mountain View is $43,611, with the highest median household income of $70,990 found in the 25 to 44 years age bracket for the primary householder. A total of 231 households (23.8%) fall into this category. Meanwhile, the 65+ years age bracket for the primary householder has the lowest median household income of $24,896, with 438 households (45.1%) in this group.
| Income Bracket | # Households | Median Income |
| 15 to 24 Years | 47 (4.8%) | $62,344 |
| 25 to 44 Years | 231 (23.8%) | $70,990 |
| 45 to 64 Years | 256 (26.3%) | $34,821 |
| 65+ Years | 438 (45.1%) | $24,896 |
| Total | 972 (100.0%) | $43,611 |
Poverty in Mountain View
Income Below Poverty by Sex and Age in Mountain View
With 31.4% poverty level for males and 32.2% for females among the residents of Mountain View, 15 year old males and 6 to 11 year old females are the most vulnerable to poverty, with 7 males (100.0%) and 57 females (64.8%) in their respective age groups living below the poverty level.
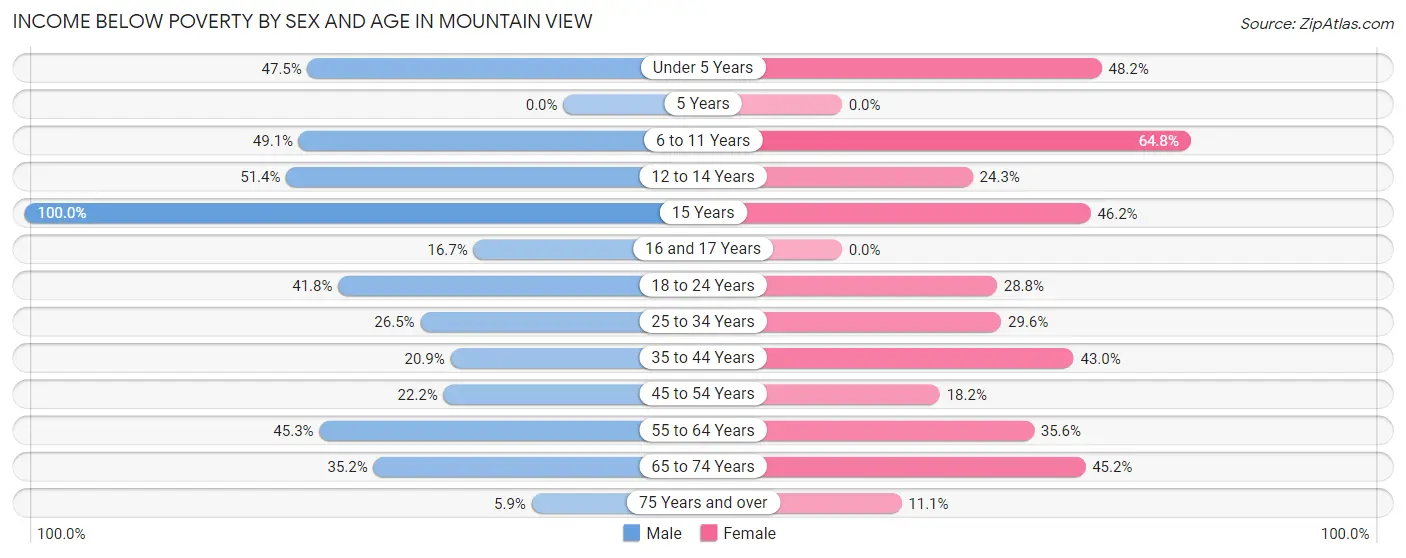
| Age Bracket | Male | Female |
| Under 5 Years | 47 (47.5%) | 27 (48.2%) |
| 5 Years | 0 (0.0%) | 0 (0.0%) |
| 6 to 11 Years | 27 (49.1%) | 57 (64.8%) |
| 12 to 14 Years | 18 (51.4%) | 17 (24.3%) |
| 15 Years | 7 (100.0%) | 12 (46.2%) |
| 16 and 17 Years | 10 (16.7%) | 0 (0.0%) |
| 18 to 24 Years | 33 (41.8%) | 21 (28.8%) |
| 25 to 34 Years | 26 (26.5%) | 34 (29.6%) |
| 35 to 44 Years | 40 (20.9%) | 74 (43.0%) |
| 45 to 54 Years | 22 (22.2%) | 44 (18.2%) |
| 55 to 64 Years | 72 (45.3%) | 36 (35.6%) |
| 65 to 74 Years | 31 (35.2%) | 89 (45.2%) |
| 75 Years and over | 6 (5.9%) | 23 (11.1%) |
| Total | 339 (31.4%) | 434 (32.2%) |
Income Above Poverty by Sex and Age in Mountain View
According to the poverty statistics in Mountain View, males aged 5 years and females aged 75 years and over are the age groups that are most secure financially, with 100.0% of males and 88.9% of females in these age groups living above the poverty line.
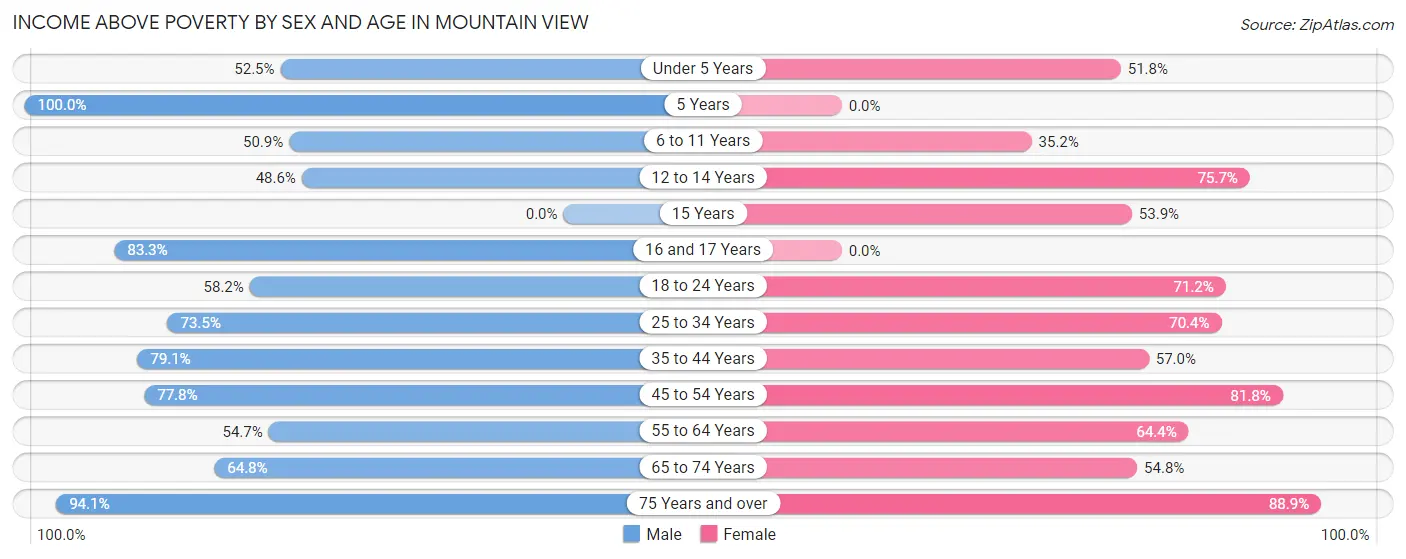
| Age Bracket | Male | Female |
| Under 5 Years | 52 (52.5%) | 29 (51.8%) |
| 5 Years | 7 (100.0%) | 0 (0.0%) |
| 6 to 11 Years | 28 (50.9%) | 31 (35.2%) |
| 12 to 14 Years | 17 (48.6%) | 53 (75.7%) |
| 15 Years | 0 (0.0%) | 14 (53.8%) |
| 16 and 17 Years | 50 (83.3%) | 0 (0.0%) |
| 18 to 24 Years | 46 (58.2%) | 52 (71.2%) |
| 25 to 34 Years | 72 (73.5%) | 81 (70.4%) |
| 35 to 44 Years | 151 (79.1%) | 98 (57.0%) |
| 45 to 54 Years | 77 (77.8%) | 198 (81.8%) |
| 55 to 64 Years | 87 (54.7%) | 65 (64.4%) |
| 65 to 74 Years | 57 (64.8%) | 108 (54.8%) |
| 75 Years and over | 96 (94.1%) | 185 (88.9%) |
| Total | 740 (68.6%) | 914 (67.8%) |
Income Below Poverty Among Married-Couple Families in Mountain View
The poverty statistics for married-couple families in Mountain View show that 23.6% or 113 of the total 478 families live below the poverty line. Families with 3 or 4 children have the highest poverty rate of 82.1%, comprising of 23 families. On the other hand, families with 1 or 2 children have the lowest poverty rate of 6.7%, which includes 10 families.
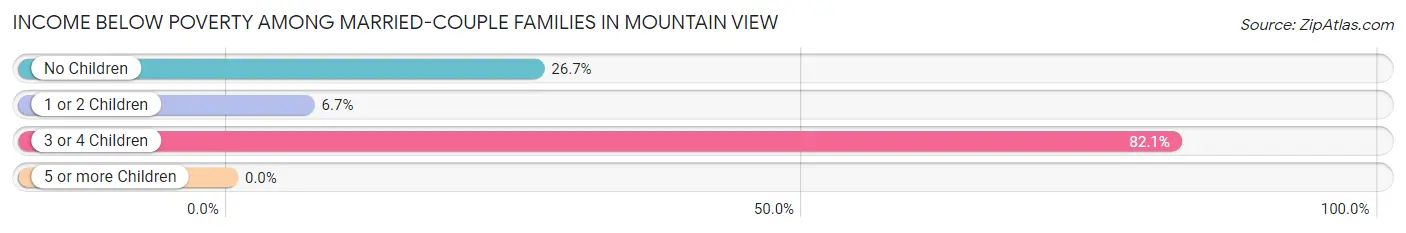
| Children | Above Poverty | Below Poverty |
| No Children | 220 (73.3%) | 80 (26.7%) |
| 1 or 2 Children | 140 (93.3%) | 10 (6.7%) |
| 3 or 4 Children | 5 (17.9%) | 23 (82.1%) |
| 5 or more Children | 0 (0.0%) | 0 (0.0%) |
| Total | 365 (76.4%) | 113 (23.6%) |
Income Below Poverty Among Single-Parent Households in Mountain View
According to the poverty data in Mountain View, 25.7% or 9 single-father households and 50.0% or 49 single-mother households are living below the poverty line. Among single-father households, those with 1 or 2 children have the highest poverty rate, with 9 households (50.0%) experiencing poverty. Likewise, among single-mother households, those with 1 or 2 children have the highest poverty rate, with 18 households (78.3%) falling below the poverty line.
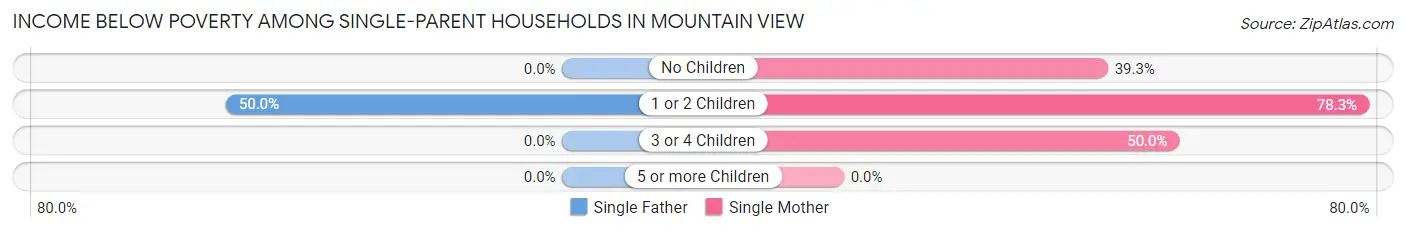
| Children | Single Father | Single Mother |
| No Children | 0 (0.0%) | 24 (39.3%) |
| 1 or 2 Children | 9 (50.0%) | 18 (78.3%) |
| 3 or 4 Children | 0 (0.0%) | 7 (50.0%) |
| 5 or more Children | 0 (0.0%) | 0 (0.0%) |
| Total | 9 (25.7%) | 49 (50.0%) |
Income Below Poverty Among Married-Couple vs Single-Parent Households in Mountain View
The poverty data for Mountain View shows that 113 of the married-couple family households (23.6%) and 58 of the single-parent households (43.6%) are living below the poverty level. Within the married-couple family households, those with 3 or 4 children have the highest poverty rate, with 23 households (82.1%) falling below the poverty line. Among the single-parent households, those with 1 or 2 children have the highest poverty rate, with 27 household (65.8%) living below poverty.
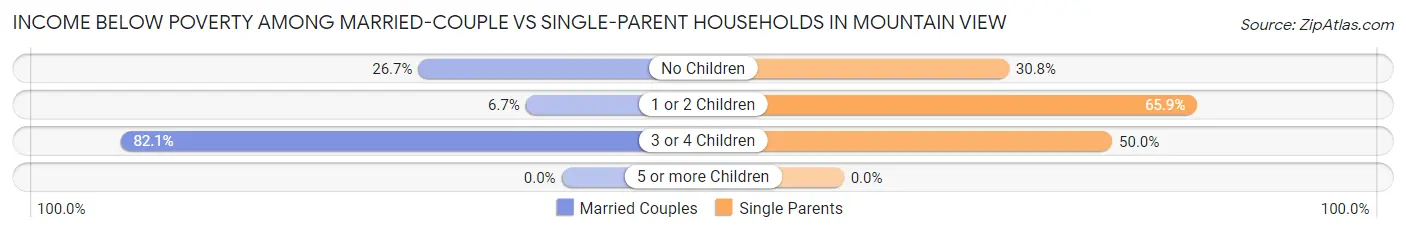
| Children | Married-Couple Families | Single-Parent Households |
| No Children | 80 (26.7%) | 24 (30.8%) |
| 1 or 2 Children | 10 (6.7%) | 27 (65.8%) |
| 3 or 4 Children | 23 (82.1%) | 7 (50.0%) |
| 5 or more Children | 0 (0.0%) | 0 (0.0%) |
| Total | 113 (23.6%) | 58 (43.6%) |
Race in Mountain View
The most populous races in Mountain View are White / Caucasian (2,428 | 94.9%), Two or more Races (51 | 2.0%), and Some other Race (39 | 1.5%).
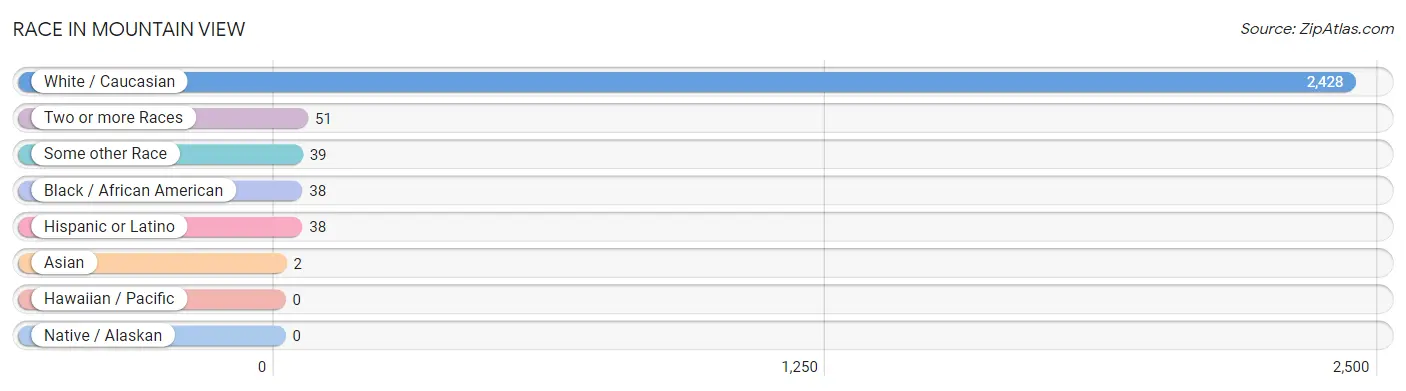
| Race | # Population | % Population |
| Asian | 2 | 0.1% |
| Black / African American | 38 | 1.5% |
| Hawaiian / Pacific | 0 | 0.0% |
| Hispanic or Latino | 38 | 1.5% |
| Native / Alaskan | 0 | 0.0% |
| White / Caucasian | 2,428 | 94.9% |
| Two or more Races | 51 | 2.0% |
| Some other Race | 39 | 1.5% |
| Total | 2,558 | 100.0% |
Ancestry in Mountain View
The most populous ancestries reported in Mountain View are English (536 | 20.9%), German (351 | 13.7%), American (305 | 11.9%), Irish (216 | 8.4%), and French (91 | 3.6%), together accounting for 58.6% of all Mountain View residents.
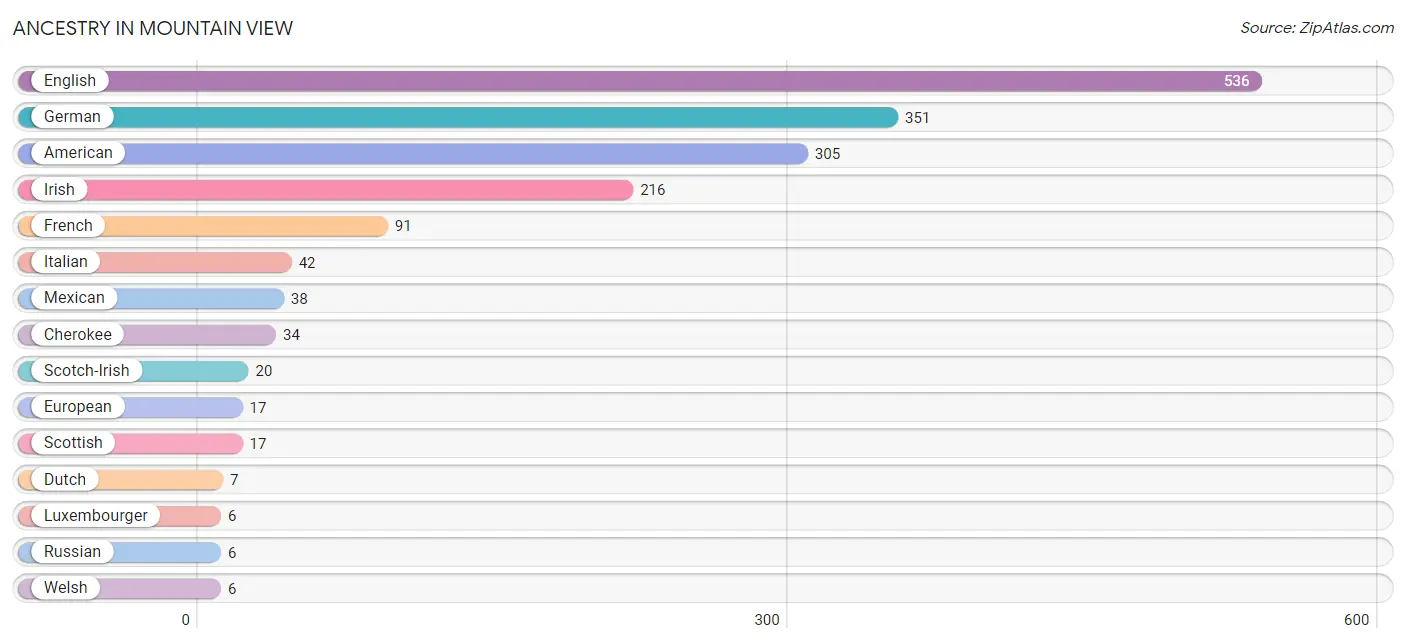
| Ancestry | # Population | % Population |
| American | 305 | 11.9% |
| Canadian | 4 | 0.2% |
| Cherokee | 34 | 1.3% |
| Czech | 4 | 0.2% |
| Dutch | 7 | 0.3% |
| English | 536 | 20.9% |
| European | 17 | 0.7% |
| Finnish | 5 | 0.2% |
| French | 91 | 3.6% |
| French Canadian | 5 | 0.2% |
| German | 351 | 13.7% |
| Hungarian | 4 | 0.2% |
| Indian (Asian) | 2 | 0.1% |
| Irish | 216 | 8.4% |
| Italian | 42 | 1.6% |
| Luxembourger | 6 | 0.2% |
| Mexican | 38 | 1.5% |
| Russian | 6 | 0.2% |
| Scandinavian | 5 | 0.2% |
| Scotch-Irish | 20 | 0.8% |
| Scottish | 17 | 0.7% |
| Seminole | 5 | 0.2% |
| Swedish | 5 | 0.2% |
| Welsh | 6 | 0.2% | View All 24 Rows |
Immigrants in Mountain View
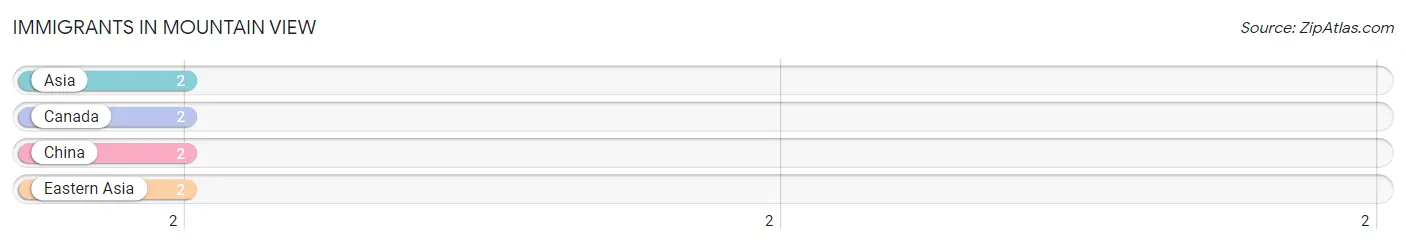
The most numerous immigrant groups reported in Mountain View came from Asia (2 | 0.1%), Canada (2 | 0.1%), China (2 | 0.1%), and Eastern Asia (2 | 0.1%), together accounting for 0.3% of all Mountain View residents.
| Immigration Origin | # Population | % Population |
| Asia | 2 | 0.1% |
| Canada | 2 | 0.1% |
| China | 2 | 0.1% |
| Eastern Asia | 2 | 0.1% | View All 4 Rows |
Sex and Age in Mountain View
Sex and Age in Mountain View
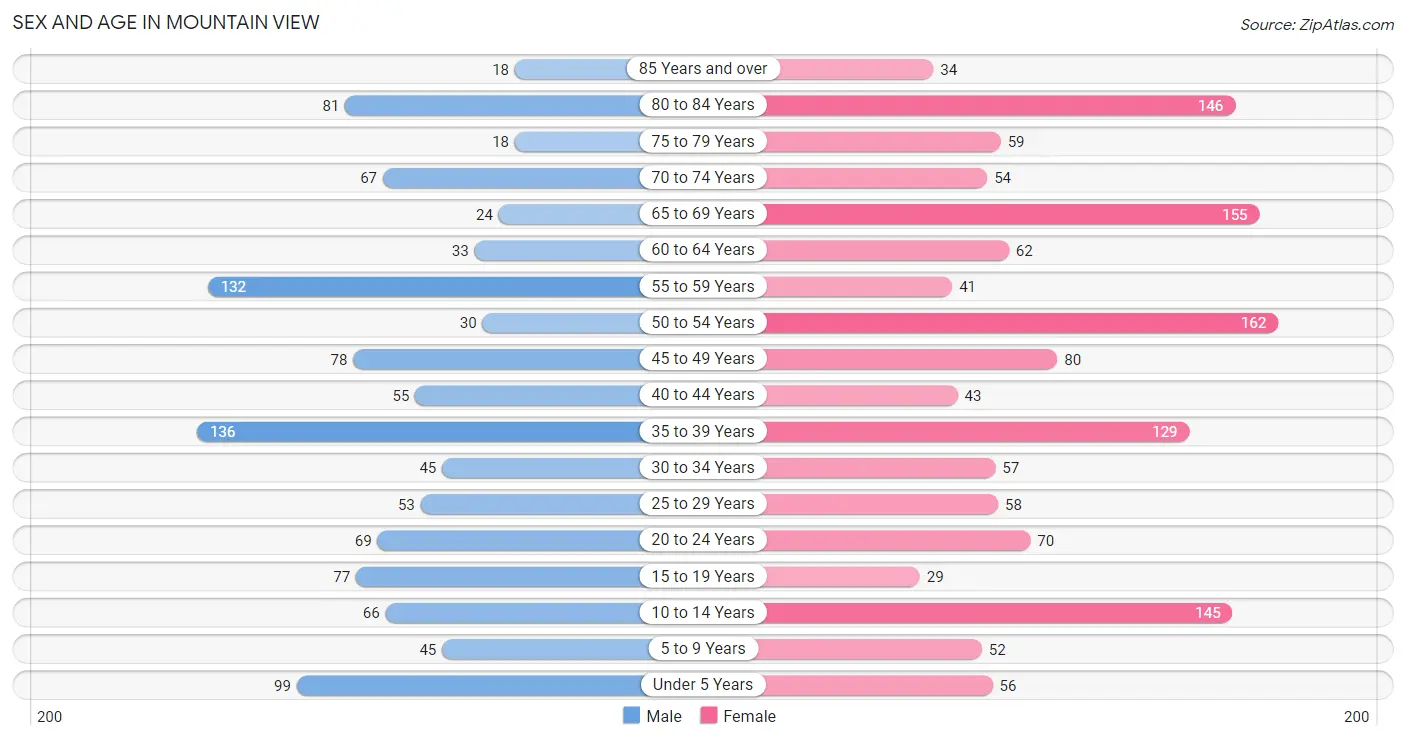
The most populous age groups in Mountain View are 35 to 39 Years (136 | 12.1%) for men and 50 to 54 Years (162 | 11.3%) for women.
| Age Bracket | Male | Female |
| Under 5 Years | 99 (8.8%) | 56 (3.9%) |
| 5 to 9 Years | 45 (4.0%) | 52 (3.6%) |
| 10 to 14 Years | 66 (5.9%) | 145 (10.1%) |
| 15 to 19 Years | 77 (6.8%) | 29 (2.0%) |
| 20 to 24 Years | 69 (6.1%) | 70 (4.9%) |
| 25 to 29 Years | 53 (4.7%) | 58 (4.1%) |
| 30 to 34 Years | 45 (4.0%) | 57 (4.0%) |
| 35 to 39 Years | 136 (12.1%) | 129 (9.0%) |
| 40 to 44 Years | 55 (4.9%) | 43 (3.0%) |
| 45 to 49 Years | 78 (6.9%) | 80 (5.6%) |
| 50 to 54 Years | 30 (2.7%) | 162 (11.3%) |
| 55 to 59 Years | 132 (11.7%) | 41 (2.9%) |
| 60 to 64 Years | 33 (2.9%) | 62 (4.3%) |
| 65 to 69 Years | 24 (2.1%) | 155 (10.8%) |
| 70 to 74 Years | 67 (5.9%) | 54 (3.8%) |
| 75 to 79 Years | 18 (1.6%) | 59 (4.1%) |
| 80 to 84 Years | 81 (7.2%) | 146 (10.2%) |
| 85 Years and over | 18 (1.6%) | 34 (2.4%) |
| Total | 1,126 (100.0%) | 1,432 (100.0%) |
Families and Households in Mountain View
Median Family Size in Mountain View
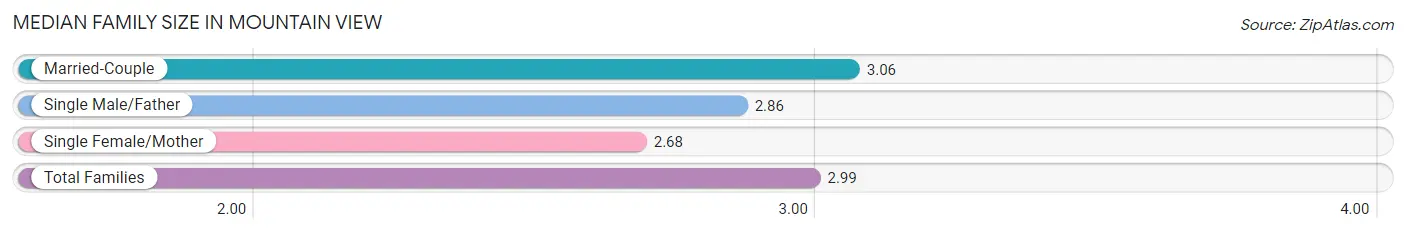
The median family size in Mountain View is 2.99 persons per family, with married-couple families (478 | 78.2%) accounting for the largest median family size of 3.06 persons per family. On the other hand, single female/mother families (98 | 16.0%) represent the smallest median family size with 2.68 persons per family.
| Family Type | # Families | Family Size |
| Married-Couple | 478 (78.2%) | 3.06 |
| Single Male/Father | 35 (5.7%) | 2.86 |
| Single Female/Mother | 98 (16.0%) | 2.68 |
| Total Families | 611 (100.0%) | 2.99 |
Median Household Size in Mountain View
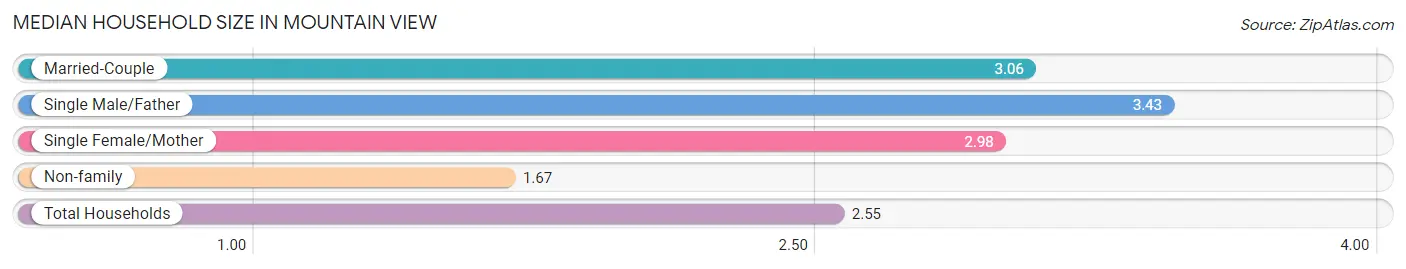
The median household size in Mountain View is 2.55 persons per household, with single male/father households (35 | 3.6%) accounting for the largest median household size of 3.43 persons per household. non-family households (361 | 37.1%) represent the smallest median household size with 1.67 persons per household.
| Household Type | # Households | Household Size |
| Married-Couple | 478 (49.2%) | 3.06 |
| Single Male/Father | 35 (3.6%) | 3.43 |
| Single Female/Mother | 98 (10.1%) | 2.98 |
| Non-family | 361 (37.1%) | 1.67 |
| Total Households | 972 (100.0%) | 2.55 |
Household Size by Marriage Status in Mountain View
Out of a total of 972 households in Mountain View, 611 (62.9%) are family households, while 361 (37.1%) are nonfamily households. The most numerous type of family households are 2-person households, comprising 349, and the most common type of nonfamily households are 1-person households, comprising 281.
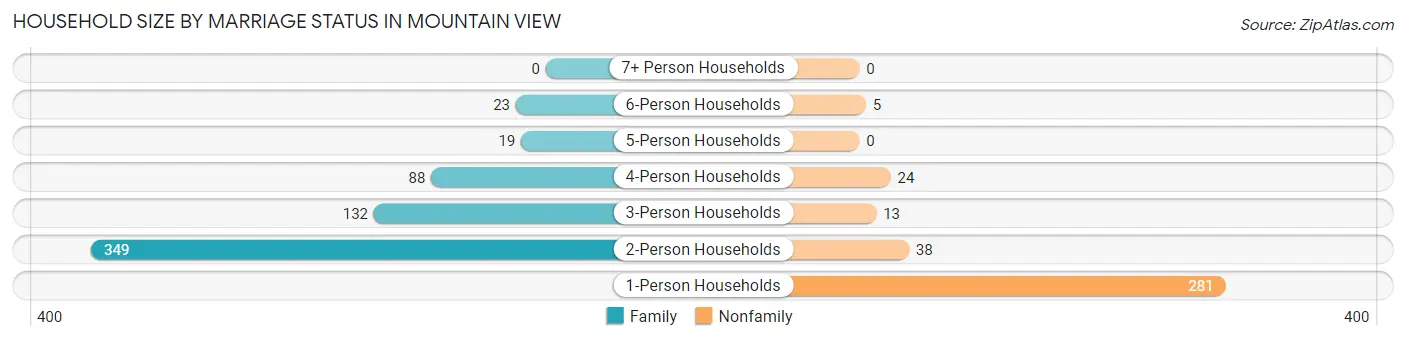
| Household Size | Family Households | Nonfamily Households |
| 1-Person Households | - | 281 (28.9%) |
| 2-Person Households | 349 (35.9%) | 38 (3.9%) |
| 3-Person Households | 132 (13.6%) | 13 (1.3%) |
| 4-Person Households | 88 (9.0%) | 24 (2.5%) |
| 5-Person Households | 19 (1.9%) | 0 (0.0%) |
| 6-Person Households | 23 (2.4%) | 5 (0.5%) |
| 7+ Person Households | 0 (0.0%) | 0 (0.0%) |
| Total | 611 (62.9%) | 361 (37.1%) |
Female Fertility in Mountain View
Fertility by Age in Mountain View
Average fertility rate in Mountain View is 85.0 births per 1,000 women. Women in the age bracket of 20 to 34 years have the highest fertility rate with 189.0 births per 1,000 women. Women in the age bracket of 20 to 34 years acount for 87.5% of all women with births.
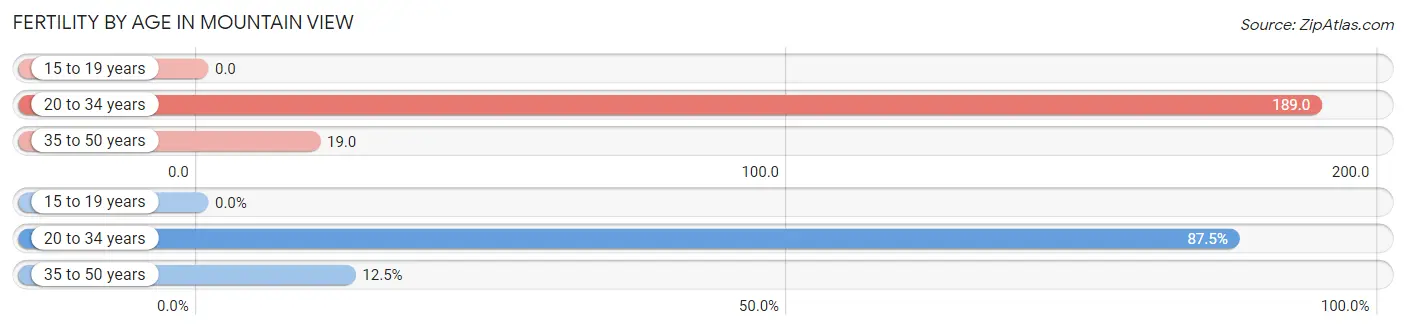
| Age Bracket | Women with Births | Births / 1,000 Women |
| 15 to 19 years | 0 (0.0%) | 0.0 |
| 20 to 34 years | 35 (87.5%) | 189.0 |
| 35 to 50 years | 5 (12.5%) | 19.0 |
| Total | 40 (100.0%) | 85.0 |
Fertility by Age by Marriage Status in Mountain View
72.5% of women with births (40) in Mountain View are married. The highest percentage of unmarried women with births falls into 20 to 34 years age bracket with 31.4% of them unmarried at the time of birth, while the lowest percentage of unmarried women with births belong to 35 to 50 years age bracket with 0.0% of them unmarried.
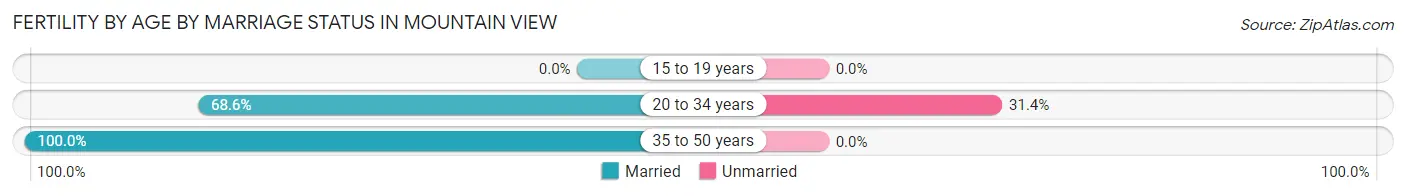
| Age Bracket | Married | Unmarried |
| 15 to 19 years | 0 (0.0%) | 0 (0.0%) |
| 20 to 34 years | 24 (68.6%) | 11 (31.4%) |
| 35 to 50 years | 5 (100.0%) | 0 (0.0%) |
| Total | 29 (72.5%) | 11 (27.5%) |
Fertility by Education in Mountain View
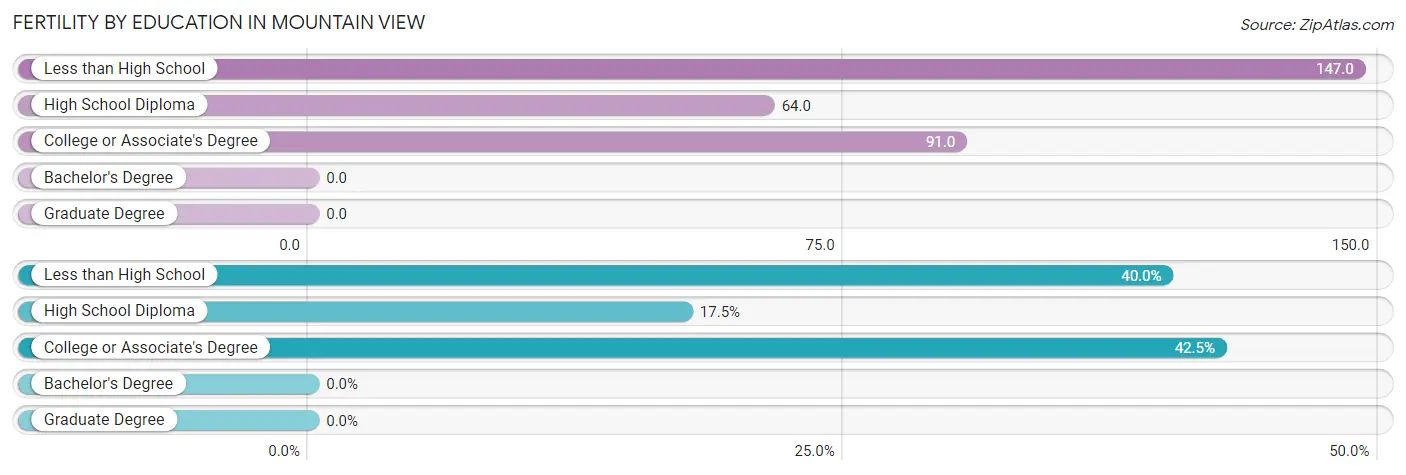
| Educational Attainment | Women with Births | Births / 1,000 Women |
| Less than High School | 16 (40.0%) | 147.0 |
| High School Diploma | 7 (17.5%) | 64.0 |
| College or Associate's Degree | 17 (42.5%) | 91.0 |
| Bachelor's Degree | 0 (0.0%) | 0.0 |
| Graduate Degree | 0 (0.0%) | 0.0 |
| Total | 40 (100.0%) | 85.0 |
Fertility by Education by Marriage Status in Mountain View
27.5% of women with births in Mountain View are unmarried. Women with the educational attainment of high school diploma are most likely to be married with 100.0% of them married at childbirth, while women with the educational attainment of less than high school are least likely to be married with 68.8% of them unmarried at childbirth.
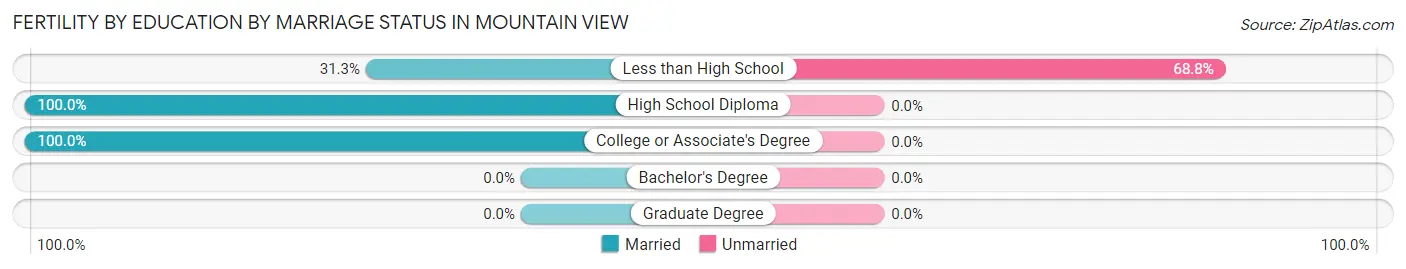
| Educational Attainment | Married | Unmarried |
| Less than High School | 5 (31.2%) | 11 (68.8%) |
| High School Diploma | 7 (100.0%) | 0 (0.0%) |
| College or Associate's Degree | 17 (100.0%) | 0 (0.0%) |
| Bachelor's Degree | 0 (0.0%) | 0 (0.0%) |
| Graduate Degree | 0 (0.0%) | 0 (0.0%) |
| Total | 29 (72.5%) | 11 (27.5%) |
Employment Characteristics in Mountain View
Employment by Class of Employer in Mountain View
Among the 914 employed individuals in Mountain View, private company employees (523 | 57.2%), state government employees (147 | 16.1%), and local government employees (119 | 13.0%) make up the most common classes of employment.
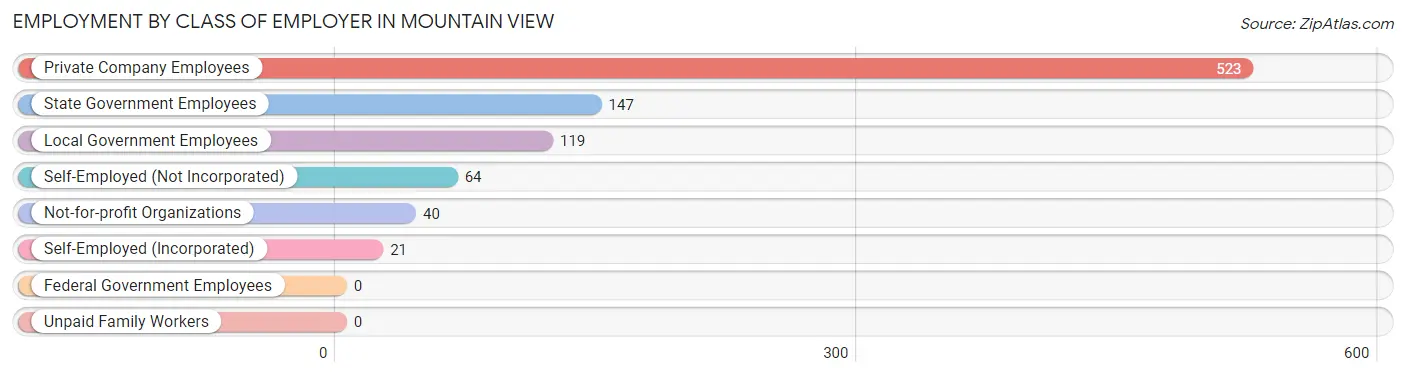
| Employer Class | # Employees | % Employees |
| Private Company Employees | 523 | 57.2% |
| Self-Employed (Incorporated) | 21 | 2.3% |
| Self-Employed (Not Incorporated) | 64 | 7.0% |
| Not-for-profit Organizations | 40 | 4.4% |
| Local Government Employees | 119 | 13.0% |
| State Government Employees | 147 | 16.1% |
| Federal Government Employees | 0 | 0.0% |
| Unpaid Family Workers | 0 | 0.0% |
| Total | 914 | 100.0% |
Employment Status by Age in Mountain View
According to the labor force statistics for Mountain View, out of the total population over 16 years of age (2,062), 46.2% or 953 individuals are in the labor force, with 2.6% or 25 of them unemployed. The age group with the highest labor force participation rate is 30 to 34 years, with 100.0% or 102 individuals in the labor force. Within the labor force, the 20 to 24 years age range has the highest percentage of unemployed individuals, with 17.2% or 16 of them being unemployed.
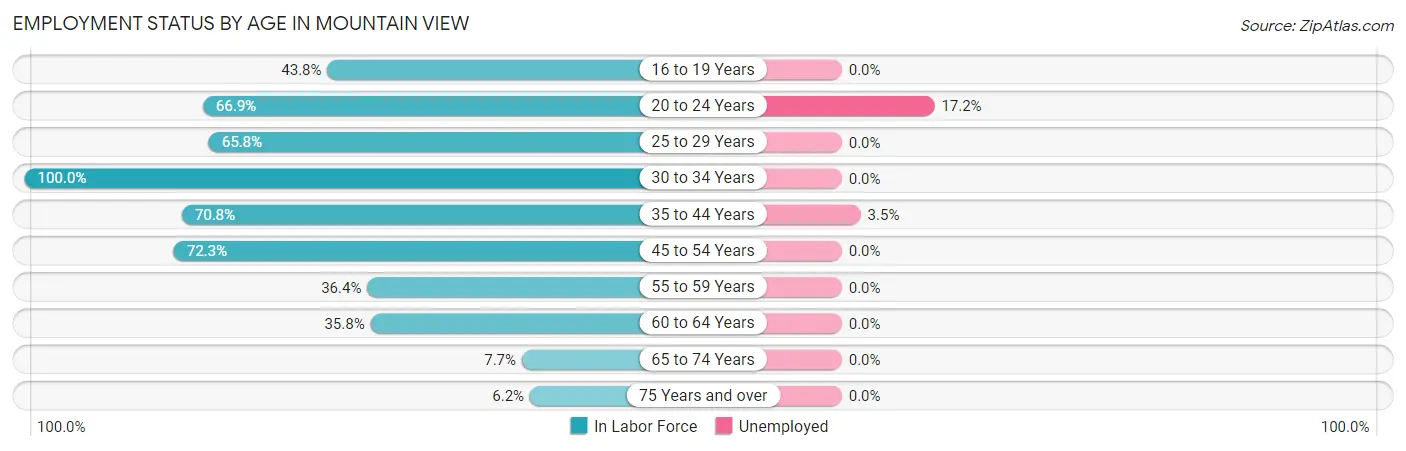
| Age Bracket | In Labor Force | Unemployed |
| 16 to 19 Years | 32 (43.8%) | 0 (0.0%) |
| 20 to 24 Years | 93 (66.9%) | 16 (17.2%) |
| 25 to 29 Years | 73 (65.8%) | 0 (0.0%) |
| 30 to 34 Years | 102 (100.0%) | 0 (0.0%) |
| 35 to 44 Years | 257 (70.8%) | 9 (3.5%) |
| 45 to 54 Years | 253 (72.3%) | 0 (0.0%) |
| 55 to 59 Years | 63 (36.4%) | 0 (0.0%) |
| 60 to 64 Years | 34 (35.8%) | 0 (0.0%) |
| 65 to 74 Years | 23 (7.7%) | 0 (0.0%) |
| 75 Years and over | 22 (6.2%) | 0 (0.0%) |
| Total | 953 (46.2%) | 25 (2.6%) |
Employment Status by Educational Attainment in Mountain View
According to labor force statistics for Mountain View, 65.5% of individuals (782) out of the total population between 25 and 64 years of age (1,194) are in the labor force, with 1.2% or 9 of them being unemployed. The group with the highest labor force participation rate are those with the educational attainment of bachelor's degree or higher, with 86.8% or 112 individuals in the labor force. Within the labor force, individuals with college / associate degree education have the highest percentage of unemployment, with 4.2% or 9 of them being unemployed.
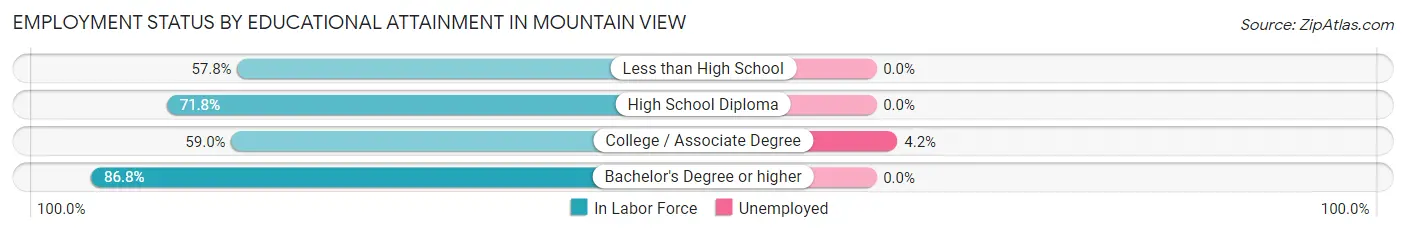
| Educational Attainment | In Labor Force | Unemployed |
| Less than High School | 199 (57.8%) | 0 (0.0%) |
| High School Diploma | 257 (71.8%) | 0 (0.0%) |
| College / Associate Degree | 214 (59.0%) | 15 (4.2%) |
| Bachelor's Degree or higher | 112 (86.8%) | 0 (0.0%) |
| Total | 782 (65.5%) | 14 (1.2%) |
Employment Occupations by Sex in Mountain View
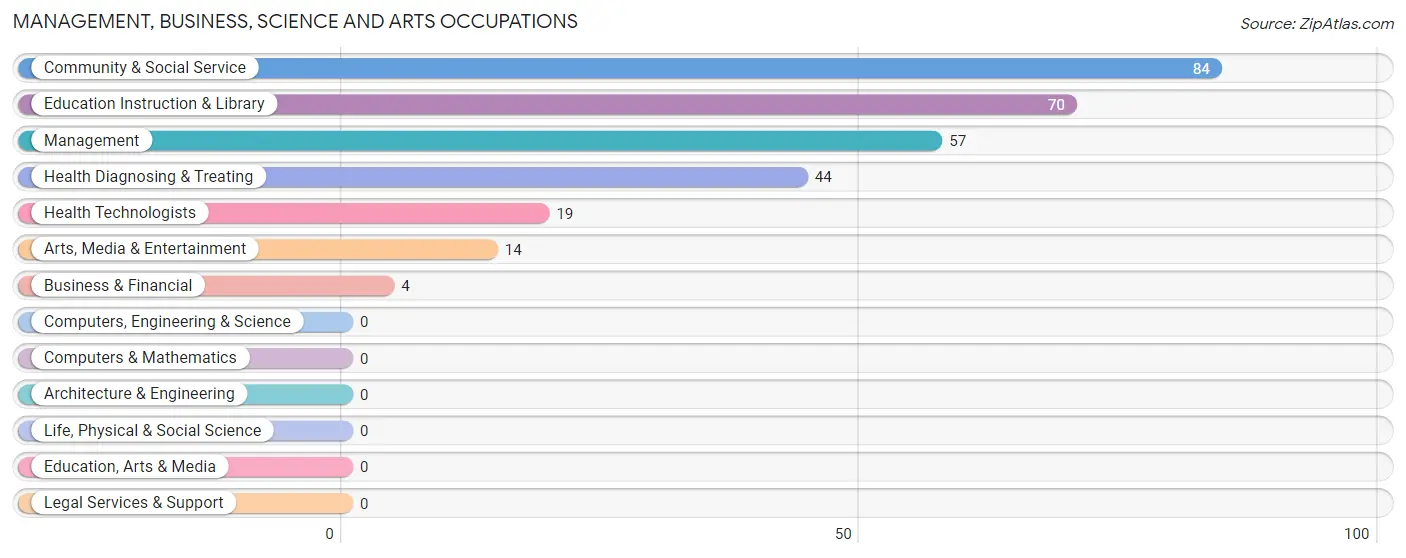
Management, Business, Science and Arts Occupations
The most common Management, Business, Science and Arts occupations in Mountain View are Community & Social Service (84 | 9.1%), Education Instruction & Library (70 | 7.5%), Management (57 | 6.1%), Health Diagnosing & Treating (44 | 4.8%), and Health Technologists (19 | 2.1%).
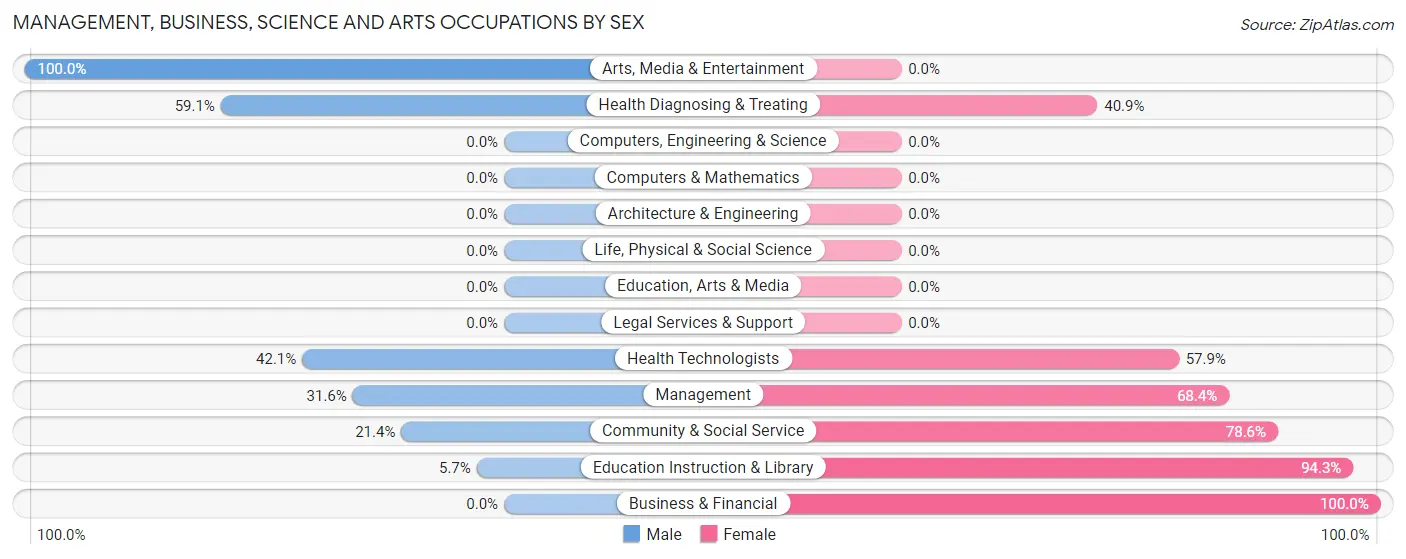
Management, Business, Science and Arts Occupations by Sex
Within the Management, Business, Science and Arts occupations in Mountain View, the most male-oriented occupations are Arts, Media & Entertainment (100.0%), Health Diagnosing & Treating (59.1%), and Health Technologists (42.1%), while the most female-oriented occupations are Business & Financial (100.0%), Education Instruction & Library (94.3%), and Community & Social Service (78.6%).
| Occupation | Male | Female |
| Management | 18 (31.6%) | 39 (68.4%) |
| Business & Financial | 0 (0.0%) | 4 (100.0%) |
| Computers, Engineering & Science | 0 (0.0%) | 0 (0.0%) |
| Computers & Mathematics | 0 (0.0%) | 0 (0.0%) |
| Architecture & Engineering | 0 (0.0%) | 0 (0.0%) |
| Life, Physical & Social Science | 0 (0.0%) | 0 (0.0%) |
| Community & Social Service | 18 (21.4%) | 66 (78.6%) |
| Education, Arts & Media | 0 (0.0%) | 0 (0.0%) |
| Legal Services & Support | 0 (0.0%) | 0 (0.0%) |
| Education Instruction & Library | 4 (5.7%) | 66 (94.3%) |
| Arts, Media & Entertainment | 14 (100.0%) | 0 (0.0%) |
| Health Diagnosing & Treating | 26 (59.1%) | 18 (40.9%) |
| Health Technologists | 8 (42.1%) | 11 (57.9%) |
| Total (Category) | 62 (32.8%) | 127 (67.2%) |
| Total (Overall) | 412 (44.4%) | 515 (55.6%) |
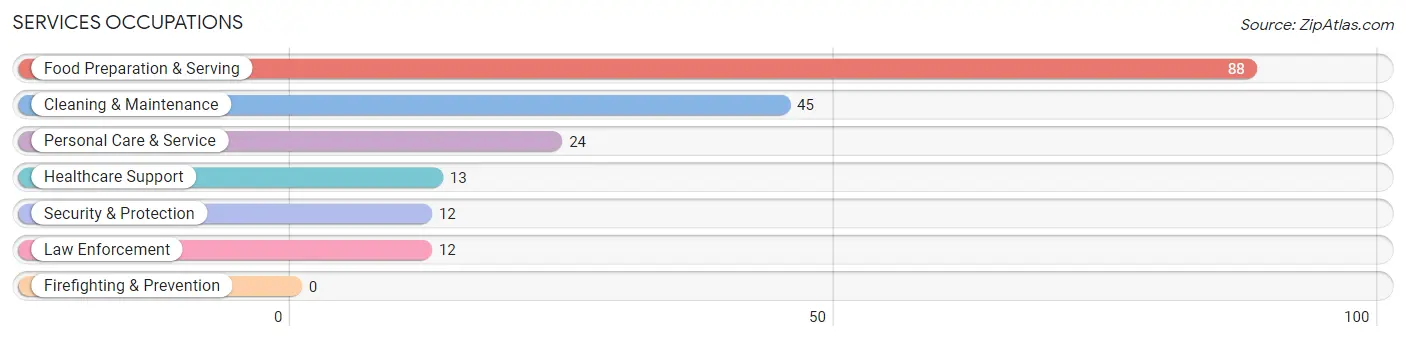
Services Occupations
The most common Services occupations in Mountain View are Food Preparation & Serving (88 | 9.5%), Cleaning & Maintenance (45 | 4.9%), Personal Care & Service (24 | 2.6%), Healthcare Support (13 | 1.4%), and Security & Protection (12 | 1.3%).
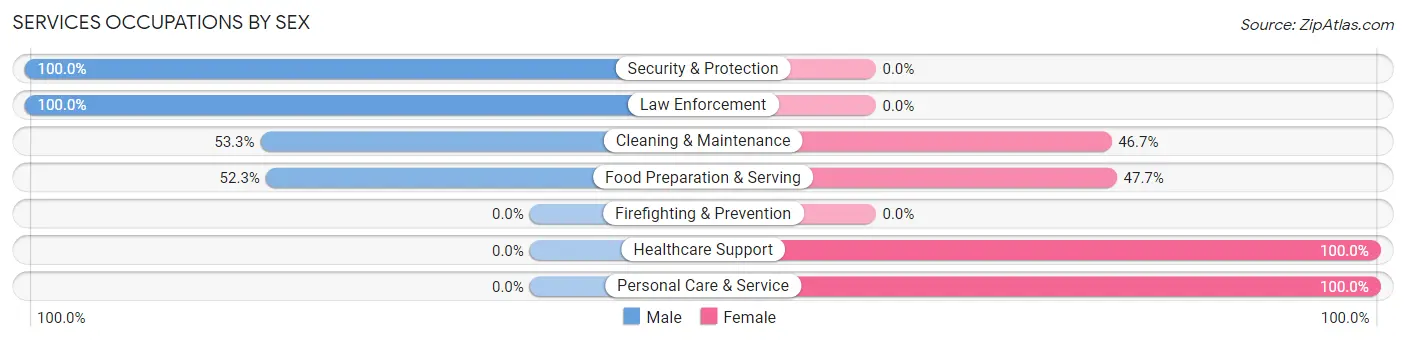
Services Occupations by Sex
Within the Services occupations in Mountain View, the most male-oriented occupations are Security & Protection (100.0%), Law Enforcement (100.0%), and Cleaning & Maintenance (53.3%), while the most female-oriented occupations are Healthcare Support (100.0%), Personal Care & Service (100.0%), and Food Preparation & Serving (47.7%).
| Occupation | Male | Female |
| Healthcare Support | 0 (0.0%) | 13 (100.0%) |
| Security & Protection | 12 (100.0%) | 0 (0.0%) |
| Firefighting & Prevention | 0 (0.0%) | 0 (0.0%) |
| Law Enforcement | 12 (100.0%) | 0 (0.0%) |
| Food Preparation & Serving | 46 (52.3%) | 42 (47.7%) |
| Cleaning & Maintenance | 24 (53.3%) | 21 (46.7%) |
| Personal Care & Service | 0 (0.0%) | 24 (100.0%) |
| Total (Category) | 82 (45.1%) | 100 (54.9%) |
| Total (Overall) | 412 (44.4%) | 515 (55.6%) |
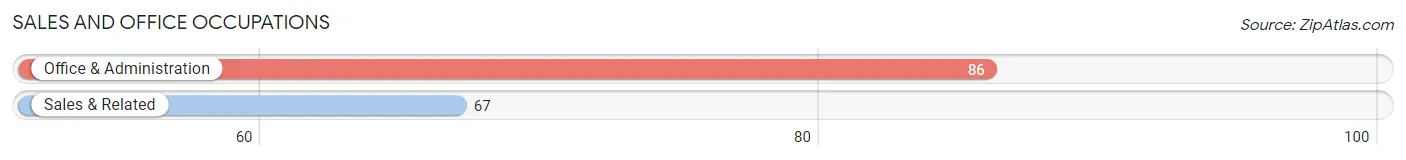
Sales and Office Occupations
The most common Sales and Office occupations in Mountain View are Office & Administration (86 | 9.3%), and Sales & Related (67 | 7.2%).
Sales and Office Occupations by Sex
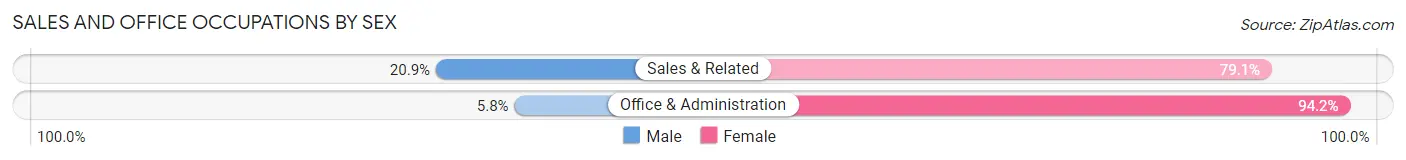
| Occupation | Male | Female |
| Sales & Related | 14 (20.9%) | 53 (79.1%) |
| Office & Administration | 5 (5.8%) | 81 (94.2%) |
| Total (Category) | 19 (12.4%) | 134 (87.6%) |
| Total (Overall) | 412 (44.4%) | 515 (55.6%) |
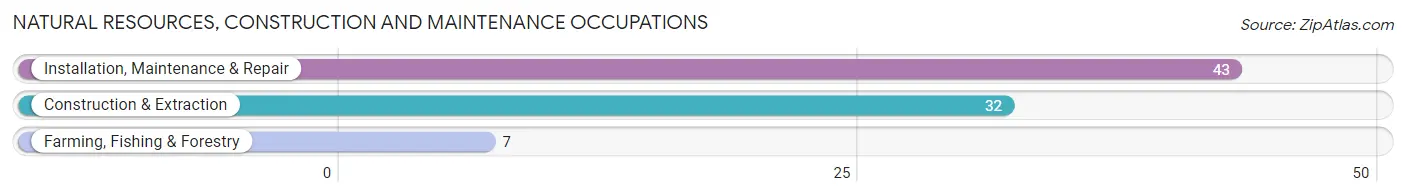
Natural Resources, Construction and Maintenance Occupations
The most common Natural Resources, Construction and Maintenance occupations in Mountain View are Installation, Maintenance & Repair (43 | 4.6%), Construction & Extraction (32 | 3.5%), and Farming, Fishing & Forestry (7 | 0.8%).
Natural Resources, Construction and Maintenance Occupations by Sex
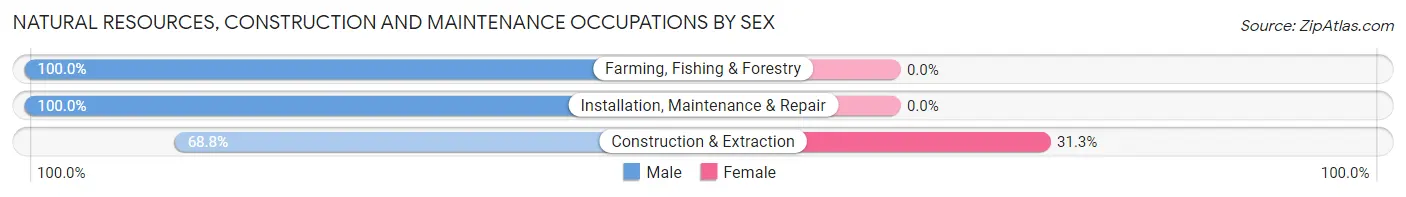
| Occupation | Male | Female |
| Farming, Fishing & Forestry | 7 (100.0%) | 0 (0.0%) |
| Construction & Extraction | 22 (68.8%) | 10 (31.2%) |
| Installation, Maintenance & Repair | 43 (100.0%) | 0 (0.0%) |
| Total (Category) | 72 (87.8%) | 10 (12.2%) |
| Total (Overall) | 412 (44.4%) | 515 (55.6%) |
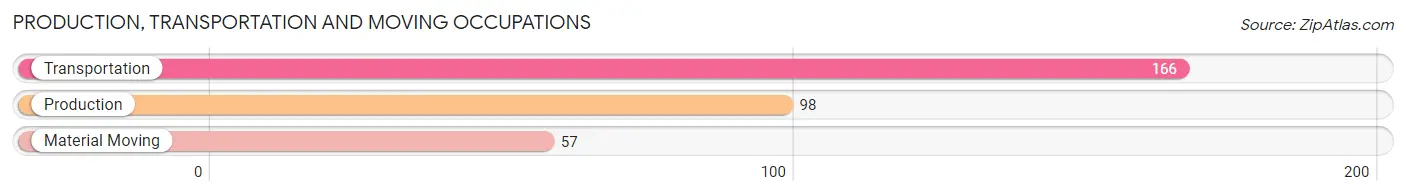
Production, Transportation and Moving Occupations
The most common Production, Transportation and Moving occupations in Mountain View are Transportation (166 | 17.9%), Production (98 | 10.6%), and Material Moving (57 | 6.1%).
Production, Transportation and Moving Occupations by Sex
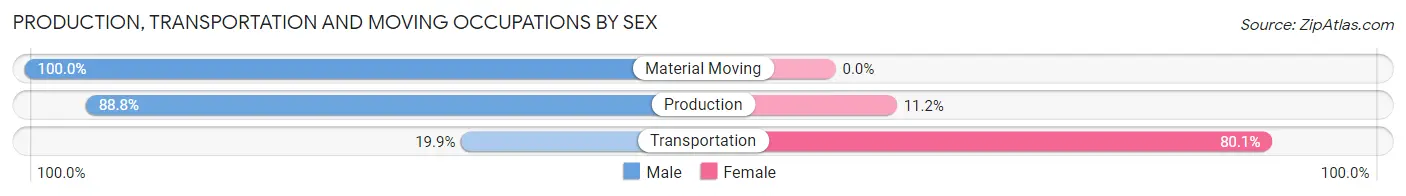
| Occupation | Male | Female |
| Production | 87 (88.8%) | 11 (11.2%) |
| Transportation | 33 (19.9%) | 133 (80.1%) |
| Material Moving | 57 (100.0%) | 0 (0.0%) |
| Total (Category) | 177 (55.1%) | 144 (44.9%) |
| Total (Overall) | 412 (44.4%) | 515 (55.6%) |
Employment Industries by Sex in Mountain View
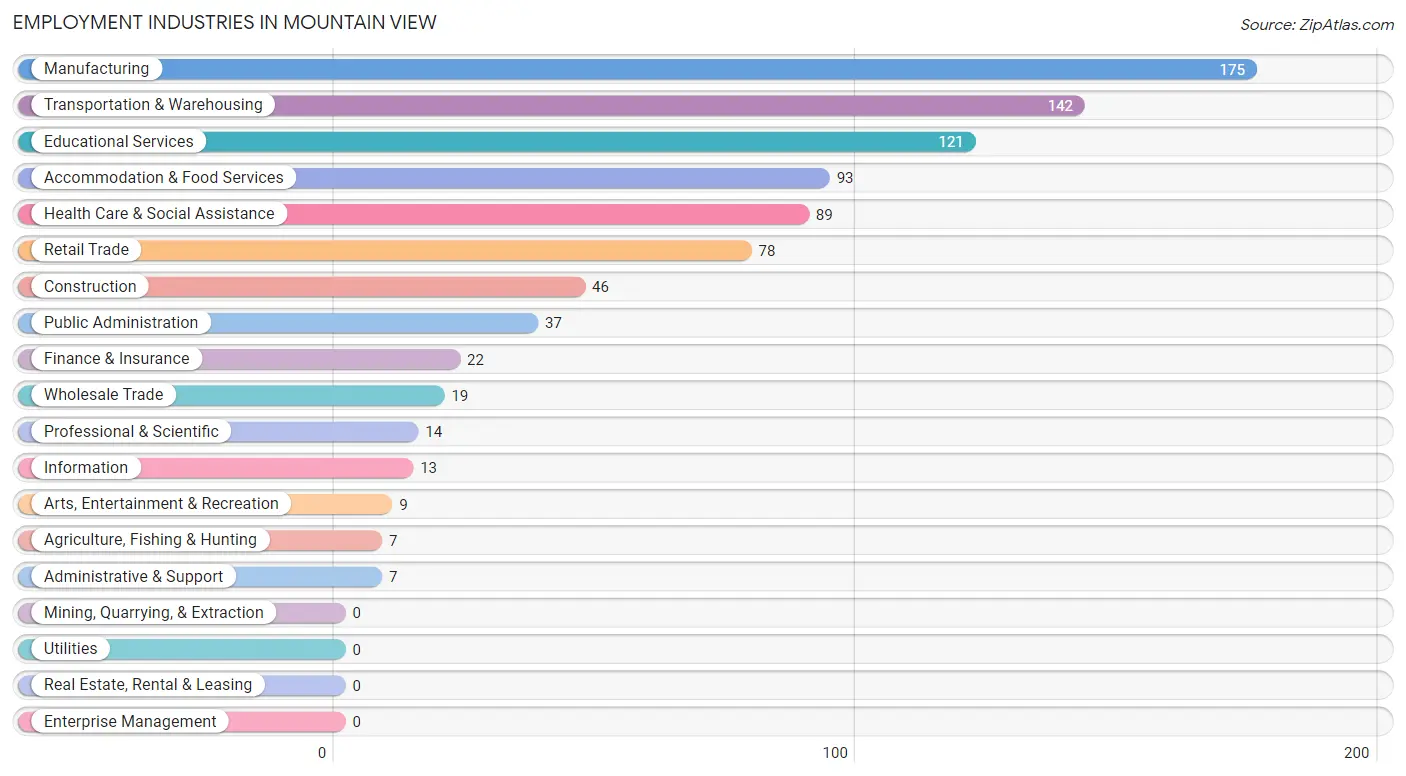
Employment Industries in Mountain View
The major employment industries in Mountain View include Manufacturing (175 | 18.9%), Transportation & Warehousing (142 | 15.3%), Educational Services (121 | 13.1%), Accommodation & Food Services (93 | 10.0%), and Health Care & Social Assistance (89 | 9.6%).
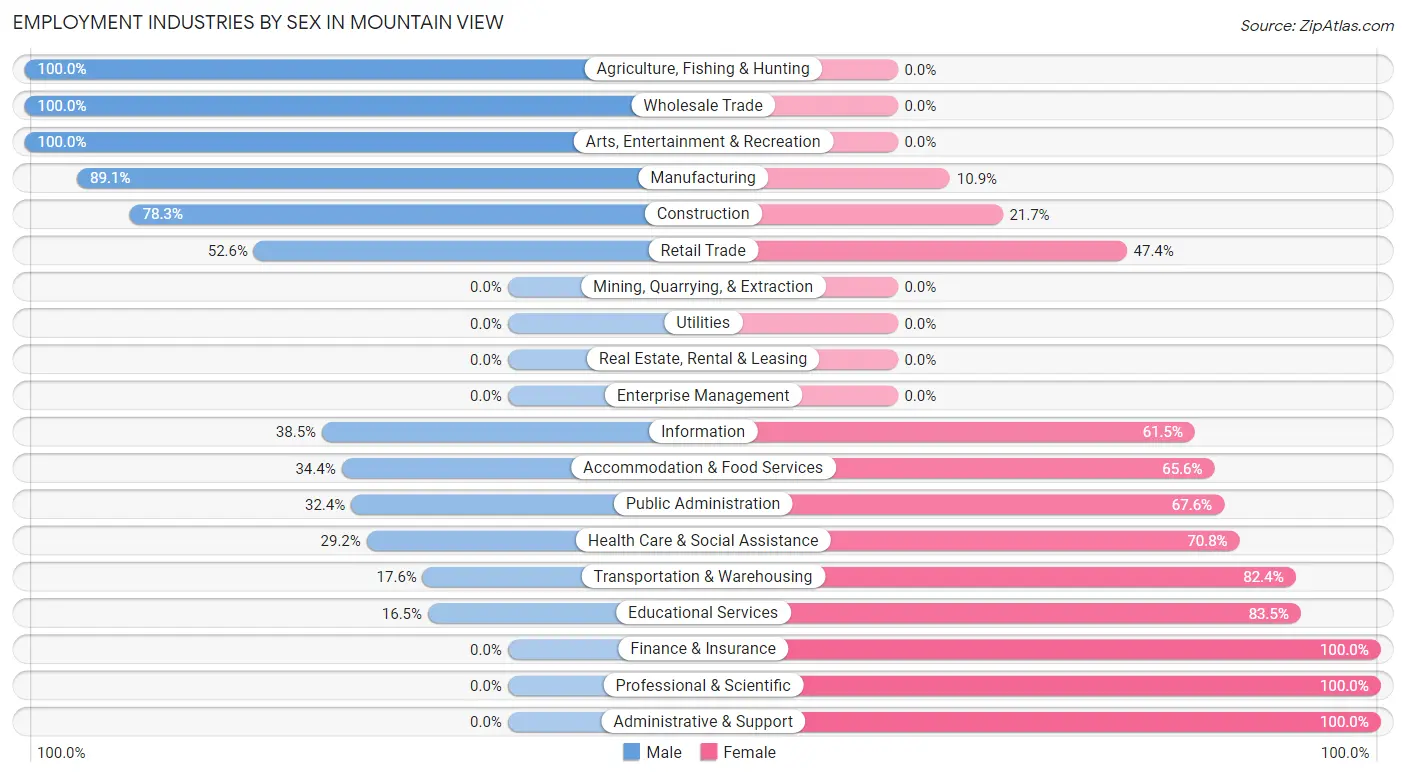
Employment Industries by Sex in Mountain View
The Mountain View industries that see more men than women are Agriculture, Fishing & Hunting (100.0%), Wholesale Trade (100.0%), and Arts, Entertainment & Recreation (100.0%), whereas the industries that tend to have a higher number of women are Finance & Insurance (100.0%), Professional & Scientific (100.0%), and Administrative & Support (100.0%).
| Industry | Male | Female |
| Agriculture, Fishing & Hunting | 7 (100.0%) | 0 (0.0%) |
| Mining, Quarrying, & Extraction | 0 (0.0%) | 0 (0.0%) |
| Construction | 36 (78.3%) | 10 (21.7%) |
| Manufacturing | 156 (89.1%) | 19 (10.9%) |
| Wholesale Trade | 19 (100.0%) | 0 (0.0%) |
| Retail Trade | 41 (52.6%) | 37 (47.4%) |
| Transportation & Warehousing | 25 (17.6%) | 117 (82.4%) |
| Utilities | 0 (0.0%) | 0 (0.0%) |
| Information | 5 (38.5%) | 8 (61.5%) |
| Finance & Insurance | 0 (0.0%) | 22 (100.0%) |
| Real Estate, Rental & Leasing | 0 (0.0%) | 0 (0.0%) |
| Professional & Scientific | 0 (0.0%) | 14 (100.0%) |
| Enterprise Management | 0 (0.0%) | 0 (0.0%) |
| Administrative & Support | 0 (0.0%) | 7 (100.0%) |
| Educational Services | 20 (16.5%) | 101 (83.5%) |
| Health Care & Social Assistance | 26 (29.2%) | 63 (70.8%) |
| Arts, Entertainment & Recreation | 9 (100.0%) | 0 (0.0%) |
| Accommodation & Food Services | 32 (34.4%) | 61 (65.6%) |
| Public Administration | 12 (32.4%) | 25 (67.6%) |
| Total | 412 (44.4%) | 515 (55.6%) |
Education in Mountain View
School Enrollment in Mountain View
The most common levels of schooling among the 520 students in Mountain View are middle school (152 | 29.2%), high school (143 | 27.5%), and elementary school (89 | 17.1%).
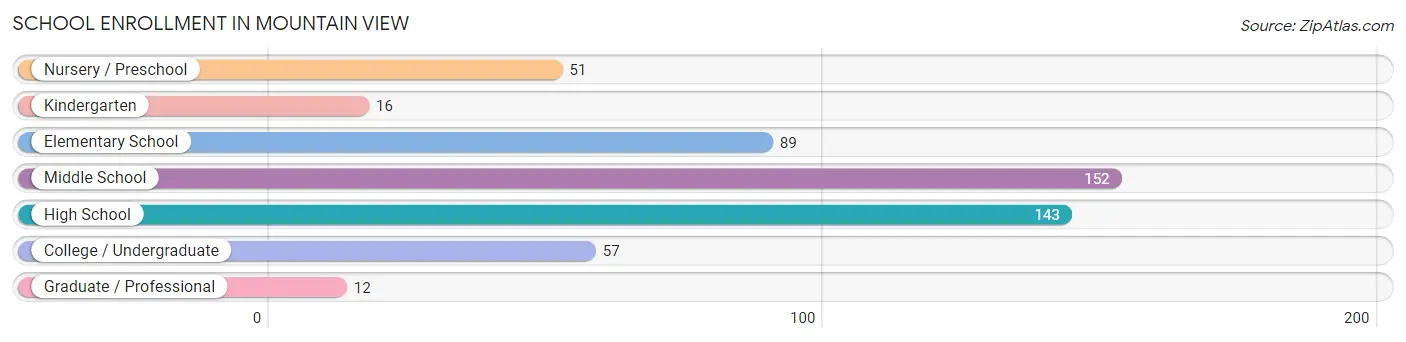
| School Level | # Students | % Students |
| Nursery / Preschool | 51 | 9.8% |
| Kindergarten | 16 | 3.1% |
| Elementary School | 89 | 17.1% |
| Middle School | 152 | 29.2% |
| High School | 143 | 27.5% |
| College / Undergraduate | 57 | 11.0% |
| Graduate / Professional | 12 | 2.3% |
| Total | 520 | 100.0% |
School Enrollment by Age by Funding Source in Mountain View
Out of a total of 520 students who are enrolled in schools in Mountain View, 33 (6.3%) attend a private institution, while the remaining 487 (93.7%) are enrolled in public schools. The age group of 25 to 34 year olds has the highest likelihood of being enrolled in private schools, with 11 (100.0% in the age bracket) enrolled. Conversely, the age group of 3 to 4 year olds has the lowest likelihood of being enrolled in a private school, with 44 (100.0% in the age bracket) attending a public institution.
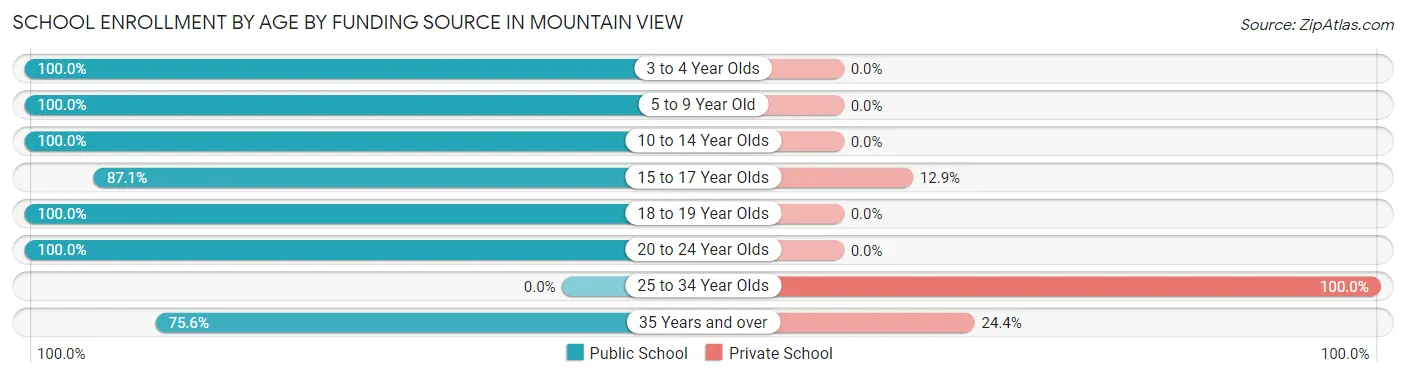
| Age Bracket | Public School | Private School |
| 3 to 4 Year Olds | 44 (100.0%) | 0 (0.0%) |
| 5 to 9 Year Old | 97 (100.0%) | 0 (0.0%) |
| 10 to 14 Year Olds | 211 (100.0%) | 0 (0.0%) |
| 15 to 17 Year Olds | 81 (87.1%) | 12 (12.9%) |
| 18 to 19 Year Olds | 3 (100.0%) | 0 (0.0%) |
| 20 to 24 Year Olds | 20 (100.0%) | 0 (0.0%) |
| 25 to 34 Year Olds | 0 (0.0%) | 11 (100.0%) |
| 35 Years and over | 31 (75.6%) | 10 (24.4%) |
| Total | 487 (93.7%) | 33 (6.3%) |
Educational Attainment by Field of Study in Mountain View
Education (84 | 42.9%), business (25 | 12.8%), bio, nature & agricultural (21 | 10.7%), psychology (18 | 9.2%), and liberal arts & history (18 | 9.2%) are the most common fields of study among 196 individuals in Mountain View who have obtained a bachelor's degree or higher.
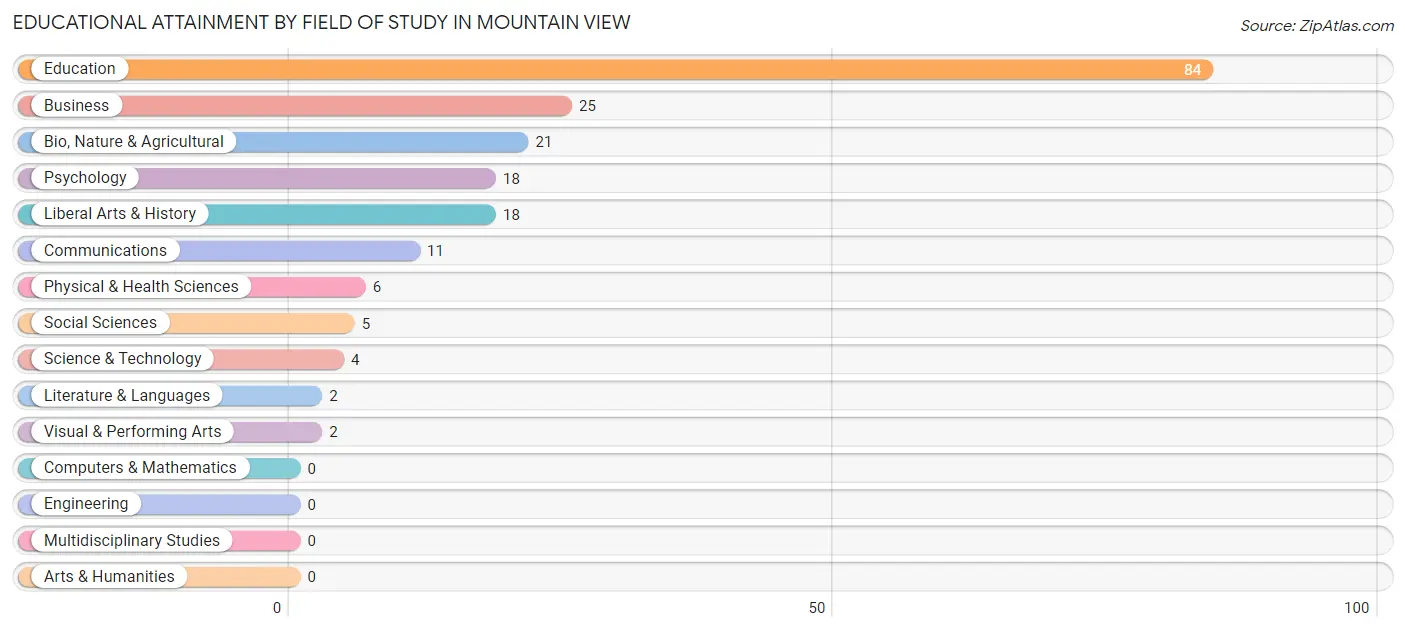
| Field of Study | # Graduates | % Graduates |
| Computers & Mathematics | 0 | 0.0% |
| Bio, Nature & Agricultural | 21 | 10.7% |
| Physical & Health Sciences | 6 | 3.1% |
| Psychology | 18 | 9.2% |
| Social Sciences | 5 | 2.5% |
| Engineering | 0 | 0.0% |
| Multidisciplinary Studies | 0 | 0.0% |
| Science & Technology | 4 | 2.0% |
| Business | 25 | 12.8% |
| Education | 84 | 42.9% |
| Literature & Languages | 2 | 1.0% |
| Liberal Arts & History | 18 | 9.2% |
| Visual & Performing Arts | 2 | 1.0% |
| Communications | 11 | 5.6% |
| Arts & Humanities | 0 | 0.0% |
| Total | 196 | 100.0% |
Transportation & Commute in Mountain View
Vehicle Availability by Sex in Mountain View
The most prevalent vehicle ownership categories in Mountain View are males with 1 vehicle (135, accounting for 33.8%) and females with 1 vehicle (47, making up 26.2%).
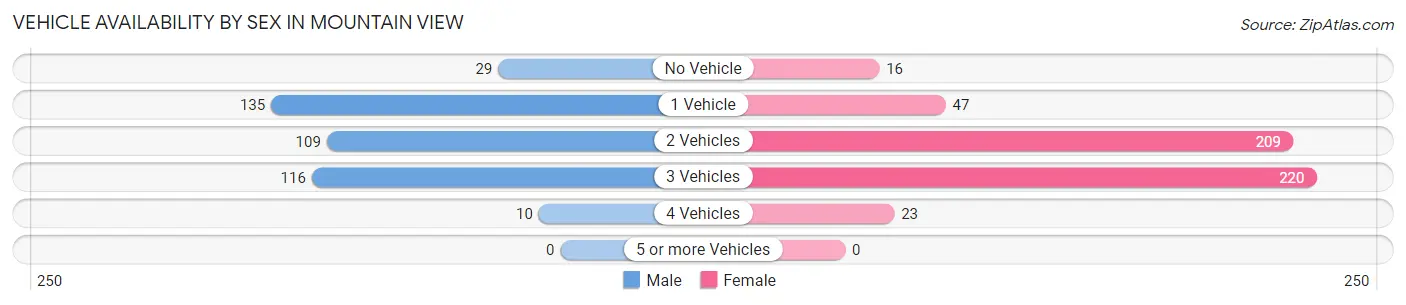
| Vehicles Available | Male | Female |
| No Vehicle | 29 (7.3%) | 16 (3.1%) |
| 1 Vehicle | 135 (33.8%) | 47 (9.1%) |
| 2 Vehicles | 109 (27.3%) | 209 (40.6%) |
| 3 Vehicles | 116 (29.1%) | 220 (42.7%) |
| 4 Vehicles | 10 (2.5%) | 23 (4.5%) |
| 5 or more Vehicles | 0 (0.0%) | 0 (0.0%) |
| Total | 399 (100.0%) | 515 (100.0%) |
Commute Time in Mountain View
The most frequently occuring commute durations in Mountain View are 10 to 14 minutes (286 commuters, 31.6%), 5 to 9 minutes (192 commuters, 21.2%), and 20 to 24 minutes (88 commuters, 9.7%).
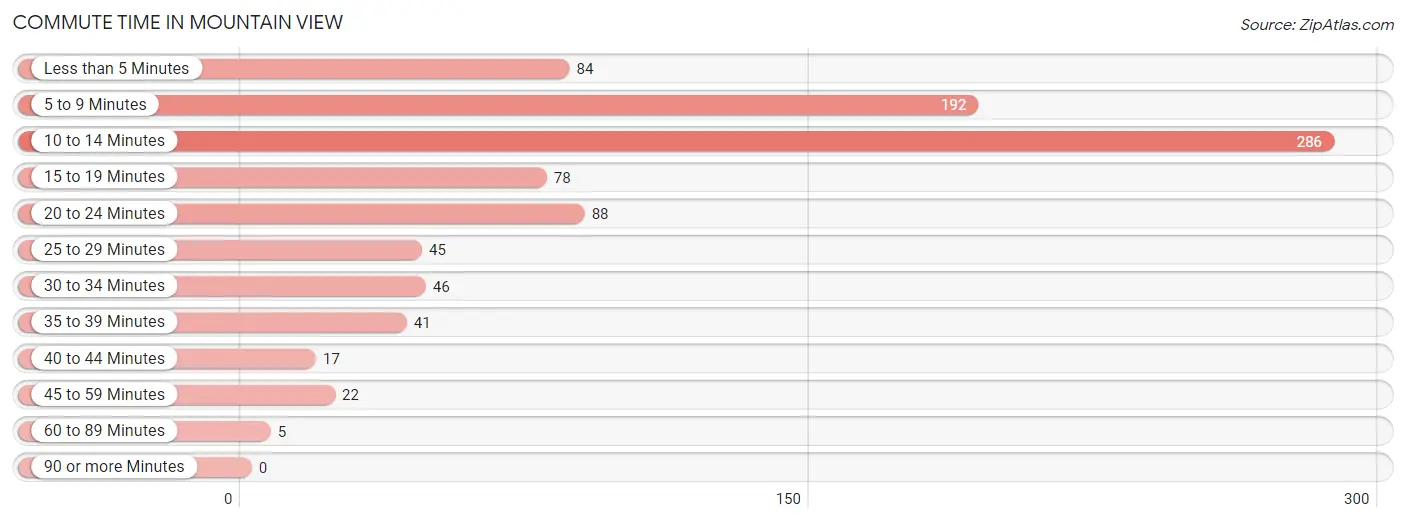
| Commute Time | # Commuters | % Commuters |
| Less than 5 Minutes | 84 | 9.3% |
| 5 to 9 Minutes | 192 | 21.2% |
| 10 to 14 Minutes | 286 | 31.6% |
| 15 to 19 Minutes | 78 | 8.6% |
| 20 to 24 Minutes | 88 | 9.7% |
| 25 to 29 Minutes | 45 | 5.0% |
| 30 to 34 Minutes | 46 | 5.1% |
| 35 to 39 Minutes | 41 | 4.5% |
| 40 to 44 Minutes | 17 | 1.9% |
| 45 to 59 Minutes | 22 | 2.4% |
| 60 to 89 Minutes | 5 | 0.5% |
| 90 or more Minutes | 0 | 0.0% |
Commute Time by Sex in Mountain View
The most common commute times in Mountain View are 5 to 9 minutes (89 commuters, 22.3%) for males and 10 to 14 minutes (205 commuters, 40.6%) for females.
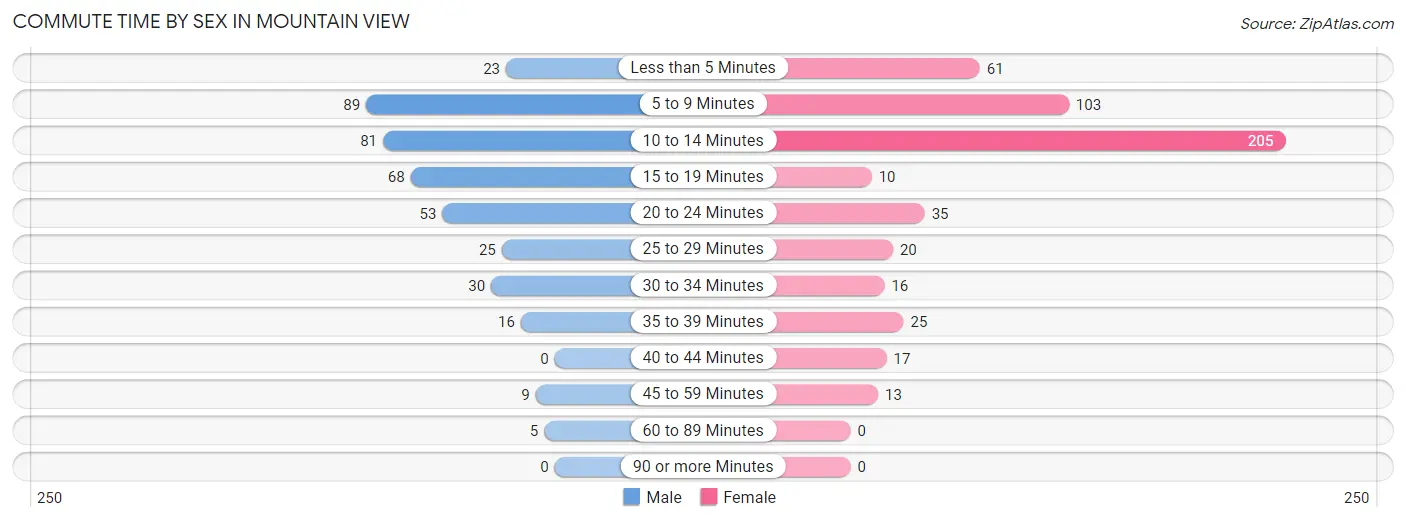
| Commute Time | Male | Female |
| Less than 5 Minutes | 23 (5.8%) | 61 (12.1%) |
| 5 to 9 Minutes | 89 (22.3%) | 103 (20.4%) |
| 10 to 14 Minutes | 81 (20.3%) | 205 (40.6%) |
| 15 to 19 Minutes | 68 (17.0%) | 10 (2.0%) |
| 20 to 24 Minutes | 53 (13.3%) | 35 (6.9%) |
| 25 to 29 Minutes | 25 (6.3%) | 20 (4.0%) |
| 30 to 34 Minutes | 30 (7.5%) | 16 (3.2%) |
| 35 to 39 Minutes | 16 (4.0%) | 25 (5.0%) |
| 40 to 44 Minutes | 0 (0.0%) | 17 (3.4%) |
| 45 to 59 Minutes | 9 (2.3%) | 13 (2.6%) |
| 60 to 89 Minutes | 5 (1.3%) | 0 (0.0%) |
| 90 or more Minutes | 0 (0.0%) | 0 (0.0%) |
Time of Departure to Work by Sex in Mountain View
The most frequent times of departure to work in Mountain View are 12:00 PM to 3:59 PM (70, 17.5%) for males and 6:30 AM to 6:59 AM (139, 27.5%) for females.
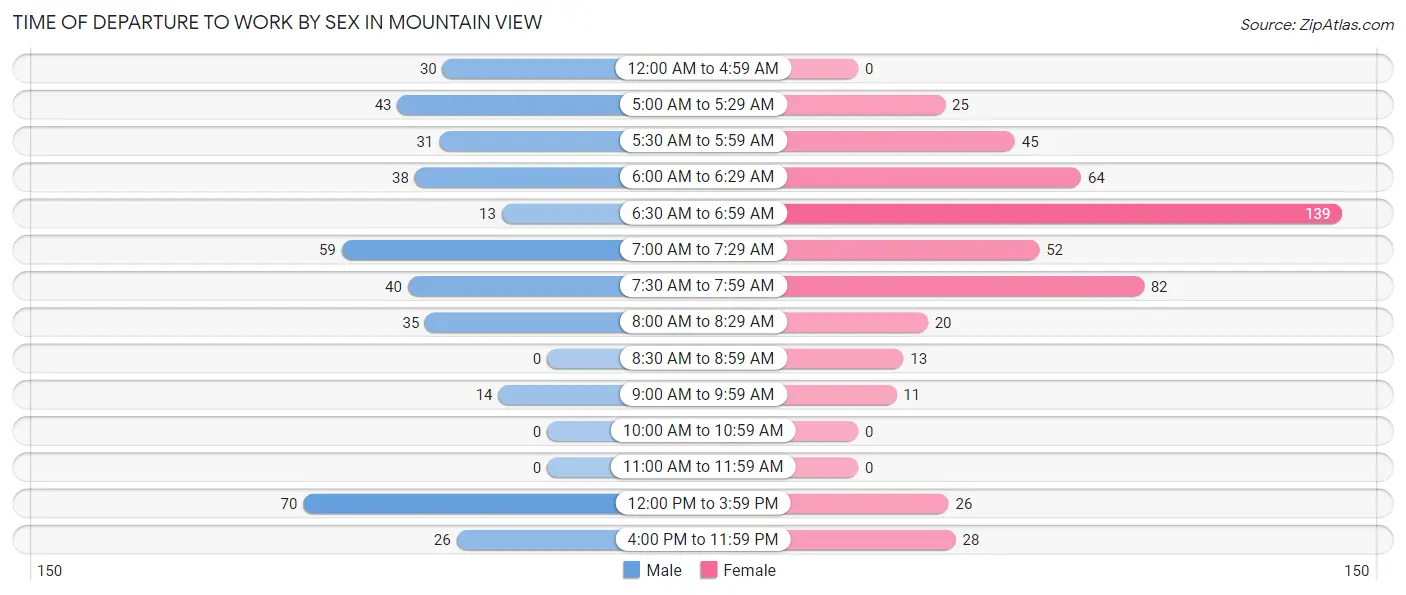
| Time of Departure | Male | Female |
| 12:00 AM to 4:59 AM | 30 (7.5%) | 0 (0.0%) |
| 5:00 AM to 5:29 AM | 43 (10.8%) | 25 (5.0%) |
| 5:30 AM to 5:59 AM | 31 (7.8%) | 45 (8.9%) |
| 6:00 AM to 6:29 AM | 38 (9.5%) | 64 (12.7%) |
| 6:30 AM to 6:59 AM | 13 (3.3%) | 139 (27.5%) |
| 7:00 AM to 7:29 AM | 59 (14.8%) | 52 (10.3%) |
| 7:30 AM to 7:59 AM | 40 (10.0%) | 82 (16.2%) |
| 8:00 AM to 8:29 AM | 35 (8.8%) | 20 (4.0%) |
| 8:30 AM to 8:59 AM | 0 (0.0%) | 13 (2.6%) |
| 9:00 AM to 9:59 AM | 14 (3.5%) | 11 (2.2%) |
| 10:00 AM to 10:59 AM | 0 (0.0%) | 0 (0.0%) |
| 11:00 AM to 11:59 AM | 0 (0.0%) | 0 (0.0%) |
| 12:00 PM to 3:59 PM | 70 (17.5%) | 26 (5.1%) |
| 4:00 PM to 11:59 PM | 26 (6.5%) | 28 (5.5%) |
| Total | 399 (100.0%) | 505 (100.0%) |
Housing Occupancy in Mountain View
Occupancy by Ownership in Mountain View
Of the total 972 dwellings in Mountain View, owner-occupied units account for 592 (60.9%), while renter-occupied units make up 380 (39.1%).
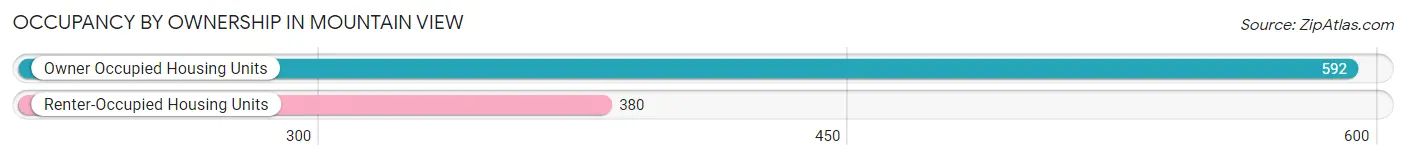
| Occupancy | # Housing Units | % Housing Units |
| Owner Occupied Housing Units | 592 | 60.9% |
| Renter-Occupied Housing Units | 380 | 39.1% |
| Total Occupied Housing Units | 972 | 100.0% |
Occupancy by Household Size in Mountain View
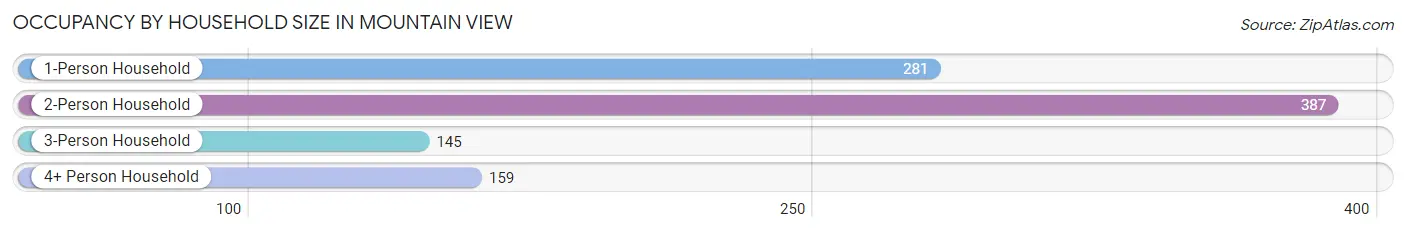
| Household Size | # Housing Units | % Housing Units |
| 1-Person Household | 281 | 28.9% |
| 2-Person Household | 387 | 39.8% |
| 3-Person Household | 145 | 14.9% |
| 4+ Person Household | 159 | 16.4% |
| Total Housing Units | 972 | 100.0% |
Occupancy by Ownership by Household Size in Mountain View
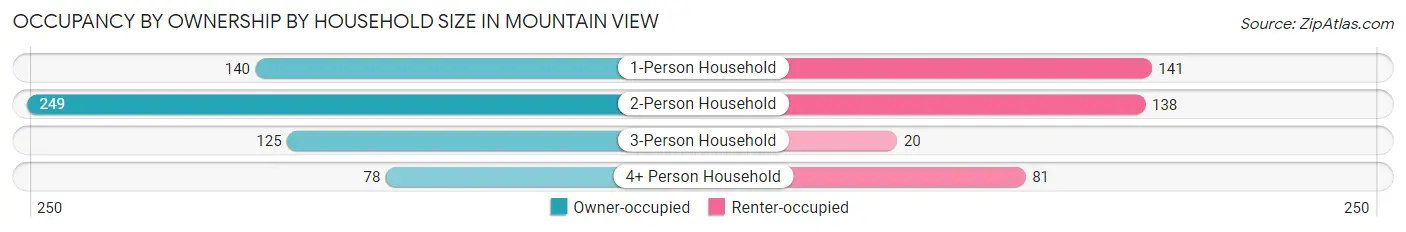
| Household Size | Owner-occupied | Renter-occupied |
| 1-Person Household | 140 (49.8%) | 141 (50.2%) |
| 2-Person Household | 249 (64.3%) | 138 (35.7%) |
| 3-Person Household | 125 (86.2%) | 20 (13.8%) |
| 4+ Person Household | 78 (49.1%) | 81 (50.9%) |
| Total Housing Units | 592 (60.9%) | 380 (39.1%) |
Occupancy by Educational Attainment in Mountain View
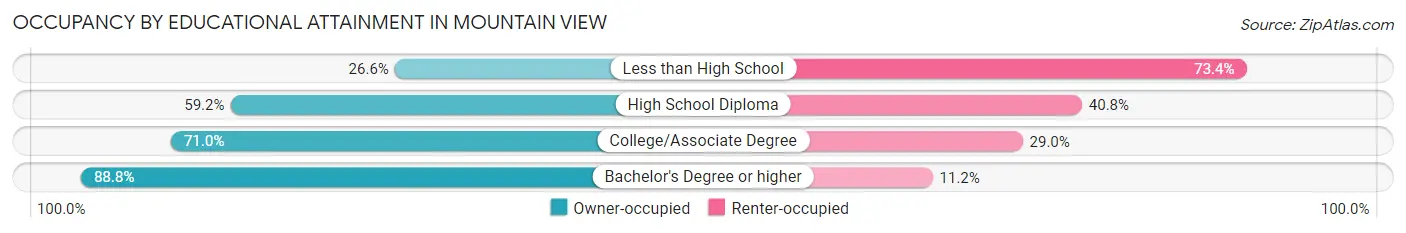
| Household Size | Owner-occupied | Renter-occupied |
| Less than High School | 45 (26.6%) | 124 (73.4%) |
| High School Diploma | 244 (59.2%) | 168 (40.8%) |
| College/Associate Degree | 176 (71.0%) | 72 (29.0%) |
| Bachelor's Degree or higher | 127 (88.8%) | 16 (11.2%) |
Occupancy by Age of Householder in Mountain View
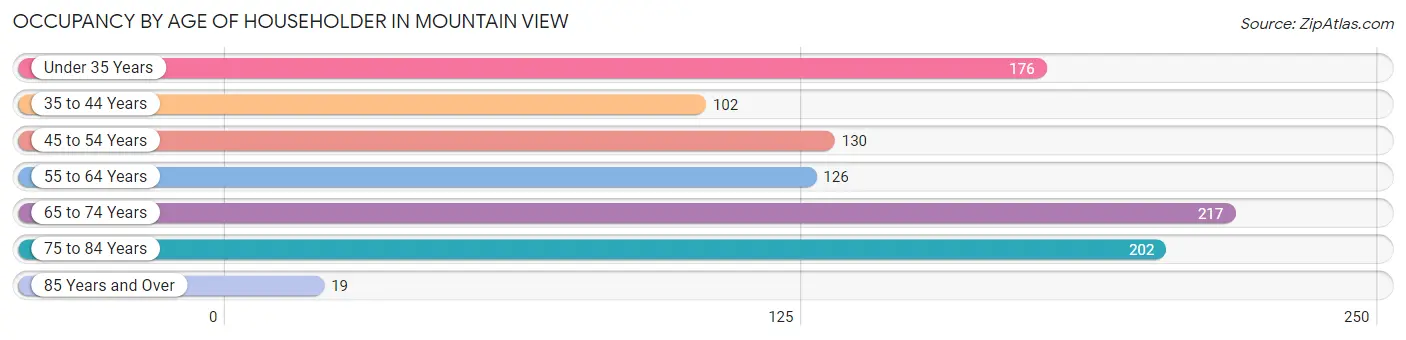
| Age Bracket | # Households | % Households |
| Under 35 Years | 176 | 18.1% |
| 35 to 44 Years | 102 | 10.5% |
| 45 to 54 Years | 130 | 13.4% |
| 55 to 64 Years | 126 | 13.0% |
| 65 to 74 Years | 217 | 22.3% |
| 75 to 84 Years | 202 | 20.8% |
| 85 Years and Over | 19 | 1.9% |
| Total | 972 | 100.0% |
Housing Finances in Mountain View
Median Income by Occupancy in Mountain View
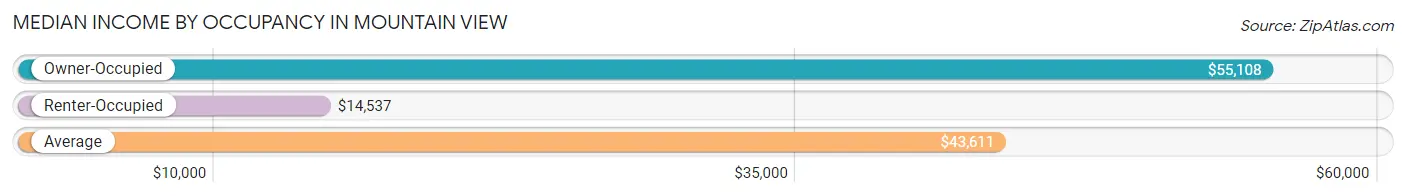
| Occupancy Type | # Households | Median Income |
| Owner-Occupied | 592 (60.9%) | $55,108 |
| Renter-Occupied | 380 (39.1%) | $14,537 |
| Average | 972 (100.0%) | $43,611 |
Occupancy by Householder Income Bracket in Mountain View
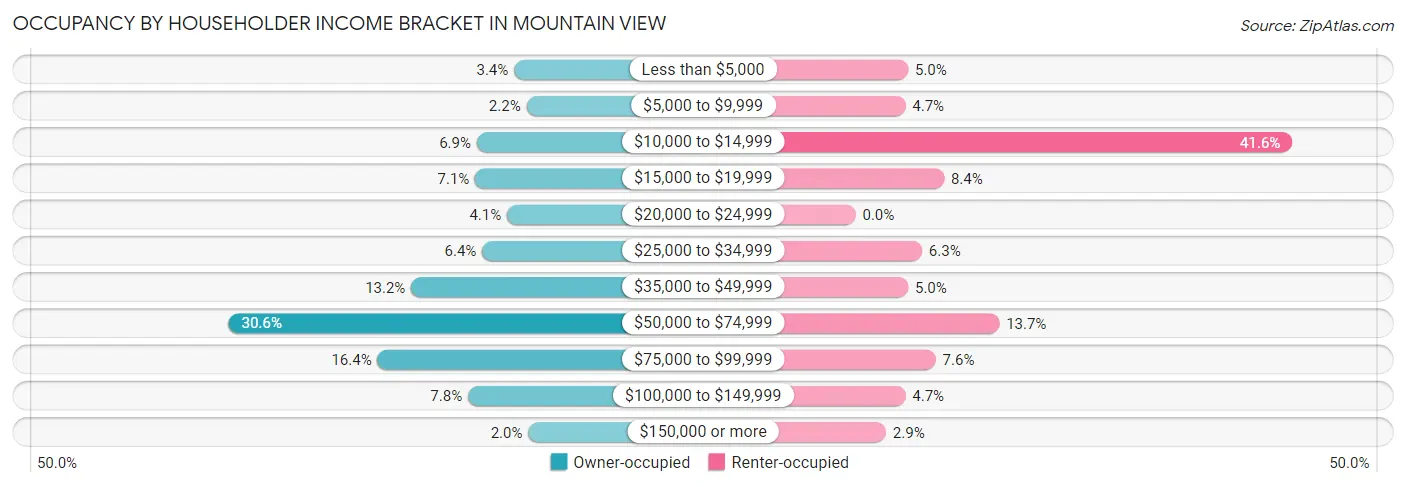
| Income Bracket | Owner-occupied | Renter-occupied |
| Less than $5,000 | 20 (3.4%) | 19 (5.0%) |
| $5,000 to $9,999 | 13 (2.2%) | 18 (4.7%) |
| $10,000 to $14,999 | 41 (6.9%) | 158 (41.6%) |
| $15,000 to $19,999 | 42 (7.1%) | 32 (8.4%) |
| $20,000 to $24,999 | 24 (4.1%) | 0 (0.0%) |
| $25,000 to $34,999 | 38 (6.4%) | 24 (6.3%) |
| $35,000 to $49,999 | 78 (13.2%) | 19 (5.0%) |
| $50,000 to $74,999 | 181 (30.6%) | 52 (13.7%) |
| $75,000 to $99,999 | 97 (16.4%) | 29 (7.6%) |
| $100,000 to $149,999 | 46 (7.8%) | 18 (4.7%) |
| $150,000 or more | 12 (2.0%) | 11 (2.9%) |
| Total | 592 (100.0%) | 380 (100.0%) |
Monthly Housing Cost Tiers in Mountain View
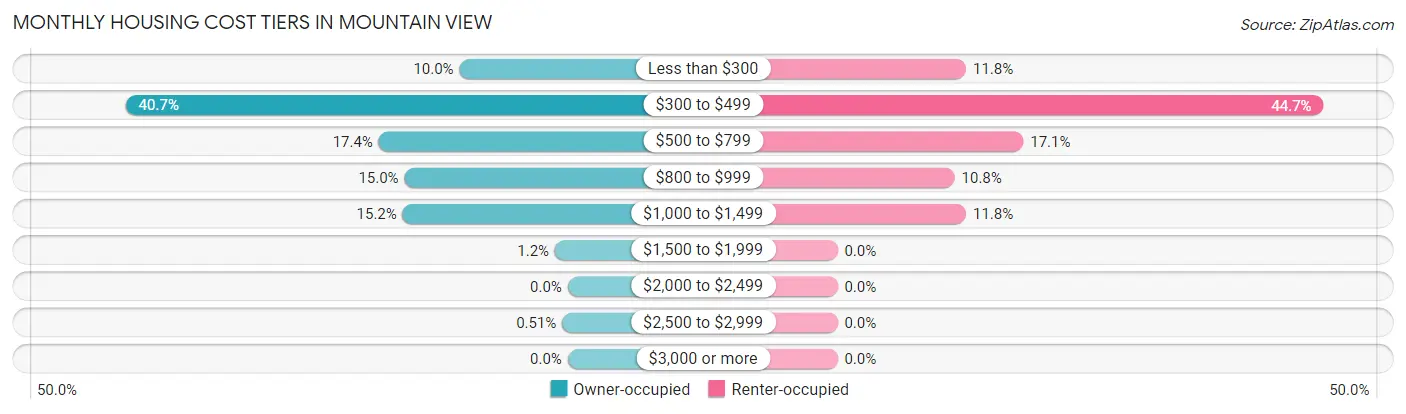
| Monthly Cost | Owner-occupied | Renter-occupied |
| Less than $300 | 59 (10.0%) | 45 (11.8%) |
| $300 to $499 | 241 (40.7%) | 170 (44.7%) |
| $500 to $799 | 103 (17.4%) | 65 (17.1%) |
| $800 to $999 | 89 (15.0%) | 41 (10.8%) |
| $1,000 to $1,499 | 90 (15.2%) | 45 (11.8%) |
| $1,500 to $1,999 | 7 (1.2%) | 0 (0.0%) |
| $2,000 to $2,499 | 0 (0.0%) | 0 (0.0%) |
| $2,500 to $2,999 | 3 (0.5%) | 0 (0.0%) |
| $3,000 or more | 0 (0.0%) | 0 (0.0%) |
| Total | 592 (100.0%) | 380 (100.0%) |
Physical Housing Characteristics in Mountain View
Housing Structures in Mountain View
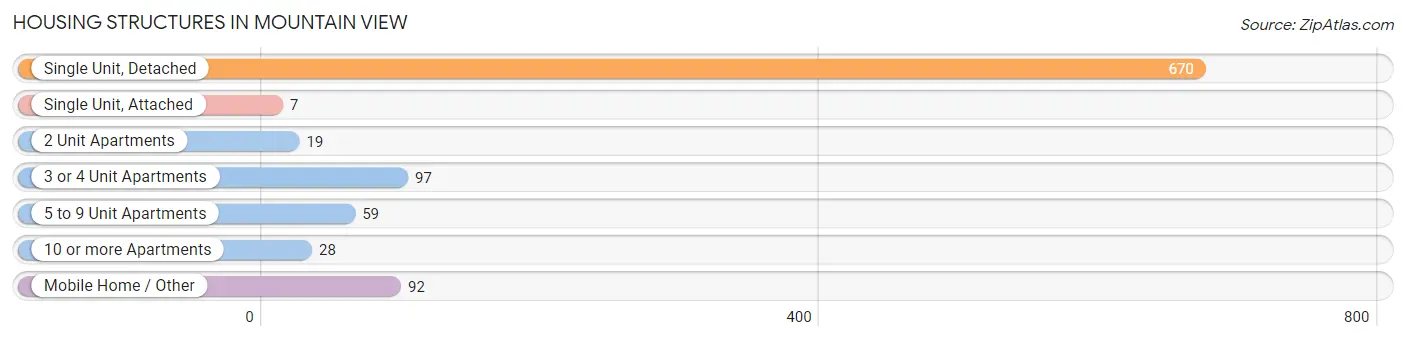
| Structure Type | # Housing Units | % Housing Units |
| Single Unit, Detached | 670 | 68.9% |
| Single Unit, Attached | 7 | 0.7% |
| 2 Unit Apartments | 19 | 1.9% |
| 3 or 4 Unit Apartments | 97 | 10.0% |
| 5 to 9 Unit Apartments | 59 | 6.1% |
| 10 or more Apartments | 28 | 2.9% |
| Mobile Home / Other | 92 | 9.5% |
| Total | 972 | 100.0% |
Housing Structures by Occupancy in Mountain View
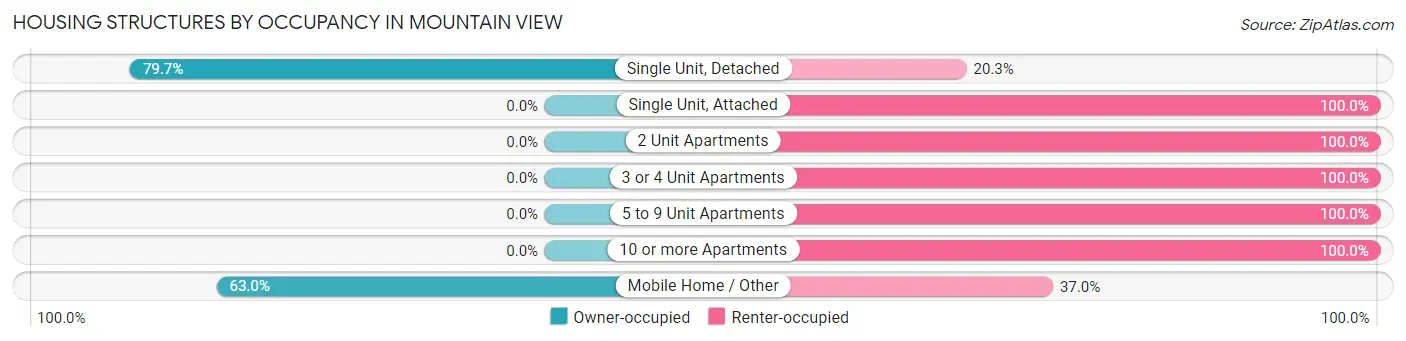
| Structure Type | Owner-occupied | Renter-occupied |
| Single Unit, Detached | 534 (79.7%) | 136 (20.3%) |
| Single Unit, Attached | 0 (0.0%) | 7 (100.0%) |
| 2 Unit Apartments | 0 (0.0%) | 19 (100.0%) |
| 3 or 4 Unit Apartments | 0 (0.0%) | 97 (100.0%) |
| 5 to 9 Unit Apartments | 0 (0.0%) | 59 (100.0%) |
| 10 or more Apartments | 0 (0.0%) | 28 (100.0%) |
| Mobile Home / Other | 58 (63.0%) | 34 (37.0%) |
| Total | 592 (60.9%) | 380 (39.1%) |
Housing Structures by Number of Rooms in Mountain View
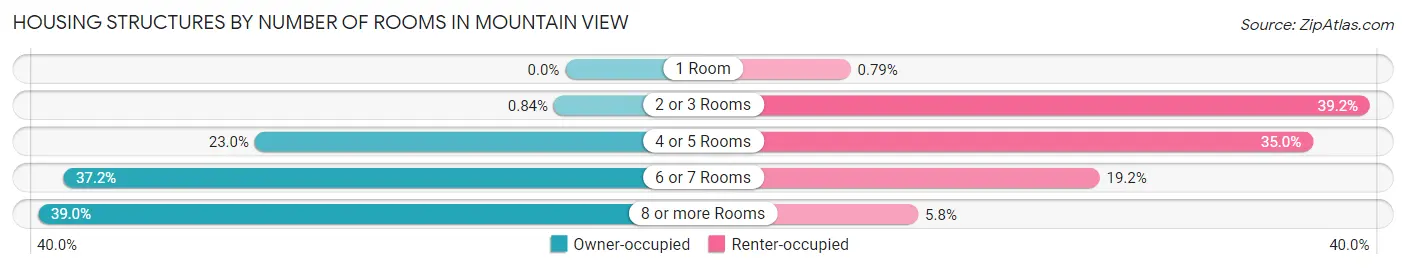
| Number of Rooms | Owner-occupied | Renter-occupied |
| 1 Room | 0 (0.0%) | 3 (0.8%) |
| 2 or 3 Rooms | 5 (0.8%) | 149 (39.2%) |
| 4 or 5 Rooms | 136 (23.0%) | 133 (35.0%) |
| 6 or 7 Rooms | 220 (37.2%) | 73 (19.2%) |
| 8 or more Rooms | 231 (39.0%) | 22 (5.8%) |
| Total | 592 (100.0%) | 380 (100.0%) |
Housing Structure by Heating Type in Mountain View
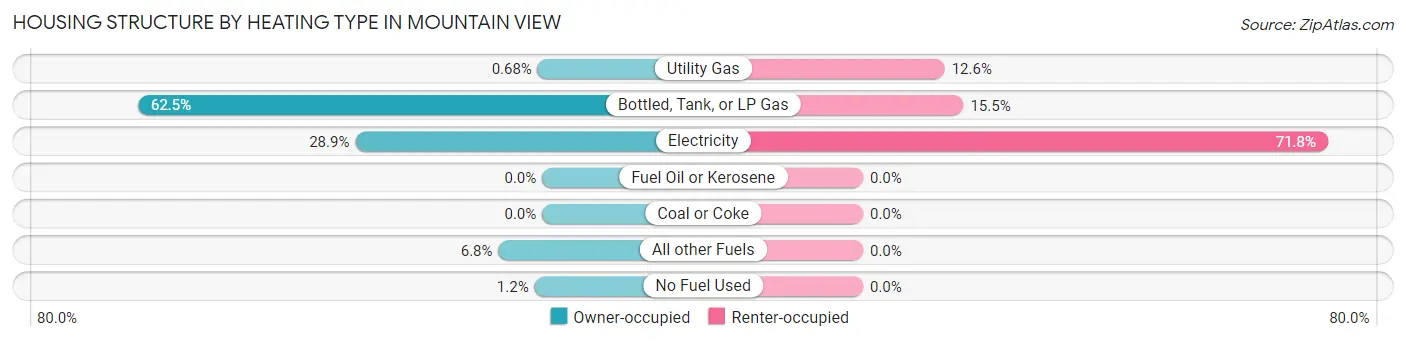
| Heating Type | Owner-occupied | Renter-occupied |
| Utility Gas | 4 (0.7%) | 48 (12.6%) |
| Bottled, Tank, or LP Gas | 370 (62.5%) | 59 (15.5%) |
| Electricity | 171 (28.9%) | 273 (71.8%) |
| Fuel Oil or Kerosene | 0 (0.0%) | 0 (0.0%) |
| Coal or Coke | 0 (0.0%) | 0 (0.0%) |
| All other Fuels | 40 (6.8%) | 0 (0.0%) |
| No Fuel Used | 7 (1.2%) | 0 (0.0%) |
| Total | 592 (100.0%) | 380 (100.0%) |
Household Vehicle Usage in Mountain View
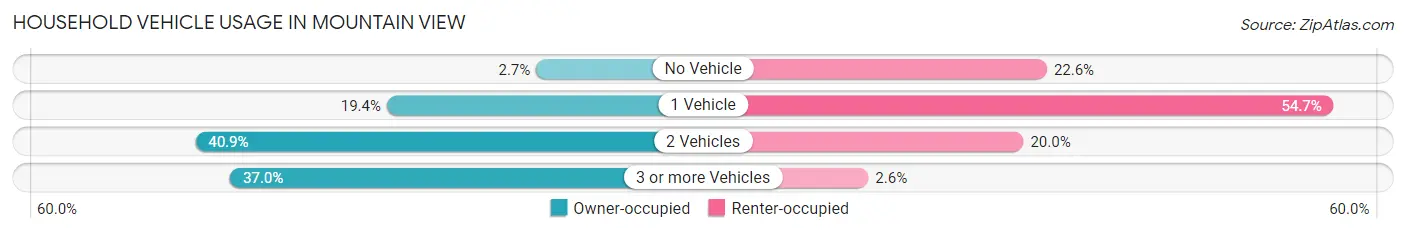
| Vehicles per Household | Owner-occupied | Renter-occupied |
| No Vehicle | 16 (2.7%) | 86 (22.6%) |
| 1 Vehicle | 115 (19.4%) | 208 (54.7%) |
| 2 Vehicles | 242 (40.9%) | 76 (20.0%) |
| 3 or more Vehicles | 219 (37.0%) | 10 (2.6%) |
| Total | 592 (100.0%) | 380 (100.0%) |
Real Estate & Mortgages in Mountain View
Real Estate and Mortgage Overview in Mountain View
| Characteristic | Without Mortgage | With Mortgage |
| Housing Units | 359 | 233 |
| Median Property Value | $116,000 | $95,900 |
| Median Household Income | $53,295 | $5 |
| Monthly Housing Costs | $433 | $0 |
| Real Estate Taxes | $780 | $4 |
Property Value by Mortgage Status in Mountain View
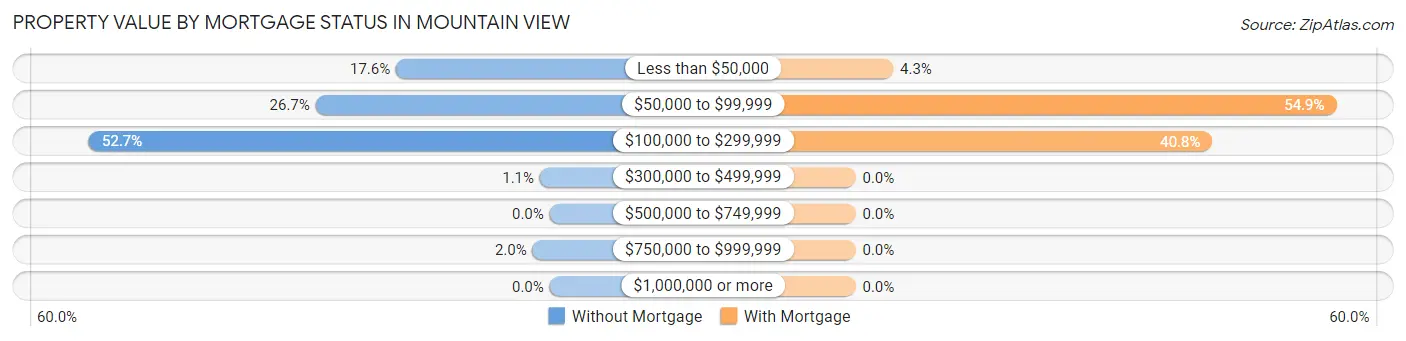
| Property Value | Without Mortgage | With Mortgage |
| Less than $50,000 | 63 (17.5%) | 10 (4.3%) |
| $50,000 to $99,999 | 96 (26.7%) | 128 (54.9%) |
| $100,000 to $299,999 | 189 (52.6%) | 95 (40.8%) |
| $300,000 to $499,999 | 4 (1.1%) | 0 (0.0%) |
| $500,000 to $749,999 | 0 (0.0%) | 0 (0.0%) |
| $750,000 to $999,999 | 7 (1.9%) | 0 (0.0%) |
| $1,000,000 or more | 0 (0.0%) | 0 (0.0%) |
| Total | 359 (100.0%) | 233 (100.0%) |
Household Income by Mortgage Status in Mountain View
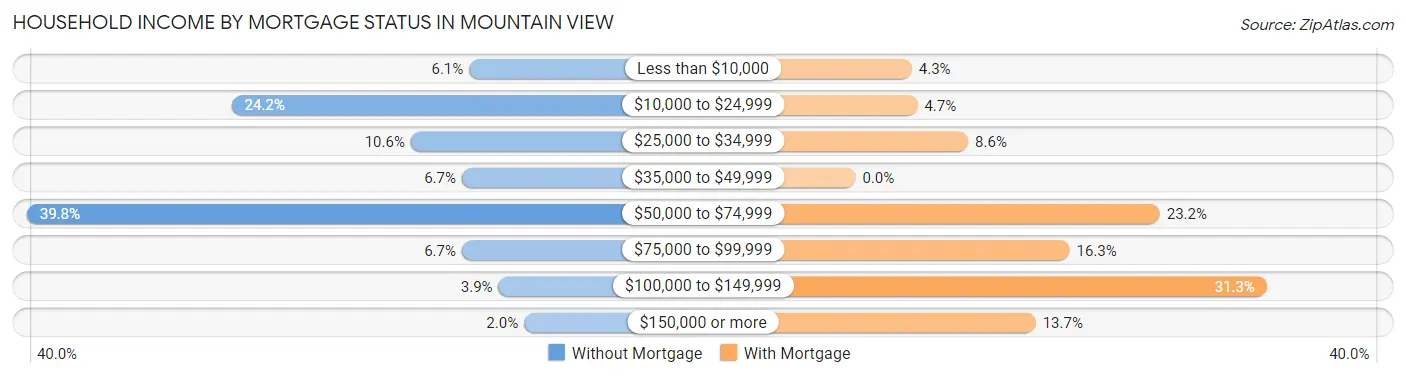
| Household Income | Without Mortgage | With Mortgage |
| Less than $10,000 | 22 (6.1%) | 10 (4.3%) |
| $10,000 to $24,999 | 87 (24.2%) | 11 (4.7%) |
| $25,000 to $34,999 | 38 (10.6%) | 20 (8.6%) |
| $35,000 to $49,999 | 24 (6.7%) | 0 (0.0%) |
| $50,000 to $74,999 | 143 (39.8%) | 54 (23.2%) |
| $75,000 to $99,999 | 24 (6.7%) | 38 (16.3%) |
| $100,000 to $149,999 | 14 (3.9%) | 73 (31.3%) |
| $150,000 or more | 7 (1.9%) | 32 (13.7%) |
| Total | 359 (100.0%) | 233 (100.0%) |
Property Value to Household Income Ratio in Mountain View
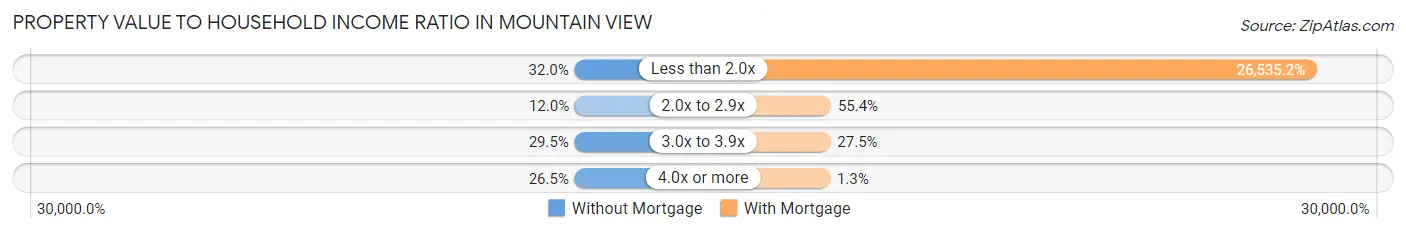
| Value-to-Income Ratio | Without Mortgage | With Mortgage |
| Less than 2.0x | 115 (32.0%) | 61,827 (26,535.2%) |
| 2.0x to 2.9x | 43 (12.0%) | 129 (55.4%) |
| 3.0x to 3.9x | 106 (29.5%) | 64 (27.5%) |
| 4.0x or more | 95 (26.5%) | 3 (1.3%) |
| Total | 359 (100.0%) | 233 (100.0%) |
Real Estate Taxes by Mortgage Status in Mountain View
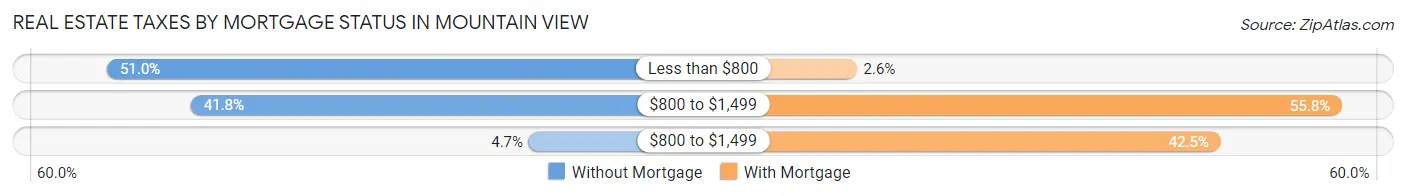
| Property Taxes | Without Mortgage | With Mortgage |
| Less than $800 | 183 (51.0%) | 6 (2.6%) |
| $800 to $1,499 | 150 (41.8%) | 130 (55.8%) |
| $800 to $1,499 | 17 (4.7%) | 99 (42.5%) |
| Total | 359 (100.0%) | 233 (100.0%) |
Health & Disability in Mountain View
Health Insurance Coverage by Age in Mountain View
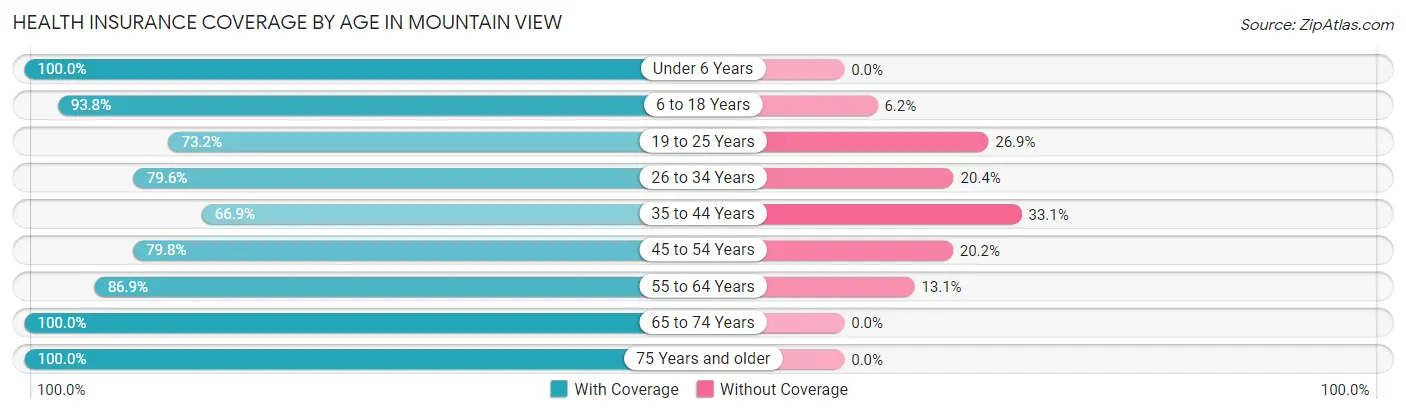
| Age Bracket | With Coverage | Without Coverage |
| Under 6 Years | 162 (100.0%) | 0 (0.0%) |
| 6 to 18 Years | 379 (93.8%) | 25 (6.2%) |
| 19 to 25 Years | 109 (73.2%) | 40 (26.9%) |
| 26 to 34 Years | 164 (79.6%) | 42 (20.4%) |
| 35 to 44 Years | 243 (66.9%) | 120 (33.1%) |
| 45 to 54 Years | 272 (79.8%) | 69 (20.2%) |
| 55 to 64 Years | 226 (86.9%) | 34 (13.1%) |
| 65 to 74 Years | 285 (100.0%) | 0 (0.0%) |
| 75 Years and older | 310 (100.0%) | 0 (0.0%) |
| Total | 2,150 (86.7%) | 330 (13.3%) |
Health Insurance Coverage by Citizenship Status in Mountain View
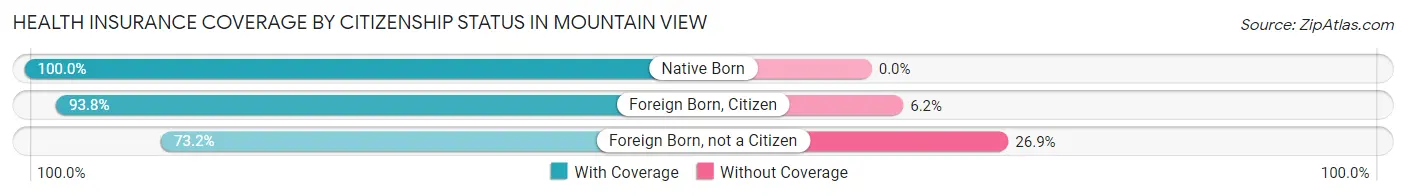
| Citizenship Status | With Coverage | Without Coverage |
| Native Born | 162 (100.0%) | 0 (0.0%) |
| Foreign Born, Citizen | 379 (93.8%) | 25 (6.2%) |
| Foreign Born, not a Citizen | 109 (73.2%) | 40 (26.9%) |
Health Insurance Coverage by Household Income in Mountain View
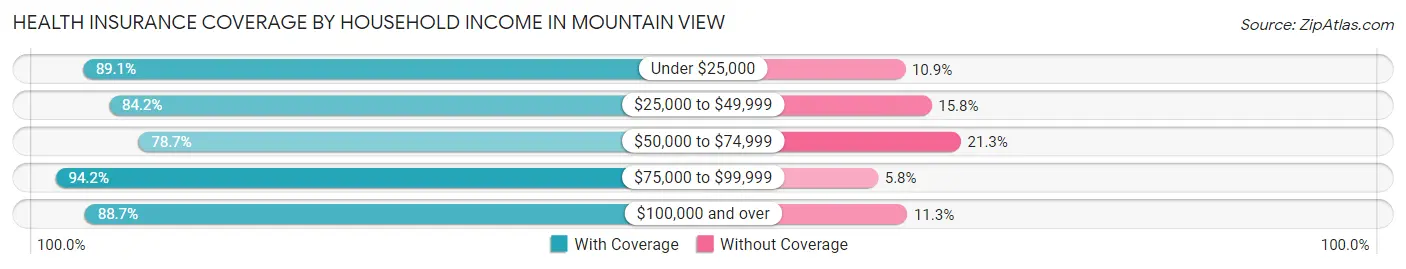
| Household Income | With Coverage | Without Coverage |
| Under $25,000 | 572 (89.1%) | 70 (10.9%) |
| $25,000 to $49,999 | 367 (84.2%) | 69 (15.8%) |
| $50,000 to $74,999 | 465 (78.7%) | 126 (21.3%) |
| $75,000 to $99,999 | 455 (94.2%) | 28 (5.8%) |
| $100,000 and over | 291 (88.7%) | 37 (11.3%) |
Public vs Private Health Insurance Coverage by Age in Mountain View
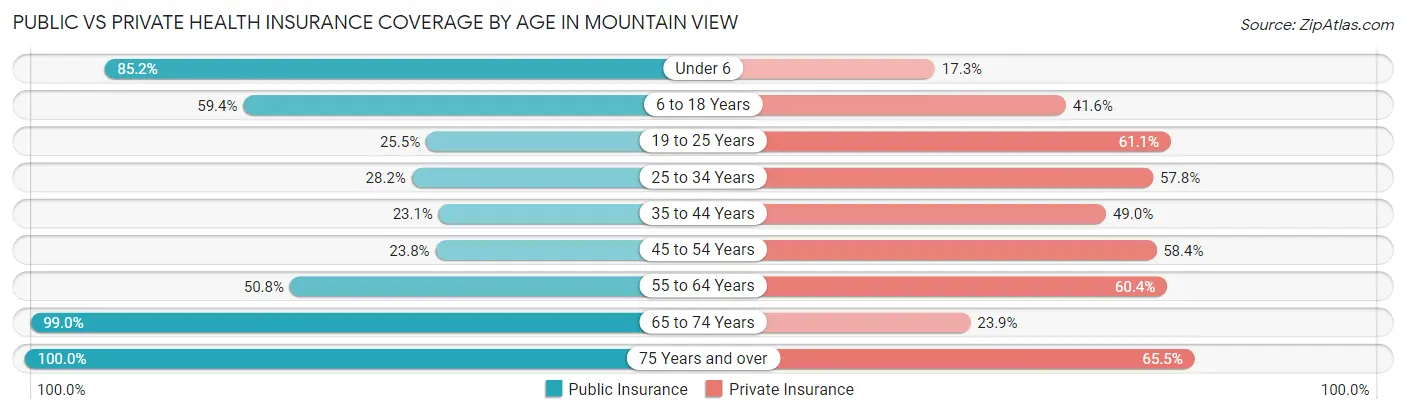
| Age Bracket | Public Insurance | Private Insurance |
| Under 6 | 138 (85.2%) | 28 (17.3%) |
| 6 to 18 Years | 240 (59.4%) | 168 (41.6%) |
| 19 to 25 Years | 38 (25.5%) | 91 (61.1%) |
| 25 to 34 Years | 58 (28.2%) | 119 (57.8%) |
| 35 to 44 Years | 84 (23.1%) | 178 (49.0%) |
| 45 to 54 Years | 81 (23.7%) | 199 (58.4%) |
| 55 to 64 Years | 132 (50.8%) | 157 (60.4%) |
| 65 to 74 Years | 282 (99.0%) | 68 (23.9%) |
| 75 Years and over | 310 (100.0%) | 203 (65.5%) |
| Total | 1,363 (55.0%) | 1,211 (48.8%) |
Disability Status by Sex by Age in Mountain View
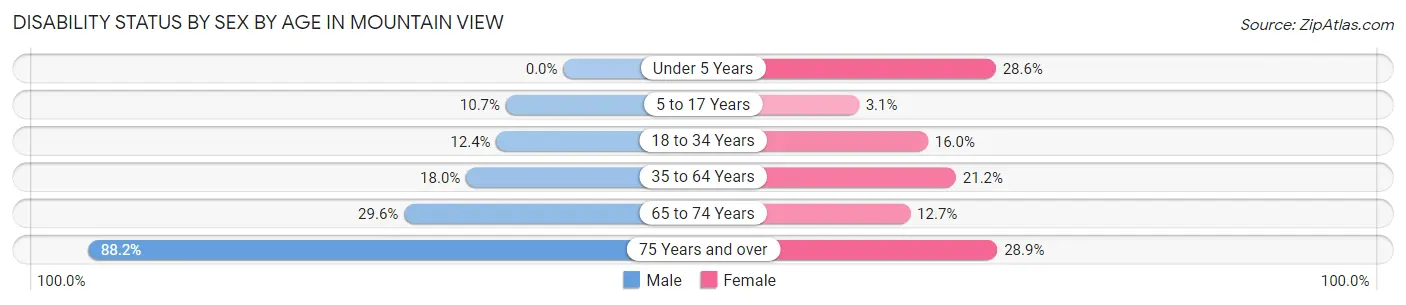
| Age Bracket | Male | Female |
| Under 5 Years | 0 (0.0%) | 16 (28.6%) |
| 5 to 17 Years | 19 (10.7%) | 7 (3.1%) |
| 18 to 34 Years | 22 (12.4%) | 30 (16.0%) |
| 35 to 64 Years | 81 (18.0%) | 109 (21.2%) |
| 65 to 74 Years | 26 (29.5%) | 25 (12.7%) |
| 75 Years and over | 90 (88.2%) | 60 (28.8%) |
Disability Class by Sex by Age in Mountain View
Disability Class: Hearing Difficulty
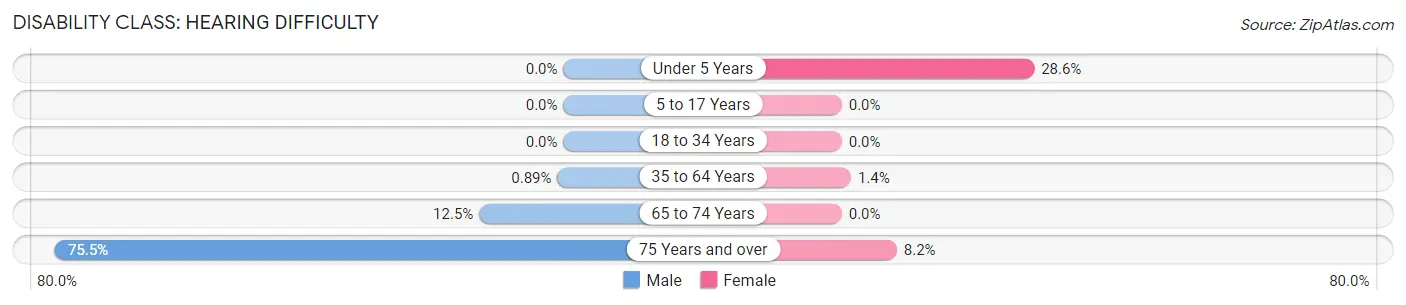
| Age Bracket | Male | Female |
| Under 5 Years | 0 (0.0%) | 16 (28.6%) |
| 5 to 17 Years | 0 (0.0%) | 0 (0.0%) |
| 18 to 34 Years | 0 (0.0%) | 0 (0.0%) |
| 35 to 64 Years | 4 (0.9%) | 7 (1.4%) |
| 65 to 74 Years | 11 (12.5%) | 0 (0.0%) |
| 75 Years and over | 77 (75.5%) | 17 (8.2%) |
Disability Class: Vision Difficulty
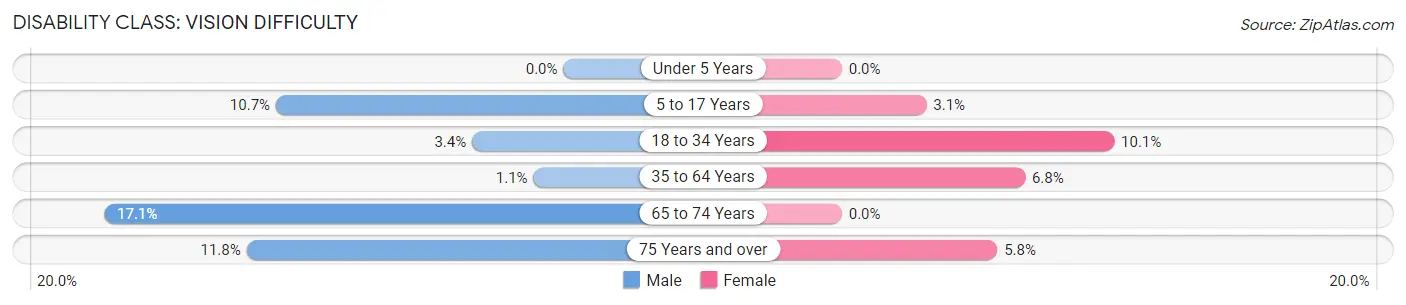
| Age Bracket | Male | Female |
| Under 5 Years | 0 (0.0%) | 0 (0.0%) |
| 5 to 17 Years | 19 (10.7%) | 7 (3.1%) |
| 18 to 34 Years | 6 (3.4%) | 19 (10.1%) |
| 35 to 64 Years | 5 (1.1%) | 35 (6.8%) |
| 65 to 74 Years | 15 (17.1%) | 0 (0.0%) |
| 75 Years and over | 12 (11.8%) | 12 (5.8%) |
Disability Class: Cognitive Difficulty
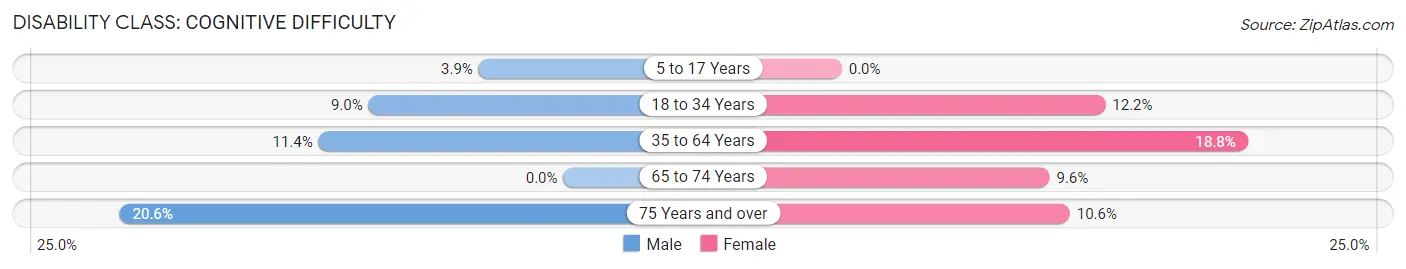
| Age Bracket | Male | Female |
| 5 to 17 Years | 7 (3.9%) | 0 (0.0%) |
| 18 to 34 Years | 16 (9.0%) | 23 (12.2%) |
| 35 to 64 Years | 51 (11.4%) | 97 (18.8%) |
| 65 to 74 Years | 0 (0.0%) | 19 (9.6%) |
| 75 Years and over | 21 (20.6%) | 22 (10.6%) |
Disability Class: Ambulatory Difficulty
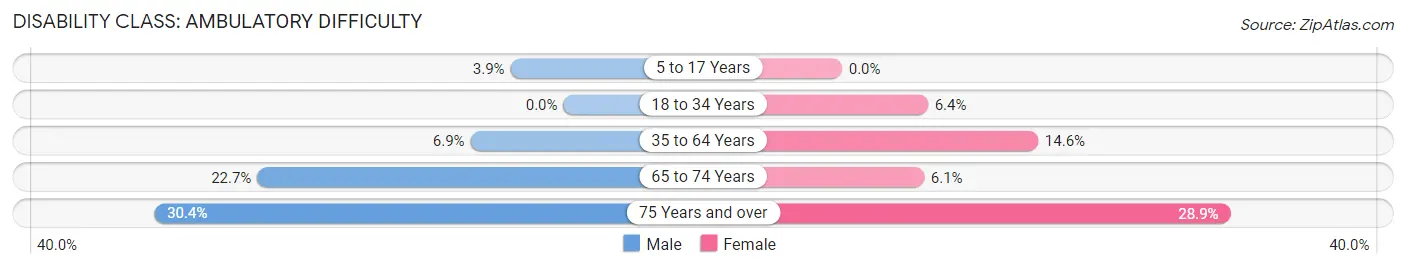
| Age Bracket | Male | Female |
| 5 to 17 Years | 7 (3.9%) | 0 (0.0%) |
| 18 to 34 Years | 0 (0.0%) | 12 (6.4%) |
| 35 to 64 Years | 31 (6.9%) | 75 (14.6%) |
| 65 to 74 Years | 20 (22.7%) | 12 (6.1%) |
| 75 Years and over | 31 (30.4%) | 60 (28.8%) |
Disability Class: Self-Care Difficulty
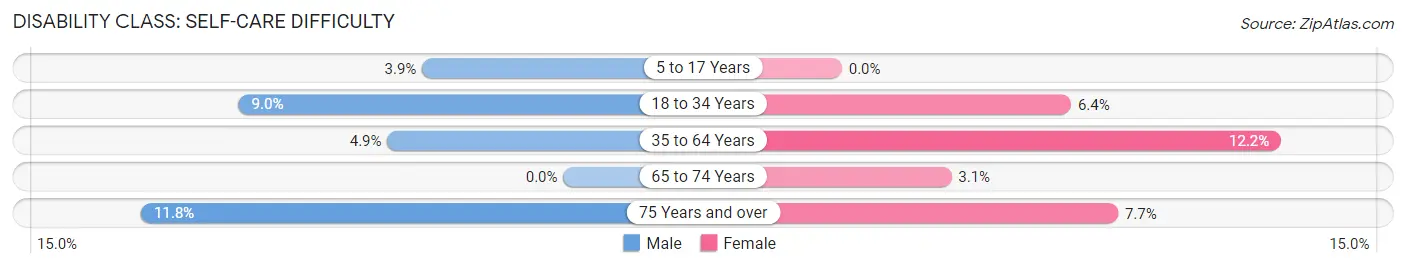
| Age Bracket | Male | Female |
| 5 to 17 Years | 7 (3.9%) | 0 (0.0%) |
| 18 to 34 Years | 16 (9.0%) | 12 (6.4%) |
| 35 to 64 Years | 22 (4.9%) | 63 (12.2%) |
| 65 to 74 Years | 0 (0.0%) | 6 (3.0%) |
| 75 Years and over | 12 (11.8%) | 16 (7.7%) |
Technology Access in Mountain View
Computing Device Access in Mountain View
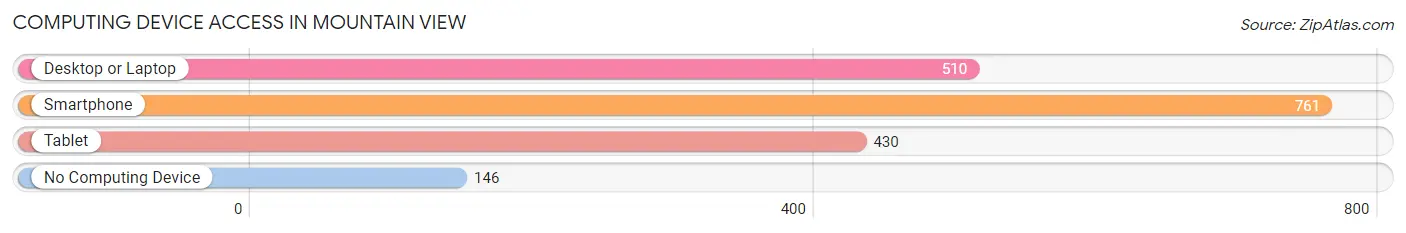
| Device Type | # Households | % Households |
| Desktop or Laptop | 510 | 52.5% |
| Smartphone | 761 | 78.3% |
| Tablet | 430 | 44.2% |
| No Computing Device | 146 | 15.0% |
| Total | 972 | 100.0% |
Internet Access in Mountain View
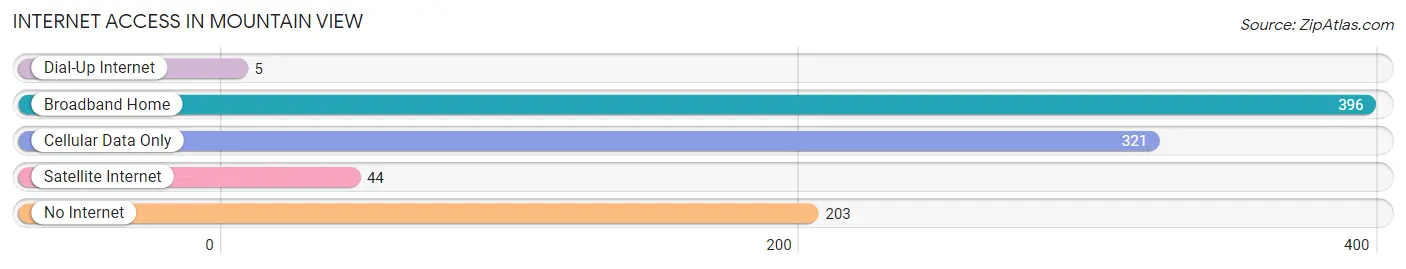
| Internet Type | # Households | % Households |
| Dial-Up Internet | 5 | 0.5% |
| Broadband Home | 396 | 40.7% |
| Cellular Data Only | 321 | 33.0% |
| Satellite Internet | 44 | 4.5% |
| No Internet | 203 | 20.9% |
| Total | 972 | 100.0% |
Mountain View Summary
Mountain View, Missouri is a small town located in the Ozark Mountains of south-central Missouri. It is the county seat of Howell County and is home to a population of approximately 2,800 people. The town is situated in a picturesque valley surrounded by rolling hills and is known for its rural charm and friendly atmosphere.
Geography
Mountain View is located in the Ozark Mountains of south-central Missouri. It is situated in a picturesque valley surrounded by rolling hills. The town is located at the intersection of U.S. Route 60 and Missouri Route 17. The nearest major cities are Springfield, Missouri, which is about 70 miles to the east, and Branson, Missouri, which is about 50 miles to the south.
The town is situated at an elevation of 1,100 feet above sea level and has a total area of 2.2 square miles. The climate is characterized by hot, humid summers and cold, wet winters. The average annual temperature is around 57 degrees Fahrenheit and the average annual precipitation is around 40 inches.
History
Mountain View was founded in 1883 by a group of settlers from the nearby town of West Plains. The town was named for its location in the Ozark Mountains and was incorporated in 1887. The town quickly grew and by the early 1900s had become a popular tourist destination.
The town was home to a variety of businesses, including a hotel, a bank, a newspaper, a sawmill, and a variety of stores. The town also had a thriving agricultural industry, with many farmers growing corn, wheat, and other crops.
In the 1950s, the town began to decline as many of its businesses closed and the population began to decline. However, in recent years, the town has seen a resurgence in tourism and has become a popular destination for outdoor recreation.
Economy
Mountain View’s economy is largely based on tourism and outdoor recreation. The town is home to a variety of attractions, including the Ozark National Scenic Riverways, the Mark Twain National Forest, and the Ozark Mountain State Park.
The town is also home to a variety of businesses, including restaurants, hotels, and retail stores. The town is also home to a variety of manufacturing companies, including a furniture factory and a woodworking plant.
Demographics
As of the 2010 census, the population of Mountain View was 2,811. The racial makeup of the town was 97.3% White, 0.7% African American, 0.2% Native American, 0.2% Asian, 0.1% Pacific Islander, 0.3% from other races, and 1.3% from two or more races. Hispanic or Latino of any race were 1.2% of the population.
The median income for a household in the town was $30,938 and the median income for a family was $37,917. The per capita income for the town was $17,845. About 16.2% of families and 19.2% of the population were below the poverty line, including 25.2% of those under age 18 and 11.2% of those age 65 or over.
Mountain View is a small town with a rich history and a vibrant economy. It is a popular destination for outdoor recreation and is home to a variety of businesses and attractions. The town is known for its rural charm and friendly atmosphere and is a great place to live and visit.
Common Questions
What is Per Capita Income in Mountain View?
Per Capita income in Mountain View is $20,910.
What is the Median Family Income in Mountain View?
Median Family Income in Mountain View is $53,958.
What is the Median Household income in Mountain View?
Median Household Income in Mountain View is $43,611.
What is Income or Wage Gap in Mountain View?
Income or Wage Gap in Mountain View is 9.8%.
Women in Mountain View earn 90.2 cents for every dollar earned by a man.
What is Inequality or Gini Index in Mountain View?
Inequality or Gini Index in Mountain View is 0.43.
What is the Total Population of Mountain View?
Total Population of Mountain View is 2,558.
What is the Total Male Population of Mountain View?
Total Male Population of Mountain View is 1,126.
What is the Total Female Population of Mountain View?
Total Female Population of Mountain View is 1,432.
What is the Ratio of Males per 100 Females in Mountain View?
There are 78.63 Males per 100 Females in Mountain View.
What is the Ratio of Females per 100 Males in Mountain View?
There are 127.18 Females per 100 Males in Mountain View.
What is the Median Population Age in Mountain View?
Median Population Age in Mountain View is 43.9 Years.
What is the Average Family Size in Mountain View
Average Family Size in Mountain View is 3.0 People.
What is the Average Household Size in Mountain View
Average Household Size in Mountain View is 2.5 People.
How Large is the Labor Force in Mountain View?
There are 953 People in the Labor Forcein in Mountain View.
What is the Percentage of People in the Labor Force in Mountain View?
46.2% of People are in the Labor Force in Mountain View.
What is the Unemployment Rate in Mountain View?
Unemployment Rate in Mountain View is 2.6%.