Moscow Mills, MO Map & Demographics
Moscow Mills Map
Moscow Mills Overview
$27,698
PER CAPITA INCOME
$75,625
AVG FAMILY INCOME
$70,429
AVG HOUSEHOLD INCOME
41.6%
WAGE / INCOME GAP [ % ]
58.4¢/ $1
WAGE / INCOME GAP [ $ ]
0.40
INEQUALITY / GINI INDEX
3,502
TOTAL POPULATION
1,809
MALE POPULATION
1,693
FEMALE POPULATION
106.85
MALES / 100 FEMALES
93.59
FEMALES / 100 MALES
30.3
MEDIAN AGE
3.1
AVG FAMILY SIZE
2.9
AVG HOUSEHOLD SIZE
1,670
LABOR FORCE [ PEOPLE ]
64.5%
PERCENT IN LABOR FORCE
7.7%
UNEMPLOYMENT RATE
Moscow Mills Zip Codes
Moscow Mills Area Codes
Income in Moscow Mills
Income Overview in Moscow Mills
Per Capita Income in Moscow Mills is $27,698, while median incomes of families and households are $75,625 and $70,429 respectively.
| Characteristic | Number | Measure |
| Per Capita Income | 3,502 | $27,698 |
| Median Family Income | 1,004 | $75,625 |
| Mean Family Income | 1,004 | $83,248 |
| Median Household Income | 1,200 | $70,429 |
| Mean Household Income | 1,200 | $78,226 |
| Income Deficit | 1,004 | $0 |
| Wage / Income Gap (%) | 3,502 | 41.62% |
| Wage / Income Gap ($) | 3,502 | 58.38¢ per $1 |
| Gini / Inequality Index | 3,502 | 0.40 |
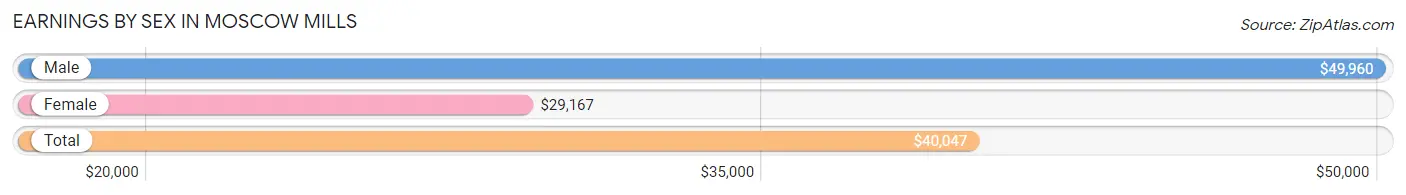
Earnings by Sex in Moscow Mills
Average Earnings in Moscow Mills are $40,047, $49,960 for men and $29,167 for women, a difference of 41.6%.
| Sex | Number | Average Earnings |
| Male | 909 (50.9%) | $49,960 |
| Female | 878 (49.1%) | $29,167 |
| Total | 1,787 (100.0%) | $40,047 |
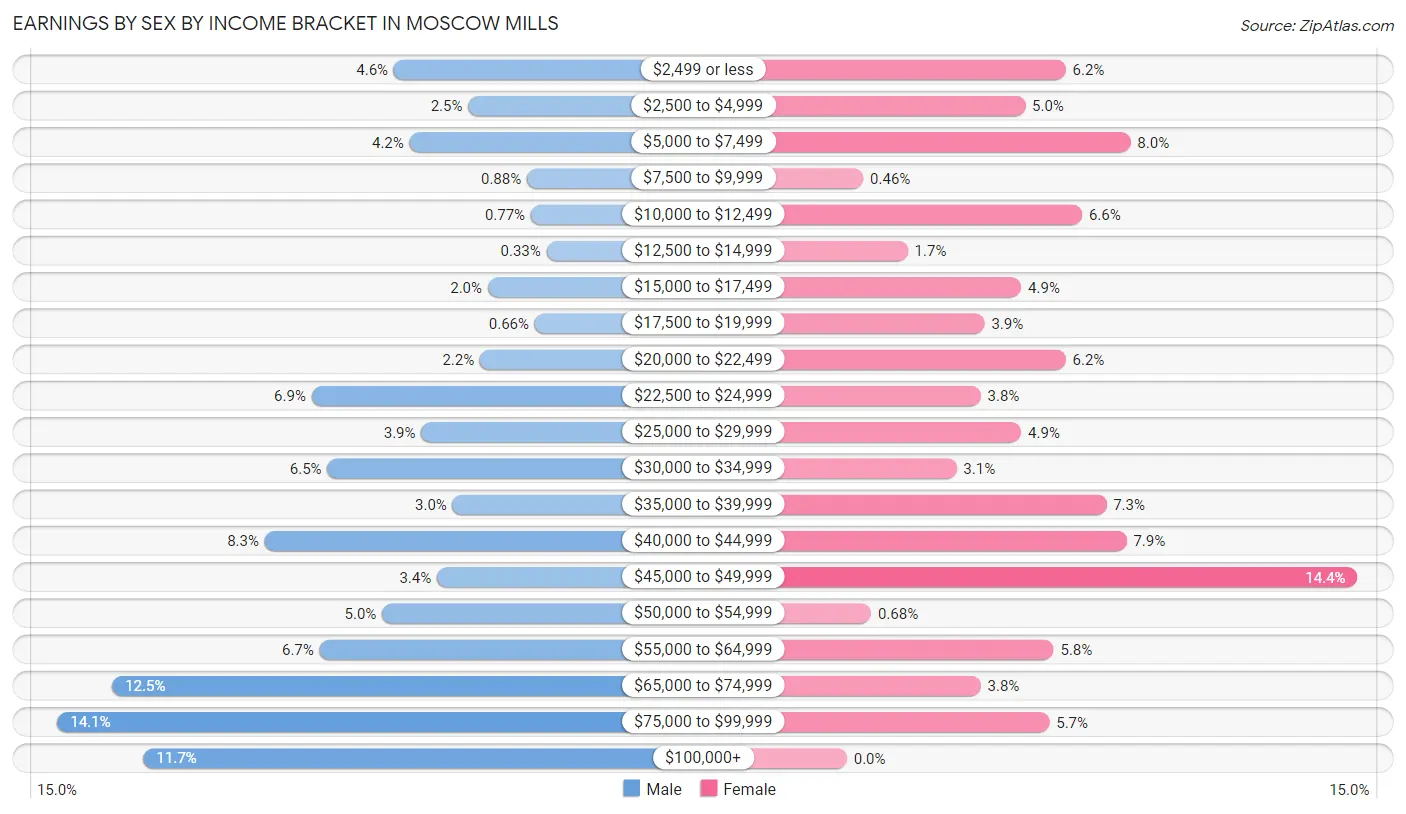
Earnings by Sex by Income Bracket in Moscow Mills
The most common earnings brackets in Moscow Mills are $75,000 to $99,999 for men (128 | 14.1%) and $45,000 to $49,999 for women (126 | 14.3%).
| Income | Male | Female |
| $2,499 or less | 42 (4.6%) | 54 (6.1%) |
| $2,500 to $4,999 | 23 (2.5%) | 44 (5.0%) |
| $5,000 to $7,499 | 38 (4.2%) | 70 (8.0%) |
| $7,500 to $9,999 | 8 (0.9%) | 4 (0.5%) |
| $10,000 to $12,499 | 7 (0.8%) | 58 (6.6%) |
| $12,500 to $14,999 | 3 (0.3%) | 15 (1.7%) |
| $15,000 to $17,499 | 18 (2.0%) | 43 (4.9%) |
| $17,500 to $19,999 | 6 (0.7%) | 34 (3.9%) |
| $20,000 to $22,499 | 20 (2.2%) | 54 (6.1%) |
| $22,500 to $24,999 | 63 (6.9%) | 33 (3.8%) |
| $25,000 to $29,999 | 35 (3.8%) | 43 (4.9%) |
| $30,000 to $34,999 | 59 (6.5%) | 27 (3.1%) |
| $35,000 to $39,999 | 27 (3.0%) | 64 (7.3%) |
| $40,000 to $44,999 | 75 (8.3%) | 69 (7.9%) |
| $45,000 to $49,999 | 31 (3.4%) | 126 (14.3%) |
| $50,000 to $54,999 | 45 (5.0%) | 6 (0.7%) |
| $55,000 to $64,999 | 61 (6.7%) | 51 (5.8%) |
| $65,000 to $74,999 | 114 (12.5%) | 33 (3.8%) |
| $75,000 to $99,999 | 128 (14.1%) | 50 (5.7%) |
| $100,000+ | 106 (11.7%) | 0 (0.0%) |
| Total | 909 (100.0%) | 878 (100.0%) |
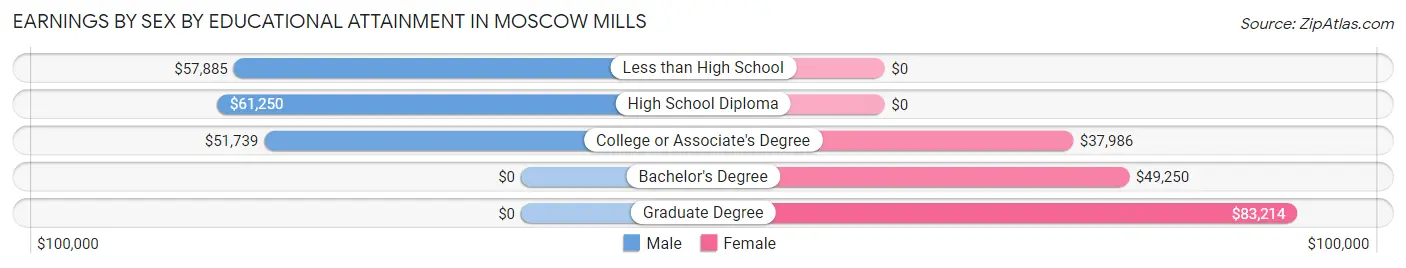
Earnings by Sex by Educational Attainment in Moscow Mills
Average earnings in Moscow Mills are $61,771 for men and $37,569 for women, a difference of 39.2%. Men with an educational attainment of high school diploma enjoy the highest average annual earnings of $61,250, while those with college or associate's degree education earn the least with $51,739. Women with an educational attainment of graduate degree earn the most with the average annual earnings of $83,214, while those with college or associate's degree education have the smallest earnings of $37,986.
| Educational Attainment | Male Income | Female Income |
| Less than High School | $57,885 | $0 |
| High School Diploma | $61,250 | $0 |
| College or Associate's Degree | $51,739 | $37,986 |
| Bachelor's Degree | - | - |
| Graduate Degree | - | - |
| Total | $61,771 | $37,569 |
Family Income in Moscow Mills
Family Income Brackets in Moscow Mills
According to the Moscow Mills family income data, there are 194 families falling into the $100,000 to $149,999 income range, which is the most common income bracket and makes up 19.3% of all families. Conversely, the $10,000 to $14,999 income bracket is the least frequent group with only 9 families (0.9%) belonging to this category.
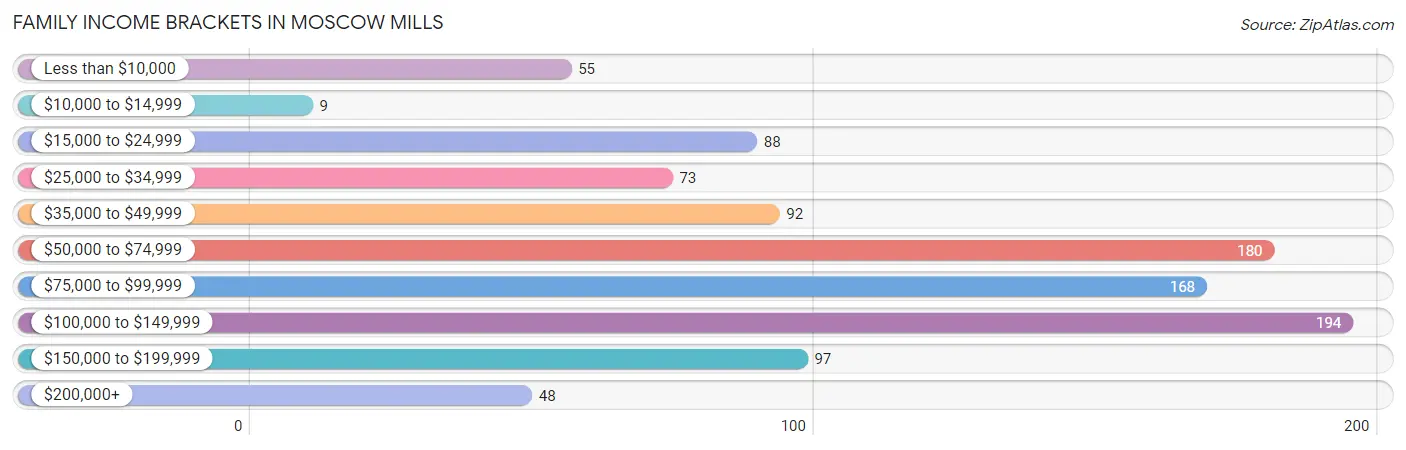
| Income Bracket | # Families | % Families |
| Less than $10,000 | 55 | 5.5% |
| $10,000 to $14,999 | 9 | 0.9% |
| $15,000 to $24,999 | 88 | 8.8% |
| $25,000 to $34,999 | 73 | 7.3% |
| $35,000 to $49,999 | 92 | 9.2% |
| $50,000 to $74,999 | 180 | 17.9% |
| $75,000 to $99,999 | 168 | 16.7% |
| $100,000 to $149,999 | 194 | 19.3% |
| $150,000 to $199,999 | 97 | 9.7% |
| $200,000+ | 48 | 4.8% |
Family Income by Famaliy Size in Moscow Mills
5-person families (89 | 8.9%) account for the highest median family income in Moscow Mills with $126,202 per family, while 2-person families (540 | 53.8%) have the highest median income of $27,242 per family member.
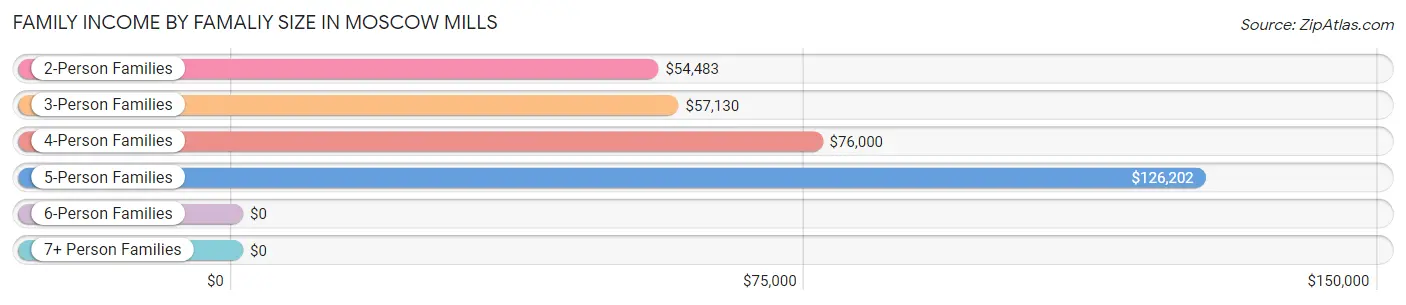
| Income Bracket | # Families | Median Income |
| 2-Person Families | 540 (53.8%) | $54,483 |
| 3-Person Families | 130 (13.0%) | $57,130 |
| 4-Person Families | 210 (20.9%) | $76,000 |
| 5-Person Families | 89 (8.9%) | $126,202 |
| 6-Person Families | 19 (1.9%) | $0 |
| 7+ Person Families | 16 (1.6%) | $0 |
| Total | 1,004 (100.0%) | $75,625 |
Family Income by Number of Earners in Moscow Mills
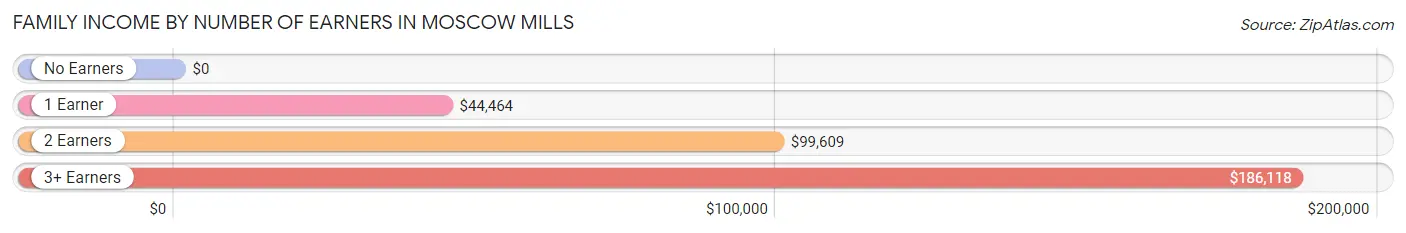
| Number of Earners | # Families | Median Income |
| No Earners | 127 (12.7%) | $0 |
| 1 Earner | 343 (34.2%) | $44,464 |
| 2 Earners | 467 (46.5%) | $99,609 |
| 3+ Earners | 67 (6.7%) | $186,118 |
| Total | 1,004 (100.0%) | $75,625 |
Household Income in Moscow Mills
Household Income Brackets in Moscow Mills
With 220 households falling in the category, the $100,000 to $149,999 income range is the most frequent in Moscow Mills, accounting for 18.3% of all households. In contrast, only 10 households (0.8%) fall into the $10,000 to $14,999 income bracket, making it the least populous group.
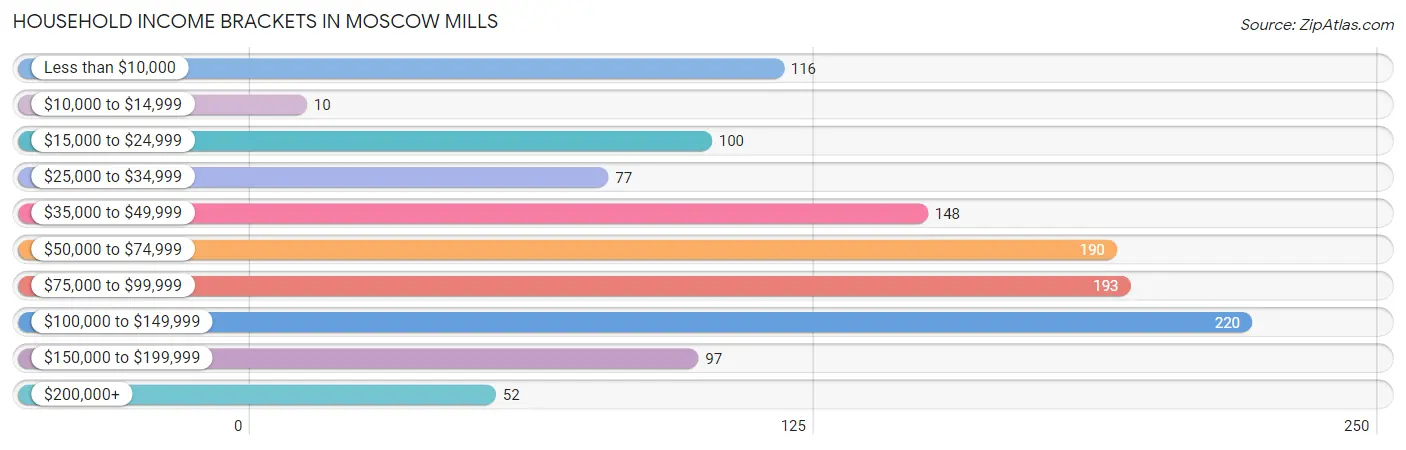
| Income Bracket | # Households | % Households |
| Less than $10,000 | 116 | 9.7% |
| $10,000 to $14,999 | 10 | 0.8% |
| $15,000 to $24,999 | 100 | 8.3% |
| $25,000 to $34,999 | 77 | 6.4% |
| $35,000 to $49,999 | 148 | 12.3% |
| $50,000 to $74,999 | 190 | 15.8% |
| $75,000 to $99,999 | 193 | 16.1% |
| $100,000 to $149,999 | 220 | 18.3% |
| $150,000 to $199,999 | 97 | 8.1% |
| $200,000+ | 52 | 4.3% |
Household Income by Householder Age in Moscow Mills
The median household income in Moscow Mills is $70,429, with the highest median household income of $89,143 found in the 45 to 64 years age bracket for the primary householder. A total of 444 households (37.0%) fall into this category. Meanwhile, the 15 to 24 years age bracket for the primary householder has the lowest median household income of $0, with 12 households (1.0%) in this group.
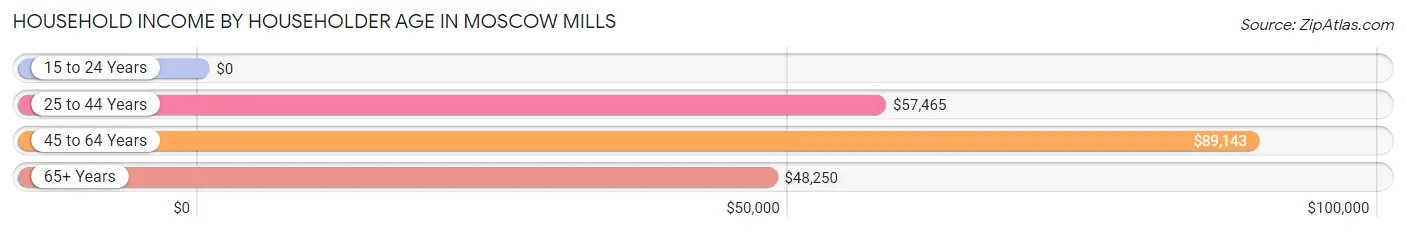
| Income Bracket | # Households | Median Income |
| 15 to 24 Years | 12 (1.0%) | $0 |
| 25 to 44 Years | 537 (44.8%) | $57,465 |
| 45 to 64 Years | 444 (37.0%) | $89,143 |
| 65+ Years | 207 (17.2%) | $48,250 |
| Total | 1,200 (100.0%) | $70,429 |
Poverty in Moscow Mills
Income Below Poverty by Sex and Age in Moscow Mills
With 16.0% poverty level for males and 19.5% for females among the residents of Moscow Mills, 5 year old males and 15 year old females are the most vulnerable to poverty, with 54 males (62.1%) and 10 females (100.0%) in their respective age groups living below the poverty level.
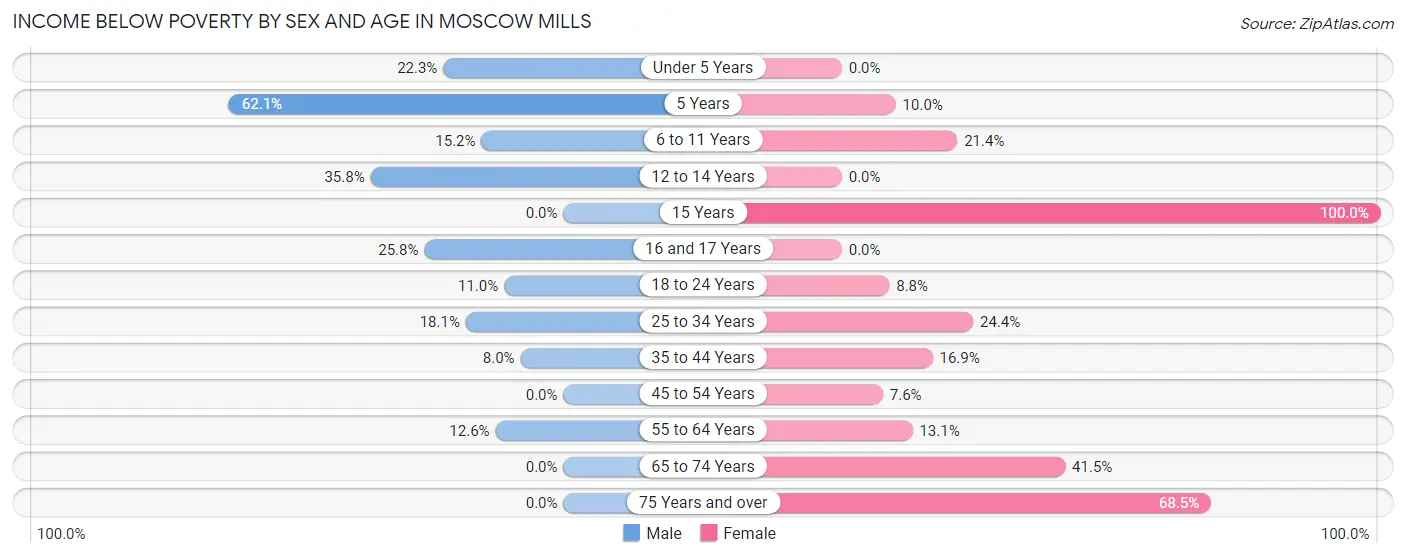
| Age Bracket | Male | Female |
| Under 5 Years | 33 (22.3%) | 0 (0.0%) |
| 5 Years | 54 (62.1%) | 4 (10.0%) |
| 6 to 11 Years | 44 (15.2%) | 18 (21.4%) |
| 12 to 14 Years | 29 (35.8%) | 0 (0.0%) |
| 15 Years | 0 (0.0%) | 10 (100.0%) |
| 16 and 17 Years | 8 (25.8%) | 0 (0.0%) |
| 18 to 24 Years | 23 (11.0%) | 9 (8.8%) |
| 25 to 34 Years | 58 (18.1%) | 98 (24.4%) |
| 35 to 44 Years | 11 (8.0%) | 31 (16.9%) |
| 45 to 54 Years | 0 (0.0%) | 17 (7.6%) |
| 55 to 64 Years | 29 (12.6%) | 29 (13.1%) |
| 65 to 74 Years | 0 (0.0%) | 51 (41.5%) |
| 75 Years and over | 0 (0.0%) | 61 (68.5%) |
| Total | 289 (16.0%) | 328 (19.5%) |
Income Above Poverty by Sex and Age in Moscow Mills
According to the poverty statistics in Moscow Mills, males aged 45 to 54 years and females aged under 5 years are the age groups that are most secure financially, with 100.0% of males and 100.0% of females in these age groups living above the poverty line.
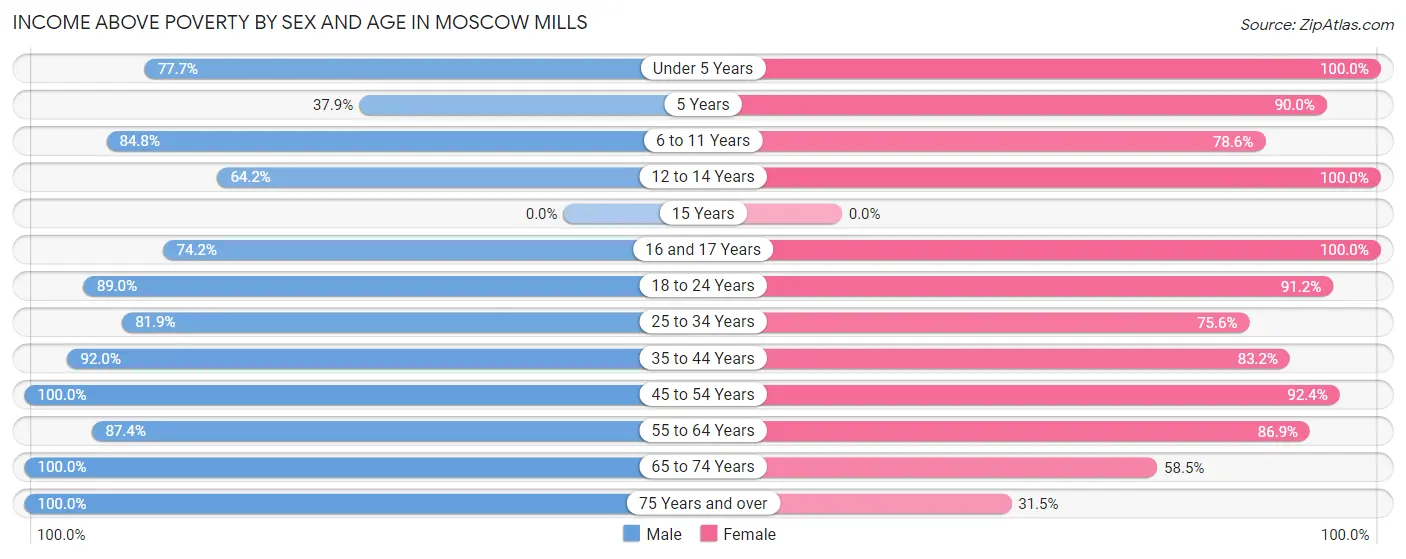
| Age Bracket | Male | Female |
| Under 5 Years | 115 (77.7%) | 119 (100.0%) |
| 5 Years | 33 (37.9%) | 36 (90.0%) |
| 6 to 11 Years | 245 (84.8%) | 66 (78.6%) |
| 12 to 14 Years | 52 (64.2%) | 46 (100.0%) |
| 15 Years | 0 (0.0%) | 0 (0.0%) |
| 16 and 17 Years | 23 (74.2%) | 41 (100.0%) |
| 18 to 24 Years | 186 (89.0%) | 93 (91.2%) |
| 25 to 34 Years | 262 (81.9%) | 304 (75.6%) |
| 35 to 44 Years | 127 (92.0%) | 153 (83.2%) |
| 45 to 54 Years | 145 (100.0%) | 206 (92.4%) |
| 55 to 64 Years | 201 (87.4%) | 192 (86.9%) |
| 65 to 74 Years | 85 (100.0%) | 72 (58.5%) |
| 75 Years and over | 46 (100.0%) | 28 (31.5%) |
| Total | 1,520 (84.0%) | 1,356 (80.5%) |
Income Below Poverty Among Married-Couple Families in Moscow Mills
The poverty statistics for married-couple families in Moscow Mills show that 6.3% or 39 of the total 620 families live below the poverty line. Families with 1 or 2 children have the highest poverty rate of 23.8%, comprising of 39 families. On the other hand, families with no children have the lowest poverty rate of 0.0%, which includes 0 families.
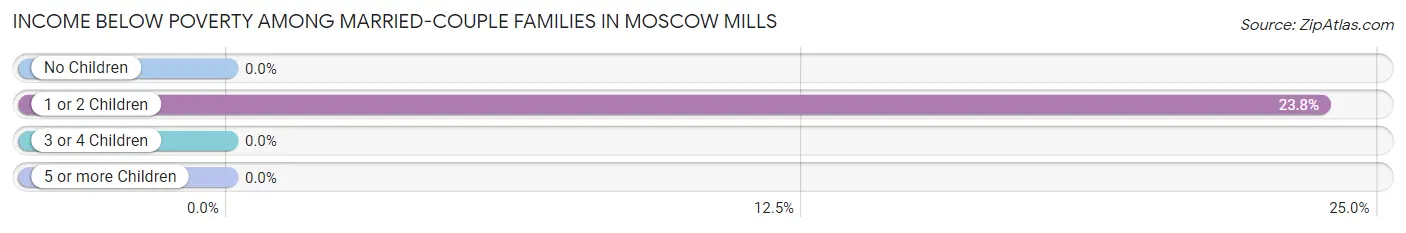
| Children | Above Poverty | Below Poverty |
| No Children | 362 (100.0%) | 0 (0.0%) |
| 1 or 2 Children | 125 (76.2%) | 39 (23.8%) |
| 3 or 4 Children | 78 (100.0%) | 0 (0.0%) |
| 5 or more Children | 16 (100.0%) | 0 (0.0%) |
| Total | 581 (93.7%) | 39 (6.3%) |
Income Below Poverty Among Single-Parent Households in Moscow Mills
According to the poverty data in Moscow Mills, 52.7% or 29 single-father households and 29.8% or 98 single-mother households are living below the poverty line. Among single-father households, those with no children have the highest poverty rate, with 29 households (72.5%) experiencing poverty. Likewise, among single-mother households, those with 3 or 4 children have the highest poverty rate, with 12 households (42.9%) falling below the poverty line.
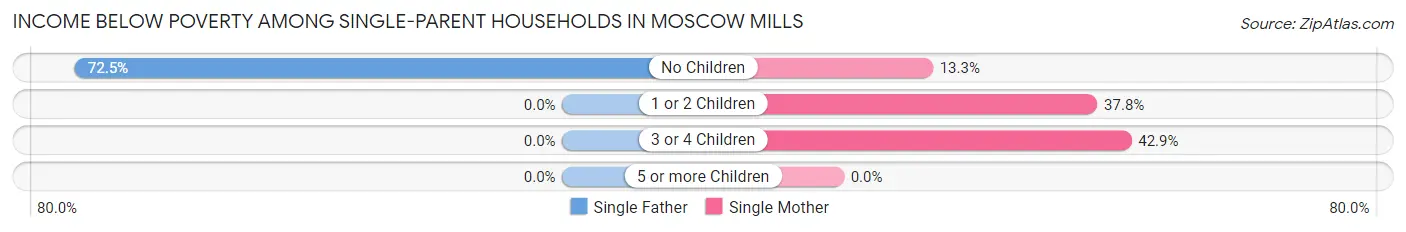
| Children | Single Father | Single Mother |
| No Children | 29 (72.5%) | 15 (13.3%) |
| 1 or 2 Children | 0 (0.0%) | 71 (37.8%) |
| 3 or 4 Children | 0 (0.0%) | 12 (42.9%) |
| 5 or more Children | 0 (0.0%) | 0 (0.0%) |
| Total | 29 (52.7%) | 98 (29.8%) |
Income Below Poverty Among Married-Couple vs Single-Parent Households in Moscow Mills
The poverty data for Moscow Mills shows that 39 of the married-couple family households (6.3%) and 127 of the single-parent households (33.1%) are living below the poverty level. Within the married-couple family households, those with 1 or 2 children have the highest poverty rate, with 39 households (23.8%) falling below the poverty line. Among the single-parent households, those with 3 or 4 children have the highest poverty rate, with 12 household (42.9%) living below poverty.
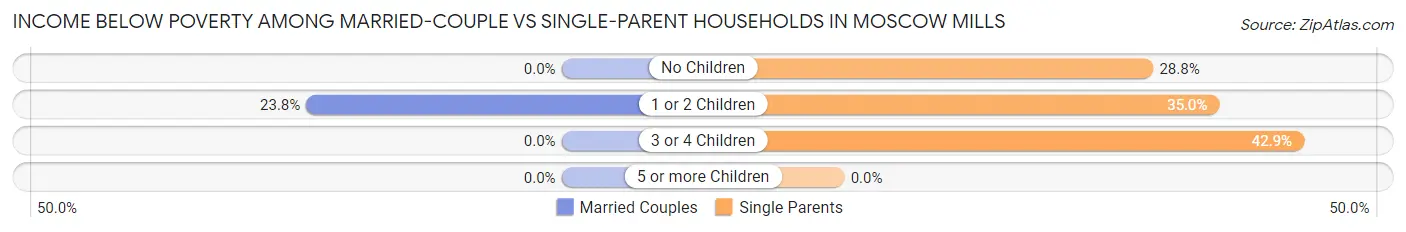
| Children | Married-Couple Families | Single-Parent Households |
| No Children | 0 (0.0%) | 44 (28.8%) |
| 1 or 2 Children | 39 (23.8%) | 71 (35.0%) |
| 3 or 4 Children | 0 (0.0%) | 12 (42.9%) |
| 5 or more Children | 0 (0.0%) | 0 (0.0%) |
| Total | 39 (6.3%) | 127 (33.1%) |
Race in Moscow Mills
The most populous races in Moscow Mills are White / Caucasian (3,149 | 89.9%), Two or more Races (190 | 5.4%), and Hispanic or Latino (189 | 5.4%).
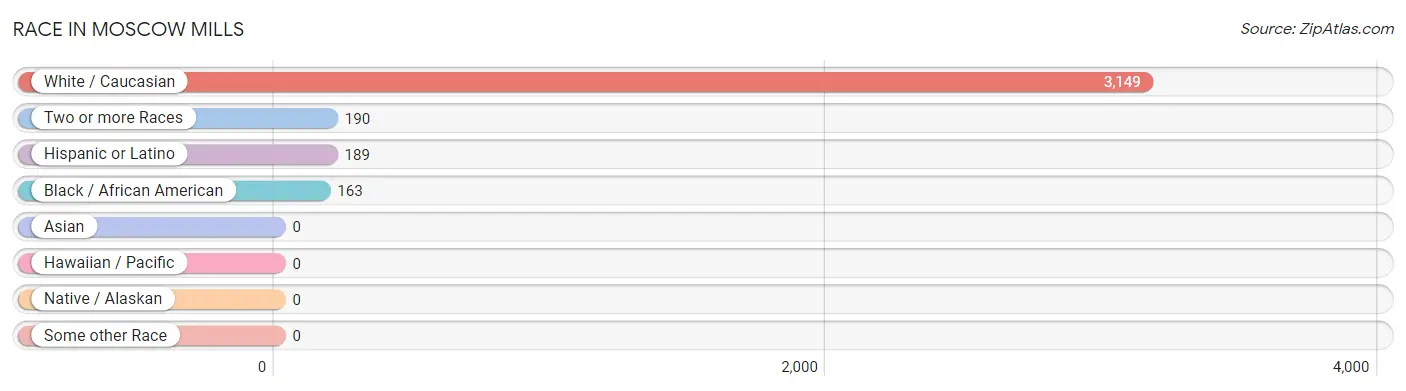
| Race | # Population | % Population |
| Asian | 0 | 0.0% |
| Black / African American | 163 | 4.6% |
| Hawaiian / Pacific | 0 | 0.0% |
| Hispanic or Latino | 189 | 5.4% |
| Native / Alaskan | 0 | 0.0% |
| White / Caucasian | 3,149 | 89.9% |
| Two or more Races | 190 | 5.4% |
| Some other Race | 0 | 0.0% |
| Total | 3,502 | 100.0% |
Ancestry in Moscow Mills
The most populous ancestries reported in Moscow Mills are German (765 | 21.8%), Irish (335 | 9.6%), American (310 | 8.8%), English (180 | 5.1%), and Italian (120 | 3.4%), together accounting for 48.8% of all Moscow Mills residents.
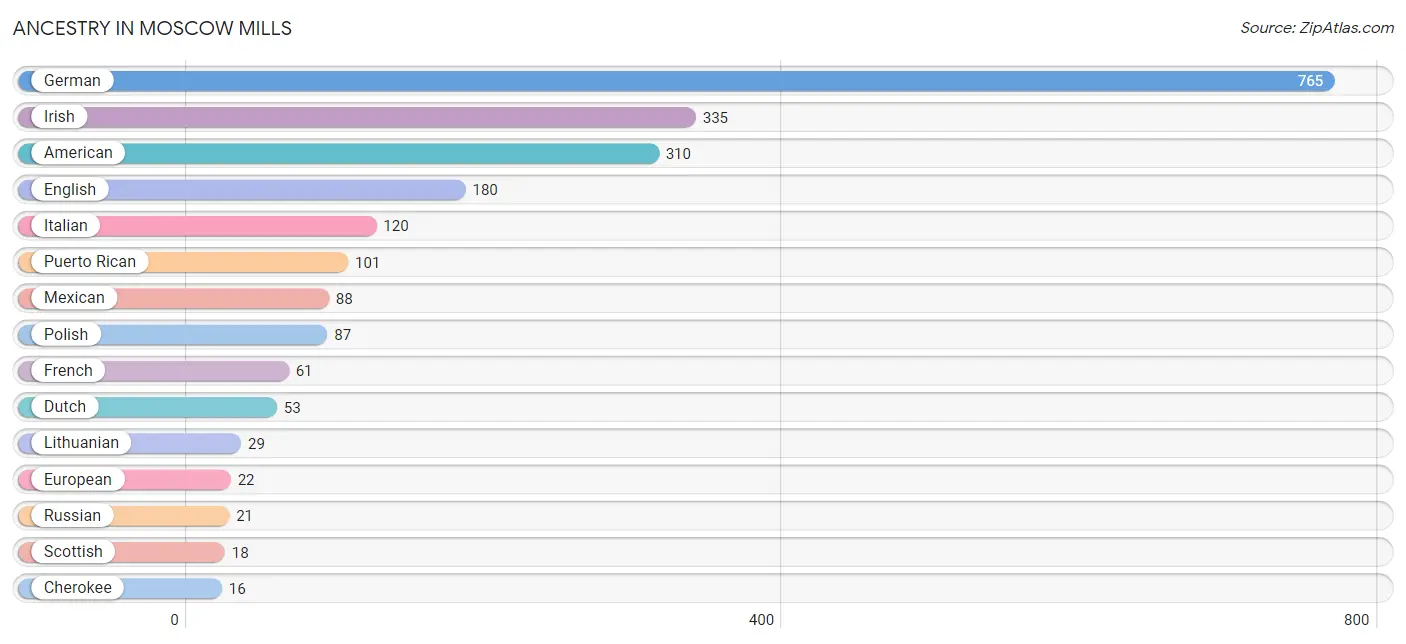
| Ancestry | # Population | % Population |
| American | 310 | 8.8% |
| Celtic | 13 | 0.4% |
| Cherokee | 16 | 0.5% |
| Danish | 7 | 0.2% |
| Dutch | 53 | 1.5% |
| English | 180 | 5.1% |
| European | 22 | 0.6% |
| Finnish | 8 | 0.2% |
| French | 61 | 1.7% |
| German | 765 | 21.8% |
| Indian (Asian) | 13 | 0.4% |
| Irish | 335 | 9.6% |
| Italian | 120 | 3.4% |
| Lithuanian | 29 | 0.8% |
| Mexican | 88 | 2.5% |
| Norwegian | 16 | 0.5% |
| Polish | 87 | 2.5% |
| Puerto Rican | 101 | 2.9% |
| Russian | 21 | 0.6% |
| Scottish | 18 | 0.5% |
| Swedish | 9 | 0.3% | View All 21 Rows |
Immigrants in Moscow Mills
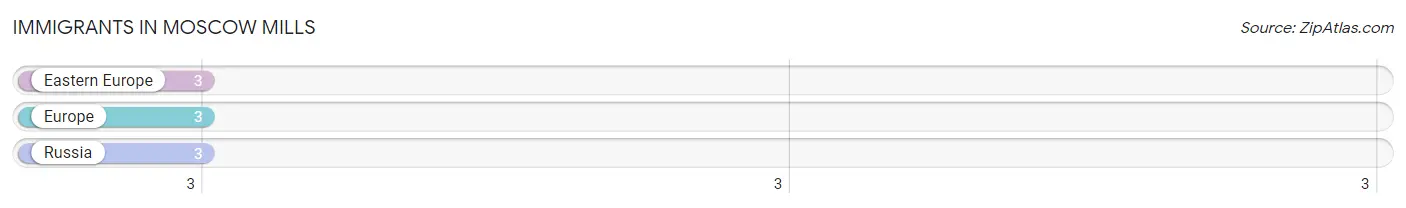
The most numerous immigrant groups reported in Moscow Mills came from Eastern Europe (3 | 0.1%), Europe (3 | 0.1%), and Russia (3 | 0.1%), together accounting for 0.3% of all Moscow Mills residents.
| Immigration Origin | # Population | % Population |
| Eastern Europe | 3 | 0.1% |
| Europe | 3 | 0.1% |
| Russia | 3 | 0.1% | View All 3 Rows |
Sex and Age in Moscow Mills
Sex and Age in Moscow Mills
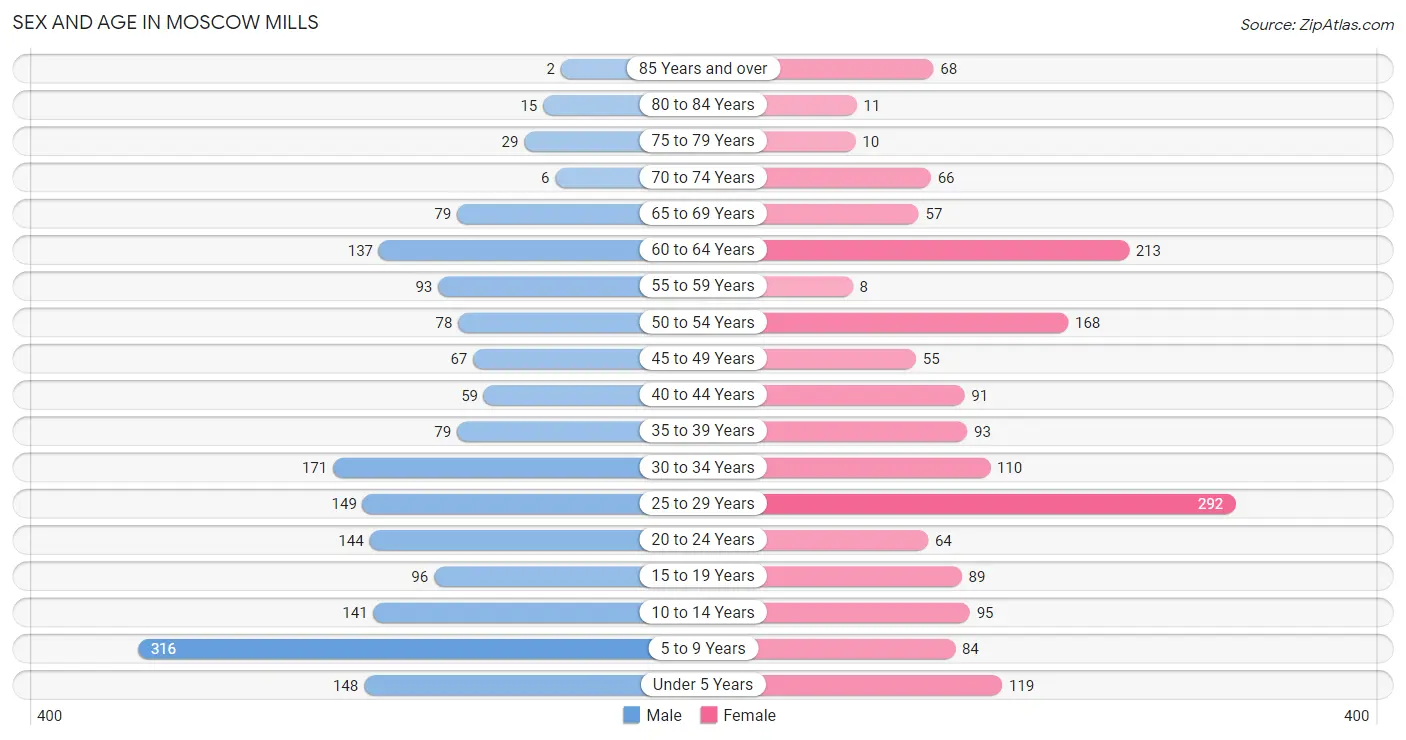
The most populous age groups in Moscow Mills are 5 to 9 Years (316 | 17.5%) for men and 25 to 29 Years (292 | 17.2%) for women.
| Age Bracket | Male | Female |
| Under 5 Years | 148 (8.2%) | 119 (7.0%) |
| 5 to 9 Years | 316 (17.5%) | 84 (5.0%) |
| 10 to 14 Years | 141 (7.8%) | 95 (5.6%) |
| 15 to 19 Years | 96 (5.3%) | 89 (5.3%) |
| 20 to 24 Years | 144 (8.0%) | 64 (3.8%) |
| 25 to 29 Years | 149 (8.2%) | 292 (17.2%) |
| 30 to 34 Years | 171 (9.5%) | 110 (6.5%) |
| 35 to 39 Years | 79 (4.4%) | 93 (5.5%) |
| 40 to 44 Years | 59 (3.3%) | 91 (5.4%) |
| 45 to 49 Years | 67 (3.7%) | 55 (3.3%) |
| 50 to 54 Years | 78 (4.3%) | 168 (9.9%) |
| 55 to 59 Years | 93 (5.1%) | 8 (0.5%) |
| 60 to 64 Years | 137 (7.6%) | 213 (12.6%) |
| 65 to 69 Years | 79 (4.4%) | 57 (3.4%) |
| 70 to 74 Years | 6 (0.3%) | 66 (3.9%) |
| 75 to 79 Years | 29 (1.6%) | 10 (0.6%) |
| 80 to 84 Years | 15 (0.8%) | 11 (0.6%) |
| 85 Years and over | 2 (0.1%) | 68 (4.0%) |
| Total | 1,809 (100.0%) | 1,693 (100.0%) |
Families and Households in Moscow Mills
Median Family Size in Moscow Mills
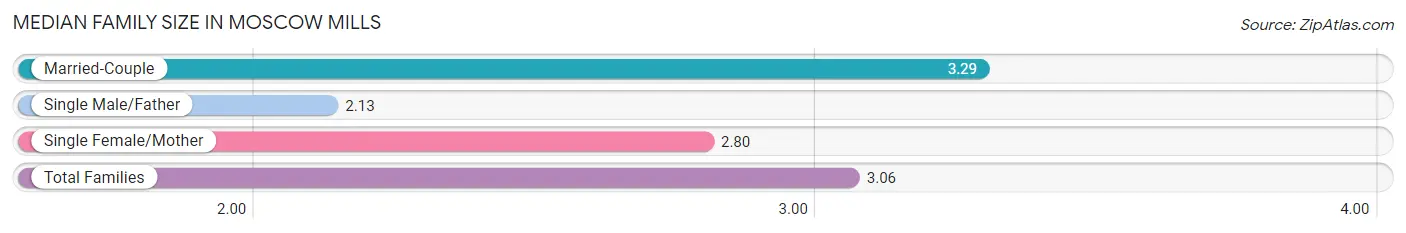
The median family size in Moscow Mills is 3.06 persons per family, with married-couple families (620 | 61.8%) accounting for the largest median family size of 3.29 persons per family. On the other hand, single male/father families (55 | 5.5%) represent the smallest median family size with 2.13 persons per family.
| Family Type | # Families | Family Size |
| Married-Couple | 620 (61.8%) | 3.29 |
| Single Male/Father | 55 (5.5%) | 2.13 |
| Single Female/Mother | 329 (32.8%) | 2.80 |
| Total Families | 1,004 (100.0%) | 3.06 |
Median Household Size in Moscow Mills
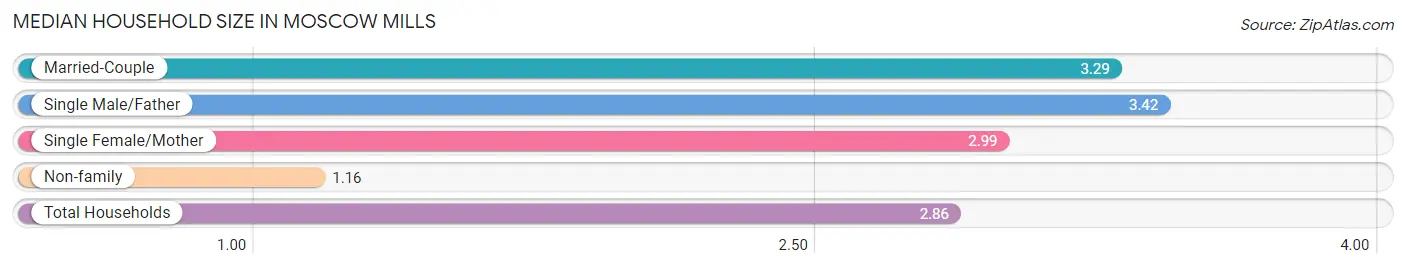
The median household size in Moscow Mills is 2.86 persons per household, with single male/father households (55 | 4.6%) accounting for the largest median household size of 3.42 persons per household. non-family households (196 | 16.3%) represent the smallest median household size with 1.16 persons per household.
| Household Type | # Households | Household Size |
| Married-Couple | 620 (51.7%) | 3.29 |
| Single Male/Father | 55 (4.6%) | 3.42 |
| Single Female/Mother | 329 (27.4%) | 2.99 |
| Non-family | 196 (16.3%) | 1.16 |
| Total Households | 1,200 (100.0%) | 2.86 |
Household Size by Marriage Status in Moscow Mills
Out of a total of 1,200 households in Moscow Mills, 1,004 (83.7%) are family households, while 196 (16.3%) are nonfamily households. The most numerous type of family households are 2-person households, comprising 493, and the most common type of nonfamily households are 1-person households, comprising 172.
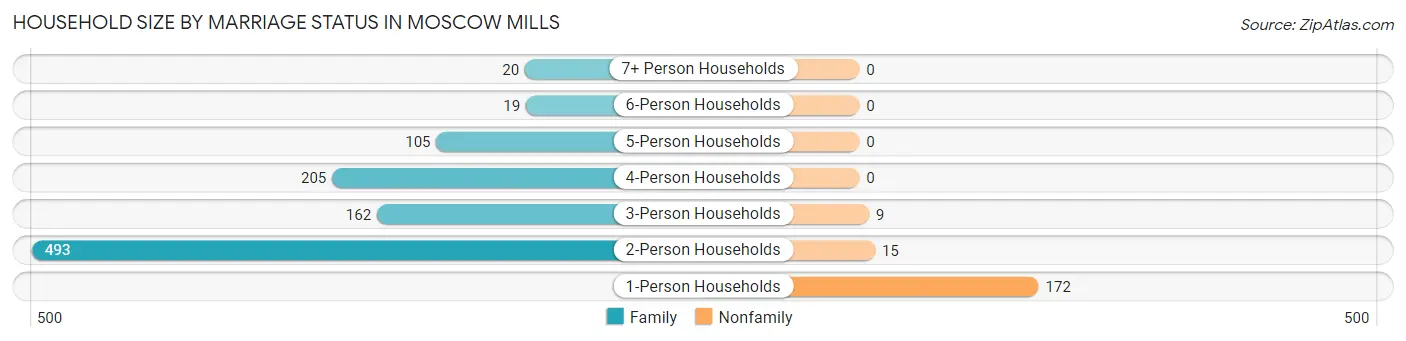
| Household Size | Family Households | Nonfamily Households |
| 1-Person Households | - | 172 (14.3%) |
| 2-Person Households | 493 (41.1%) | 15 (1.3%) |
| 3-Person Households | 162 (13.5%) | 9 (0.7%) |
| 4-Person Households | 205 (17.1%) | 0 (0.0%) |
| 5-Person Households | 105 (8.7%) | 0 (0.0%) |
| 6-Person Households | 19 (1.6%) | 0 (0.0%) |
| 7+ Person Households | 20 (1.7%) | 0 (0.0%) |
| Total | 1,004 (83.7%) | 196 (16.3%) |
Female Fertility in Moscow Mills
Fertility by Age in Moscow Mills
Average fertility rate in Moscow Mills is 46.0 births per 1,000 women. Women in the age bracket of 20 to 34 years have the highest fertility rate with 56.0 births per 1,000 women. Women in the age bracket of 20 to 34 years acount for 66.7% of all women with births.
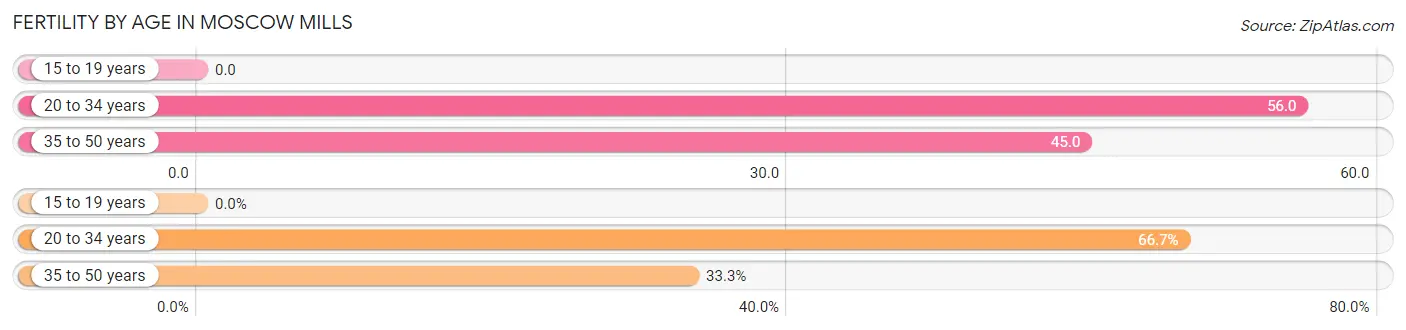
| Age Bracket | Women with Births | Births / 1,000 Women |
| 15 to 19 years | 0 (0.0%) | 0.0 |
| 20 to 34 years | 26 (66.7%) | 56.0 |
| 35 to 50 years | 13 (33.3%) | 45.0 |
| Total | 39 (100.0%) | 46.0 |
Fertility by Age by Marriage Status in Moscow Mills
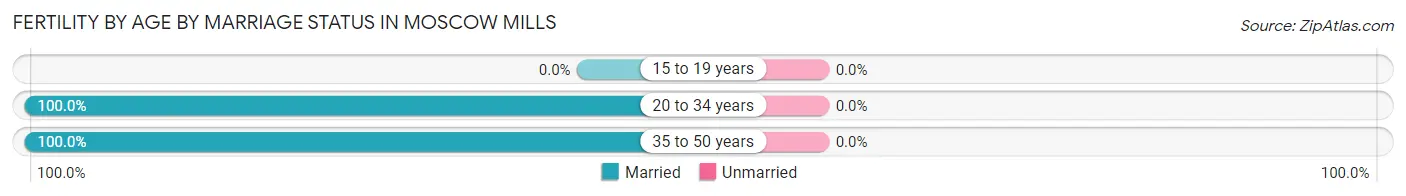
| Age Bracket | Married | Unmarried |
| 15 to 19 years | 0 (0.0%) | 0 (0.0%) |
| 20 to 34 years | 26 (100.0%) | 0 (0.0%) |
| 35 to 50 years | 13 (100.0%) | 0 (0.0%) |
| Total | 39 (100.0%) | 0 (0.0%) |
Fertility by Education in Moscow Mills
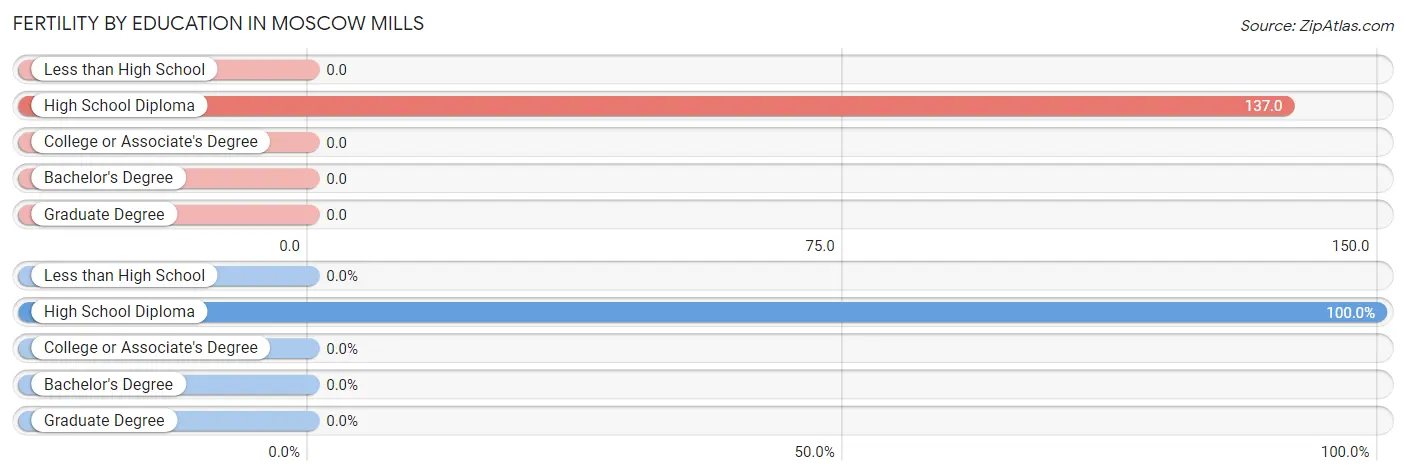
| Educational Attainment | Women with Births | Births / 1,000 Women |
| Less than High School | 0 (0.0%) | 0.0 |
| High School Diploma | 39 (100.0%) | 137.0 |
| College or Associate's Degree | 0 (0.0%) | 0.0 |
| Bachelor's Degree | 0 (0.0%) | 0.0 |
| Graduate Degree | 0 (0.0%) | 0.0 |
| Total | 39 (100.0%) | 46.0 |
Fertility by Education by Marriage Status in Moscow Mills
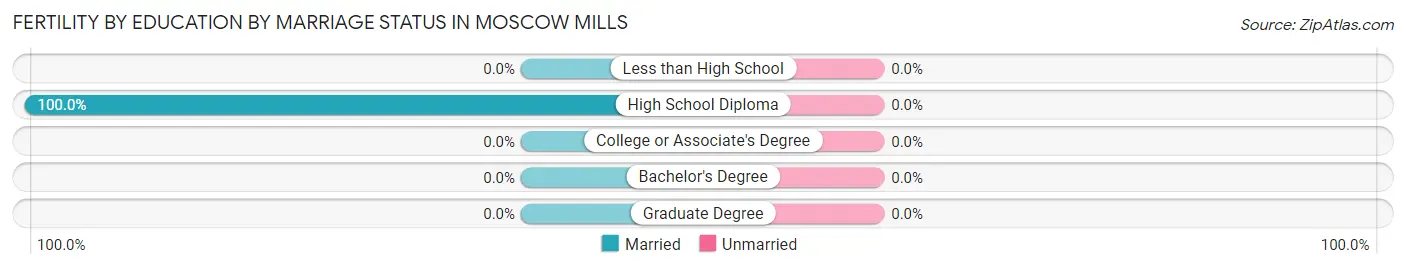
| Educational Attainment | Married | Unmarried |
| Less than High School | 0 (0.0%) | 0 (0.0%) |
| High School Diploma | 39 (100.0%) | 0 (0.0%) |
| College or Associate's Degree | 0 (0.0%) | 0 (0.0%) |
| Bachelor's Degree | 0 (0.0%) | 0 (0.0%) |
| Graduate Degree | 0 (0.0%) | 0 (0.0%) |
| Total | 39 (100.0%) | 0 (0.0%) |
Employment Characteristics in Moscow Mills
Employment by Class of Employer in Moscow Mills
Among the 1,542 employed individuals in Moscow Mills, private company employees (1,196 | 77.6%), self-employed (not incorporated) (88 | 5.7%), and local government employees (84 | 5.4%) make up the most common classes of employment.
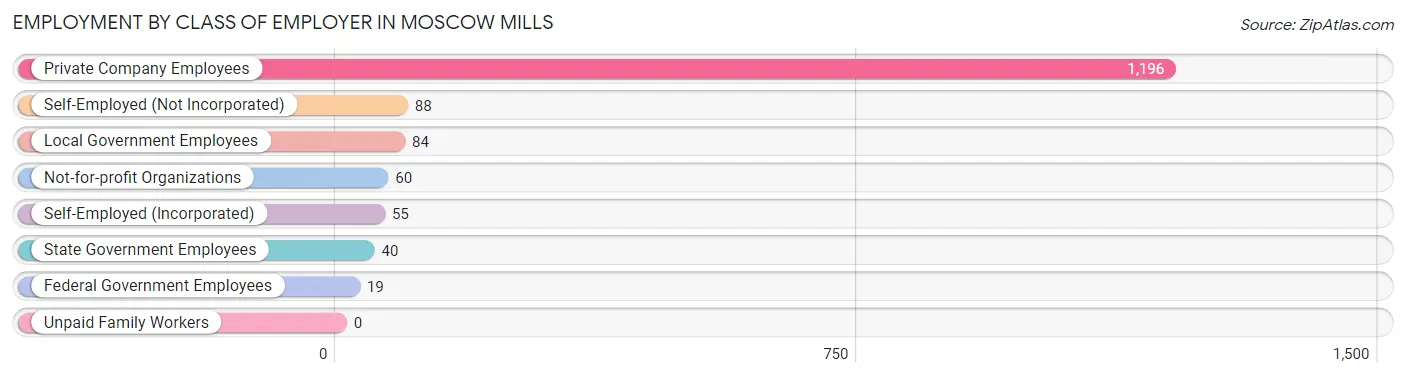
| Employer Class | # Employees | % Employees |
| Private Company Employees | 1,196 | 77.6% |
| Self-Employed (Incorporated) | 55 | 3.6% |
| Self-Employed (Not Incorporated) | 88 | 5.7% |
| Not-for-profit Organizations | 60 | 3.9% |
| Local Government Employees | 84 | 5.4% |
| State Government Employees | 40 | 2.6% |
| Federal Government Employees | 19 | 1.2% |
| Unpaid Family Workers | 0 | 0.0% |
| Total | 1,542 | 100.0% |
Employment Status by Age in Moscow Mills
According to the labor force statistics for Moscow Mills, out of the total population over 16 years of age (2,589), 64.5% or 1,670 individuals are in the labor force, with 7.7% or 129 of them unemployed. The age group with the highest labor force participation rate is 25 to 29 years, with 93.4% or 412 individuals in the labor force. Within the labor force, the 16 to 19 years age range has the highest percentage of unemployed individuals, with 45.7% or 42 of them being unemployed.
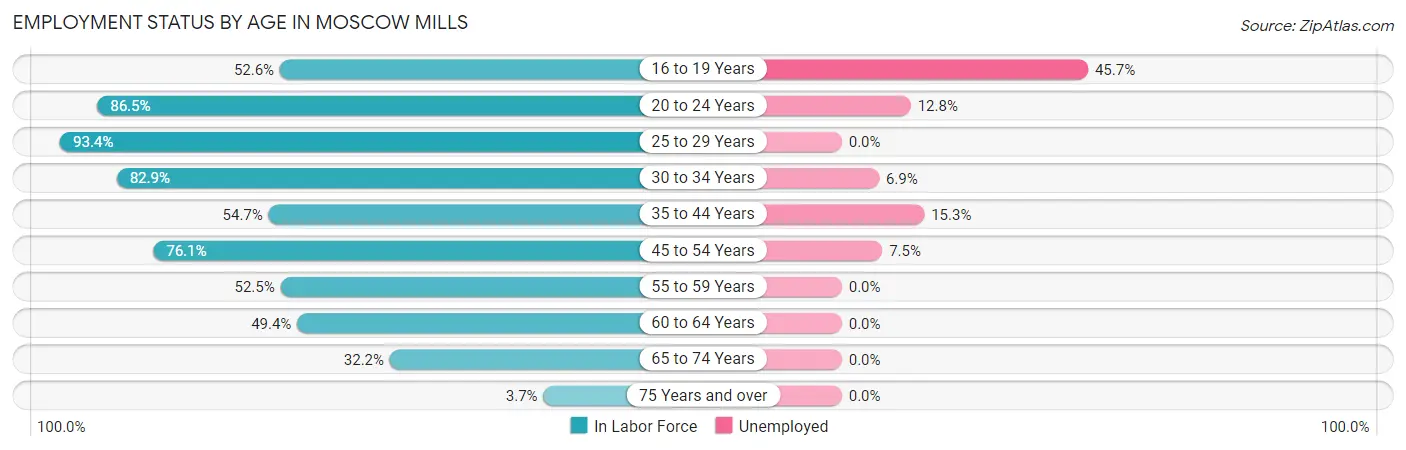
| Age Bracket | In Labor Force | Unemployed |
| 16 to 19 Years | 92 (52.6%) | 42 (45.7%) |
| 20 to 24 Years | 180 (86.5%) | 23 (12.8%) |
| 25 to 29 Years | 412 (93.4%) | 0 (0.0%) |
| 30 to 34 Years | 233 (82.9%) | 16 (6.9%) |
| 35 to 44 Years | 176 (54.7%) | 27 (15.3%) |
| 45 to 54 Years | 280 (76.1%) | 21 (7.5%) |
| 55 to 59 Years | 53 (52.5%) | 0 (0.0%) |
| 60 to 64 Years | 173 (49.4%) | 0 (0.0%) |
| 65 to 74 Years | 67 (32.2%) | 0 (0.0%) |
| 75 Years and over | 5 (3.7%) | 0 (0.0%) |
| Total | 1,670 (64.5%) | 129 (7.7%) |
Employment Status by Educational Attainment in Moscow Mills
According to labor force statistics for Moscow Mills, 71.2% of individuals (1,326) out of the total population between 25 and 64 years of age (1,863) are in the labor force, with 4.8% or 64 of them being unemployed. The group with the highest labor force participation rate are those with the educational attainment of bachelor's degree or higher, with 85.8% or 206 individuals in the labor force. Within the labor force, individuals with less than high school education have the highest percentage of unemployment, with 18.0% or 25 of them being unemployed.
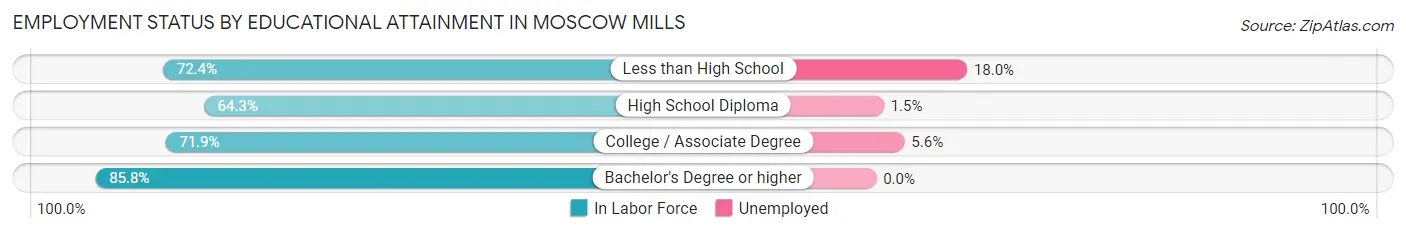
| Educational Attainment | In Labor Force | Unemployed |
| Less than High School | 139 (72.4%) | 35 (18.0%) |
| High School Diploma | 396 (64.3%) | 9 (1.5%) |
| College / Associate Degree | 586 (71.9%) | 46 (5.6%) |
| Bachelor's Degree or higher | 206 (85.8%) | 0 (0.0%) |
| Total | 1,326 (71.2%) | 89 (4.8%) |
Employment Occupations by Sex in Moscow Mills
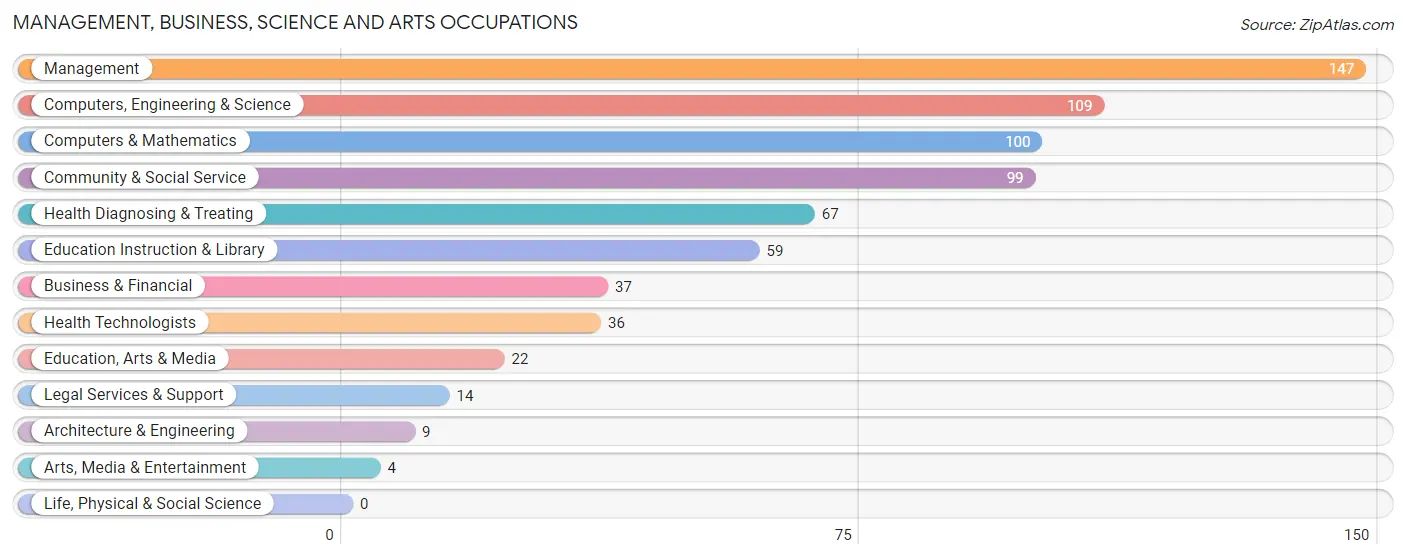
Management, Business, Science and Arts Occupations
The most common Management, Business, Science and Arts occupations in Moscow Mills are Management (147 | 9.5%), Computers, Engineering & Science (109 | 7.1%), Computers & Mathematics (100 | 6.5%), Community & Social Service (99 | 6.4%), and Health Diagnosing & Treating (67 | 4.3%).
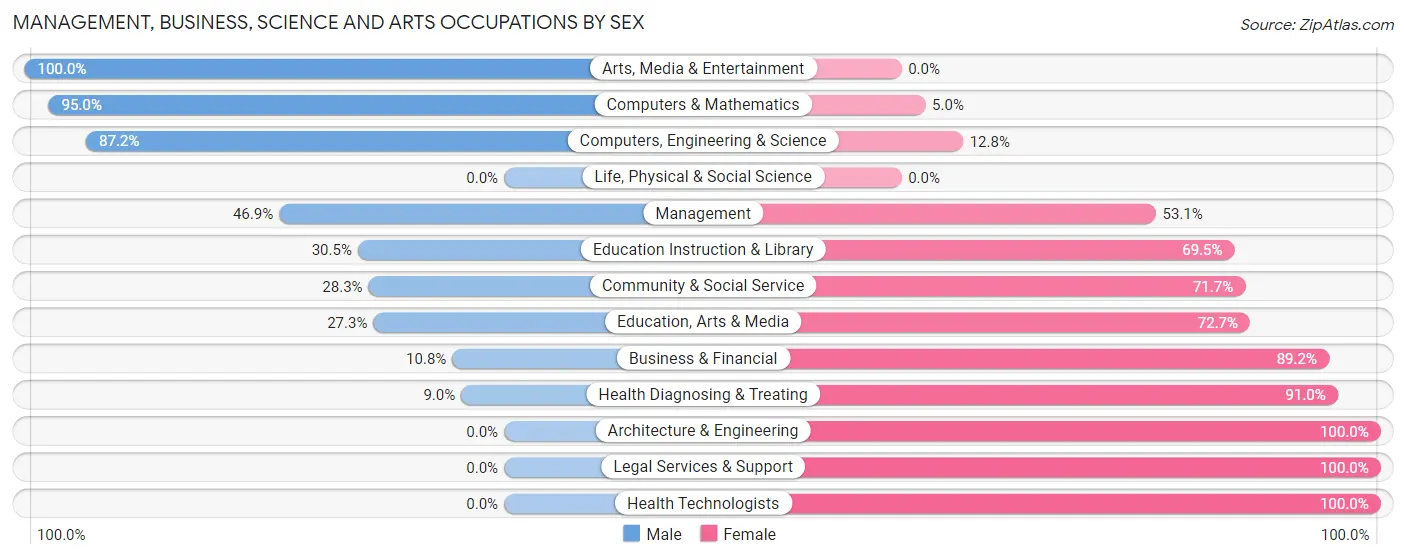
Management, Business, Science and Arts Occupations by Sex
Within the Management, Business, Science and Arts occupations in Moscow Mills, the most male-oriented occupations are Arts, Media & Entertainment (100.0%), Computers & Mathematics (95.0%), and Computers, Engineering & Science (87.2%), while the most female-oriented occupations are Architecture & Engineering (100.0%), Legal Services & Support (100.0%), and Health Technologists (100.0%).
| Occupation | Male | Female |
| Management | 69 (46.9%) | 78 (53.1%) |
| Business & Financial | 4 (10.8%) | 33 (89.2%) |
| Computers, Engineering & Science | 95 (87.2%) | 14 (12.8%) |
| Computers & Mathematics | 95 (95.0%) | 5 (5.0%) |
| Architecture & Engineering | 0 (0.0%) | 9 (100.0%) |
| Life, Physical & Social Science | 0 (0.0%) | 0 (0.0%) |
| Community & Social Service | 28 (28.3%) | 71 (71.7%) |
| Education, Arts & Media | 6 (27.3%) | 16 (72.7%) |
| Legal Services & Support | 0 (0.0%) | 14 (100.0%) |
| Education Instruction & Library | 18 (30.5%) | 41 (69.5%) |
| Arts, Media & Entertainment | 4 (100.0%) | 0 (0.0%) |
| Health Diagnosing & Treating | 6 (9.0%) | 61 (91.0%) |
| Health Technologists | 0 (0.0%) | 36 (100.0%) |
| Total (Category) | 202 (44.0%) | 257 (56.0%) |
| Total (Overall) | 823 (53.4%) | 719 (46.6%) |
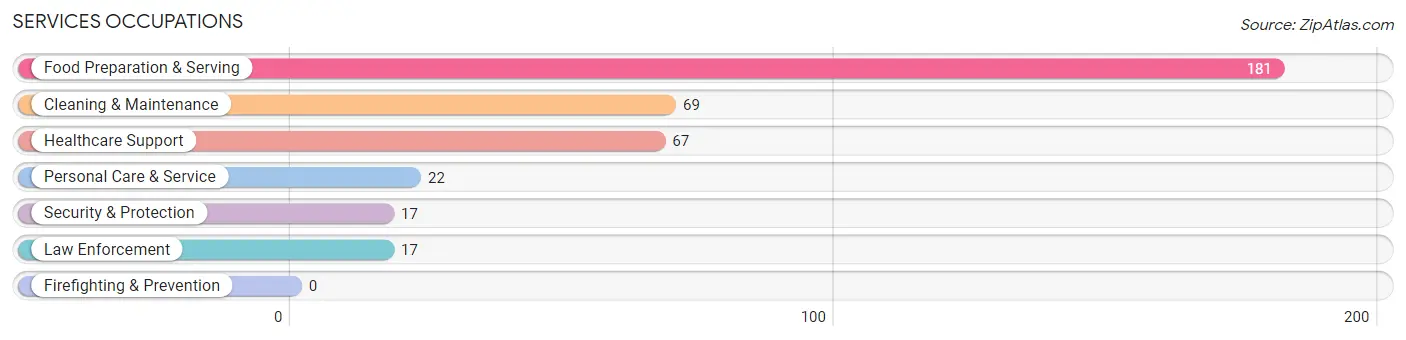
Services Occupations
The most common Services occupations in Moscow Mills are Food Preparation & Serving (181 | 11.7%), Cleaning & Maintenance (69 | 4.5%), Healthcare Support (67 | 4.3%), Personal Care & Service (22 | 1.4%), and Security & Protection (17 | 1.1%).
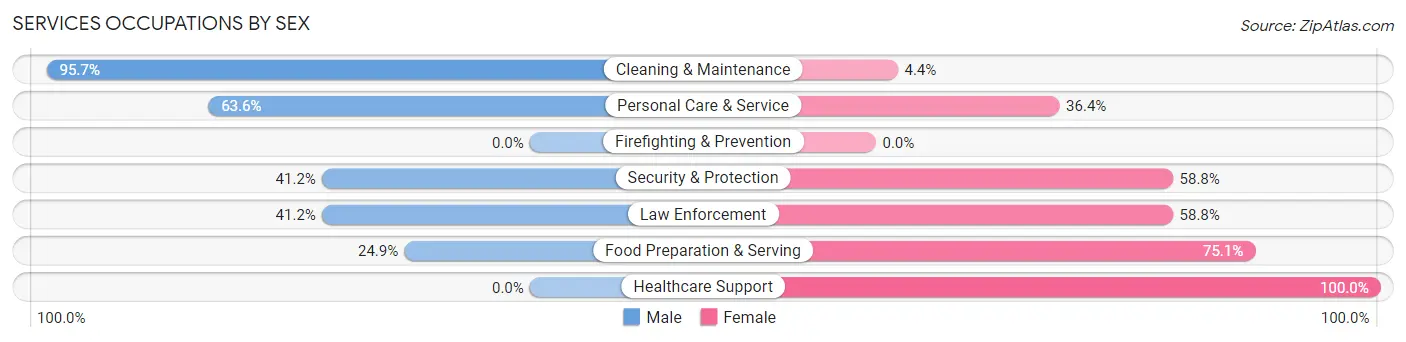
Services Occupations by Sex
Within the Services occupations in Moscow Mills, the most male-oriented occupations are Cleaning & Maintenance (95.7%), Personal Care & Service (63.6%), and Security & Protection (41.2%), while the most female-oriented occupations are Healthcare Support (100.0%), Food Preparation & Serving (75.1%), and Security & Protection (58.8%).
| Occupation | Male | Female |
| Healthcare Support | 0 (0.0%) | 67 (100.0%) |
| Security & Protection | 7 (41.2%) | 10 (58.8%) |
| Firefighting & Prevention | 0 (0.0%) | 0 (0.0%) |
| Law Enforcement | 7 (41.2%) | 10 (58.8%) |
| Food Preparation & Serving | 45 (24.9%) | 136 (75.1%) |
| Cleaning & Maintenance | 66 (95.7%) | 3 (4.3%) |
| Personal Care & Service | 14 (63.6%) | 8 (36.4%) |
| Total (Category) | 132 (37.1%) | 224 (62.9%) |
| Total (Overall) | 823 (53.4%) | 719 (46.6%) |
Sales and Office Occupations
The most common Sales and Office occupations in Moscow Mills are Office & Administration (144 | 9.3%), and Sales & Related (97 | 6.3%).
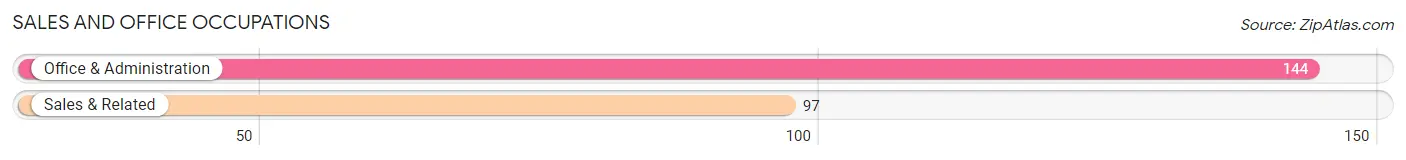
Sales and Office Occupations by Sex

| Occupation | Male | Female |
| Sales & Related | 59 (60.8%) | 38 (39.2%) |
| Office & Administration | 26 (18.1%) | 118 (81.9%) |
| Total (Category) | 85 (35.3%) | 156 (64.7%) |
| Total (Overall) | 823 (53.4%) | 719 (46.6%) |
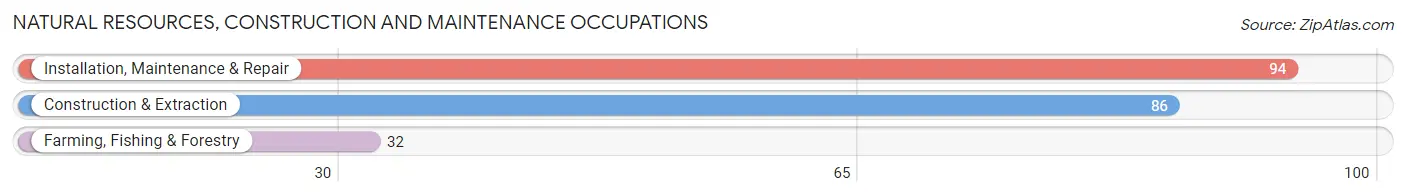
Natural Resources, Construction and Maintenance Occupations
The most common Natural Resources, Construction and Maintenance occupations in Moscow Mills are Installation, Maintenance & Repair (94 | 6.1%), Construction & Extraction (86 | 5.6%), and Farming, Fishing & Forestry (32 | 2.1%).
Natural Resources, Construction and Maintenance Occupations by Sex
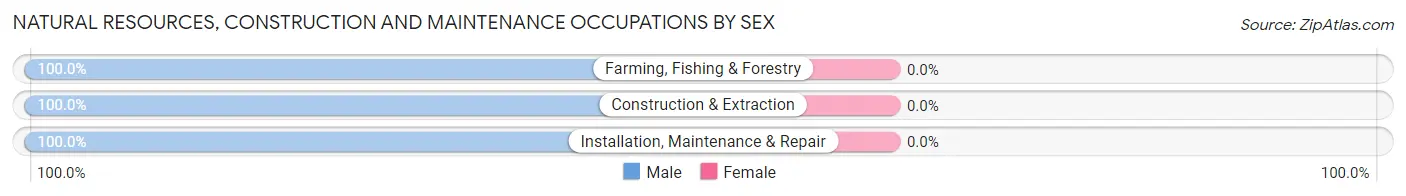
| Occupation | Male | Female |
| Farming, Fishing & Forestry | 32 (100.0%) | 0 (0.0%) |
| Construction & Extraction | 86 (100.0%) | 0 (0.0%) |
| Installation, Maintenance & Repair | 94 (100.0%) | 0 (0.0%) |
| Total (Category) | 212 (100.0%) | 0 (0.0%) |
| Total (Overall) | 823 (53.4%) | 719 (46.6%) |
Production, Transportation and Moving Occupations
The most common Production, Transportation and Moving occupations in Moscow Mills are Transportation (107 | 6.9%), Production (86 | 5.6%), and Material Moving (81 | 5.2%).
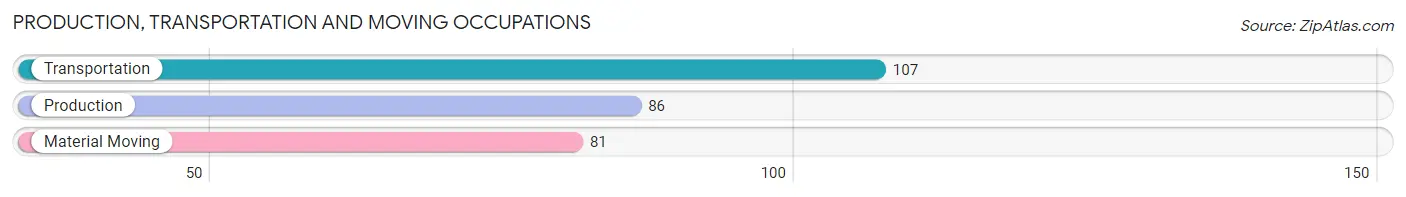
Production, Transportation and Moving Occupations by Sex
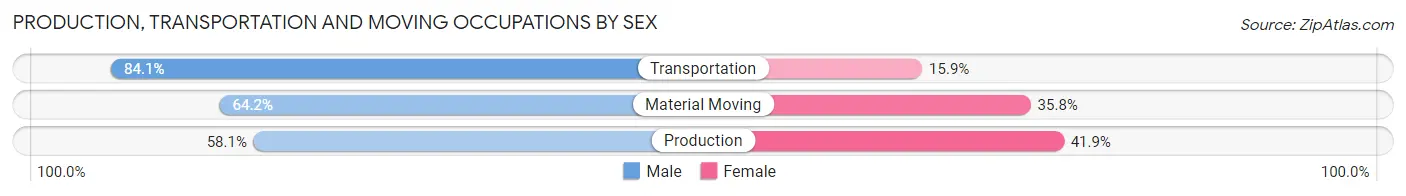
| Occupation | Male | Female |
| Production | 50 (58.1%) | 36 (41.9%) |
| Transportation | 90 (84.1%) | 17 (15.9%) |
| Material Moving | 52 (64.2%) | 29 (35.8%) |
| Total (Category) | 192 (70.1%) | 82 (29.9%) |
| Total (Overall) | 823 (53.4%) | 719 (46.6%) |
Employment Industries by Sex in Moscow Mills
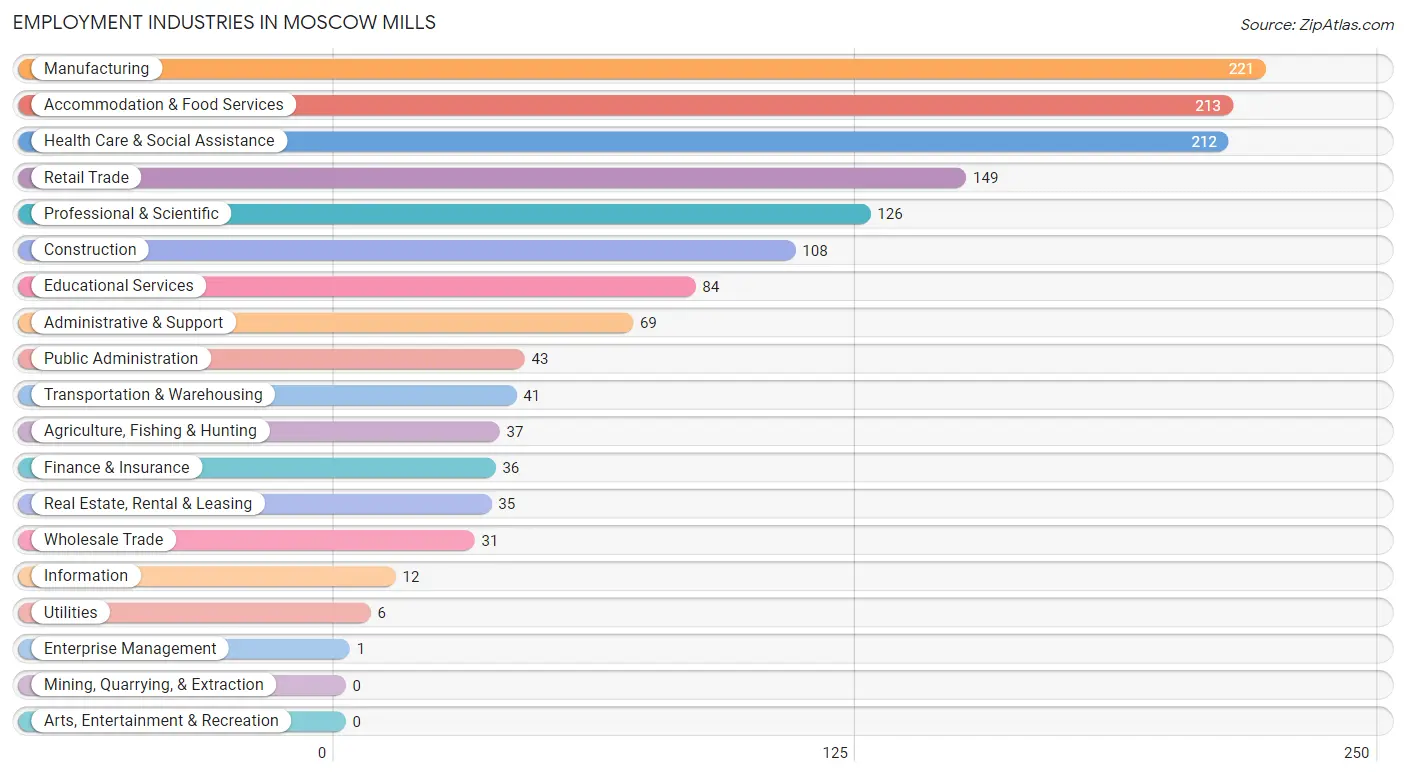
Employment Industries in Moscow Mills
The major employment industries in Moscow Mills include Manufacturing (221 | 14.3%), Accommodation & Food Services (213 | 13.8%), Health Care & Social Assistance (212 | 13.8%), Retail Trade (149 | 9.7%), and Professional & Scientific (126 | 8.2%).
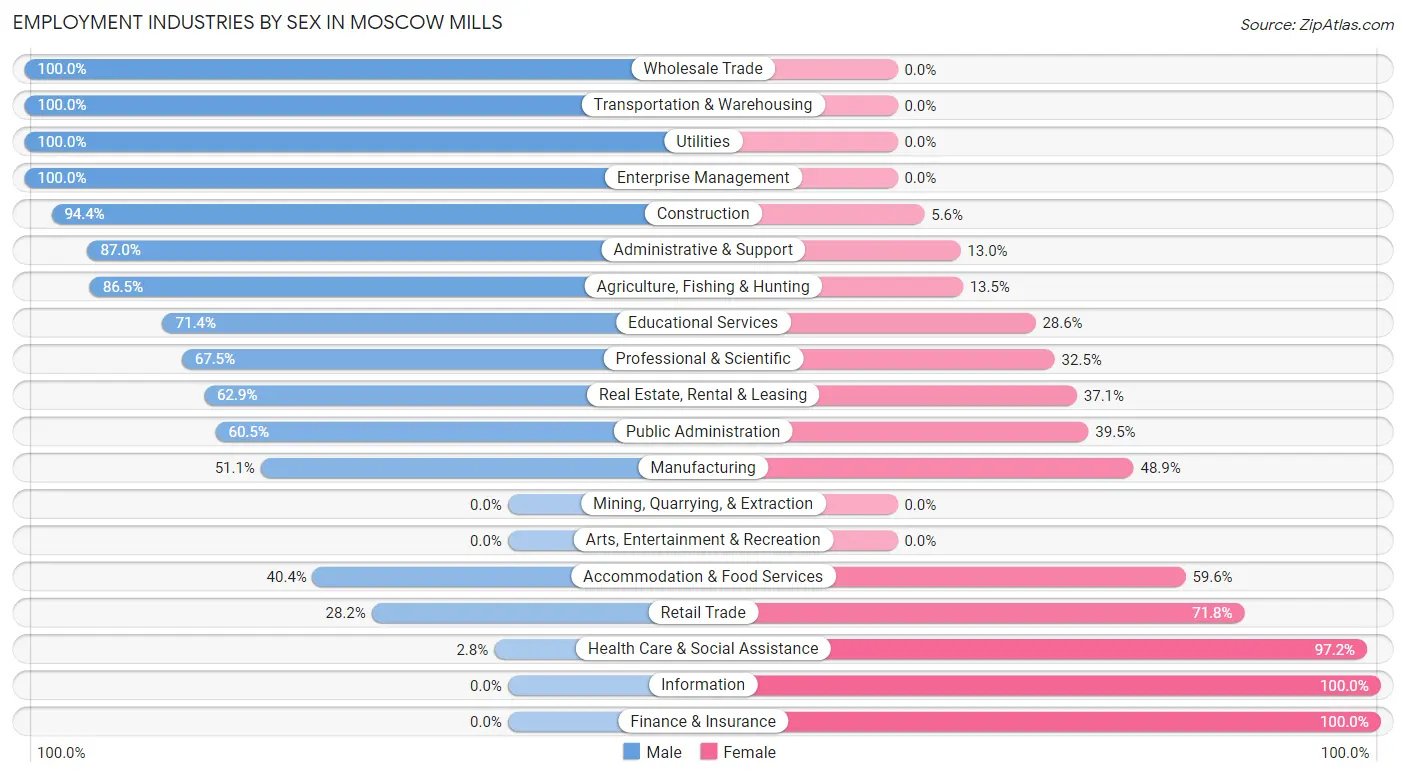
Employment Industries by Sex in Moscow Mills
The Moscow Mills industries that see more men than women are Wholesale Trade (100.0%), Transportation & Warehousing (100.0%), and Utilities (100.0%), whereas the industries that tend to have a higher number of women are Information (100.0%), Finance & Insurance (100.0%), and Health Care & Social Assistance (97.2%).
| Industry | Male | Female |
| Agriculture, Fishing & Hunting | 32 (86.5%) | 5 (13.5%) |
| Mining, Quarrying, & Extraction | 0 (0.0%) | 0 (0.0%) |
| Construction | 102 (94.4%) | 6 (5.6%) |
| Manufacturing | 113 (51.1%) | 108 (48.9%) |
| Wholesale Trade | 31 (100.0%) | 0 (0.0%) |
| Retail Trade | 42 (28.2%) | 107 (71.8%) |
| Transportation & Warehousing | 41 (100.0%) | 0 (0.0%) |
| Utilities | 6 (100.0%) | 0 (0.0%) |
| Information | 0 (0.0%) | 12 (100.0%) |
| Finance & Insurance | 0 (0.0%) | 36 (100.0%) |
| Real Estate, Rental & Leasing | 22 (62.9%) | 13 (37.1%) |
| Professional & Scientific | 85 (67.5%) | 41 (32.5%) |
| Enterprise Management | 1 (100.0%) | 0 (0.0%) |
| Administrative & Support | 60 (87.0%) | 9 (13.0%) |
| Educational Services | 60 (71.4%) | 24 (28.6%) |
| Health Care & Social Assistance | 6 (2.8%) | 206 (97.2%) |
| Arts, Entertainment & Recreation | 0 (0.0%) | 0 (0.0%) |
| Accommodation & Food Services | 86 (40.4%) | 127 (59.6%) |
| Public Administration | 26 (60.5%) | 17 (39.5%) |
| Total | 823 (53.4%) | 719 (46.6%) |
Education in Moscow Mills
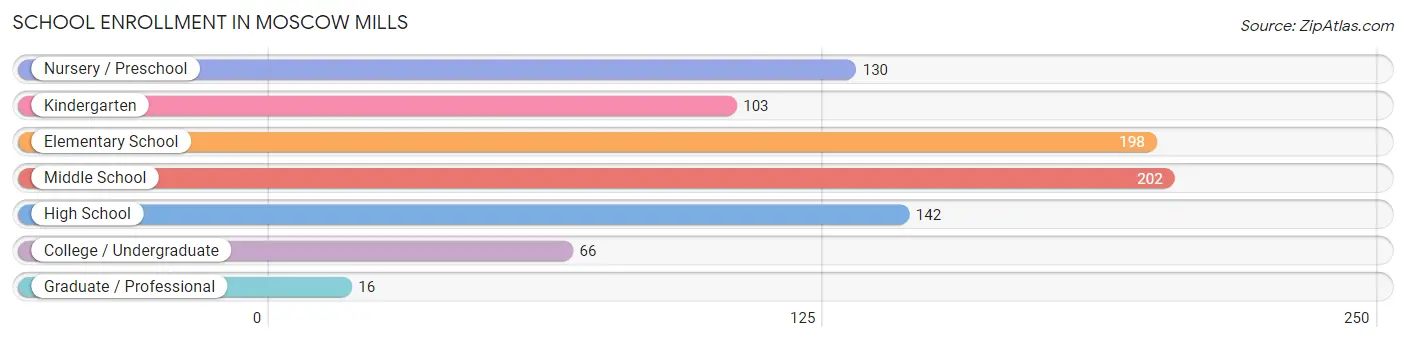
School Enrollment in Moscow Mills
The most common levels of schooling among the 857 students in Moscow Mills are middle school (202 | 23.6%), elementary school (198 | 23.1%), and high school (142 | 16.6%).
| School Level | # Students | % Students |
| Nursery / Preschool | 130 | 15.2% |
| Kindergarten | 103 | 12.0% |
| Elementary School | 198 | 23.1% |
| Middle School | 202 | 23.6% |
| High School | 142 | 16.6% |
| College / Undergraduate | 66 | 7.7% |
| Graduate / Professional | 16 | 1.9% |
| Total | 857 | 100.0% |
School Enrollment by Age by Funding Source in Moscow Mills
Out of a total of 857 students who are enrolled in schools in Moscow Mills, 82 (9.6%) attend a private institution, while the remaining 775 (90.4%) are enrolled in public schools. The age group of 3 to 4 year olds has the highest likelihood of being enrolled in private schools, with 67 (100.0% in the age bracket) enrolled. Conversely, the age group of 5 to 9 year old has the lowest likelihood of being enrolled in a private school, with 359 (100.0% in the age bracket) attending a public institution.
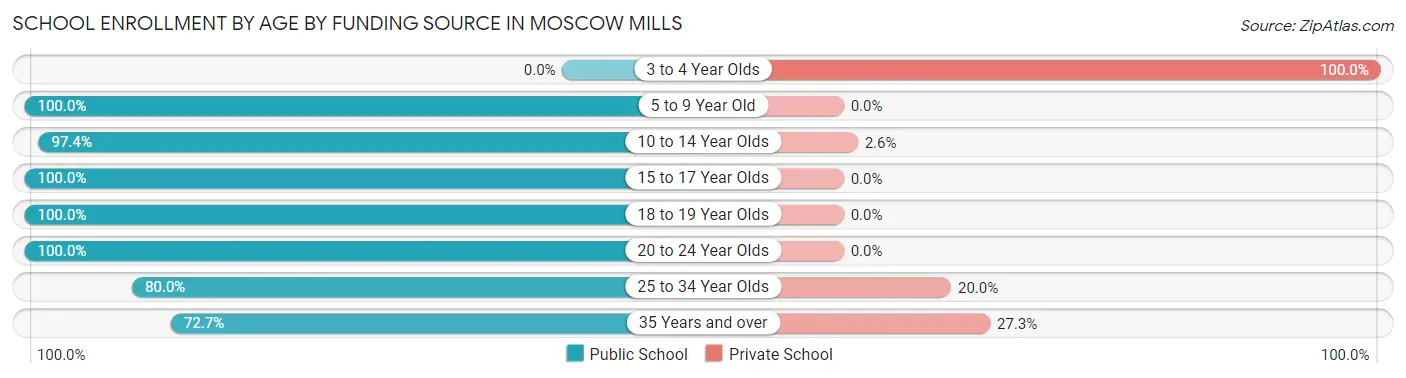
| Age Bracket | Public School | Private School |
| 3 to 4 Year Olds | 0 (0.0%) | 67 (100.0%) |
| 5 to 9 Year Old | 359 (100.0%) | 0 (0.0%) |
| 10 to 14 Year Olds | 224 (97.4%) | 6 (2.6%) |
| 15 to 17 Year Olds | 82 (100.0%) | 0 (0.0%) |
| 18 to 19 Year Olds | 49 (100.0%) | 0 (0.0%) |
| 20 to 24 Year Olds | 33 (100.0%) | 0 (0.0%) |
| 25 to 34 Year Olds | 12 (80.0%) | 3 (20.0%) |
| 35 Years and over | 16 (72.7%) | 6 (27.3%) |
| Total | 775 (90.4%) | 82 (9.6%) |
Educational Attainment by Field of Study in Moscow Mills
Business (90 | 34.4%), education (42 | 16.0%), arts & humanities (34 | 13.0%), psychology (26 | 9.9%), and science & technology (20 | 7.6%) are the most common fields of study among 262 individuals in Moscow Mills who have obtained a bachelor's degree or higher.
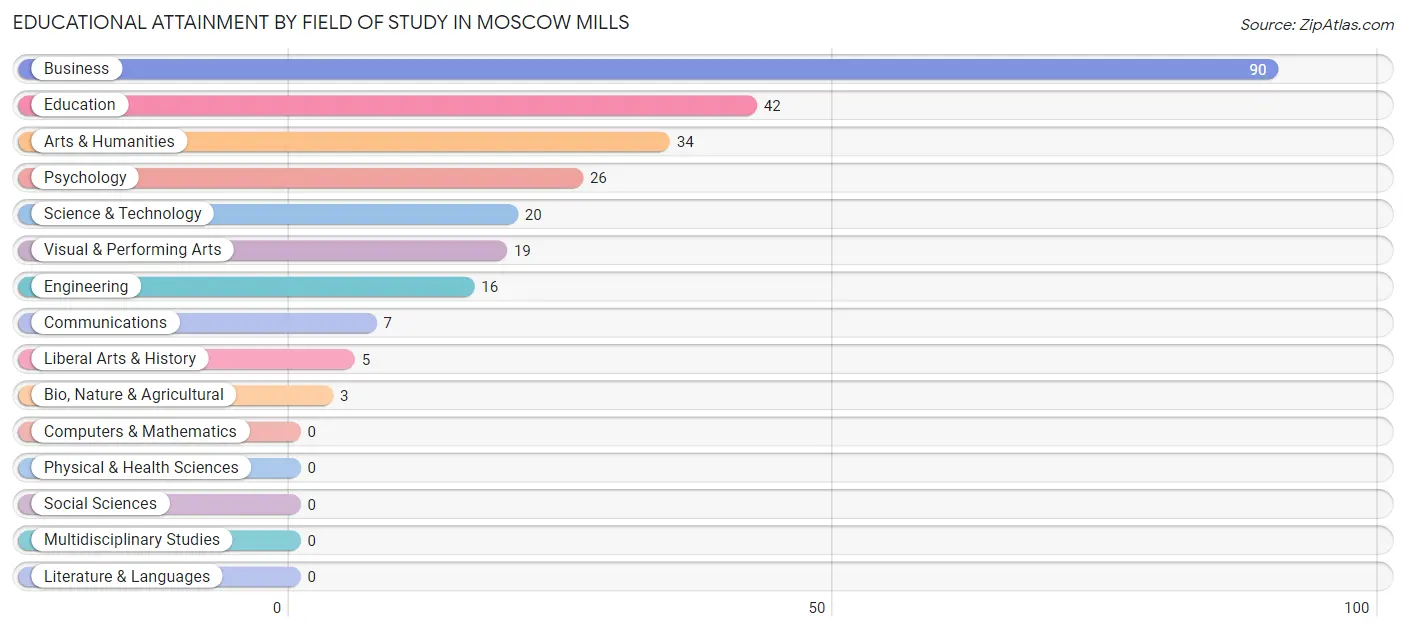
| Field of Study | # Graduates | % Graduates |
| Computers & Mathematics | 0 | 0.0% |
| Bio, Nature & Agricultural | 3 | 1.1% |
| Physical & Health Sciences | 0 | 0.0% |
| Psychology | 26 | 9.9% |
| Social Sciences | 0 | 0.0% |
| Engineering | 16 | 6.1% |
| Multidisciplinary Studies | 0 | 0.0% |
| Science & Technology | 20 | 7.6% |
| Business | 90 | 34.4% |
| Education | 42 | 16.0% |
| Literature & Languages | 0 | 0.0% |
| Liberal Arts & History | 5 | 1.9% |
| Visual & Performing Arts | 19 | 7.2% |
| Communications | 7 | 2.7% |
| Arts & Humanities | 34 | 13.0% |
| Total | 262 | 100.0% |
Transportation & Commute in Moscow Mills
Vehicle Availability by Sex in Moscow Mills
The most prevalent vehicle ownership categories in Moscow Mills are males with 2 vehicles (411, accounting for 49.9%) and females with 2 vehicles (301, making up 57.2%).
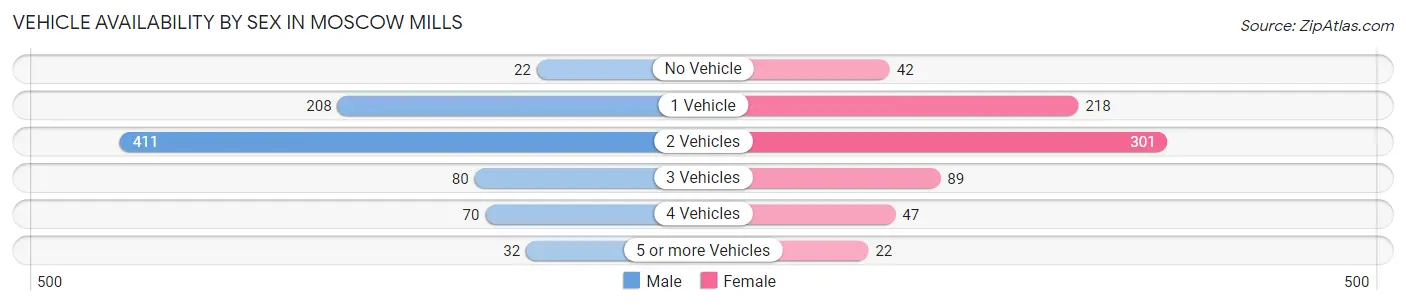
| Vehicles Available | Male | Female |
| No Vehicle | 22 (2.7%) | 42 (5.8%) |
| 1 Vehicle | 208 (25.3%) | 218 (30.3%) |
| 2 Vehicles | 411 (49.9%) | 301 (41.9%) |
| 3 Vehicles | 80 (9.7%) | 89 (12.4%) |
| 4 Vehicles | 70 (8.5%) | 47 (6.5%) |
| 5 or more Vehicles | 32 (3.9%) | 22 (3.1%) |
| Total | 823 (100.0%) | 719 (100.0%) |
Commute Time in Moscow Mills
The most frequently occuring commute durations in Moscow Mills are 45 to 59 minutes (215 commuters, 14.1%), 30 to 34 minutes (200 commuters, 13.1%), and 15 to 19 minutes (187 commuters, 12.2%).
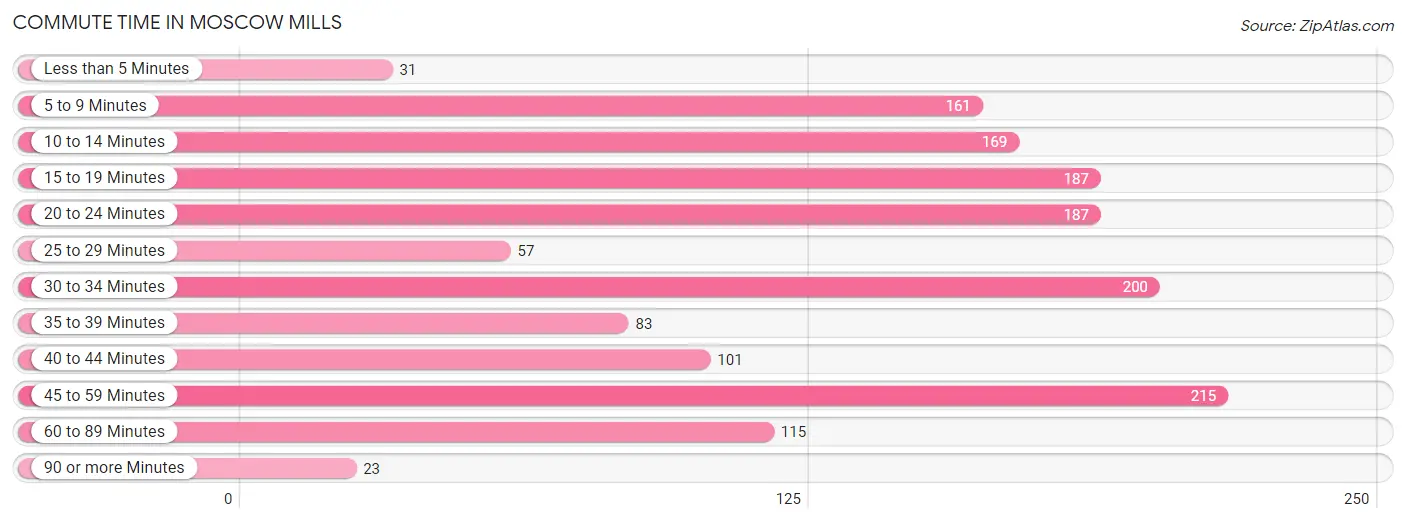
| Commute Time | # Commuters | % Commuters |
| Less than 5 Minutes | 31 | 2.0% |
| 5 to 9 Minutes | 161 | 10.5% |
| 10 to 14 Minutes | 169 | 11.1% |
| 15 to 19 Minutes | 187 | 12.2% |
| 20 to 24 Minutes | 187 | 12.2% |
| 25 to 29 Minutes | 57 | 3.7% |
| 30 to 34 Minutes | 200 | 13.1% |
| 35 to 39 Minutes | 83 | 5.4% |
| 40 to 44 Minutes | 101 | 6.6% |
| 45 to 59 Minutes | 215 | 14.1% |
| 60 to 89 Minutes | 115 | 7.5% |
| 90 or more Minutes | 23 | 1.5% |
Commute Time by Sex in Moscow Mills
The most common commute times in Moscow Mills are 5 to 9 minutes (140 commuters, 17.0%) for males and 45 to 59 minutes (134 commuters, 19.0%) for females.
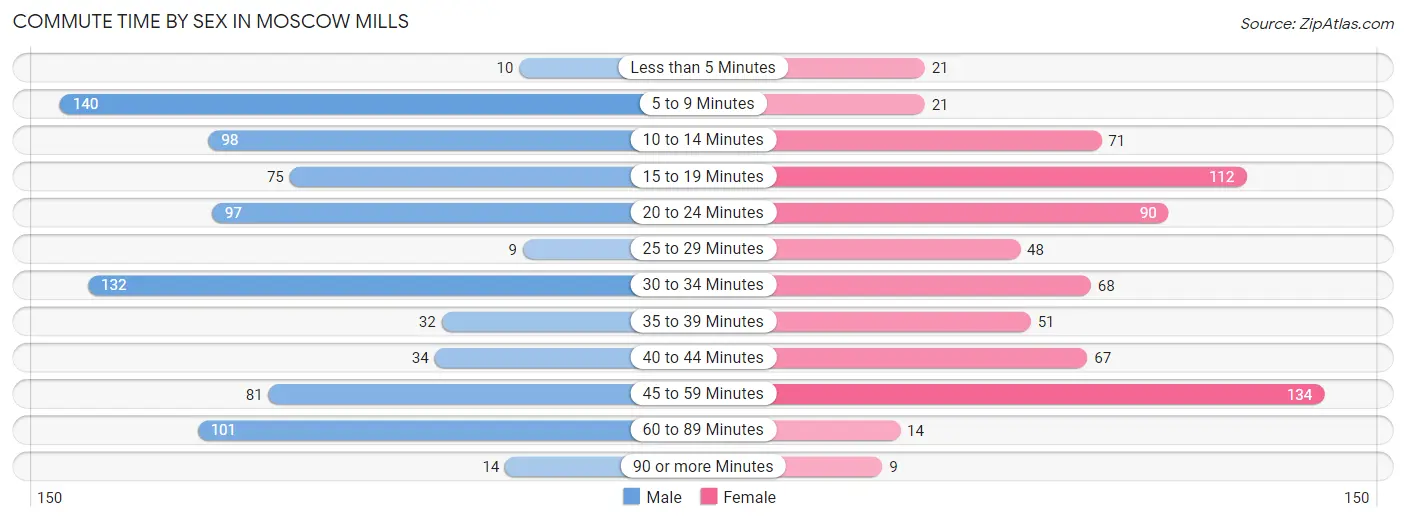
| Commute Time | Male | Female |
| Less than 5 Minutes | 10 (1.2%) | 21 (3.0%) |
| 5 to 9 Minutes | 140 (17.0%) | 21 (3.0%) |
| 10 to 14 Minutes | 98 (11.9%) | 71 (10.1%) |
| 15 to 19 Minutes | 75 (9.1%) | 112 (15.9%) |
| 20 to 24 Minutes | 97 (11.8%) | 90 (12.8%) |
| 25 to 29 Minutes | 9 (1.1%) | 48 (6.8%) |
| 30 to 34 Minutes | 132 (16.0%) | 68 (9.6%) |
| 35 to 39 Minutes | 32 (3.9%) | 51 (7.2%) |
| 40 to 44 Minutes | 34 (4.1%) | 67 (9.5%) |
| 45 to 59 Minutes | 81 (9.8%) | 134 (19.0%) |
| 60 to 89 Minutes | 101 (12.3%) | 14 (2.0%) |
| 90 or more Minutes | 14 (1.7%) | 9 (1.3%) |
Time of Departure to Work by Sex in Moscow Mills
The most frequent times of departure to work in Moscow Mills are 4:00 PM to 11:59 PM (121, 14.7%) for males and 6:30 AM to 6:59 AM (134, 19.0%) for females.
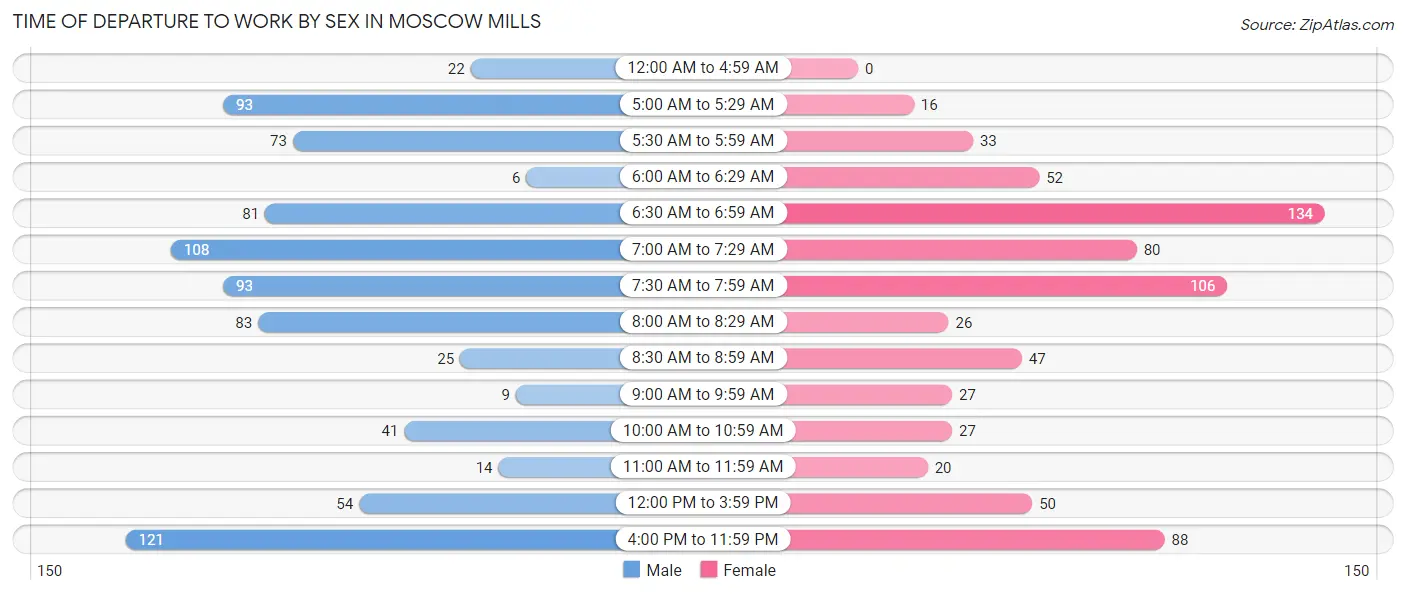
| Time of Departure | Male | Female |
| 12:00 AM to 4:59 AM | 22 (2.7%) | 0 (0.0%) |
| 5:00 AM to 5:29 AM | 93 (11.3%) | 16 (2.3%) |
| 5:30 AM to 5:59 AM | 73 (8.9%) | 33 (4.7%) |
| 6:00 AM to 6:29 AM | 6 (0.7%) | 52 (7.4%) |
| 6:30 AM to 6:59 AM | 81 (9.8%) | 134 (19.0%) |
| 7:00 AM to 7:29 AM | 108 (13.1%) | 80 (11.3%) |
| 7:30 AM to 7:59 AM | 93 (11.3%) | 106 (15.0%) |
| 8:00 AM to 8:29 AM | 83 (10.1%) | 26 (3.7%) |
| 8:30 AM to 8:59 AM | 25 (3.0%) | 47 (6.7%) |
| 9:00 AM to 9:59 AM | 9 (1.1%) | 27 (3.8%) |
| 10:00 AM to 10:59 AM | 41 (5.0%) | 27 (3.8%) |
| 11:00 AM to 11:59 AM | 14 (1.7%) | 20 (2.8%) |
| 12:00 PM to 3:59 PM | 54 (6.6%) | 50 (7.1%) |
| 4:00 PM to 11:59 PM | 121 (14.7%) | 88 (12.5%) |
| Total | 823 (100.0%) | 706 (100.0%) |
Housing Occupancy in Moscow Mills
Occupancy by Ownership in Moscow Mills
Of the total 1,200 dwellings in Moscow Mills, owner-occupied units account for 880 (73.3%), while renter-occupied units make up 320 (26.7%).
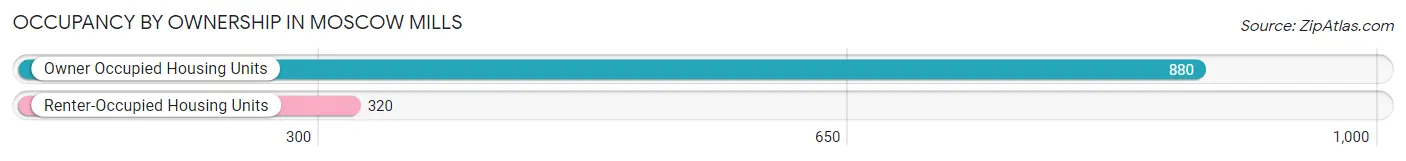
| Occupancy | # Housing Units | % Housing Units |
| Owner Occupied Housing Units | 880 | 73.3% |
| Renter-Occupied Housing Units | 320 | 26.7% |
| Total Occupied Housing Units | 1,200 | 100.0% |
Occupancy by Household Size in Moscow Mills
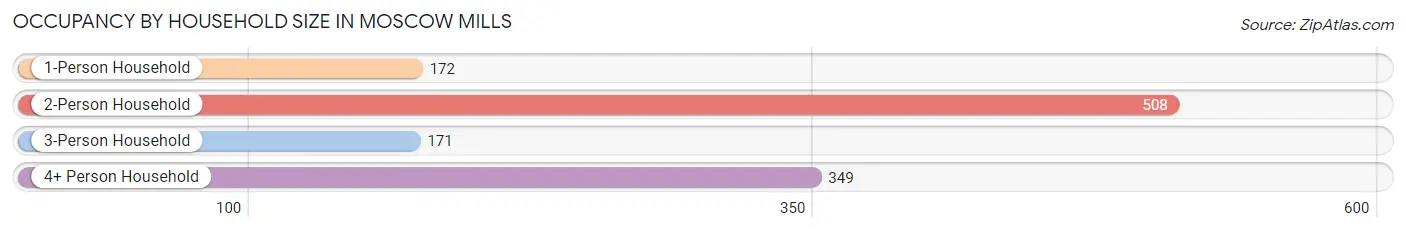
| Household Size | # Housing Units | % Housing Units |
| 1-Person Household | 172 | 14.3% |
| 2-Person Household | 508 | 42.3% |
| 3-Person Household | 171 | 14.2% |
| 4+ Person Household | 349 | 29.1% |
| Total Housing Units | 1,200 | 100.0% |
Occupancy by Ownership by Household Size in Moscow Mills
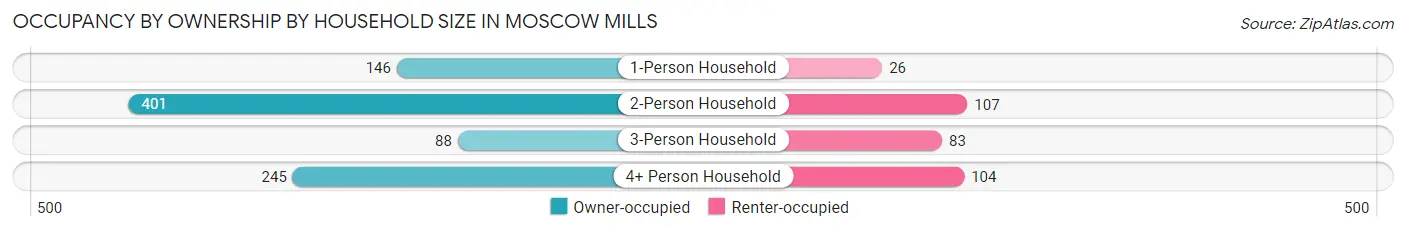
| Household Size | Owner-occupied | Renter-occupied |
| 1-Person Household | 146 (84.9%) | 26 (15.1%) |
| 2-Person Household | 401 (78.9%) | 107 (21.1%) |
| 3-Person Household | 88 (51.5%) | 83 (48.5%) |
| 4+ Person Household | 245 (70.2%) | 104 (29.8%) |
| Total Housing Units | 880 (73.3%) | 320 (26.7%) |
Occupancy by Educational Attainment in Moscow Mills
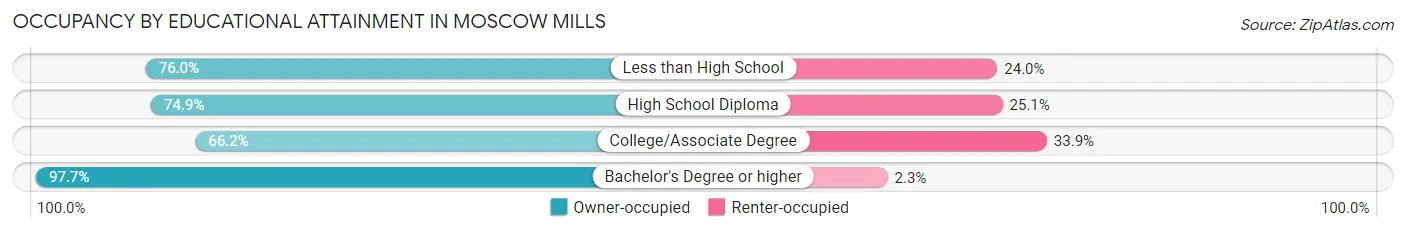
| Household Size | Owner-occupied | Renter-occupied |
| Less than High School | 98 (76.0%) | 31 (24.0%) |
| High School Diploma | 272 (74.9%) | 91 (25.1%) |
| College/Associate Degree | 381 (66.1%) | 195 (33.9%) |
| Bachelor's Degree or higher | 129 (97.7%) | 3 (2.3%) |
Occupancy by Age of Householder in Moscow Mills
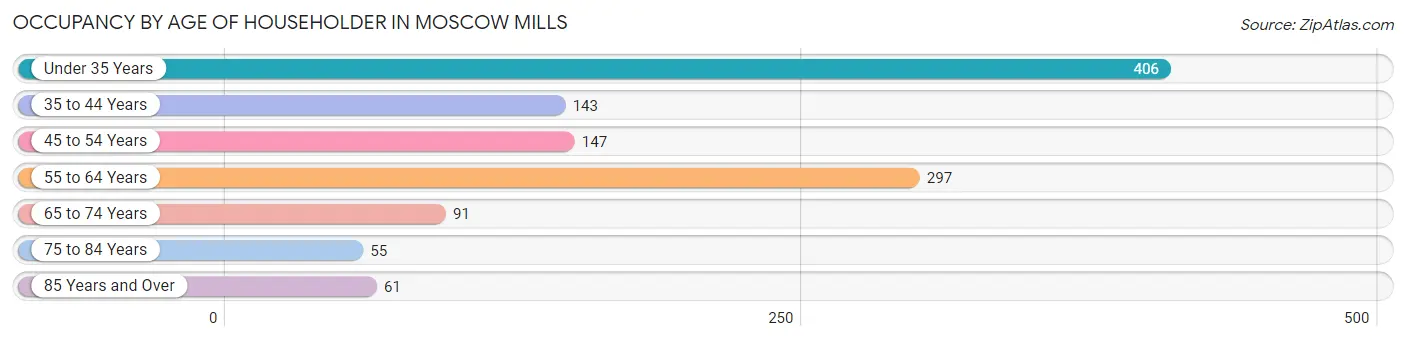
| Age Bracket | # Households | % Households |
| Under 35 Years | 406 | 33.8% |
| 35 to 44 Years | 143 | 11.9% |
| 45 to 54 Years | 147 | 12.2% |
| 55 to 64 Years | 297 | 24.7% |
| 65 to 74 Years | 91 | 7.6% |
| 75 to 84 Years | 55 | 4.6% |
| 85 Years and Over | 61 | 5.1% |
| Total | 1,200 | 100.0% |
Housing Finances in Moscow Mills
Median Income by Occupancy in Moscow Mills
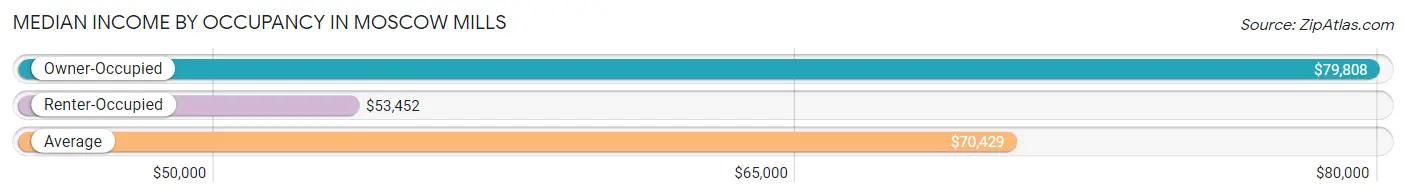
| Occupancy Type | # Households | Median Income |
| Owner-Occupied | 880 (73.3%) | $79,808 |
| Renter-Occupied | 320 (26.7%) | $53,452 |
| Average | 1,200 (100.0%) | $70,429 |
Occupancy by Householder Income Bracket in Moscow Mills
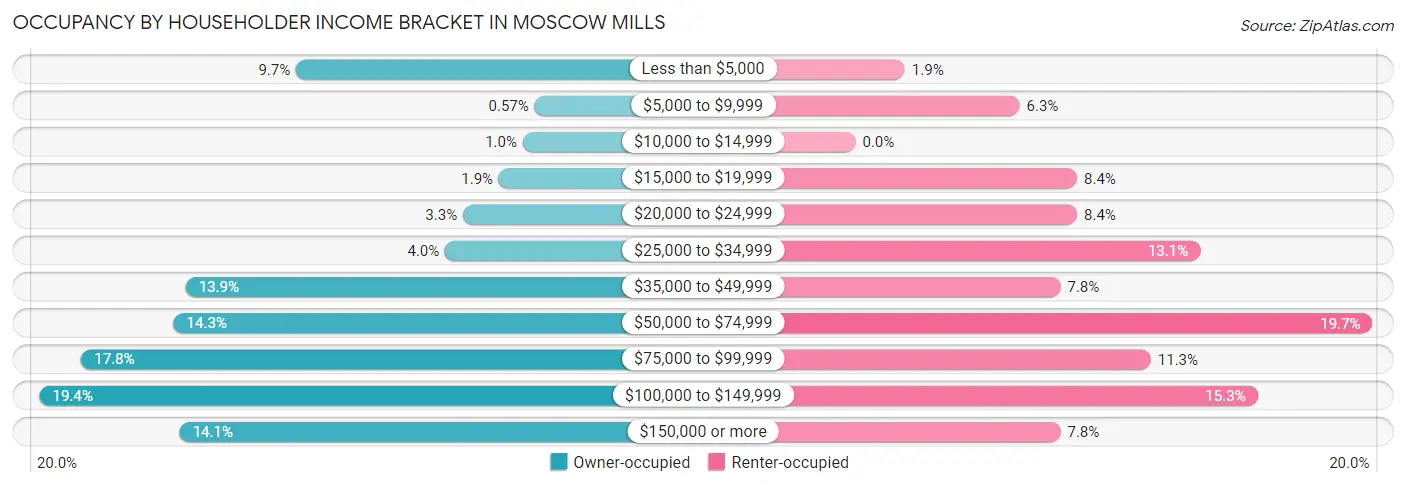
| Income Bracket | Owner-occupied | Renter-occupied |
| Less than $5,000 | 85 (9.7%) | 6 (1.9%) |
| $5,000 to $9,999 | 5 (0.6%) | 20 (6.2%) |
| $10,000 to $14,999 | 9 (1.0%) | 0 (0.0%) |
| $15,000 to $19,999 | 17 (1.9%) | 27 (8.4%) |
| $20,000 to $24,999 | 29 (3.3%) | 27 (8.4%) |
| $25,000 to $34,999 | 35 (4.0%) | 42 (13.1%) |
| $35,000 to $49,999 | 122 (13.9%) | 25 (7.8%) |
| $50,000 to $74,999 | 126 (14.3%) | 63 (19.7%) |
| $75,000 to $99,999 | 157 (17.8%) | 36 (11.3%) |
| $100,000 to $149,999 | 171 (19.4%) | 49 (15.3%) |
| $150,000 or more | 124 (14.1%) | 25 (7.8%) |
| Total | 880 (100.0%) | 320 (100.0%) |
Monthly Housing Cost Tiers in Moscow Mills
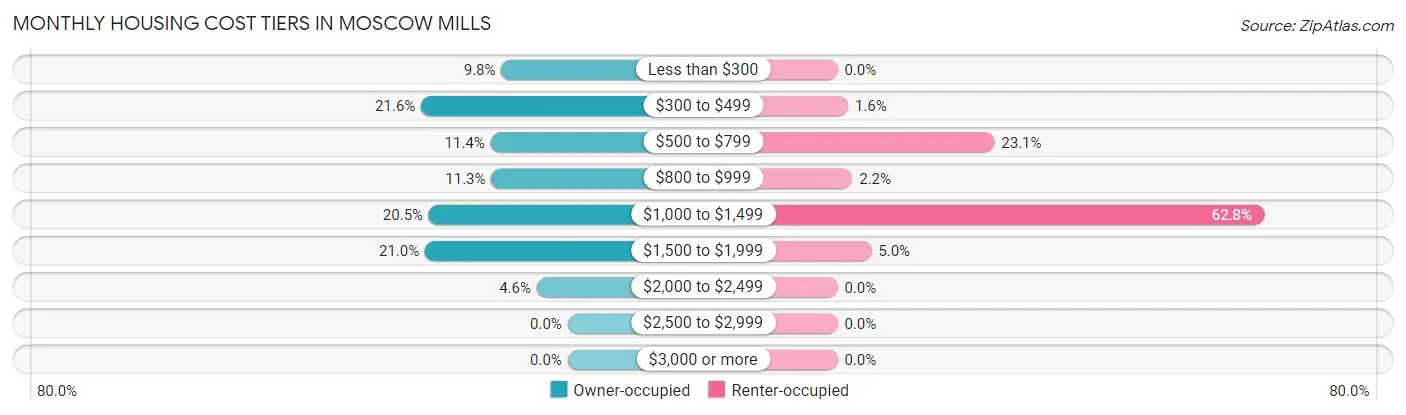
| Monthly Cost | Owner-occupied | Renter-occupied |
| Less than $300 | 86 (9.8%) | 0 (0.0%) |
| $300 to $499 | 190 (21.6%) | 5 (1.6%) |
| $500 to $799 | 100 (11.4%) | 74 (23.1%) |
| $800 to $999 | 99 (11.3%) | 7 (2.2%) |
| $1,000 to $1,499 | 180 (20.4%) | 201 (62.8%) |
| $1,500 to $1,999 | 185 (21.0%) | 16 (5.0%) |
| $2,000 to $2,499 | 40 (4.5%) | 0 (0.0%) |
| $2,500 to $2,999 | 0 (0.0%) | 0 (0.0%) |
| $3,000 or more | 0 (0.0%) | 0 (0.0%) |
| Total | 880 (100.0%) | 320 (100.0%) |
Physical Housing Characteristics in Moscow Mills
Housing Structures in Moscow Mills
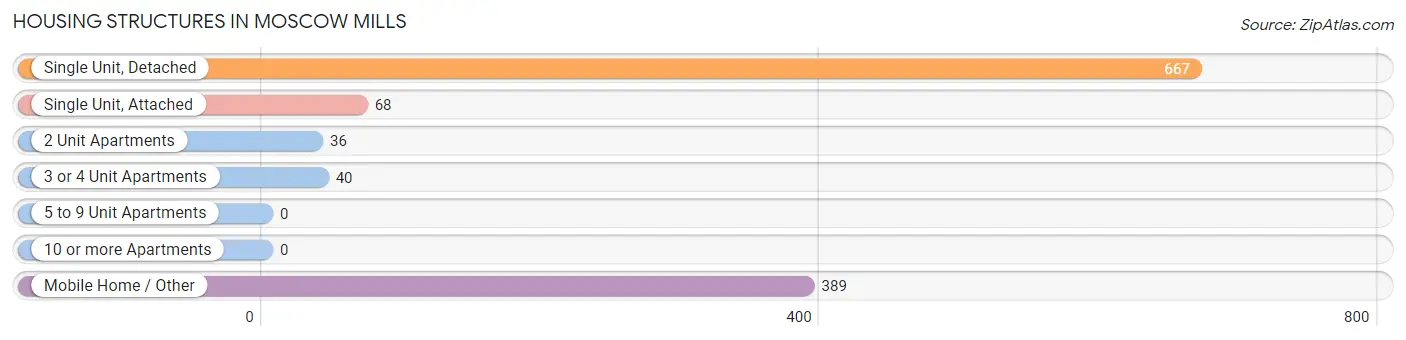
| Structure Type | # Housing Units | % Housing Units |
| Single Unit, Detached | 667 | 55.6% |
| Single Unit, Attached | 68 | 5.7% |
| 2 Unit Apartments | 36 | 3.0% |
| 3 or 4 Unit Apartments | 40 | 3.3% |
| 5 to 9 Unit Apartments | 0 | 0.0% |
| 10 or more Apartments | 0 | 0.0% |
| Mobile Home / Other | 389 | 32.4% |
| Total | 1,200 | 100.0% |
Housing Structures by Occupancy in Moscow Mills
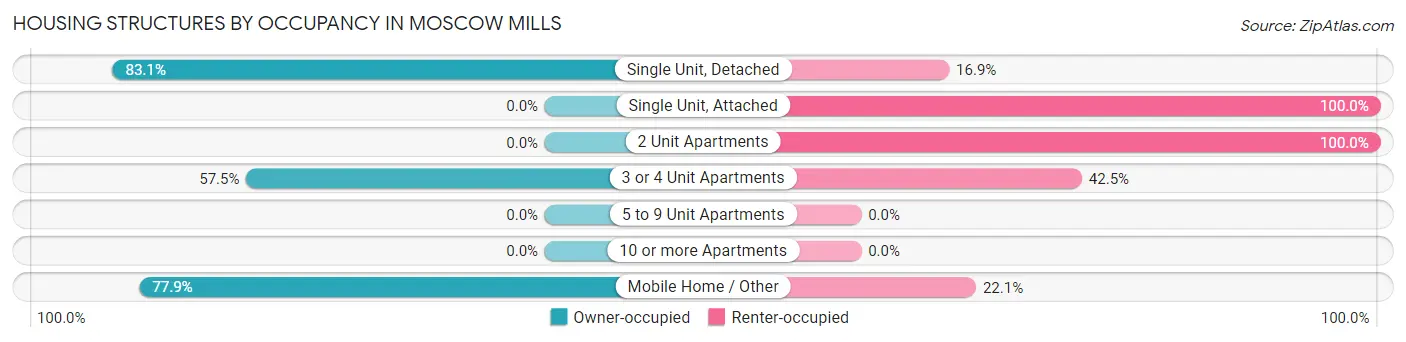
| Structure Type | Owner-occupied | Renter-occupied |
| Single Unit, Detached | 554 (83.1%) | 113 (16.9%) |
| Single Unit, Attached | 0 (0.0%) | 68 (100.0%) |
| 2 Unit Apartments | 0 (0.0%) | 36 (100.0%) |
| 3 or 4 Unit Apartments | 23 (57.5%) | 17 (42.5%) |
| 5 to 9 Unit Apartments | 0 (0.0%) | 0 (0.0%) |
| 10 or more Apartments | 0 (0.0%) | 0 (0.0%) |
| Mobile Home / Other | 303 (77.9%) | 86 (22.1%) |
| Total | 880 (73.3%) | 320 (26.7%) |
Housing Structures by Number of Rooms in Moscow Mills
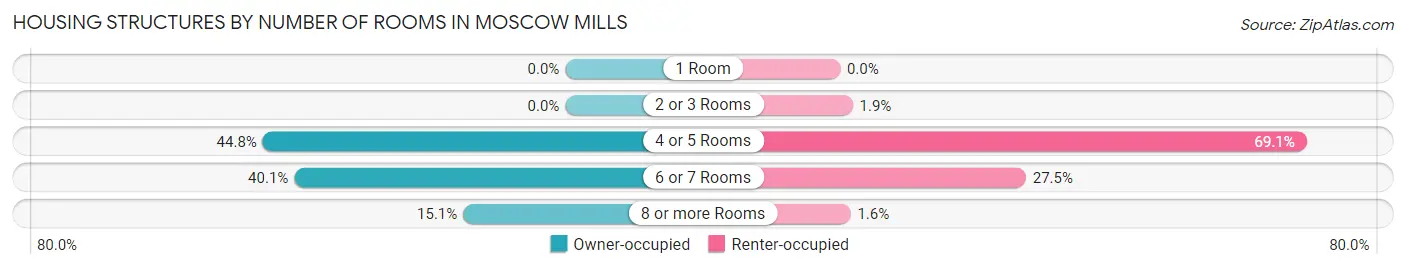
| Number of Rooms | Owner-occupied | Renter-occupied |
| 1 Room | 0 (0.0%) | 0 (0.0%) |
| 2 or 3 Rooms | 0 (0.0%) | 6 (1.9%) |
| 4 or 5 Rooms | 394 (44.8%) | 221 (69.1%) |
| 6 or 7 Rooms | 353 (40.1%) | 88 (27.5%) |
| 8 or more Rooms | 133 (15.1%) | 5 (1.6%) |
| Total | 880 (100.0%) | 320 (100.0%) |
Housing Structure by Heating Type in Moscow Mills
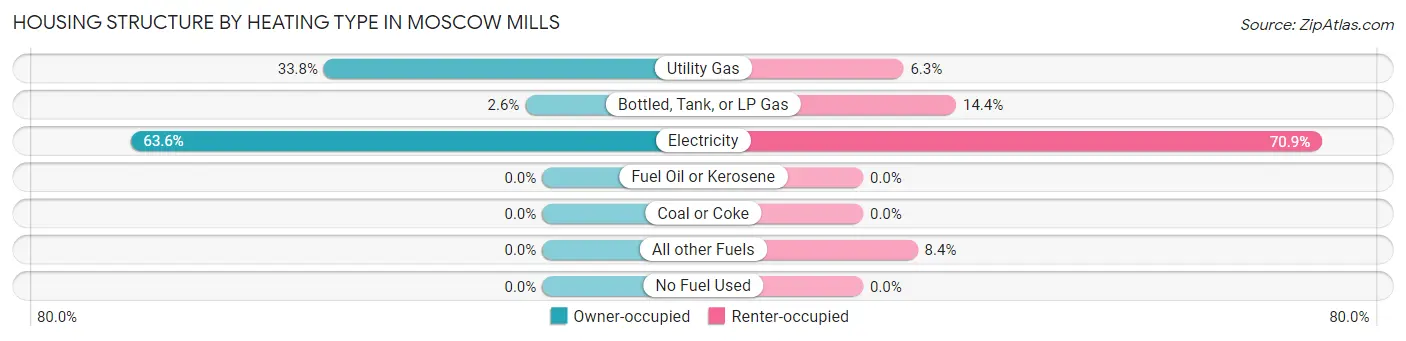
| Heating Type | Owner-occupied | Renter-occupied |
| Utility Gas | 297 (33.8%) | 20 (6.2%) |
| Bottled, Tank, or LP Gas | 23 (2.6%) | 46 (14.4%) |
| Electricity | 560 (63.6%) | 227 (70.9%) |
| Fuel Oil or Kerosene | 0 (0.0%) | 0 (0.0%) |
| Coal or Coke | 0 (0.0%) | 0 (0.0%) |
| All other Fuels | 0 (0.0%) | 27 (8.4%) |
| No Fuel Used | 0 (0.0%) | 0 (0.0%) |
| Total | 880 (100.0%) | 320 (100.0%) |
Household Vehicle Usage in Moscow Mills
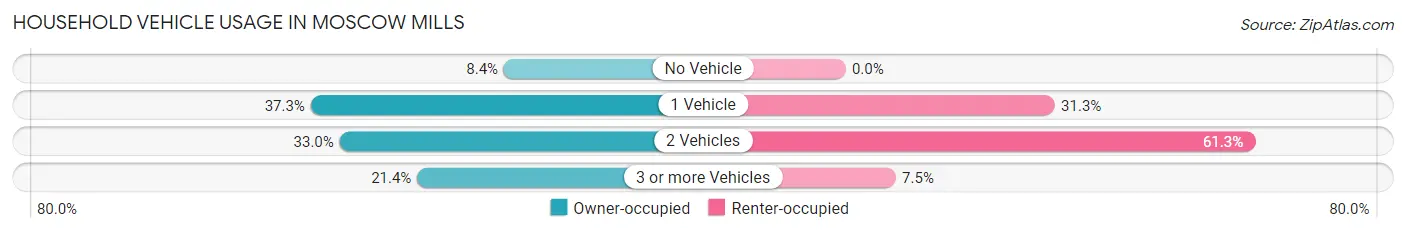
| Vehicles per Household | Owner-occupied | Renter-occupied |
| No Vehicle | 74 (8.4%) | 0 (0.0%) |
| 1 Vehicle | 328 (37.3%) | 100 (31.2%) |
| 2 Vehicles | 290 (33.0%) | 196 (61.3%) |
| 3 or more Vehicles | 188 (21.4%) | 24 (7.5%) |
| Total | 880 (100.0%) | 320 (100.0%) |
Real Estate & Mortgages in Moscow Mills
Real Estate and Mortgage Overview in Moscow Mills
| Characteristic | Without Mortgage | With Mortgage |
| Housing Units | 375 | 505 |
| Median Property Value | - | - |
| Median Household Income | $49,750 | $124 |
| Monthly Housing Costs | $395 | $0 |
| Real Estate Taxes | $825 | $29 |
Property Value by Mortgage Status in Moscow Mills
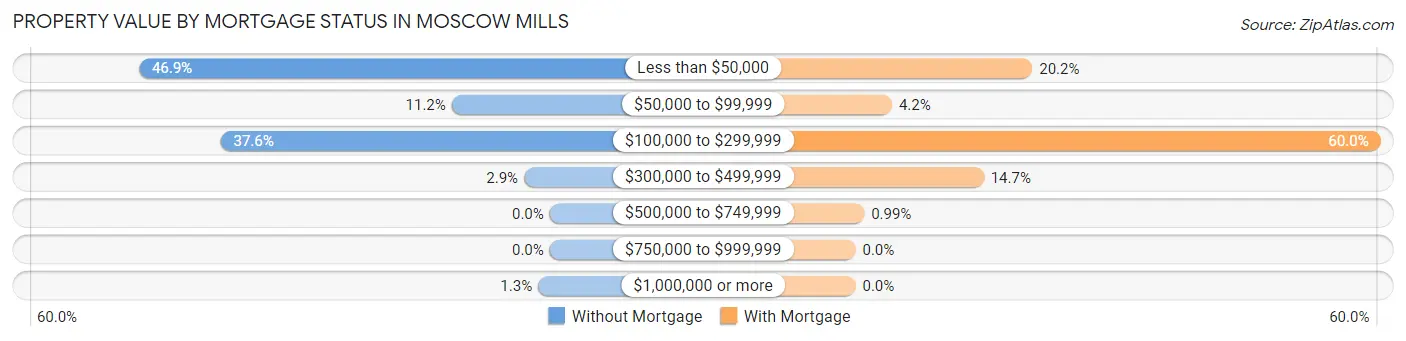
| Property Value | Without Mortgage | With Mortgage |
| Less than $50,000 | 176 (46.9%) | 102 (20.2%) |
| $50,000 to $99,999 | 42 (11.2%) | 21 (4.2%) |
| $100,000 to $299,999 | 141 (37.6%) | 303 (60.0%) |
| $300,000 to $499,999 | 11 (2.9%) | 74 (14.6%) |
| $500,000 to $749,999 | 0 (0.0%) | 5 (1.0%) |
| $750,000 to $999,999 | 0 (0.0%) | 0 (0.0%) |
| $1,000,000 or more | 5 (1.3%) | 0 (0.0%) |
| Total | 375 (100.0%) | 505 (100.0%) |
Household Income by Mortgage Status in Moscow Mills
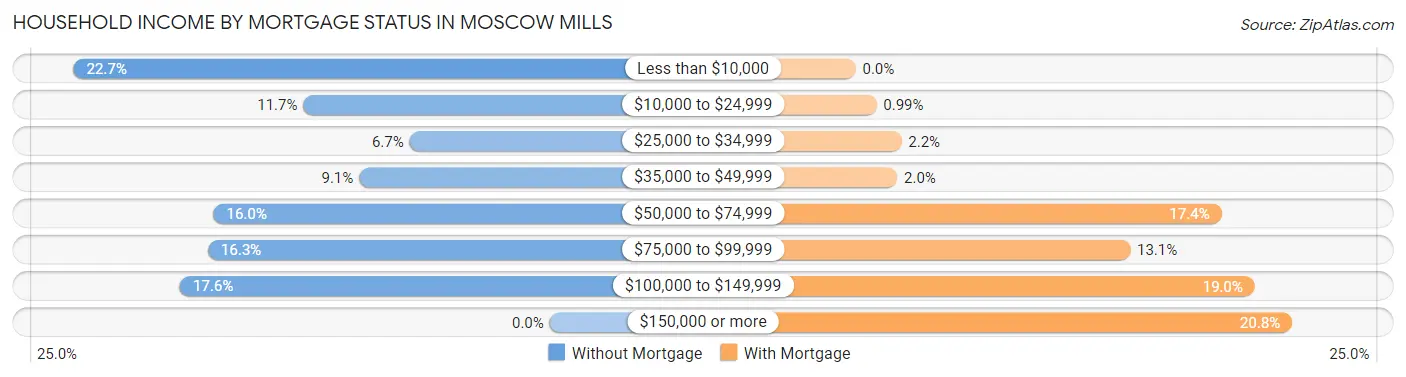
| Household Income | Without Mortgage | With Mortgage |
| Less than $10,000 | 85 (22.7%) | 0 (0.0%) |
| $10,000 to $24,999 | 44 (11.7%) | 5 (1.0%) |
| $25,000 to $34,999 | 25 (6.7%) | 11 (2.2%) |
| $35,000 to $49,999 | 34 (9.1%) | 10 (2.0%) |
| $50,000 to $74,999 | 60 (16.0%) | 88 (17.4%) |
| $75,000 to $99,999 | 61 (16.3%) | 66 (13.1%) |
| $100,000 to $149,999 | 66 (17.6%) | 96 (19.0%) |
| $150,000 or more | 0 (0.0%) | 105 (20.8%) |
| Total | 375 (100.0%) | 505 (100.0%) |
Property Value to Household Income Ratio in Moscow Mills
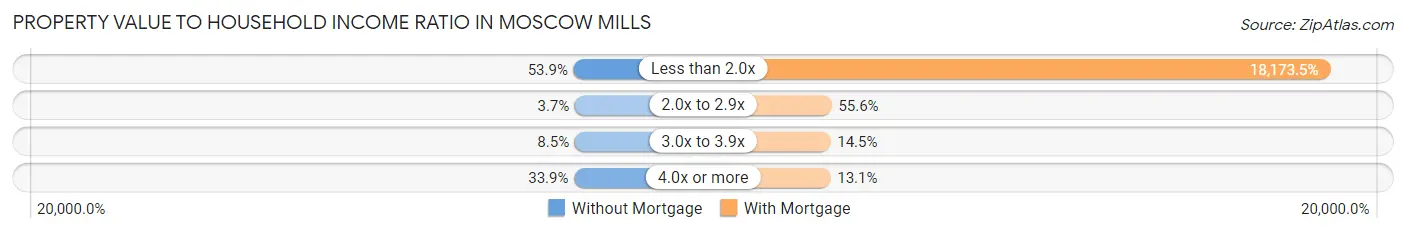
| Value-to-Income Ratio | Without Mortgage | With Mortgage |
| Less than 2.0x | 202 (53.9%) | 91,776 (18,173.5%) |
| 2.0x to 2.9x | 14 (3.7%) | 281 (55.6%) |
| 3.0x to 3.9x | 32 (8.5%) | 73 (14.5%) |
| 4.0x or more | 127 (33.9%) | 66 (13.1%) |
| Total | 375 (100.0%) | 505 (100.0%) |
Real Estate Taxes by Mortgage Status in Moscow Mills
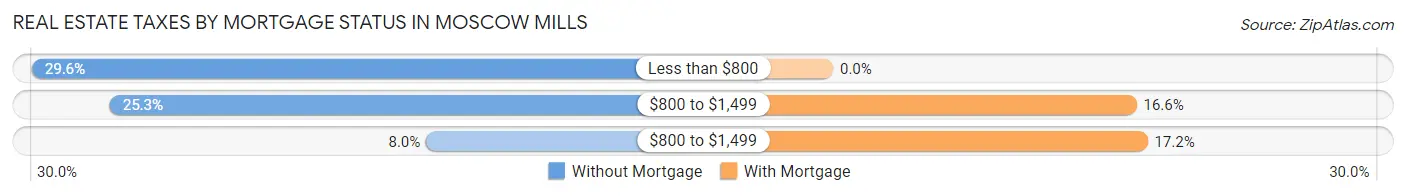
| Property Taxes | Without Mortgage | With Mortgage |
| Less than $800 | 111 (29.6%) | 0 (0.0%) |
| $800 to $1,499 | 95 (25.3%) | 84 (16.6%) |
| $800 to $1,499 | 30 (8.0%) | 87 (17.2%) |
| Total | 375 (100.0%) | 505 (100.0%) |
Health & Disability in Moscow Mills
Health Insurance Coverage by Age in Moscow Mills
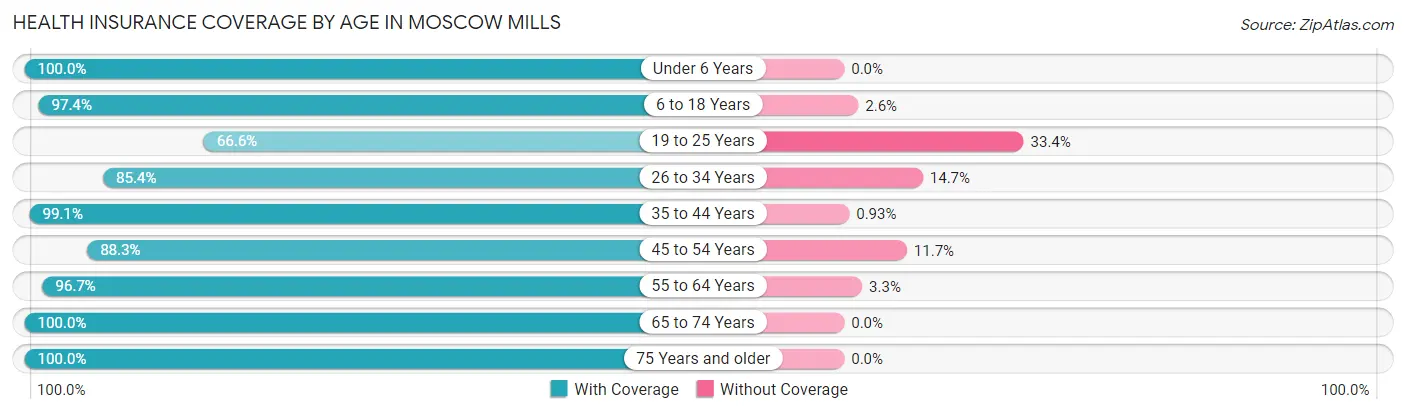
| Age Bracket | With Coverage | Without Coverage |
| Under 6 Years | 394 (100.0%) | 0 (0.0%) |
| 6 to 18 Years | 631 (97.4%) | 17 (2.6%) |
| 19 to 25 Years | 209 (66.6%) | 105 (33.4%) |
| 26 to 34 Years | 565 (85.4%) | 97 (14.6%) |
| 35 to 44 Years | 319 (99.1%) | 3 (0.9%) |
| 45 to 54 Years | 325 (88.3%) | 43 (11.7%) |
| 55 to 64 Years | 436 (96.7%) | 15 (3.3%) |
| 65 to 74 Years | 208 (100.0%) | 0 (0.0%) |
| 75 Years and older | 135 (100.0%) | 0 (0.0%) |
| Total | 3,222 (92.0%) | 280 (8.0%) |
Health Insurance Coverage by Citizenship Status in Moscow Mills
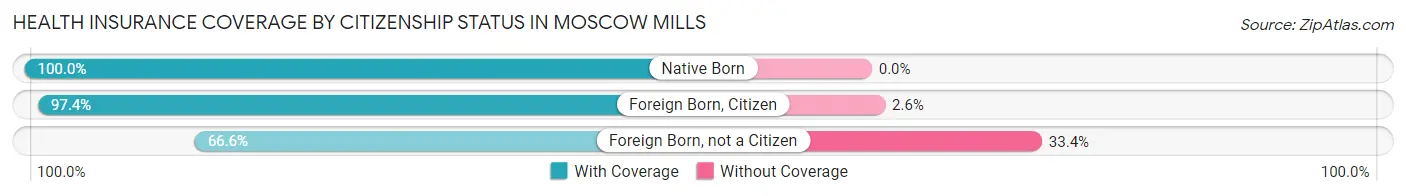
| Citizenship Status | With Coverage | Without Coverage |
| Native Born | 394 (100.0%) | 0 (0.0%) |
| Foreign Born, Citizen | 631 (97.4%) | 17 (2.6%) |
| Foreign Born, not a Citizen | 209 (66.6%) | 105 (33.4%) |
Health Insurance Coverage by Household Income in Moscow Mills
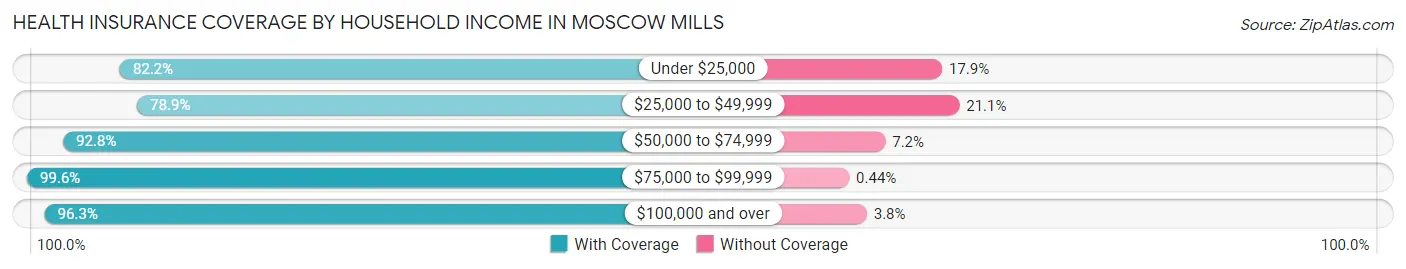
| Household Income | With Coverage | Without Coverage |
| Under $25,000 | 359 (82.2%) | 78 (17.8%) |
| $25,000 to $49,999 | 438 (78.9%) | 117 (21.1%) |
| $50,000 to $74,999 | 425 (92.8%) | 33 (7.2%) |
| $75,000 to $99,999 | 677 (99.6%) | 3 (0.4%) |
| $100,000 and over | 1,258 (96.3%) | 49 (3.7%) |
Public vs Private Health Insurance Coverage by Age in Moscow Mills
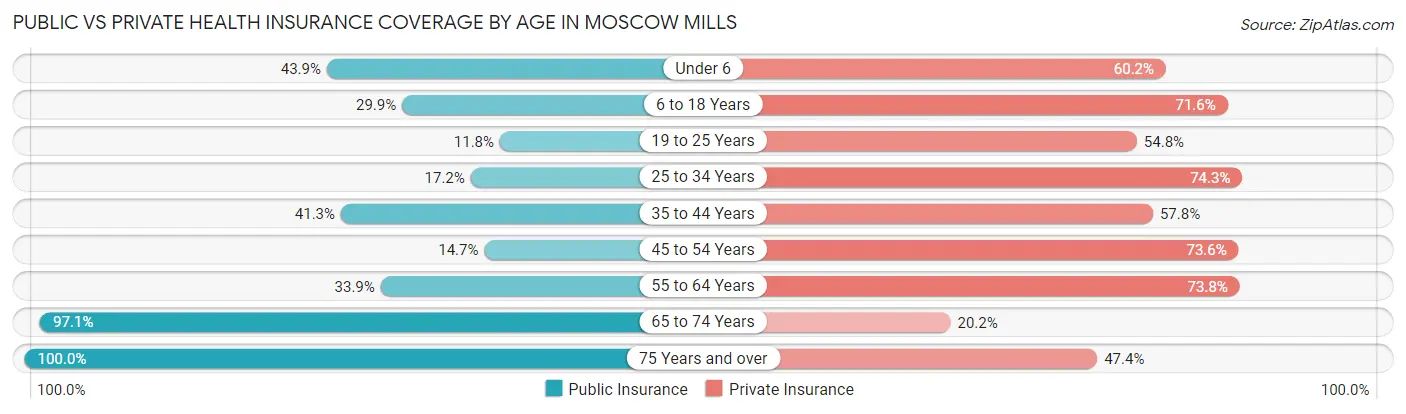
| Age Bracket | Public Insurance | Private Insurance |
| Under 6 | 173 (43.9%) | 237 (60.2%) |
| 6 to 18 Years | 194 (29.9%) | 464 (71.6%) |
| 19 to 25 Years | 37 (11.8%) | 172 (54.8%) |
| 25 to 34 Years | 114 (17.2%) | 492 (74.3%) |
| 35 to 44 Years | 133 (41.3%) | 186 (57.8%) |
| 45 to 54 Years | 54 (14.7%) | 271 (73.6%) |
| 55 to 64 Years | 153 (33.9%) | 333 (73.8%) |
| 65 to 74 Years | 202 (97.1%) | 42 (20.2%) |
| 75 Years and over | 135 (100.0%) | 64 (47.4%) |
| Total | 1,195 (34.1%) | 2,261 (64.6%) |
Disability Status by Sex by Age in Moscow Mills
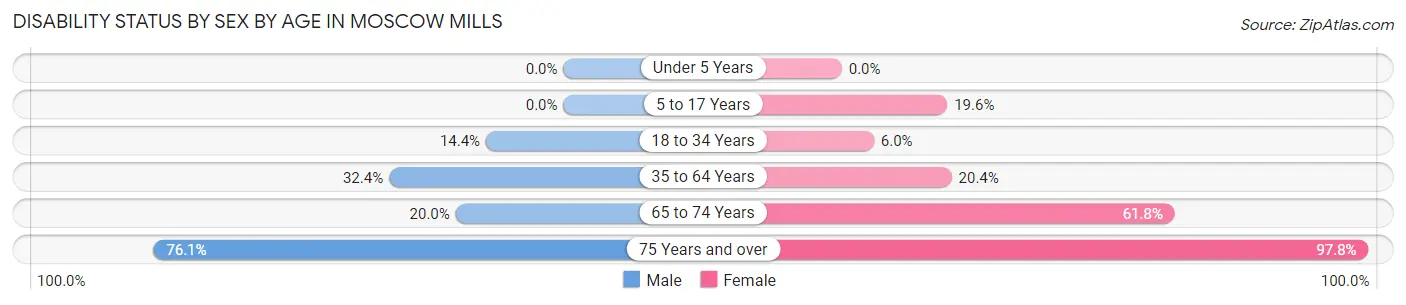
| Age Bracket | Male | Female |
| Under 5 Years | 0 (0.0%) | 0 (0.0%) |
| 5 to 17 Years | 0 (0.0%) | 45 (19.6%) |
| 18 to 34 Years | 76 (14.4%) | 30 (5.9%) |
| 35 to 64 Years | 166 (32.4%) | 128 (20.4%) |
| 65 to 74 Years | 17 (20.0%) | 76 (61.8%) |
| 75 Years and over | 35 (76.1%) | 87 (97.8%) |
Disability Class by Sex by Age in Moscow Mills
Disability Class: Hearing Difficulty
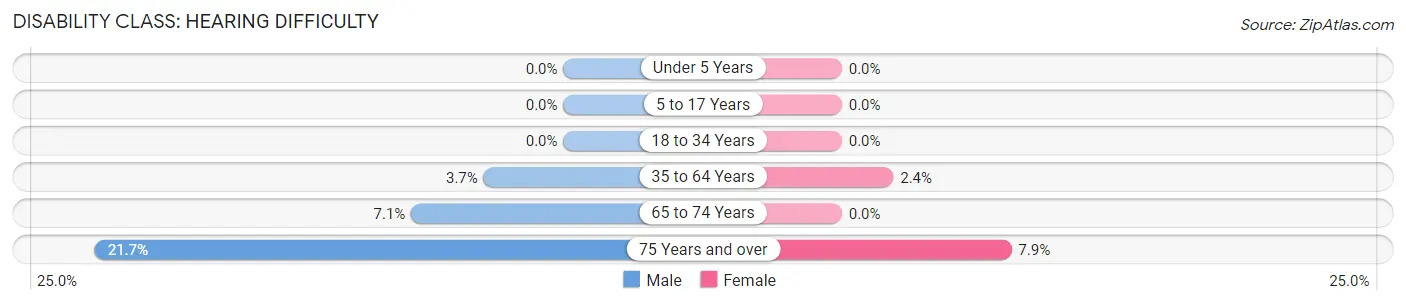
| Age Bracket | Male | Female |
| Under 5 Years | 0 (0.0%) | 0 (0.0%) |
| 5 to 17 Years | 0 (0.0%) | 0 (0.0%) |
| 18 to 34 Years | 0 (0.0%) | 0 (0.0%) |
| 35 to 64 Years | 19 (3.7%) | 15 (2.4%) |
| 65 to 74 Years | 6 (7.1%) | 0 (0.0%) |
| 75 Years and over | 10 (21.7%) | 7 (7.9%) |
Disability Class: Vision Difficulty
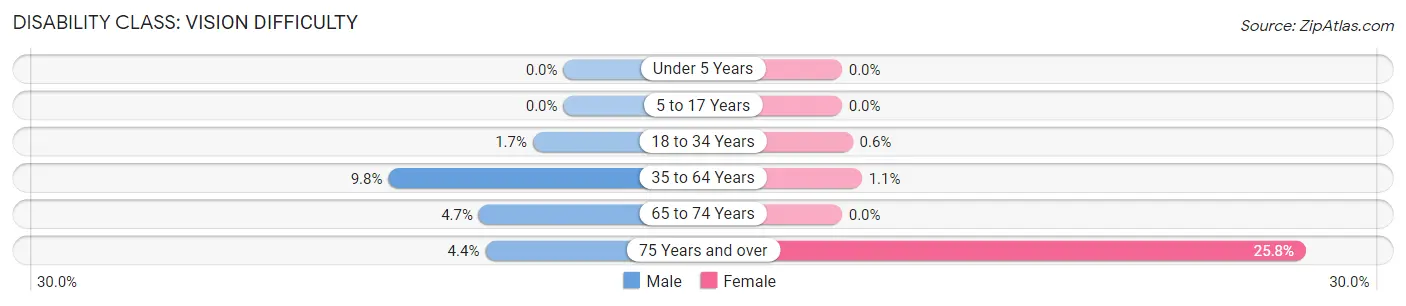
| Age Bracket | Male | Female |
| Under 5 Years | 0 (0.0%) | 0 (0.0%) |
| 5 to 17 Years | 0 (0.0%) | 0 (0.0%) |
| 18 to 34 Years | 9 (1.7%) | 3 (0.6%) |
| 35 to 64 Years | 50 (9.8%) | 7 (1.1%) |
| 65 to 74 Years | 4 (4.7%) | 0 (0.0%) |
| 75 Years and over | 2 (4.3%) | 23 (25.8%) |
Disability Class: Cognitive Difficulty
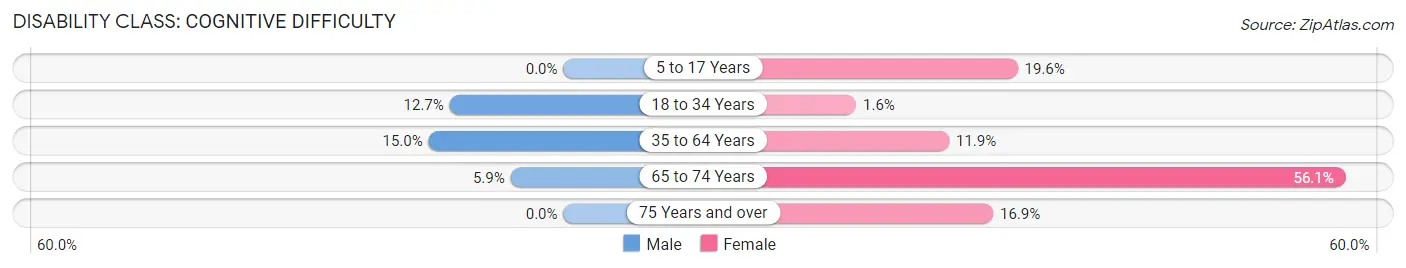
| Age Bracket | Male | Female |
| 5 to 17 Years | 0 (0.0%) | 45 (19.6%) |
| 18 to 34 Years | 67 (12.7%) | 8 (1.6%) |
| 35 to 64 Years | 77 (15.0%) | 75 (11.9%) |
| 65 to 74 Years | 5 (5.9%) | 69 (56.1%) |
| 75 Years and over | 0 (0.0%) | 15 (16.9%) |
Disability Class: Ambulatory Difficulty
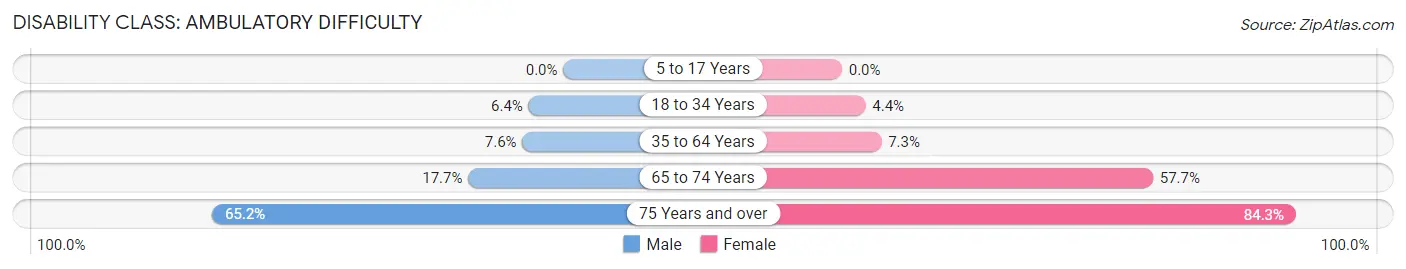
| Age Bracket | Male | Female |
| 5 to 17 Years | 0 (0.0%) | 0 (0.0%) |
| 18 to 34 Years | 34 (6.4%) | 22 (4.4%) |
| 35 to 64 Years | 39 (7.6%) | 46 (7.3%) |
| 65 to 74 Years | 15 (17.6%) | 71 (57.7%) |
| 75 Years and over | 30 (65.2%) | 75 (84.3%) |
Disability Class: Self-Care Difficulty
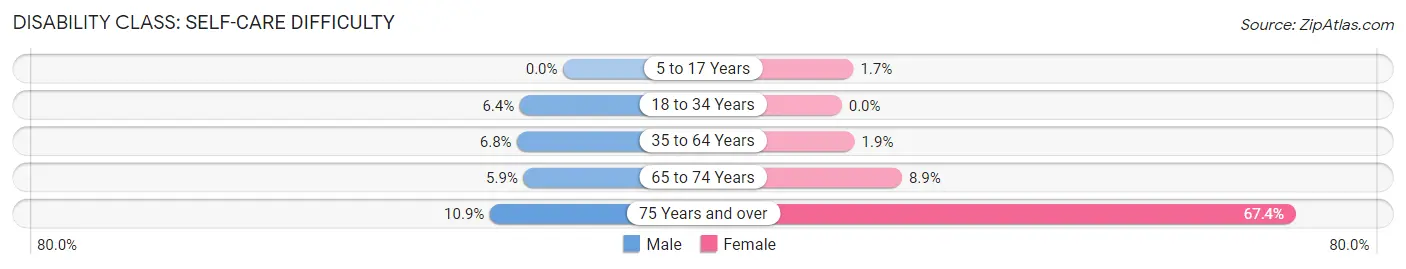
| Age Bracket | Male | Female |
| 5 to 17 Years | 0 (0.0%) | 4 (1.7%) |
| 18 to 34 Years | 34 (6.4%) | 0 (0.0%) |
| 35 to 64 Years | 35 (6.8%) | 12 (1.9%) |
| 65 to 74 Years | 5 (5.9%) | 11 (8.9%) |
| 75 Years and over | 5 (10.9%) | 60 (67.4%) |
Technology Access in Moscow Mills
Computing Device Access in Moscow Mills
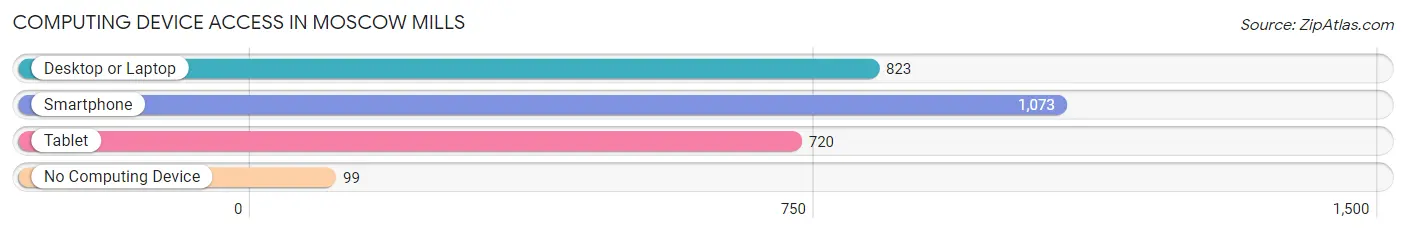
| Device Type | # Households | % Households |
| Desktop or Laptop | 823 | 68.6% |
| Smartphone | 1,073 | 89.4% |
| Tablet | 720 | 60.0% |
| No Computing Device | 99 | 8.3% |
| Total | 1,200 | 100.0% |
Internet Access in Moscow Mills
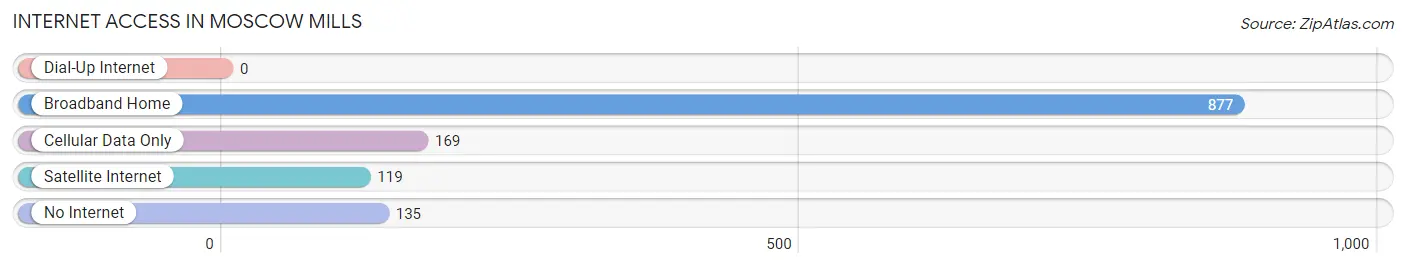
| Internet Type | # Households | % Households |
| Dial-Up Internet | 0 | 0.0% |
| Broadband Home | 877 | 73.1% |
| Cellular Data Only | 169 | 14.1% |
| Satellite Internet | 119 | 9.9% |
| No Internet | 135 | 11.3% |
| Total | 1,200 | 100.0% |
Moscow Mills Summary
History
The small town of Moscow Mills, Missouri is located in Lincoln County, approximately 40 miles northwest of St. Louis. The town was founded in 1819 by a group of settlers from Kentucky and Tennessee. The town was originally known as “Moscow”, but the name was changed to “Moscow Mills” in 1837 when a mill was built on the banks of the Cuivre River. The mill was used to grind wheat and corn, and it was the first industry in the area.
The town grew slowly over the years, and by the late 19th century, it had become a thriving agricultural community. The town was home to several businesses, including a general store, a blacksmith shop, a hotel, and a post office. The town also had a school, a church, and a cemetery.
In the early 20th century, the town began to experience a period of growth. The population increased from just over 200 in 1900 to nearly 1,000 by 1950. During this time, the town was home to several businesses, including a bank, a grocery store, a hardware store, and a movie theater.
Geography
Moscow Mills is located in Lincoln County, Missouri, approximately 40 miles northwest of St. Louis. The town is situated on the banks of the Cuivre River, which flows through the town and provides a source of water for the area. The town is surrounded by rolling hills and farmland, and is located in the Ozark Mountains region of Missouri.
The climate in Moscow Mills is typical of the Midwest, with hot summers and cold winters. The average temperature in the summer is around 80 degrees Fahrenheit, and the average temperature in the winter is around 30 degrees Fahrenheit. The town receives an average of 40 inches of precipitation per year, with most of it falling in the spring and summer months.
Economy
The economy of Moscow Mills is largely based on agriculture. The town is home to several farms, which produce a variety of crops, including corn, soybeans, wheat, and hay. The town is also home to several businesses, including a bank, a grocery store, a hardware store, and a movie theater.
The town is also home to several manufacturing companies, including a plastics manufacturer and a metal fabrication company. The town is also home to several small businesses, including restaurants, retail stores, and service providers.
Demographics
As of the 2010 census, the population of Moscow Mills was 1,845. The town is predominantly white, with 92.3% of the population identifying as white. The town is also home to a small African American population, with 4.2% of the population identifying as African American. The town is also home to a small Hispanic population, with 1.7% of the population identifying as Hispanic or Latino.
The median household income in Moscow Mills is $50,938, and the median home value is $128,400. The town has a poverty rate of 11.3%, which is slightly higher than the national average. The town also has a high rate of homeownership, with 78.3% of the population owning their own homes.
Common Questions
What is Per Capita Income in Moscow Mills?
Per Capita income in Moscow Mills is $27,698.
What is the Median Family Income in Moscow Mills?
Median Family Income in Moscow Mills is $75,625.
What is the Median Household income in Moscow Mills?
Median Household Income in Moscow Mills is $70,429.
What is Income or Wage Gap in Moscow Mills?
Income or Wage Gap in Moscow Mills is 41.6%.
Women in Moscow Mills earn 58.4 cents for every dollar earned by a man.
What is Inequality or Gini Index in Moscow Mills?
Inequality or Gini Index in Moscow Mills is 0.40.
What is the Total Population of Moscow Mills?
Total Population of Moscow Mills is 3,502.
What is the Total Male Population of Moscow Mills?
Total Male Population of Moscow Mills is 1,809.
What is the Total Female Population of Moscow Mills?
Total Female Population of Moscow Mills is 1,693.
What is the Ratio of Males per 100 Females in Moscow Mills?
There are 106.85 Males per 100 Females in Moscow Mills.
What is the Ratio of Females per 100 Males in Moscow Mills?
There are 93.59 Females per 100 Males in Moscow Mills.
What is the Median Population Age in Moscow Mills?
Median Population Age in Moscow Mills is 30.3 Years.
What is the Average Family Size in Moscow Mills
Average Family Size in Moscow Mills is 3.1 People.
What is the Average Household Size in Moscow Mills
Average Household Size in Moscow Mills is 2.9 People.
How Large is the Labor Force in Moscow Mills?
There are 1,670 People in the Labor Forcein in Moscow Mills.
What is the Percentage of People in the Labor Force in Moscow Mills?
64.5% of People are in the Labor Force in Moscow Mills.
What is the Unemployment Rate in Moscow Mills?
Unemployment Rate in Moscow Mills is 7.7%.