Morrisville, MO Map & Demographics
Morrisville Map
Morrisville Overview
$24,190
PER CAPITA INCOME
$67,917
AVG FAMILY INCOME
$54,375
AVG HOUSEHOLD INCOME
3.3%
WAGE / INCOME GAP [ % ]
96.7¢/ $1
WAGE / INCOME GAP [ $ ]
0.35
INEQUALITY / GINI INDEX
550
TOTAL POPULATION
248
MALE POPULATION
302
FEMALE POPULATION
82.12
MALES / 100 FEMALES
121.77
FEMALES / 100 MALES
45.5
MEDIAN AGE
2.6
AVG FAMILY SIZE
2.4
AVG HOUSEHOLD SIZE
296
LABOR FORCE [ PEOPLE ]
65.5%
PERCENT IN LABOR FORCE
4.1%
UNEMPLOYMENT RATE
Morrisville Zip Codes
Morrisville Area Codes
Income in Morrisville
Income Overview in Morrisville
Per Capita Income in Morrisville is $24,190, while median incomes of families and households are $67,917 and $54,375 respectively.
| Characteristic | Number | Measure |
| Per Capita Income | 550 | $24,190 |
| Median Family Income | 173 | $67,917 |
| Mean Family Income | 173 | $68,126 |
| Median Household Income | 234 | $54,375 |
| Mean Household Income | 234 | $56,376 |
| Income Deficit | 173 | $0 |
| Wage / Income Gap (%) | 550 | 3.34% |
| Wage / Income Gap ($) | 550 | 96.66¢ per $1 |
| Gini / Inequality Index | 550 | 0.35 |
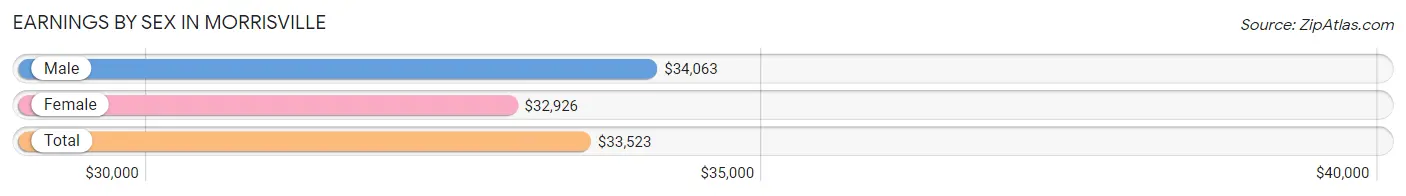
Earnings by Sex in Morrisville
Average Earnings in Morrisville are $33,523, $34,063 for men and $32,926 for women, a difference of 3.3%.
| Sex | Number | Average Earnings |
| Male | 139 (45.9%) | $34,063 |
| Female | 164 (54.1%) | $32,926 |
| Total | 303 (100.0%) | $33,523 |
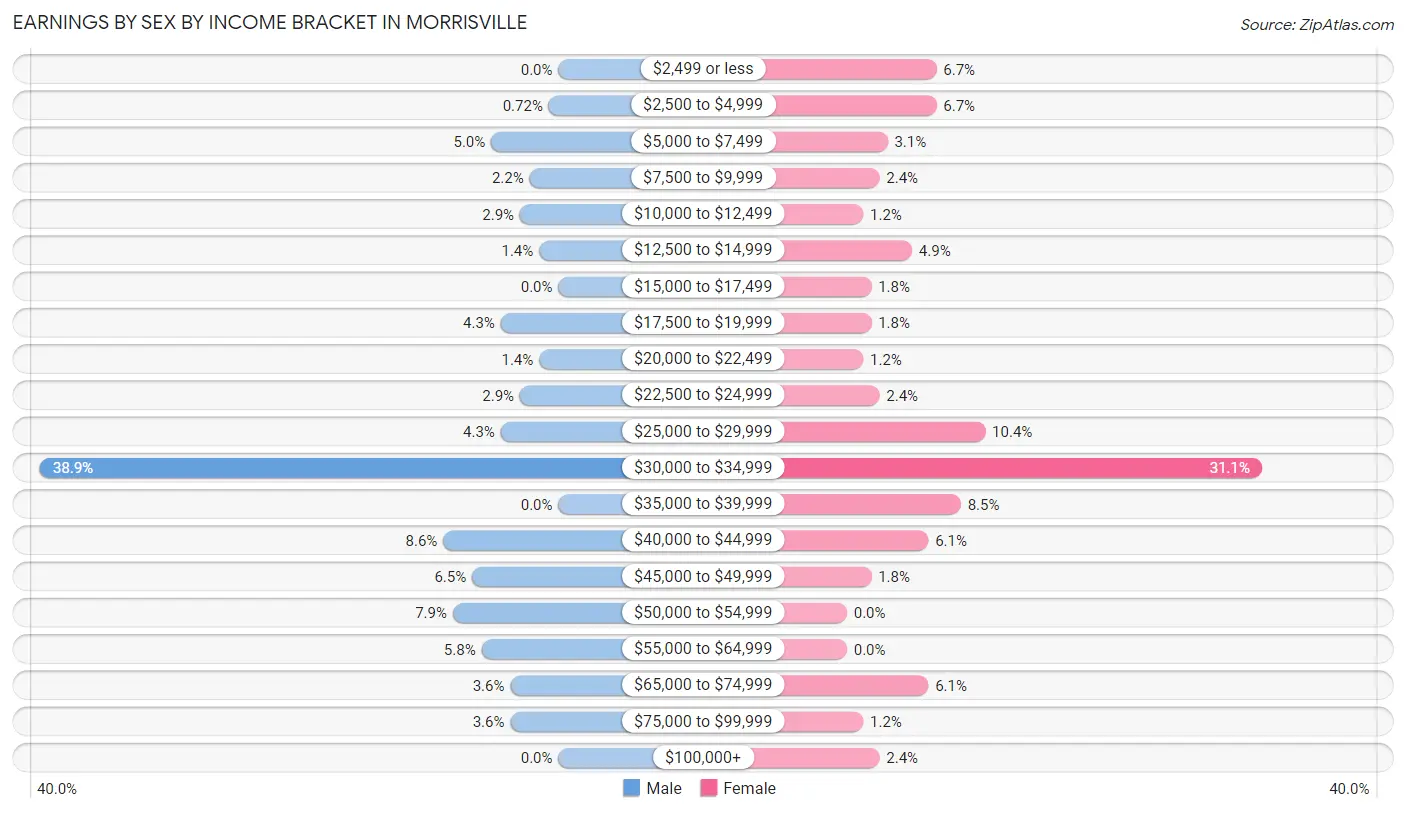
Earnings by Sex by Income Bracket in Morrisville
The most common earnings brackets in Morrisville are $30,000 to $34,999 for men (54 | 38.9%) and $30,000 to $34,999 for women (51 | 31.1%).
| Income | Male | Female |
| $2,499 or less | 0 (0.0%) | 11 (6.7%) |
| $2,500 to $4,999 | 1 (0.7%) | 11 (6.7%) |
| $5,000 to $7,499 | 7 (5.0%) | 5 (3.0%) |
| $7,500 to $9,999 | 3 (2.2%) | 4 (2.4%) |
| $10,000 to $12,499 | 4 (2.9%) | 2 (1.2%) |
| $12,500 to $14,999 | 2 (1.4%) | 8 (4.9%) |
| $15,000 to $17,499 | 0 (0.0%) | 3 (1.8%) |
| $17,500 to $19,999 | 6 (4.3%) | 3 (1.8%) |
| $20,000 to $22,499 | 2 (1.4%) | 2 (1.2%) |
| $22,500 to $24,999 | 4 (2.9%) | 4 (2.4%) |
| $25,000 to $29,999 | 6 (4.3%) | 17 (10.4%) |
| $30,000 to $34,999 | 54 (38.9%) | 51 (31.1%) |
| $35,000 to $39,999 | 0 (0.0%) | 14 (8.5%) |
| $40,000 to $44,999 | 12 (8.6%) | 10 (6.1%) |
| $45,000 to $49,999 | 9 (6.5%) | 3 (1.8%) |
| $50,000 to $54,999 | 11 (7.9%) | 0 (0.0%) |
| $55,000 to $64,999 | 8 (5.8%) | 0 (0.0%) |
| $65,000 to $74,999 | 5 (3.6%) | 10 (6.1%) |
| $75,000 to $99,999 | 5 (3.6%) | 2 (1.2%) |
| $100,000+ | 0 (0.0%) | 4 (2.4%) |
| Total | 139 (100.0%) | 164 (100.0%) |
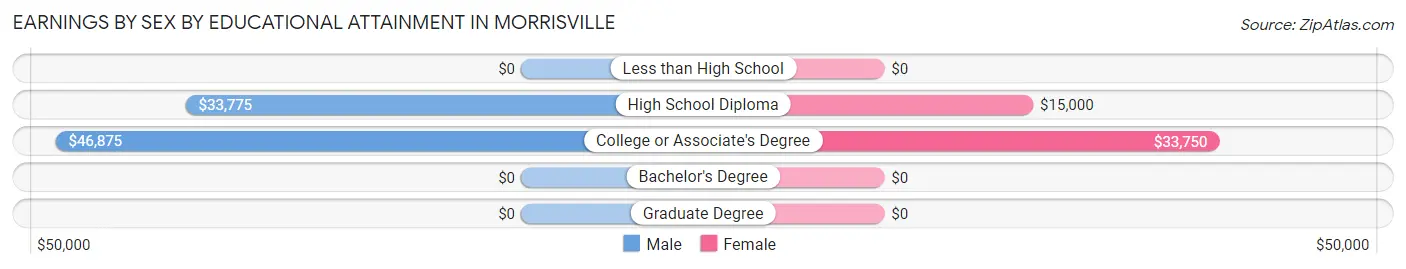
Earnings by Sex by Educational Attainment in Morrisville
Average earnings in Morrisville are $34,183 for men and $33,351 for women, a difference of 2.4%. Men with an educational attainment of college or associate's degree enjoy the highest average annual earnings of $46,875, while those with high school diploma education earn the least with $33,775. Women with an educational attainment of college or associate's degree earn the most with the average annual earnings of $33,750, while those with high school diploma education have the smallest earnings of $15,000.
| Educational Attainment | Male Income | Female Income |
| Less than High School | - | - |
| High School Diploma | $33,775 | $15,000 |
| College or Associate's Degree | $46,875 | $33,750 |
| Bachelor's Degree | - | - |
| Graduate Degree | - | - |
| Total | $34,183 | $33,351 |
Family Income in Morrisville
Family Income Brackets in Morrisville
According to the Morrisville family income data, there are 72 families falling into the $50,000 to $74,999 income range, which is the most common income bracket and makes up 41.6% of all families.
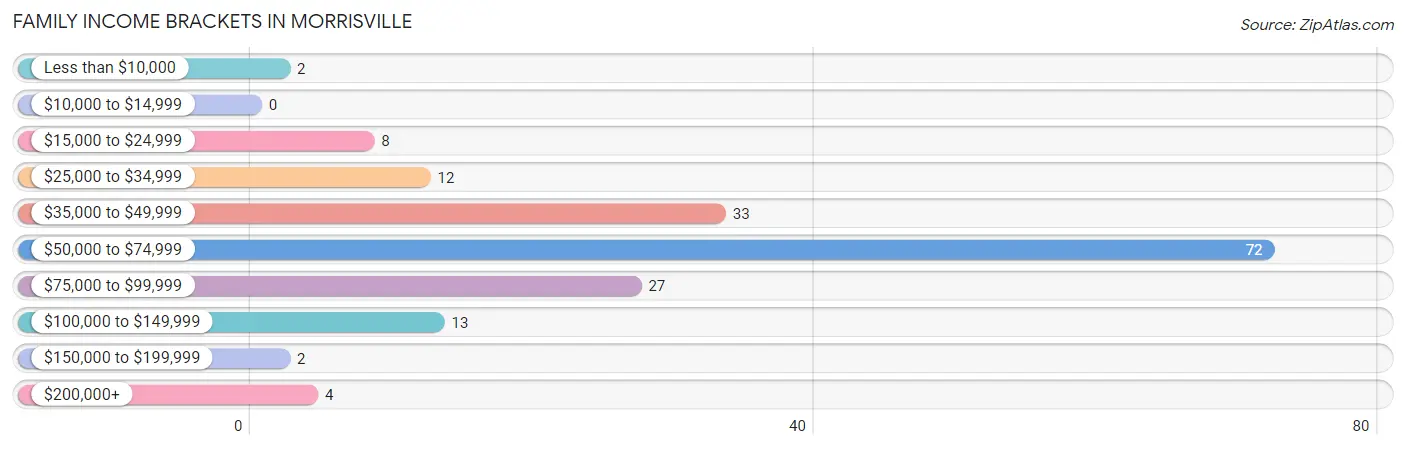
| Income Bracket | # Families | % Families |
| Less than $10,000 | 2 | 1.2% |
| $10,000 to $14,999 | 0 | 0.0% |
| $15,000 to $24,999 | 8 | 4.6% |
| $25,000 to $34,999 | 12 | 6.9% |
| $35,000 to $49,999 | 33 | 19.1% |
| $50,000 to $74,999 | 72 | 41.6% |
| $75,000 to $99,999 | 27 | 15.6% |
| $100,000 to $149,999 | 13 | 7.5% |
| $150,000 to $199,999 | 2 | 1.2% |
| $200,000+ | 4 | 2.3% |
Family Income by Famaliy Size in Morrisville
2-person families (104 | 60.1%) account for the highest median family income in Morrisville with $68,556 per family, while 2-person families (104 | 60.1%) have the highest median income of $34,278 per family member.
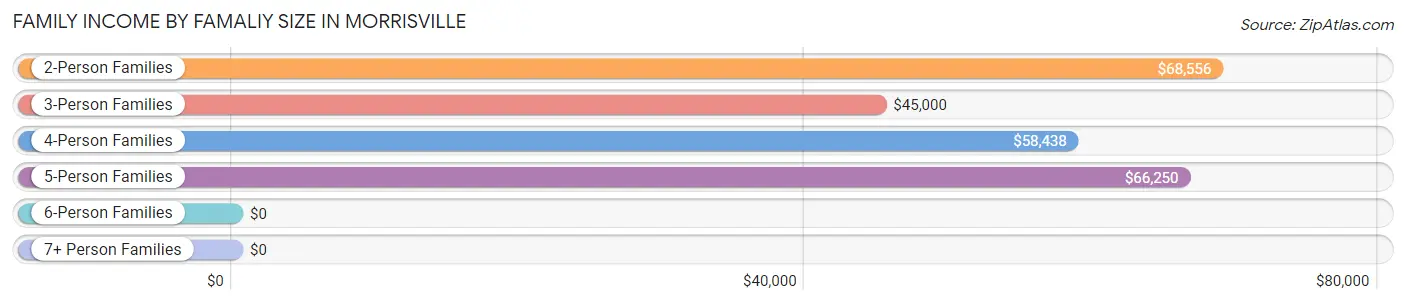
| Income Bracket | # Families | Median Income |
| 2-Person Families | 104 (60.1%) | $68,556 |
| 3-Person Families | 36 (20.8%) | $45,000 |
| 4-Person Families | 19 (11.0%) | $58,438 |
| 5-Person Families | 8 (4.6%) | $66,250 |
| 6-Person Families | 4 (2.3%) | $0 |
| 7+ Person Families | 2 (1.2%) | $0 |
| Total | 173 (100.0%) | $67,917 |
Family Income by Number of Earners in Morrisville
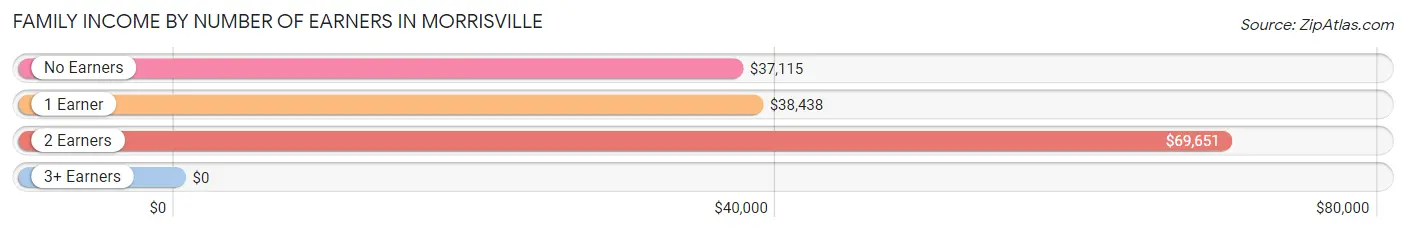
| Number of Earners | # Families | Median Income |
| No Earners | 22 (12.7%) | $37,115 |
| 1 Earner | 46 (26.6%) | $38,438 |
| 2 Earners | 92 (53.2%) | $69,651 |
| 3+ Earners | 13 (7.5%) | $0 |
| Total | 173 (100.0%) | $67,917 |
Household Income in Morrisville
Household Income Brackets in Morrisville
With 75 households falling in the category, the $50,000 to $74,999 income range is the most frequent in Morrisville, accounting for 32.1% of all households. In contrast, only 2 households (0.9%) fall into the $150,000 to $199,999 income bracket, making it the least populous group.
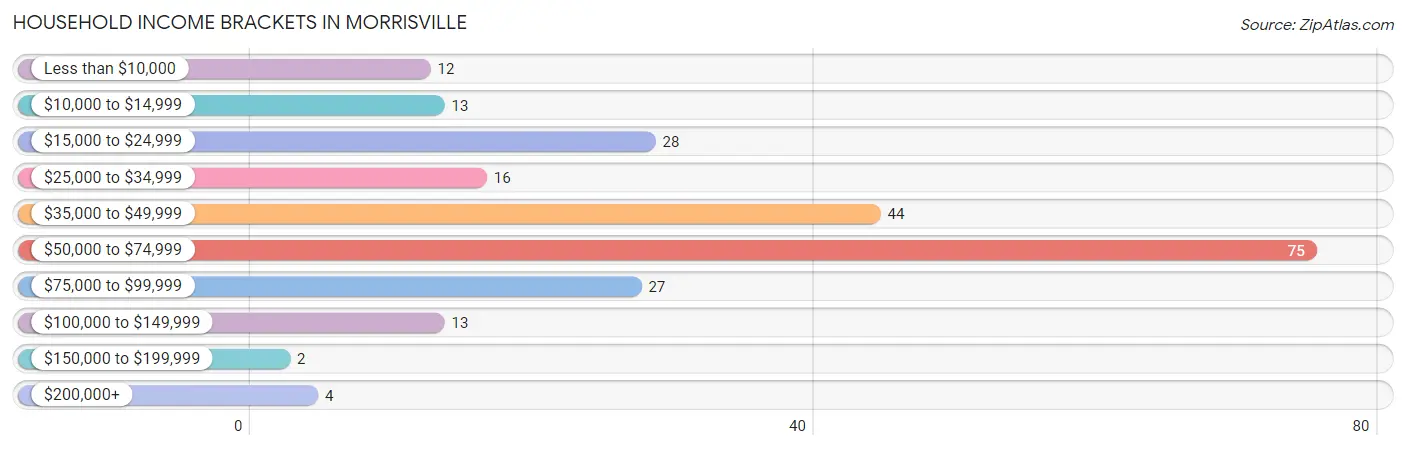
| Income Bracket | # Households | % Households |
| Less than $10,000 | 12 | 5.1% |
| $10,000 to $14,999 | 13 | 5.6% |
| $15,000 to $24,999 | 28 | 12.0% |
| $25,000 to $34,999 | 16 | 6.8% |
| $35,000 to $49,999 | 44 | 18.8% |
| $50,000 to $74,999 | 75 | 32.1% |
| $75,000 to $99,999 | 27 | 11.5% |
| $100,000 to $149,999 | 13 | 5.6% |
| $150,000 to $199,999 | 2 | 0.9% |
| $200,000+ | 4 | 1.7% |
Household Income by Householder Age in Morrisville
The median household income in Morrisville is $54,375, with the highest median household income of $68,372 found in the 45 to 64 years age bracket for the primary householder. A total of 106 households (45.3%) fall into this category. Meanwhile, the 15 to 24 years age bracket for the primary householder has the lowest median household income of $0, with 4 households (1.7%) in this group.
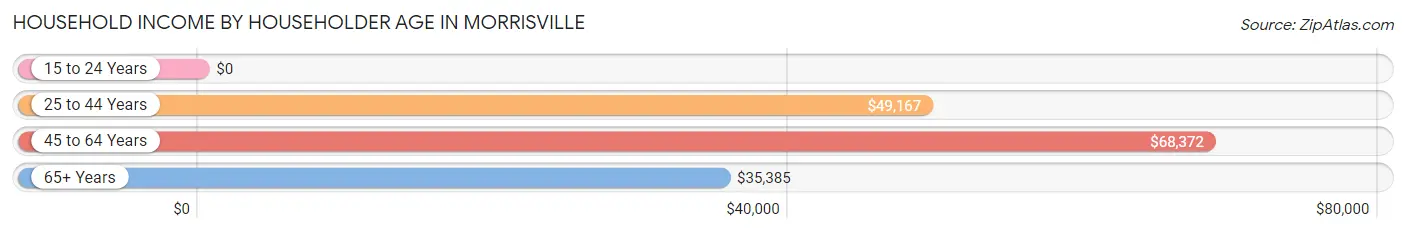
| Income Bracket | # Households | Median Income |
| 15 to 24 Years | 4 (1.7%) | $0 |
| 25 to 44 Years | 66 (28.2%) | $49,167 |
| 45 to 64 Years | 106 (45.3%) | $68,372 |
| 65+ Years | 58 (24.8%) | $35,385 |
| Total | 234 (100.0%) | $54,375 |
Poverty in Morrisville
Income Below Poverty by Sex and Age in Morrisville
With 7.4% poverty level for males and 16.9% for females among the residents of Morrisville, 75 year old and over males and 18 to 24 year old females are the most vulnerable to poverty, with 7 males (36.8%) and 8 females (72.7%) in their respective age groups living below the poverty level.
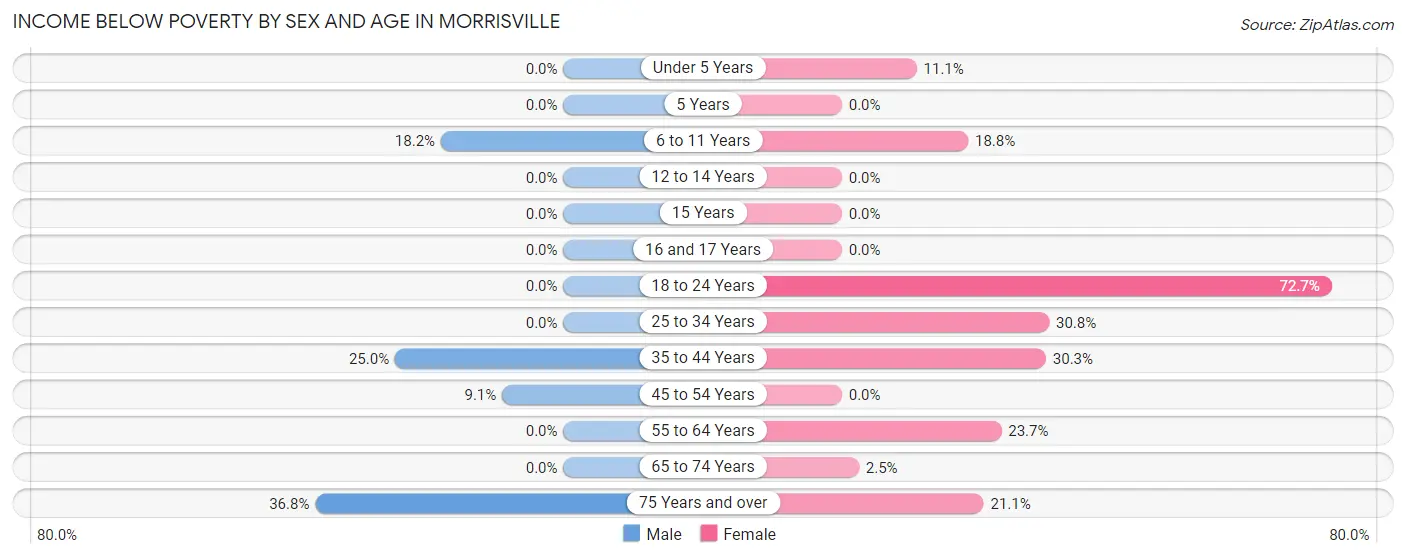
| Age Bracket | Male | Female |
| Under 5 Years | 0 (0.0%) | 3 (11.1%) |
| 5 Years | 0 (0.0%) | 0 (0.0%) |
| 6 to 11 Years | 2 (18.2%) | 3 (18.8%) |
| 12 to 14 Years | 0 (0.0%) | 0 (0.0%) |
| 15 Years | 0 (0.0%) | 0 (0.0%) |
| 16 and 17 Years | 0 (0.0%) | 0 (0.0%) |
| 18 to 24 Years | 0 (0.0%) | 8 (72.7%) |
| 25 to 34 Years | 0 (0.0%) | 12 (30.8%) |
| 35 to 44 Years | 7 (25.0%) | 10 (30.3%) |
| 45 to 54 Years | 2 (9.1%) | 0 (0.0%) |
| 55 to 64 Years | 0 (0.0%) | 9 (23.7%) |
| 65 to 74 Years | 0 (0.0%) | 2 (2.5%) |
| 75 Years and over | 7 (36.8%) | 4 (21.0%) |
| Total | 18 (7.4%) | 51 (16.9%) |
Income Above Poverty by Sex and Age in Morrisville
According to the poverty statistics in Morrisville, males aged under 5 years and females aged 5 years are the age groups that are most secure financially, with 100.0% of males and 100.0% of females in these age groups living above the poverty line.
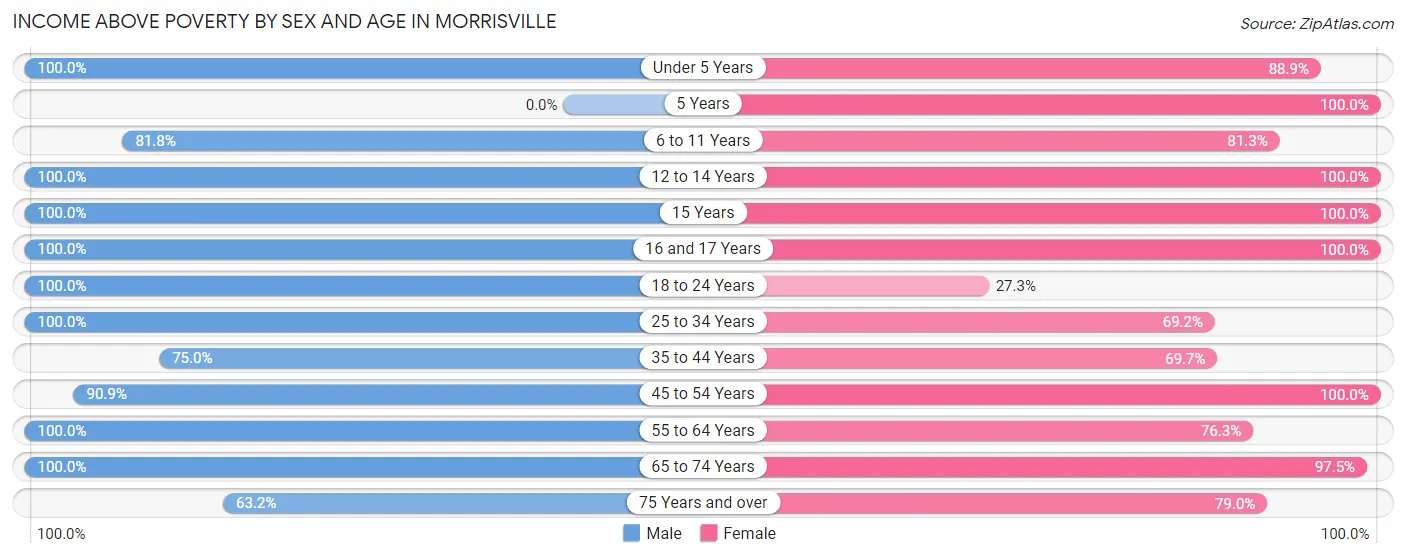
| Age Bracket | Male | Female |
| Under 5 Years | 6 (100.0%) | 24 (88.9%) |
| 5 Years | 0 (0.0%) | 4 (100.0%) |
| 6 to 11 Years | 9 (81.8%) | 13 (81.2%) |
| 12 to 14 Years | 7 (100.0%) | 8 (100.0%) |
| 15 Years | 8 (100.0%) | 5 (100.0%) |
| 16 and 17 Years | 12 (100.0%) | 5 (100.0%) |
| 18 to 24 Years | 16 (100.0%) | 3 (27.3%) |
| 25 to 34 Years | 33 (100.0%) | 27 (69.2%) |
| 35 to 44 Years | 21 (75.0%) | 23 (69.7%) |
| 45 to 54 Years | 20 (90.9%) | 17 (100.0%) |
| 55 to 64 Years | 63 (100.0%) | 29 (76.3%) |
| 65 to 74 Years | 18 (100.0%) | 77 (97.5%) |
| 75 Years and over | 12 (63.2%) | 15 (78.9%) |
| Total | 225 (92.6%) | 250 (83.1%) |
Income Below Poverty Among Married-Couple Families in Morrisville
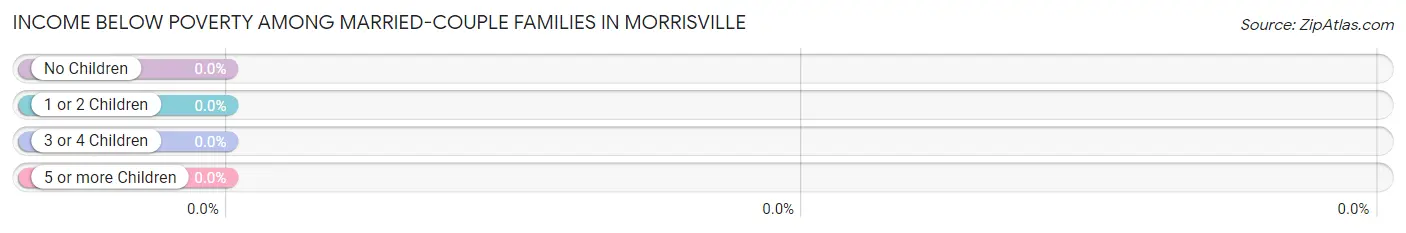
| Children | Above Poverty | Below Poverty |
| No Children | 94 (100.0%) | 0 (0.0%) |
| 1 or 2 Children | 36 (100.0%) | 0 (0.0%) |
| 3 or 4 Children | 2 (100.0%) | 0 (0.0%) |
| 5 or more Children | 0 (0.0%) | 0 (0.0%) |
| Total | 132 (100.0%) | 0 (0.0%) |
Income Below Poverty Among Single-Parent Households in Morrisville
According to the poverty data in Morrisville, 8.7% or 2 single-father households and 11.1% or 2 single-mother households are living below the poverty line. Among single-father households, those with 1 or 2 children have the highest poverty rate, with 2 households (11.8%) experiencing poverty. Likewise, among single-mother households, those with 3 or 4 children have the highest poverty rate, with 2 households (100.0%) falling below the poverty line.
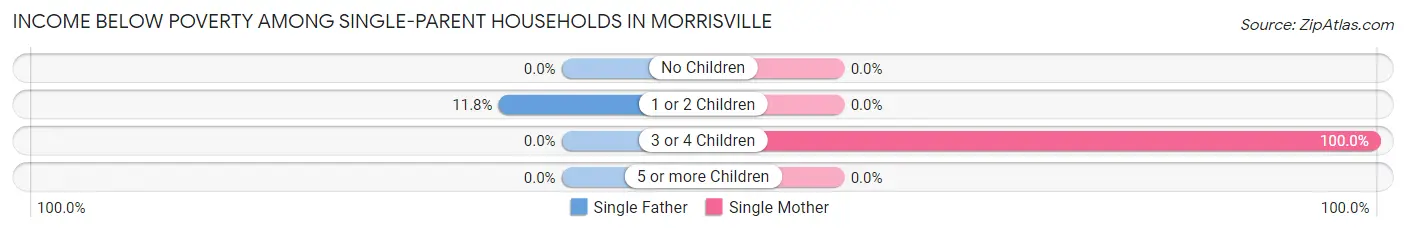
| Children | Single Father | Single Mother |
| No Children | 0 (0.0%) | 0 (0.0%) |
| 1 or 2 Children | 2 (11.8%) | 0 (0.0%) |
| 3 or 4 Children | 0 (0.0%) | 2 (100.0%) |
| 5 or more Children | 0 (0.0%) | 0 (0.0%) |
| Total | 2 (8.7%) | 2 (11.1%) |
Income Below Poverty Among Married-Couple vs Single-Parent Households in Morrisville
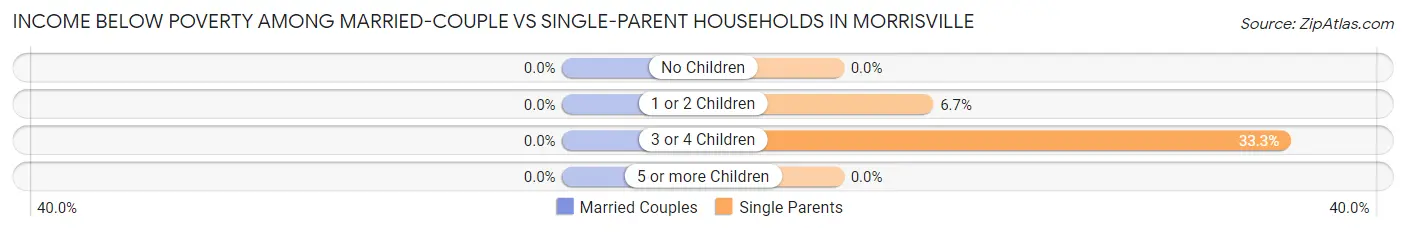
| Children | Married-Couple Families | Single-Parent Households |
| No Children | 0 (0.0%) | 0 (0.0%) |
| 1 or 2 Children | 0 (0.0%) | 2 (6.7%) |
| 3 or 4 Children | 0 (0.0%) | 2 (33.3%) |
| 5 or more Children | 0 (0.0%) | 0 (0.0%) |
| Total | 0 (0.0%) | 4 (9.8%) |
Race in Morrisville
The most populous races in Morrisville are White / Caucasian (527 | 95.8%), Hispanic or Latino (13 | 2.4%), and Two or more Races (13 | 2.4%).
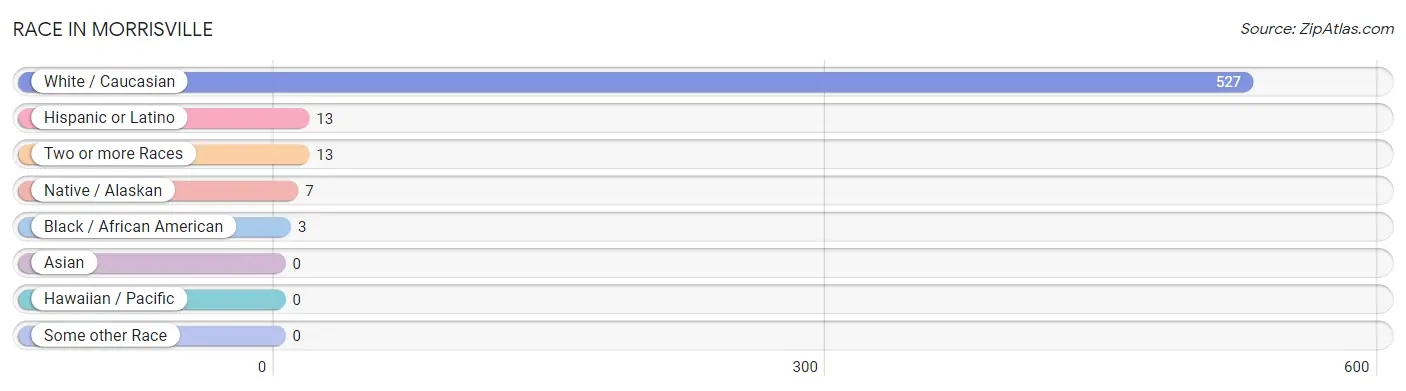
| Race | # Population | % Population |
| Asian | 0 | 0.0% |
| Black / African American | 3 | 0.5% |
| Hawaiian / Pacific | 0 | 0.0% |
| Hispanic or Latino | 13 | 2.4% |
| Native / Alaskan | 7 | 1.3% |
| White / Caucasian | 527 | 95.8% |
| Two or more Races | 13 | 2.4% |
| Some other Race | 0 | 0.0% |
| Total | 550 | 100.0% |
Ancestry in Morrisville
The most populous ancestries reported in Morrisville are English (133 | 24.2%), Irish (94 | 17.1%), German (79 | 14.4%), American (51 | 9.3%), and European (26 | 4.7%), together accounting for 69.6% of all Morrisville residents.
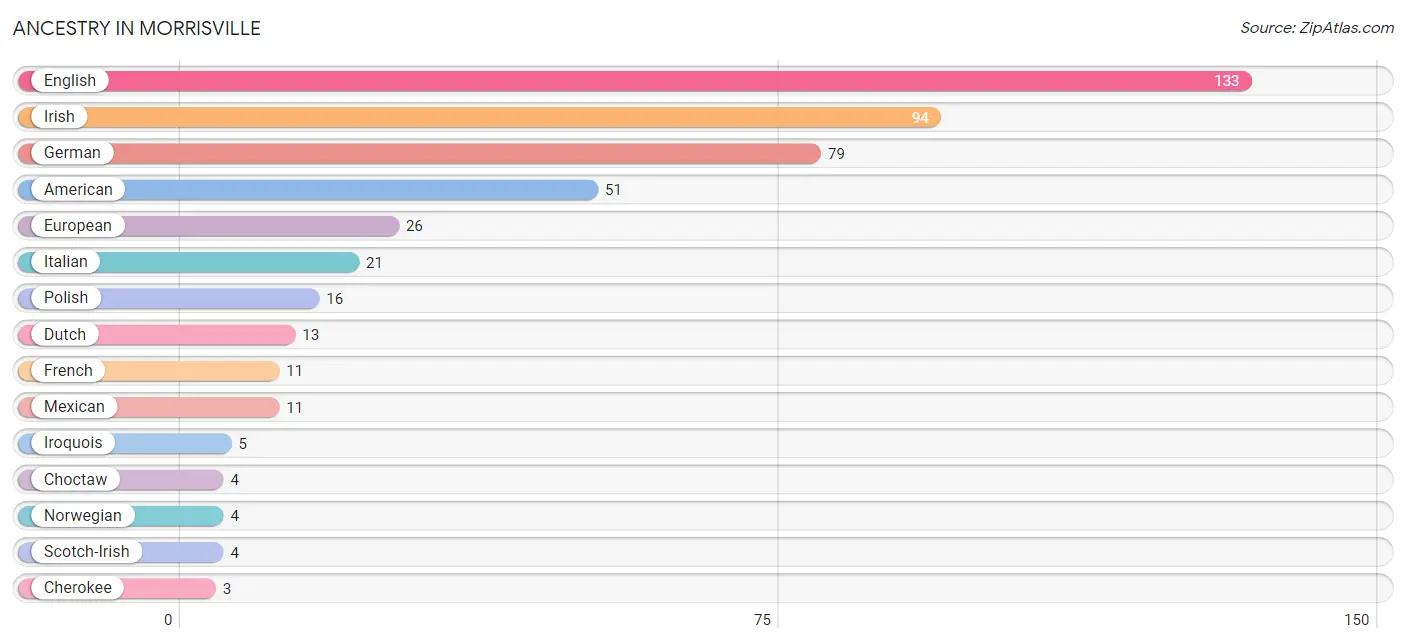
| Ancestry | # Population | % Population |
| American | 51 | 9.3% |
| Cherokee | 3 | 0.5% |
| Choctaw | 4 | 0.7% |
| Dutch | 13 | 2.4% |
| English | 133 | 24.2% |
| European | 26 | 4.7% |
| French | 11 | 2.0% |
| German | 79 | 14.4% |
| Irish | 94 | 17.1% |
| Iroquois | 5 | 0.9% |
| Italian | 21 | 3.8% |
| Mexican | 11 | 2.0% |
| Norwegian | 4 | 0.7% |
| Polish | 16 | 2.9% |
| Scotch-Irish | 4 | 0.7% |
| Spaniard | 2 | 0.4% |
| Welsh | 1 | 0.2% | View All 17 Rows |
Immigrants in Morrisville

| Immigration Origin | # Population | % Population | View All 0 Rows |
Sex and Age in Morrisville
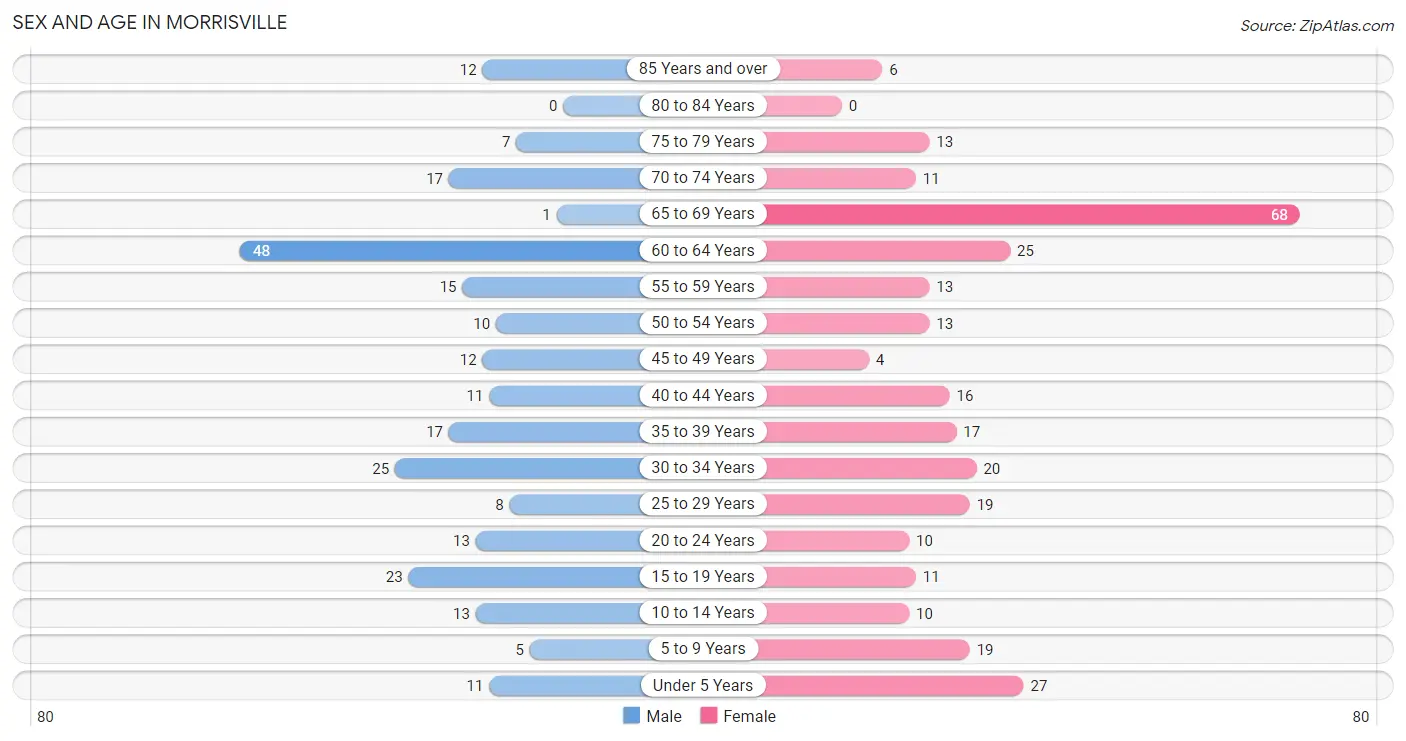
Sex and Age in Morrisville
The most populous age groups in Morrisville are 60 to 64 Years (48 | 19.4%) for men and 65 to 69 Years (68 | 22.5%) for women.
| Age Bracket | Male | Female |
| Under 5 Years | 11 (4.4%) | 27 (8.9%) |
| 5 to 9 Years | 5 (2.0%) | 19 (6.3%) |
| 10 to 14 Years | 13 (5.2%) | 10 (3.3%) |
| 15 to 19 Years | 23 (9.3%) | 11 (3.6%) |
| 20 to 24 Years | 13 (5.2%) | 10 (3.3%) |
| 25 to 29 Years | 8 (3.2%) | 19 (6.3%) |
| 30 to 34 Years | 25 (10.1%) | 20 (6.6%) |
| 35 to 39 Years | 17 (6.9%) | 17 (5.6%) |
| 40 to 44 Years | 11 (4.4%) | 16 (5.3%) |
| 45 to 49 Years | 12 (4.8%) | 4 (1.3%) |
| 50 to 54 Years | 10 (4.0%) | 13 (4.3%) |
| 55 to 59 Years | 15 (6.0%) | 13 (4.3%) |
| 60 to 64 Years | 48 (19.4%) | 25 (8.3%) |
| 65 to 69 Years | 1 (0.4%) | 68 (22.5%) |
| 70 to 74 Years | 17 (6.9%) | 11 (3.6%) |
| 75 to 79 Years | 7 (2.8%) | 13 (4.3%) |
| 80 to 84 Years | 0 (0.0%) | 0 (0.0%) |
| 85 Years and over | 12 (4.8%) | 6 (2.0%) |
| Total | 248 (100.0%) | 302 (100.0%) |
Families and Households in Morrisville
Median Family Size in Morrisville
The median family size in Morrisville is 2.63 persons per family, with single male/father families (23 | 13.3%) accounting for the largest median family size of 3.09 persons per family. On the other hand, married-couple families (132 | 76.3%) represent the smallest median family size with 2.49 persons per family.
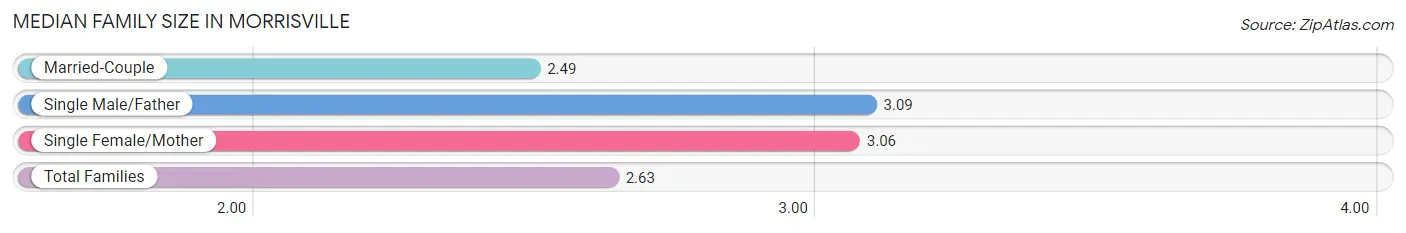
| Family Type | # Families | Family Size |
| Married-Couple | 132 (76.3%) | 2.49 |
| Single Male/Father | 23 (13.3%) | 3.09 |
| Single Female/Mother | 18 (10.4%) | 3.06 |
| Total Families | 173 (100.0%) | 2.63 |
Median Household Size in Morrisville
The median household size in Morrisville is 2.35 persons per household, with single male/father households (23 | 9.8%) accounting for the largest median household size of 3.48 persons per household. non-family households (61 | 26.1%) represent the smallest median household size with 1.16 persons per household.
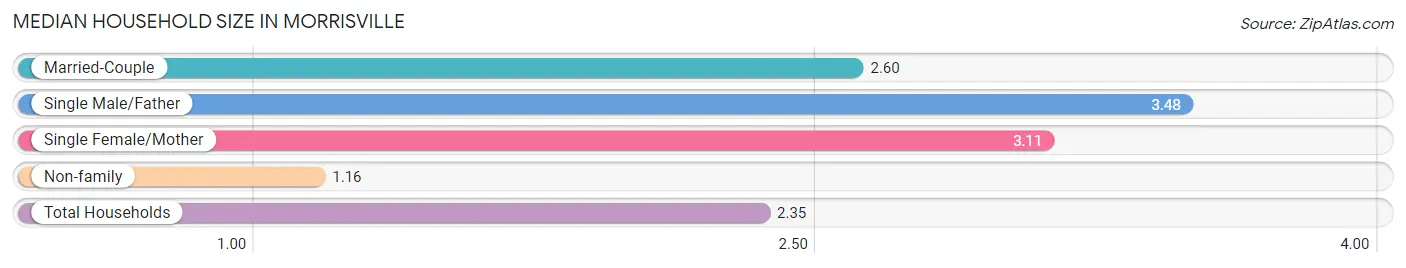
| Household Type | # Households | Household Size |
| Married-Couple | 132 (56.4%) | 2.60 |
| Single Male/Father | 23 (9.8%) | 3.48 |
| Single Female/Mother | 18 (7.7%) | 3.11 |
| Non-family | 61 (26.1%) | 1.16 |
| Total Households | 234 (100.0%) | 2.35 |
Household Size by Marriage Status in Morrisville
Out of a total of 234 households in Morrisville, 173 (73.9%) are family households, while 61 (26.1%) are nonfamily households. The most numerous type of family households are 2-person households, comprising 101, and the most common type of nonfamily households are 1-person households, comprising 58.
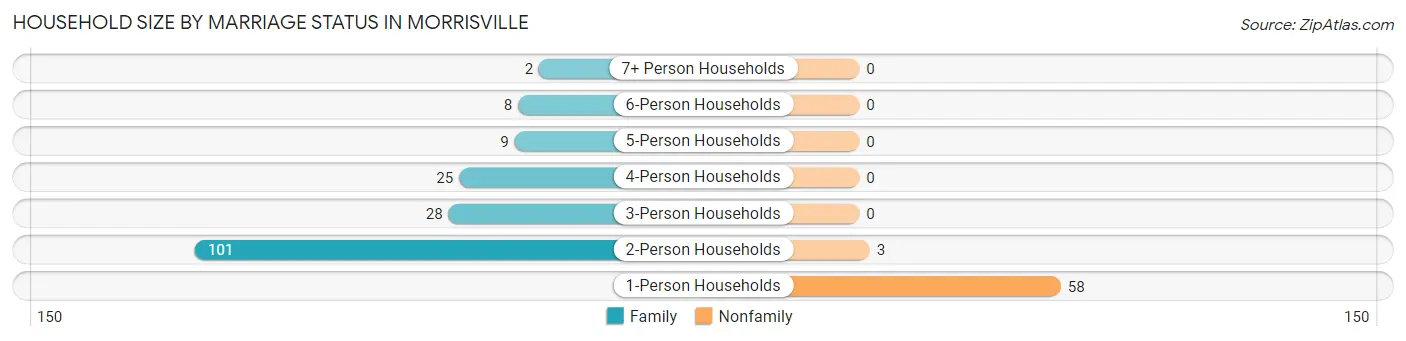
| Household Size | Family Households | Nonfamily Households |
| 1-Person Households | - | 58 (24.8%) |
| 2-Person Households | 101 (43.2%) | 3 (1.3%) |
| 3-Person Households | 28 (12.0%) | 0 (0.0%) |
| 4-Person Households | 25 (10.7%) | 0 (0.0%) |
| 5-Person Households | 9 (3.8%) | 0 (0.0%) |
| 6-Person Households | 8 (3.4%) | 0 (0.0%) |
| 7+ Person Households | 2 (0.9%) | 0 (0.0%) |
| Total | 173 (73.9%) | 61 (26.1%) |
Female Fertility in Morrisville
Fertility by Age in Morrisville
Average fertility rate in Morrisville is 144.0 births per 1,000 women. Women in the age bracket of 20 to 34 years have the highest fertility rate with 204.0 births per 1,000 women. Women in the age bracket of 20 to 34 years acount for 71.4% of all women with births.
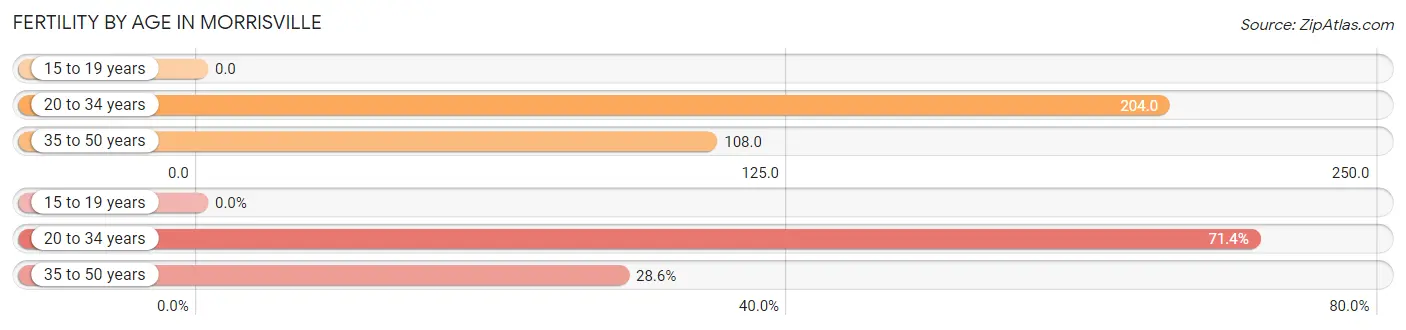
| Age Bracket | Women with Births | Births / 1,000 Women |
| 15 to 19 years | 0 (0.0%) | 0.0 |
| 20 to 34 years | 10 (71.4%) | 204.0 |
| 35 to 50 years | 4 (28.6%) | 108.0 |
| Total | 14 (100.0%) | 144.0 |
Fertility by Age by Marriage Status in Morrisville
42.9% of women with births (14) in Morrisville are married. The highest percentage of unmarried women with births falls into 35 to 50 years age bracket with 100.0% of them unmarried at the time of birth, while the lowest percentage of unmarried women with births belong to 20 to 34 years age bracket with 40.0% of them unmarried.
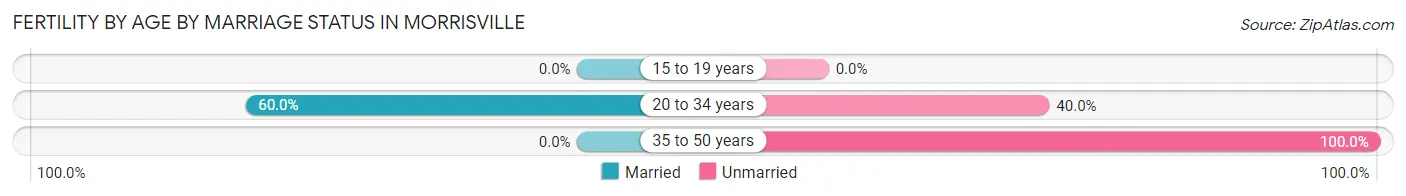
| Age Bracket | Married | Unmarried |
| 15 to 19 years | 0 (0.0%) | 0 (0.0%) |
| 20 to 34 years | 6 (60.0%) | 4 (40.0%) |
| 35 to 50 years | 0 (0.0%) | 4 (100.0%) |
| Total | 6 (42.9%) | 8 (57.1%) |
Fertility by Education in Morrisville
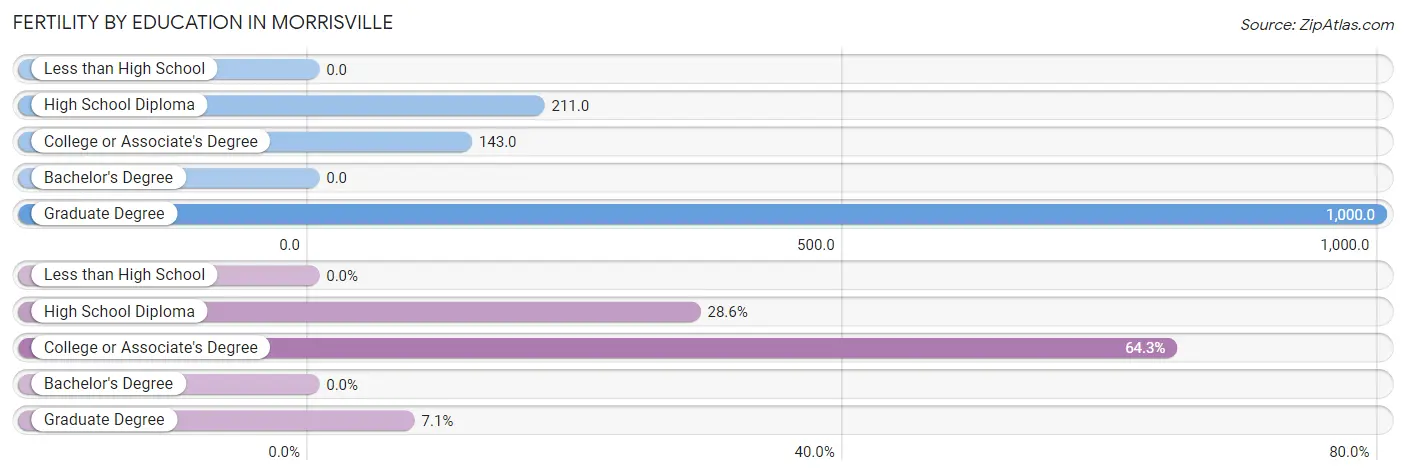
| Educational Attainment | Women with Births | Births / 1,000 Women |
| Less than High School | 0 (0.0%) | 0.0 |
| High School Diploma | 4 (28.6%) | 211.0 |
| College or Associate's Degree | 9 (64.3%) | 143.0 |
| Bachelor's Degree | 0 (0.0%) | 0.0 |
| Graduate Degree | 1 (7.1%) | 1,000.0 |
| Total | 14 (100.0%) | 144.0 |
Fertility by Education by Marriage Status in Morrisville
57.1% of women with births in Morrisville are unmarried. Women with the educational attainment of graduate degree are most likely to be married with 100.0% of them married at childbirth, while women with the educational attainment of high school diploma are least likely to be married with 100.0% of them unmarried at childbirth.
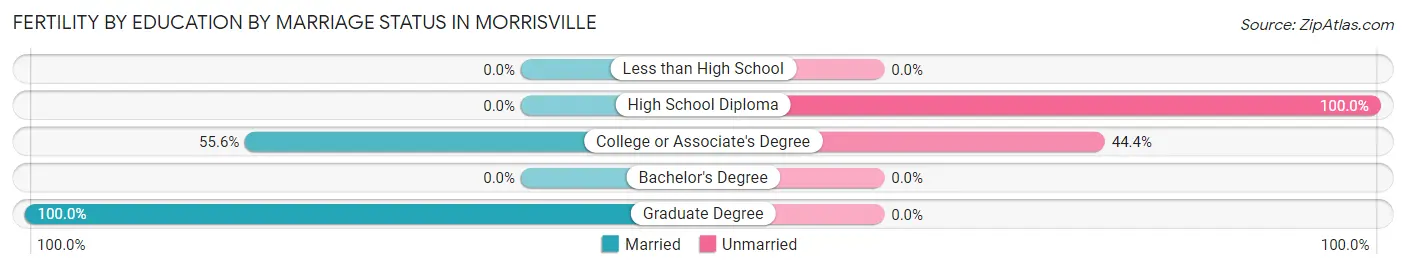
| Educational Attainment | Married | Unmarried |
| Less than High School | 0 (0.0%) | 0 (0.0%) |
| High School Diploma | 0 (0.0%) | 4 (100.0%) |
| College or Associate's Degree | 5 (55.6%) | 4 (44.4%) |
| Bachelor's Degree | 0 (0.0%) | 0 (0.0%) |
| Graduate Degree | 1 (100.0%) | 0 (0.0%) |
| Total | 6 (42.9%) | 8 (57.1%) |
Employment Characteristics in Morrisville
Employment by Class of Employer in Morrisville
Among the 276 employed individuals in Morrisville, private company employees (209 | 75.7%), not-for-profit organizations (28 | 10.1%), and local government employees (15 | 5.4%) make up the most common classes of employment.
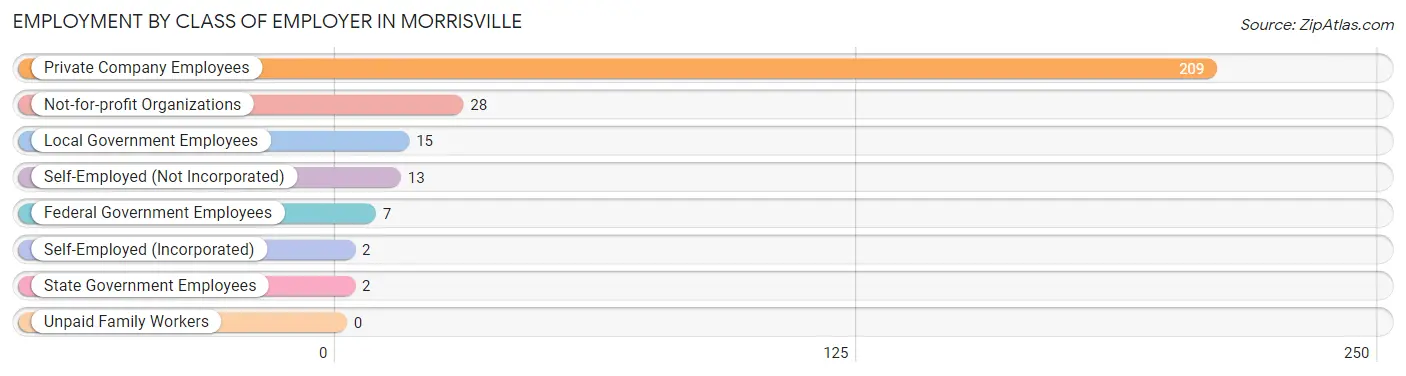
| Employer Class | # Employees | % Employees |
| Private Company Employees | 209 | 75.7% |
| Self-Employed (Incorporated) | 2 | 0.7% |
| Self-Employed (Not Incorporated) | 13 | 4.7% |
| Not-for-profit Organizations | 28 | 10.1% |
| Local Government Employees | 15 | 5.4% |
| State Government Employees | 2 | 0.7% |
| Federal Government Employees | 7 | 2.5% |
| Unpaid Family Workers | 0 | 0.0% |
| Total | 276 | 100.0% |
Employment Status by Age in Morrisville
According to the labor force statistics for Morrisville, out of the total population over 16 years of age (452), 65.5% or 296 individuals are in the labor force, with 4.1% or 12 of them unemployed. The age group with the highest labor force participation rate is 30 to 34 years, with 97.8% or 44 individuals in the labor force. Within the labor force, the 16 to 19 years age range has the highest percentage of unemployed individuals, with 40.0% or 2 of them being unemployed.
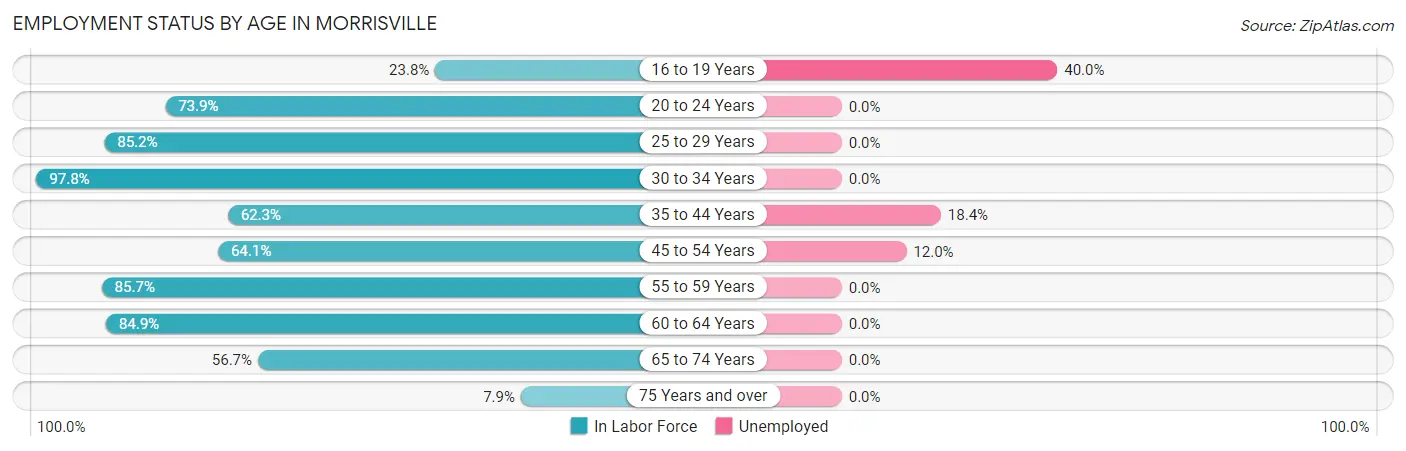
| Age Bracket | In Labor Force | Unemployed |
| 16 to 19 Years | 5 (23.8%) | 2 (40.0%) |
| 20 to 24 Years | 17 (73.9%) | 0 (0.0%) |
| 25 to 29 Years | 23 (85.2%) | 0 (0.0%) |
| 30 to 34 Years | 44 (97.8%) | 0 (0.0%) |
| 35 to 44 Years | 38 (62.3%) | 7 (18.4%) |
| 45 to 54 Years | 25 (64.1%) | 3 (12.0%) |
| 55 to 59 Years | 24 (85.7%) | 0 (0.0%) |
| 60 to 64 Years | 62 (84.9%) | 0 (0.0%) |
| 65 to 74 Years | 55 (56.7%) | 0 (0.0%) |
| 75 Years and over | 3 (7.9%) | 0 (0.0%) |
| Total | 296 (65.5%) | 12 (4.1%) |
Employment Status by Educational Attainment in Morrisville
According to labor force statistics for Morrisville, 79.1% of individuals (216) out of the total population between 25 and 64 years of age (273) are in the labor force, with 4.6% or 10 of them being unemployed. The group with the highest labor force participation rate are those with the educational attainment of bachelor's degree or higher, with 100.0% or 21 individuals in the labor force. Within the labor force, individuals with bachelor's degree or higher education have the highest percentage of unemployment, with 9.5% or 2 of them being unemployed.
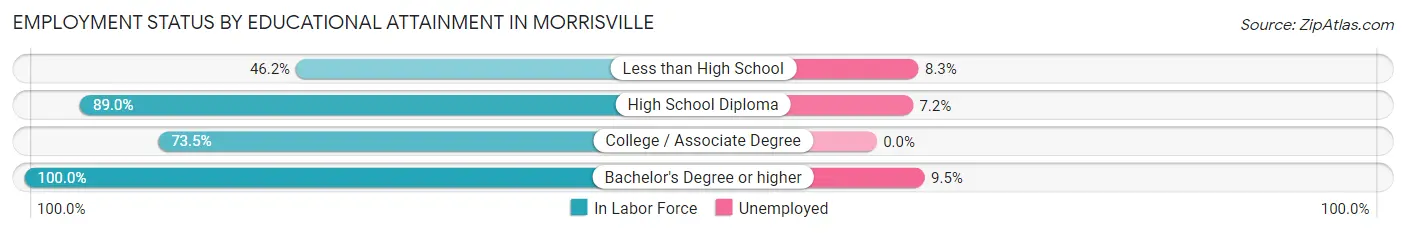
| Educational Attainment | In Labor Force | Unemployed |
| Less than High School | 12 (46.2%) | 2 (8.3%) |
| High School Diploma | 97 (89.0%) | 8 (7.2%) |
| College / Associate Degree | 86 (73.5%) | 0 (0.0%) |
| Bachelor's Degree or higher | 21 (100.0%) | 2 (9.5%) |
| Total | 216 (79.1%) | 13 (4.6%) |
Employment Occupations by Sex in Morrisville
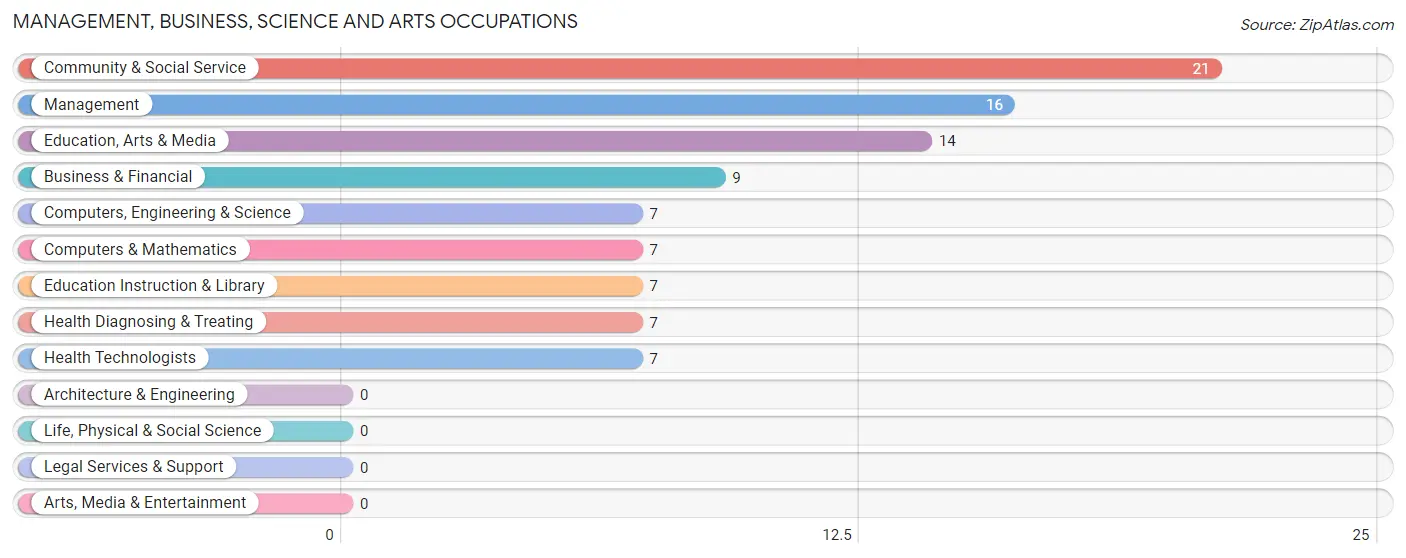
Management, Business, Science and Arts Occupations
The most common Management, Business, Science and Arts occupations in Morrisville are Community & Social Service (21 | 7.4%), Management (16 | 5.6%), Education, Arts & Media (14 | 4.9%), Business & Financial (9 | 3.2%), and Computers, Engineering & Science (7 | 2.5%).
Management, Business, Science and Arts Occupations by Sex
Within the Management, Business, Science and Arts occupations in Morrisville, the most male-oriented occupations are Business & Financial (100.0%), Computers, Engineering & Science (100.0%), and Computers & Mathematics (100.0%), while the most female-oriented occupations are Health Diagnosing & Treating (100.0%), Health Technologists (100.0%), and Education Instruction & Library (57.1%).
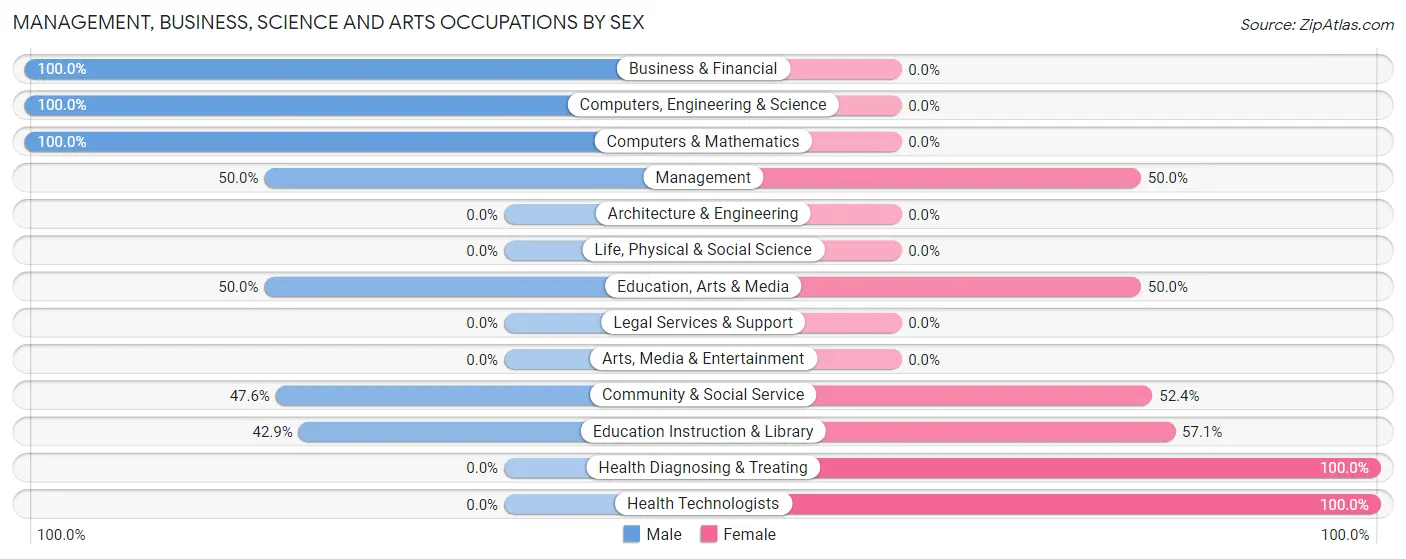
| Occupation | Male | Female |
| Management | 8 (50.0%) | 8 (50.0%) |
| Business & Financial | 9 (100.0%) | 0 (0.0%) |
| Computers, Engineering & Science | 7 (100.0%) | 0 (0.0%) |
| Computers & Mathematics | 7 (100.0%) | 0 (0.0%) |
| Architecture & Engineering | 0 (0.0%) | 0 (0.0%) |
| Life, Physical & Social Science | 0 (0.0%) | 0 (0.0%) |
| Community & Social Service | 10 (47.6%) | 11 (52.4%) |
| Education, Arts & Media | 7 (50.0%) | 7 (50.0%) |
| Legal Services & Support | 0 (0.0%) | 0 (0.0%) |
| Education Instruction & Library | 3 (42.9%) | 4 (57.1%) |
| Arts, Media & Entertainment | 0 (0.0%) | 0 (0.0%) |
| Health Diagnosing & Treating | 0 (0.0%) | 7 (100.0%) |
| Health Technologists | 0 (0.0%) | 7 (100.0%) |
| Total (Category) | 34 (56.7%) | 26 (43.3%) |
| Total (Overall) | 130 (45.8%) | 154 (54.2%) |
Services Occupations
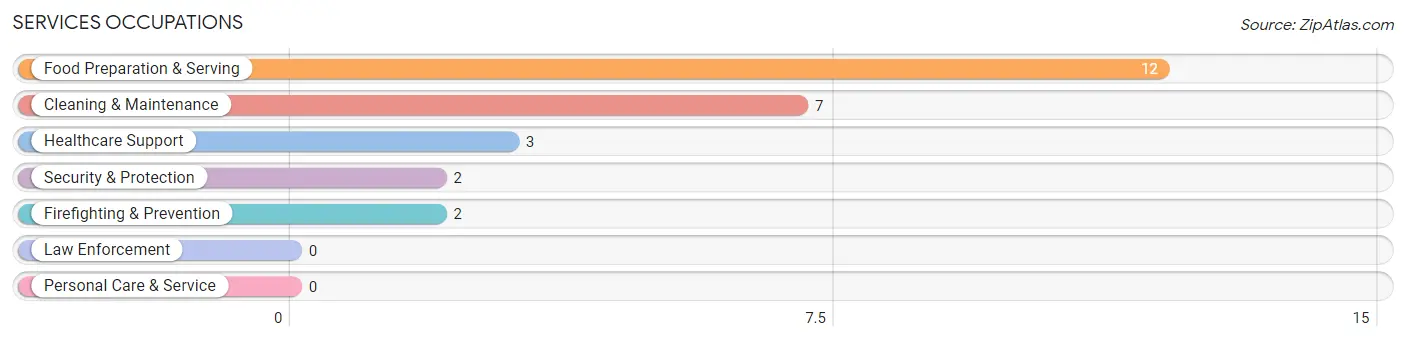
The most common Services occupations in Morrisville are Food Preparation & Serving (12 | 4.2%), Cleaning & Maintenance (7 | 2.5%), Healthcare Support (3 | 1.1%), Security & Protection (2 | 0.7%), and Firefighting & Prevention (2 | 0.7%).
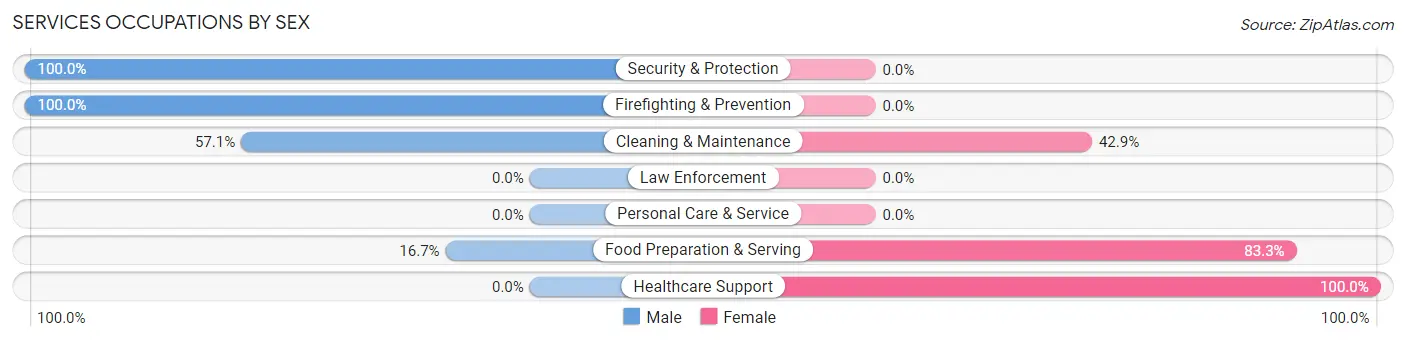
Services Occupations by Sex
Within the Services occupations in Morrisville, the most male-oriented occupations are Security & Protection (100.0%), Firefighting & Prevention (100.0%), and Cleaning & Maintenance (57.1%), while the most female-oriented occupations are Healthcare Support (100.0%), Food Preparation & Serving (83.3%), and Cleaning & Maintenance (42.9%).
| Occupation | Male | Female |
| Healthcare Support | 0 (0.0%) | 3 (100.0%) |
| Security & Protection | 2 (100.0%) | 0 (0.0%) |
| Firefighting & Prevention | 2 (100.0%) | 0 (0.0%) |
| Law Enforcement | 0 (0.0%) | 0 (0.0%) |
| Food Preparation & Serving | 2 (16.7%) | 10 (83.3%) |
| Cleaning & Maintenance | 4 (57.1%) | 3 (42.9%) |
| Personal Care & Service | 0 (0.0%) | 0 (0.0%) |
| Total (Category) | 8 (33.3%) | 16 (66.7%) |
| Total (Overall) | 130 (45.8%) | 154 (54.2%) |
Sales and Office Occupations
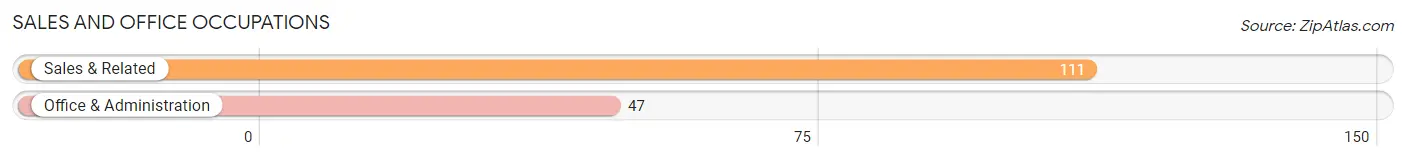
The most common Sales and Office occupations in Morrisville are Sales & Related (111 | 39.1%), and Office & Administration (47 | 16.6%).
Sales and Office Occupations by Sex
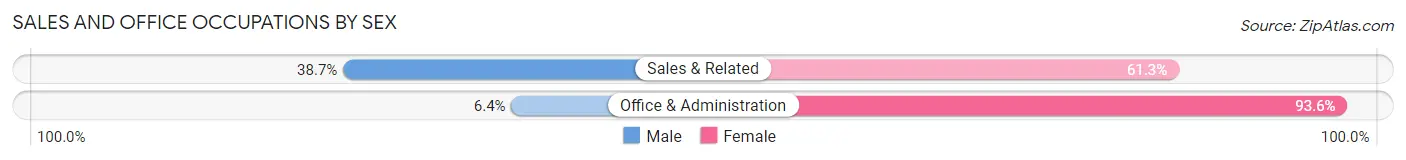
| Occupation | Male | Female |
| Sales & Related | 43 (38.7%) | 68 (61.3%) |
| Office & Administration | 3 (6.4%) | 44 (93.6%) |
| Total (Category) | 46 (29.1%) | 112 (70.9%) |
| Total (Overall) | 130 (45.8%) | 154 (54.2%) |
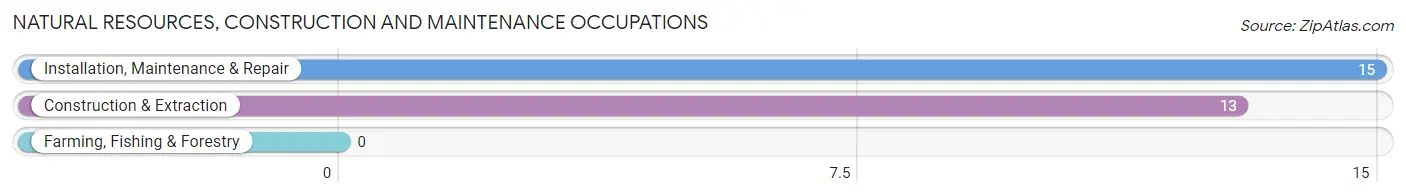
Natural Resources, Construction and Maintenance Occupations
The most common Natural Resources, Construction and Maintenance occupations in Morrisville are Installation, Maintenance & Repair (15 | 5.3%), and Construction & Extraction (13 | 4.6%).
Natural Resources, Construction and Maintenance Occupations by Sex
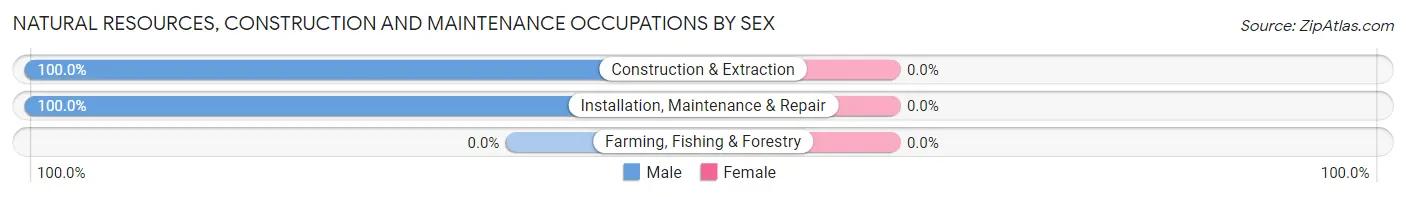
| Occupation | Male | Female |
| Farming, Fishing & Forestry | 0 (0.0%) | 0 (0.0%) |
| Construction & Extraction | 13 (100.0%) | 0 (0.0%) |
| Installation, Maintenance & Repair | 15 (100.0%) | 0 (0.0%) |
| Total (Category) | 28 (100.0%) | 0 (0.0%) |
| Total (Overall) | 130 (45.8%) | 154 (54.2%) |
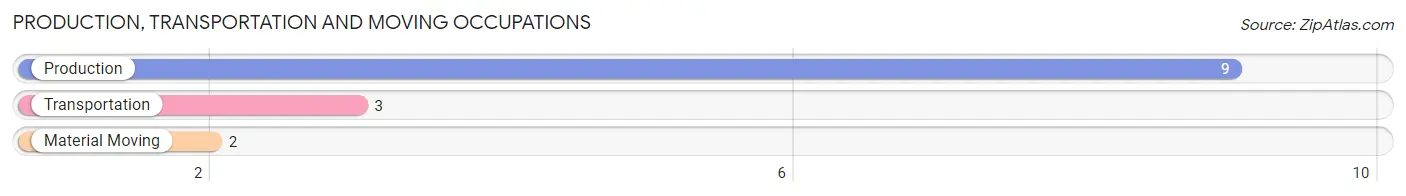
Production, Transportation and Moving Occupations
The most common Production, Transportation and Moving occupations in Morrisville are Production (9 | 3.2%), Transportation (3 | 1.1%), and Material Moving (2 | 0.7%).
Production, Transportation and Moving Occupations by Sex
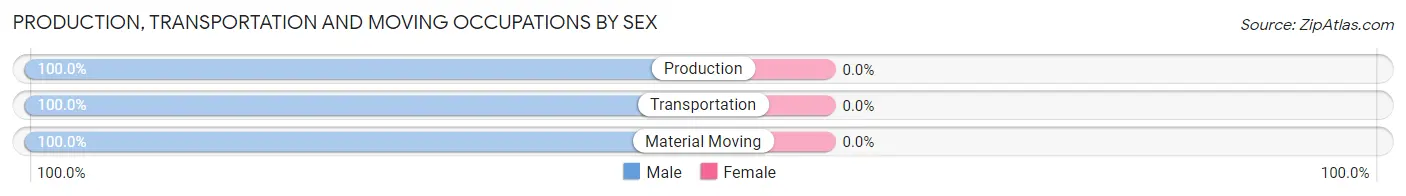
| Occupation | Male | Female |
| Production | 9 (100.0%) | 0 (0.0%) |
| Transportation | 3 (100.0%) | 0 (0.0%) |
| Material Moving | 2 (100.0%) | 0 (0.0%) |
| Total (Category) | 14 (100.0%) | 0 (0.0%) |
| Total (Overall) | 130 (45.8%) | 154 (54.2%) |
Employment Industries by Sex in Morrisville
Employment Industries in Morrisville
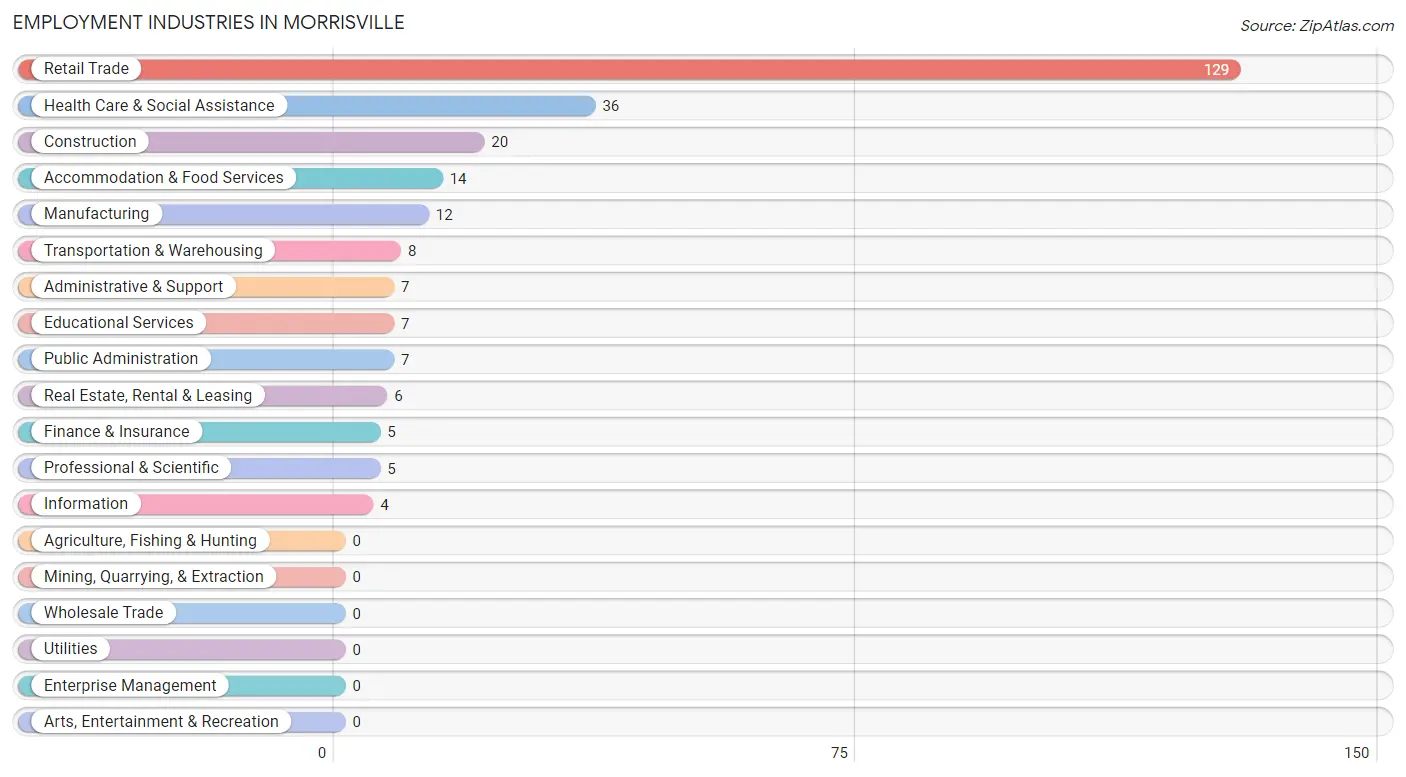
The major employment industries in Morrisville include Retail Trade (129 | 45.4%), Health Care & Social Assistance (36 | 12.7%), Construction (20 | 7.0%), Accommodation & Food Services (14 | 4.9%), and Manufacturing (12 | 4.2%).
Employment Industries by Sex in Morrisville
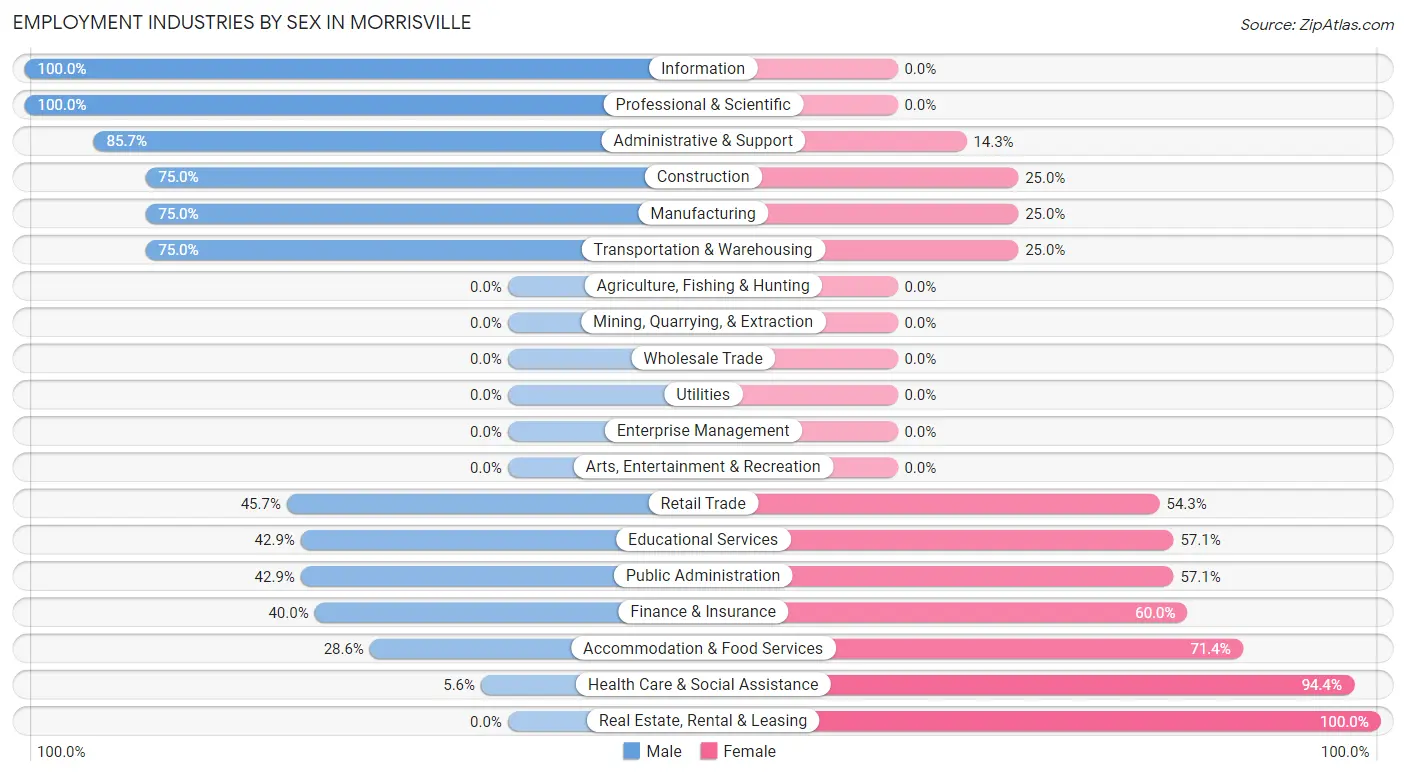
The Morrisville industries that see more men than women are Information (100.0%), Professional & Scientific (100.0%), and Administrative & Support (85.7%), whereas the industries that tend to have a higher number of women are Real Estate, Rental & Leasing (100.0%), Health Care & Social Assistance (94.4%), and Accommodation & Food Services (71.4%).
| Industry | Male | Female |
| Agriculture, Fishing & Hunting | 0 (0.0%) | 0 (0.0%) |
| Mining, Quarrying, & Extraction | 0 (0.0%) | 0 (0.0%) |
| Construction | 15 (75.0%) | 5 (25.0%) |
| Manufacturing | 9 (75.0%) | 3 (25.0%) |
| Wholesale Trade | 0 (0.0%) | 0 (0.0%) |
| Retail Trade | 59 (45.7%) | 70 (54.3%) |
| Transportation & Warehousing | 6 (75.0%) | 2 (25.0%) |
| Utilities | 0 (0.0%) | 0 (0.0%) |
| Information | 4 (100.0%) | 0 (0.0%) |
| Finance & Insurance | 2 (40.0%) | 3 (60.0%) |
| Real Estate, Rental & Leasing | 0 (0.0%) | 6 (100.0%) |
| Professional & Scientific | 5 (100.0%) | 0 (0.0%) |
| Enterprise Management | 0 (0.0%) | 0 (0.0%) |
| Administrative & Support | 6 (85.7%) | 1 (14.3%) |
| Educational Services | 3 (42.9%) | 4 (57.1%) |
| Health Care & Social Assistance | 2 (5.6%) | 34 (94.4%) |
| Arts, Entertainment & Recreation | 0 (0.0%) | 0 (0.0%) |
| Accommodation & Food Services | 4 (28.6%) | 10 (71.4%) |
| Public Administration | 3 (42.9%) | 4 (57.1%) |
| Total | 130 (45.8%) | 154 (54.2%) |
Education in Morrisville
School Enrollment in Morrisville
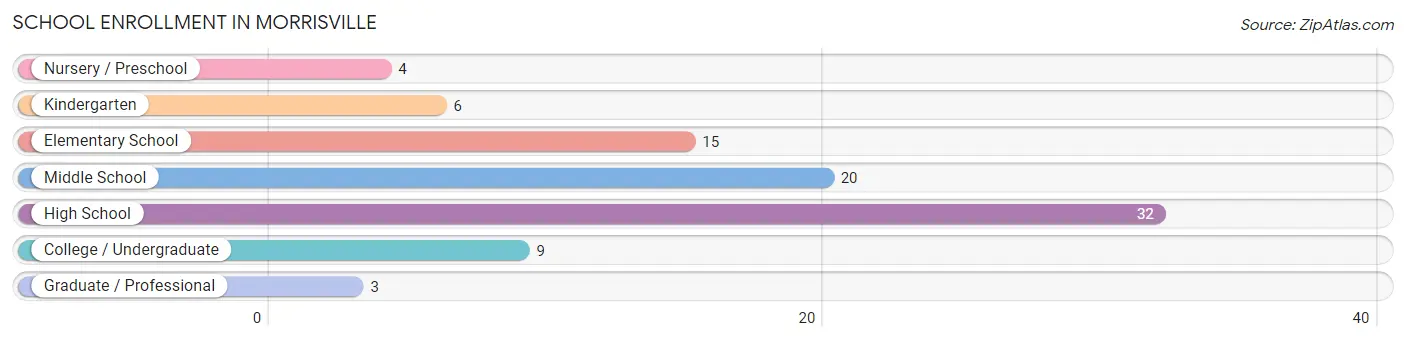
The most common levels of schooling among the 89 students in Morrisville are high school (32 | 36.0%), middle school (20 | 22.5%), and elementary school (15 | 16.9%).
| School Level | # Students | % Students |
| Nursery / Preschool | 4 | 4.5% |
| Kindergarten | 6 | 6.7% |
| Elementary School | 15 | 16.9% |
| Middle School | 20 | 22.5% |
| High School | 32 | 36.0% |
| College / Undergraduate | 9 | 10.1% |
| Graduate / Professional | 3 | 3.4% |
| Total | 89 | 100.0% |
School Enrollment by Age by Funding Source in Morrisville
Out of a total of 89 students who are enrolled in schools in Morrisville, 3 (3.4%) attend a private institution, while the remaining 86 (96.6%) are enrolled in public schools. The age group of 35 years and over has the highest likelihood of being enrolled in private schools, with 3 (42.9% in the age bracket) enrolled. Conversely, the age group of 3 to 4 year olds has the lowest likelihood of being enrolled in a private school, with 4 (100.0% in the age bracket) attending a public institution.
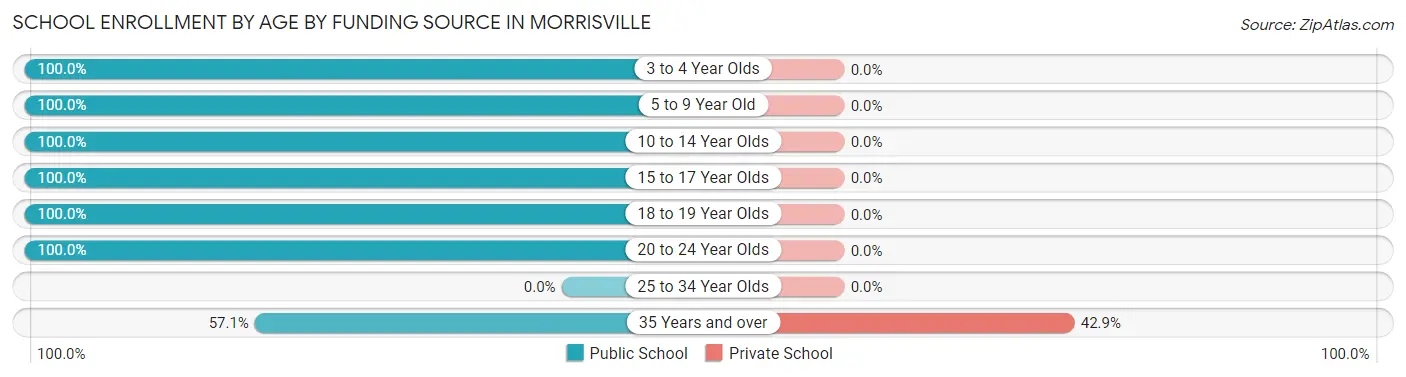
| Age Bracket | Public School | Private School |
| 3 to 4 Year Olds | 4 (100.0%) | 0 (0.0%) |
| 5 to 9 Year Old | 19 (100.0%) | 0 (0.0%) |
| 10 to 14 Year Olds | 23 (100.0%) | 0 (0.0%) |
| 15 to 17 Year Olds | 28 (100.0%) | 0 (0.0%) |
| 18 to 19 Year Olds | 2 (100.0%) | 0 (0.0%) |
| 20 to 24 Year Olds | 6 (100.0%) | 0 (0.0%) |
| 25 to 34 Year Olds | 0 (0.0%) | 0 (0.0%) |
| 35 Years and over | 4 (57.1%) | 3 (42.9%) |
| Total | 86 (96.6%) | 3 (3.4%) |
Educational Attainment by Field of Study in Morrisville
Business (9 | 27.3%), education (7 | 21.2%), social sciences (5 | 15.1%), bio, nature & agricultural (4 | 12.1%), and liberal arts & history (3 | 9.1%) are the most common fields of study among 33 individuals in Morrisville who have obtained a bachelor's degree or higher.
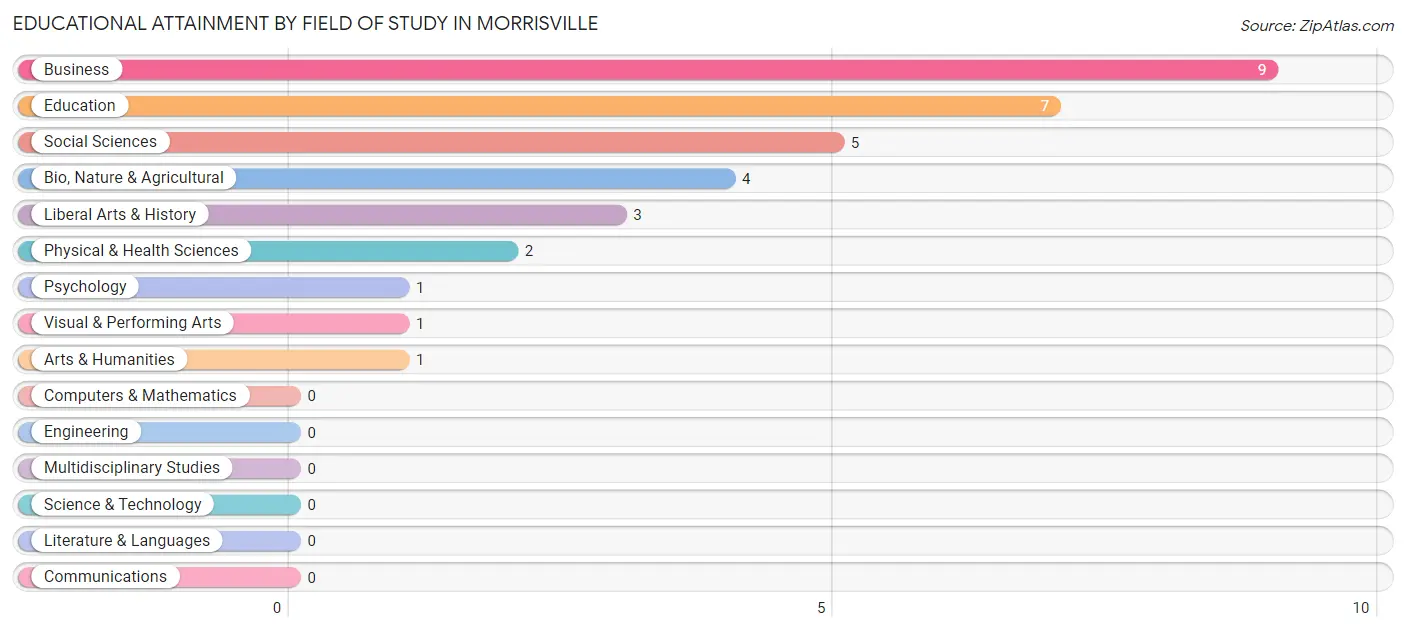
| Field of Study | # Graduates | % Graduates |
| Computers & Mathematics | 0 | 0.0% |
| Bio, Nature & Agricultural | 4 | 12.1% |
| Physical & Health Sciences | 2 | 6.1% |
| Psychology | 1 | 3.0% |
| Social Sciences | 5 | 15.1% |
| Engineering | 0 | 0.0% |
| Multidisciplinary Studies | 0 | 0.0% |
| Science & Technology | 0 | 0.0% |
| Business | 9 | 27.3% |
| Education | 7 | 21.2% |
| Literature & Languages | 0 | 0.0% |
| Liberal Arts & History | 3 | 9.1% |
| Visual & Performing Arts | 1 | 3.0% |
| Communications | 0 | 0.0% |
| Arts & Humanities | 1 | 3.0% |
| Total | 33 | 100.0% |
Transportation & Commute in Morrisville
Vehicle Availability by Sex in Morrisville
The most prevalent vehicle ownership categories in Morrisville are males with 1 vehicle (51, accounting for 39.2%) and females with 1 vehicle (59, making up 34.9%).
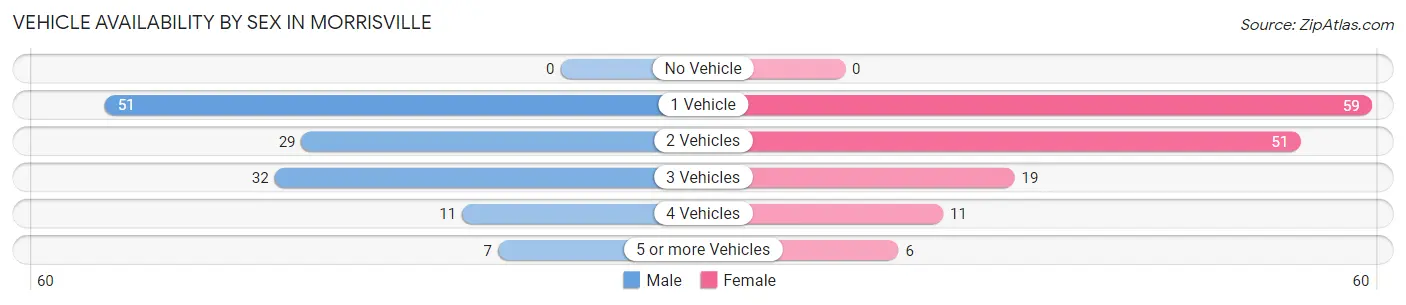
| Vehicles Available | Male | Female |
| No Vehicle | 0 (0.0%) | 0 (0.0%) |
| 1 Vehicle | 51 (39.2%) | 59 (40.4%) |
| 2 Vehicles | 29 (22.3%) | 51 (34.9%) |
| 3 Vehicles | 32 (24.6%) | 19 (13.0%) |
| 4 Vehicles | 11 (8.5%) | 11 (7.5%) |
| 5 or more Vehicles | 7 (5.4%) | 6 (4.1%) |
| Total | 130 (100.0%) | 146 (100.0%) |
Commute Time in Morrisville
The most frequently occuring commute durations in Morrisville are less than 5 minutes (102 commuters, 39.7%), 45 to 59 minutes (26 commuters, 10.1%), and 25 to 29 minutes (24 commuters, 9.3%).
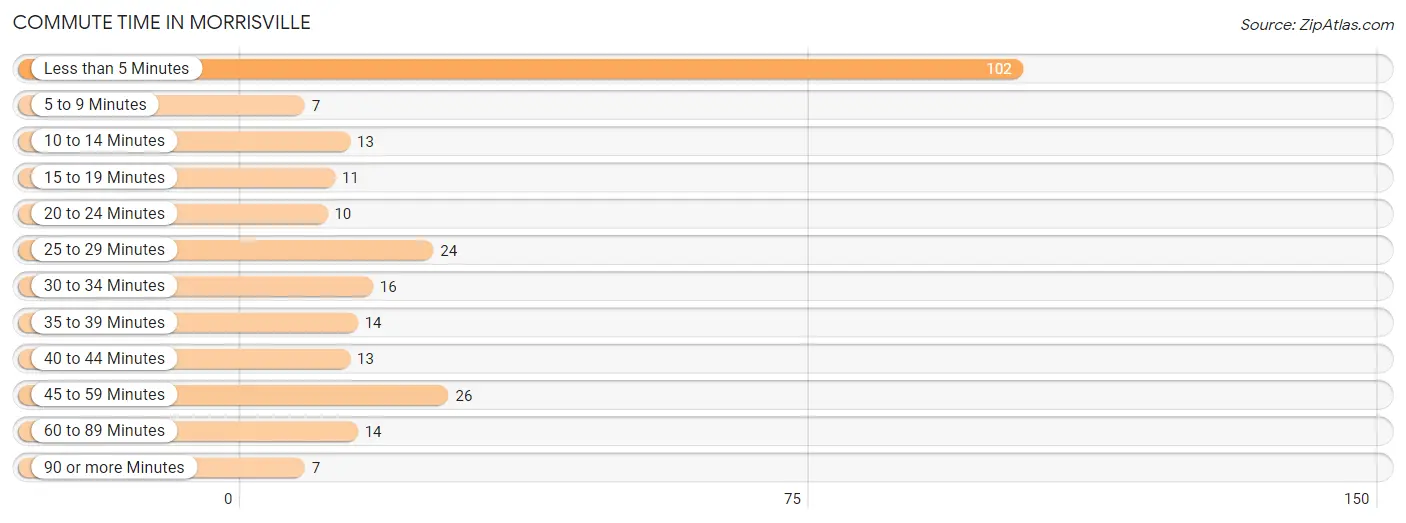
| Commute Time | # Commuters | % Commuters |
| Less than 5 Minutes | 102 | 39.7% |
| 5 to 9 Minutes | 7 | 2.7% |
| 10 to 14 Minutes | 13 | 5.1% |
| 15 to 19 Minutes | 11 | 4.3% |
| 20 to 24 Minutes | 10 | 3.9% |
| 25 to 29 Minutes | 24 | 9.3% |
| 30 to 34 Minutes | 16 | 6.2% |
| 35 to 39 Minutes | 14 | 5.4% |
| 40 to 44 Minutes | 13 | 5.1% |
| 45 to 59 Minutes | 26 | 10.1% |
| 60 to 89 Minutes | 14 | 5.4% |
| 90 or more Minutes | 7 | 2.7% |
Commute Time by Sex in Morrisville
The most common commute times in Morrisville are less than 5 minutes (47 commuters, 37.6%) for males and less than 5 minutes (55 commuters, 41.7%) for females.
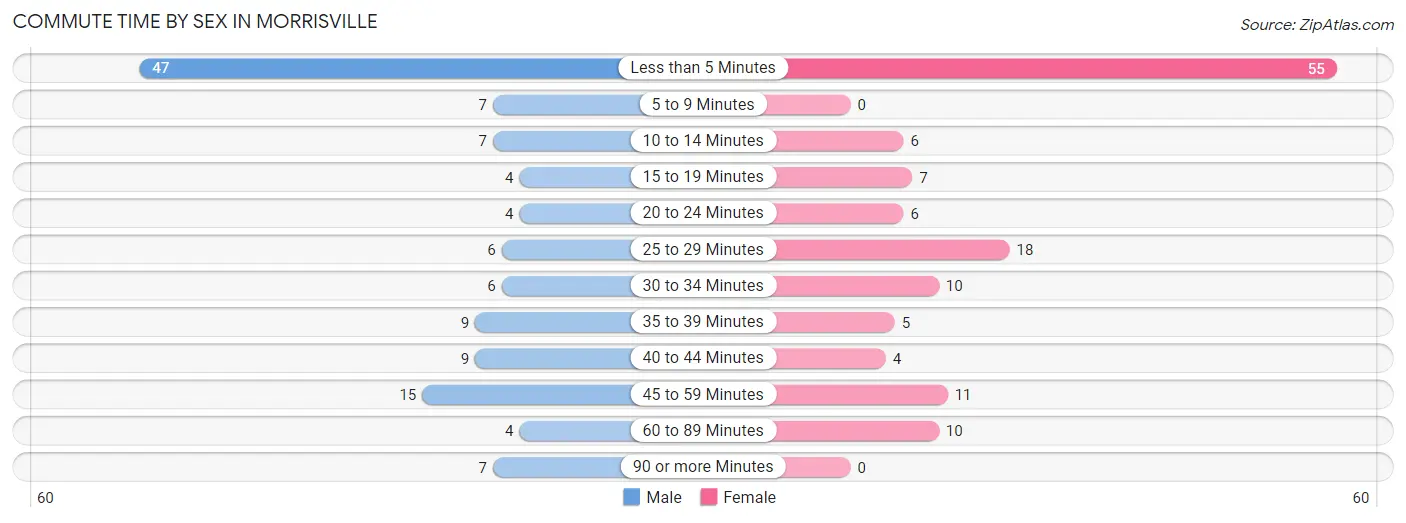
| Commute Time | Male | Female |
| Less than 5 Minutes | 47 (37.6%) | 55 (41.7%) |
| 5 to 9 Minutes | 7 (5.6%) | 0 (0.0%) |
| 10 to 14 Minutes | 7 (5.6%) | 6 (4.5%) |
| 15 to 19 Minutes | 4 (3.2%) | 7 (5.3%) |
| 20 to 24 Minutes | 4 (3.2%) | 6 (4.5%) |
| 25 to 29 Minutes | 6 (4.8%) | 18 (13.6%) |
| 30 to 34 Minutes | 6 (4.8%) | 10 (7.6%) |
| 35 to 39 Minutes | 9 (7.2%) | 5 (3.8%) |
| 40 to 44 Minutes | 9 (7.2%) | 4 (3.0%) |
| 45 to 59 Minutes | 15 (12.0%) | 11 (8.3%) |
| 60 to 89 Minutes | 4 (3.2%) | 10 (7.6%) |
| 90 or more Minutes | 7 (5.6%) | 0 (0.0%) |
Time of Departure to Work by Sex in Morrisville
The most frequent times of departure to work in Morrisville are 6:00 AM to 6:29 AM (51, 40.8%) for males and 6:00 AM to 6:29 AM (57, 43.2%) for females.
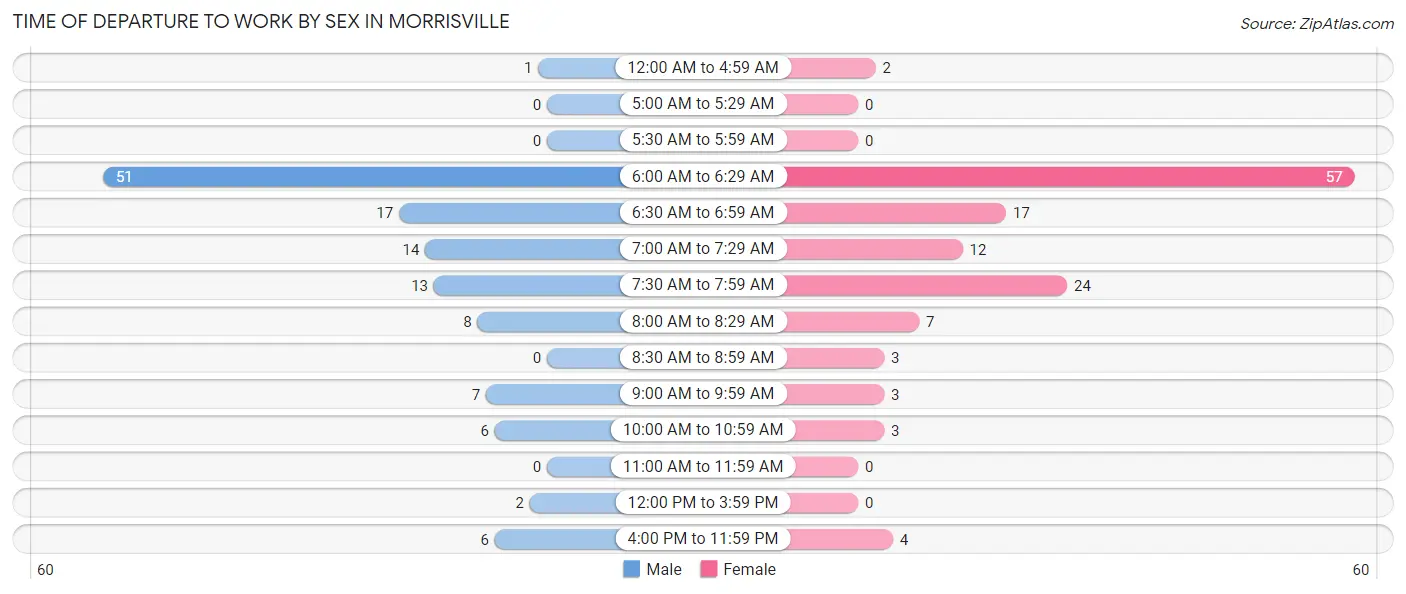
| Time of Departure | Male | Female |
| 12:00 AM to 4:59 AM | 1 (0.8%) | 2 (1.5%) |
| 5:00 AM to 5:29 AM | 0 (0.0%) | 0 (0.0%) |
| 5:30 AM to 5:59 AM | 0 (0.0%) | 0 (0.0%) |
| 6:00 AM to 6:29 AM | 51 (40.8%) | 57 (43.2%) |
| 6:30 AM to 6:59 AM | 17 (13.6%) | 17 (12.9%) |
| 7:00 AM to 7:29 AM | 14 (11.2%) | 12 (9.1%) |
| 7:30 AM to 7:59 AM | 13 (10.4%) | 24 (18.2%) |
| 8:00 AM to 8:29 AM | 8 (6.4%) | 7 (5.3%) |
| 8:30 AM to 8:59 AM | 0 (0.0%) | 3 (2.3%) |
| 9:00 AM to 9:59 AM | 7 (5.6%) | 3 (2.3%) |
| 10:00 AM to 10:59 AM | 6 (4.8%) | 3 (2.3%) |
| 11:00 AM to 11:59 AM | 0 (0.0%) | 0 (0.0%) |
| 12:00 PM to 3:59 PM | 2 (1.6%) | 0 (0.0%) |
| 4:00 PM to 11:59 PM | 6 (4.8%) | 4 (3.0%) |
| Total | 125 (100.0%) | 132 (100.0%) |
Housing Occupancy in Morrisville
Occupancy by Ownership in Morrisville
Of the total 234 dwellings in Morrisville, owner-occupied units account for 113 (48.3%), while renter-occupied units make up 121 (51.7%).
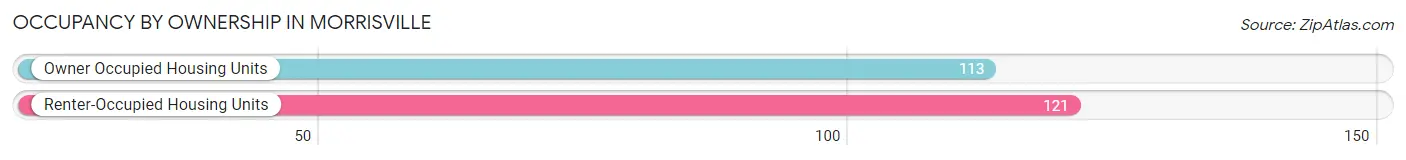
| Occupancy | # Housing Units | % Housing Units |
| Owner Occupied Housing Units | 113 | 48.3% |
| Renter-Occupied Housing Units | 121 | 51.7% |
| Total Occupied Housing Units | 234 | 100.0% |
Occupancy by Household Size in Morrisville
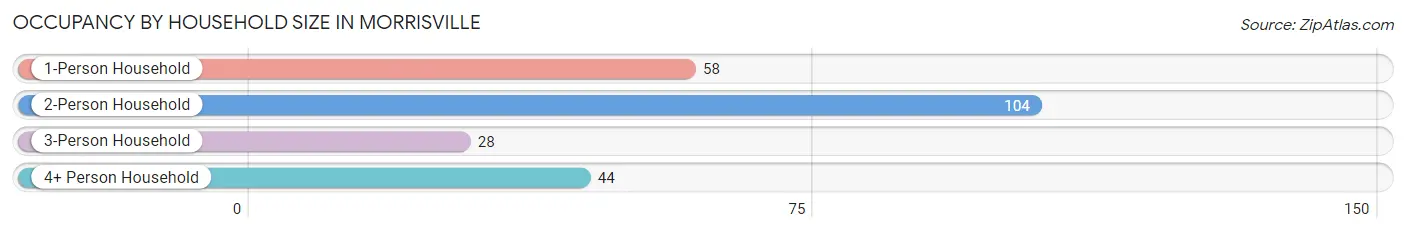
| Household Size | # Housing Units | % Housing Units |
| 1-Person Household | 58 | 24.8% |
| 2-Person Household | 104 | 44.4% |
| 3-Person Household | 28 | 12.0% |
| 4+ Person Household | 44 | 18.8% |
| Total Housing Units | 234 | 100.0% |
Occupancy by Ownership by Household Size in Morrisville
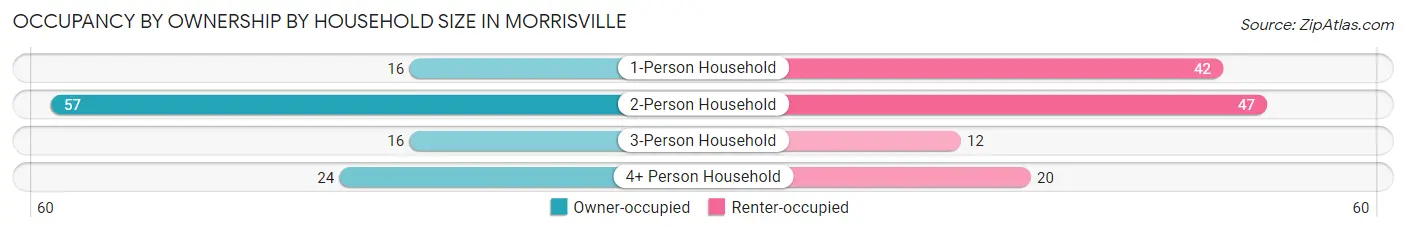
| Household Size | Owner-occupied | Renter-occupied |
| 1-Person Household | 16 (27.6%) | 42 (72.4%) |
| 2-Person Household | 57 (54.8%) | 47 (45.2%) |
| 3-Person Household | 16 (57.1%) | 12 (42.9%) |
| 4+ Person Household | 24 (54.5%) | 20 (45.5%) |
| Total Housing Units | 113 (48.3%) | 121 (51.7%) |
Occupancy by Educational Attainment in Morrisville
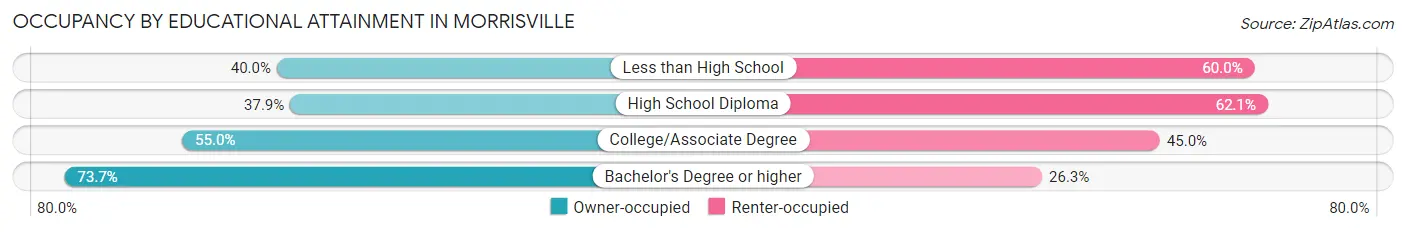
| Household Size | Owner-occupied | Renter-occupied |
| Less than High School | 8 (40.0%) | 12 (60.0%) |
| High School Diploma | 36 (37.9%) | 59 (62.1%) |
| College/Associate Degree | 55 (55.0%) | 45 (45.0%) |
| Bachelor's Degree or higher | 14 (73.7%) | 5 (26.3%) |
Occupancy by Age of Householder in Morrisville
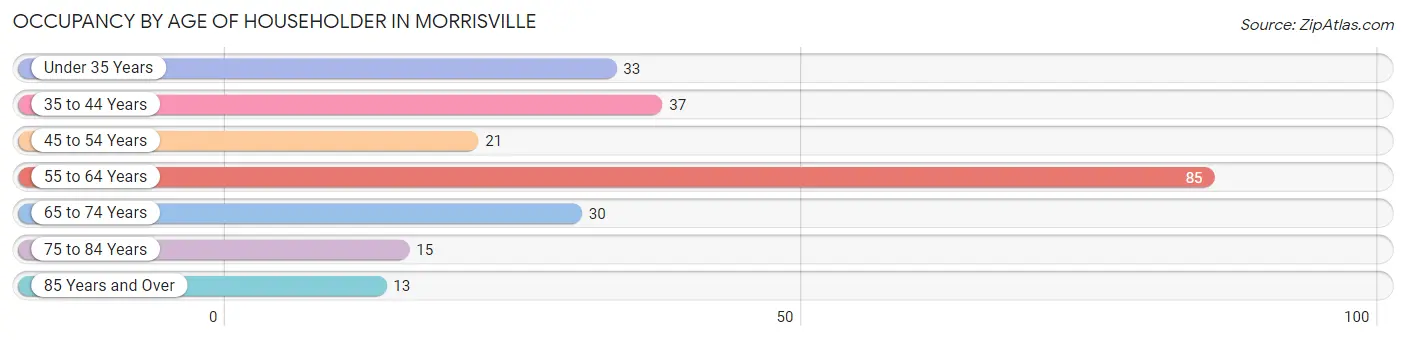
| Age Bracket | # Households | % Households |
| Under 35 Years | 33 | 14.1% |
| 35 to 44 Years | 37 | 15.8% |
| 45 to 54 Years | 21 | 9.0% |
| 55 to 64 Years | 85 | 36.3% |
| 65 to 74 Years | 30 | 12.8% |
| 75 to 84 Years | 15 | 6.4% |
| 85 Years and Over | 13 | 5.6% |
| Total | 234 | 100.0% |
Housing Finances in Morrisville
Median Income by Occupancy in Morrisville
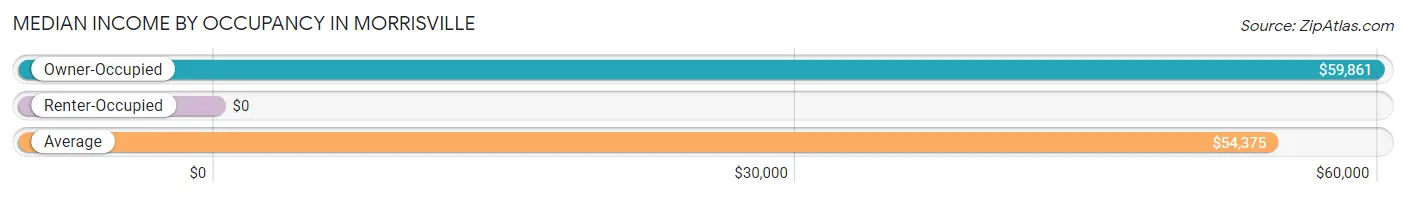
| Occupancy Type | # Households | Median Income |
| Owner-Occupied | 113 (48.3%) | $59,861 |
| Renter-Occupied | 121 (51.7%) | $0 |
| Average | 234 (100.0%) | $54,375 |
Occupancy by Householder Income Bracket in Morrisville
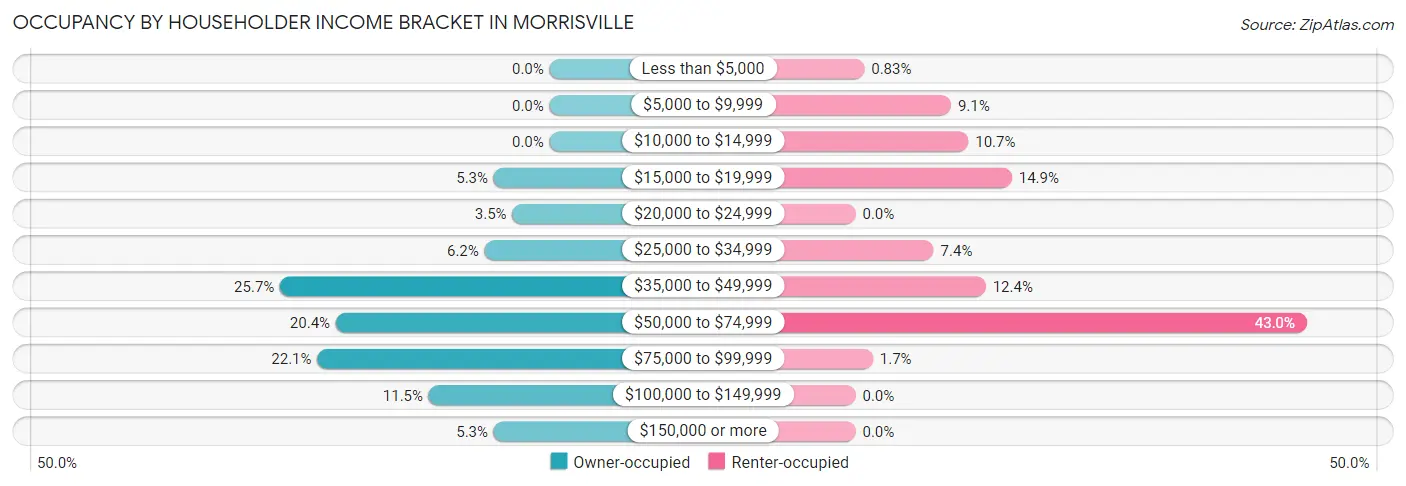
| Income Bracket | Owner-occupied | Renter-occupied |
| Less than $5,000 | 0 (0.0%) | 1 (0.8%) |
| $5,000 to $9,999 | 0 (0.0%) | 11 (9.1%) |
| $10,000 to $14,999 | 0 (0.0%) | 13 (10.7%) |
| $15,000 to $19,999 | 6 (5.3%) | 18 (14.9%) |
| $20,000 to $24,999 | 4 (3.5%) | 0 (0.0%) |
| $25,000 to $34,999 | 7 (6.2%) | 9 (7.4%) |
| $35,000 to $49,999 | 29 (25.7%) | 15 (12.4%) |
| $50,000 to $74,999 | 23 (20.3%) | 52 (43.0%) |
| $75,000 to $99,999 | 25 (22.1%) | 2 (1.7%) |
| $100,000 to $149,999 | 13 (11.5%) | 0 (0.0%) |
| $150,000 or more | 6 (5.3%) | 0 (0.0%) |
| Total | 113 (100.0%) | 121 (100.0%) |
Monthly Housing Cost Tiers in Morrisville
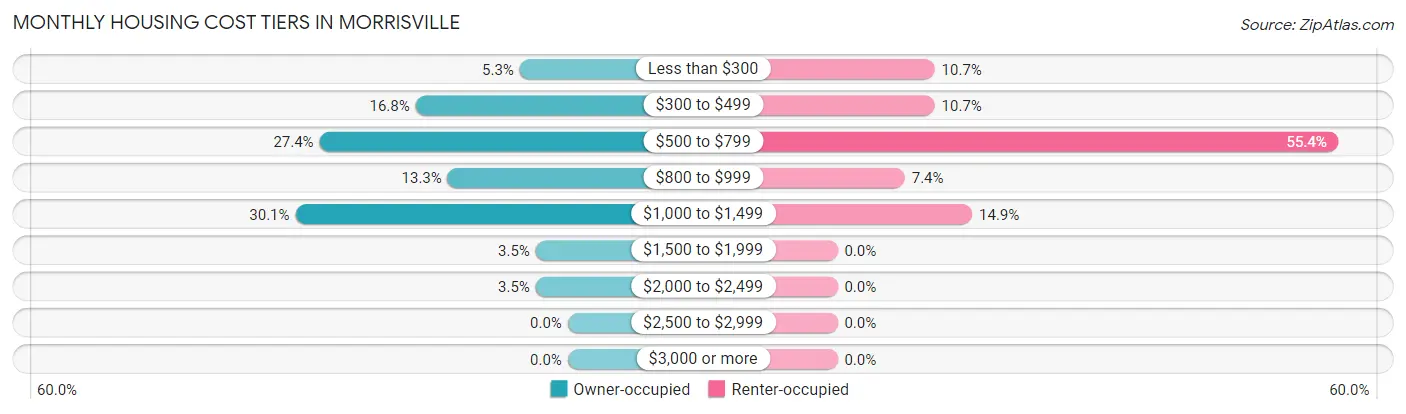
| Monthly Cost | Owner-occupied | Renter-occupied |
| Less than $300 | 6 (5.3%) | 13 (10.7%) |
| $300 to $499 | 19 (16.8%) | 13 (10.7%) |
| $500 to $799 | 31 (27.4%) | 67 (55.4%) |
| $800 to $999 | 15 (13.3%) | 9 (7.4%) |
| $1,000 to $1,499 | 34 (30.1%) | 18 (14.9%) |
| $1,500 to $1,999 | 4 (3.5%) | 0 (0.0%) |
| $2,000 to $2,499 | 4 (3.5%) | 0 (0.0%) |
| $2,500 to $2,999 | 0 (0.0%) | 0 (0.0%) |
| $3,000 or more | 0 (0.0%) | 0 (0.0%) |
| Total | 113 (100.0%) | 121 (100.0%) |
Physical Housing Characteristics in Morrisville
Housing Structures in Morrisville
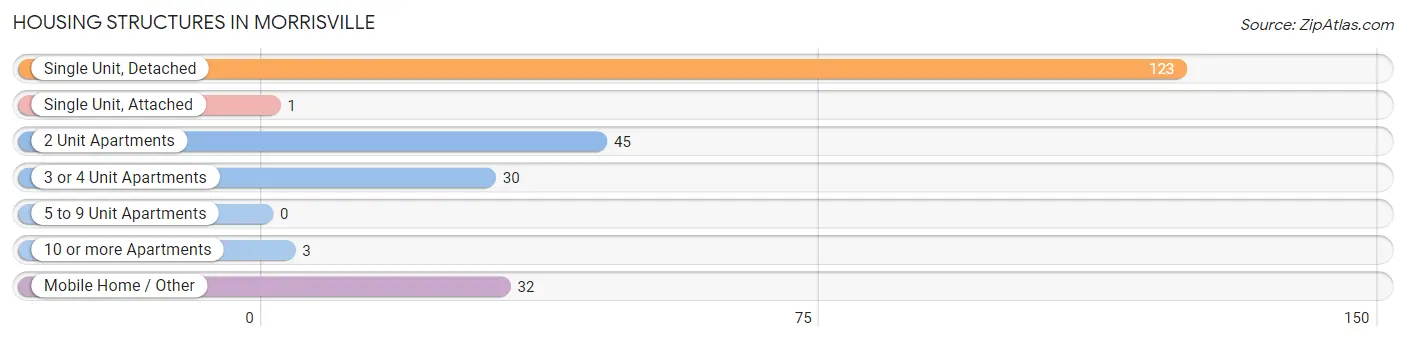
| Structure Type | # Housing Units | % Housing Units |
| Single Unit, Detached | 123 | 52.6% |
| Single Unit, Attached | 1 | 0.4% |
| 2 Unit Apartments | 45 | 19.2% |
| 3 or 4 Unit Apartments | 30 | 12.8% |
| 5 to 9 Unit Apartments | 0 | 0.0% |
| 10 or more Apartments | 3 | 1.3% |
| Mobile Home / Other | 32 | 13.7% |
| Total | 234 | 100.0% |
Housing Structures by Occupancy in Morrisville
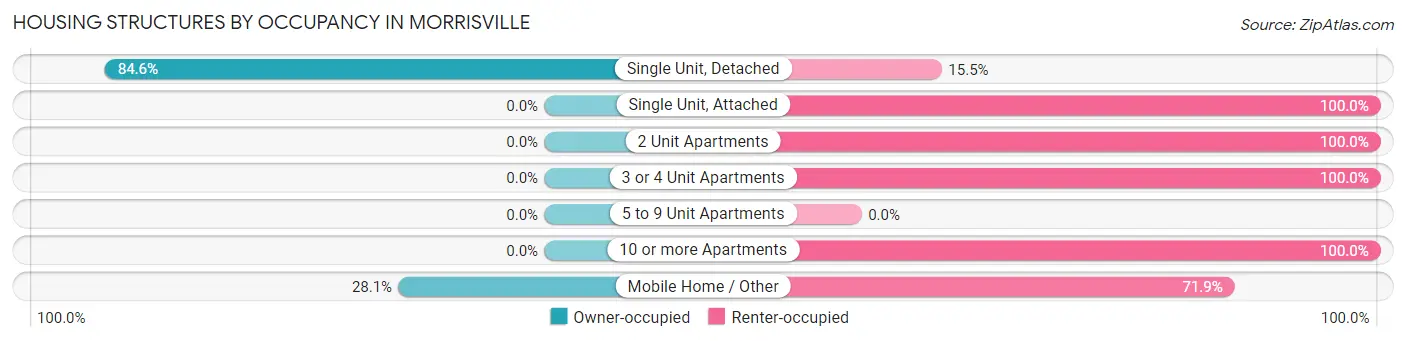
| Structure Type | Owner-occupied | Renter-occupied |
| Single Unit, Detached | 104 (84.6%) | 19 (15.4%) |
| Single Unit, Attached | 0 (0.0%) | 1 (100.0%) |
| 2 Unit Apartments | 0 (0.0%) | 45 (100.0%) |
| 3 or 4 Unit Apartments | 0 (0.0%) | 30 (100.0%) |
| 5 to 9 Unit Apartments | 0 (0.0%) | 0 (0.0%) |
| 10 or more Apartments | 0 (0.0%) | 3 (100.0%) |
| Mobile Home / Other | 9 (28.1%) | 23 (71.9%) |
| Total | 113 (48.3%) | 121 (51.7%) |
Housing Structures by Number of Rooms in Morrisville
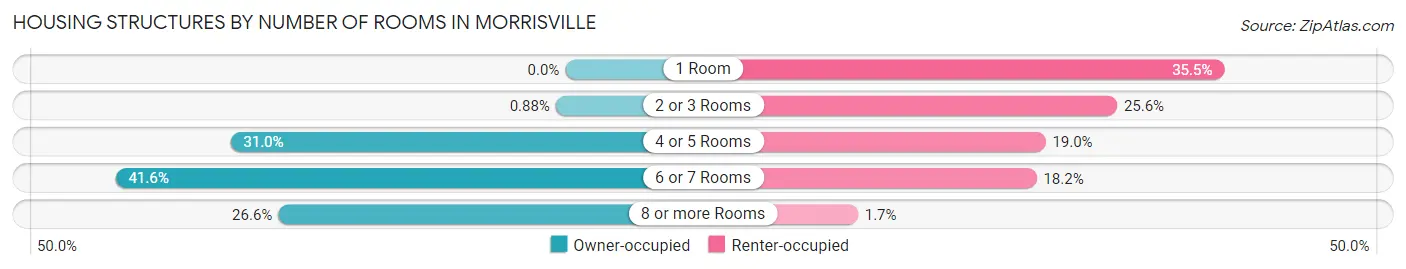
| Number of Rooms | Owner-occupied | Renter-occupied |
| 1 Room | 0 (0.0%) | 43 (35.5%) |
| 2 or 3 Rooms | 1 (0.9%) | 31 (25.6%) |
| 4 or 5 Rooms | 35 (31.0%) | 23 (19.0%) |
| 6 or 7 Rooms | 47 (41.6%) | 22 (18.2%) |
| 8 or more Rooms | 30 (26.6%) | 2 (1.7%) |
| Total | 113 (100.0%) | 121 (100.0%) |
Housing Structure by Heating Type in Morrisville
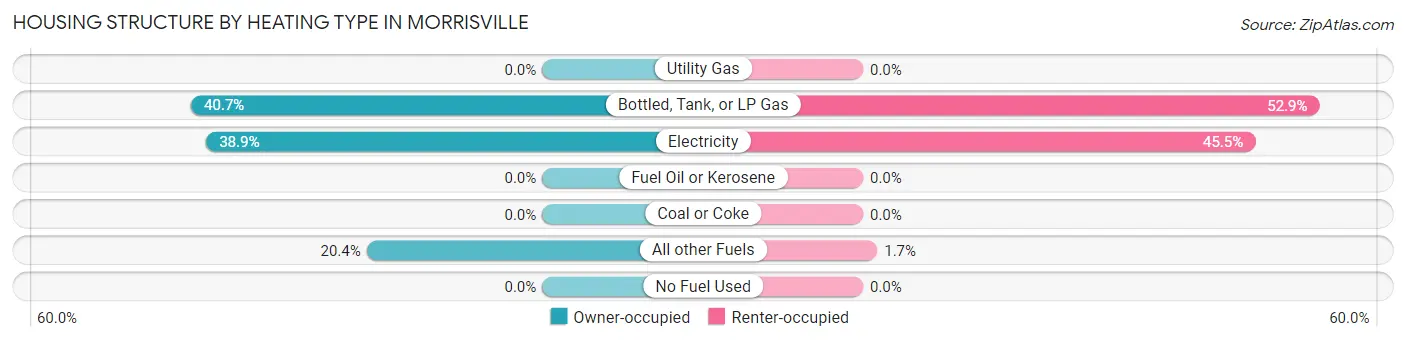
| Heating Type | Owner-occupied | Renter-occupied |
| Utility Gas | 0 (0.0%) | 0 (0.0%) |
| Bottled, Tank, or LP Gas | 46 (40.7%) | 64 (52.9%) |
| Electricity | 44 (38.9%) | 55 (45.5%) |
| Fuel Oil or Kerosene | 0 (0.0%) | 0 (0.0%) |
| Coal or Coke | 0 (0.0%) | 0 (0.0%) |
| All other Fuels | 23 (20.3%) | 2 (1.7%) |
| No Fuel Used | 0 (0.0%) | 0 (0.0%) |
| Total | 113 (100.0%) | 121 (100.0%) |
Household Vehicle Usage in Morrisville
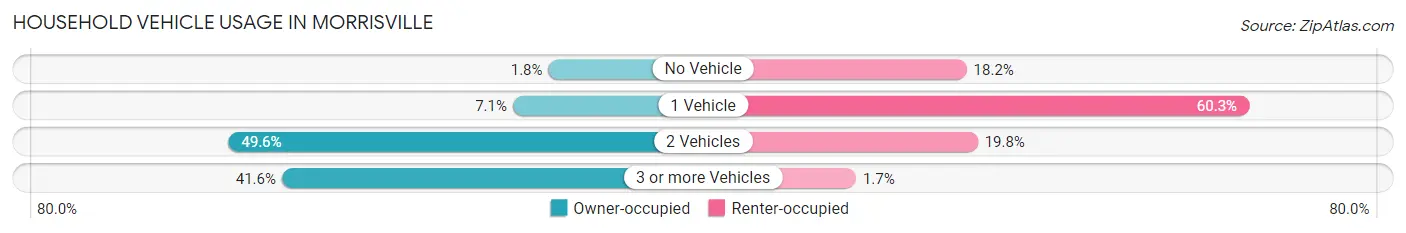
| Vehicles per Household | Owner-occupied | Renter-occupied |
| No Vehicle | 2 (1.8%) | 22 (18.2%) |
| 1 Vehicle | 8 (7.1%) | 73 (60.3%) |
| 2 Vehicles | 56 (49.6%) | 24 (19.8%) |
| 3 or more Vehicles | 47 (41.6%) | 2 (1.7%) |
| Total | 113 (100.0%) | 121 (100.0%) |
Real Estate & Mortgages in Morrisville
Real Estate and Mortgage Overview in Morrisville
| Characteristic | Without Mortgage | With Mortgage |
| Housing Units | 53 | 60 |
| Median Property Value | $107,500 | $135,000 |
| Median Household Income | $37,109 | $2 |
| Monthly Housing Costs | $537 | $0 |
| Real Estate Taxes | $579 | $0 |
Property Value by Mortgage Status in Morrisville
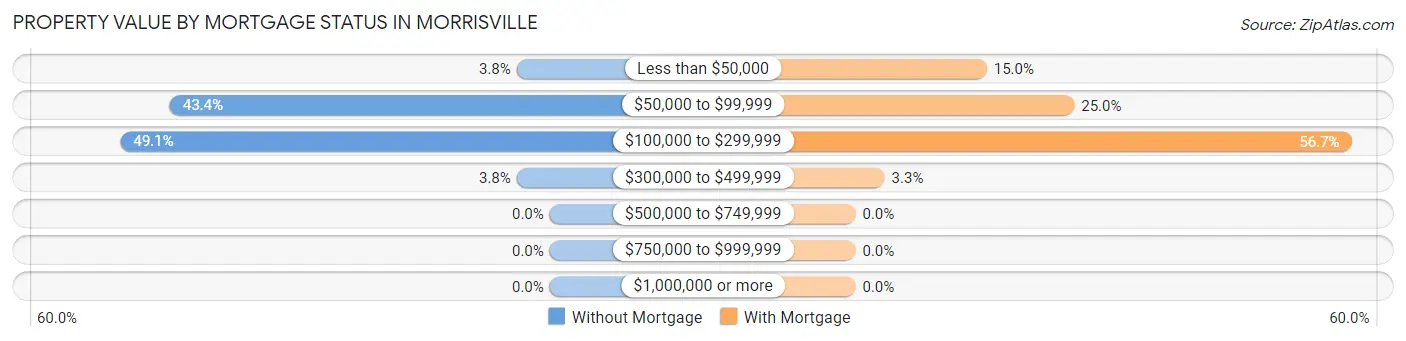
| Property Value | Without Mortgage | With Mortgage |
| Less than $50,000 | 2 (3.8%) | 9 (15.0%) |
| $50,000 to $99,999 | 23 (43.4%) | 15 (25.0%) |
| $100,000 to $299,999 | 26 (49.1%) | 34 (56.7%) |
| $300,000 to $499,999 | 2 (3.8%) | 2 (3.3%) |
| $500,000 to $749,999 | 0 (0.0%) | 0 (0.0%) |
| $750,000 to $999,999 | 0 (0.0%) | 0 (0.0%) |
| $1,000,000 or more | 0 (0.0%) | 0 (0.0%) |
| Total | 53 (100.0%) | 60 (100.0%) |
Household Income by Mortgage Status in Morrisville
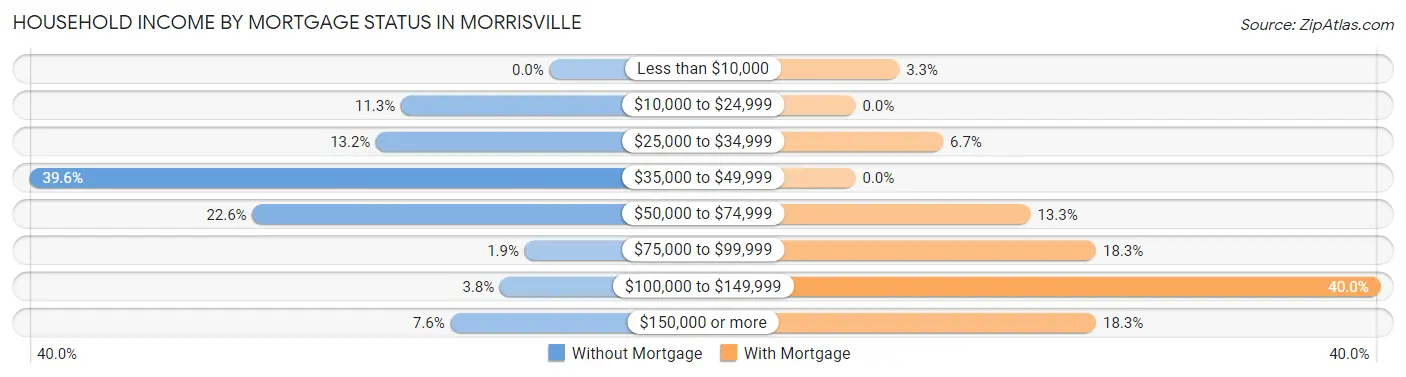
| Household Income | Without Mortgage | With Mortgage |
| Less than $10,000 | 0 (0.0%) | 2 (3.3%) |
| $10,000 to $24,999 | 6 (11.3%) | 0 (0.0%) |
| $25,000 to $34,999 | 7 (13.2%) | 4 (6.7%) |
| $35,000 to $49,999 | 21 (39.6%) | 0 (0.0%) |
| $50,000 to $74,999 | 12 (22.6%) | 8 (13.3%) |
| $75,000 to $99,999 | 1 (1.9%) | 11 (18.3%) |
| $100,000 to $149,999 | 2 (3.8%) | 24 (40.0%) |
| $150,000 or more | 4 (7.5%) | 11 (18.3%) |
| Total | 53 (100.0%) | 60 (100.0%) |
Property Value to Household Income Ratio in Morrisville
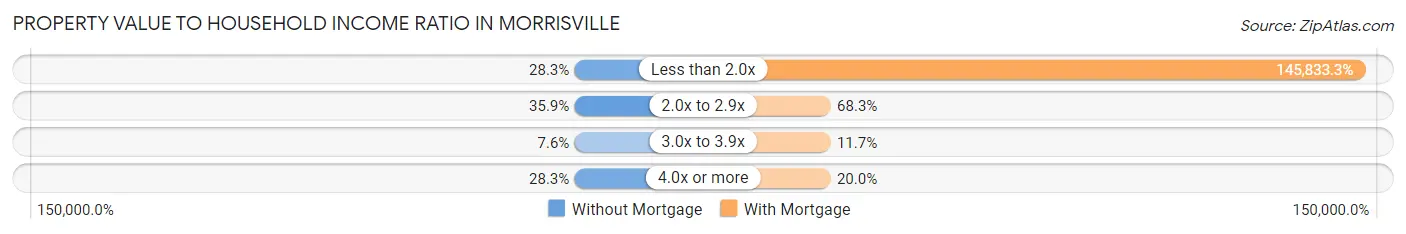
| Value-to-Income Ratio | Without Mortgage | With Mortgage |
| Less than 2.0x | 15 (28.3%) | 87,500 (145,833.3%) |
| 2.0x to 2.9x | 19 (35.8%) | 41 (68.3%) |
| 3.0x to 3.9x | 4 (7.5%) | 7 (11.7%) |
| 4.0x or more | 15 (28.3%) | 12 (20.0%) |
| Total | 53 (100.0%) | 60 (100.0%) |
Real Estate Taxes by Mortgage Status in Morrisville
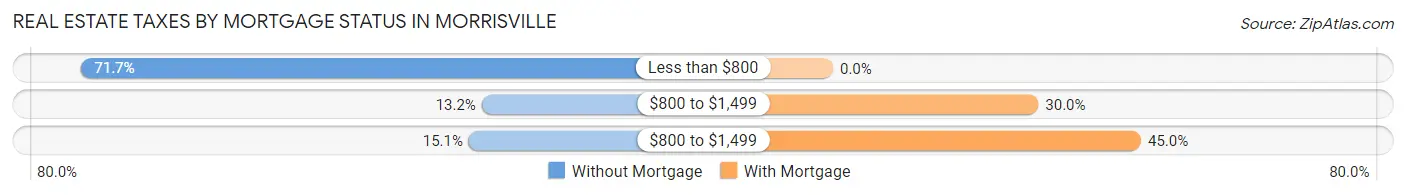
| Property Taxes | Without Mortgage | With Mortgage |
| Less than $800 | 38 (71.7%) | 0 (0.0%) |
| $800 to $1,499 | 7 (13.2%) | 18 (30.0%) |
| $800 to $1,499 | 8 (15.1%) | 27 (45.0%) |
| Total | 53 (100.0%) | 60 (100.0%) |
Health & Disability in Morrisville
Health Insurance Coverage by Age in Morrisville
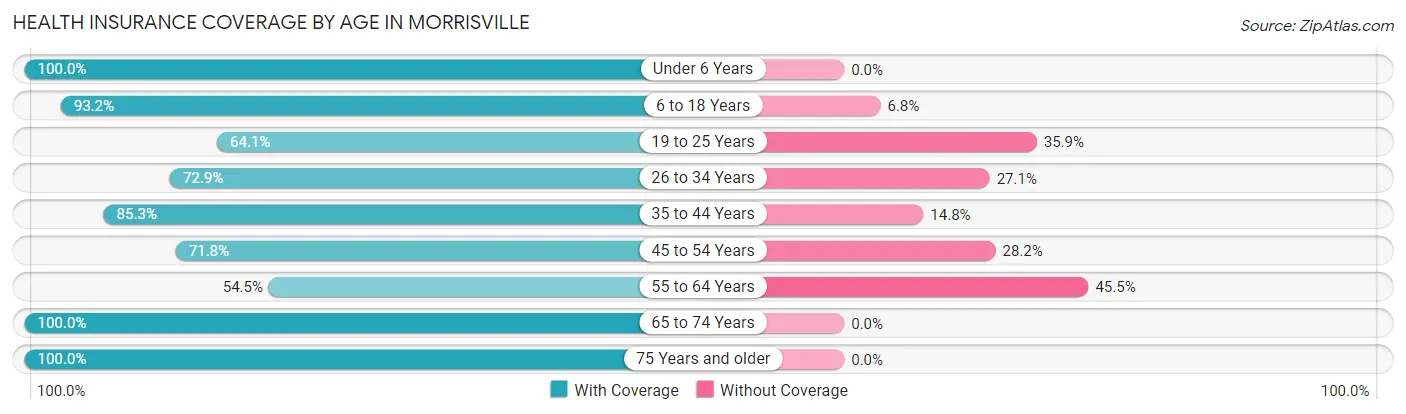
| Age Bracket | With Coverage | Without Coverage |
| Under 6 Years | 42 (100.0%) | 0 (0.0%) |
| 6 to 18 Years | 69 (93.2%) | 5 (6.8%) |
| 19 to 25 Years | 25 (64.1%) | 14 (35.9%) |
| 26 to 34 Years | 43 (72.9%) | 16 (27.1%) |
| 35 to 44 Years | 52 (85.3%) | 9 (14.7%) |
| 45 to 54 Years | 28 (71.8%) | 11 (28.2%) |
| 55 to 64 Years | 55 (54.5%) | 46 (45.5%) |
| 65 to 74 Years | 97 (100.0%) | 0 (0.0%) |
| 75 Years and older | 38 (100.0%) | 0 (0.0%) |
| Total | 449 (81.6%) | 101 (18.4%) |
Health Insurance Coverage by Citizenship Status in Morrisville
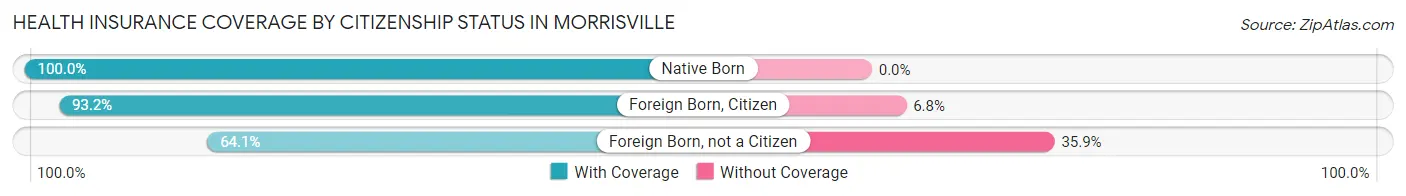
| Citizenship Status | With Coverage | Without Coverage |
| Native Born | 42 (100.0%) | 0 (0.0%) |
| Foreign Born, Citizen | 69 (93.2%) | 5 (6.8%) |
| Foreign Born, not a Citizen | 25 (64.1%) | 14 (35.9%) |
Health Insurance Coverage by Household Income in Morrisville
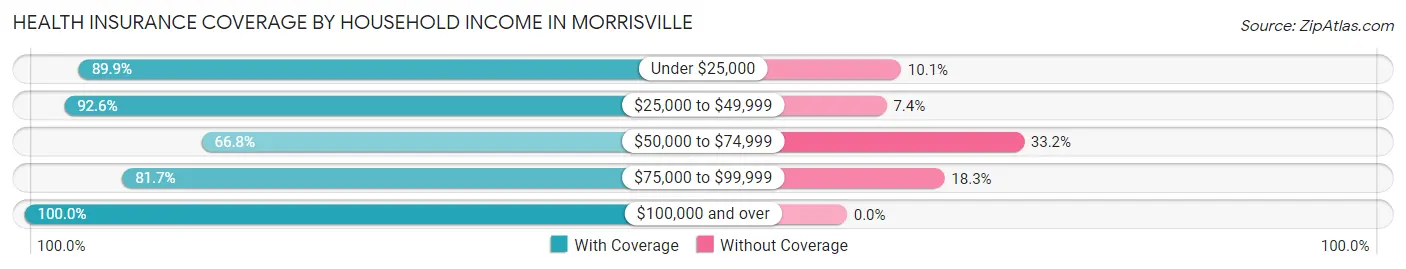
| Household Income | With Coverage | Without Coverage |
| Under $25,000 | 62 (89.9%) | 7 (10.1%) |
| $25,000 to $49,999 | 137 (92.6%) | 11 (7.4%) |
| $50,000 to $74,999 | 137 (66.8%) | 68 (33.2%) |
| $75,000 to $99,999 | 67 (81.7%) | 15 (18.3%) |
| $100,000 and over | 46 (100.0%) | 0 (0.0%) |
Public vs Private Health Insurance Coverage by Age in Morrisville
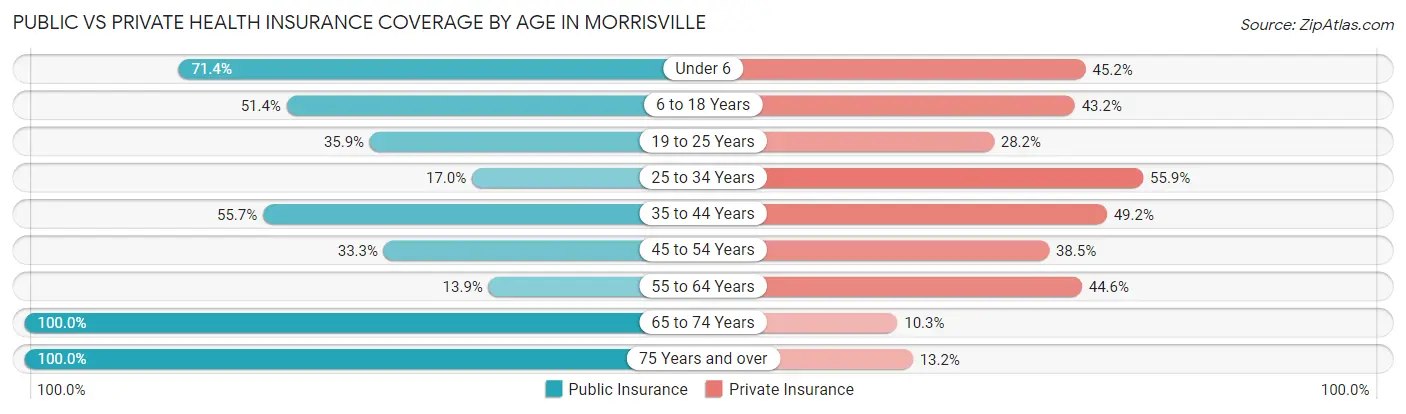
| Age Bracket | Public Insurance | Private Insurance |
| Under 6 | 30 (71.4%) | 19 (45.2%) |
| 6 to 18 Years | 38 (51.3%) | 32 (43.2%) |
| 19 to 25 Years | 14 (35.9%) | 11 (28.2%) |
| 25 to 34 Years | 10 (17.0%) | 33 (55.9%) |
| 35 to 44 Years | 34 (55.7%) | 30 (49.2%) |
| 45 to 54 Years | 13 (33.3%) | 15 (38.5%) |
| 55 to 64 Years | 14 (13.9%) | 45 (44.6%) |
| 65 to 74 Years | 97 (100.0%) | 10 (10.3%) |
| 75 Years and over | 38 (100.0%) | 5 (13.2%) |
| Total | 288 (52.4%) | 200 (36.4%) |
Disability Status by Sex by Age in Morrisville
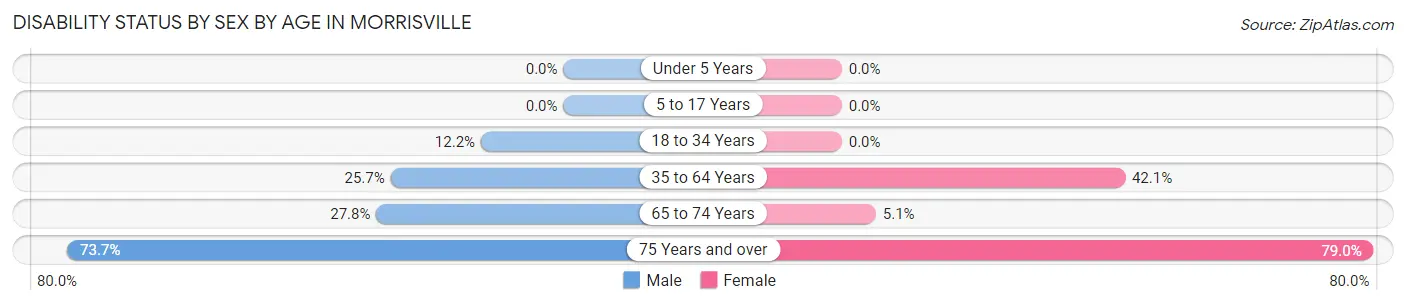
| Age Bracket | Male | Female |
| Under 5 Years | 0 (0.0%) | 0 (0.0%) |
| 5 to 17 Years | 0 (0.0%) | 0 (0.0%) |
| 18 to 34 Years | 6 (12.2%) | 0 (0.0%) |
| 35 to 64 Years | 29 (25.7%) | 37 (42.0%) |
| 65 to 74 Years | 5 (27.8%) | 4 (5.1%) |
| 75 Years and over | 14 (73.7%) | 15 (78.9%) |
Disability Class by Sex by Age in Morrisville
Disability Class: Hearing Difficulty
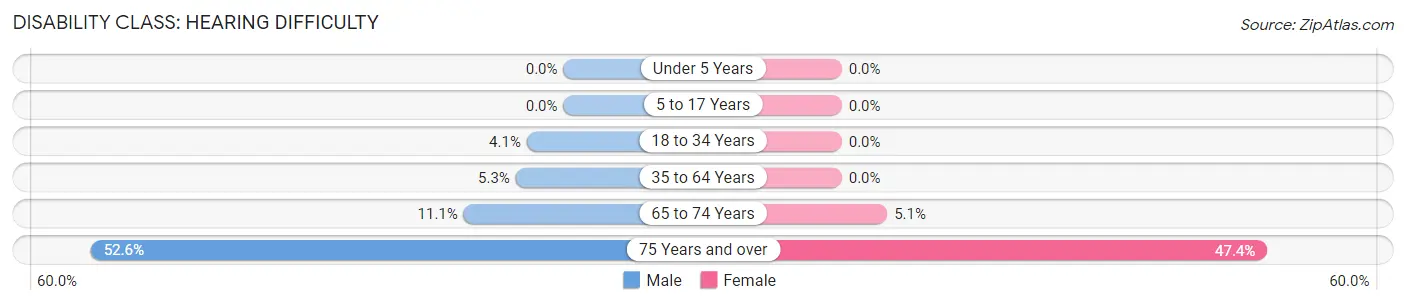
| Age Bracket | Male | Female |
| Under 5 Years | 0 (0.0%) | 0 (0.0%) |
| 5 to 17 Years | 0 (0.0%) | 0 (0.0%) |
| 18 to 34 Years | 2 (4.1%) | 0 (0.0%) |
| 35 to 64 Years | 6 (5.3%) | 0 (0.0%) |
| 65 to 74 Years | 2 (11.1%) | 4 (5.1%) |
| 75 Years and over | 10 (52.6%) | 9 (47.4%) |
Disability Class: Vision Difficulty
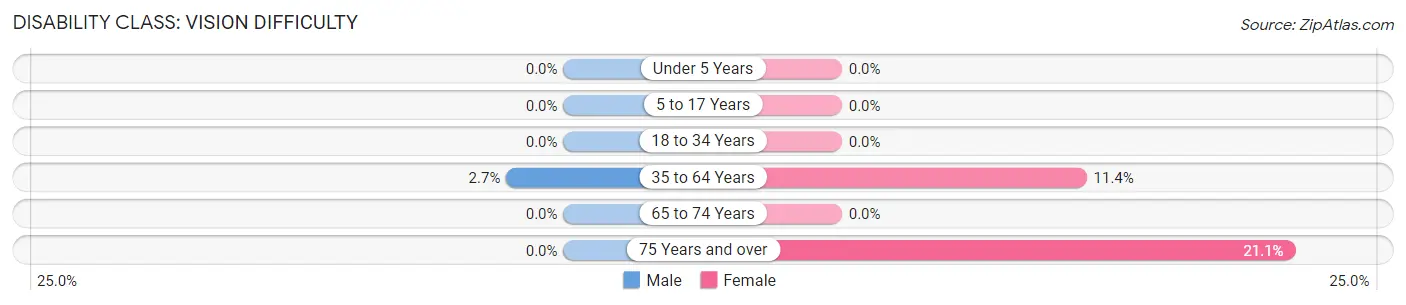
| Age Bracket | Male | Female |
| Under 5 Years | 0 (0.0%) | 0 (0.0%) |
| 5 to 17 Years | 0 (0.0%) | 0 (0.0%) |
| 18 to 34 Years | 0 (0.0%) | 0 (0.0%) |
| 35 to 64 Years | 3 (2.6%) | 10 (11.4%) |
| 65 to 74 Years | 0 (0.0%) | 0 (0.0%) |
| 75 Years and over | 0 (0.0%) | 4 (21.0%) |
Disability Class: Cognitive Difficulty
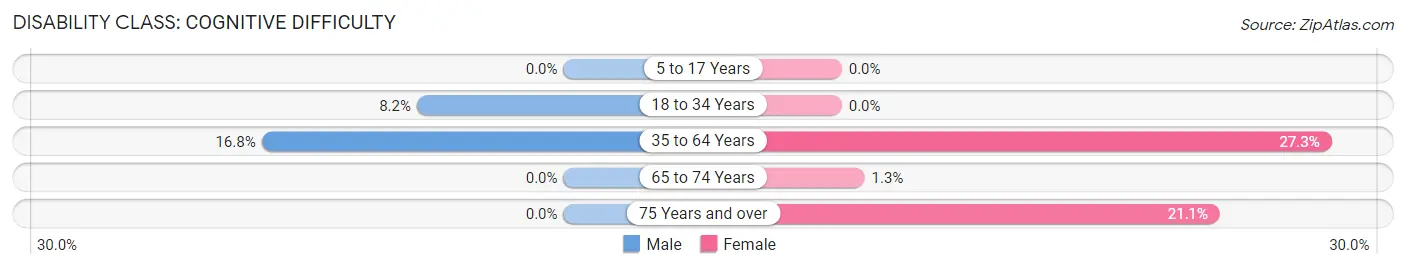
| Age Bracket | Male | Female |
| 5 to 17 Years | 0 (0.0%) | 0 (0.0%) |
| 18 to 34 Years | 4 (8.2%) | 0 (0.0%) |
| 35 to 64 Years | 19 (16.8%) | 24 (27.3%) |
| 65 to 74 Years | 0 (0.0%) | 1 (1.3%) |
| 75 Years and over | 0 (0.0%) | 4 (21.0%) |
Disability Class: Ambulatory Difficulty
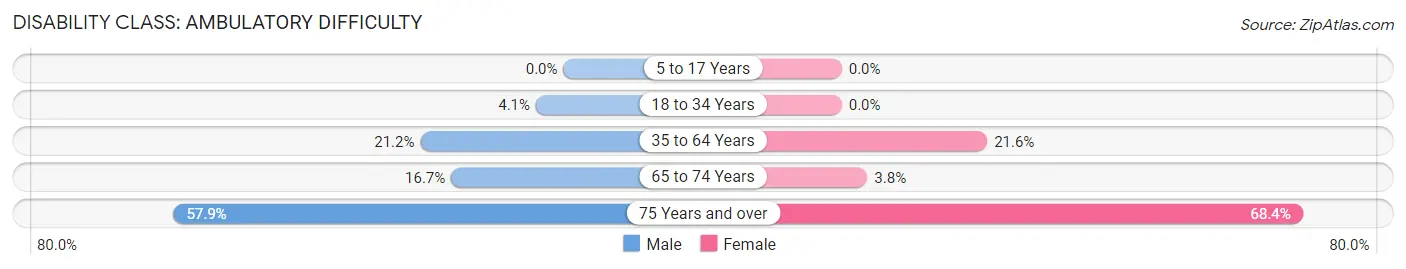
| Age Bracket | Male | Female |
| 5 to 17 Years | 0 (0.0%) | 0 (0.0%) |
| 18 to 34 Years | 2 (4.1%) | 0 (0.0%) |
| 35 to 64 Years | 24 (21.2%) | 19 (21.6%) |
| 65 to 74 Years | 3 (16.7%) | 3 (3.8%) |
| 75 Years and over | 11 (57.9%) | 13 (68.4%) |
Disability Class: Self-Care Difficulty
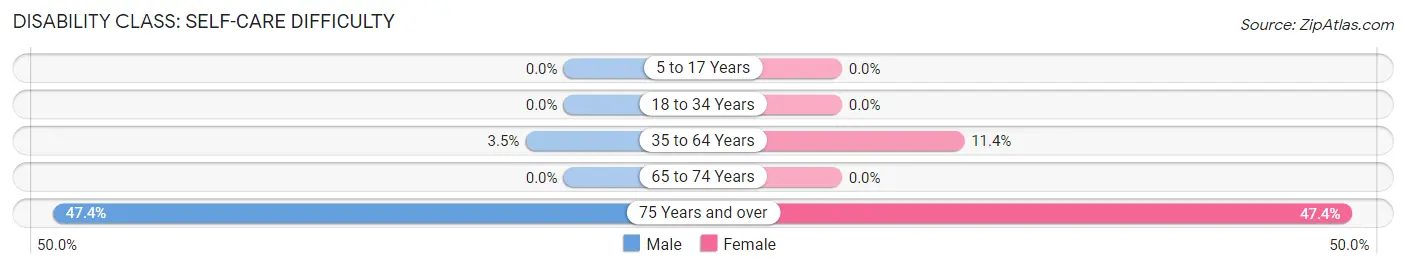
| Age Bracket | Male | Female |
| 5 to 17 Years | 0 (0.0%) | 0 (0.0%) |
| 18 to 34 Years | 0 (0.0%) | 0 (0.0%) |
| 35 to 64 Years | 4 (3.5%) | 10 (11.4%) |
| 65 to 74 Years | 0 (0.0%) | 0 (0.0%) |
| 75 Years and over | 9 (47.4%) | 9 (47.4%) |
Technology Access in Morrisville
Computing Device Access in Morrisville
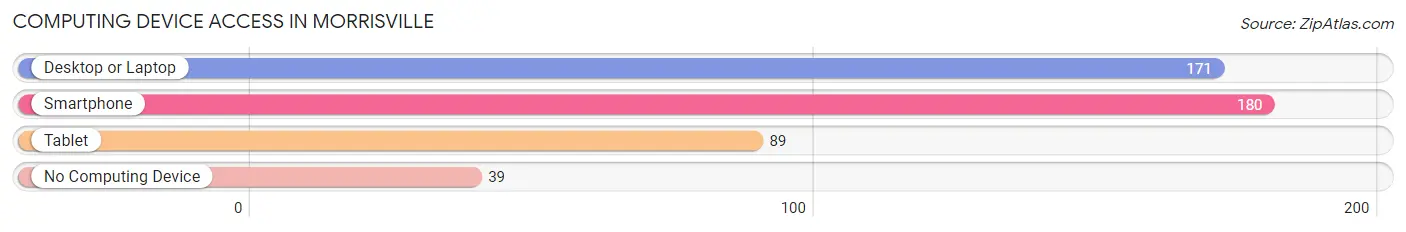
| Device Type | # Households | % Households |
| Desktop or Laptop | 171 | 73.1% |
| Smartphone | 180 | 76.9% |
| Tablet | 89 | 38.0% |
| No Computing Device | 39 | 16.7% |
| Total | 234 | 100.0% |
Internet Access in Morrisville
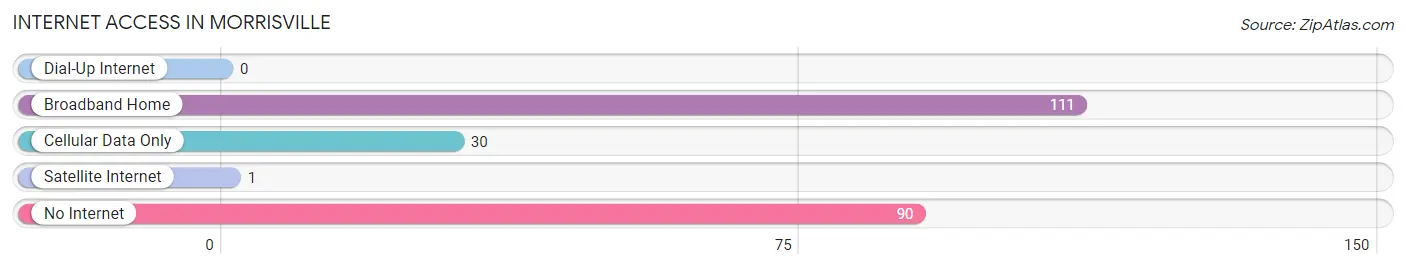
| Internet Type | # Households | % Households |
| Dial-Up Internet | 0 | 0.0% |
| Broadband Home | 111 | 47.4% |
| Cellular Data Only | 30 | 12.8% |
| Satellite Internet | 1 | 0.4% |
| No Internet | 90 | 38.5% |
| Total | 234 | 100.0% |
Morrisville Summary
Morrisville is a small town located in Polk County, Missouri, United States. It is situated on the banks of the Pomme de Terre River, approximately 20 miles east of Bolivar. The town was founded in 1871 and was named after William Morris, a local landowner. As of the 2010 census, the population of Morrisville was 545.
History
The area around Morrisville was first settled in the early 1800s by settlers from Kentucky and Tennessee. The town was founded in 1871 by William Morris, a local landowner. The town was originally known as Morrisville Station, as it was a stop on the St. Louis and San Francisco Railroad. The town was officially incorporated in 1876.
In the late 1800s, Morrisville was a thriving agricultural community. The town was home to several businesses, including a general store, a blacksmith shop, a hotel, and a sawmill. The town also had a school, a post office, and a church.
In the early 1900s, Morrisville began to decline. The railroad stopped running through the town, and many of the businesses closed. The population of the town decreased, and by the 1950s, the population had dropped to just over 200.
Geography
Morrisville is located in Polk County, Missouri, at the intersection of Missouri State Highways 83 and 64. The town is situated on the banks of the Pomme de Terre River, approximately 20 miles east of Bolivar. The town has a total area of 0.6 square miles, all of which is land.
Economy
The economy of Morrisville is largely based on agriculture. The town is home to several farms, which produce a variety of crops, including corn, soybeans, wheat, and hay. The town also has a few small businesses, including a gas station, a convenience store, and a restaurant.
Demographics
As of the 2010 census, the population of Morrisville was 545. The racial makeup of the town was 97.3% White, 0.2% African American, 0.2% Native American, 0.2% Asian, 0.4% from other races, and 1.7% from two or more races. Hispanic or Latino of any race were 1.3% of the population.
The median income for a household in Morrisville was $35,625, and the median income for a family was $41,250. The per capita income for the town was $17,845. About 11.2% of families and 14.2% of the population were below the poverty line, including 18.2% of those under age 18 and 8.3% of those age 65 or over.
Common Questions
What is Per Capita Income in Morrisville?
Per Capita income in Morrisville is $24,190.
What is the Median Family Income in Morrisville?
Median Family Income in Morrisville is $67,917.
What is the Median Household income in Morrisville?
Median Household Income in Morrisville is $54,375.
What is Income or Wage Gap in Morrisville?
Income or Wage Gap in Morrisville is 3.3%.
Women in Morrisville earn 96.7 cents for every dollar earned by a man.
What is Inequality or Gini Index in Morrisville?
Inequality or Gini Index in Morrisville is 0.35.
What is the Total Population of Morrisville?
Total Population of Morrisville is 550.
What is the Total Male Population of Morrisville?
Total Male Population of Morrisville is 248.
What is the Total Female Population of Morrisville?
Total Female Population of Morrisville is 302.
What is the Ratio of Males per 100 Females in Morrisville?
There are 82.12 Males per 100 Females in Morrisville.
What is the Ratio of Females per 100 Males in Morrisville?
There are 121.77 Females per 100 Males in Morrisville.
What is the Median Population Age in Morrisville?
Median Population Age in Morrisville is 45.5 Years.
What is the Average Family Size in Morrisville
Average Family Size in Morrisville is 2.6 People.
What is the Average Household Size in Morrisville
Average Household Size in Morrisville is 2.4 People.
How Large is the Labor Force in Morrisville?
There are 296 People in the Labor Forcein in Morrisville.
What is the Percentage of People in the Labor Force in Morrisville?
65.5% of People are in the Labor Force in Morrisville.
What is the Unemployment Rate in Morrisville?
Unemployment Rate in Morrisville is 4.1%.