Monett, MO Map & Demographics
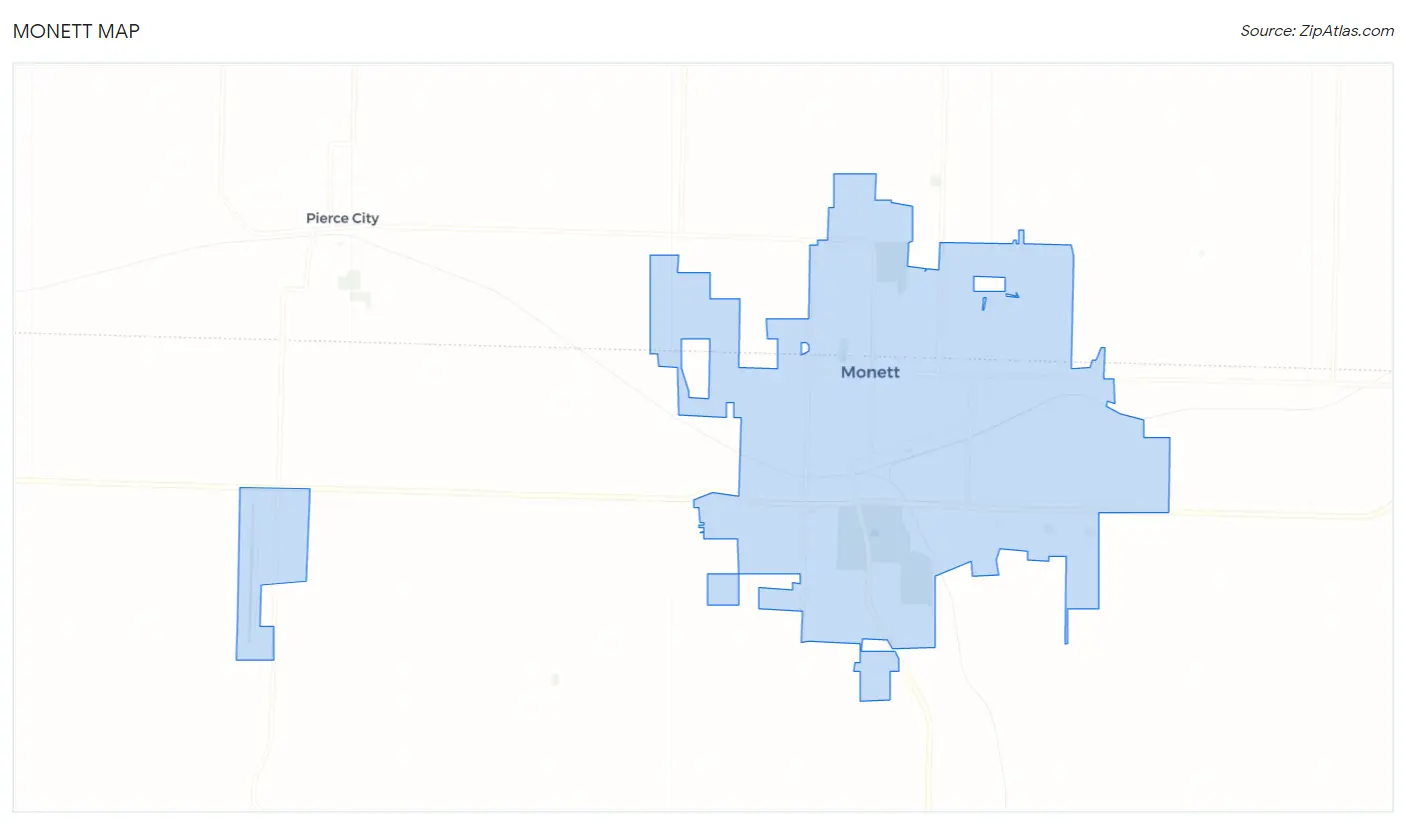
Monett Map
Monett Overview
$24,247
PER CAPITA INCOME
$55,722
AVG FAMILY INCOME
$42,635
AVG HOUSEHOLD INCOME
23.6%
WAGE / INCOME GAP [ % ]
76.4¢/ $1
WAGE / INCOME GAP [ $ ]
$8,888
FAMILY INCOME DEFICIT
0.42
INEQUALITY / GINI INDEX
9,632
TOTAL POPULATION
4,853
MALE POPULATION
4,779
FEMALE POPULATION
101.55
MALES / 100 FEMALES
98.48
FEMALES / 100 MALES
34.7
MEDIAN AGE
3.2
AVG FAMILY SIZE
2.6
AVG HOUSEHOLD SIZE
4,819
LABOR FORCE [ PEOPLE ]
67.1%
PERCENT IN LABOR FORCE
4.6%
UNEMPLOYMENT RATE
Monett Zip Codes
Monett Area Codes
Income in Monett
Income Overview in Monett
Per Capita Income in Monett is $24,247, while median incomes of families and households are $55,722 and $42,635 respectively.
| Characteristic | Number | Measure |
| Per Capita Income | 9,632 | $24,247 |
| Median Family Income | 2,458 | $55,722 |
| Mean Family Income | 2,458 | $70,139 |
| Median Household Income | 3,702 | $42,635 |
| Mean Household Income | 3,702 | $58,895 |
| Income Deficit | 2,458 | $8,888 |
| Wage / Income Gap (%) | 9,632 | 23.58% |
| Wage / Income Gap ($) | 9,632 | 76.42¢ per $1 |
| Gini / Inequality Index | 9,632 | 0.42 |
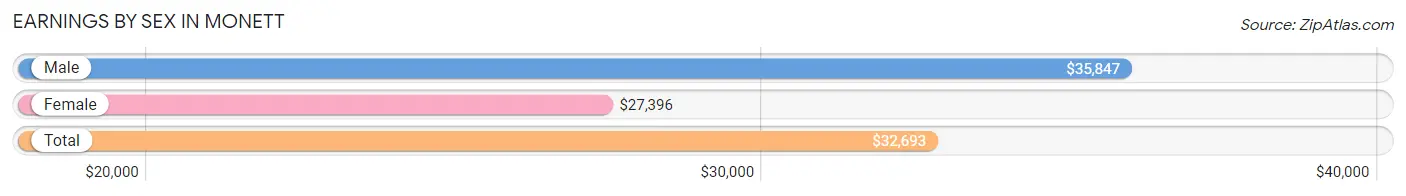
Earnings by Sex in Monett
Average Earnings in Monett are $32,693, $35,847 for men and $27,396 for women, a difference of 23.6%.
| Sex | Number | Average Earnings |
| Male | 2,543 (52.0%) | $35,847 |
| Female | 2,351 (48.0%) | $27,396 |
| Total | 4,894 (100.0%) | $32,693 |
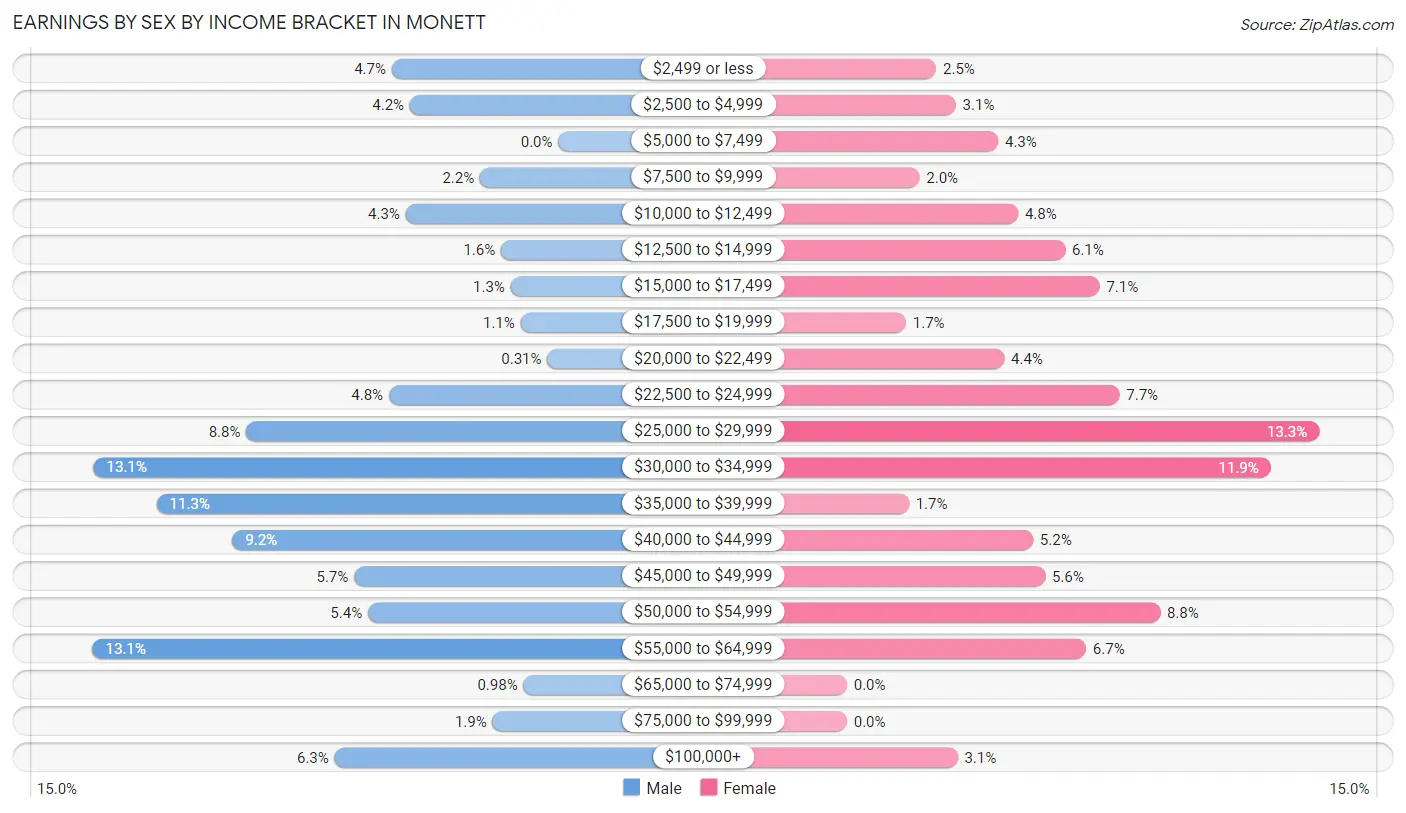
Earnings by Sex by Income Bracket in Monett
The most common earnings brackets in Monett are $55,000 to $64,999 for men (333 | 13.1%) and $25,000 to $29,999 for women (312 | 13.3%).
| Income | Male | Female |
| $2,499 or less | 119 (4.7%) | 59 (2.5%) |
| $2,500 to $4,999 | 106 (4.2%) | 72 (3.1%) |
| $5,000 to $7,499 | 0 (0.0%) | 100 (4.3%) |
| $7,500 to $9,999 | 56 (2.2%) | 48 (2.0%) |
| $10,000 to $12,499 | 109 (4.3%) | 113 (4.8%) |
| $12,500 to $14,999 | 41 (1.6%) | 144 (6.1%) |
| $15,000 to $17,499 | 34 (1.3%) | 167 (7.1%) |
| $17,500 to $19,999 | 27 (1.1%) | 39 (1.7%) |
| $20,000 to $22,499 | 8 (0.3%) | 104 (4.4%) |
| $22,500 to $24,999 | 121 (4.8%) | 180 (7.7%) |
| $25,000 to $29,999 | 223 (8.8%) | 312 (13.3%) |
| $30,000 to $34,999 | 332 (13.1%) | 280 (11.9%) |
| $35,000 to $39,999 | 287 (11.3%) | 41 (1.7%) |
| $40,000 to $44,999 | 233 (9.2%) | 123 (5.2%) |
| $45,000 to $49,999 | 146 (5.7%) | 131 (5.6%) |
| $50,000 to $54,999 | 136 (5.3%) | 207 (8.8%) |
| $55,000 to $64,999 | 333 (13.1%) | 158 (6.7%) |
| $65,000 to $74,999 | 25 (1.0%) | 0 (0.0%) |
| $75,000 to $99,999 | 47 (1.8%) | 0 (0.0%) |
| $100,000+ | 160 (6.3%) | 73 (3.1%) |
| Total | 2,543 (100.0%) | 2,351 (100.0%) |
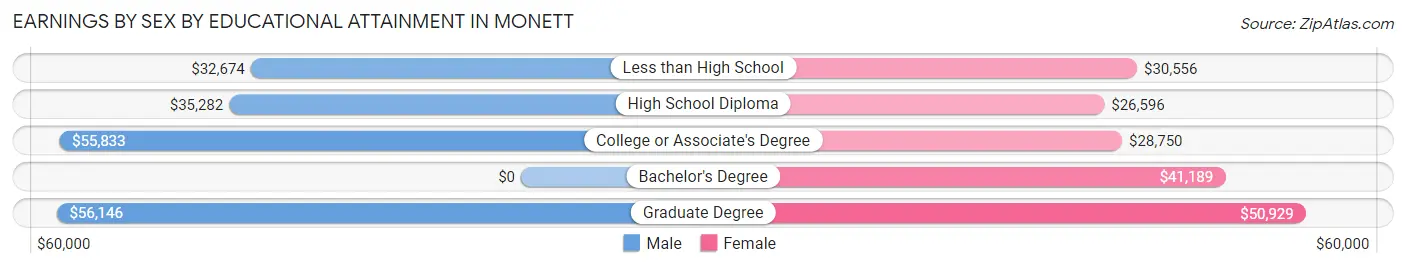
Earnings by Sex by Educational Attainment in Monett
Average earnings in Monett are $36,941 for men and $30,000 for women, a difference of 18.8%. Men with an educational attainment of graduate degree enjoy the highest average annual earnings of $56,146, while those with less than high school education earn the least with $32,674. Women with an educational attainment of graduate degree earn the most with the average annual earnings of $50,929, while those with high school diploma education have the smallest earnings of $26,596.
| Educational Attainment | Male Income | Female Income |
| Less than High School | $32,674 | $30,556 |
| High School Diploma | $35,282 | $26,596 |
| College or Associate's Degree | $55,833 | $28,750 |
| Bachelor's Degree | - | - |
| Graduate Degree | $56,146 | $50,929 |
| Total | $36,941 | $30,000 |
Family Income in Monett
Family Income Brackets in Monett
According to the Monett family income data, there are 595 families falling into the $50,000 to $74,999 income range, which is the most common income bracket and makes up 24.2% of all families. Conversely, the less than $10,000 income bracket is the least frequent group with only 52 families (2.1%) belonging to this category.
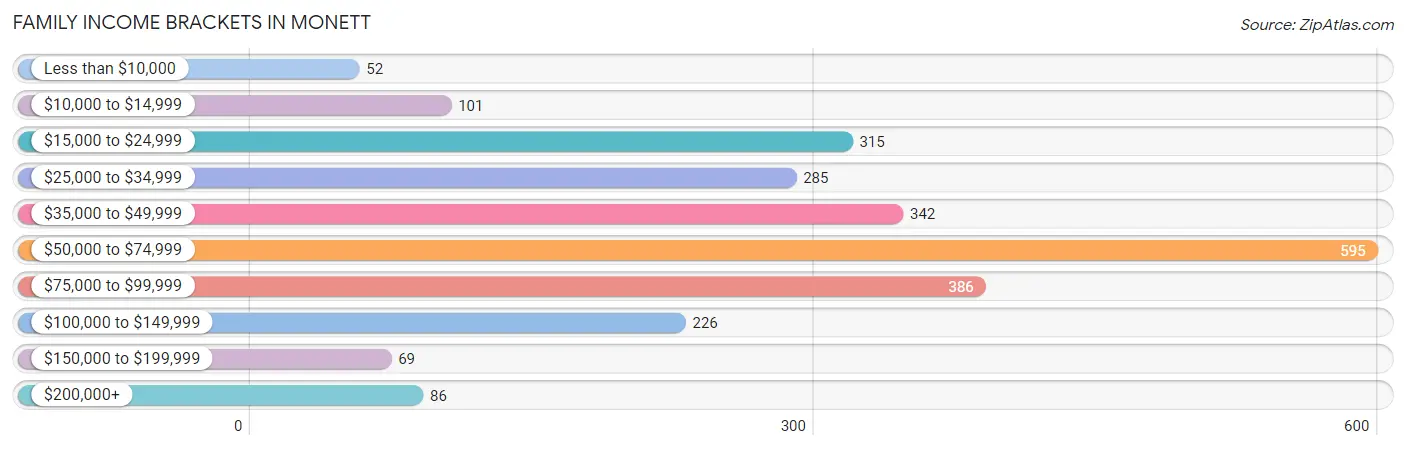
| Income Bracket | # Families | % Families |
| Less than $10,000 | 52 | 2.1% |
| $10,000 to $14,999 | 101 | 4.1% |
| $15,000 to $24,999 | 315 | 12.8% |
| $25,000 to $34,999 | 285 | 11.6% |
| $35,000 to $49,999 | 342 | 13.9% |
| $50,000 to $74,999 | 595 | 24.2% |
| $75,000 to $99,999 | 386 | 15.7% |
| $100,000 to $149,999 | 226 | 9.2% |
| $150,000 to $199,999 | 69 | 2.8% |
| $200,000+ | 86 | 3.5% |
Family Income by Famaliy Size in Monett
6-person families (272 | 11.1%) account for the highest median family income in Monett with $64,563 per family, while 2-person families (1,207 | 49.1%) have the highest median income of $24,935 per family member.
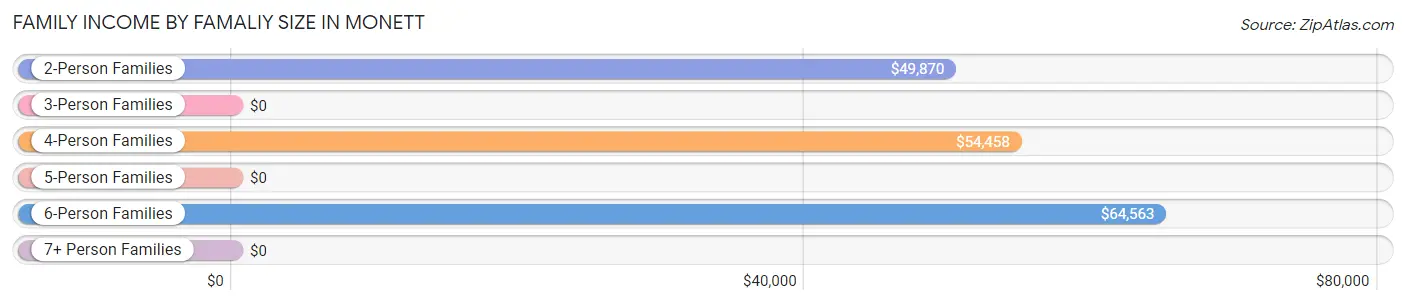
| Income Bracket | # Families | Median Income |
| 2-Person Families | 1,207 (49.1%) | $49,870 |
| 3-Person Families | 359 (14.6%) | $0 |
| 4-Person Families | 435 (17.7%) | $54,458 |
| 5-Person Families | 143 (5.8%) | $0 |
| 6-Person Families | 272 (11.1%) | $64,563 |
| 7+ Person Families | 42 (1.7%) | $0 |
| Total | 2,458 (100.0%) | $55,722 |
Family Income by Number of Earners in Monett
The median family income in Monett is $55,722, with families comprising 3+ earners (221) having the highest median family income of $114,236, while families with no earners (439) have the lowest median family income of $24,047, accounting for 9.0% and 17.9% of families, respectively.
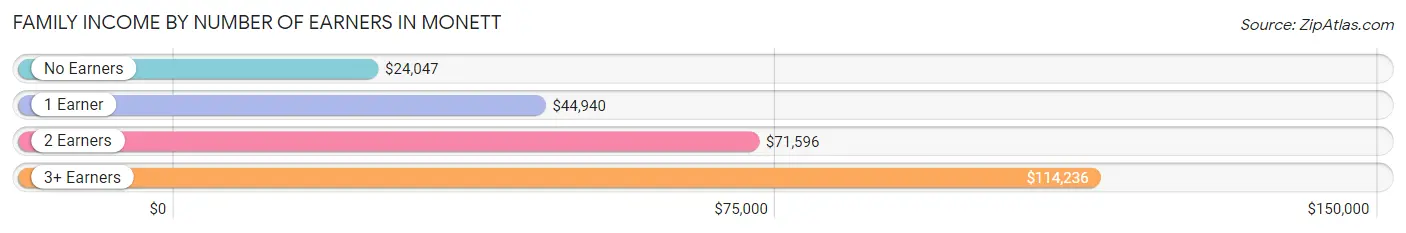
| Number of Earners | # Families | Median Income |
| No Earners | 439 (17.9%) | $24,047 |
| 1 Earner | 971 (39.5%) | $44,940 |
| 2 Earners | 827 (33.7%) | $71,596 |
| 3+ Earners | 221 (9.0%) | $114,236 |
| Total | 2,458 (100.0%) | $55,722 |
Household Income in Monett
Household Income Brackets in Monett
With 752 households falling in the category, the $35,000 to $49,999 income range is the most frequent in Monett, accounting for 20.3% of all households. In contrast, only 81 households (2.2%) fall into the $150,000 to $199,999 income bracket, making it the least populous group.
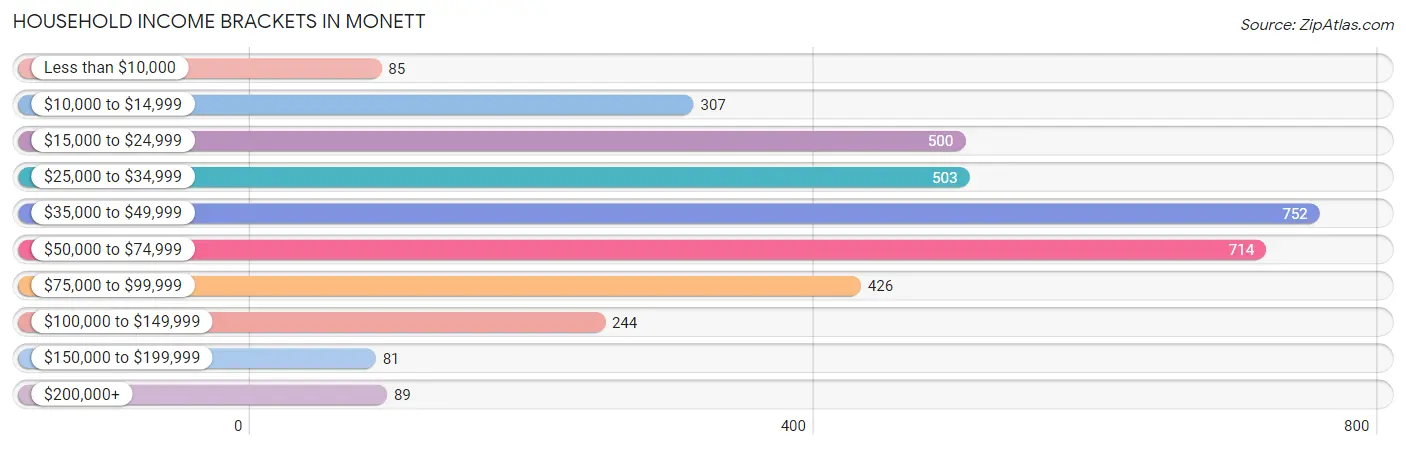
| Income Bracket | # Households | % Households |
| Less than $10,000 | 85 | 2.3% |
| $10,000 to $14,999 | 307 | 8.3% |
| $15,000 to $24,999 | 500 | 13.5% |
| $25,000 to $34,999 | 503 | 13.6% |
| $35,000 to $49,999 | 752 | 20.3% |
| $50,000 to $74,999 | 714 | 19.3% |
| $75,000 to $99,999 | 426 | 11.5% |
| $100,000 to $149,999 | 244 | 6.6% |
| $150,000 to $199,999 | 81 | 2.2% |
| $200,000+ | 89 | 2.4% |
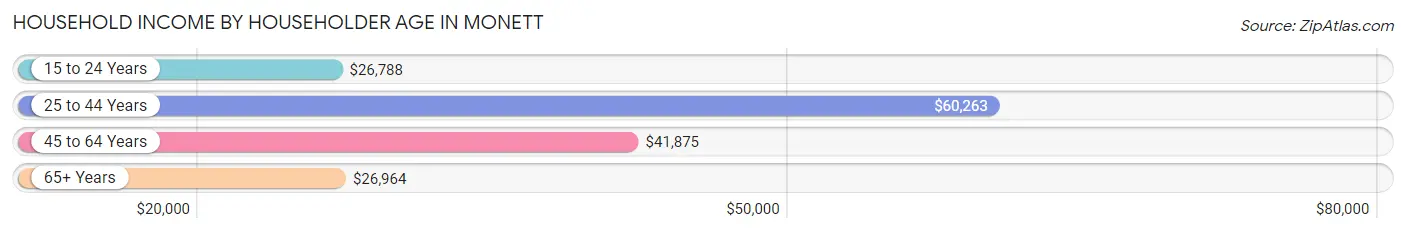
Household Income by Householder Age in Monett
The median household income in Monett is $42,635, with the highest median household income of $60,263 found in the 25 to 44 years age bracket for the primary householder. A total of 1,356 households (36.6%) fall into this category. Meanwhile, the 15 to 24 years age bracket for the primary householder has the lowest median household income of $26,788, with 331 households (8.9%) in this group.
| Income Bracket | # Households | Median Income |
| 15 to 24 Years | 331 (8.9%) | $26,788 |
| 25 to 44 Years | 1,356 (36.6%) | $60,263 |
| 45 to 64 Years | 883 (23.8%) | $41,875 |
| 65+ Years | 1,132 (30.6%) | $26,964 |
| Total | 3,702 (100.0%) | $42,635 |
Poverty in Monett
Income Below Poverty by Sex and Age in Monett
With 17.9% poverty level for males and 19.0% for females among the residents of Monett, 18 to 24 year old males and 6 to 11 year old females are the most vulnerable to poverty, with 166 males (44.7%) and 186 females (34.5%) in their respective age groups living below the poverty level.
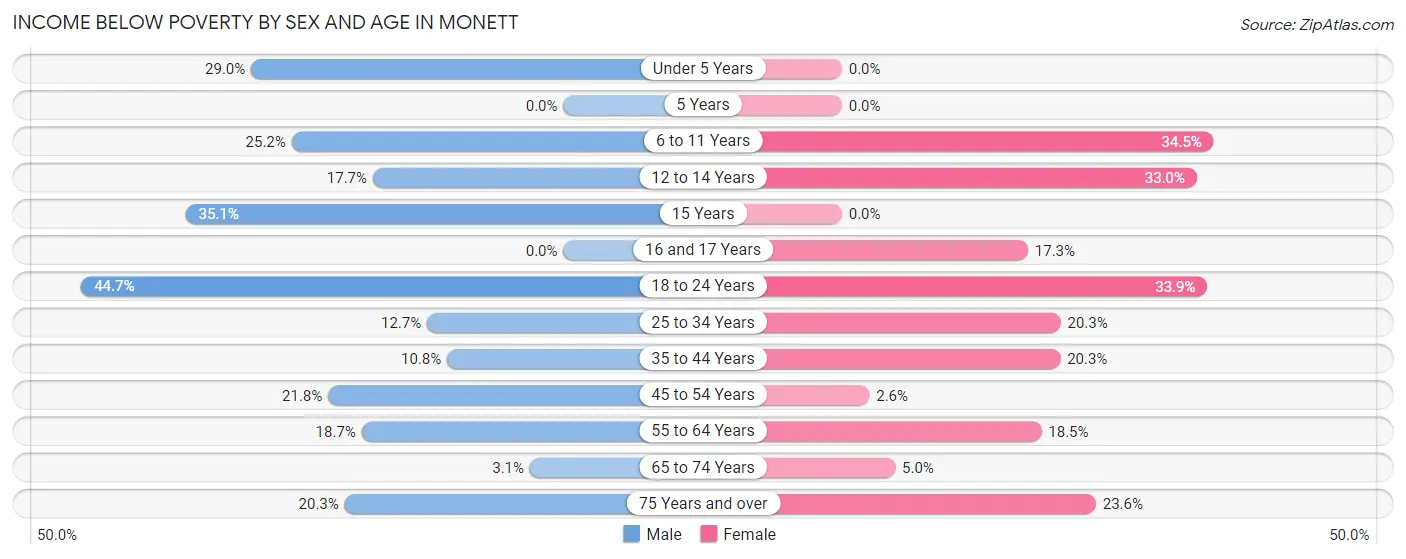
| Age Bracket | Male | Female |
| Under 5 Years | 71 (29.0%) | 0 (0.0%) |
| 5 Years | 0 (0.0%) | 0 (0.0%) |
| 6 to 11 Years | 143 (25.2%) | 186 (34.5%) |
| 12 to 14 Years | 61 (17.7%) | 57 (33.0%) |
| 15 Years | 27 (35.1%) | 0 (0.0%) |
| 16 and 17 Years | 0 (0.0%) | 19 (17.3%) |
| 18 to 24 Years | 166 (44.7%) | 135 (33.9%) |
| 25 to 34 Years | 92 (12.7%) | 134 (20.3%) |
| 35 to 44 Years | 94 (10.8%) | 105 (20.3%) |
| 45 to 54 Years | 55 (21.8%) | 11 (2.5%) |
| 55 to 64 Years | 91 (18.7%) | 80 (18.5%) |
| 65 to 74 Years | 15 (3.1%) | 15 (5.0%) |
| 75 Years and over | 54 (20.3%) | 153 (23.6%) |
| Total | 869 (17.9%) | 895 (19.0%) |
Income Above Poverty by Sex and Age in Monett
According to the poverty statistics in Monett, males aged 5 years and females aged under 5 years are the age groups that are most secure financially, with 100.0% of males and 100.0% of females in these age groups living above the poverty line.
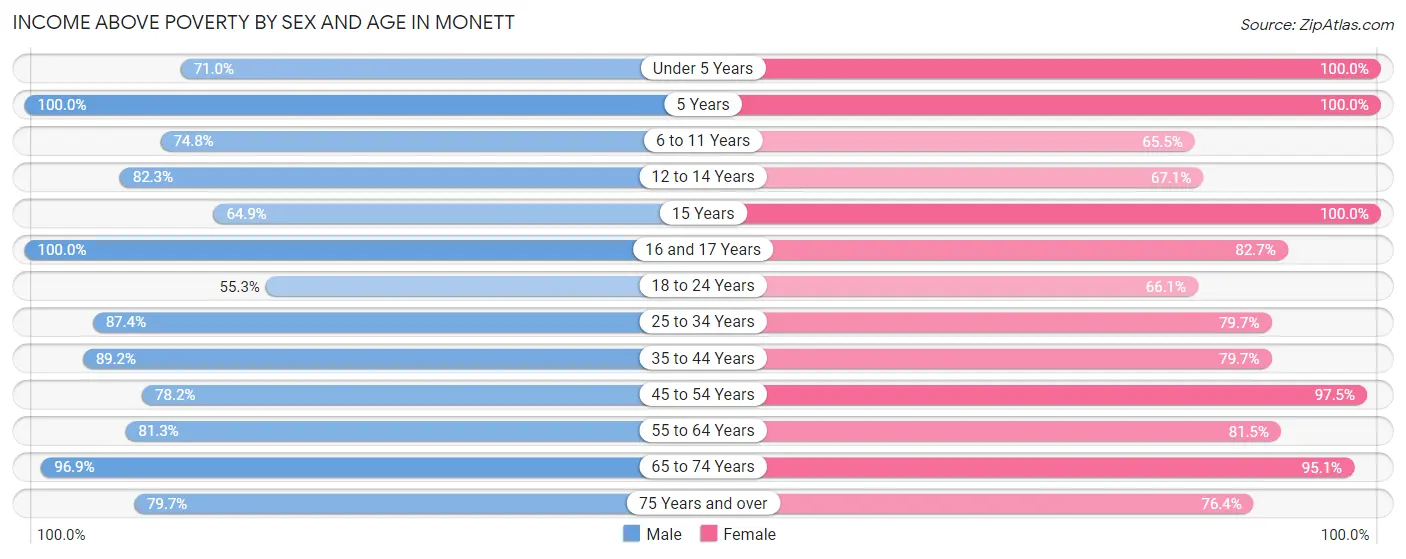
| Age Bracket | Male | Female |
| Under 5 Years | 174 (71.0%) | 269 (100.0%) |
| 5 Years | 11 (100.0%) | 98 (100.0%) |
| 6 to 11 Years | 424 (74.8%) | 353 (65.5%) |
| 12 to 14 Years | 284 (82.3%) | 116 (67.0%) |
| 15 Years | 50 (64.9%) | 126 (100.0%) |
| 16 and 17 Years | 139 (100.0%) | 91 (82.7%) |
| 18 to 24 Years | 205 (55.3%) | 263 (66.1%) |
| 25 to 34 Years | 635 (87.4%) | 526 (79.7%) |
| 35 to 44 Years | 777 (89.2%) | 413 (79.7%) |
| 45 to 54 Years | 197 (78.2%) | 421 (97.5%) |
| 55 to 64 Years | 395 (81.3%) | 352 (81.5%) |
| 65 to 74 Years | 468 (96.9%) | 288 (95.1%) |
| 75 Years and over | 212 (79.7%) | 496 (76.4%) |
| Total | 3,971 (82.1%) | 3,812 (81.0%) |
Income Below Poverty Among Married-Couple Families in Monett
The poverty statistics for married-couple families in Monett show that 8.9% or 135 of the total 1,519 families live below the poverty line. Families with 3 or 4 children have the highest poverty rate of 12.1%, comprising of 42 families. On the other hand, families with 1 or 2 children have the lowest poverty rate of 0.0%, which includes 0 families.
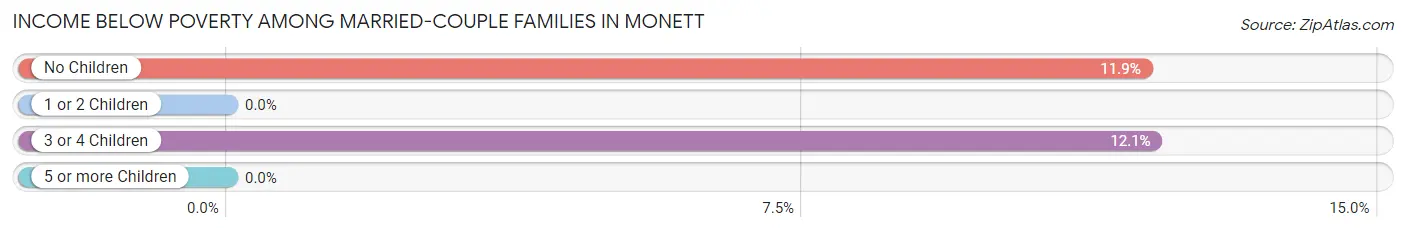
| Children | Above Poverty | Below Poverty |
| No Children | 686 (88.1%) | 93 (11.9%) |
| 1 or 2 Children | 392 (100.0%) | 0 (0.0%) |
| 3 or 4 Children | 306 (87.9%) | 42 (12.1%) |
| 5 or more Children | 0 (0.0%) | 0 (0.0%) |
| Total | 1,384 (91.1%) | 135 (8.9%) |
Income Below Poverty Among Single-Parent Households in Monett
According to the poverty data in Monett, 31.3% or 121 single-father households and 19.4% or 107 single-mother households are living below the poverty line. Among single-father households, those with 3 or 4 children have the highest poverty rate, with 110 households (100.0%) experiencing poverty. Likewise, among single-mother households, those with 3 or 4 children have the highest poverty rate, with 45 households (64.3%) falling below the poverty line.
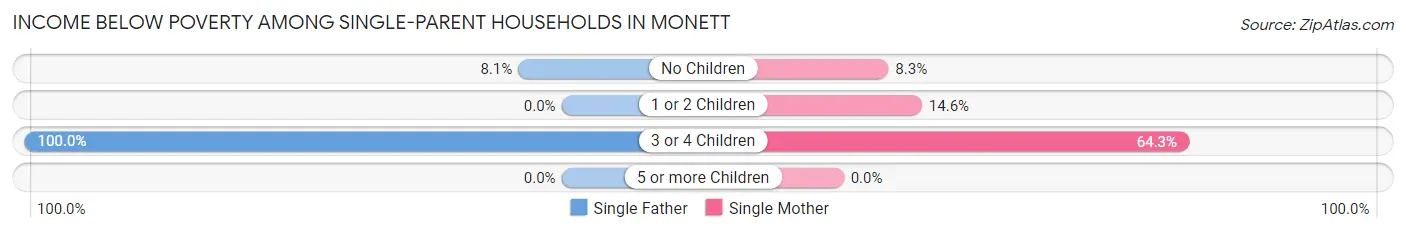
| Children | Single Father | Single Mother |
| No Children | 11 (8.1%) | 11 (8.3%) |
| 1 or 2 Children | 0 (0.0%) | 51 (14.6%) |
| 3 or 4 Children | 110 (100.0%) | 45 (64.3%) |
| 5 or more Children | 0 (0.0%) | 0 (0.0%) |
| Total | 121 (31.3%) | 107 (19.4%) |
Income Below Poverty Among Married-Couple vs Single-Parent Households in Monett
The poverty data for Monett shows that 135 of the married-couple family households (8.9%) and 228 of the single-parent households (24.3%) are living below the poverty level. Within the married-couple family households, those with 3 or 4 children have the highest poverty rate, with 42 households (12.1%) falling below the poverty line. Among the single-parent households, those with 3 or 4 children have the highest poverty rate, with 155 household (86.1%) living below poverty.
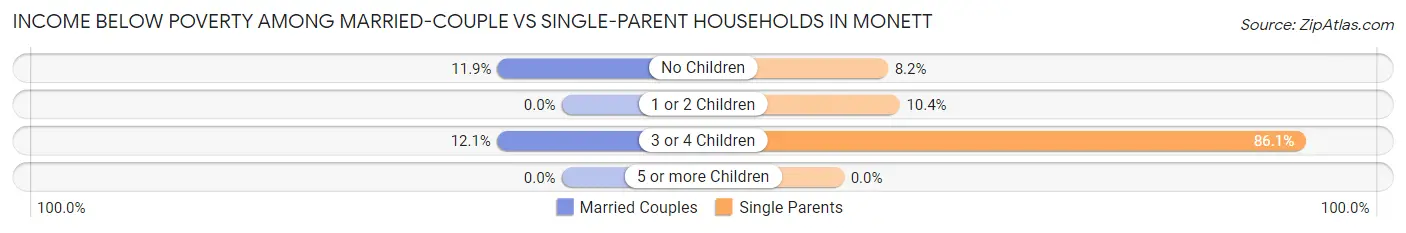
| Children | Married-Couple Families | Single-Parent Households |
| No Children | 93 (11.9%) | 22 (8.2%) |
| 1 or 2 Children | 0 (0.0%) | 51 (10.4%) |
| 3 or 4 Children | 42 (12.1%) | 155 (86.1%) |
| 5 or more Children | 0 (0.0%) | 0 (0.0%) |
| Total | 135 (8.9%) | 228 (24.3%) |
Race in Monett
The most populous races in Monett are White / Caucasian (6,930 | 72.0%), Hispanic or Latino (2,868 | 29.8%), and Two or more Races (1,477 | 15.3%).
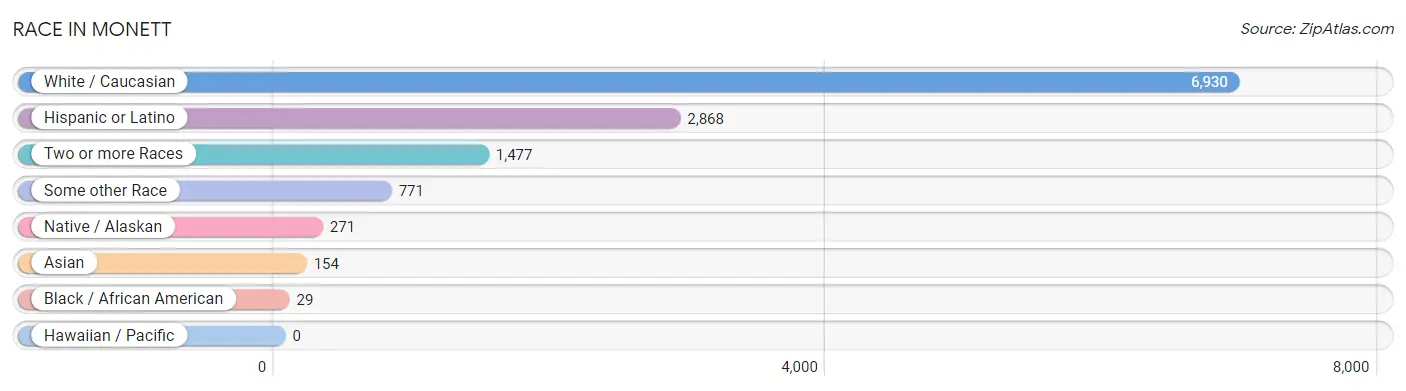
| Race | # Population | % Population |
| Asian | 154 | 1.6% |
| Black / African American | 29 | 0.3% |
| Hawaiian / Pacific | 0 | 0.0% |
| Hispanic or Latino | 2,868 | 29.8% |
| Native / Alaskan | 271 | 2.8% |
| White / Caucasian | 6,930 | 72.0% |
| Two or more Races | 1,477 | 15.3% |
| Some other Race | 771 | 8.0% |
| Total | 9,632 | 100.0% |
Ancestry in Monett
The most populous ancestries reported in Monett are Mexican (1,984 | 20.6%), German (1,482 | 15.4%), English (832 | 8.6%), American (804 | 8.4%), and Irish (784 | 8.1%), together accounting for 61.1% of all Monett residents.
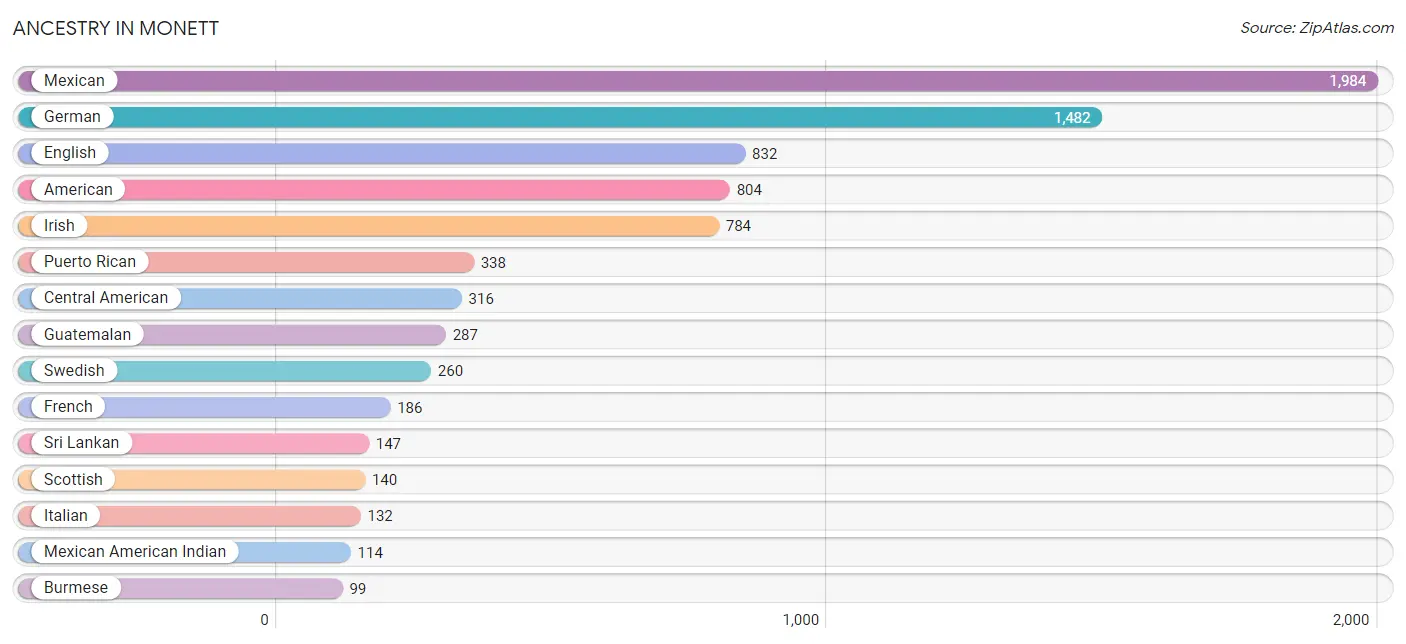
| Ancestry | # Population | % Population |
| American | 804 | 8.4% |
| Armenian | 40 | 0.4% |
| Bangladeshi | 19 | 0.2% |
| Belgian | 11 | 0.1% |
| Bhutanese | 29 | 0.3% |
| British | 57 | 0.6% |
| Burmese | 99 | 1.0% |
| Canadian | 23 | 0.2% |
| Central American | 316 | 3.3% |
| Central American Indian | 70 | 0.7% |
| Cherokee | 31 | 0.3% |
| Czechoslovakian | 22 | 0.2% |
| Dutch | 74 | 0.8% |
| Eastern European | 73 | 0.8% |
| English | 832 | 8.6% |
| European | 53 | 0.5% |
| French | 186 | 1.9% |
| French Canadian | 8 | 0.1% |
| German | 1,482 | 15.4% |
| Guamanian / Chamorro | 28 | 0.3% |
| Guatemalan | 287 | 3.0% |
| Honduran | 29 | 0.3% |
| Irish | 784 | 8.1% |
| Italian | 132 | 1.4% |
| Korean | 81 | 0.8% |
| Mexican | 1,984 | 20.6% |
| Mexican American Indian | 114 | 1.2% |
| Osage | 21 | 0.2% |
| Polish | 52 | 0.5% |
| Puerto Rican | 338 | 3.5% |
| Scotch-Irish | 67 | 0.7% |
| Scottish | 140 | 1.5% |
| Slavic | 8 | 0.1% |
| Sri Lankan | 147 | 1.5% |
| Swedish | 260 | 2.7% |
| Swiss | 20 | 0.2% |
| Welsh | 51 | 0.5% | View All 37 Rows |
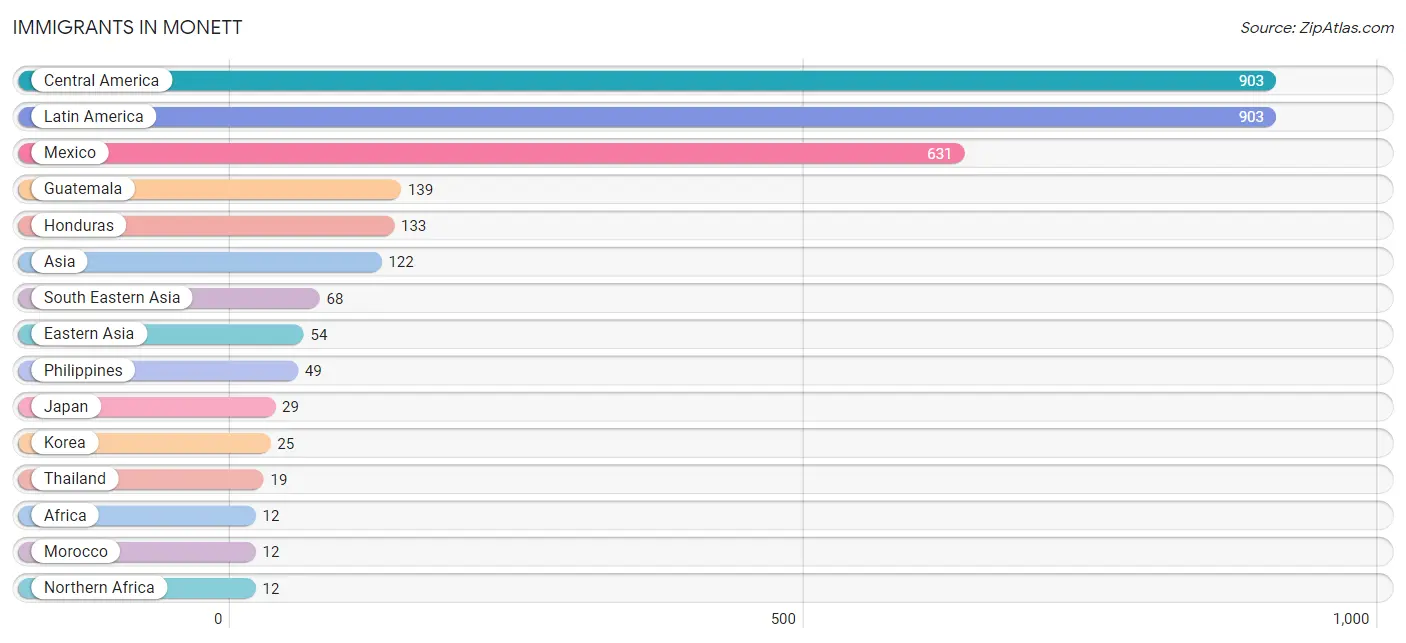
Immigrants in Monett
The most numerous immigrant groups reported in Monett came from Central America (903 | 9.4%), Latin America (903 | 9.4%), Mexico (631 | 6.6%), Guatemala (139 | 1.4%), and Honduras (133 | 1.4%), together accounting for 28.1% of all Monett residents.
| Immigration Origin | # Population | % Population |
| Africa | 12 | 0.1% |
| Asia | 122 | 1.3% |
| Central America | 903 | 9.4% |
| Eastern Asia | 54 | 0.6% |
| Guatemala | 139 | 1.4% |
| Honduras | 133 | 1.4% |
| Japan | 29 | 0.3% |
| Korea | 25 | 0.3% |
| Latin America | 903 | 9.4% |
| Mexico | 631 | 6.6% |
| Morocco | 12 | 0.1% |
| Northern Africa | 12 | 0.1% |
| Philippines | 49 | 0.5% |
| South Eastern Asia | 68 | 0.7% |
| Thailand | 19 | 0.2% | View All 15 Rows |
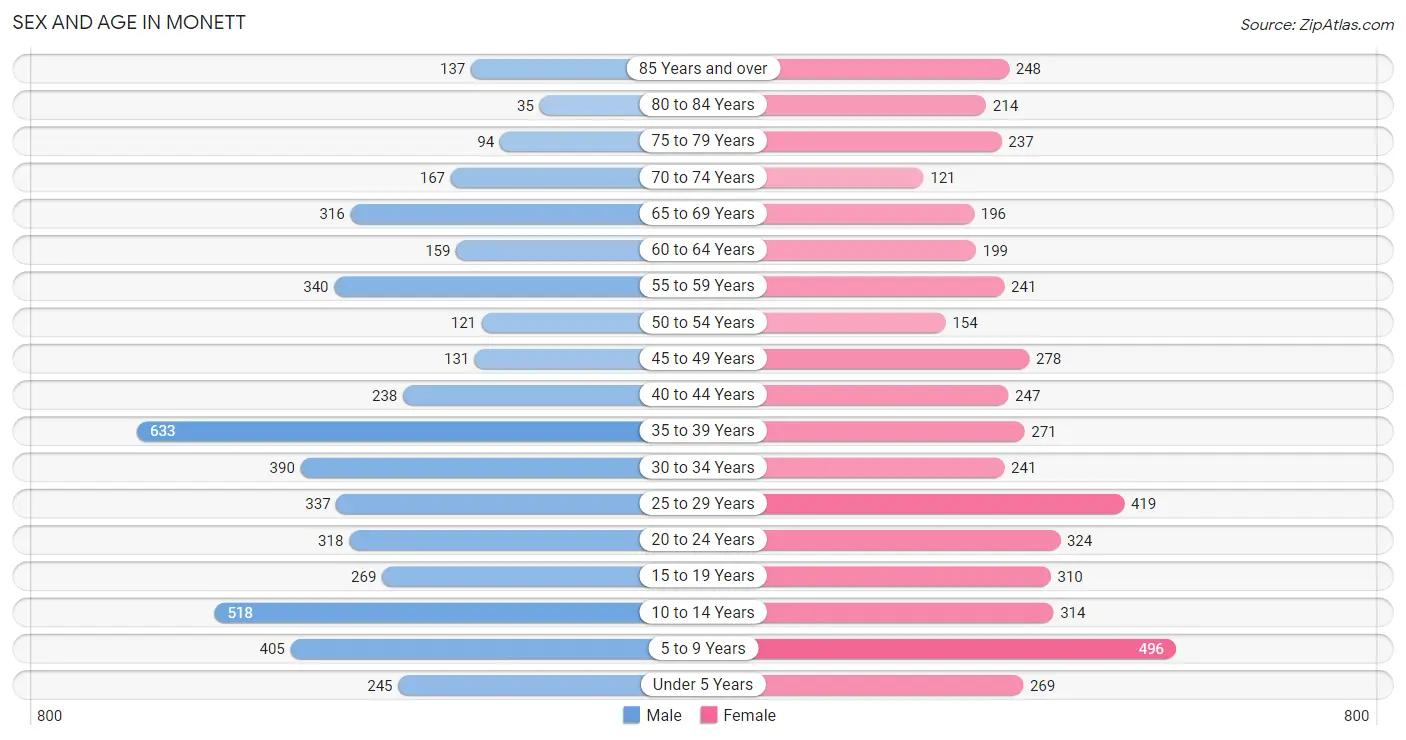
Sex and Age in Monett
Sex and Age in Monett
The most populous age groups in Monett are 35 to 39 Years (633 | 13.0%) for men and 5 to 9 Years (496 | 10.4%) for women.
| Age Bracket | Male | Female |
| Under 5 Years | 245 (5.1%) | 269 (5.6%) |
| 5 to 9 Years | 405 (8.4%) | 496 (10.4%) |
| 10 to 14 Years | 518 (10.7%) | 314 (6.6%) |
| 15 to 19 Years | 269 (5.5%) | 310 (6.5%) |
| 20 to 24 Years | 318 (6.6%) | 324 (6.8%) |
| 25 to 29 Years | 337 (6.9%) | 419 (8.8%) |
| 30 to 34 Years | 390 (8.0%) | 241 (5.0%) |
| 35 to 39 Years | 633 (13.0%) | 271 (5.7%) |
| 40 to 44 Years | 238 (4.9%) | 247 (5.2%) |
| 45 to 49 Years | 131 (2.7%) | 278 (5.8%) |
| 50 to 54 Years | 121 (2.5%) | 154 (3.2%) |
| 55 to 59 Years | 340 (7.0%) | 241 (5.0%) |
| 60 to 64 Years | 159 (3.3%) | 199 (4.2%) |
| 65 to 69 Years | 316 (6.5%) | 196 (4.1%) |
| 70 to 74 Years | 167 (3.4%) | 121 (2.5%) |
| 75 to 79 Years | 94 (1.9%) | 237 (5.0%) |
| 80 to 84 Years | 35 (0.7%) | 214 (4.5%) |
| 85 Years and over | 137 (2.8%) | 248 (5.2%) |
| Total | 4,853 (100.0%) | 4,779 (100.0%) |
Families and Households in Monett
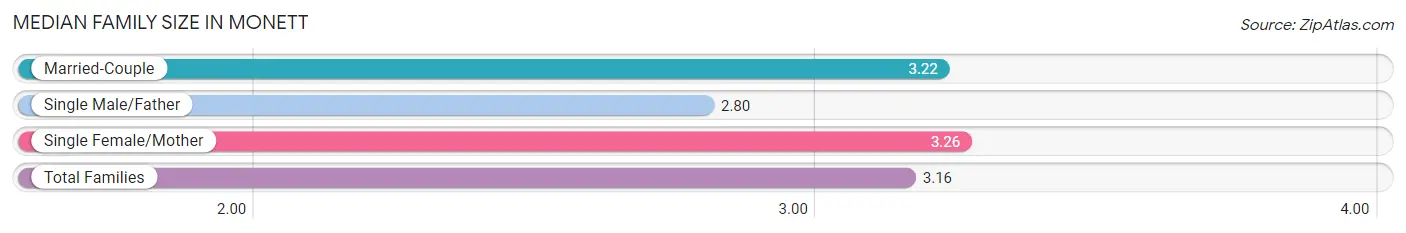
Median Family Size in Monett
The median family size in Monett is 3.16 persons per family, with single female/mother families (552 | 22.5%) accounting for the largest median family size of 3.26 persons per family. On the other hand, single male/father families (387 | 15.7%) represent the smallest median family size with 2.80 persons per family.
| Family Type | # Families | Family Size |
| Married-Couple | 1,519 (61.8%) | 3.22 |
| Single Male/Father | 387 (15.7%) | 2.80 |
| Single Female/Mother | 552 (22.5%) | 3.26 |
| Total Families | 2,458 (100.0%) | 3.16 |
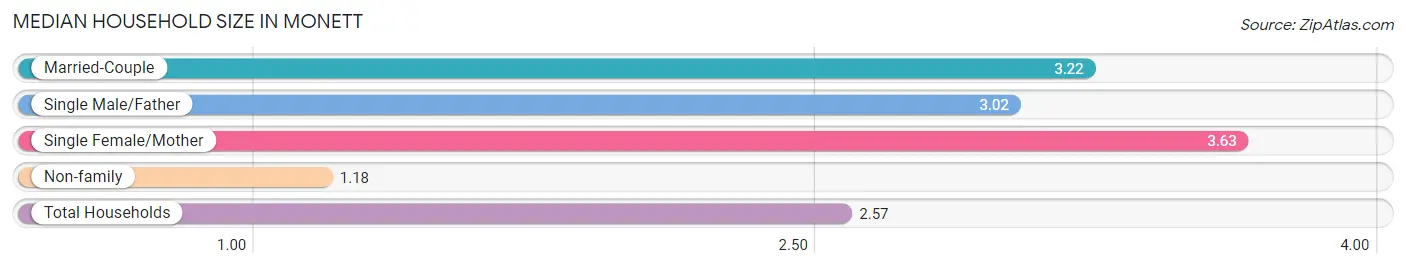
Median Household Size in Monett
The median household size in Monett is 2.57 persons per household, with single female/mother households (552 | 14.9%) accounting for the largest median household size of 3.63 persons per household. non-family households (1,244 | 33.6%) represent the smallest median household size with 1.18 persons per household.
| Household Type | # Households | Household Size |
| Married-Couple | 1,519 (41.0%) | 3.22 |
| Single Male/Father | 387 (10.4%) | 3.02 |
| Single Female/Mother | 552 (14.9%) | 3.63 |
| Non-family | 1,244 (33.6%) | 1.18 |
| Total Households | 3,702 (100.0%) | 2.57 |
Household Size by Marriage Status in Monett
Out of a total of 3,702 households in Monett, 2,458 (66.4%) are family households, while 1,244 (33.6%) are nonfamily households. The most numerous type of family households are 2-person households, comprising 1,130, and the most common type of nonfamily households are 1-person households, comprising 1,156.
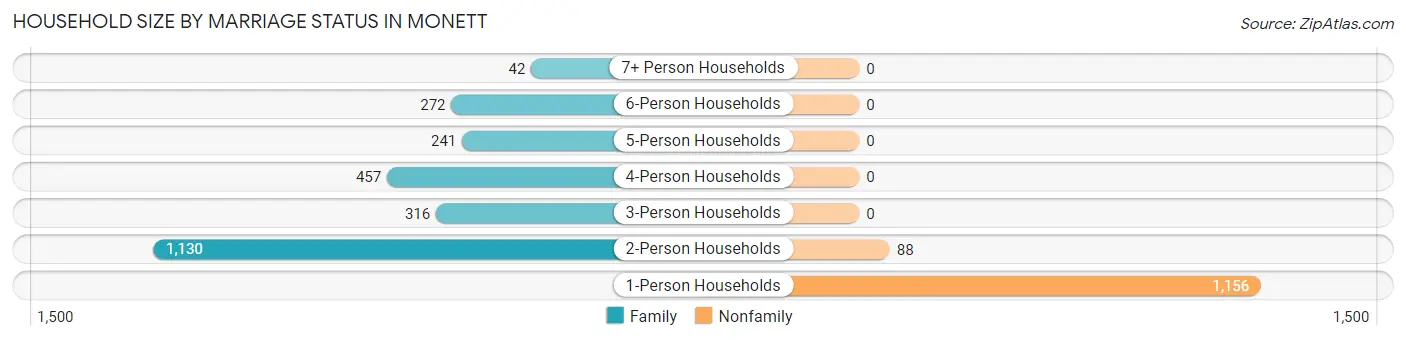
| Household Size | Family Households | Nonfamily Households |
| 1-Person Households | - | 1,156 (31.2%) |
| 2-Person Households | 1,130 (30.5%) | 88 (2.4%) |
| 3-Person Households | 316 (8.5%) | 0 (0.0%) |
| 4-Person Households | 457 (12.3%) | 0 (0.0%) |
| 5-Person Households | 241 (6.5%) | 0 (0.0%) |
| 6-Person Households | 272 (7.3%) | 0 (0.0%) |
| 7+ Person Households | 42 (1.1%) | 0 (0.0%) |
| Total | 2,458 (66.4%) | 1,244 (33.6%) |
Female Fertility in Monett
Fertility by Age in Monett
Average fertility rate in Monett is 16.0 births per 1,000 women. Women in the age bracket of 20 to 34 years have the highest fertility rate with 36.0 births per 1,000 women. Women in the age bracket of 20 to 34 years acount for 100.0% of all women with births.
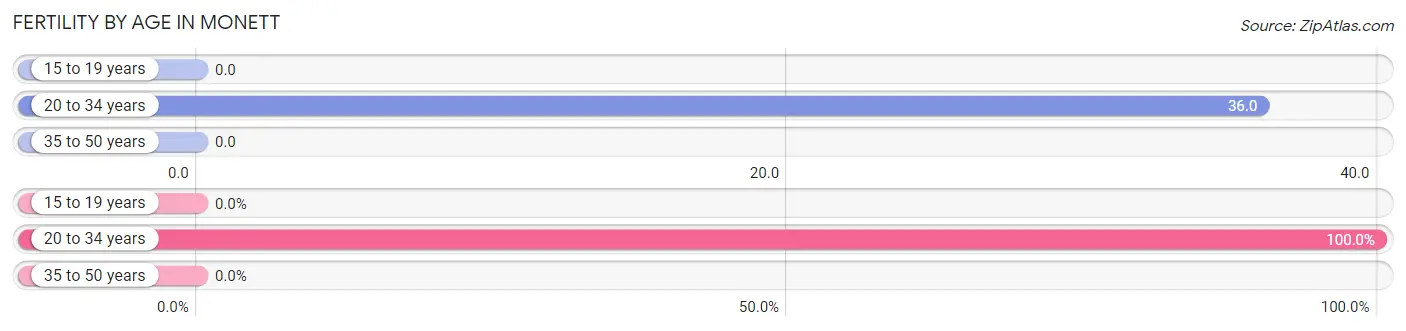
| Age Bracket | Women with Births | Births / 1,000 Women |
| 15 to 19 years | 0 (0.0%) | 0.0 |
| 20 to 34 years | 35 (100.0%) | 36.0 |
| 35 to 50 years | 0 (0.0%) | 0.0 |
| Total | 35 (100.0%) | 16.0 |
Fertility by Age by Marriage Status in Monett
42.9% of women with births (35) in Monett are married. The highest percentage of unmarried women with births falls into 20 to 34 years age bracket with 57.1% of them unmarried at the time of birth, while the lowest percentage of unmarried women with births belong to 20 to 34 years age bracket with 57.1% of them unmarried.
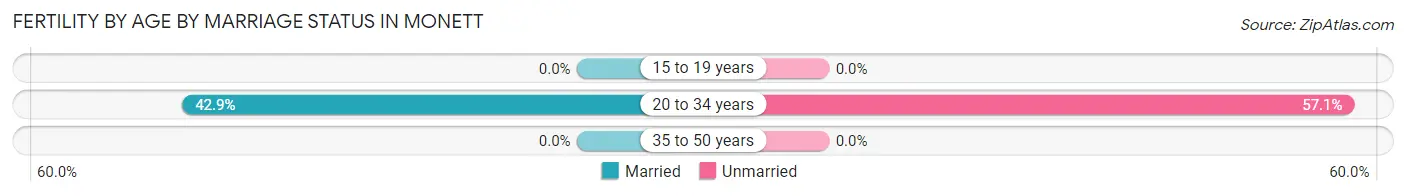
| Age Bracket | Married | Unmarried |
| 15 to 19 years | 0 (0.0%) | 0 (0.0%) |
| 20 to 34 years | 15 (42.9%) | 20 (57.1%) |
| 35 to 50 years | 0 (0.0%) | 0 (0.0%) |
| Total | 15 (42.9%) | 20 (57.1%) |
Fertility by Education in Monett
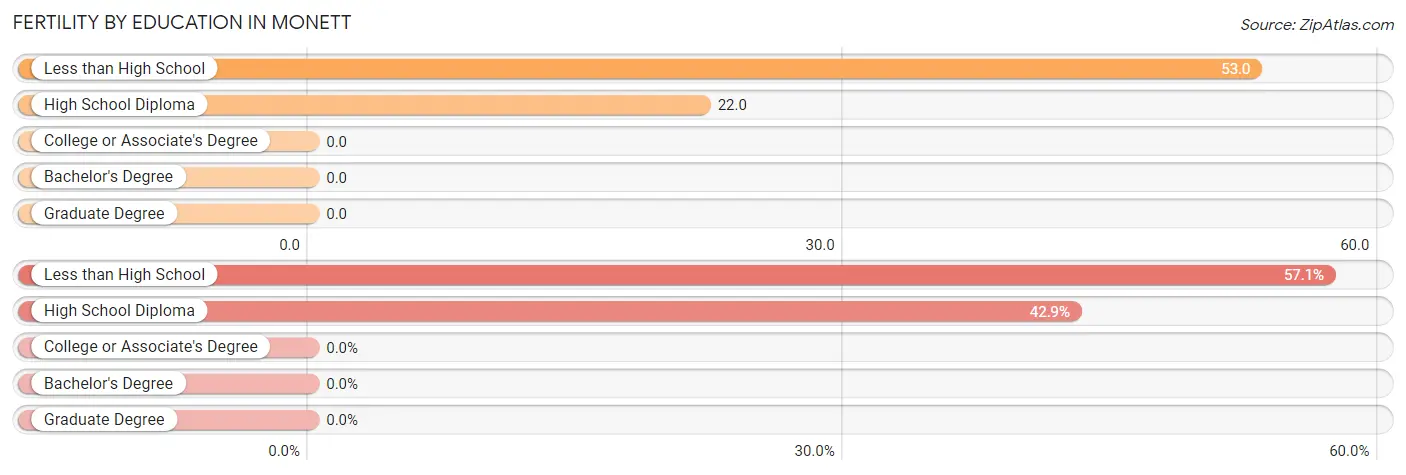
| Educational Attainment | Women with Births | Births / 1,000 Women |
| Less than High School | 20 (57.1%) | 53.0 |
| High School Diploma | 15 (42.9%) | 22.0 |
| College or Associate's Degree | 0 (0.0%) | 0.0 |
| Bachelor's Degree | 0 (0.0%) | 0.0 |
| Graduate Degree | 0 (0.0%) | 0.0 |
| Total | 35 (100.0%) | 16.0 |
Fertility by Education by Marriage Status in Monett
57.1% of women with births in Monett are unmarried. Women with the educational attainment of high school diploma are most likely to be married with 100.0% of them married at childbirth, while women with the educational attainment of less than high school are least likely to be married with 100.0% of them unmarried at childbirth.
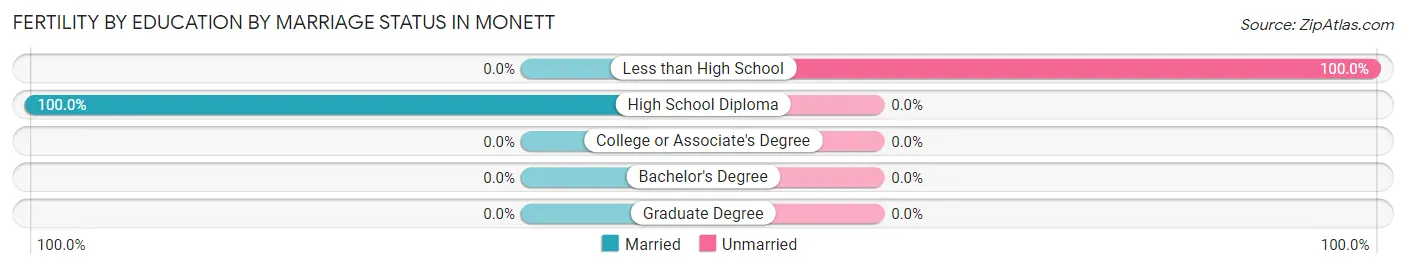
| Educational Attainment | Married | Unmarried |
| Less than High School | 0 (0.0%) | 20 (100.0%) |
| High School Diploma | 15 (100.0%) | 0 (0.0%) |
| College or Associate's Degree | 0 (0.0%) | 0 (0.0%) |
| Bachelor's Degree | 0 (0.0%) | 0 (0.0%) |
| Graduate Degree | 0 (0.0%) | 0 (0.0%) |
| Total | 15 (42.9%) | 20 (57.1%) |
Employment Characteristics in Monett
Employment by Class of Employer in Monett
Among the 4,564 employed individuals in Monett, private company employees (3,350 | 73.4%), local government employees (551 | 12.1%), and self-employed (not incorporated) (284 | 6.2%) make up the most common classes of employment.
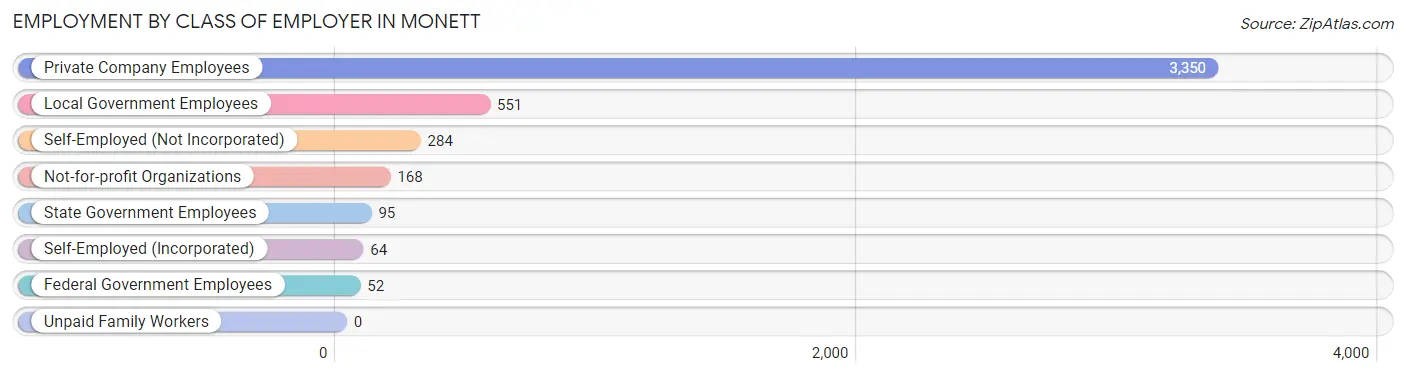
| Employer Class | # Employees | % Employees |
| Private Company Employees | 3,350 | 73.4% |
| Self-Employed (Incorporated) | 64 | 1.4% |
| Self-Employed (Not Incorporated) | 284 | 6.2% |
| Not-for-profit Organizations | 168 | 3.7% |
| Local Government Employees | 551 | 12.1% |
| State Government Employees | 95 | 2.1% |
| Federal Government Employees | 52 | 1.1% |
| Unpaid Family Workers | 0 | 0.0% |
| Total | 4,564 | 100.0% |
Employment Status by Age in Monett
According to the labor force statistics for Monett, out of the total population over 16 years of age (7,182), 67.1% or 4,819 individuals are in the labor force, with 4.6% or 222 of them unemployed. The age group with the highest labor force participation rate is 20 to 24 years, with 96.9% or 622 individuals in the labor force. Within the labor force, the 20 to 24 years age range has the highest percentage of unemployed individuals, with 9.6% or 60 of them being unemployed.
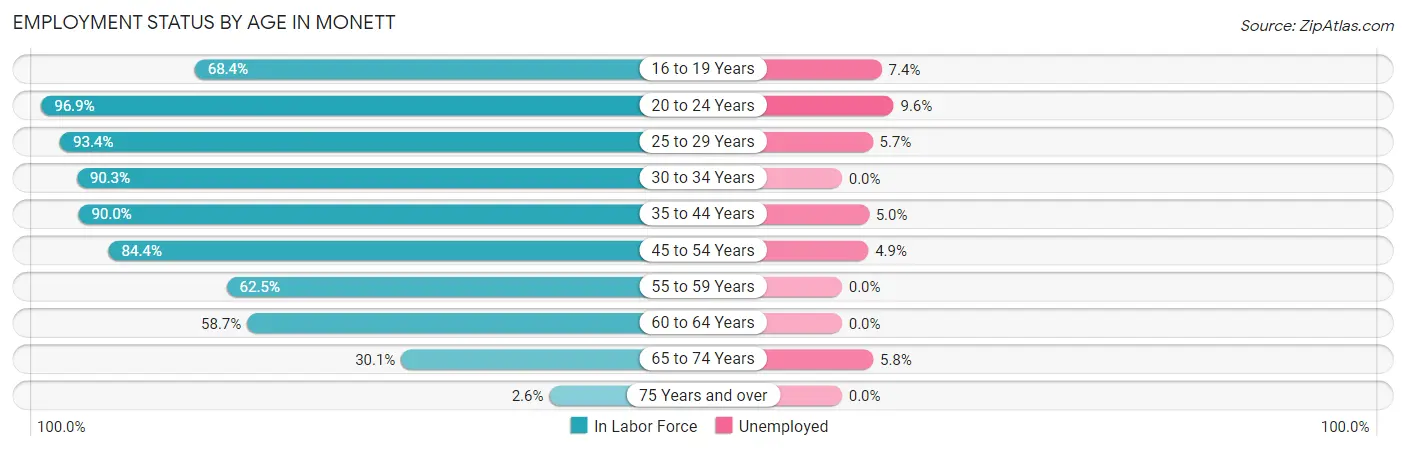
| Age Bracket | In Labor Force | Unemployed |
| 16 to 19 Years | 257 (68.4%) | 19 (7.4%) |
| 20 to 24 Years | 622 (96.9%) | 60 (9.6%) |
| 25 to 29 Years | 706 (93.4%) | 40 (5.7%) |
| 30 to 34 Years | 570 (90.3%) | 0 (0.0%) |
| 35 to 44 Years | 1,250 (90.0%) | 62 (5.0%) |
| 45 to 54 Years | 577 (84.4%) | 28 (4.9%) |
| 55 to 59 Years | 363 (62.5%) | 0 (0.0%) |
| 60 to 64 Years | 210 (58.7%) | 0 (0.0%) |
| 65 to 74 Years | 241 (30.1%) | 14 (5.8%) |
| 75 Years and over | 25 (2.6%) | 0 (0.0%) |
| Total | 4,819 (67.1%) | 222 (4.6%) |
Employment Status by Educational Attainment in Monett
According to labor force statistics for Monett, 83.6% of individuals (3,678) out of the total population between 25 and 64 years of age (4,399) are in the labor force, with 3.5% or 129 of them being unemployed. The group with the highest labor force participation rate are those with the educational attainment of high school diploma, with 93.7% or 1,463 individuals in the labor force. Within the labor force, individuals with college / associate degree education have the highest percentage of unemployment, with 7.7% or 88 of them being unemployed.
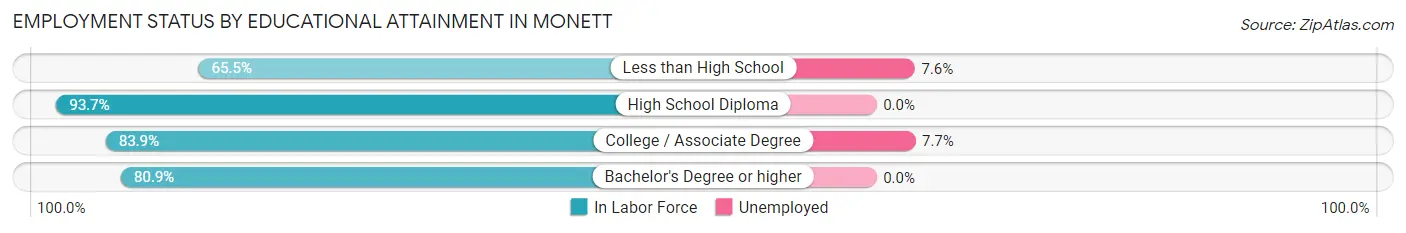
| Educational Attainment | In Labor Force | Unemployed |
| Less than High School | 527 (65.5%) | 61 (7.6%) |
| High School Diploma | 1,463 (93.7%) | 0 (0.0%) |
| College / Associate Degree | 1,149 (83.9%) | 105 (7.7%) |
| Bachelor's Degree or higher | 537 (80.9%) | 0 (0.0%) |
| Total | 3,678 (83.6%) | 154 (3.5%) |
Employment Occupations by Sex in Monett
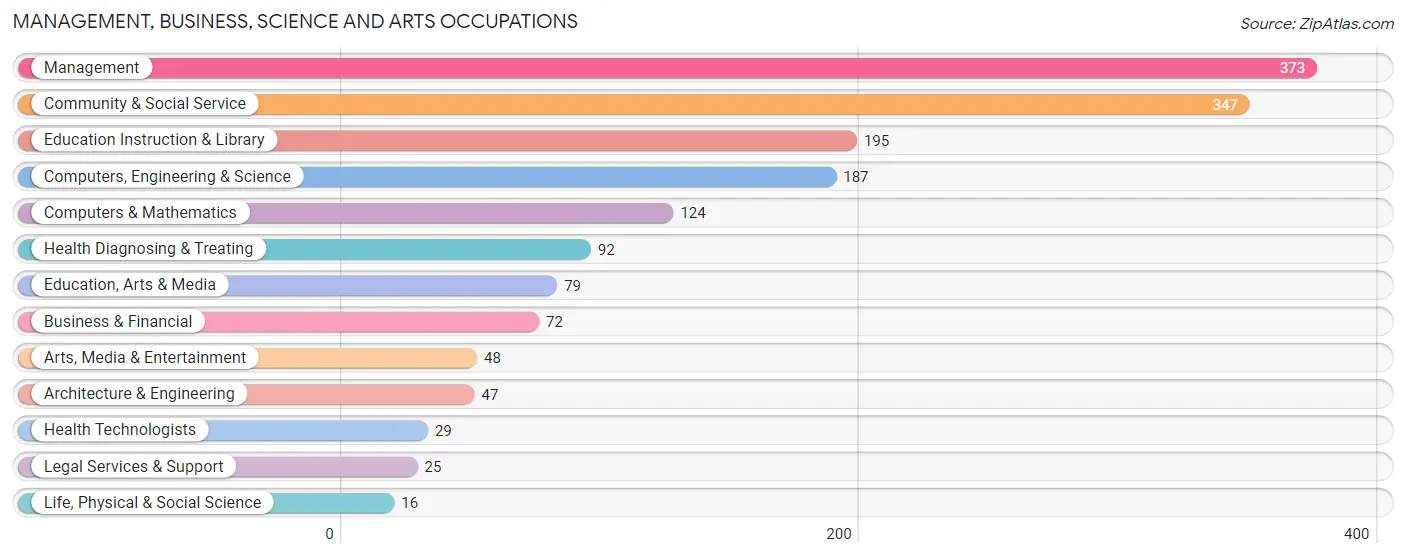
Management, Business, Science and Arts Occupations
The most common Management, Business, Science and Arts occupations in Monett are Management (373 | 8.2%), Community & Social Service (347 | 7.6%), Education Instruction & Library (195 | 4.3%), Computers, Engineering & Science (187 | 4.1%), and Computers & Mathematics (124 | 2.7%).
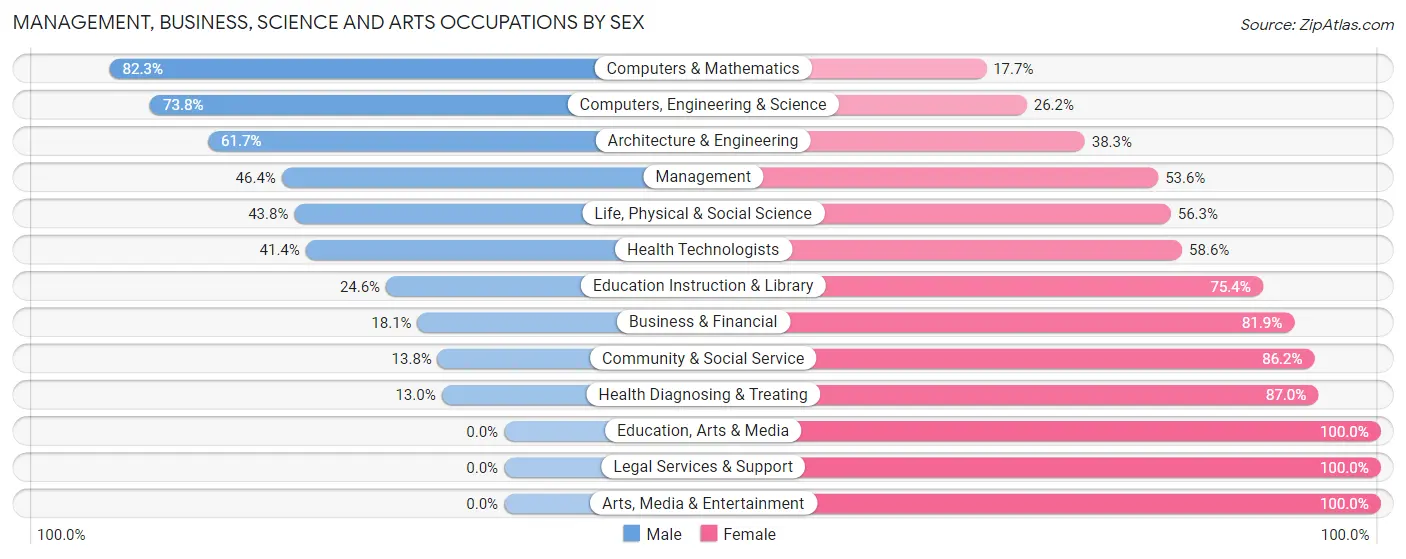
Management, Business, Science and Arts Occupations by Sex
Within the Management, Business, Science and Arts occupations in Monett, the most male-oriented occupations are Computers & Mathematics (82.3%), Computers, Engineering & Science (73.8%), and Architecture & Engineering (61.7%), while the most female-oriented occupations are Education, Arts & Media (100.0%), Legal Services & Support (100.0%), and Arts, Media & Entertainment (100.0%).
| Occupation | Male | Female |
| Management | 173 (46.4%) | 200 (53.6%) |
| Business & Financial | 13 (18.1%) | 59 (81.9%) |
| Computers, Engineering & Science | 138 (73.8%) | 49 (26.2%) |
| Computers & Mathematics | 102 (82.3%) | 22 (17.7%) |
| Architecture & Engineering | 29 (61.7%) | 18 (38.3%) |
| Life, Physical & Social Science | 7 (43.8%) | 9 (56.2%) |
| Community & Social Service | 48 (13.8%) | 299 (86.2%) |
| Education, Arts & Media | 0 (0.0%) | 79 (100.0%) |
| Legal Services & Support | 0 (0.0%) | 25 (100.0%) |
| Education Instruction & Library | 48 (24.6%) | 147 (75.4%) |
| Arts, Media & Entertainment | 0 (0.0%) | 48 (100.0%) |
| Health Diagnosing & Treating | 12 (13.0%) | 80 (87.0%) |
| Health Technologists | 12 (41.4%) | 17 (58.6%) |
| Total (Category) | 384 (35.8%) | 687 (64.1%) |
| Total (Overall) | 2,327 (51.0%) | 2,238 (49.0%) |
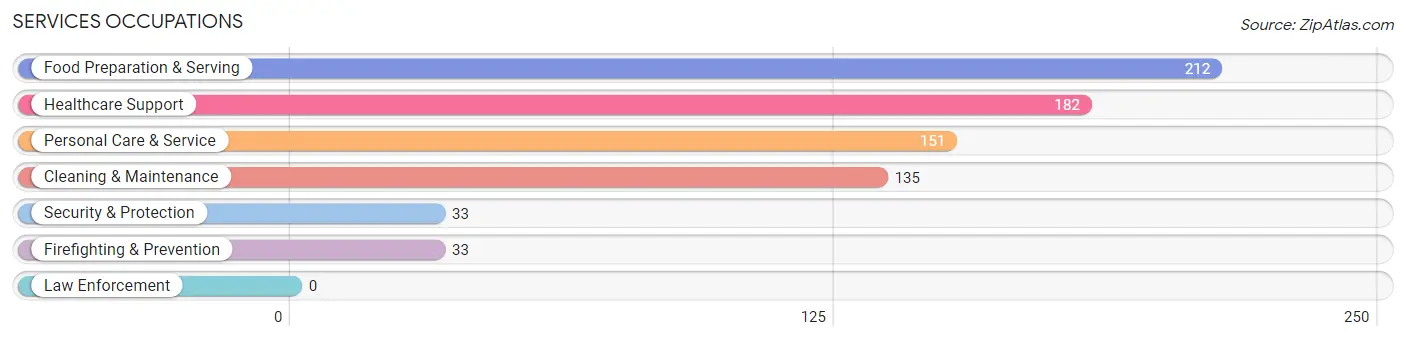
Services Occupations
The most common Services occupations in Monett are Food Preparation & Serving (212 | 4.6%), Healthcare Support (182 | 4.0%), Personal Care & Service (151 | 3.3%), Cleaning & Maintenance (135 | 3.0%), and Security & Protection (33 | 0.7%).
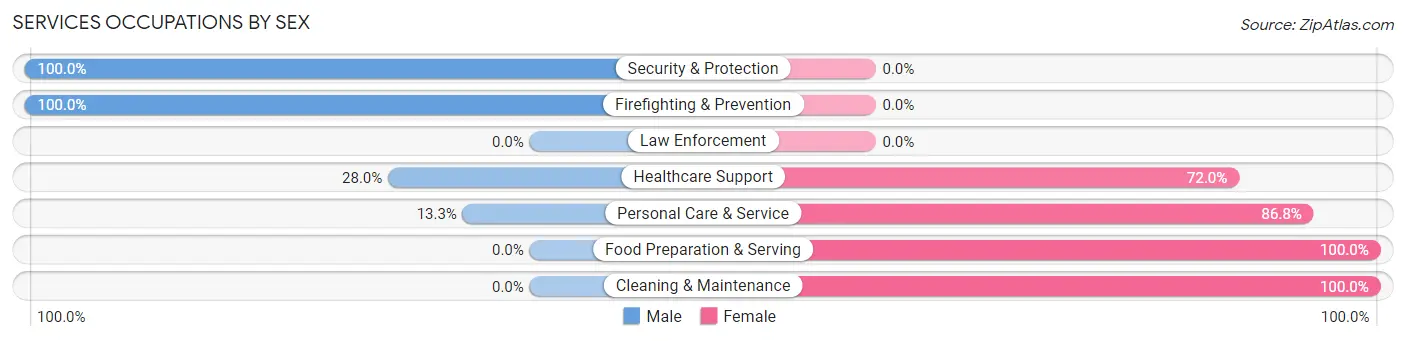
Services Occupations by Sex
Within the Services occupations in Monett, the most male-oriented occupations are Security & Protection (100.0%), Firefighting & Prevention (100.0%), and Healthcare Support (28.0%), while the most female-oriented occupations are Food Preparation & Serving (100.0%), Cleaning & Maintenance (100.0%), and Personal Care & Service (86.8%).
| Occupation | Male | Female |
| Healthcare Support | 51 (28.0%) | 131 (72.0%) |
| Security & Protection | 33 (100.0%) | 0 (0.0%) |
| Firefighting & Prevention | 33 (100.0%) | 0 (0.0%) |
| Law Enforcement | 0 (0.0%) | 0 (0.0%) |
| Food Preparation & Serving | 0 (0.0%) | 212 (100.0%) |
| Cleaning & Maintenance | 0 (0.0%) | 135 (100.0%) |
| Personal Care & Service | 20 (13.3%) | 131 (86.8%) |
| Total (Category) | 104 (14.6%) | 609 (85.4%) |
| Total (Overall) | 2,327 (51.0%) | 2,238 (49.0%) |
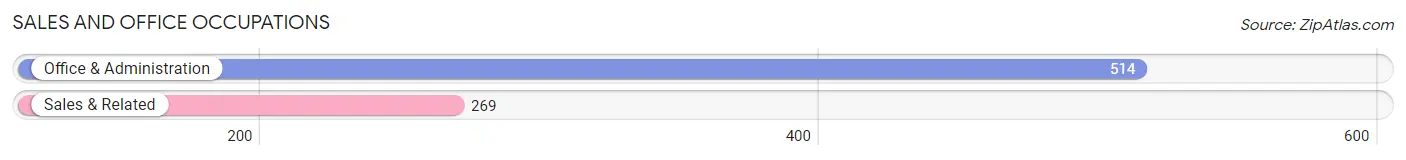
Sales and Office Occupations
The most common Sales and Office occupations in Monett are Office & Administration (514 | 11.3%), and Sales & Related (269 | 5.9%).
Sales and Office Occupations by Sex
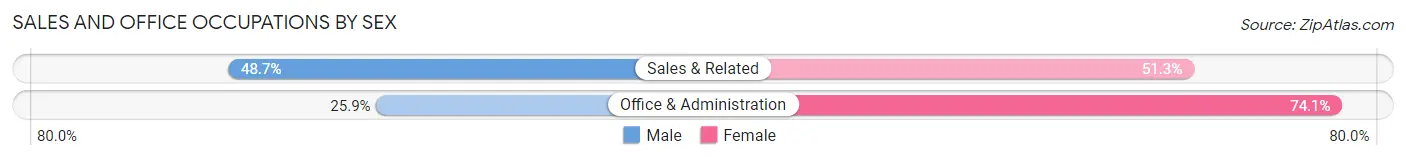
| Occupation | Male | Female |
| Sales & Related | 131 (48.7%) | 138 (51.3%) |
| Office & Administration | 133 (25.9%) | 381 (74.1%) |
| Total (Category) | 264 (33.7%) | 519 (66.3%) |
| Total (Overall) | 2,327 (51.0%) | 2,238 (49.0%) |
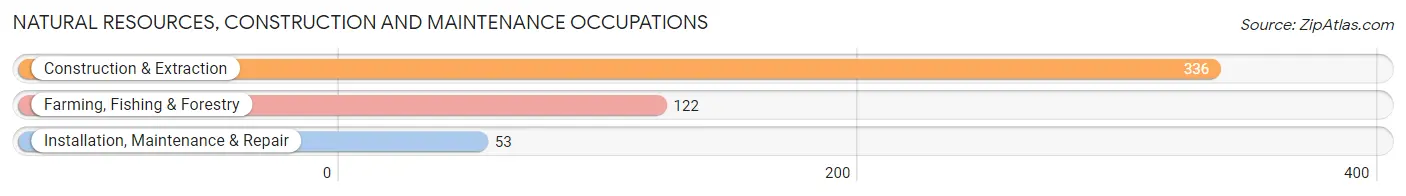
Natural Resources, Construction and Maintenance Occupations
The most common Natural Resources, Construction and Maintenance occupations in Monett are Construction & Extraction (336 | 7.4%), Farming, Fishing & Forestry (122 | 2.7%), and Installation, Maintenance & Repair (53 | 1.2%).
Natural Resources, Construction and Maintenance Occupations by Sex
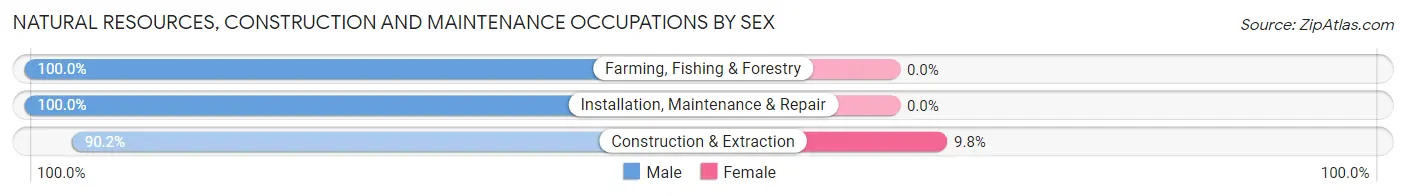
| Occupation | Male | Female |
| Farming, Fishing & Forestry | 122 (100.0%) | 0 (0.0%) |
| Construction & Extraction | 303 (90.2%) | 33 (9.8%) |
| Installation, Maintenance & Repair | 53 (100.0%) | 0 (0.0%) |
| Total (Category) | 478 (93.5%) | 33 (6.5%) |
| Total (Overall) | 2,327 (51.0%) | 2,238 (49.0%) |
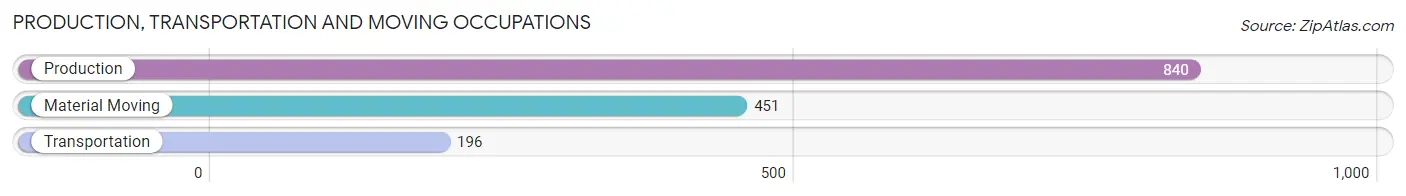
Production, Transportation and Moving Occupations
The most common Production, Transportation and Moving occupations in Monett are Production (840 | 18.4%), Material Moving (451 | 9.9%), and Transportation (196 | 4.3%).
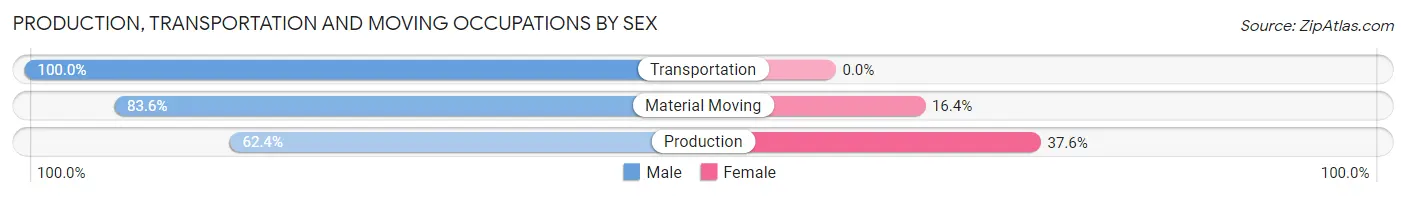
Production, Transportation and Moving Occupations by Sex
| Occupation | Male | Female |
| Production | 524 (62.4%) | 316 (37.6%) |
| Transportation | 196 (100.0%) | 0 (0.0%) |
| Material Moving | 377 (83.6%) | 74 (16.4%) |
| Total (Category) | 1,097 (73.8%) | 390 (26.2%) |
| Total (Overall) | 2,327 (51.0%) | 2,238 (49.0%) |
Employment Industries by Sex in Monett
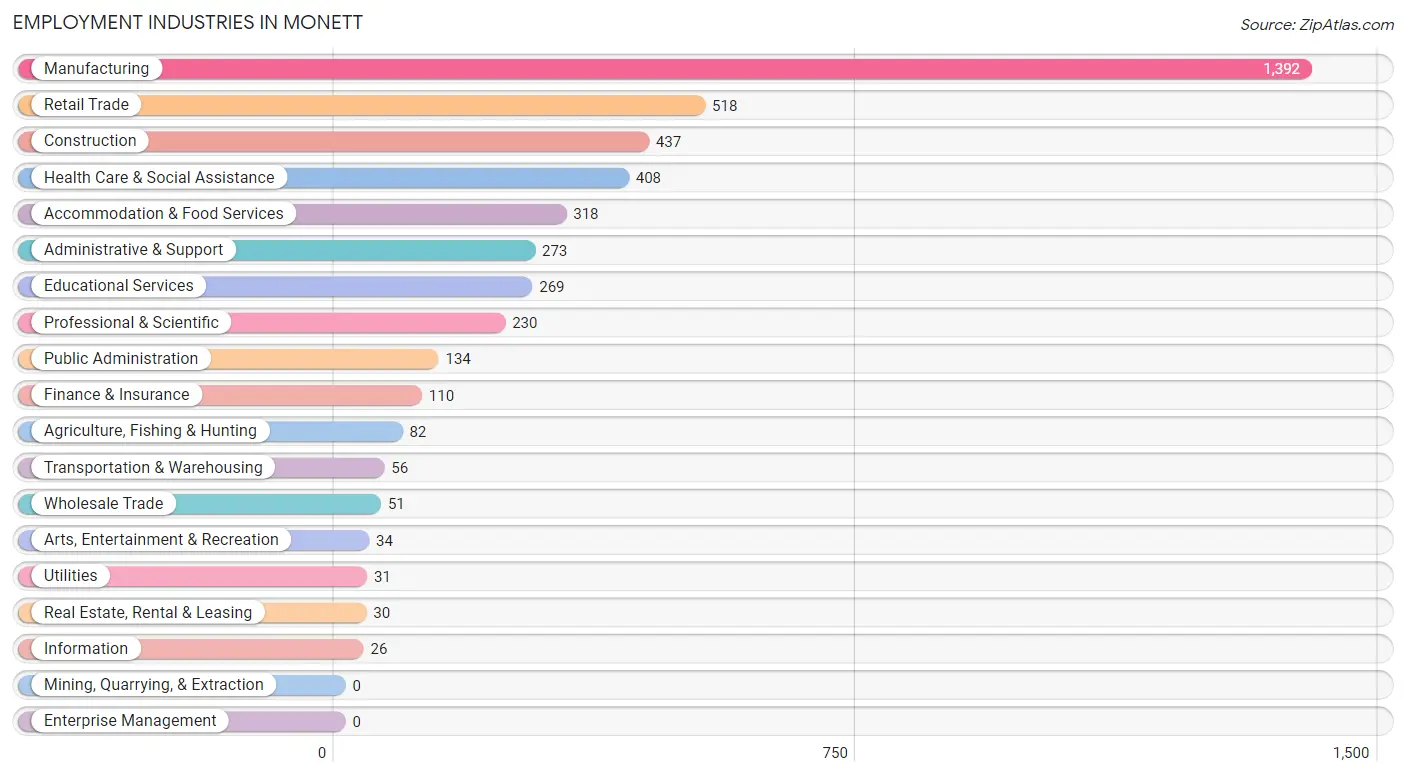
Employment Industries in Monett
The major employment industries in Monett include Manufacturing (1,392 | 30.5%), Retail Trade (518 | 11.4%), Construction (437 | 9.6%), Health Care & Social Assistance (408 | 8.9%), and Accommodation & Food Services (318 | 7.0%).
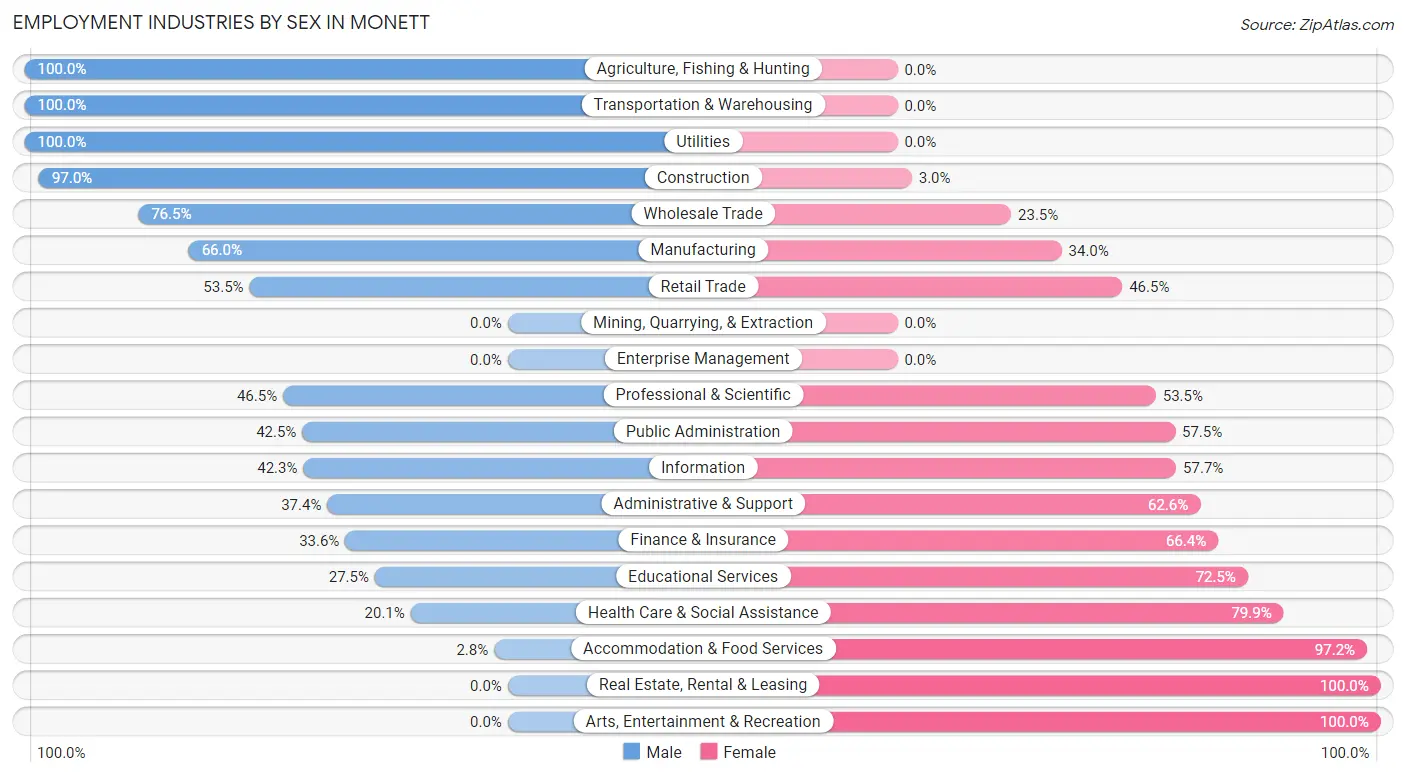
Employment Industries by Sex in Monett
The Monett industries that see more men than women are Agriculture, Fishing & Hunting (100.0%), Transportation & Warehousing (100.0%), and Utilities (100.0%), whereas the industries that tend to have a higher number of women are Real Estate, Rental & Leasing (100.0%), Arts, Entertainment & Recreation (100.0%), and Accommodation & Food Services (97.2%).
| Industry | Male | Female |
| Agriculture, Fishing & Hunting | 82 (100.0%) | 0 (0.0%) |
| Mining, Quarrying, & Extraction | 0 (0.0%) | 0 (0.0%) |
| Construction | 424 (97.0%) | 13 (3.0%) |
| Manufacturing | 919 (66.0%) | 473 (34.0%) |
| Wholesale Trade | 39 (76.5%) | 12 (23.5%) |
| Retail Trade | 277 (53.5%) | 241 (46.5%) |
| Transportation & Warehousing | 56 (100.0%) | 0 (0.0%) |
| Utilities | 31 (100.0%) | 0 (0.0%) |
| Information | 11 (42.3%) | 15 (57.7%) |
| Finance & Insurance | 37 (33.6%) | 73 (66.4%) |
| Real Estate, Rental & Leasing | 0 (0.0%) | 30 (100.0%) |
| Professional & Scientific | 107 (46.5%) | 123 (53.5%) |
| Enterprise Management | 0 (0.0%) | 0 (0.0%) |
| Administrative & Support | 102 (37.4%) | 171 (62.6%) |
| Educational Services | 74 (27.5%) | 195 (72.5%) |
| Health Care & Social Assistance | 82 (20.1%) | 326 (79.9%) |
| Arts, Entertainment & Recreation | 0 (0.0%) | 34 (100.0%) |
| Accommodation & Food Services | 9 (2.8%) | 309 (97.2%) |
| Public Administration | 57 (42.5%) | 77 (57.5%) |
| Total | 2,327 (51.0%) | 2,238 (49.0%) |
Education in Monett
School Enrollment in Monett
The most common levels of schooling among the 2,629 students in Monett are elementary school (742 | 28.2%), middle school (563 | 21.4%), and high school (532 | 20.2%).
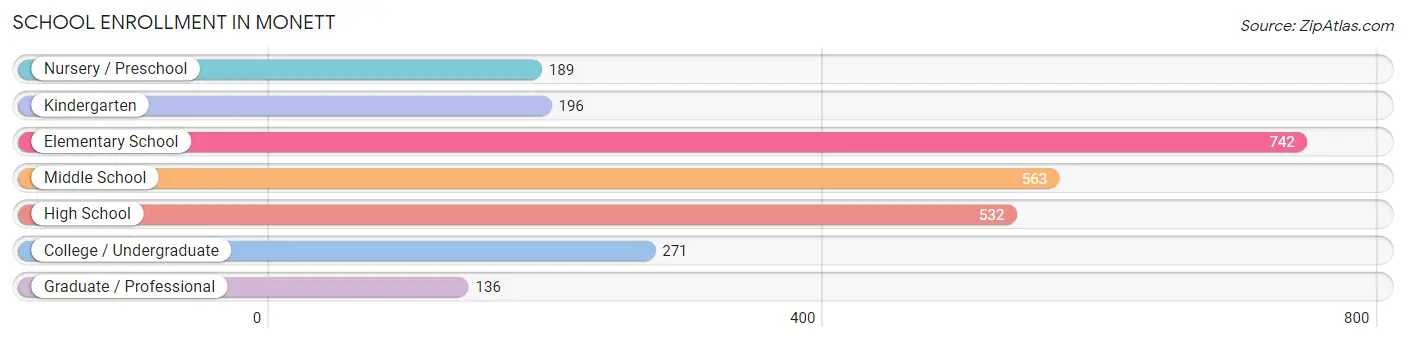
| School Level | # Students | % Students |
| Nursery / Preschool | 189 | 7.2% |
| Kindergarten | 196 | 7.5% |
| Elementary School | 742 | 28.2% |
| Middle School | 563 | 21.4% |
| High School | 532 | 20.2% |
| College / Undergraduate | 271 | 10.3% |
| Graduate / Professional | 136 | 5.2% |
| Total | 2,629 | 100.0% |
School Enrollment by Age by Funding Source in Monett
Out of a total of 2,629 students who are enrolled in schools in Monett, 273 (10.4%) attend a private institution, while the remaining 2,356 (89.6%) are enrolled in public schools. The age group of 35 years and over has the highest likelihood of being enrolled in private schools, with 60 (31.9% in the age bracket) enrolled. Conversely, the age group of 3 to 4 year olds has the lowest likelihood of being enrolled in a private school, with 118 (100.0% in the age bracket) attending a public institution.
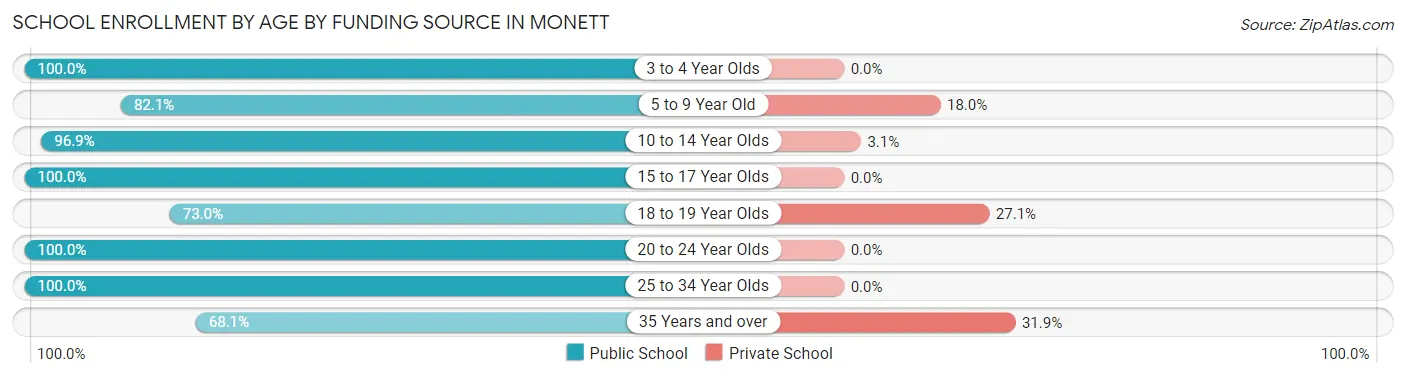
| Age Bracket | Public School | Private School |
| 3 to 4 Year Olds | 118 (100.0%) | 0 (0.0%) |
| 5 to 9 Year Old | 713 (82.1%) | 156 (17.9%) |
| 10 to 14 Year Olds | 774 (96.9%) | 25 (3.1%) |
| 15 to 17 Year Olds | 401 (100.0%) | 0 (0.0%) |
| 18 to 19 Year Olds | 89 (73.0%) | 33 (27.1%) |
| 20 to 24 Year Olds | 27 (100.0%) | 0 (0.0%) |
| 25 to 34 Year Olds | 105 (100.0%) | 0 (0.0%) |
| 35 Years and over | 128 (68.1%) | 60 (31.9%) |
| Total | 2,356 (89.6%) | 273 (10.4%) |
Educational Attainment by Field of Study in Monett
Business (228 | 25.6%), education (220 | 24.7%), arts & humanities (106 | 11.9%), social sciences (67 | 7.5%), and science & technology (58 | 6.5%) are the most common fields of study among 892 individuals in Monett who have obtained a bachelor's degree or higher.
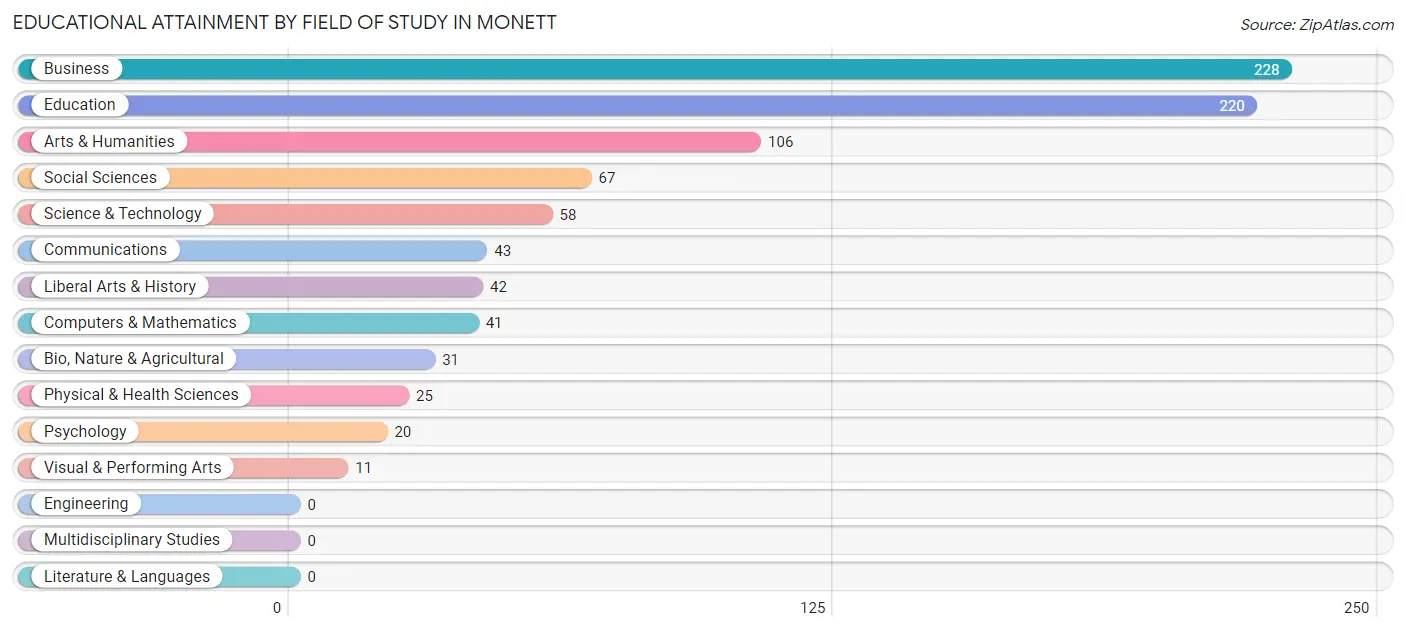
| Field of Study | # Graduates | % Graduates |
| Computers & Mathematics | 41 | 4.6% |
| Bio, Nature & Agricultural | 31 | 3.5% |
| Physical & Health Sciences | 25 | 2.8% |
| Psychology | 20 | 2.2% |
| Social Sciences | 67 | 7.5% |
| Engineering | 0 | 0.0% |
| Multidisciplinary Studies | 0 | 0.0% |
| Science & Technology | 58 | 6.5% |
| Business | 228 | 25.6% |
| Education | 220 | 24.7% |
| Literature & Languages | 0 | 0.0% |
| Liberal Arts & History | 42 | 4.7% |
| Visual & Performing Arts | 11 | 1.2% |
| Communications | 43 | 4.8% |
| Arts & Humanities | 106 | 11.9% |
| Total | 892 | 100.0% |
Transportation & Commute in Monett
Vehicle Availability by Sex in Monett
The most prevalent vehicle ownership categories in Monett are males with 2 vehicles (974, accounting for 41.2%) and females with 2 vehicles (966, making up 44.2%).
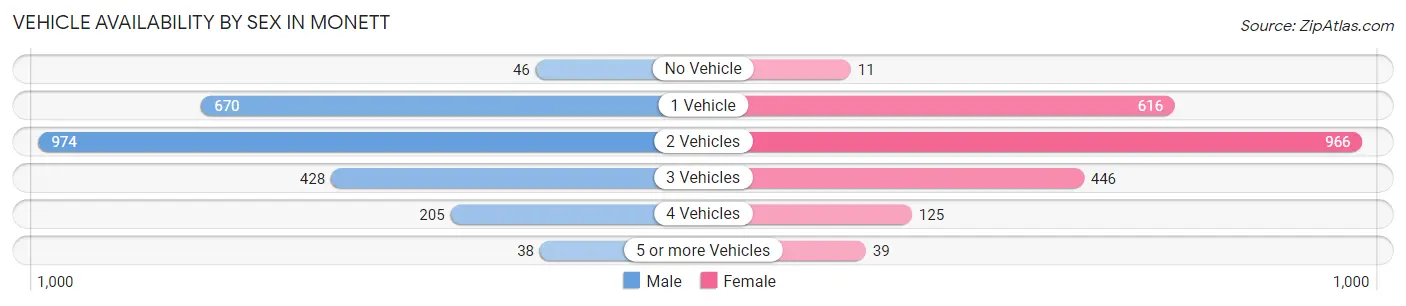
| Vehicles Available | Male | Female |
| No Vehicle | 46 (1.9%) | 11 (0.5%) |
| 1 Vehicle | 670 (28.4%) | 616 (28.0%) |
| 2 Vehicles | 974 (41.2%) | 966 (43.9%) |
| 3 Vehicles | 428 (18.1%) | 446 (20.3%) |
| 4 Vehicles | 205 (8.7%) | 125 (5.7%) |
| 5 or more Vehicles | 38 (1.6%) | 39 (1.8%) |
| Total | 2,361 (100.0%) | 2,203 (100.0%) |
Commute Time in Monett
The most frequently occuring commute durations in Monett are 5 to 9 minutes (1,474 commuters, 34.2%), 10 to 14 minutes (777 commuters, 18.0%), and less than 5 minutes (410 commuters, 9.5%).
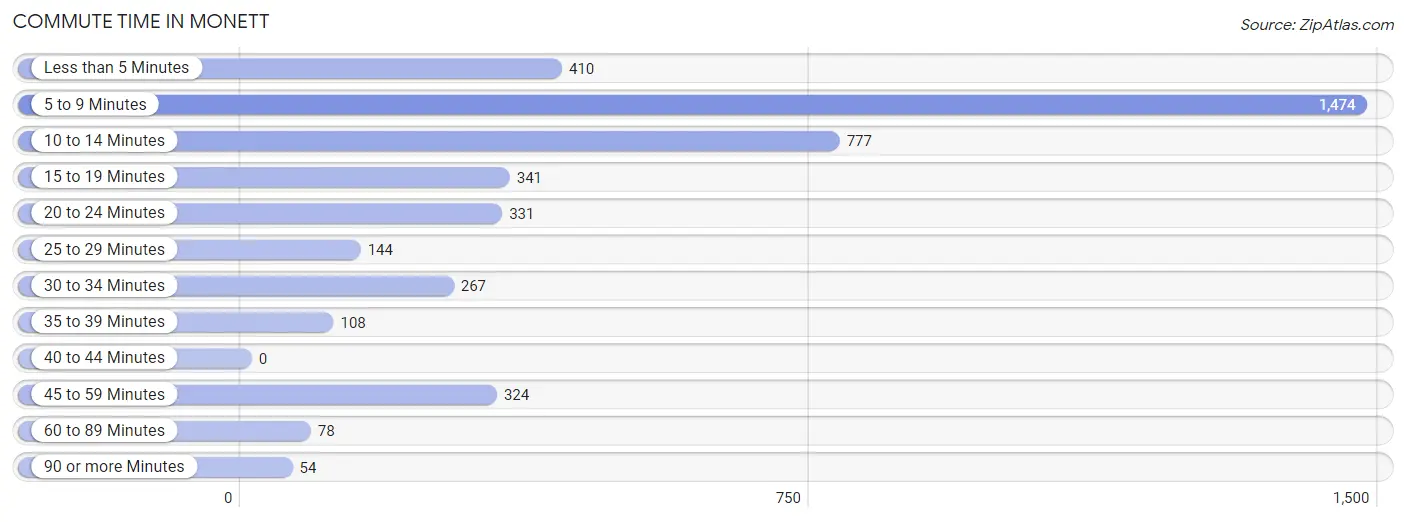
| Commute Time | # Commuters | % Commuters |
| Less than 5 Minutes | 410 | 9.5% |
| 5 to 9 Minutes | 1,474 | 34.2% |
| 10 to 14 Minutes | 777 | 18.0% |
| 15 to 19 Minutes | 341 | 7.9% |
| 20 to 24 Minutes | 331 | 7.7% |
| 25 to 29 Minutes | 144 | 3.3% |
| 30 to 34 Minutes | 267 | 6.2% |
| 35 to 39 Minutes | 108 | 2.5% |
| 40 to 44 Minutes | 0 | 0.0% |
| 45 to 59 Minutes | 324 | 7.5% |
| 60 to 89 Minutes | 78 | 1.8% |
| 90 or more Minutes | 54 | 1.3% |
Commute Time by Sex in Monett
The most common commute times in Monett are 5 to 9 minutes (775 commuters, 35.0%) for males and 5 to 9 minutes (699 commuters, 33.4%) for females.
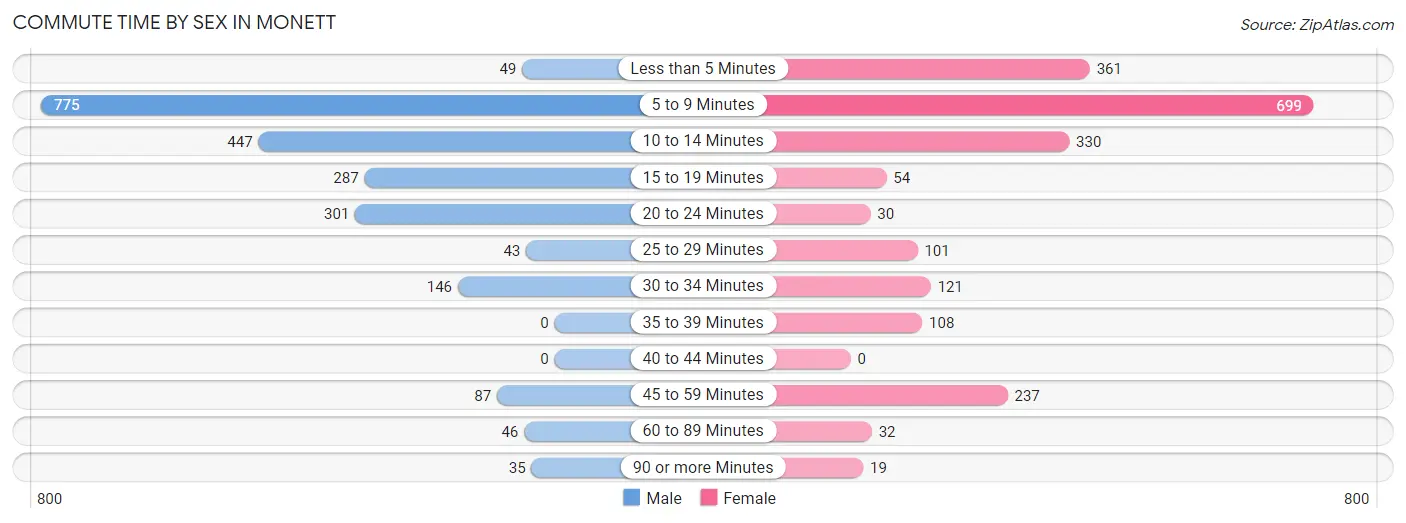
| Commute Time | Male | Female |
| Less than 5 Minutes | 49 (2.2%) | 361 (17.3%) |
| 5 to 9 Minutes | 775 (35.0%) | 699 (33.4%) |
| 10 to 14 Minutes | 447 (20.2%) | 330 (15.8%) |
| 15 to 19 Minutes | 287 (13.0%) | 54 (2.6%) |
| 20 to 24 Minutes | 301 (13.6%) | 30 (1.4%) |
| 25 to 29 Minutes | 43 (1.9%) | 101 (4.8%) |
| 30 to 34 Minutes | 146 (6.6%) | 121 (5.8%) |
| 35 to 39 Minutes | 0 (0.0%) | 108 (5.2%) |
| 40 to 44 Minutes | 0 (0.0%) | 0 (0.0%) |
| 45 to 59 Minutes | 87 (3.9%) | 237 (11.3%) |
| 60 to 89 Minutes | 46 (2.1%) | 32 (1.5%) |
| 90 or more Minutes | 35 (1.6%) | 19 (0.9%) |
Time of Departure to Work by Sex in Monett
The most frequent times of departure to work in Monett are 12:00 AM to 4:59 AM (443, 20.0%) for males and 8:00 AM to 8:29 AM (295, 14.1%) for females.
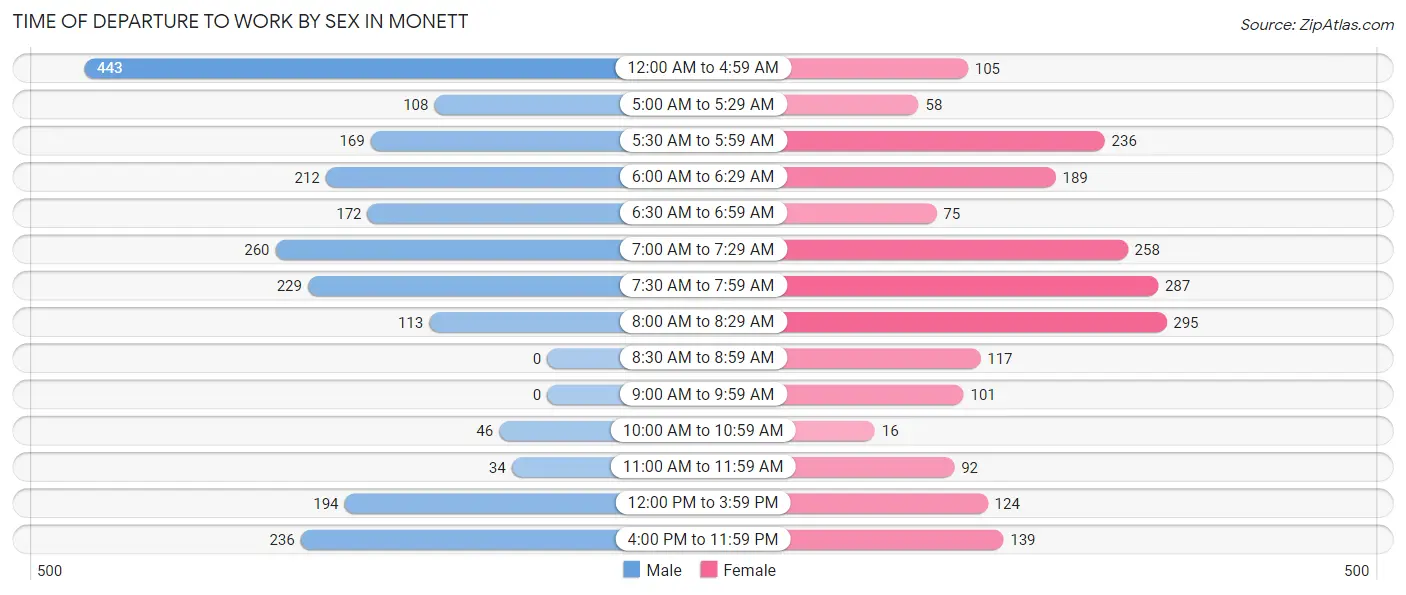
| Time of Departure | Male | Female |
| 12:00 AM to 4:59 AM | 443 (20.0%) | 105 (5.0%) |
| 5:00 AM to 5:29 AM | 108 (4.9%) | 58 (2.8%) |
| 5:30 AM to 5:59 AM | 169 (7.6%) | 236 (11.3%) |
| 6:00 AM to 6:29 AM | 212 (9.6%) | 189 (9.0%) |
| 6:30 AM to 6:59 AM | 172 (7.8%) | 75 (3.6%) |
| 7:00 AM to 7:29 AM | 260 (11.7%) | 258 (12.3%) |
| 7:30 AM to 7:59 AM | 229 (10.3%) | 287 (13.7%) |
| 8:00 AM to 8:29 AM | 113 (5.1%) | 295 (14.1%) |
| 8:30 AM to 8:59 AM | 0 (0.0%) | 117 (5.6%) |
| 9:00 AM to 9:59 AM | 0 (0.0%) | 101 (4.8%) |
| 10:00 AM to 10:59 AM | 46 (2.1%) | 16 (0.8%) |
| 11:00 AM to 11:59 AM | 34 (1.5%) | 92 (4.4%) |
| 12:00 PM to 3:59 PM | 194 (8.7%) | 124 (5.9%) |
| 4:00 PM to 11:59 PM | 236 (10.6%) | 139 (6.6%) |
| Total | 2,216 (100.0%) | 2,092 (100.0%) |
Housing Occupancy in Monett
Occupancy by Ownership in Monett
Of the total 3,702 dwellings in Monett, owner-occupied units account for 1,901 (51.3%), while renter-occupied units make up 1,801 (48.6%).
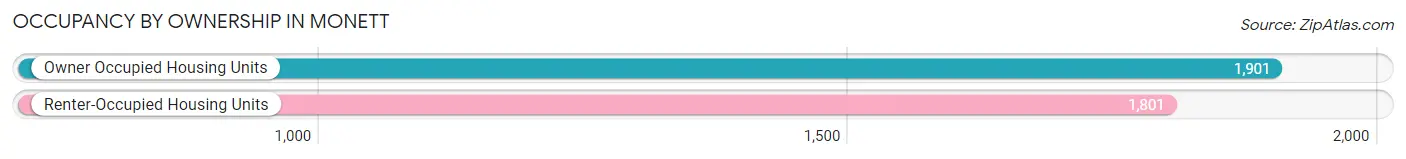
| Occupancy | # Housing Units | % Housing Units |
| Owner Occupied Housing Units | 1,901 | 51.3% |
| Renter-Occupied Housing Units | 1,801 | 48.6% |
| Total Occupied Housing Units | 3,702 | 100.0% |
Occupancy by Household Size in Monett
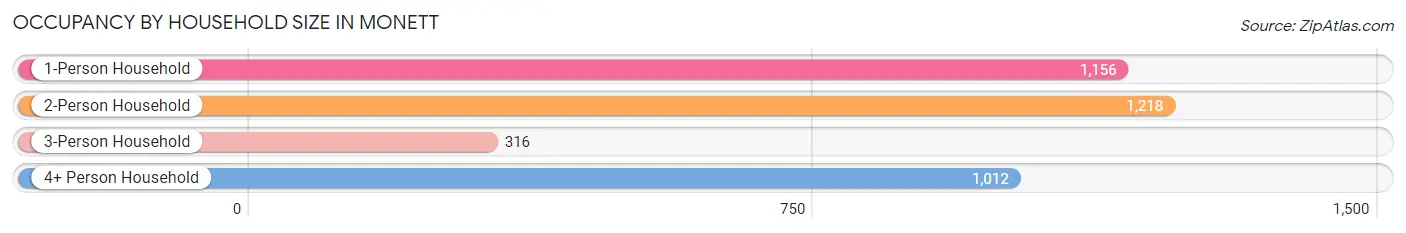
| Household Size | # Housing Units | % Housing Units |
| 1-Person Household | 1,156 | 31.2% |
| 2-Person Household | 1,218 | 32.9% |
| 3-Person Household | 316 | 8.5% |
| 4+ Person Household | 1,012 | 27.3% |
| Total Housing Units | 3,702 | 100.0% |
Occupancy by Ownership by Household Size in Monett
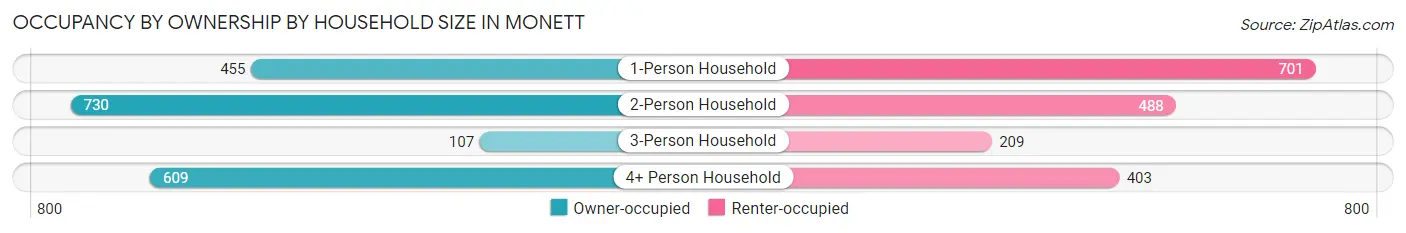
| Household Size | Owner-occupied | Renter-occupied |
| 1-Person Household | 455 (39.4%) | 701 (60.6%) |
| 2-Person Household | 730 (59.9%) | 488 (40.1%) |
| 3-Person Household | 107 (33.9%) | 209 (66.1%) |
| 4+ Person Household | 609 (60.2%) | 403 (39.8%) |
| Total Housing Units | 1,901 (51.3%) | 1,801 (48.6%) |
Occupancy by Educational Attainment in Monett
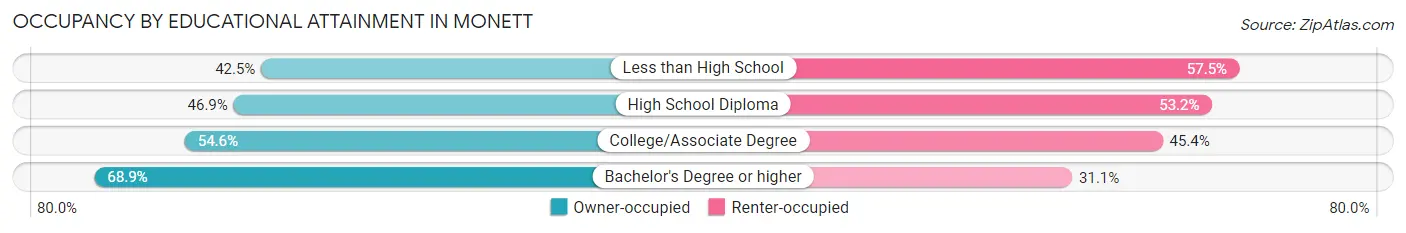
| Household Size | Owner-occupied | Renter-occupied |
| Less than High School | 268 (42.5%) | 363 (57.5%) |
| High School Diploma | 648 (46.9%) | 735 (53.1%) |
| College/Associate Degree | 679 (54.6%) | 565 (45.4%) |
| Bachelor's Degree or higher | 306 (68.9%) | 138 (31.1%) |
Occupancy by Age of Householder in Monett
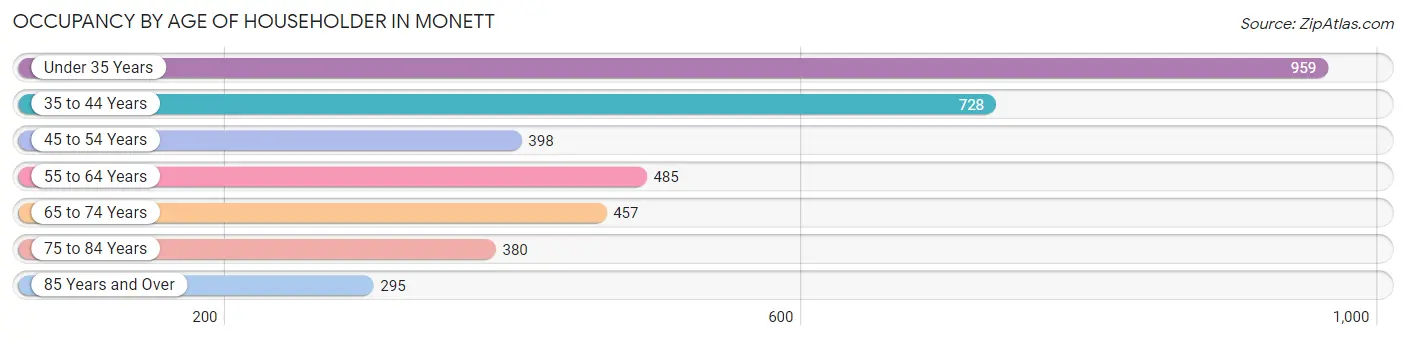
| Age Bracket | # Households | % Households |
| Under 35 Years | 959 | 25.9% |
| 35 to 44 Years | 728 | 19.7% |
| 45 to 54 Years | 398 | 10.7% |
| 55 to 64 Years | 485 | 13.1% |
| 65 to 74 Years | 457 | 12.3% |
| 75 to 84 Years | 380 | 10.3% |
| 85 Years and Over | 295 | 8.0% |
| Total | 3,702 | 100.0% |
Housing Finances in Monett
Median Income by Occupancy in Monett
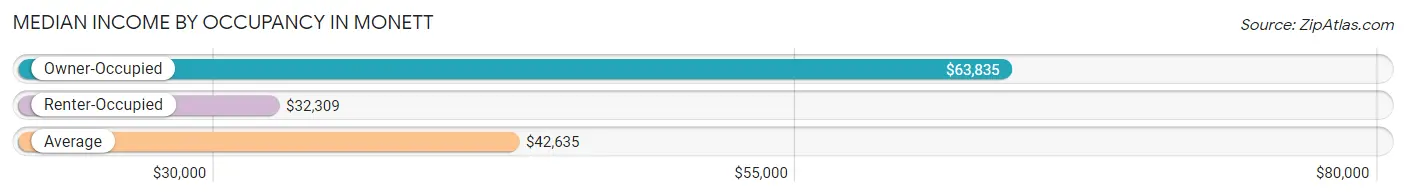
| Occupancy Type | # Households | Median Income |
| Owner-Occupied | 1,901 (51.3%) | $63,835 |
| Renter-Occupied | 1,801 (48.6%) | $32,309 |
| Average | 3,702 (100.0%) | $42,635 |
Occupancy by Householder Income Bracket in Monett
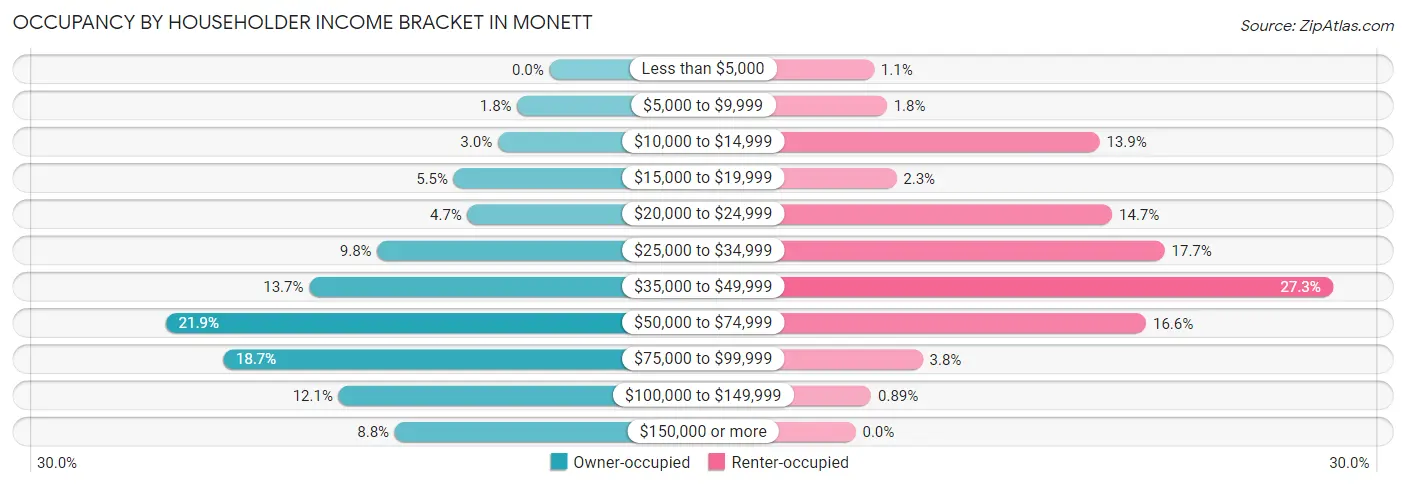
| Income Bracket | Owner-occupied | Renter-occupied |
| Less than $5,000 | 0 (0.0%) | 19 (1.1%) |
| $5,000 to $9,999 | 35 (1.8%) | 32 (1.8%) |
| $10,000 to $14,999 | 56 (2.9%) | 251 (13.9%) |
| $15,000 to $19,999 | 104 (5.5%) | 42 (2.3%) |
| $20,000 to $24,999 | 89 (4.7%) | 264 (14.7%) |
| $25,000 to $34,999 | 187 (9.8%) | 318 (17.7%) |
| $35,000 to $49,999 | 261 (13.7%) | 491 (27.3%) |
| $50,000 to $74,999 | 417 (21.9%) | 299 (16.6%) |
| $75,000 to $99,999 | 355 (18.7%) | 69 (3.8%) |
| $100,000 to $149,999 | 229 (12.0%) | 16 (0.9%) |
| $150,000 or more | 168 (8.8%) | 0 (0.0%) |
| Total | 1,901 (100.0%) | 1,801 (100.0%) |
Monthly Housing Cost Tiers in Monett
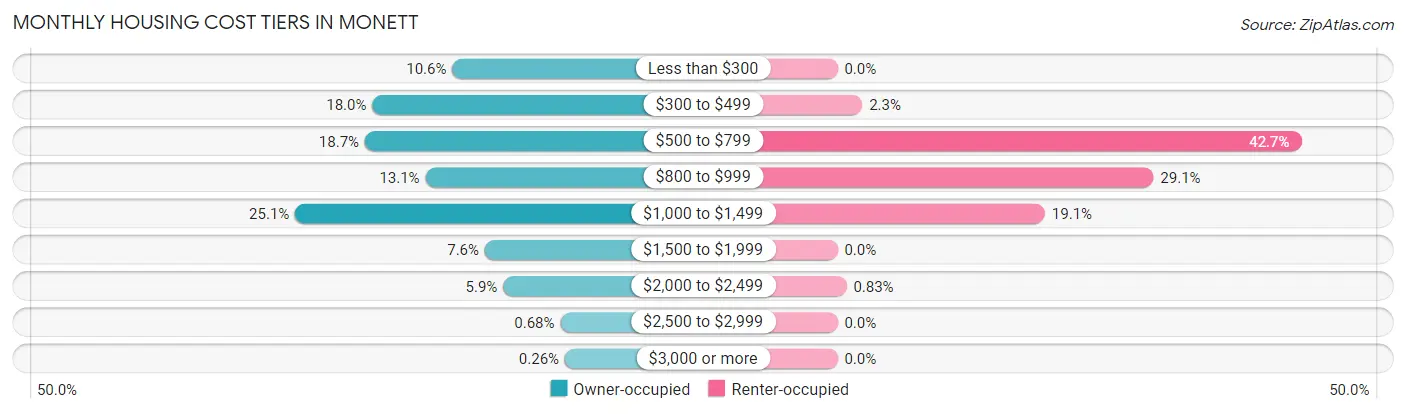
| Monthly Cost | Owner-occupied | Renter-occupied |
| Less than $300 | 202 (10.6%) | 0 (0.0%) |
| $300 to $499 | 342 (18.0%) | 41 (2.3%) |
| $500 to $799 | 355 (18.7%) | 769 (42.7%) |
| $800 to $999 | 249 (13.1%) | 524 (29.1%) |
| $1,000 to $1,499 | 477 (25.1%) | 344 (19.1%) |
| $1,500 to $1,999 | 145 (7.6%) | 0 (0.0%) |
| $2,000 to $2,499 | 113 (5.9%) | 15 (0.8%) |
| $2,500 to $2,999 | 13 (0.7%) | 0 (0.0%) |
| $3,000 or more | 5 (0.3%) | 0 (0.0%) |
| Total | 1,901 (100.0%) | 1,801 (100.0%) |
Physical Housing Characteristics in Monett
Housing Structures in Monett
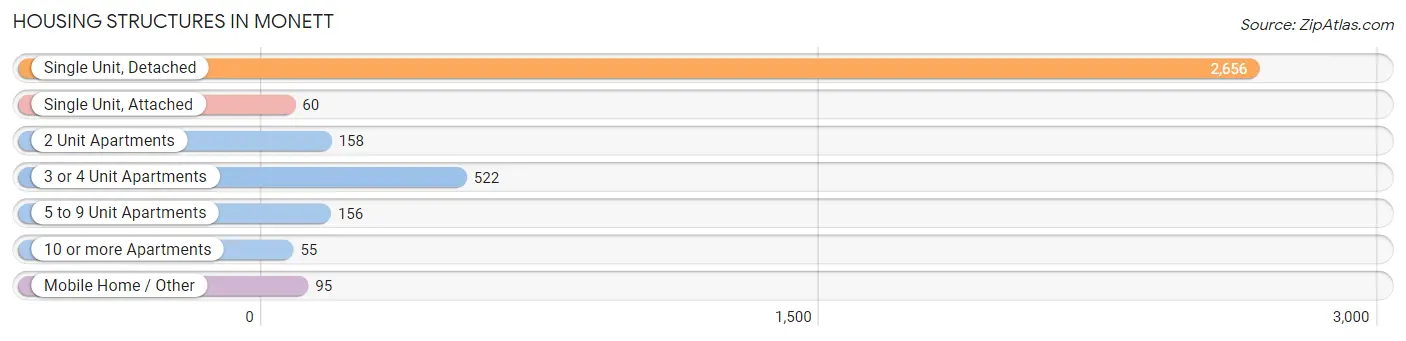
| Structure Type | # Housing Units | % Housing Units |
| Single Unit, Detached | 2,656 | 71.8% |
| Single Unit, Attached | 60 | 1.6% |
| 2 Unit Apartments | 158 | 4.3% |
| 3 or 4 Unit Apartments | 522 | 14.1% |
| 5 to 9 Unit Apartments | 156 | 4.2% |
| 10 or more Apartments | 55 | 1.5% |
| Mobile Home / Other | 95 | 2.6% |
| Total | 3,702 | 100.0% |
Housing Structures by Occupancy in Monett
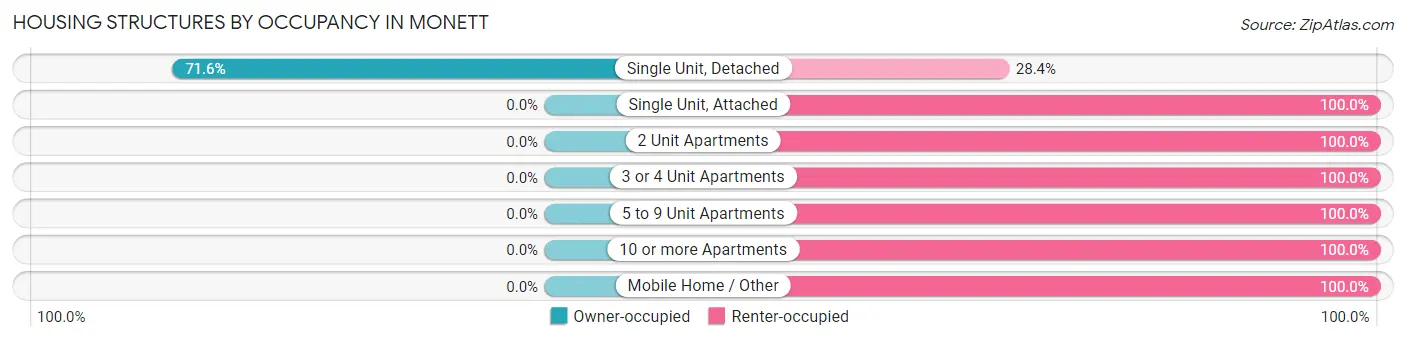
| Structure Type | Owner-occupied | Renter-occupied |
| Single Unit, Detached | 1,901 (71.6%) | 755 (28.4%) |
| Single Unit, Attached | 0 (0.0%) | 60 (100.0%) |
| 2 Unit Apartments | 0 (0.0%) | 158 (100.0%) |
| 3 or 4 Unit Apartments | 0 (0.0%) | 522 (100.0%) |
| 5 to 9 Unit Apartments | 0 (0.0%) | 156 (100.0%) |
| 10 or more Apartments | 0 (0.0%) | 55 (100.0%) |
| Mobile Home / Other | 0 (0.0%) | 95 (100.0%) |
| Total | 1,901 (51.3%) | 1,801 (48.6%) |
Housing Structures by Number of Rooms in Monett
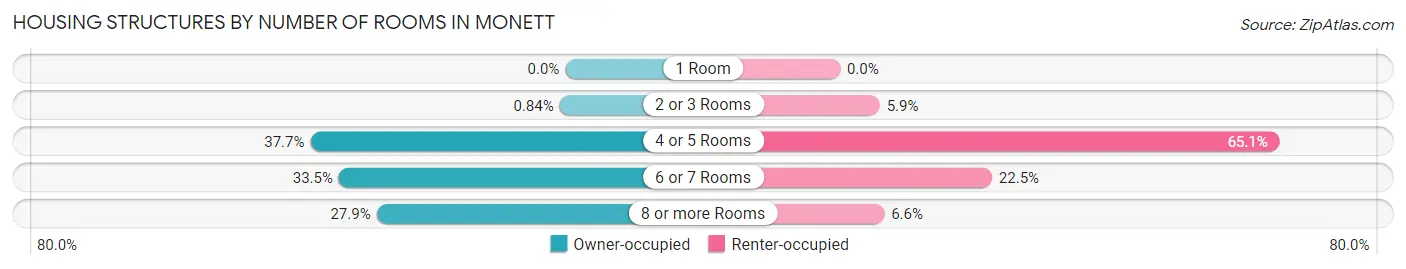
| Number of Rooms | Owner-occupied | Renter-occupied |
| 1 Room | 0 (0.0%) | 0 (0.0%) |
| 2 or 3 Rooms | 16 (0.8%) | 106 (5.9%) |
| 4 or 5 Rooms | 717 (37.7%) | 1,172 (65.1%) |
| 6 or 7 Rooms | 637 (33.5%) | 405 (22.5%) |
| 8 or more Rooms | 531 (27.9%) | 118 (6.6%) |
| Total | 1,901 (100.0%) | 1,801 (100.0%) |
Housing Structure by Heating Type in Monett
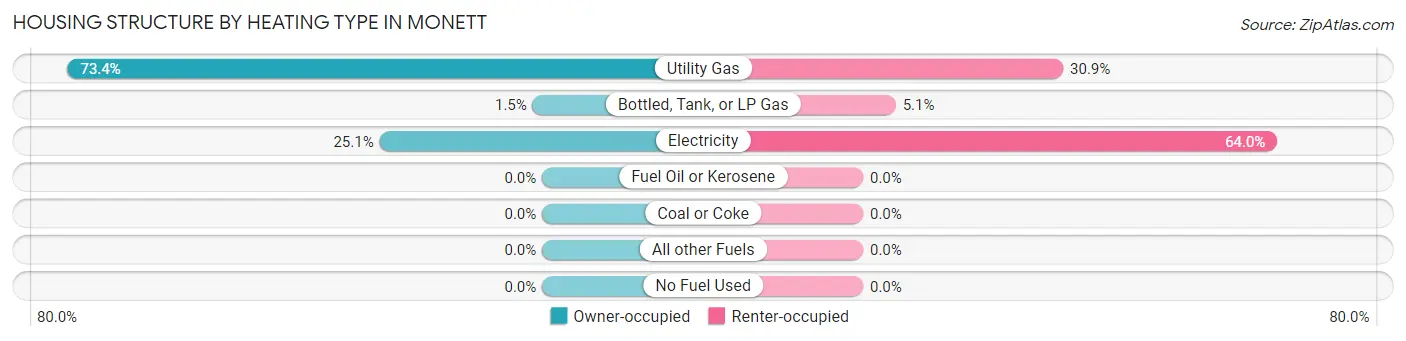
| Heating Type | Owner-occupied | Renter-occupied |
| Utility Gas | 1,395 (73.4%) | 557 (30.9%) |
| Bottled, Tank, or LP Gas | 28 (1.5%) | 91 (5.1%) |
| Electricity | 478 (25.1%) | 1,153 (64.0%) |
| Fuel Oil or Kerosene | 0 (0.0%) | 0 (0.0%) |
| Coal or Coke | 0 (0.0%) | 0 (0.0%) |
| All other Fuels | 0 (0.0%) | 0 (0.0%) |
| No Fuel Used | 0 (0.0%) | 0 (0.0%) |
| Total | 1,901 (100.0%) | 1,801 (100.0%) |
Household Vehicle Usage in Monett
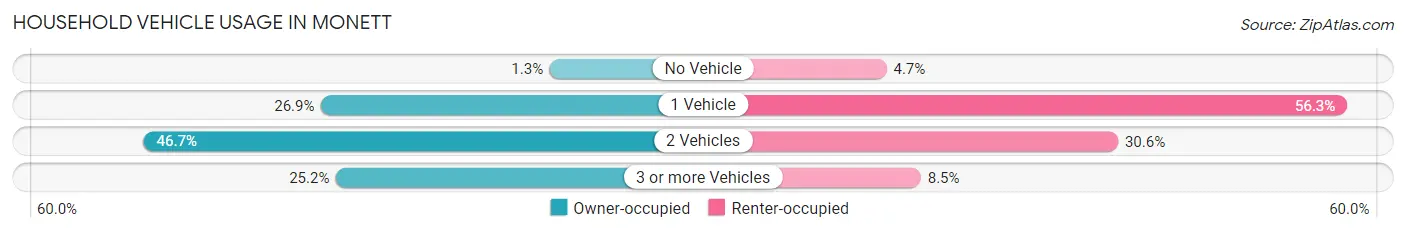
| Vehicles per Household | Owner-occupied | Renter-occupied |
| No Vehicle | 24 (1.3%) | 84 (4.7%) |
| 1 Vehicle | 511 (26.9%) | 1,013 (56.2%) |
| 2 Vehicles | 887 (46.7%) | 551 (30.6%) |
| 3 or more Vehicles | 479 (25.2%) | 153 (8.5%) |
| Total | 1,901 (100.0%) | 1,801 (100.0%) |
Real Estate & Mortgages in Monett
Real Estate and Mortgage Overview in Monett
| Characteristic | Without Mortgage | With Mortgage |
| Housing Units | 712 | 1,189 |
| Median Property Value | $122,700 | $135,500 |
| Median Household Income | $49,079 | $97 |
| Monthly Housing Costs | $411 | $5 |
| Real Estate Taxes | $854 | $78 |
Property Value by Mortgage Status in Monett
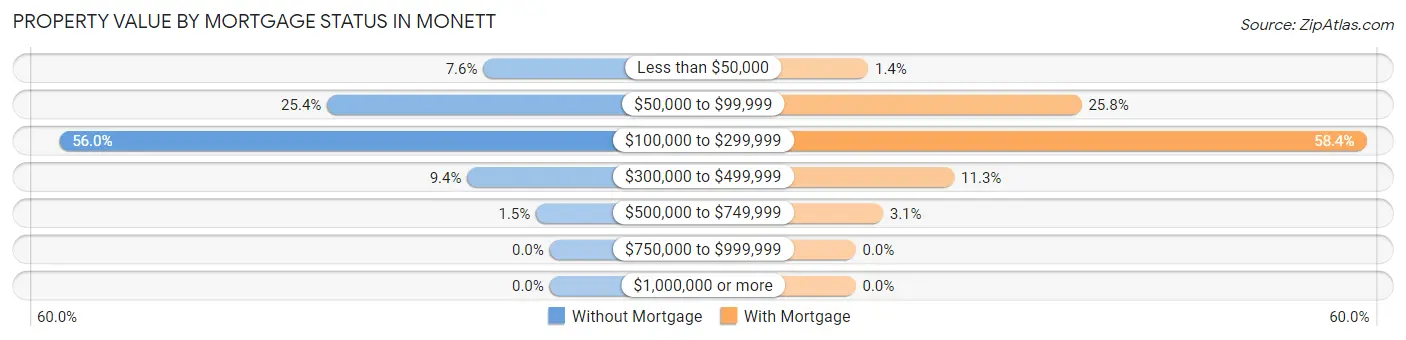
| Property Value | Without Mortgage | With Mortgage |
| Less than $50,000 | 54 (7.6%) | 17 (1.4%) |
| $50,000 to $99,999 | 181 (25.4%) | 307 (25.8%) |
| $100,000 to $299,999 | 399 (56.0%) | 694 (58.4%) |
| $300,000 to $499,999 | 67 (9.4%) | 134 (11.3%) |
| $500,000 to $749,999 | 11 (1.5%) | 37 (3.1%) |
| $750,000 to $999,999 | 0 (0.0%) | 0 (0.0%) |
| $1,000,000 or more | 0 (0.0%) | 0 (0.0%) |
| Total | 712 (100.0%) | 1,189 (100.0%) |
Household Income by Mortgage Status in Monett
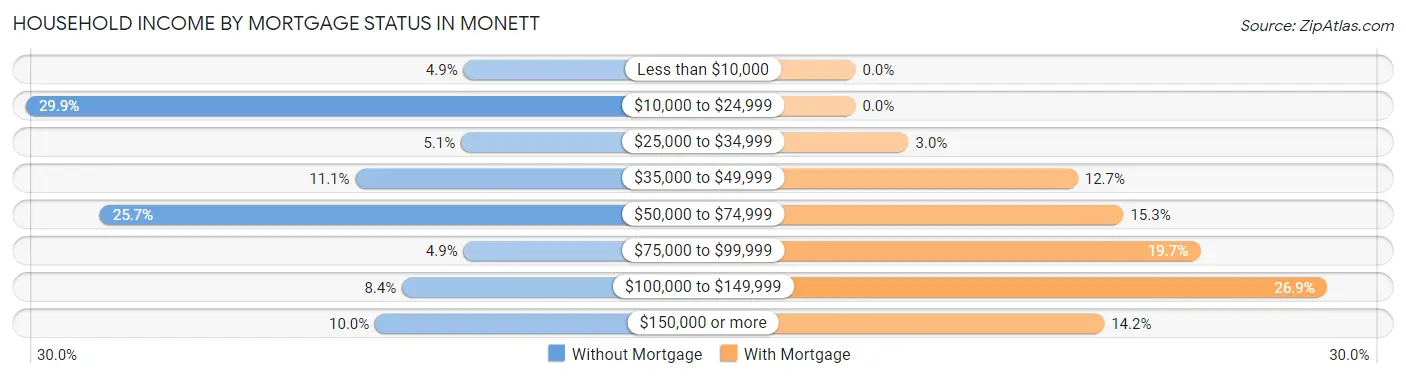
| Household Income | Without Mortgage | With Mortgage |
| Less than $10,000 | 35 (4.9%) | 0 (0.0%) |
| $10,000 to $24,999 | 213 (29.9%) | 0 (0.0%) |
| $25,000 to $34,999 | 36 (5.1%) | 36 (3.0%) |
| $35,000 to $49,999 | 79 (11.1%) | 151 (12.7%) |
| $50,000 to $74,999 | 183 (25.7%) | 182 (15.3%) |
| $75,000 to $99,999 | 35 (4.9%) | 234 (19.7%) |
| $100,000 to $149,999 | 60 (8.4%) | 320 (26.9%) |
| $150,000 or more | 71 (10.0%) | 169 (14.2%) |
| Total | 712 (100.0%) | 1,189 (100.0%) |
Property Value to Household Income Ratio in Monett
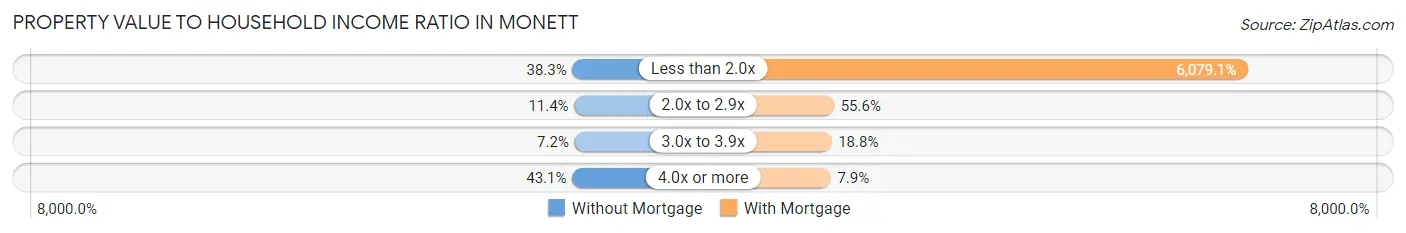
| Value-to-Income Ratio | Without Mortgage | With Mortgage |
| Less than 2.0x | 273 (38.3%) | 72,281 (6,079.1%) |
| 2.0x to 2.9x | 81 (11.4%) | 661 (55.6%) |
| 3.0x to 3.9x | 51 (7.2%) | 223 (18.8%) |
| 4.0x or more | 307 (43.1%) | 94 (7.9%) |
| Total | 712 (100.0%) | 1,189 (100.0%) |
Real Estate Taxes by Mortgage Status in Monett
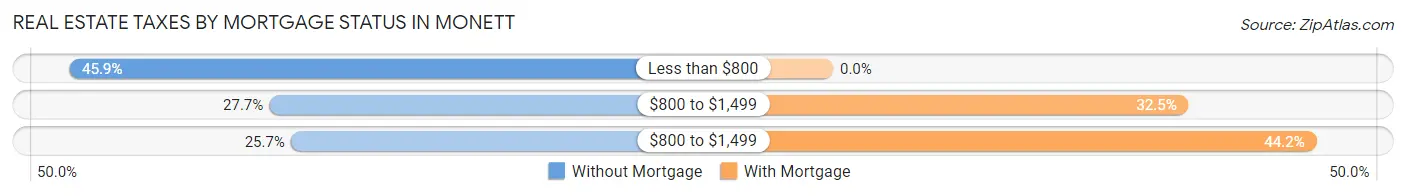
| Property Taxes | Without Mortgage | With Mortgage |
| Less than $800 | 327 (45.9%) | 0 (0.0%) |
| $800 to $1,499 | 197 (27.7%) | 386 (32.5%) |
| $800 to $1,499 | 183 (25.7%) | 525 (44.2%) |
| Total | 712 (100.0%) | 1,189 (100.0%) |
Health & Disability in Monett
Health Insurance Coverage by Age in Monett
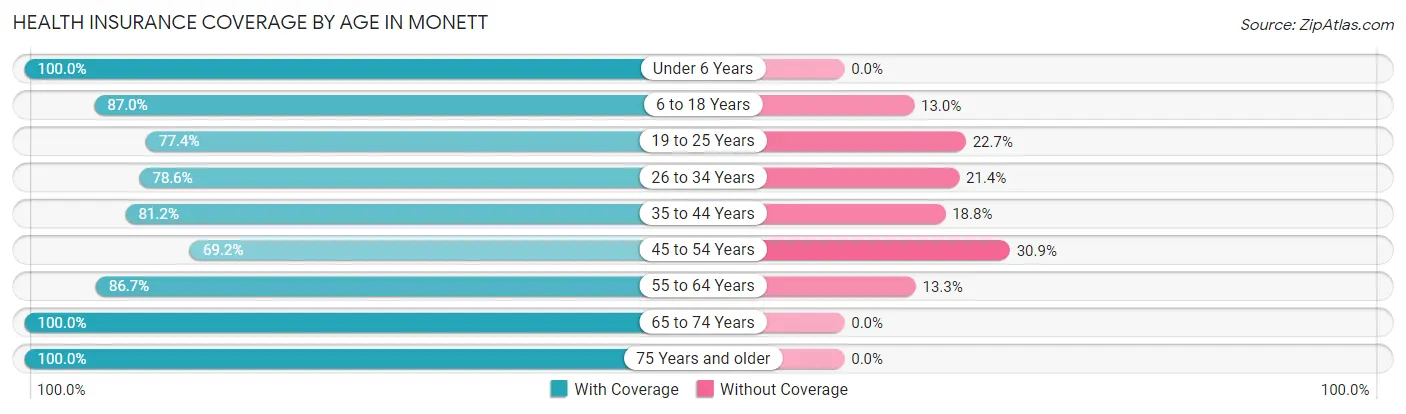
| Age Bracket | With Coverage | Without Coverage |
| Under 6 Years | 623 (100.0%) | 0 (0.0%) |
| 6 to 18 Years | 1,846 (87.0%) | 276 (13.0%) |
| 19 to 25 Years | 700 (77.3%) | 205 (22.7%) |
| 26 to 34 Years | 947 (78.6%) | 258 (21.4%) |
| 35 to 44 Years | 1,100 (81.2%) | 255 (18.8%) |
| 45 to 54 Years | 473 (69.2%) | 211 (30.8%) |
| 55 to 64 Years | 796 (86.7%) | 122 (13.3%) |
| 65 to 74 Years | 786 (100.0%) | 0 (0.0%) |
| 75 Years and older | 915 (100.0%) | 0 (0.0%) |
| Total | 8,186 (86.1%) | 1,327 (14.0%) |
Health Insurance Coverage by Citizenship Status in Monett
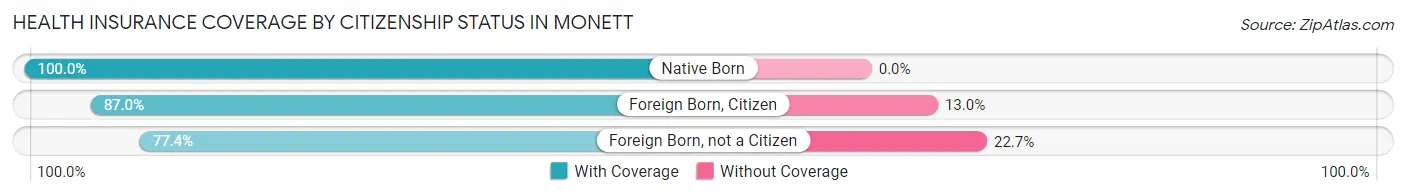
| Citizenship Status | With Coverage | Without Coverage |
| Native Born | 623 (100.0%) | 0 (0.0%) |
| Foreign Born, Citizen | 1,846 (87.0%) | 276 (13.0%) |
| Foreign Born, not a Citizen | 700 (77.3%) | 205 (22.7%) |
Health Insurance Coverage by Household Income in Monett
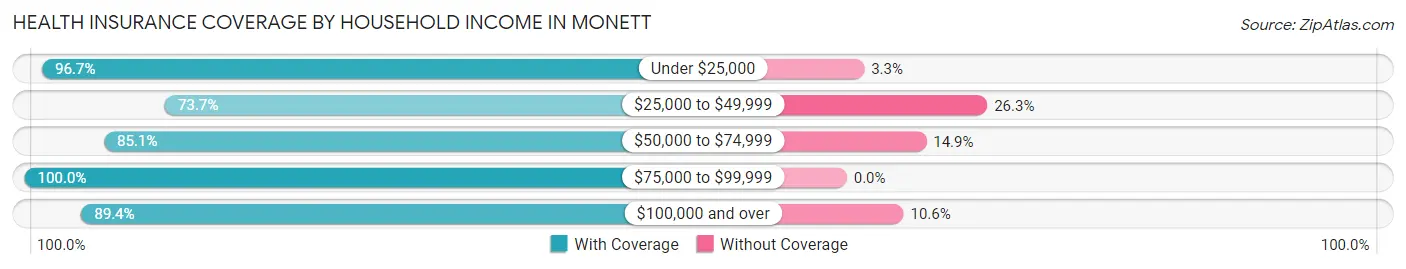
| Household Income | With Coverage | Without Coverage |
| Under $25,000 | 1,450 (96.7%) | 49 (3.3%) |
| $25,000 to $49,999 | 2,252 (73.7%) | 804 (26.3%) |
| $50,000 to $74,999 | 1,720 (85.1%) | 301 (14.9%) |
| $75,000 to $99,999 | 1,294 (100.0%) | 0 (0.0%) |
| $100,000 and over | 1,453 (89.4%) | 173 (10.6%) |
Public vs Private Health Insurance Coverage by Age in Monett
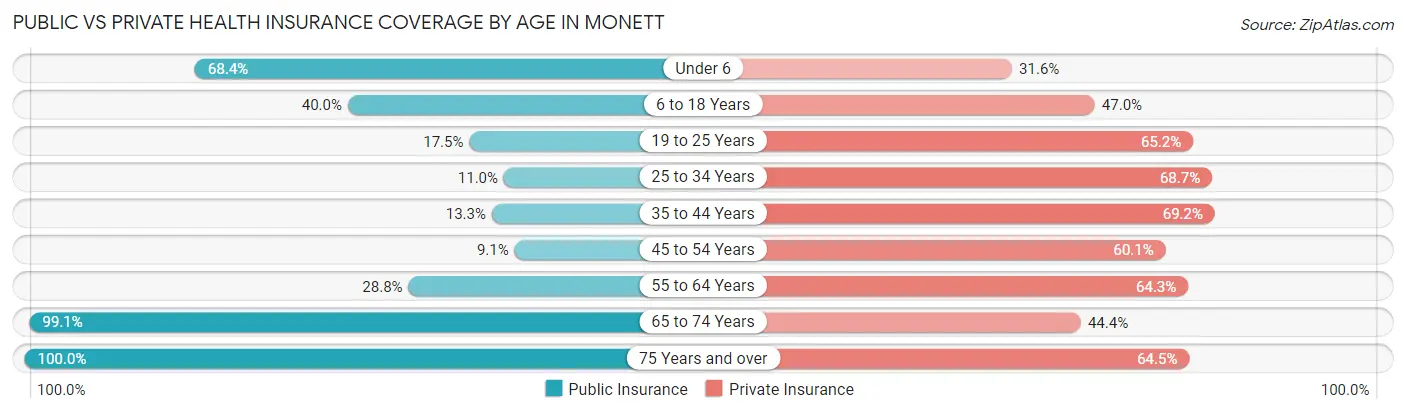
| Age Bracket | Public Insurance | Private Insurance |
| Under 6 | 426 (68.4%) | 197 (31.6%) |
| 6 to 18 Years | 849 (40.0%) | 997 (47.0%) |
| 19 to 25 Years | 158 (17.5%) | 590 (65.2%) |
| 25 to 34 Years | 133 (11.0%) | 828 (68.7%) |
| 35 to 44 Years | 180 (13.3%) | 938 (69.2%) |
| 45 to 54 Years | 62 (9.1%) | 411 (60.1%) |
| 55 to 64 Years | 264 (28.8%) | 590 (64.3%) |
| 65 to 74 Years | 779 (99.1%) | 349 (44.4%) |
| 75 Years and over | 915 (100.0%) | 590 (64.5%) |
| Total | 3,766 (39.6%) | 5,490 (57.7%) |
Disability Status by Sex by Age in Monett
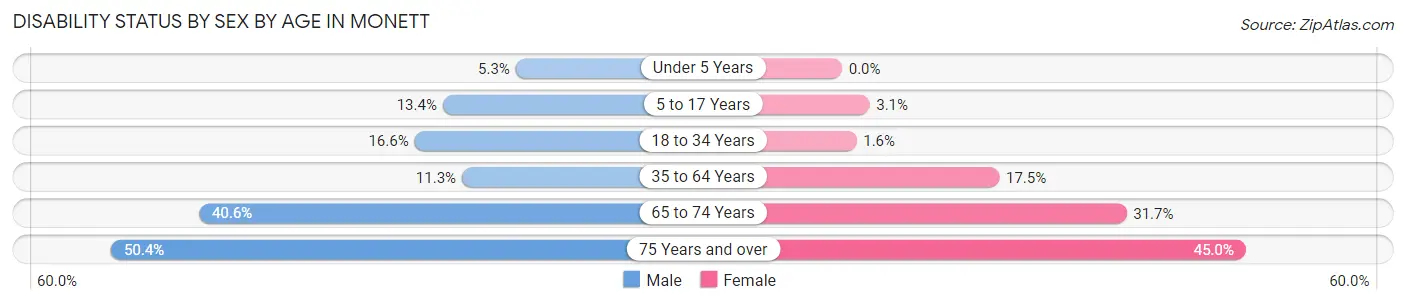
| Age Bracket | Male | Female |
| Under 5 Years | 13 (5.3%) | 0 (0.0%) |
| 5 to 17 Years | 153 (13.4%) | 32 (3.1%) |
| 18 to 34 Years | 182 (16.6%) | 17 (1.6%) |
| 35 to 64 Years | 178 (11.3%) | 242 (17.5%) |
| 65 to 74 Years | 196 (40.6%) | 96 (31.7%) |
| 75 Years and over | 134 (50.4%) | 292 (45.0%) |
Disability Class by Sex by Age in Monett
Disability Class: Hearing Difficulty
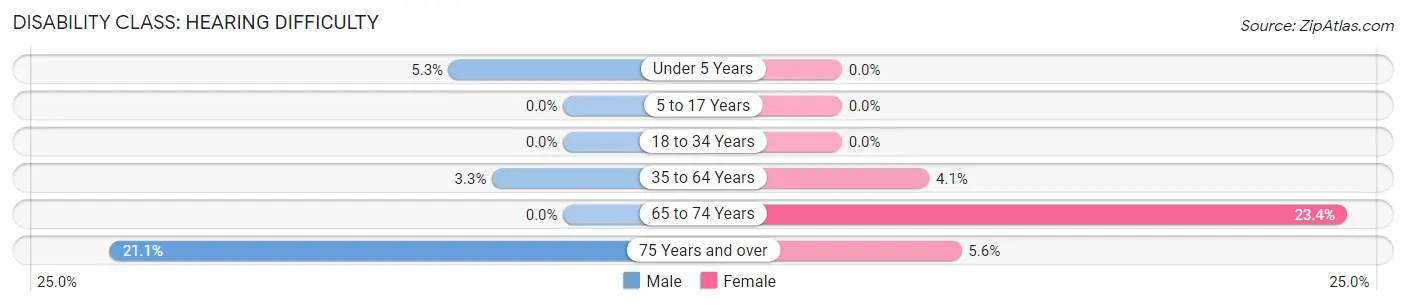
| Age Bracket | Male | Female |
| Under 5 Years | 13 (5.3%) | 0 (0.0%) |
| 5 to 17 Years | 0 (0.0%) | 0 (0.0%) |
| 18 to 34 Years | 0 (0.0%) | 0 (0.0%) |
| 35 to 64 Years | 52 (3.3%) | 56 (4.1%) |
| 65 to 74 Years | 0 (0.0%) | 71 (23.4%) |
| 75 Years and over | 56 (21.0%) | 36 (5.6%) |
Disability Class: Vision Difficulty
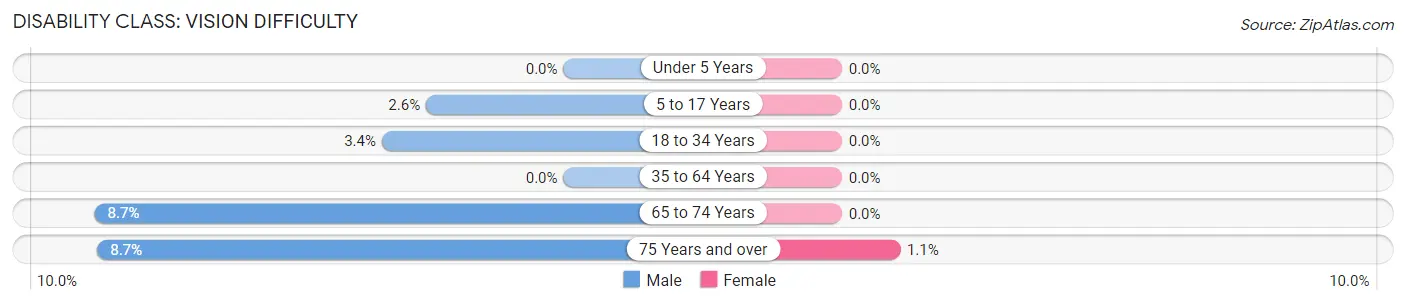
| Age Bracket | Male | Female |
| Under 5 Years | 0 (0.0%) | 0 (0.0%) |
| 5 to 17 Years | 29 (2.5%) | 0 (0.0%) |
| 18 to 34 Years | 37 (3.4%) | 0 (0.0%) |
| 35 to 64 Years | 0 (0.0%) | 0 (0.0%) |
| 65 to 74 Years | 42 (8.7%) | 0 (0.0%) |
| 75 Years and over | 23 (8.6%) | 7 (1.1%) |
Disability Class: Cognitive Difficulty
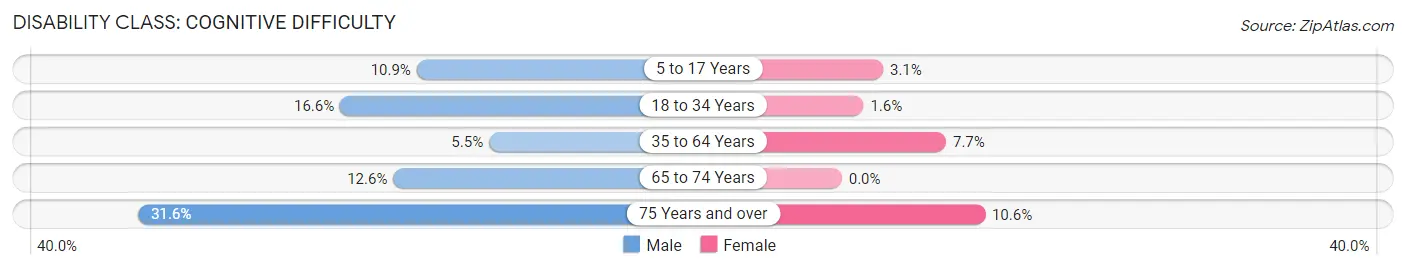
| Age Bracket | Male | Female |
| 5 to 17 Years | 124 (10.9%) | 32 (3.1%) |
| 18 to 34 Years | 182 (16.6%) | 17 (1.6%) |
| 35 to 64 Years | 87 (5.5%) | 107 (7.7%) |
| 65 to 74 Years | 61 (12.6%) | 0 (0.0%) |
| 75 Years and over | 84 (31.6%) | 69 (10.6%) |
Disability Class: Ambulatory Difficulty
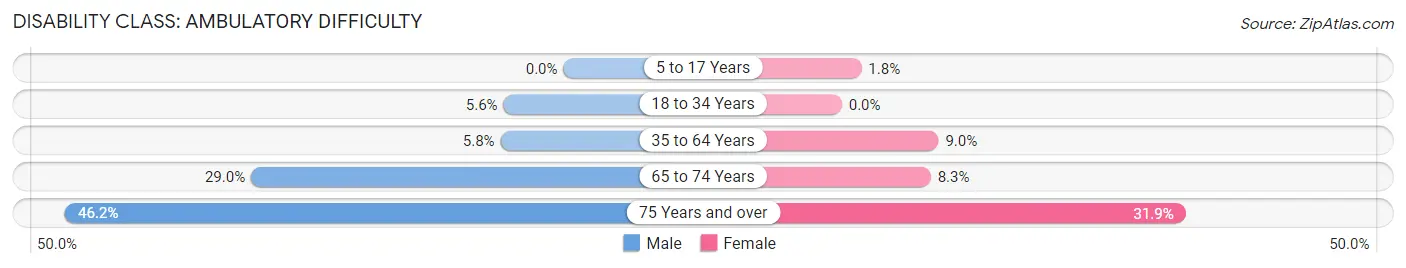
| Age Bracket | Male | Female |
| 5 to 17 Years | 0 (0.0%) | 19 (1.8%) |
| 18 to 34 Years | 61 (5.6%) | 0 (0.0%) |
| 35 to 64 Years | 92 (5.8%) | 124 (9.0%) |
| 65 to 74 Years | 140 (29.0%) | 25 (8.3%) |
| 75 Years and over | 123 (46.2%) | 207 (31.9%) |
Disability Class: Self-Care Difficulty
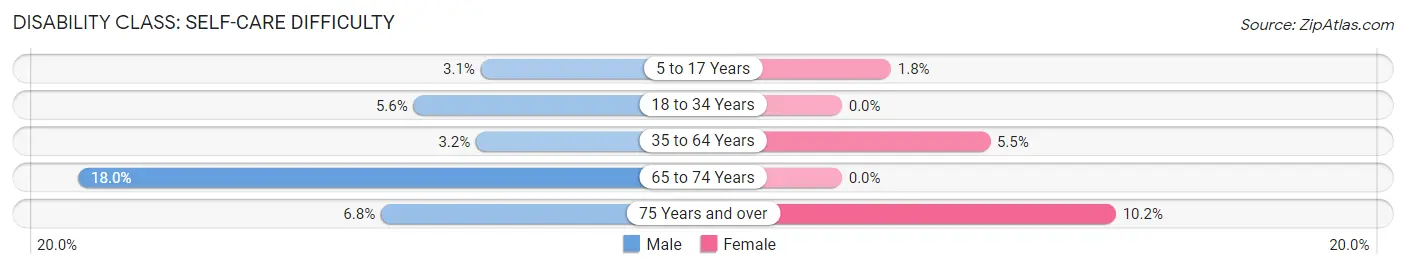
| Age Bracket | Male | Female |
| 5 to 17 Years | 35 (3.1%) | 19 (1.8%) |
| 18 to 34 Years | 61 (5.6%) | 0 (0.0%) |
| 35 to 64 Years | 51 (3.2%) | 76 (5.5%) |
| 65 to 74 Years | 87 (18.0%) | 0 (0.0%) |
| 75 Years and over | 18 (6.8%) | 66 (10.2%) |
Technology Access in Monett
Computing Device Access in Monett
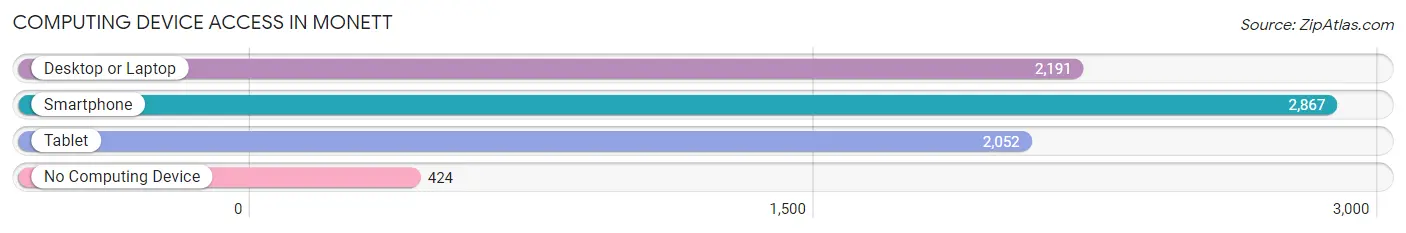
| Device Type | # Households | % Households |
| Desktop or Laptop | 2,191 | 59.2% |
| Smartphone | 2,867 | 77.4% |
| Tablet | 2,052 | 55.4% |
| No Computing Device | 424 | 11.5% |
| Total | 3,702 | 100.0% |
Internet Access in Monett
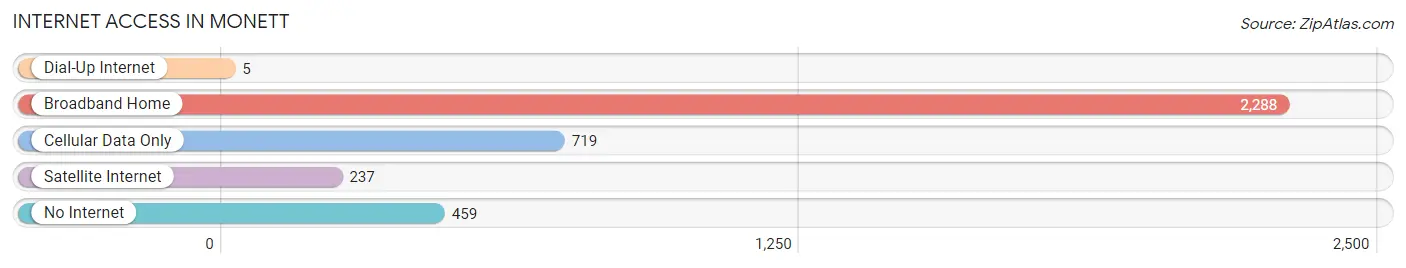
| Internet Type | # Households | % Households |
| Dial-Up Internet | 5 | 0.1% |
| Broadband Home | 2,288 | 61.8% |
| Cellular Data Only | 719 | 19.4% |
| Satellite Internet | 237 | 6.4% |
| No Internet | 459 | 12.4% |
| Total | 3,702 | 100.0% |
Monett Summary
Monett, Missouri is a small city located in the southwestern corner of the state, about 30 miles south of Springfield. It is the county seat of Barry County and is part of the Springfield Metropolitan Statistical Area. The city has a population of 8,873 as of the 2010 census, and is the largest city in the county.
History
Monett was founded in 1883 by the Monett brothers, who were looking to establish a trading post in the area. The city was named after the brothers, and the first post office was established in 1884. The city was incorporated in 1887, and the first mayor was elected in 1888.
In the early 1900s, Monett was a thriving agricultural community, with a variety of crops being grown in the area. The city was also home to a number of businesses, including a flour mill, a brickyard, and a canning factory.
In the 1920s, the city began to experience a period of growth, with the construction of a new school, a hospital, and a number of other businesses. The city also became a hub for the oil industry, with several oil companies setting up operations in the area.
In the 1950s, the city experienced a period of decline, as many of the businesses that had been established in the area began to close. However, the city was able to rebound in the 1960s, with the construction of a new shopping center and the opening of a new hospital.
Geography
Monett is located in the southwestern corner of Missouri, about 30 miles south of Springfield. The city is situated in the Ozark Plateau, and is surrounded by rolling hills and wooded areas. The city is located at the intersection of US Highway 60 and Missouri Highway 37.
The city has a total area of 5.3 square miles, all of which is land. The city is located in the White River watershed, and is home to several creeks and streams, including the Monett Creek, which runs through the city.
Economy
Monett is a small city, but it has a diverse economy. The city is home to a variety of businesses, including manufacturing, retail, and healthcare. The city is also home to a number of agricultural businesses, including dairy farms, poultry farms, and grain elevators.
The city is also home to a number of large employers, including Jack Henry & Associates, a financial services company, and Tyson Foods, a food processing company. The city is also home to a number of smaller businesses, including restaurants, shops, and other services.
Demographics
As of the 2010 census, Monett had a population of 8,873. The city has a median age of 38.7 years, and a median household income of $37,945. The city is predominantly white, with a population that is 88.3% white, 5.2% Hispanic, 2.2% African American, and 1.3% Asian.
Monett is a small city, but it has a diverse population. The city is home to a variety of cultures and religions, including Christianity, Judaism, and Islam. The city is also home to a number of different ethnicities, including German, Irish, and Mexican.
Common Questions
What is Per Capita Income in Monett?
Per Capita income in Monett is $24,247.
What is the Median Family Income in Monett?
Median Family Income in Monett is $55,722.
What is the Median Household income in Monett?
Median Household Income in Monett is $42,635.
What is Income or Wage Gap in Monett?
Income or Wage Gap in Monett is 23.6%.
Women in Monett earn 76.4 cents for every dollar earned by a man.
What is Family Income Deficit in Monett?
Family Income Deficit in Monett is $8,888.
Families that are below poverty line in Monett earn $8,888 less on average than the poverty threshold level.
What is Inequality or Gini Index in Monett?
Inequality or Gini Index in Monett is 0.42.
What is the Total Population of Monett?
Total Population of Monett is 9,632.
What is the Total Male Population of Monett?
Total Male Population of Monett is 4,853.
What is the Total Female Population of Monett?
Total Female Population of Monett is 4,779.
What is the Ratio of Males per 100 Females in Monett?
There are 101.55 Males per 100 Females in Monett.
What is the Ratio of Females per 100 Males in Monett?
There are 98.48 Females per 100 Males in Monett.
What is the Median Population Age in Monett?
Median Population Age in Monett is 34.7 Years.
What is the Average Family Size in Monett
Average Family Size in Monett is 3.2 People.
What is the Average Household Size in Monett
Average Household Size in Monett is 2.6 People.
How Large is the Labor Force in Monett?
There are 4,819 People in the Labor Forcein in Monett.
What is the Percentage of People in the Labor Force in Monett?
67.1% of People are in the Labor Force in Monett.
What is the Unemployment Rate in Monett?
Unemployment Rate in Monett is 4.6%.