Marionville, MO Map & Demographics
Marionville Map
Marionville Overview
$21,048
PER CAPITA INCOME
$50,494
AVG FAMILY INCOME
$47,557
AVG HOUSEHOLD INCOME
31.8%
WAGE / INCOME GAP [ % ]
68.2¢/ $1
WAGE / INCOME GAP [ $ ]
0.39
INEQUALITY / GINI INDEX
2,551
TOTAL POPULATION
1,188
MALE POPULATION
1,363
FEMALE POPULATION
87.16
MALES / 100 FEMALES
114.73
FEMALES / 100 MALES
29.6
MEDIAN AGE
3.5
AVG FAMILY SIZE
2.5
AVG HOUSEHOLD SIZE
1,265
LABOR FORCE [ PEOPLE ]
66.5%
PERCENT IN LABOR FORCE
9.9%
UNEMPLOYMENT RATE
Marionville Zip Codes
Marionville Area Codes
Income in Marionville
Income Overview in Marionville
Per Capita Income in Marionville is $21,048, while median incomes of families and households are $50,494 and $47,557 respectively.
| Characteristic | Number | Measure |
| Per Capita Income | 2,551 | $21,048 |
| Median Family Income | 551 | $50,494 |
| Mean Family Income | 551 | $56,815 |
| Median Household Income | 985 | $47,557 |
| Mean Household Income | 985 | $52,864 |
| Income Deficit | 551 | $0 |
| Wage / Income Gap (%) | 2,551 | 31.82% |
| Wage / Income Gap ($) | 2,551 | 68.18¢ per $1 |
| Gini / Inequality Index | 2,551 | 0.39 |
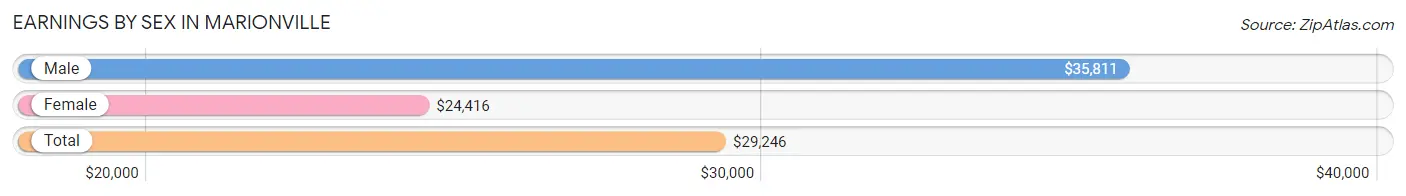
Earnings by Sex in Marionville
Average Earnings in Marionville are $29,246, $35,811 for men and $24,416 for women, a difference of 31.8%.
| Sex | Number | Average Earnings |
| Male | 607 (49.2%) | $35,811 |
| Female | 626 (50.8%) | $24,416 |
| Total | 1,233 (100.0%) | $29,246 |
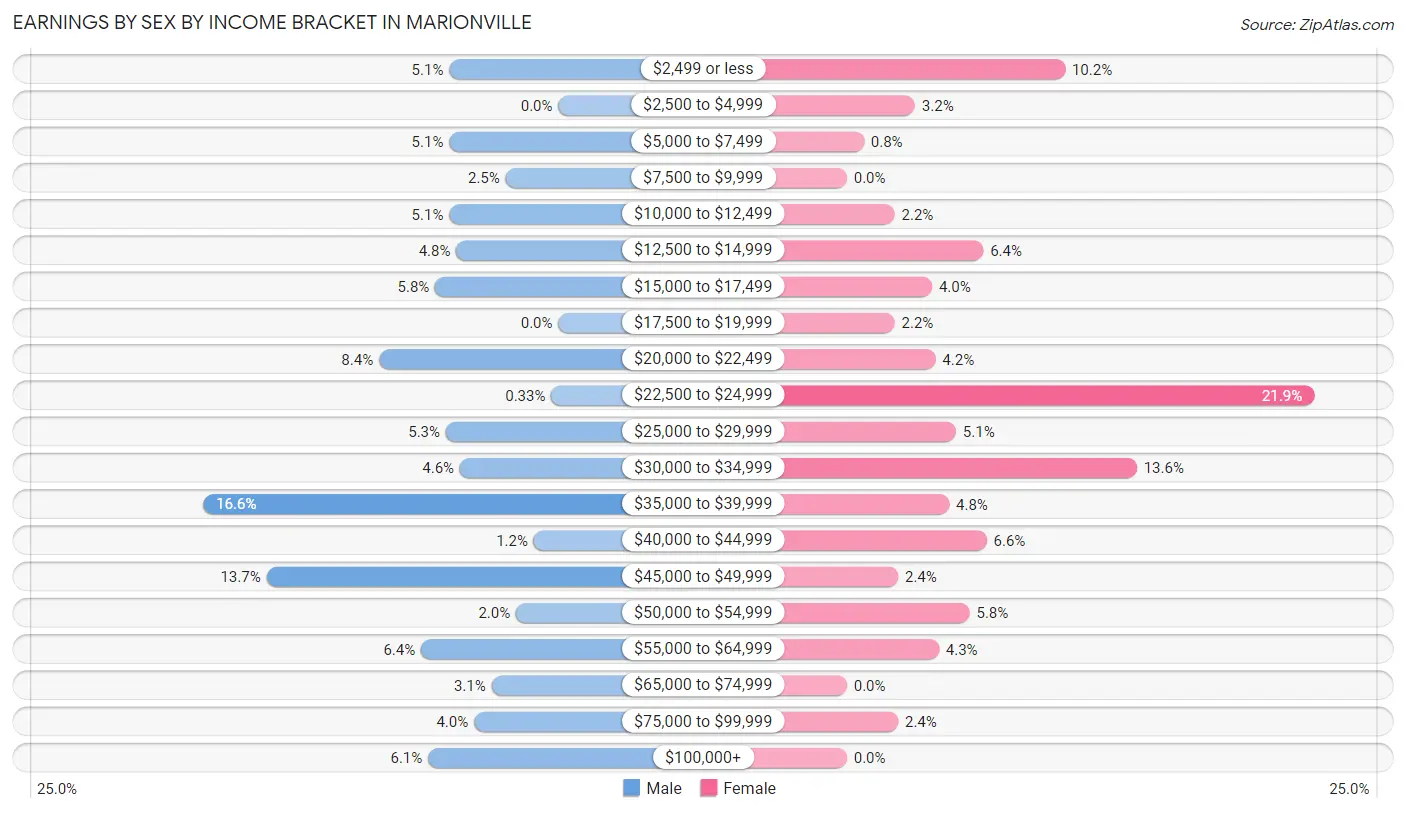
Earnings by Sex by Income Bracket in Marionville
The most common earnings brackets in Marionville are $35,000 to $39,999 for men (101 | 16.6%) and $22,500 to $24,999 for women (137 | 21.9%).
| Income | Male | Female |
| $2,499 or less | 31 (5.1%) | 64 (10.2%) |
| $2,500 to $4,999 | 0 (0.0%) | 20 (3.2%) |
| $5,000 to $7,499 | 31 (5.1%) | 5 (0.8%) |
| $7,500 to $9,999 | 15 (2.5%) | 0 (0.0%) |
| $10,000 to $12,499 | 31 (5.1%) | 14 (2.2%) |
| $12,500 to $14,999 | 29 (4.8%) | 40 (6.4%) |
| $15,000 to $17,499 | 35 (5.8%) | 25 (4.0%) |
| $17,500 to $19,999 | 0 (0.0%) | 14 (2.2%) |
| $20,000 to $22,499 | 51 (8.4%) | 26 (4.2%) |
| $22,500 to $24,999 | 2 (0.3%) | 137 (21.9%) |
| $25,000 to $29,999 | 32 (5.3%) | 32 (5.1%) |
| $30,000 to $34,999 | 28 (4.6%) | 85 (13.6%) |
| $35,000 to $39,999 | 101 (16.6%) | 30 (4.8%) |
| $40,000 to $44,999 | 7 (1.1%) | 41 (6.6%) |
| $45,000 to $49,999 | 83 (13.7%) | 15 (2.4%) |
| $50,000 to $54,999 | 12 (2.0%) | 36 (5.8%) |
| $55,000 to $64,999 | 39 (6.4%) | 27 (4.3%) |
| $65,000 to $74,999 | 19 (3.1%) | 0 (0.0%) |
| $75,000 to $99,999 | 24 (4.0%) | 15 (2.4%) |
| $100,000+ | 37 (6.1%) | 0 (0.0%) |
| Total | 607 (100.0%) | 626 (100.0%) |
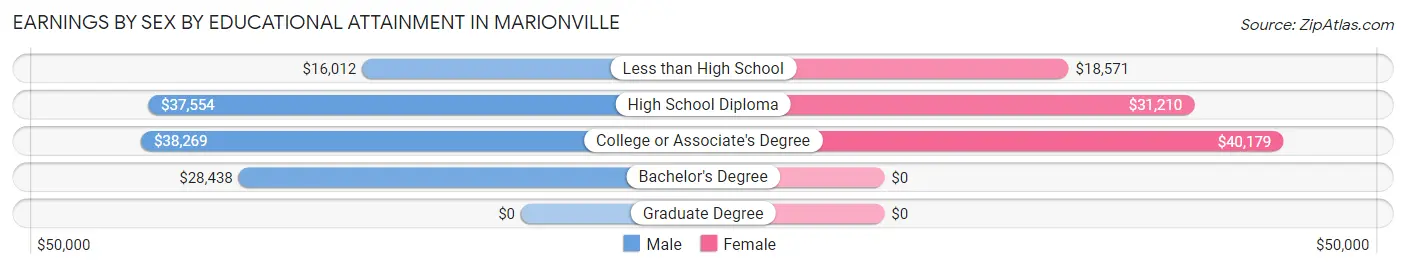
Earnings by Sex by Educational Attainment in Marionville
Average earnings in Marionville are $36,944 for men and $30,806 for women, a difference of 16.6%. Men with an educational attainment of college or associate's degree enjoy the highest average annual earnings of $38,269, while those with less than high school education earn the least with $16,012. Women with an educational attainment of college or associate's degree earn the most with the average annual earnings of $40,179, while those with less than high school education have the smallest earnings of $18,571.
| Educational Attainment | Male Income | Female Income |
| Less than High School | $16,012 | $18,571 |
| High School Diploma | $37,554 | $31,210 |
| College or Associate's Degree | $38,269 | $40,179 |
| Bachelor's Degree | $28,438 | $0 |
| Graduate Degree | - | - |
| Total | $36,944 | $30,806 |
Family Income in Marionville
Family Income Brackets in Marionville
According to the Marionville family income data, there are 145 families falling into the $50,000 to $74,999 income range, which is the most common income bracket and makes up 26.3% of all families. Conversely, the $200,000+ income bracket is the least frequent group with only 5 families (0.9%) belonging to this category.
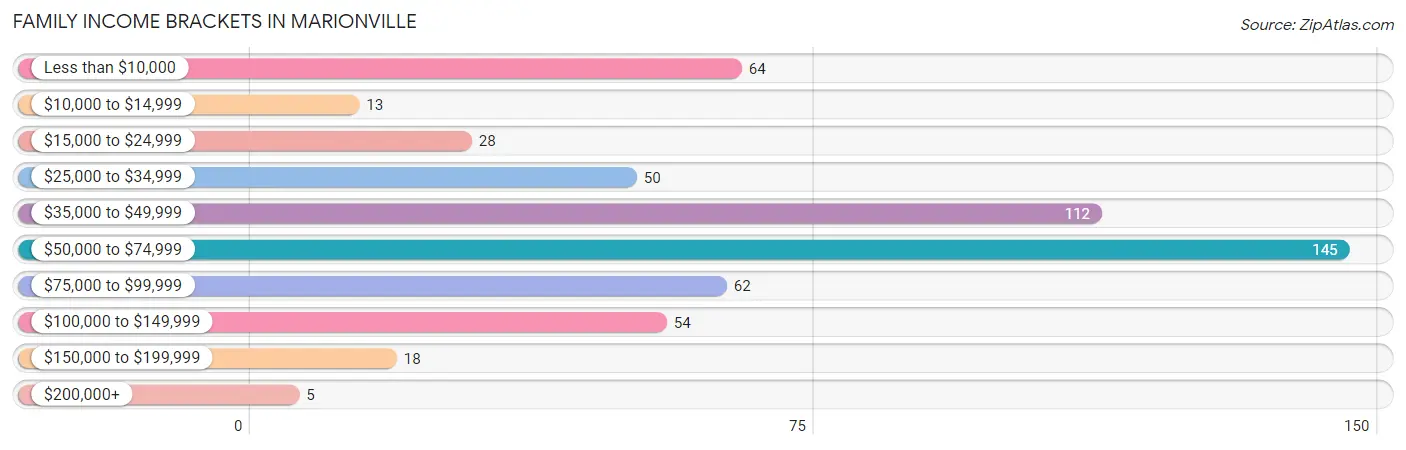
| Income Bracket | # Families | % Families |
| Less than $10,000 | 64 | 11.6% |
| $10,000 to $14,999 | 13 | 2.4% |
| $15,000 to $24,999 | 28 | 5.1% |
| $25,000 to $34,999 | 50 | 9.1% |
| $35,000 to $49,999 | 112 | 20.3% |
| $50,000 to $74,999 | 145 | 26.3% |
| $75,000 to $99,999 | 62 | 11.3% |
| $100,000 to $149,999 | 54 | 9.8% |
| $150,000 to $199,999 | 18 | 3.3% |
| $200,000+ | 5 | 0.9% |
Family Income by Famaliy Size in Marionville
3-person families (89 | 16.2%) account for the highest median family income in Marionville with $85,673 per family, while 3-person families (89 | 16.2%) have the highest median income of $28,558 per family member.
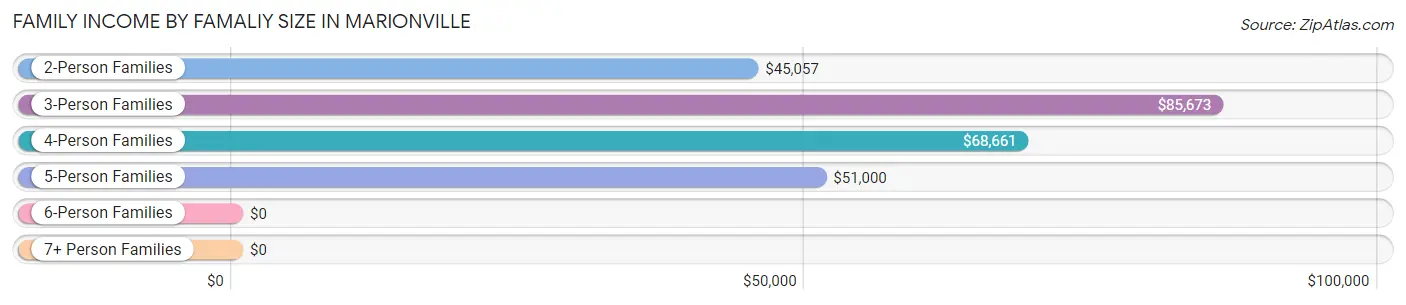
| Income Bracket | # Families | Median Income |
| 2-Person Families | 304 (55.2%) | $45,057 |
| 3-Person Families | 89 (16.2%) | $85,673 |
| 4-Person Families | 51 (9.3%) | $68,661 |
| 5-Person Families | 78 (14.2%) | $51,000 |
| 6-Person Families | 20 (3.6%) | $0 |
| 7+ Person Families | 9 (1.6%) | $0 |
| Total | 551 (100.0%) | $50,494 |
Family Income by Number of Earners in Marionville
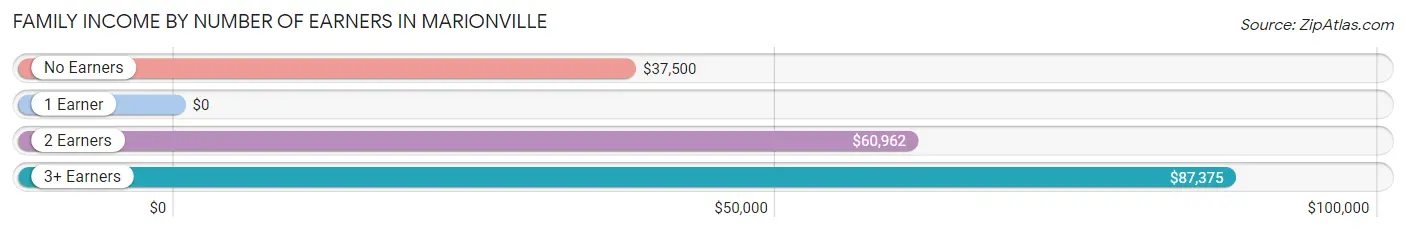
| Number of Earners | # Families | Median Income |
| No Earners | 92 (16.7%) | $37,500 |
| 1 Earner | 202 (36.7%) | $0 |
| 2 Earners | 230 (41.7%) | $60,962 |
| 3+ Earners | 27 (4.9%) | $87,375 |
| Total | 551 (100.0%) | $50,494 |
Household Income in Marionville
Household Income Brackets in Marionville
With 272 households falling in the category, the $50,000 to $74,999 income range is the most frequent in Marionville, accounting for 27.6% of all households. In contrast, only 5 households (0.5%) fall into the $200,000+ income bracket, making it the least populous group.
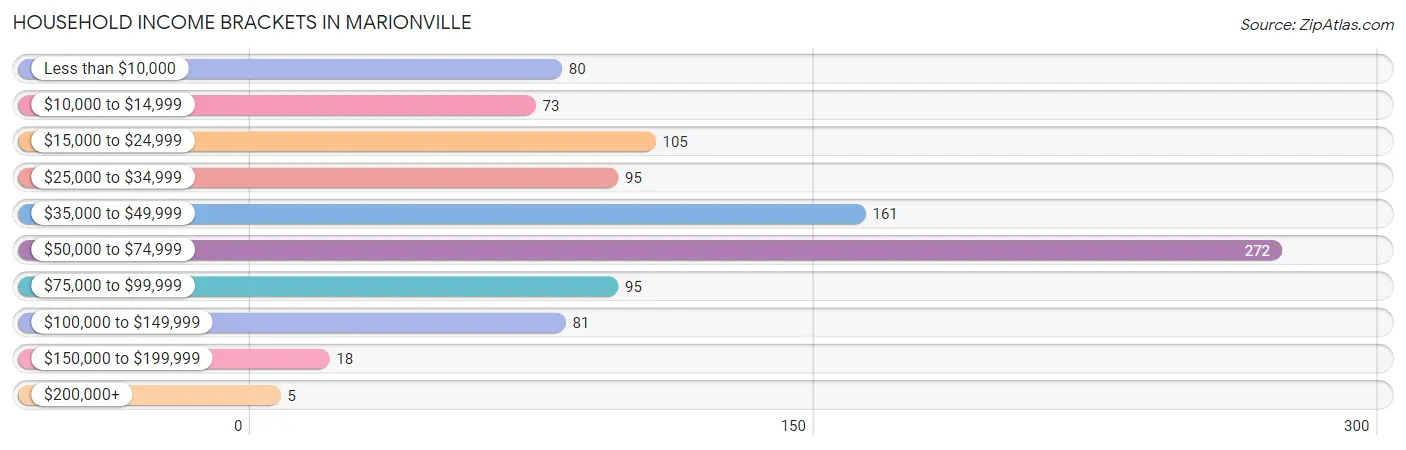
| Income Bracket | # Households | % Households |
| Less than $10,000 | 80 | 8.1% |
| $10,000 to $14,999 | 73 | 7.4% |
| $15,000 to $24,999 | 105 | 10.7% |
| $25,000 to $34,999 | 95 | 9.6% |
| $35,000 to $49,999 | 161 | 16.3% |
| $50,000 to $74,999 | 272 | 27.6% |
| $75,000 to $99,999 | 95 | 9.6% |
| $100,000 to $149,999 | 81 | 8.2% |
| $150,000 to $199,999 | 18 | 1.8% |
| $200,000+ | 5 | 0.5% |
Household Income by Householder Age in Marionville
The median household income in Marionville is $47,557, with the highest median household income of $55,625 found in the 25 to 44 years age bracket for the primary householder. A total of 262 households (26.6%) fall into this category. Meanwhile, the 15 to 24 years age bracket for the primary householder has the lowest median household income of $0, with 183 households (18.6%) in this group.
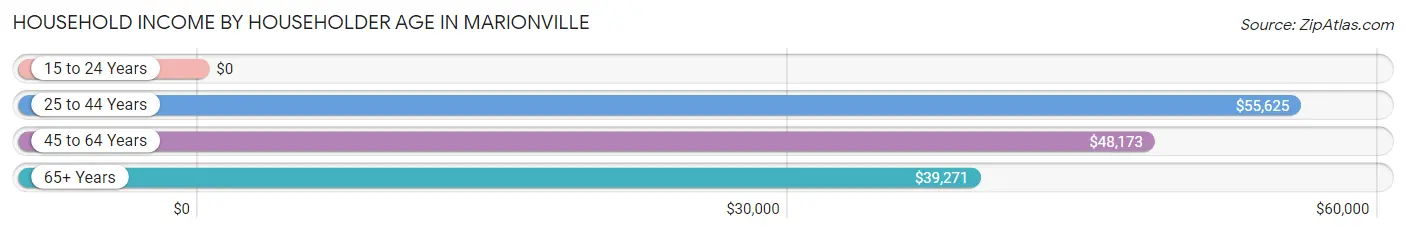
| Income Bracket | # Households | Median Income |
| 15 to 24 Years | 183 (18.6%) | $0 |
| 25 to 44 Years | 262 (26.6%) | $55,625 |
| 45 to 64 Years | 289 (29.3%) | $48,173 |
| 65+ Years | 251 (25.5%) | $39,271 |
| Total | 985 (100.0%) | $47,557 |
Poverty in Marionville
Income Below Poverty by Sex and Age in Marionville
With 11.3% poverty level for males and 22.0% for females among the residents of Marionville, 35 to 44 year old males and under 5 year old females are the most vulnerable to poverty, with 56 males (41.5%) and 120 females (67.8%) in their respective age groups living below the poverty level.
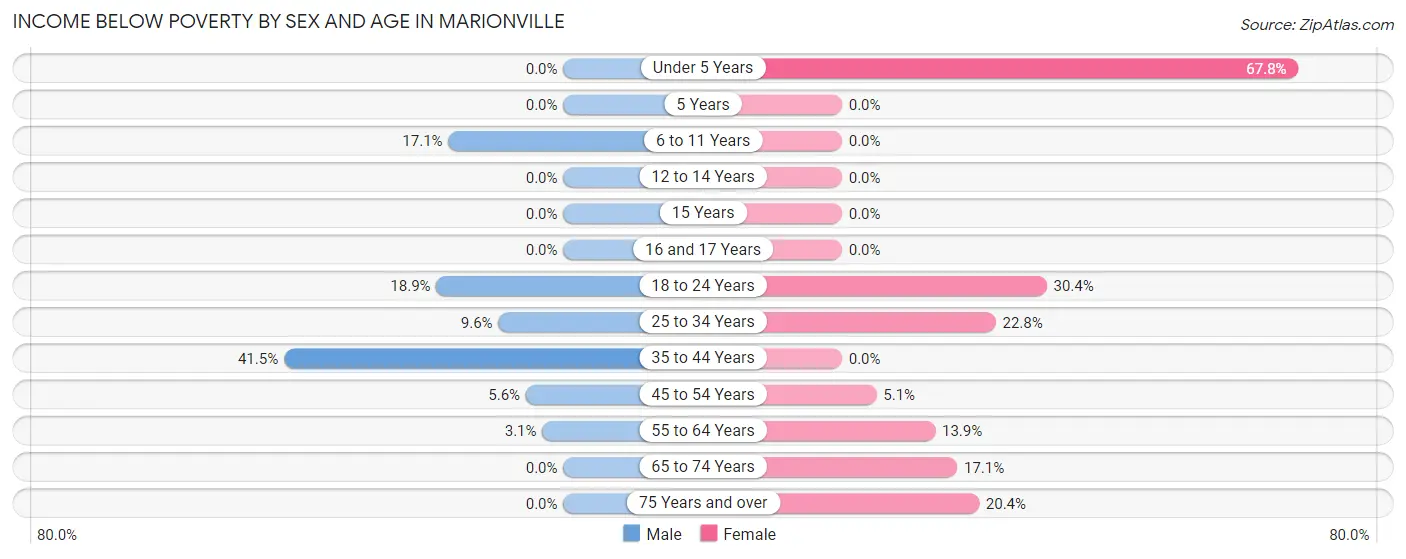
| Age Bracket | Male | Female |
| Under 5 Years | 0 (0.0%) | 120 (67.8%) |
| 5 Years | 0 (0.0%) | 0 (0.0%) |
| 6 to 11 Years | 21 (17.1%) | 0 (0.0%) |
| 12 to 14 Years | 0 (0.0%) | 0 (0.0%) |
| 15 Years | 0 (0.0%) | 0 (0.0%) |
| 16 and 17 Years | 0 (0.0%) | 0 (0.0%) |
| 18 to 24 Years | 23 (18.9%) | 69 (30.4%) |
| 25 to 34 Years | 19 (9.6%) | 42 (22.8%) |
| 35 to 44 Years | 56 (41.5%) | 0 (0.0%) |
| 45 to 54 Years | 7 (5.6%) | 6 (5.1%) |
| 55 to 64 Years | 4 (3.1%) | 18 (13.9%) |
| 65 to 74 Years | 0 (0.0%) | 13 (17.1%) |
| 75 Years and over | 0 (0.0%) | 23 (20.3%) |
| Total | 130 (11.3%) | 291 (22.0%) |
Income Above Poverty by Sex and Age in Marionville
According to the poverty statistics in Marionville, males aged under 5 years and females aged 5 years are the age groups that are most secure financially, with 100.0% of males and 100.0% of females in these age groups living above the poverty line.
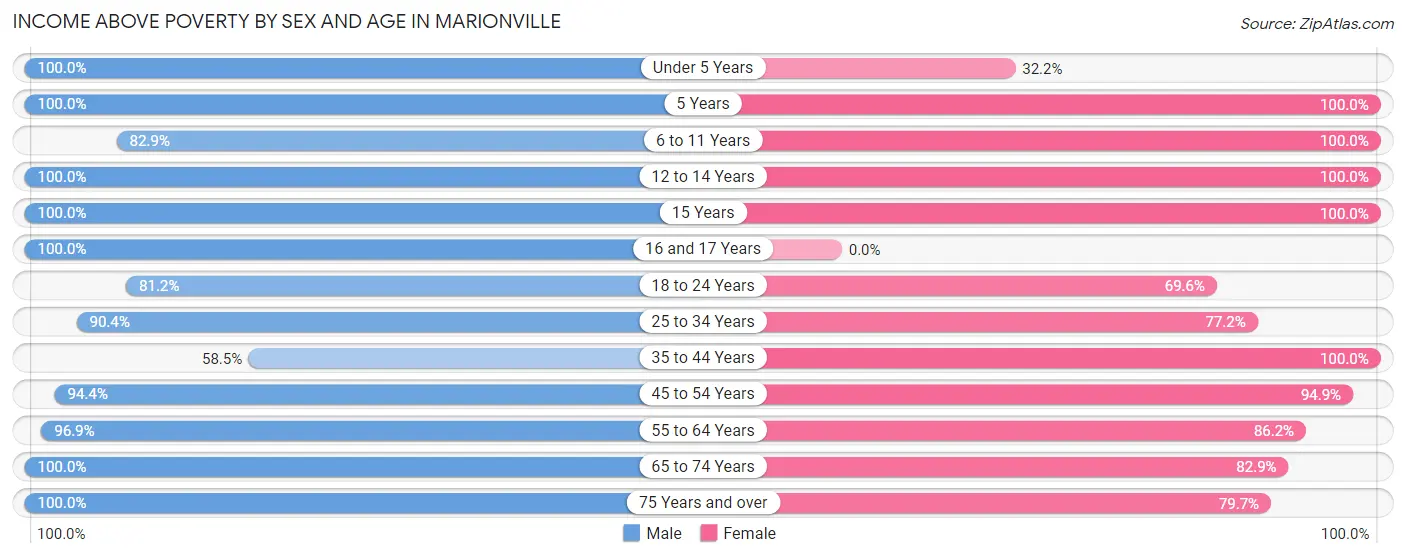
| Age Bracket | Male | Female |
| Under 5 Years | 83 (100.0%) | 57 (32.2%) |
| 5 Years | 27 (100.0%) | 21 (100.0%) |
| 6 to 11 Years | 102 (82.9%) | 146 (100.0%) |
| 12 to 14 Years | 12 (100.0%) | 19 (100.0%) |
| 15 Years | 15 (100.0%) | 12 (100.0%) |
| 16 and 17 Years | 28 (100.0%) | 0 (0.0%) |
| 18 to 24 Years | 99 (81.1%) | 158 (69.6%) |
| 25 to 34 Years | 178 (90.4%) | 142 (77.2%) |
| 35 to 44 Years | 79 (58.5%) | 103 (100.0%) |
| 45 to 54 Years | 119 (94.4%) | 111 (94.9%) |
| 55 to 64 Years | 124 (96.9%) | 112 (86.2%) |
| 65 to 74 Years | 92 (100.0%) | 63 (82.9%) |
| 75 Years and over | 63 (100.0%) | 90 (79.6%) |
| Total | 1,021 (88.7%) | 1,034 (78.0%) |
Income Below Poverty Among Married-Couple Families in Marionville
The poverty statistics for married-couple families in Marionville show that 7.0% or 25 of the total 357 families live below the poverty line. Families with 3 or 4 children have the highest poverty rate of 37.9%, comprising of 25 families. On the other hand, families with no children have the lowest poverty rate of 0.0%, which includes 0 families.
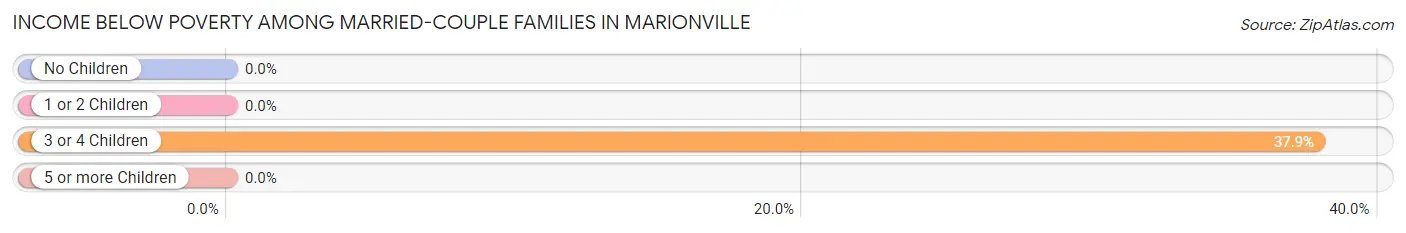
| Children | Above Poverty | Below Poverty |
| No Children | 209 (100.0%) | 0 (0.0%) |
| 1 or 2 Children | 82 (100.0%) | 0 (0.0%) |
| 3 or 4 Children | 41 (62.1%) | 25 (37.9%) |
| 5 or more Children | 0 (0.0%) | 0 (0.0%) |
| Total | 332 (93.0%) | 25 (7.0%) |
Income Below Poverty Among Single-Parent Households in Marionville
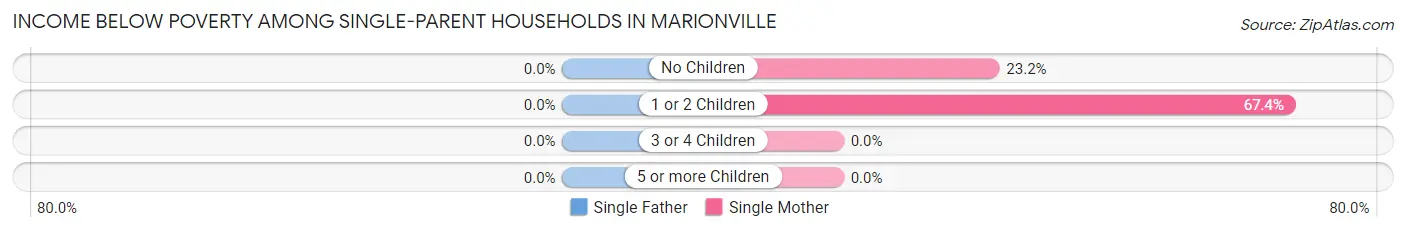
| Children | Single Father | Single Mother |
| No Children | 0 (0.0%) | 13 (23.2%) |
| 1 or 2 Children | 0 (0.0%) | 64 (67.4%) |
| 3 or 4 Children | 0 (0.0%) | 0 (0.0%) |
| 5 or more Children | 0 (0.0%) | 0 (0.0%) |
| Total | 0 (0.0%) | 77 (51.0%) |
Income Below Poverty Among Married-Couple vs Single-Parent Households in Marionville
The poverty data for Marionville shows that 25 of the married-couple family households (7.0%) and 77 of the single-parent households (39.7%) are living below the poverty level. Within the married-couple family households, those with 3 or 4 children have the highest poverty rate, with 25 households (37.9%) falling below the poverty line. Among the single-parent households, those with 1 or 2 children have the highest poverty rate, with 64 household (50.4%) living below poverty.
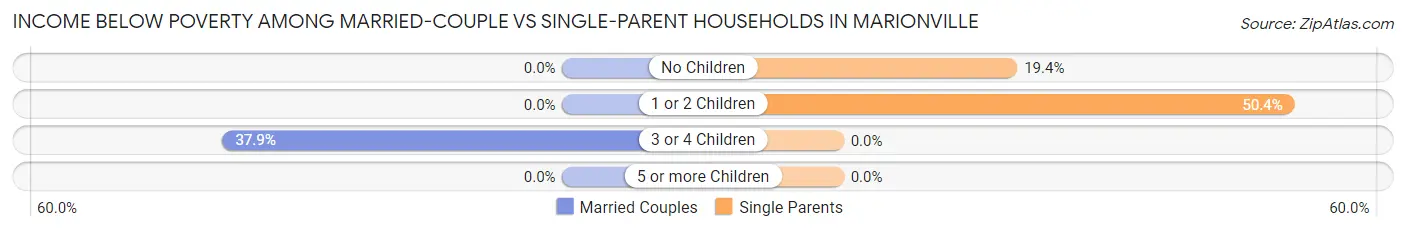
| Children | Married-Couple Families | Single-Parent Households |
| No Children | 0 (0.0%) | 13 (19.4%) |
| 1 or 2 Children | 0 (0.0%) | 64 (50.4%) |
| 3 or 4 Children | 25 (37.9%) | 0 (0.0%) |
| 5 or more Children | 0 (0.0%) | 0 (0.0%) |
| Total | 25 (7.0%) | 77 (39.7%) |
Race in Marionville
The most populous races in Marionville are White / Caucasian (2,409 | 94.4%), Hispanic or Latino (197 | 7.7%), and Two or more Races (113 | 4.4%).
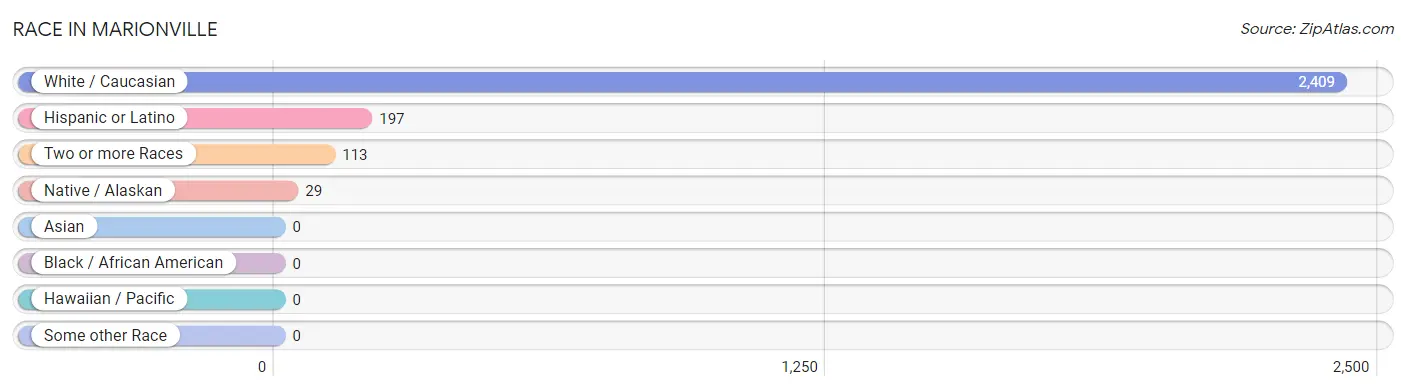
| Race | # Population | % Population |
| Asian | 0 | 0.0% |
| Black / African American | 0 | 0.0% |
| Hawaiian / Pacific | 0 | 0.0% |
| Hispanic or Latino | 197 | 7.7% |
| Native / Alaskan | 29 | 1.1% |
| White / Caucasian | 2,409 | 94.4% |
| Two or more Races | 113 | 4.4% |
| Some other Race | 0 | 0.0% |
| Total | 2,551 | 100.0% |
Ancestry in Marionville
The most populous ancestries reported in Marionville are English (521 | 20.4%), German (514 | 20.2%), American (316 | 12.4%), Irish (241 | 9.5%), and Mexican (164 | 6.4%), together accounting for 68.8% of all Marionville residents.
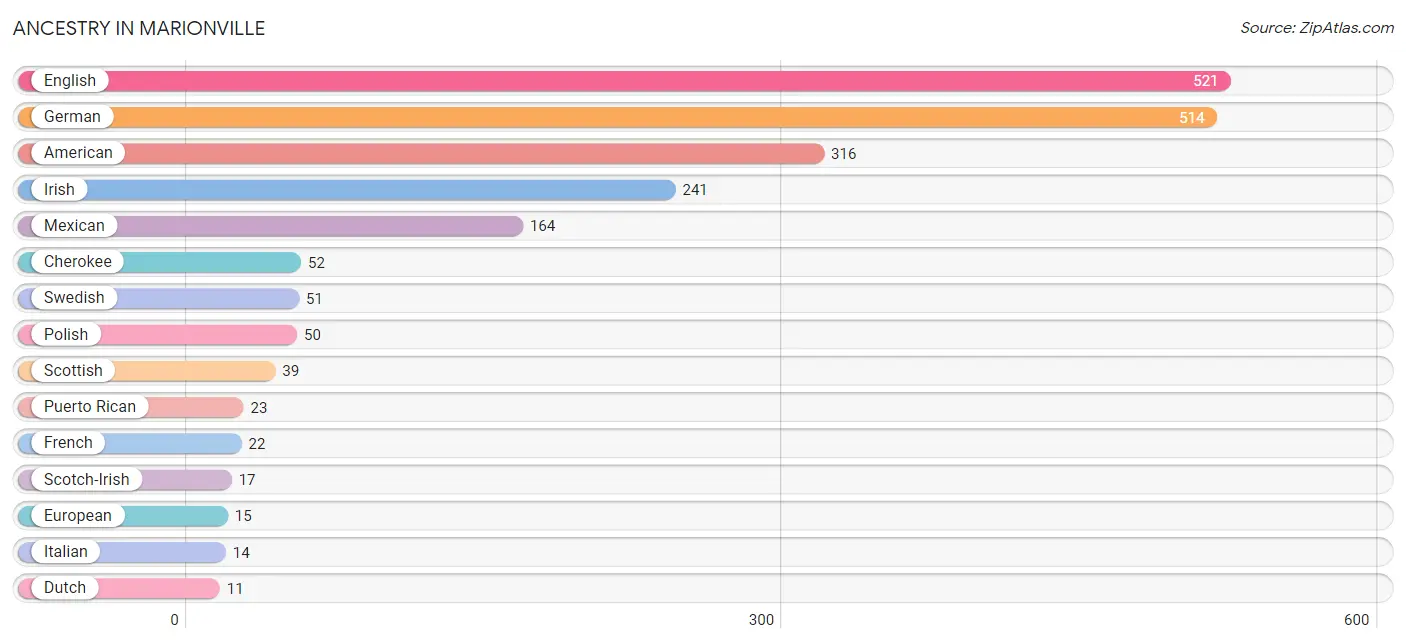
| Ancestry | # Population | % Population |
| American | 316 | 12.4% |
| Central American | 4 | 0.2% |
| Cherokee | 52 | 2.0% |
| Choctaw | 3 | 0.1% |
| Czechoslovakian | 4 | 0.2% |
| Dutch | 11 | 0.4% |
| English | 521 | 20.4% |
| European | 15 | 0.6% |
| French | 22 | 0.9% |
| German | 514 | 20.2% |
| Greek | 11 | 0.4% |
| Honduran | 4 | 0.2% |
| Irish | 241 | 9.5% |
| Italian | 14 | 0.5% |
| Mexican | 164 | 6.4% |
| Northern European | 5 | 0.2% |
| Norwegian | 4 | 0.2% |
| Osage | 2 | 0.1% |
| Polish | 50 | 2.0% |
| Puerto Rican | 23 | 0.9% |
| Scotch-Irish | 17 | 0.7% |
| Scottish | 39 | 1.5% |
| Swedish | 51 | 2.0% | View All 23 Rows |
Immigrants in Marionville
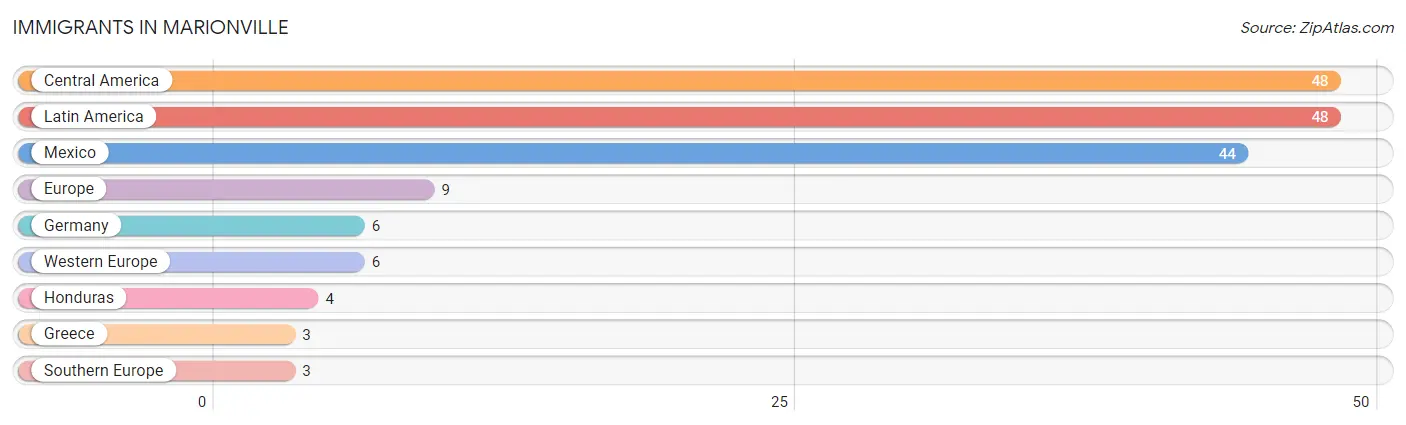
The most numerous immigrant groups reported in Marionville came from Central America (48 | 1.9%), Latin America (48 | 1.9%), Mexico (44 | 1.7%), Europe (9 | 0.4%), and Germany (6 | 0.2%), together accounting for 6.1% of all Marionville residents.
| Immigration Origin | # Population | % Population |
| Central America | 48 | 1.9% |
| Europe | 9 | 0.4% |
| Germany | 6 | 0.2% |
| Greece | 3 | 0.1% |
| Honduras | 4 | 0.2% |
| Latin America | 48 | 1.9% |
| Mexico | 44 | 1.7% |
| Southern Europe | 3 | 0.1% |
| Western Europe | 6 | 0.2% | View All 9 Rows |
Sex and Age in Marionville
Sex and Age in Marionville
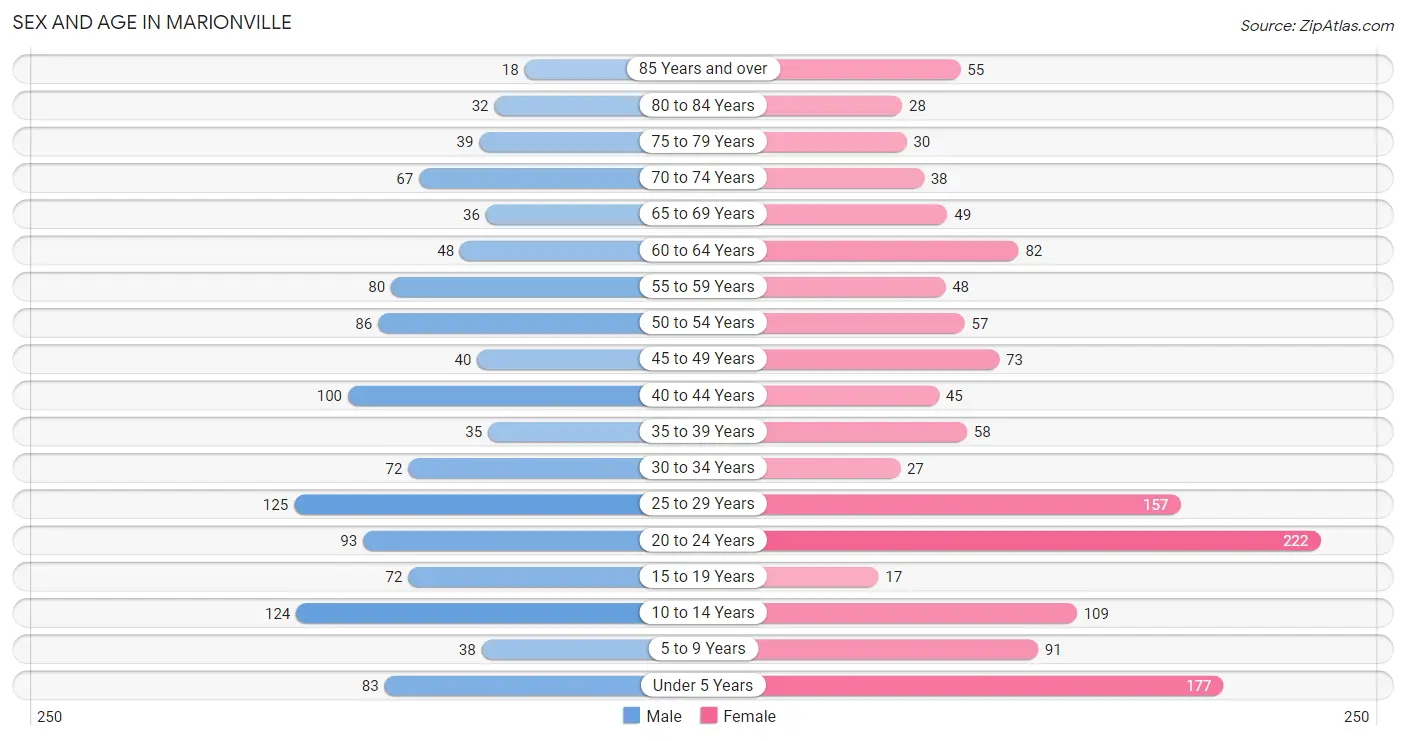
The most populous age groups in Marionville are 25 to 29 Years (125 | 10.5%) for men and 20 to 24 Years (222 | 16.3%) for women.
| Age Bracket | Male | Female |
| Under 5 Years | 83 (7.0%) | 177 (13.0%) |
| 5 to 9 Years | 38 (3.2%) | 91 (6.7%) |
| 10 to 14 Years | 124 (10.4%) | 109 (8.0%) |
| 15 to 19 Years | 72 (6.1%) | 17 (1.3%) |
| 20 to 24 Years | 93 (7.8%) | 222 (16.3%) |
| 25 to 29 Years | 125 (10.5%) | 157 (11.5%) |
| 30 to 34 Years | 72 (6.1%) | 27 (2.0%) |
| 35 to 39 Years | 35 (2.9%) | 58 (4.3%) |
| 40 to 44 Years | 100 (8.4%) | 45 (3.3%) |
| 45 to 49 Years | 40 (3.4%) | 73 (5.4%) |
| 50 to 54 Years | 86 (7.2%) | 57 (4.2%) |
| 55 to 59 Years | 80 (6.7%) | 48 (3.5%) |
| 60 to 64 Years | 48 (4.0%) | 82 (6.0%) |
| 65 to 69 Years | 36 (3.0%) | 49 (3.6%) |
| 70 to 74 Years | 67 (5.6%) | 38 (2.8%) |
| 75 to 79 Years | 39 (3.3%) | 30 (2.2%) |
| 80 to 84 Years | 32 (2.7%) | 28 (2.1%) |
| 85 Years and over | 18 (1.5%) | 55 (4.0%) |
| Total | 1,188 (100.0%) | 1,363 (100.0%) |
Families and Households in Marionville
Median Family Size in Marionville
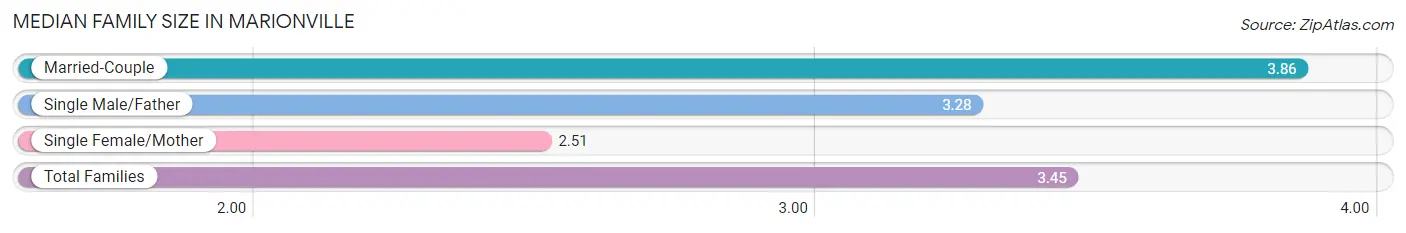
The median family size in Marionville is 3.45 persons per family, with married-couple families (357 | 64.8%) accounting for the largest median family size of 3.86 persons per family. On the other hand, single female/mother families (151 | 27.4%) represent the smallest median family size with 2.51 persons per family.
| Family Type | # Families | Family Size |
| Married-Couple | 357 (64.8%) | 3.86 |
| Single Male/Father | 43 (7.8%) | 3.28 |
| Single Female/Mother | 151 (27.4%) | 2.51 |
| Total Families | 551 (100.0%) | 3.45 |
Median Household Size in Marionville
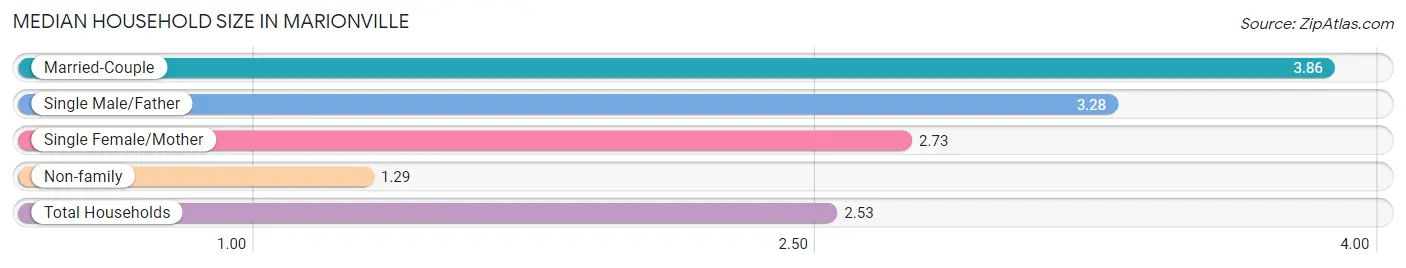
The median household size in Marionville is 2.53 persons per household, with married-couple households (357 | 36.2%) accounting for the largest median household size of 3.86 persons per household. non-family households (434 | 44.1%) represent the smallest median household size with 1.29 persons per household.
| Household Type | # Households | Household Size |
| Married-Couple | 357 (36.2%) | 3.86 |
| Single Male/Father | 43 (4.4%) | 3.28 |
| Single Female/Mother | 151 (15.3%) | 2.73 |
| Non-family | 434 (44.1%) | 1.29 |
| Total Households | 985 (100.0%) | 2.53 |
Household Size by Marriage Status in Marionville
Out of a total of 985 households in Marionville, 551 (55.9%) are family households, while 434 (44.1%) are nonfamily households. The most numerous type of family households are 2-person households, comprising 296, and the most common type of nonfamily households are 1-person households, comprising 301.
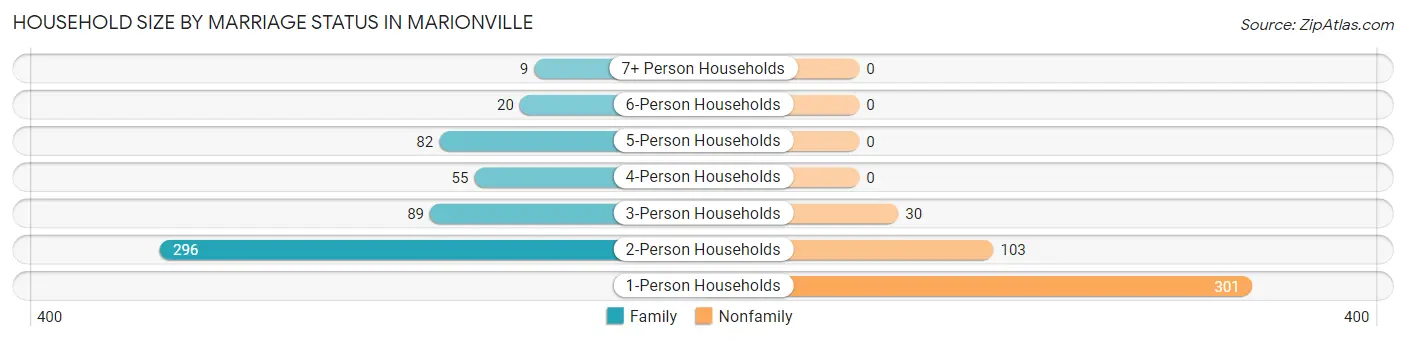
| Household Size | Family Households | Nonfamily Households |
| 1-Person Households | - | 301 (30.6%) |
| 2-Person Households | 296 (30.0%) | 103 (10.5%) |
| 3-Person Households | 89 (9.0%) | 30 (3.0%) |
| 4-Person Households | 55 (5.6%) | 0 (0.0%) |
| 5-Person Households | 82 (8.3%) | 0 (0.0%) |
| 6-Person Households | 20 (2.0%) | 0 (0.0%) |
| 7+ Person Households | 9 (0.9%) | 0 (0.0%) |
| Total | 551 (55.9%) | 434 (44.1%) |
Female Fertility in Marionville
Fertility by Age in Marionville
Average fertility rate in Marionville is 69.0 births per 1,000 women. Women in the age bracket of 20 to 34 years have the highest fertility rate with 103.0 births per 1,000 women. Women in the age bracket of 20 to 34 years acount for 100.0% of all women with births.
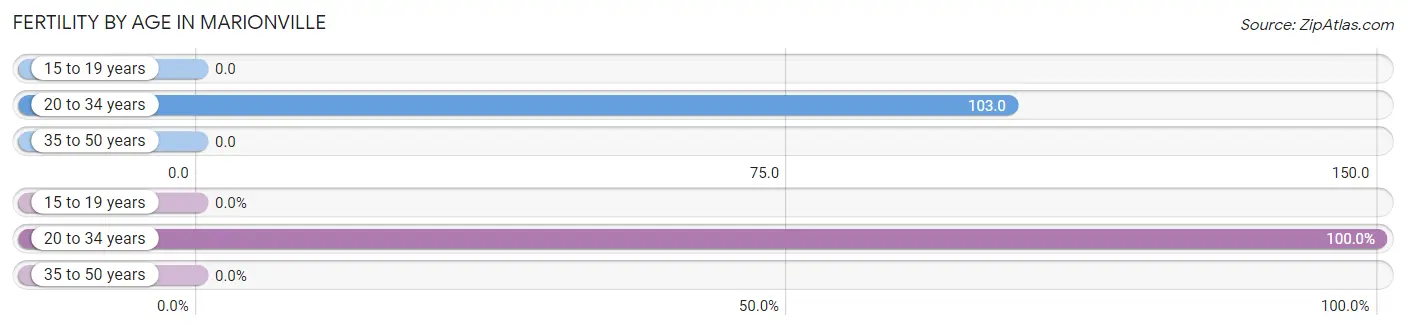
| Age Bracket | Women with Births | Births / 1,000 Women |
| 15 to 19 years | 0 (0.0%) | 0.0 |
| 20 to 34 years | 42 (100.0%) | 103.0 |
| 35 to 50 years | 0 (0.0%) | 0.0 |
| Total | 42 (100.0%) | 69.0 |
Fertility by Age by Marriage Status in Marionville
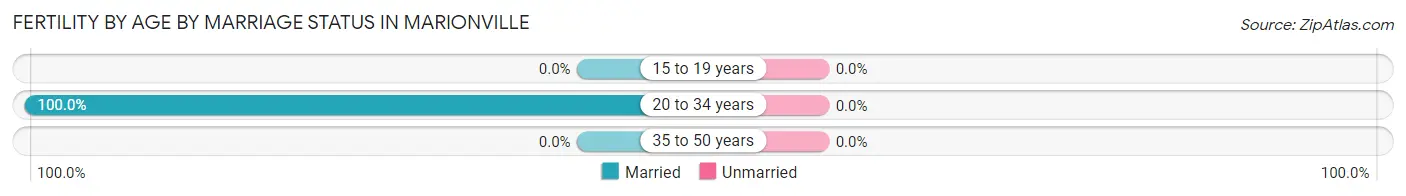
| Age Bracket | Married | Unmarried |
| 15 to 19 years | 0 (0.0%) | 0 (0.0%) |
| 20 to 34 years | 42 (100.0%) | 0 (0.0%) |
| 35 to 50 years | 0 (0.0%) | 0 (0.0%) |
| Total | 42 (100.0%) | 0 (0.0%) |
Fertility by Education in Marionville
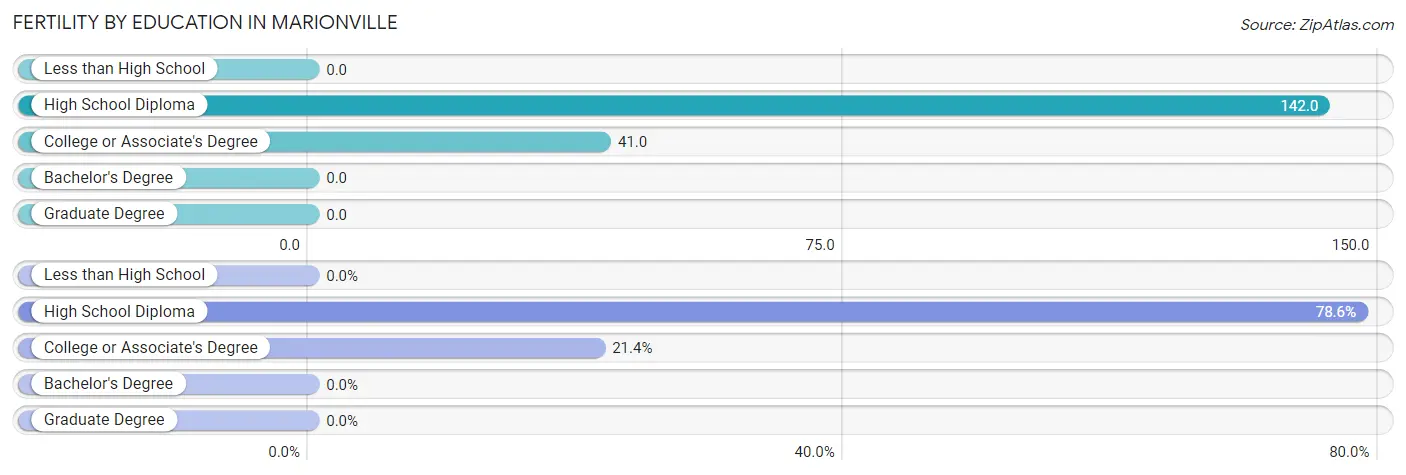
| Educational Attainment | Women with Births | Births / 1,000 Women |
| Less than High School | 0 (0.0%) | 0.0 |
| High School Diploma | 33 (78.6%) | 142.0 |
| College or Associate's Degree | 9 (21.4%) | 41.0 |
| Bachelor's Degree | 0 (0.0%) | 0.0 |
| Graduate Degree | 0 (0.0%) | 0.0 |
| Total | 42 (100.0%) | 69.0 |
Fertility by Education by Marriage Status in Marionville
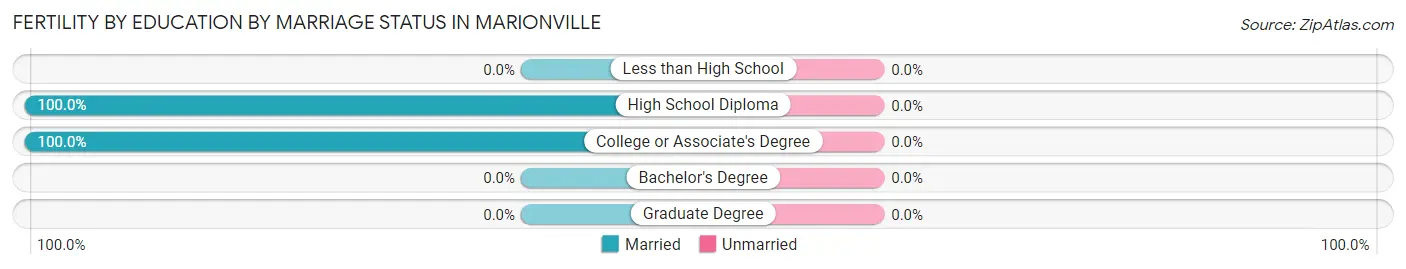
| Educational Attainment | Married | Unmarried |
| Less than High School | 0 (0.0%) | 0 (0.0%) |
| High School Diploma | 33 (100.0%) | 0 (0.0%) |
| College or Associate's Degree | 9 (100.0%) | 0 (0.0%) |
| Bachelor's Degree | 0 (0.0%) | 0 (0.0%) |
| Graduate Degree | 0 (0.0%) | 0 (0.0%) |
| Total | 42 (100.0%) | 0 (0.0%) |
Employment Characteristics in Marionville
Employment by Class of Employer in Marionville
Among the 1,108 employed individuals in Marionville, private company employees (793 | 71.6%), local government employees (180 | 16.3%), and self-employed (not incorporated) (59 | 5.3%) make up the most common classes of employment.
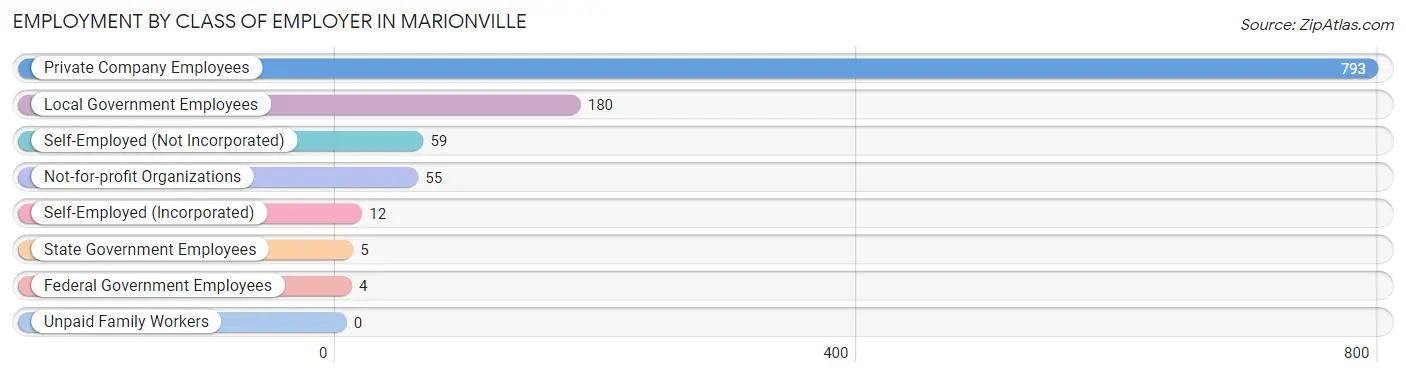
| Employer Class | # Employees | % Employees |
| Private Company Employees | 793 | 71.6% |
| Self-Employed (Incorporated) | 12 | 1.1% |
| Self-Employed (Not Incorporated) | 59 | 5.3% |
| Not-for-profit Organizations | 55 | 5.0% |
| Local Government Employees | 180 | 16.3% |
| State Government Employees | 5 | 0.4% |
| Federal Government Employees | 4 | 0.4% |
| Unpaid Family Workers | 0 | 0.0% |
| Total | 1,108 | 100.0% |
Employment Status by Age in Marionville
According to the labor force statistics for Marionville, out of the total population over 16 years of age (1,902), 66.5% or 1,265 individuals are in the labor force, with 9.9% or 125 of them unemployed. The age group with the highest labor force participation rate is 30 to 34 years, with 100.0% or 99 individuals in the labor force. Within the labor force, the 30 to 34 years age range has the highest percentage of unemployed individuals, with 42.4% or 42 of them being unemployed.
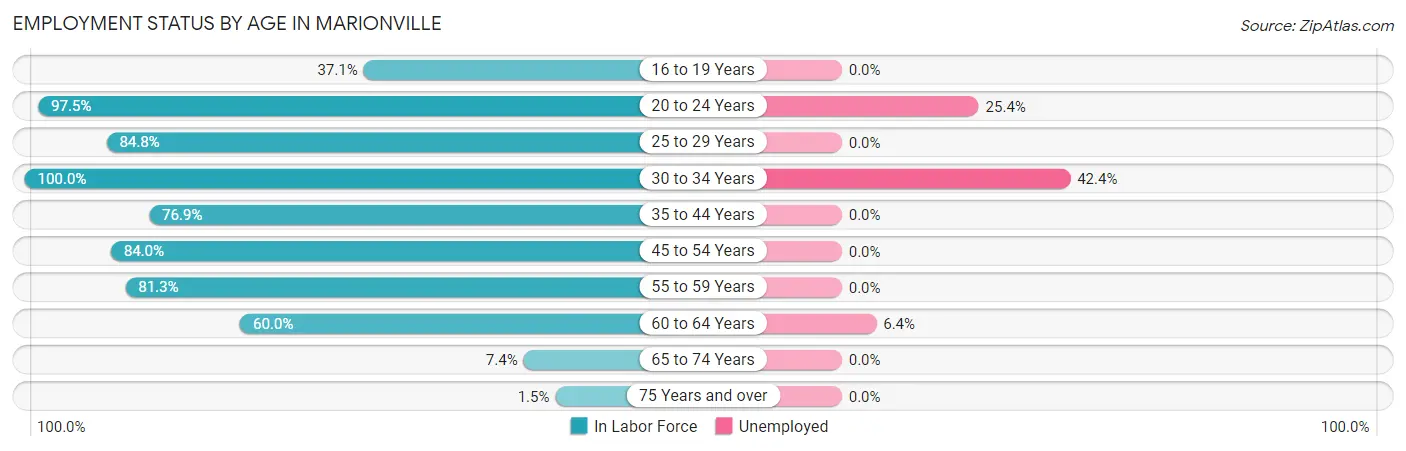
| Age Bracket | In Labor Force | Unemployed |
| 16 to 19 Years | 23 (37.1%) | 0 (0.0%) |
| 20 to 24 Years | 307 (97.5%) | 78 (25.4%) |
| 25 to 29 Years | 239 (84.8%) | 0 (0.0%) |
| 30 to 34 Years | 99 (100.0%) | 42 (42.4%) |
| 35 to 44 Years | 183 (76.9%) | 0 (0.0%) |
| 45 to 54 Years | 215 (84.0%) | 0 (0.0%) |
| 55 to 59 Years | 104 (81.3%) | 0 (0.0%) |
| 60 to 64 Years | 78 (60.0%) | 5 (6.4%) |
| 65 to 74 Years | 14 (7.4%) | 0 (0.0%) |
| 75 Years and over | 3 (1.5%) | 0 (0.0%) |
| Total | 1,265 (66.5%) | 125 (9.9%) |
Employment Status by Educational Attainment in Marionville
According to labor force statistics for Marionville, 81.0% of individuals (918) out of the total population between 25 and 64 years of age (1,133) are in the labor force, with 5.1% or 47 of them being unemployed. The group with the highest labor force participation rate are those with the educational attainment of college / associate degree, with 92.2% or 329 individuals in the labor force. Within the labor force, individuals with less than high school education have the highest percentage of unemployment, with 40.4% or 42 of them being unemployed.
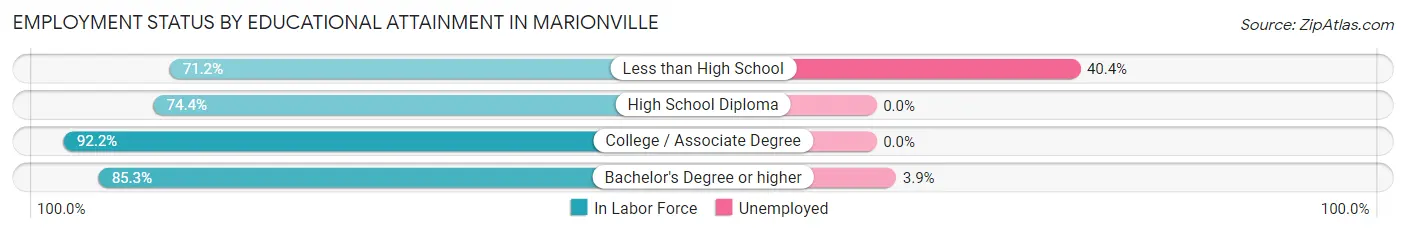
| Educational Attainment | In Labor Force | Unemployed |
| Less than High School | 104 (71.2%) | 59 (40.4%) |
| High School Diploma | 357 (74.4%) | 0 (0.0%) |
| College / Associate Degree | 329 (92.2%) | 0 (0.0%) |
| Bachelor's Degree or higher | 128 (85.3%) | 6 (3.9%) |
| Total | 918 (81.0%) | 58 (5.1%) |
Employment Occupations by Sex in Marionville
Management, Business, Science and Arts Occupations
The most common Management, Business, Science and Arts occupations in Marionville are Management (103 | 9.0%), Business & Financial (83 | 7.3%), Health Diagnosing & Treating (55 | 4.8%), Community & Social Service (44 | 3.9%), and Education Instruction & Library (31 | 2.7%).
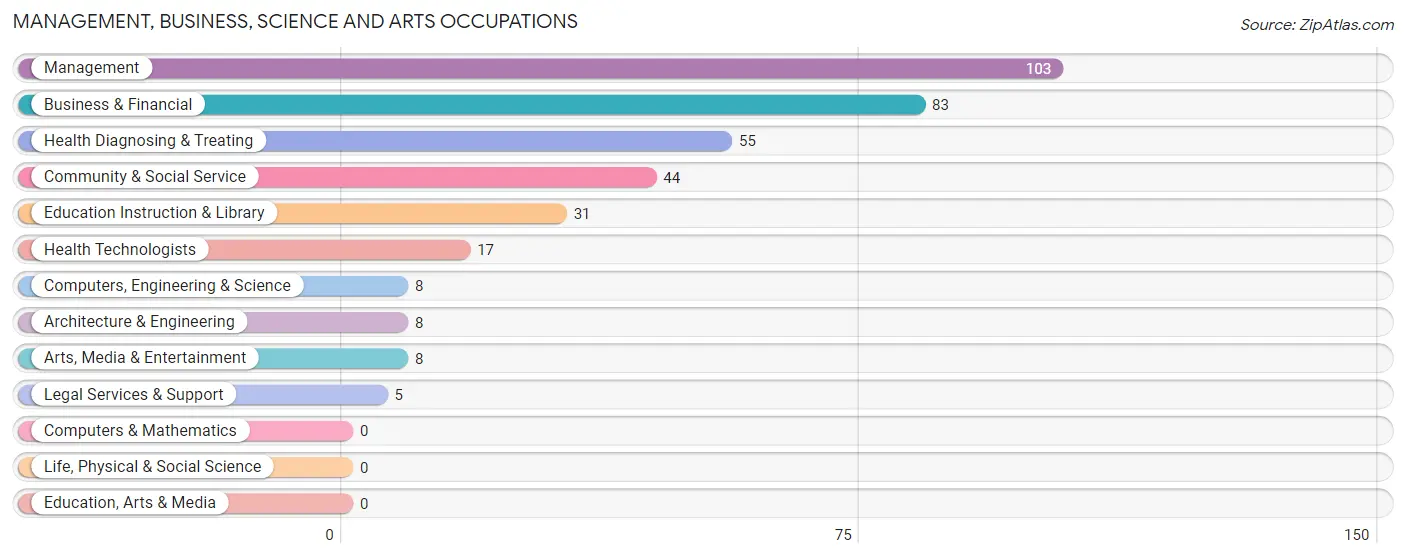
Management, Business, Science and Arts Occupations by Sex
Within the Management, Business, Science and Arts occupations in Marionville, the most male-oriented occupations are Computers, Engineering & Science (100.0%), Architecture & Engineering (100.0%), and Legal Services & Support (100.0%), while the most female-oriented occupations are Health Diagnosing & Treating (100.0%), Health Technologists (100.0%), and Business & Financial (94.0%).

| Occupation | Male | Female |
| Management | 27 (26.2%) | 76 (73.8%) |
| Business & Financial | 5 (6.0%) | 78 (94.0%) |
| Computers, Engineering & Science | 8 (100.0%) | 0 (0.0%) |
| Computers & Mathematics | 0 (0.0%) | 0 (0.0%) |
| Architecture & Engineering | 8 (100.0%) | 0 (0.0%) |
| Life, Physical & Social Science | 0 (0.0%) | 0 (0.0%) |
| Community & Social Service | 27 (61.4%) | 17 (38.6%) |
| Education, Arts & Media | 0 (0.0%) | 0 (0.0%) |
| Legal Services & Support | 5 (100.0%) | 0 (0.0%) |
| Education Instruction & Library | 14 (45.2%) | 17 (54.8%) |
| Arts, Media & Entertainment | 8 (100.0%) | 0 (0.0%) |
| Health Diagnosing & Treating | 0 (0.0%) | 55 (100.0%) |
| Health Technologists | 0 (0.0%) | 17 (100.0%) |
| Total (Category) | 67 (22.9%) | 226 (77.1%) |
| Total (Overall) | 573 (50.3%) | 567 (49.7%) |
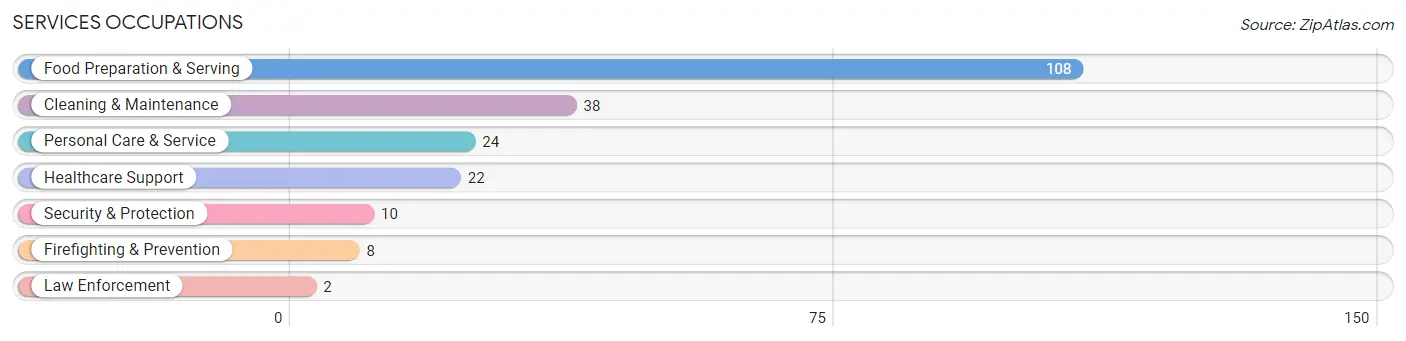
Services Occupations
The most common Services occupations in Marionville are Food Preparation & Serving (108 | 9.5%), Cleaning & Maintenance (38 | 3.3%), Personal Care & Service (24 | 2.1%), Healthcare Support (22 | 1.9%), and Security & Protection (10 | 0.9%).
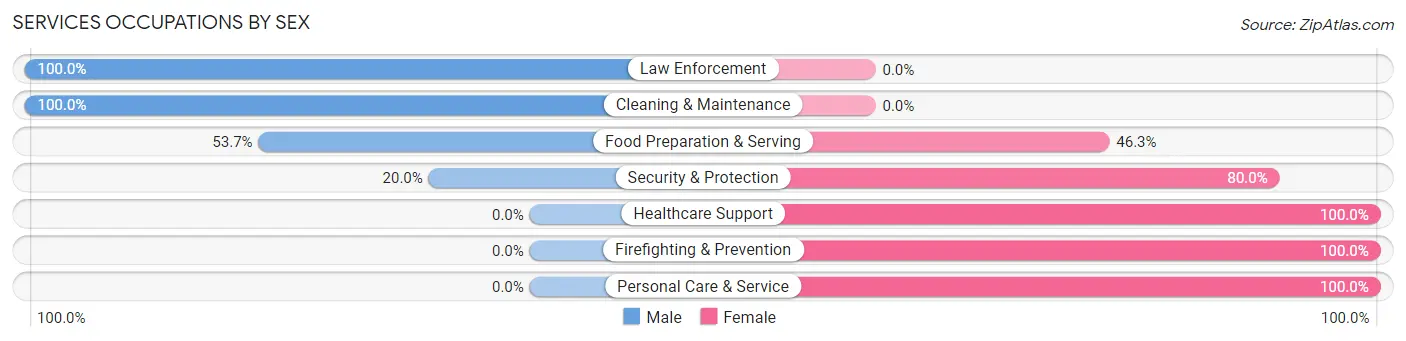
Services Occupations by Sex
Within the Services occupations in Marionville, the most male-oriented occupations are Law Enforcement (100.0%), Cleaning & Maintenance (100.0%), and Food Preparation & Serving (53.7%), while the most female-oriented occupations are Healthcare Support (100.0%), Firefighting & Prevention (100.0%), and Personal Care & Service (100.0%).
| Occupation | Male | Female |
| Healthcare Support | 0 (0.0%) | 22 (100.0%) |
| Security & Protection | 2 (20.0%) | 8 (80.0%) |
| Firefighting & Prevention | 0 (0.0%) | 8 (100.0%) |
| Law Enforcement | 2 (100.0%) | 0 (0.0%) |
| Food Preparation & Serving | 58 (53.7%) | 50 (46.3%) |
| Cleaning & Maintenance | 38 (100.0%) | 0 (0.0%) |
| Personal Care & Service | 0 (0.0%) | 24 (100.0%) |
| Total (Category) | 98 (48.5%) | 104 (51.5%) |
| Total (Overall) | 573 (50.3%) | 567 (49.7%) |
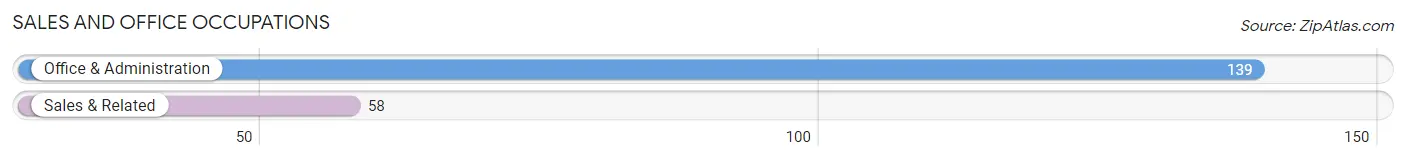
Sales and Office Occupations
The most common Sales and Office occupations in Marionville are Office & Administration (139 | 12.2%), and Sales & Related (58 | 5.1%).
Sales and Office Occupations by Sex
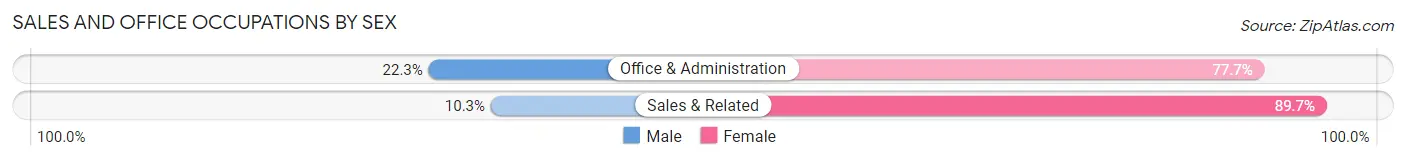
| Occupation | Male | Female |
| Sales & Related | 6 (10.3%) | 52 (89.7%) |
| Office & Administration | 31 (22.3%) | 108 (77.7%) |
| Total (Category) | 37 (18.8%) | 160 (81.2%) |
| Total (Overall) | 573 (50.3%) | 567 (49.7%) |
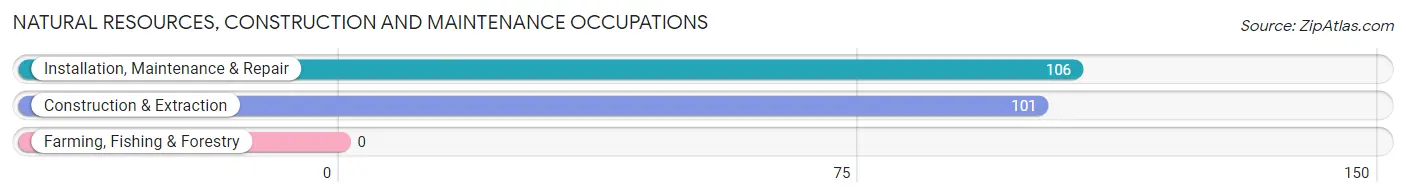
Natural Resources, Construction and Maintenance Occupations
The most common Natural Resources, Construction and Maintenance occupations in Marionville are Installation, Maintenance & Repair (106 | 9.3%), and Construction & Extraction (101 | 8.9%).
Natural Resources, Construction and Maintenance Occupations by Sex
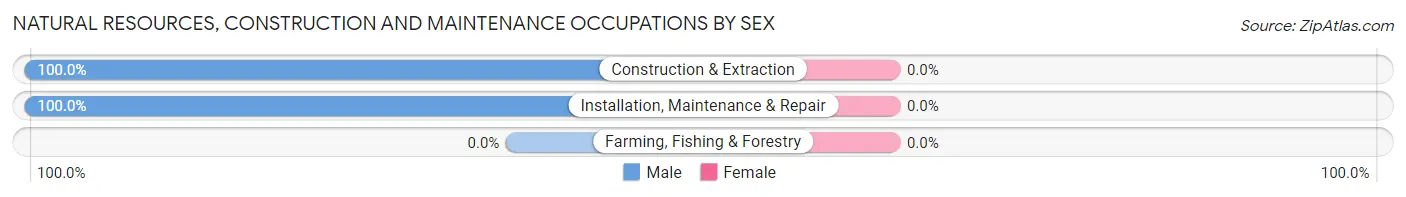
| Occupation | Male | Female |
| Farming, Fishing & Forestry | 0 (0.0%) | 0 (0.0%) |
| Construction & Extraction | 101 (100.0%) | 0 (0.0%) |
| Installation, Maintenance & Repair | 106 (100.0%) | 0 (0.0%) |
| Total (Category) | 207 (100.0%) | 0 (0.0%) |
| Total (Overall) | 573 (50.3%) | 567 (49.7%) |
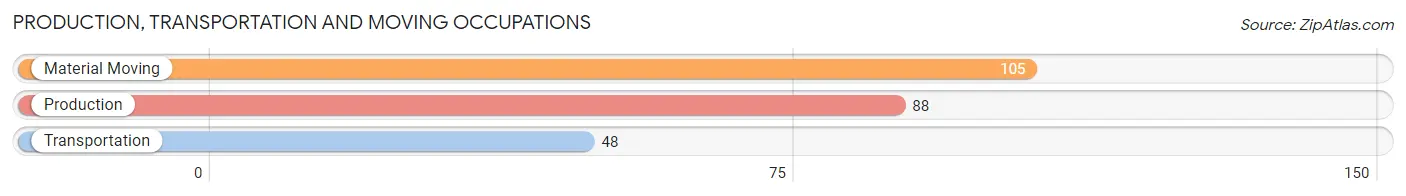
Production, Transportation and Moving Occupations
The most common Production, Transportation and Moving occupations in Marionville are Material Moving (105 | 9.2%), Production (88 | 7.7%), and Transportation (48 | 4.2%).
Production, Transportation and Moving Occupations by Sex
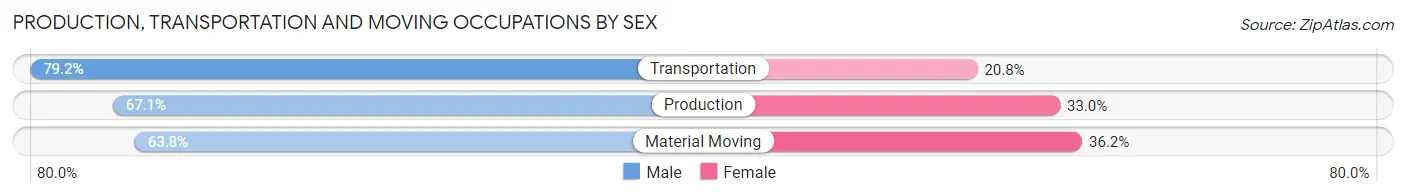
| Occupation | Male | Female |
| Production | 59 (67.0%) | 29 (33.0%) |
| Transportation | 38 (79.2%) | 10 (20.8%) |
| Material Moving | 67 (63.8%) | 38 (36.2%) |
| Total (Category) | 164 (68.0%) | 77 (32.0%) |
| Total (Overall) | 573 (50.3%) | 567 (49.7%) |
Employment Industries by Sex in Marionville
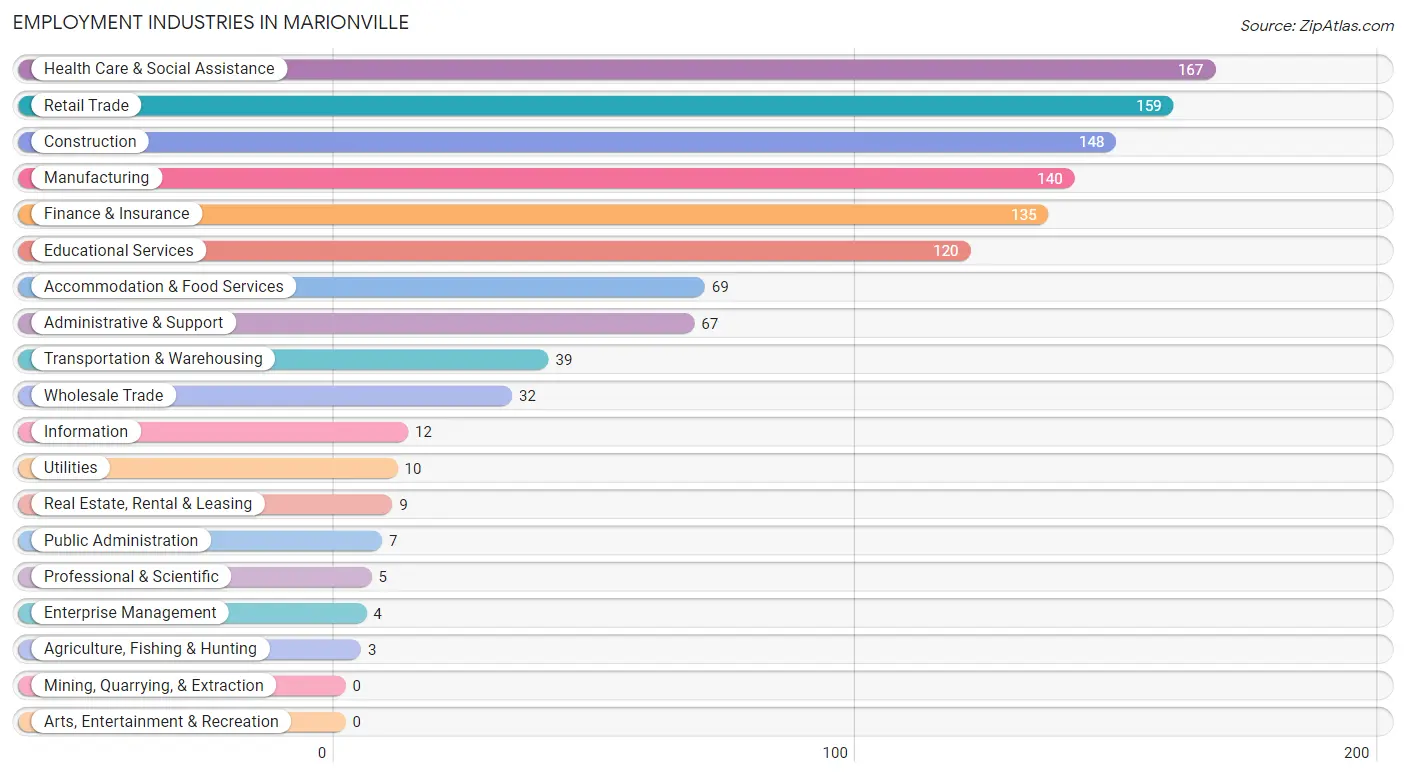
Employment Industries in Marionville
The major employment industries in Marionville include Health Care & Social Assistance (167 | 14.6%), Retail Trade (159 | 14.0%), Construction (148 | 13.0%), Manufacturing (140 | 12.3%), and Finance & Insurance (135 | 11.8%).
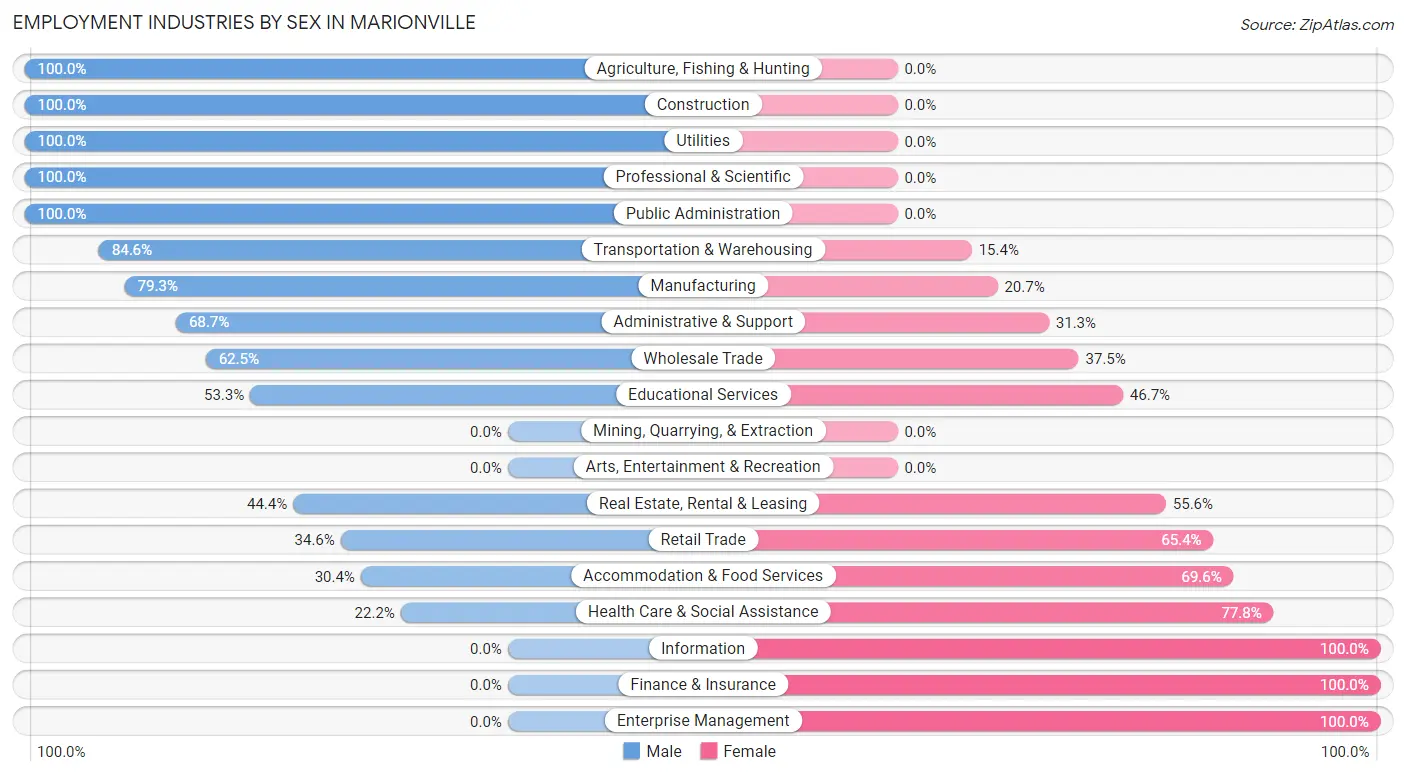
Employment Industries by Sex in Marionville
The Marionville industries that see more men than women are Agriculture, Fishing & Hunting (100.0%), Construction (100.0%), and Utilities (100.0%), whereas the industries that tend to have a higher number of women are Information (100.0%), Finance & Insurance (100.0%), and Enterprise Management (100.0%).
| Industry | Male | Female |
| Agriculture, Fishing & Hunting | 3 (100.0%) | 0 (0.0%) |
| Mining, Quarrying, & Extraction | 0 (0.0%) | 0 (0.0%) |
| Construction | 148 (100.0%) | 0 (0.0%) |
| Manufacturing | 111 (79.3%) | 29 (20.7%) |
| Wholesale Trade | 20 (62.5%) | 12 (37.5%) |
| Retail Trade | 55 (34.6%) | 104 (65.4%) |
| Transportation & Warehousing | 33 (84.6%) | 6 (15.4%) |
| Utilities | 10 (100.0%) | 0 (0.0%) |
| Information | 0 (0.0%) | 12 (100.0%) |
| Finance & Insurance | 0 (0.0%) | 135 (100.0%) |
| Real Estate, Rental & Leasing | 4 (44.4%) | 5 (55.6%) |
| Professional & Scientific | 5 (100.0%) | 0 (0.0%) |
| Enterprise Management | 0 (0.0%) | 4 (100.0%) |
| Administrative & Support | 46 (68.7%) | 21 (31.3%) |
| Educational Services | 64 (53.3%) | 56 (46.7%) |
| Health Care & Social Assistance | 37 (22.2%) | 130 (77.8%) |
| Arts, Entertainment & Recreation | 0 (0.0%) | 0 (0.0%) |
| Accommodation & Food Services | 21 (30.4%) | 48 (69.6%) |
| Public Administration | 7 (100.0%) | 0 (0.0%) |
| Total | 573 (50.3%) | 567 (49.7%) |
Education in Marionville
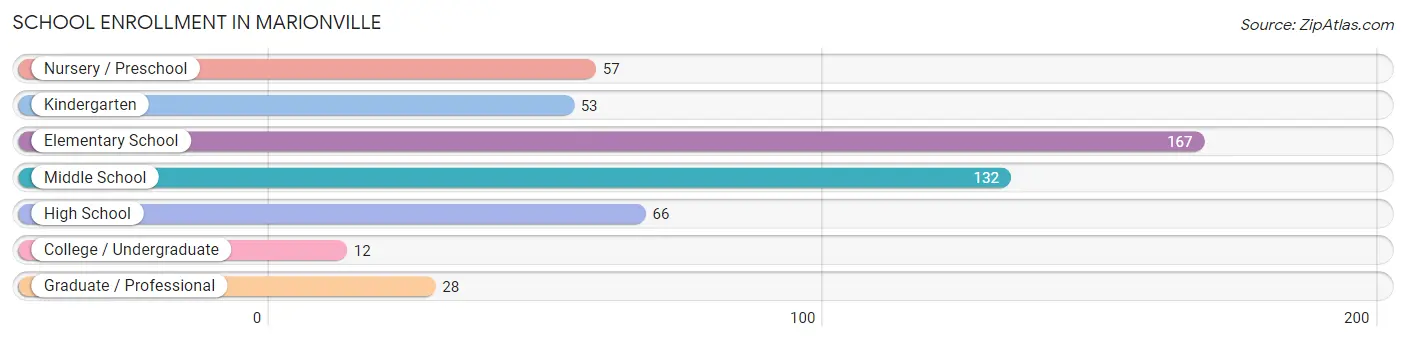
School Enrollment in Marionville
The most common levels of schooling among the 515 students in Marionville are elementary school (167 | 32.4%), middle school (132 | 25.6%), and high school (66 | 12.8%).
| School Level | # Students | % Students |
| Nursery / Preschool | 57 | 11.1% |
| Kindergarten | 53 | 10.3% |
| Elementary School | 167 | 32.4% |
| Middle School | 132 | 25.6% |
| High School | 66 | 12.8% |
| College / Undergraduate | 12 | 2.3% |
| Graduate / Professional | 28 | 5.4% |
| Total | 515 | 100.0% |
School Enrollment by Age by Funding Source in Marionville
Out of a total of 515 students who are enrolled in schools in Marionville, 32 (6.2%) attend a private institution, while the remaining 483 (93.8%) are enrolled in public schools. The age group of 35 years and over has the highest likelihood of being enrolled in private schools, with 7 (100.0% in the age bracket) enrolled. Conversely, the age group of 3 to 4 year olds has the lowest likelihood of being enrolled in a private school, with 47 (100.0% in the age bracket) attending a public institution.
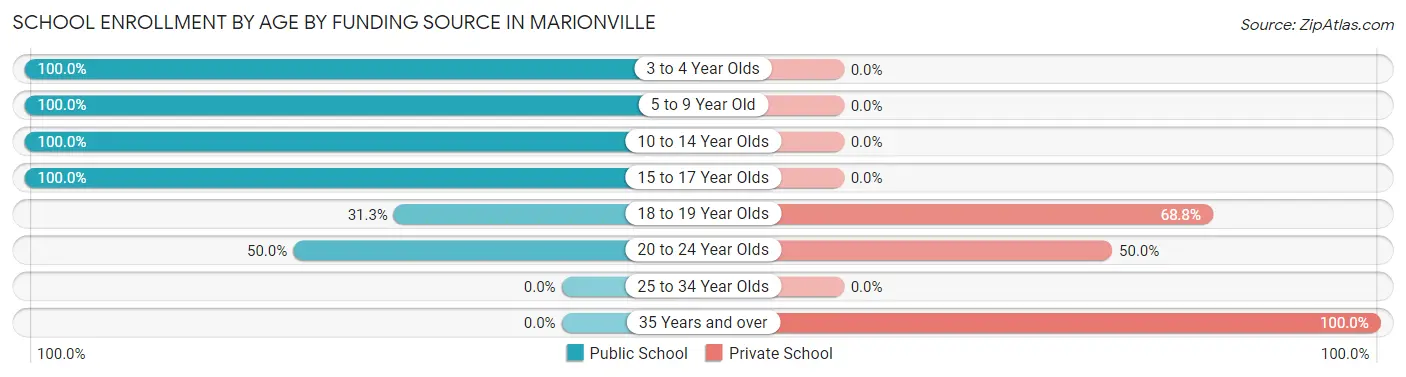
| Age Bracket | Public School | Private School |
| 3 to 4 Year Olds | 47 (100.0%) | 0 (0.0%) |
| 5 to 9 Year Old | 129 (100.0%) | 0 (0.0%) |
| 10 to 14 Year Olds | 233 (100.0%) | 0 (0.0%) |
| 15 to 17 Year Olds | 55 (100.0%) | 0 (0.0%) |
| 18 to 19 Year Olds | 5 (31.2%) | 11 (68.8%) |
| 20 to 24 Year Olds | 14 (50.0%) | 14 (50.0%) |
| 25 to 34 Year Olds | 0 (0.0%) | 0 (0.0%) |
| 35 Years and over | 0 (0.0%) | 7 (100.0%) |
| Total | 483 (93.8%) | 32 (6.2%) |
Educational Attainment by Field of Study in Marionville
Education (78 | 32.2%), business (60 | 24.8%), science & technology (26 | 10.7%), communications (17 | 7.0%), and social sciences (14 | 5.8%) are the most common fields of study among 242 individuals in Marionville who have obtained a bachelor's degree or higher.
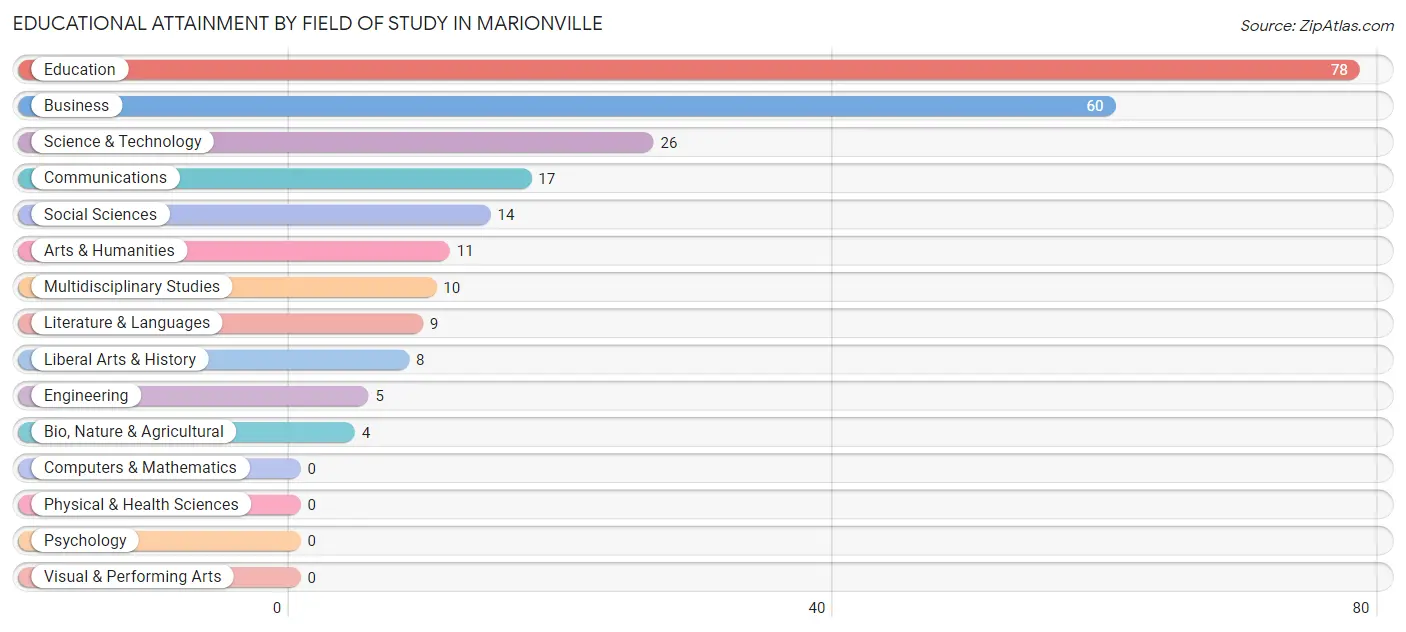
| Field of Study | # Graduates | % Graduates |
| Computers & Mathematics | 0 | 0.0% |
| Bio, Nature & Agricultural | 4 | 1.7% |
| Physical & Health Sciences | 0 | 0.0% |
| Psychology | 0 | 0.0% |
| Social Sciences | 14 | 5.8% |
| Engineering | 5 | 2.1% |
| Multidisciplinary Studies | 10 | 4.1% |
| Science & Technology | 26 | 10.7% |
| Business | 60 | 24.8% |
| Education | 78 | 32.2% |
| Literature & Languages | 9 | 3.7% |
| Liberal Arts & History | 8 | 3.3% |
| Visual & Performing Arts | 0 | 0.0% |
| Communications | 17 | 7.0% |
| Arts & Humanities | 11 | 4.5% |
| Total | 242 | 100.0% |
Transportation & Commute in Marionville
Vehicle Availability by Sex in Marionville
The most prevalent vehicle ownership categories in Marionville are males with 2 vehicles (226, accounting for 39.4%) and females with 2 vehicles (198, making up 42.2%).
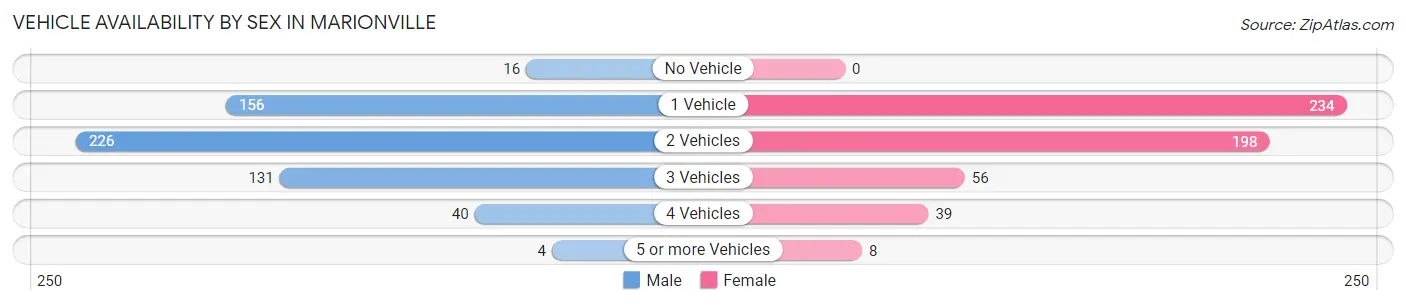
| Vehicles Available | Male | Female |
| No Vehicle | 16 (2.8%) | 0 (0.0%) |
| 1 Vehicle | 156 (27.2%) | 234 (43.7%) |
| 2 Vehicles | 226 (39.4%) | 198 (37.0%) |
| 3 Vehicles | 131 (22.9%) | 56 (10.5%) |
| 4 Vehicles | 40 (7.0%) | 39 (7.3%) |
| 5 or more Vehicles | 4 (0.7%) | 8 (1.5%) |
| Total | 573 (100.0%) | 535 (100.0%) |
Commute Time in Marionville
The most frequently occuring commute durations in Marionville are 5 to 9 minutes (294 commuters, 27.5%), 10 to 14 minutes (132 commuters, 12.3%), and 20 to 24 minutes (100 commuters, 9.3%).
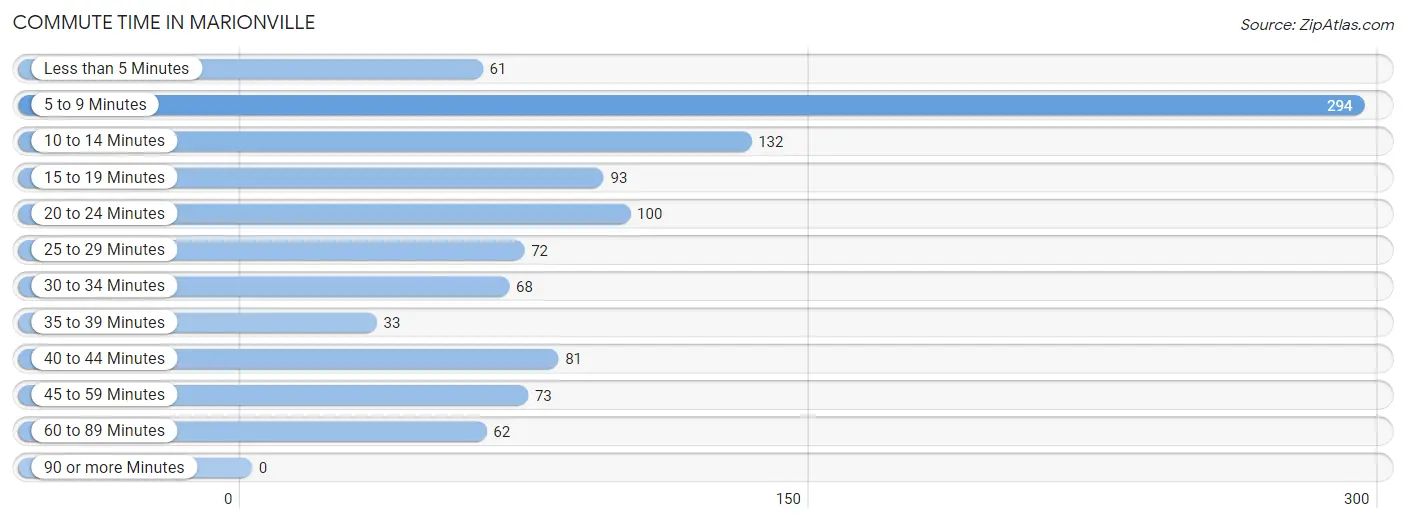
| Commute Time | # Commuters | % Commuters |
| Less than 5 Minutes | 61 | 5.7% |
| 5 to 9 Minutes | 294 | 27.5% |
| 10 to 14 Minutes | 132 | 12.3% |
| 15 to 19 Minutes | 93 | 8.7% |
| 20 to 24 Minutes | 100 | 9.3% |
| 25 to 29 Minutes | 72 | 6.7% |
| 30 to 34 Minutes | 68 | 6.4% |
| 35 to 39 Minutes | 33 | 3.1% |
| 40 to 44 Minutes | 81 | 7.6% |
| 45 to 59 Minutes | 73 | 6.8% |
| 60 to 89 Minutes | 62 | 5.8% |
| 90 or more Minutes | 0 | 0.0% |
Commute Time by Sex in Marionville
The most common commute times in Marionville are 5 to 9 minutes (144 commuters, 26.4%) for males and 5 to 9 minutes (150 commuters, 28.7%) for females.
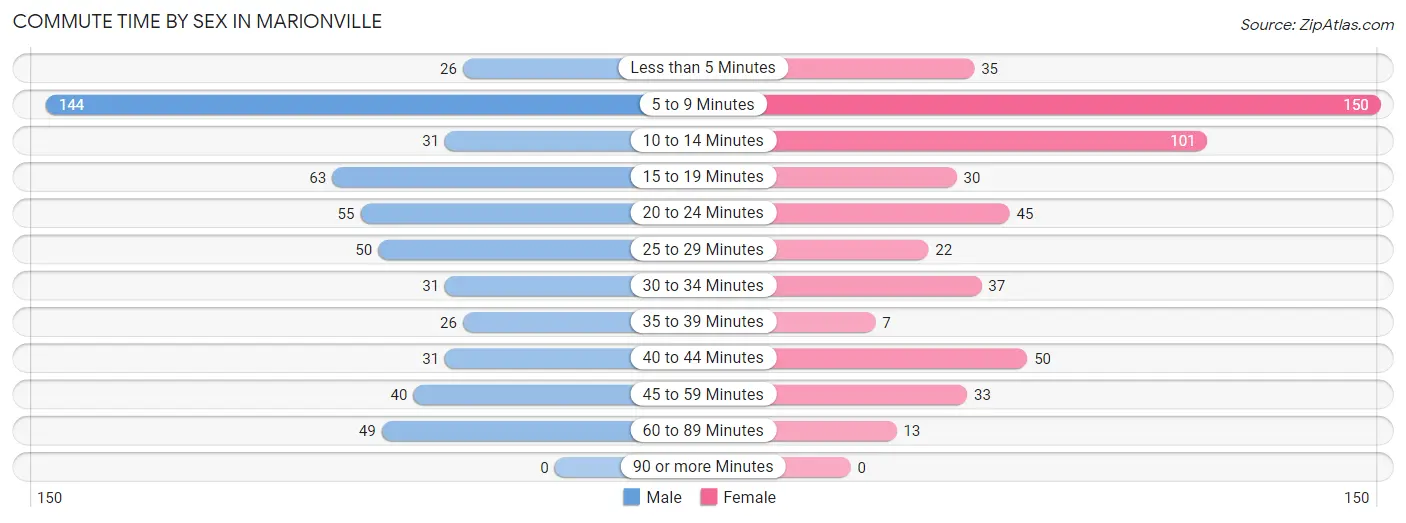
| Commute Time | Male | Female |
| Less than 5 Minutes | 26 (4.8%) | 35 (6.7%) |
| 5 to 9 Minutes | 144 (26.4%) | 150 (28.7%) |
| 10 to 14 Minutes | 31 (5.7%) | 101 (19.3%) |
| 15 to 19 Minutes | 63 (11.5%) | 30 (5.7%) |
| 20 to 24 Minutes | 55 (10.1%) | 45 (8.6%) |
| 25 to 29 Minutes | 50 (9.2%) | 22 (4.2%) |
| 30 to 34 Minutes | 31 (5.7%) | 37 (7.1%) |
| 35 to 39 Minutes | 26 (4.8%) | 7 (1.3%) |
| 40 to 44 Minutes | 31 (5.7%) | 50 (9.6%) |
| 45 to 59 Minutes | 40 (7.3%) | 33 (6.3%) |
| 60 to 89 Minutes | 49 (9.0%) | 13 (2.5%) |
| 90 or more Minutes | 0 (0.0%) | 0 (0.0%) |
Time of Departure to Work by Sex in Marionville
The most frequent times of departure to work in Marionville are 6:30 AM to 6:59 AM (130, 23.8%) for males and 7:30 AM to 7:59 AM (117, 22.4%) for females.
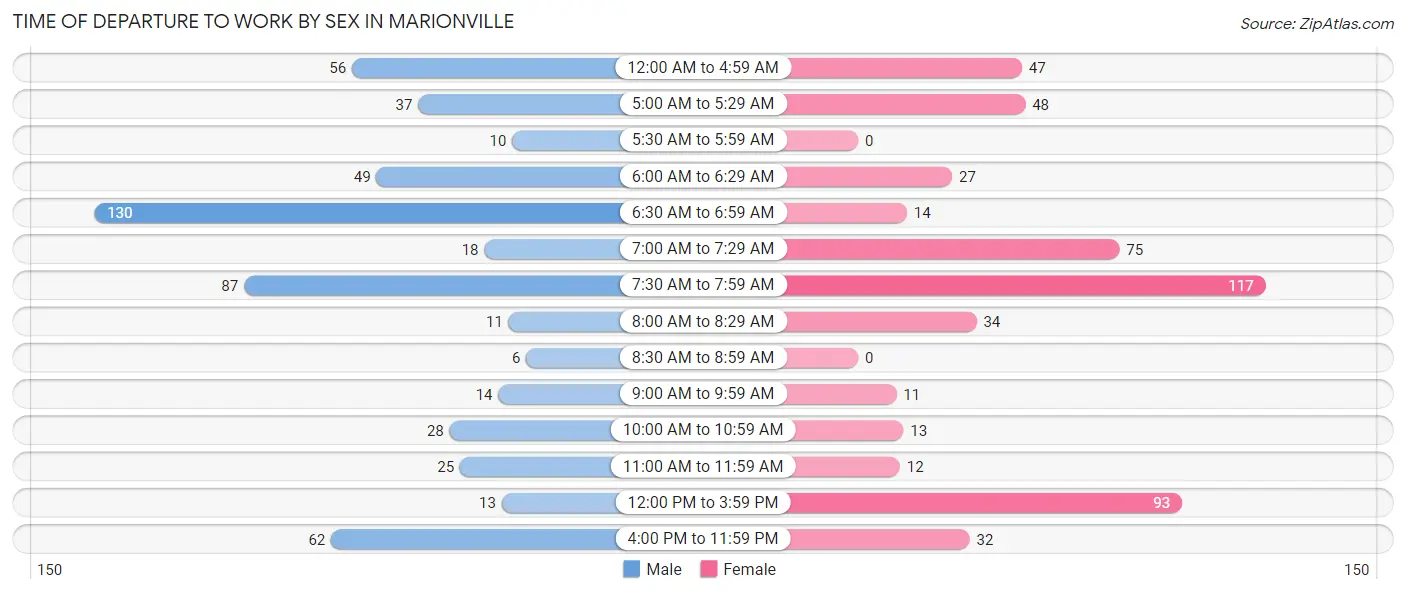
| Time of Departure | Male | Female |
| 12:00 AM to 4:59 AM | 56 (10.3%) | 47 (9.0%) |
| 5:00 AM to 5:29 AM | 37 (6.8%) | 48 (9.2%) |
| 5:30 AM to 5:59 AM | 10 (1.8%) | 0 (0.0%) |
| 6:00 AM to 6:29 AM | 49 (9.0%) | 27 (5.2%) |
| 6:30 AM to 6:59 AM | 130 (23.8%) | 14 (2.7%) |
| 7:00 AM to 7:29 AM | 18 (3.3%) | 75 (14.3%) |
| 7:30 AM to 7:59 AM | 87 (15.9%) | 117 (22.4%) |
| 8:00 AM to 8:29 AM | 11 (2.0%) | 34 (6.5%) |
| 8:30 AM to 8:59 AM | 6 (1.1%) | 0 (0.0%) |
| 9:00 AM to 9:59 AM | 14 (2.6%) | 11 (2.1%) |
| 10:00 AM to 10:59 AM | 28 (5.1%) | 13 (2.5%) |
| 11:00 AM to 11:59 AM | 25 (4.6%) | 12 (2.3%) |
| 12:00 PM to 3:59 PM | 13 (2.4%) | 93 (17.8%) |
| 4:00 PM to 11:59 PM | 62 (11.4%) | 32 (6.1%) |
| Total | 546 (100.0%) | 523 (100.0%) |
Housing Occupancy in Marionville
Occupancy by Ownership in Marionville
Of the total 985 dwellings in Marionville, owner-occupied units account for 465 (47.2%), while renter-occupied units make up 520 (52.8%).
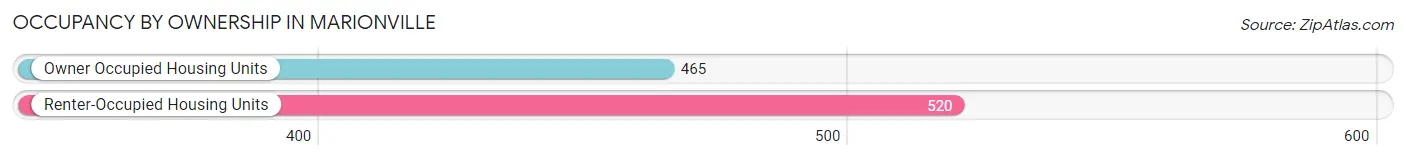
| Occupancy | # Housing Units | % Housing Units |
| Owner Occupied Housing Units | 465 | 47.2% |
| Renter-Occupied Housing Units | 520 | 52.8% |
| Total Occupied Housing Units | 985 | 100.0% |
Occupancy by Household Size in Marionville
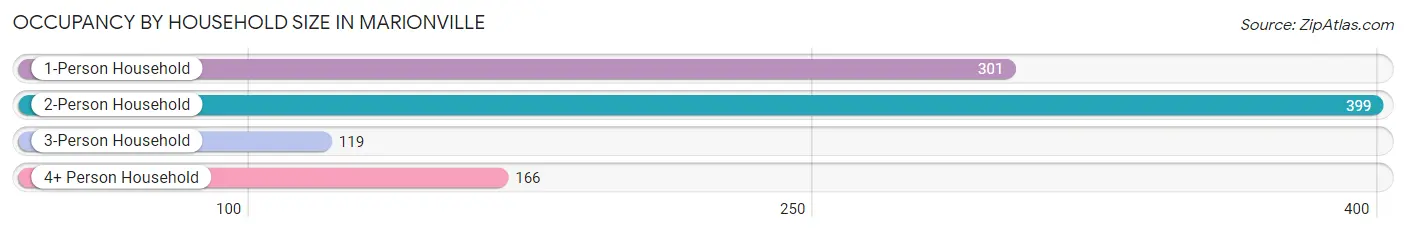
| Household Size | # Housing Units | % Housing Units |
| 1-Person Household | 301 | 30.6% |
| 2-Person Household | 399 | 40.5% |
| 3-Person Household | 119 | 12.1% |
| 4+ Person Household | 166 | 16.9% |
| Total Housing Units | 985 | 100.0% |
Occupancy by Ownership by Household Size in Marionville
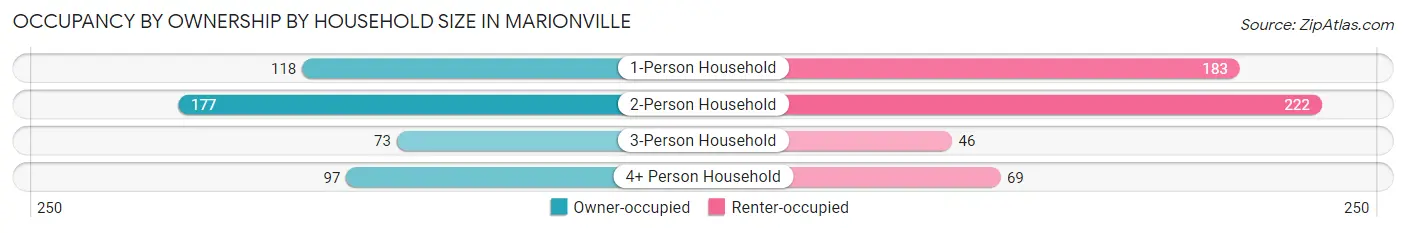
| Household Size | Owner-occupied | Renter-occupied |
| 1-Person Household | 118 (39.2%) | 183 (60.8%) |
| 2-Person Household | 177 (44.4%) | 222 (55.6%) |
| 3-Person Household | 73 (61.3%) | 46 (38.7%) |
| 4+ Person Household | 97 (58.4%) | 69 (41.6%) |
| Total Housing Units | 465 (47.2%) | 520 (52.8%) |
Occupancy by Educational Attainment in Marionville
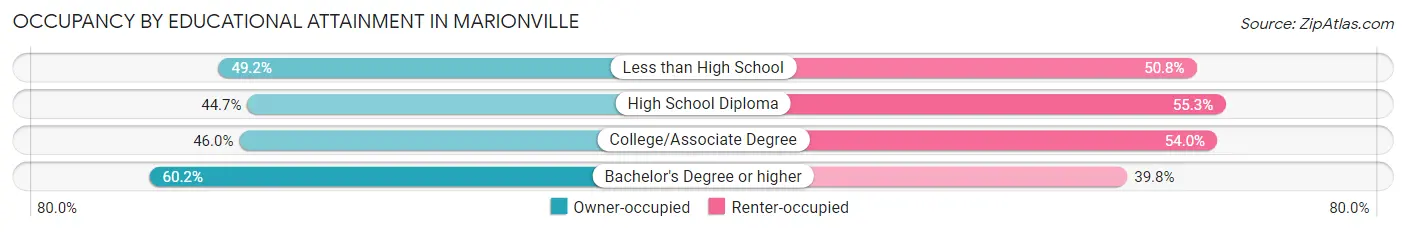
| Household Size | Owner-occupied | Renter-occupied |
| Less than High School | 32 (49.2%) | 33 (50.8%) |
| High School Diploma | 231 (44.7%) | 286 (55.3%) |
| College/Associate Degree | 131 (46.0%) | 154 (54.0%) |
| Bachelor's Degree or higher | 71 (60.2%) | 47 (39.8%) |
Occupancy by Age of Householder in Marionville
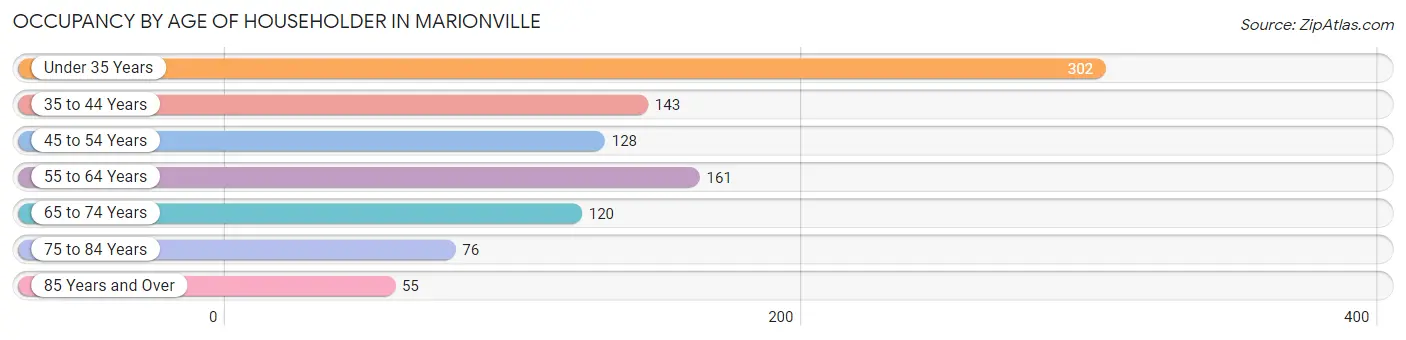
| Age Bracket | # Households | % Households |
| Under 35 Years | 302 | 30.7% |
| 35 to 44 Years | 143 | 14.5% |
| 45 to 54 Years | 128 | 13.0% |
| 55 to 64 Years | 161 | 16.4% |
| 65 to 74 Years | 120 | 12.2% |
| 75 to 84 Years | 76 | 7.7% |
| 85 Years and Over | 55 | 5.6% |
| Total | 985 | 100.0% |
Housing Finances in Marionville
Median Income by Occupancy in Marionville
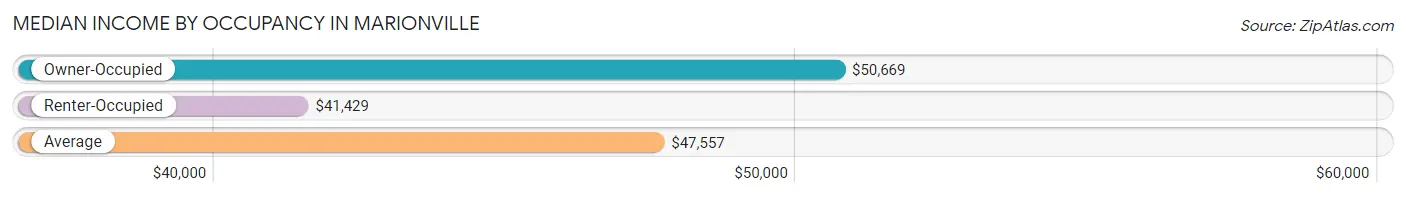
| Occupancy Type | # Households | Median Income |
| Owner-Occupied | 465 (47.2%) | $50,669 |
| Renter-Occupied | 520 (52.8%) | $41,429 |
| Average | 985 (100.0%) | $47,557 |
Occupancy by Householder Income Bracket in Marionville
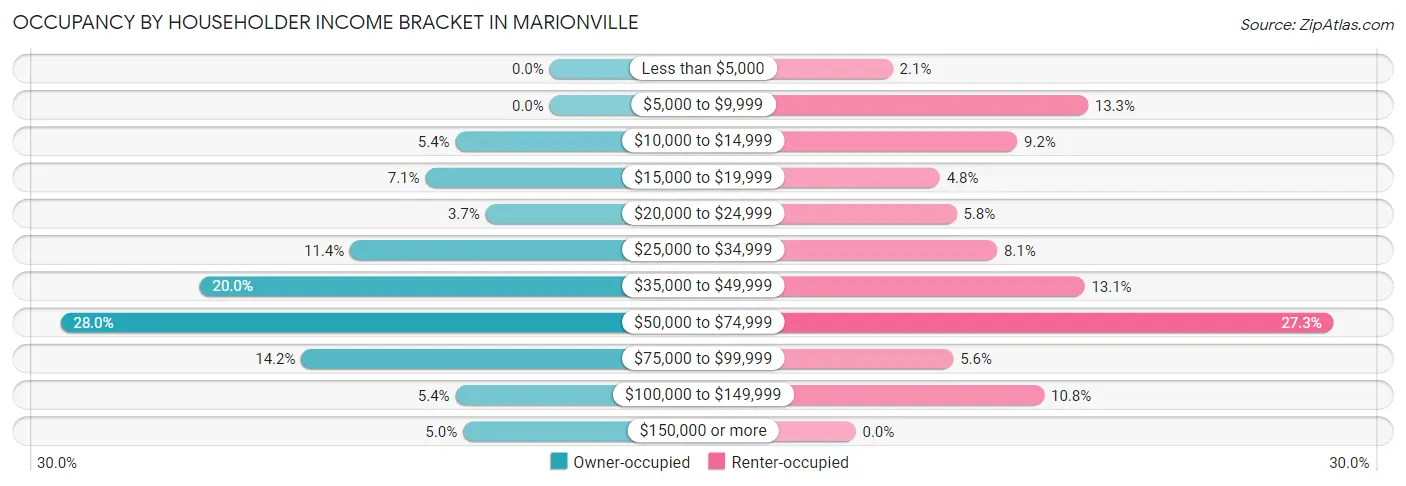
| Income Bracket | Owner-occupied | Renter-occupied |
| Less than $5,000 | 0 (0.0%) | 11 (2.1%) |
| $5,000 to $9,999 | 0 (0.0%) | 69 (13.3%) |
| $10,000 to $14,999 | 25 (5.4%) | 48 (9.2%) |
| $15,000 to $19,999 | 33 (7.1%) | 25 (4.8%) |
| $20,000 to $24,999 | 17 (3.7%) | 30 (5.8%) |
| $25,000 to $34,999 | 53 (11.4%) | 42 (8.1%) |
| $35,000 to $49,999 | 93 (20.0%) | 68 (13.1%) |
| $50,000 to $74,999 | 130 (28.0%) | 142 (27.3%) |
| $75,000 to $99,999 | 66 (14.2%) | 29 (5.6%) |
| $100,000 to $149,999 | 25 (5.4%) | 56 (10.8%) |
| $150,000 or more | 23 (5.0%) | 0 (0.0%) |
| Total | 465 (100.0%) | 520 (100.0%) |
Monthly Housing Cost Tiers in Marionville
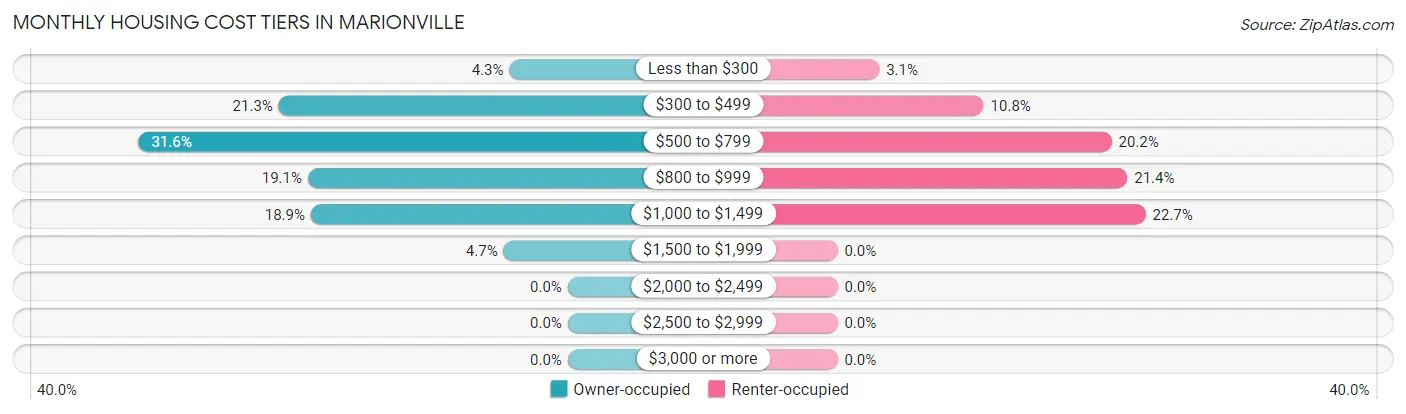
| Monthly Cost | Owner-occupied | Renter-occupied |
| Less than $300 | 20 (4.3%) | 16 (3.1%) |
| $300 to $499 | 99 (21.3%) | 56 (10.8%) |
| $500 to $799 | 147 (31.6%) | 105 (20.2%) |
| $800 to $999 | 89 (19.1%) | 111 (21.3%) |
| $1,000 to $1,499 | 88 (18.9%) | 118 (22.7%) |
| $1,500 to $1,999 | 22 (4.7%) | 0 (0.0%) |
| $2,000 to $2,499 | 0 (0.0%) | 0 (0.0%) |
| $2,500 to $2,999 | 0 (0.0%) | 0 (0.0%) |
| $3,000 or more | 0 (0.0%) | 0 (0.0%) |
| Total | 465 (100.0%) | 520 (100.0%) |
Physical Housing Characteristics in Marionville
Housing Structures in Marionville
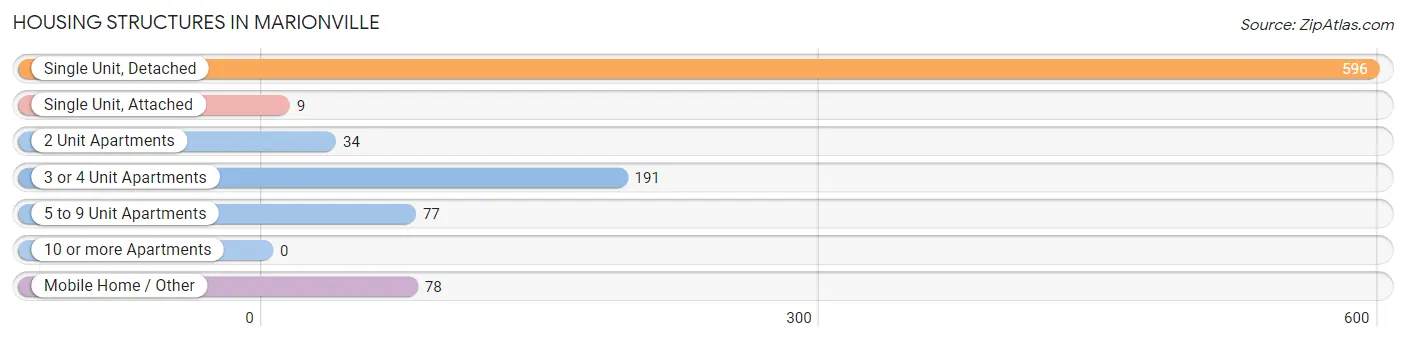
| Structure Type | # Housing Units | % Housing Units |
| Single Unit, Detached | 596 | 60.5% |
| Single Unit, Attached | 9 | 0.9% |
| 2 Unit Apartments | 34 | 3.5% |
| 3 or 4 Unit Apartments | 191 | 19.4% |
| 5 to 9 Unit Apartments | 77 | 7.8% |
| 10 or more Apartments | 0 | 0.0% |
| Mobile Home / Other | 78 | 7.9% |
| Total | 985 | 100.0% |
Housing Structures by Occupancy in Marionville
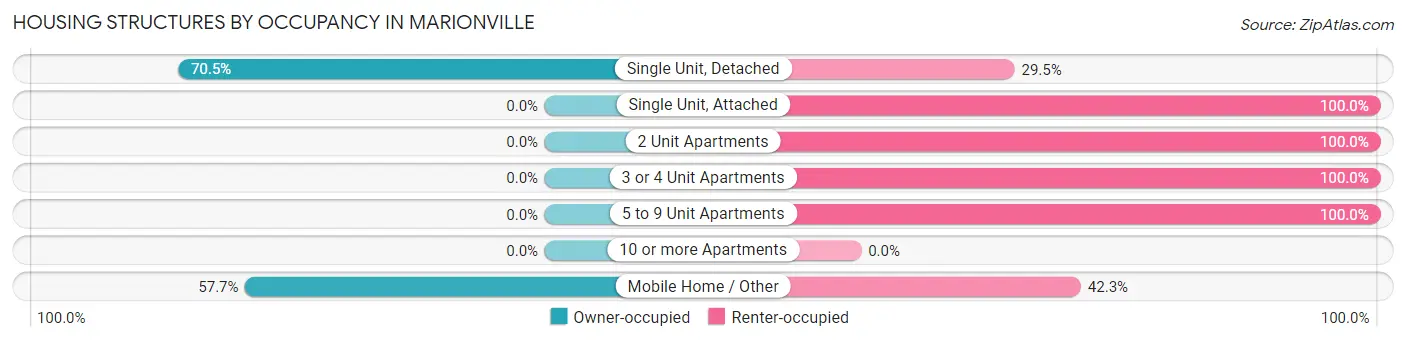
| Structure Type | Owner-occupied | Renter-occupied |
| Single Unit, Detached | 420 (70.5%) | 176 (29.5%) |
| Single Unit, Attached | 0 (0.0%) | 9 (100.0%) |
| 2 Unit Apartments | 0 (0.0%) | 34 (100.0%) |
| 3 or 4 Unit Apartments | 0 (0.0%) | 191 (100.0%) |
| 5 to 9 Unit Apartments | 0 (0.0%) | 77 (100.0%) |
| 10 or more Apartments | 0 (0.0%) | 0 (0.0%) |
| Mobile Home / Other | 45 (57.7%) | 33 (42.3%) |
| Total | 465 (47.2%) | 520 (52.8%) |
Housing Structures by Number of Rooms in Marionville
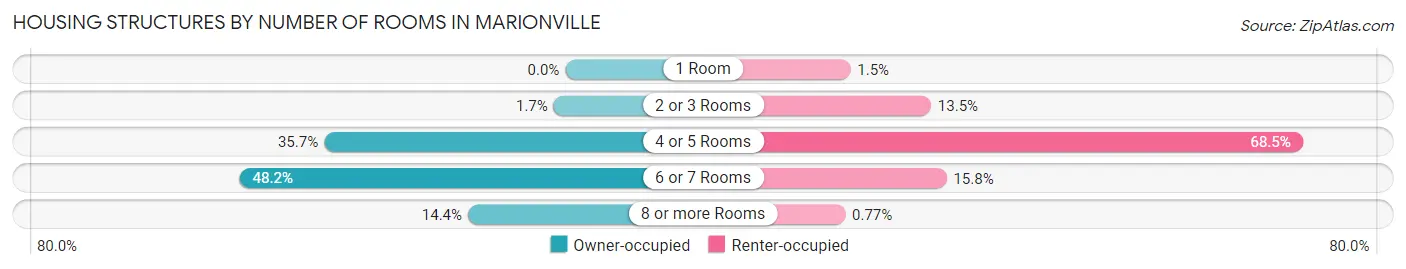
| Number of Rooms | Owner-occupied | Renter-occupied |
| 1 Room | 0 (0.0%) | 8 (1.5%) |
| 2 or 3 Rooms | 8 (1.7%) | 70 (13.5%) |
| 4 or 5 Rooms | 166 (35.7%) | 356 (68.5%) |
| 6 or 7 Rooms | 224 (48.2%) | 82 (15.8%) |
| 8 or more Rooms | 67 (14.4%) | 4 (0.8%) |
| Total | 465 (100.0%) | 520 (100.0%) |
Housing Structure by Heating Type in Marionville
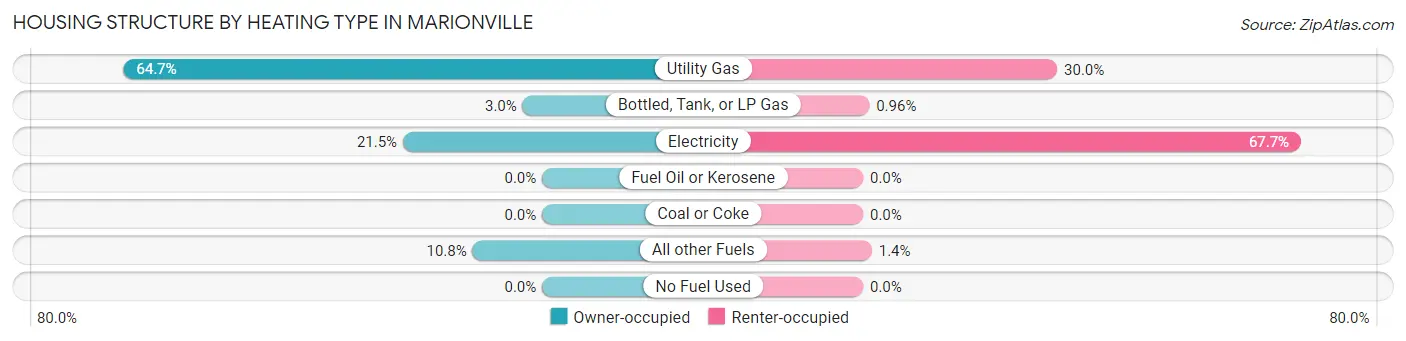
| Heating Type | Owner-occupied | Renter-occupied |
| Utility Gas | 301 (64.7%) | 156 (30.0%) |
| Bottled, Tank, or LP Gas | 14 (3.0%) | 5 (1.0%) |
| Electricity | 100 (21.5%) | 352 (67.7%) |
| Fuel Oil or Kerosene | 0 (0.0%) | 0 (0.0%) |
| Coal or Coke | 0 (0.0%) | 0 (0.0%) |
| All other Fuels | 50 (10.7%) | 7 (1.3%) |
| No Fuel Used | 0 (0.0%) | 0 (0.0%) |
| Total | 465 (100.0%) | 520 (100.0%) |
Household Vehicle Usage in Marionville
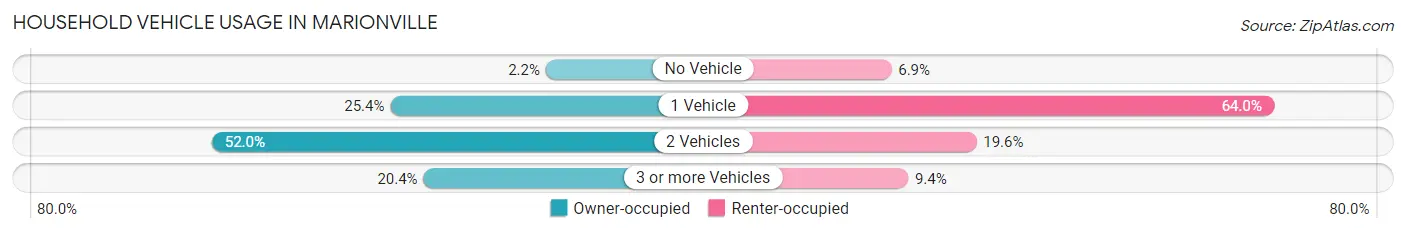
| Vehicles per Household | Owner-occupied | Renter-occupied |
| No Vehicle | 10 (2.1%) | 36 (6.9%) |
| 1 Vehicle | 118 (25.4%) | 333 (64.0%) |
| 2 Vehicles | 242 (52.0%) | 102 (19.6%) |
| 3 or more Vehicles | 95 (20.4%) | 49 (9.4%) |
| Total | 465 (100.0%) | 520 (100.0%) |
Real Estate & Mortgages in Marionville
Real Estate and Mortgage Overview in Marionville
| Characteristic | Without Mortgage | With Mortgage |
| Housing Units | 200 | 265 |
| Median Property Value | $104,200 | $122,400 |
| Median Household Income | $46,000 | $13 |
| Monthly Housing Costs | $471 | $0 |
| Real Estate Taxes | $724 | $20 |
Property Value by Mortgage Status in Marionville
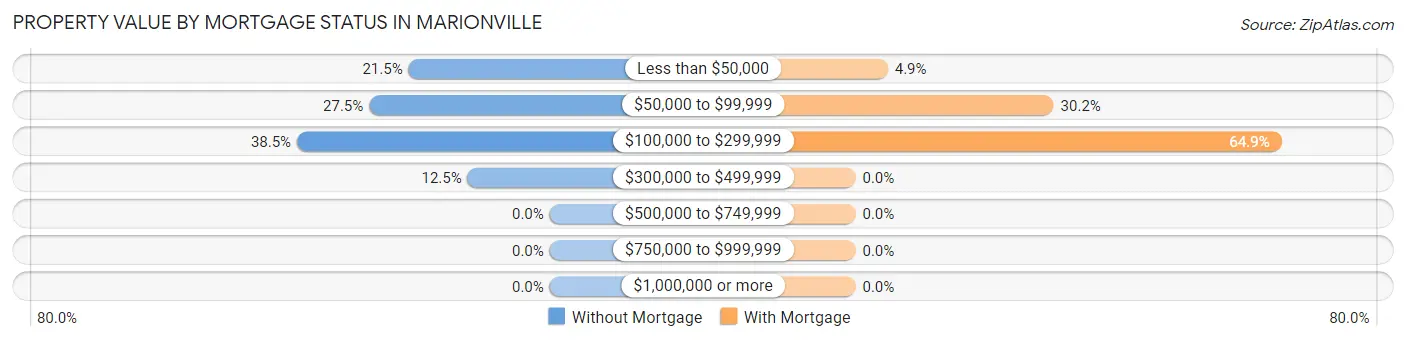
| Property Value | Without Mortgage | With Mortgage |
| Less than $50,000 | 43 (21.5%) | 13 (4.9%) |
| $50,000 to $99,999 | 55 (27.5%) | 80 (30.2%) |
| $100,000 to $299,999 | 77 (38.5%) | 172 (64.9%) |
| $300,000 to $499,999 | 25 (12.5%) | 0 (0.0%) |
| $500,000 to $749,999 | 0 (0.0%) | 0 (0.0%) |
| $750,000 to $999,999 | 0 (0.0%) | 0 (0.0%) |
| $1,000,000 or more | 0 (0.0%) | 0 (0.0%) |
| Total | 200 (100.0%) | 265 (100.0%) |
Household Income by Mortgage Status in Marionville
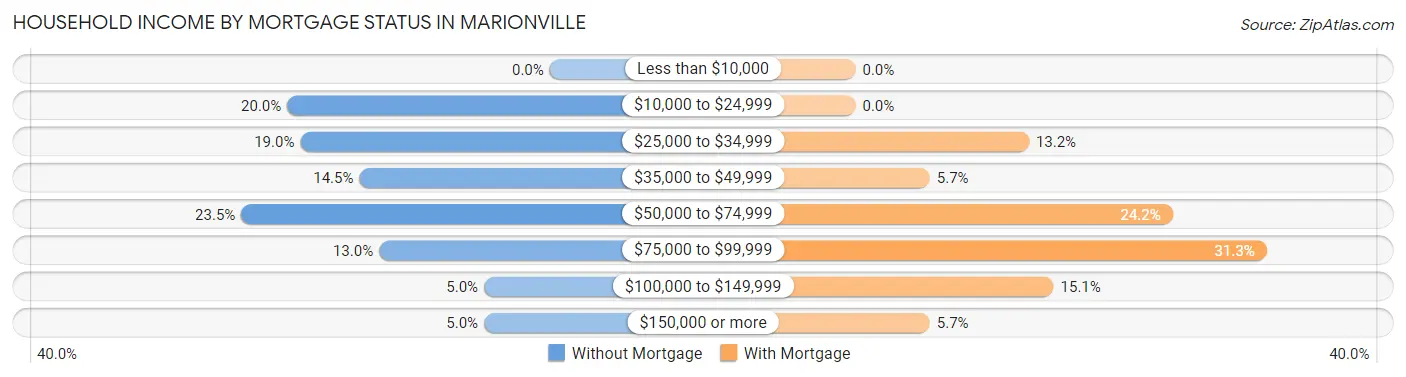
| Household Income | Without Mortgage | With Mortgage |
| Less than $10,000 | 0 (0.0%) | 0 (0.0%) |
| $10,000 to $24,999 | 40 (20.0%) | 0 (0.0%) |
| $25,000 to $34,999 | 38 (19.0%) | 35 (13.2%) |
| $35,000 to $49,999 | 29 (14.5%) | 15 (5.7%) |
| $50,000 to $74,999 | 47 (23.5%) | 64 (24.1%) |
| $75,000 to $99,999 | 26 (13.0%) | 83 (31.3%) |
| $100,000 to $149,999 | 10 (5.0%) | 40 (15.1%) |
| $150,000 or more | 10 (5.0%) | 15 (5.7%) |
| Total | 200 (100.0%) | 265 (100.0%) |
Property Value to Household Income Ratio in Marionville
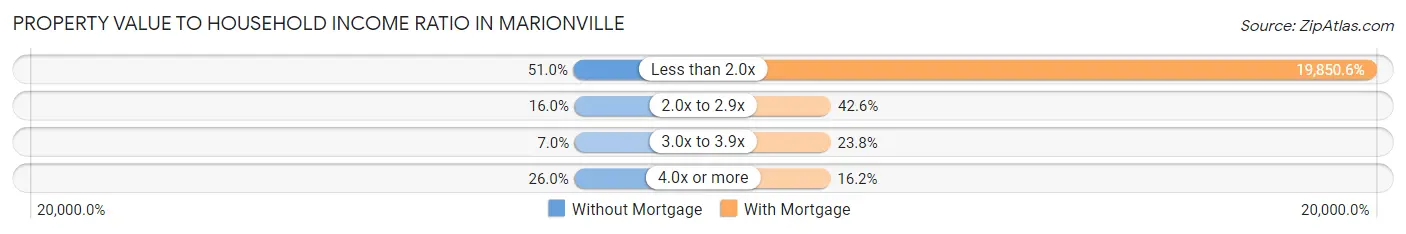
| Value-to-Income Ratio | Without Mortgage | With Mortgage |
| Less than 2.0x | 102 (51.0%) | 52,604 (19,850.6%) |
| 2.0x to 2.9x | 32 (16.0%) | 113 (42.6%) |
| 3.0x to 3.9x | 14 (7.0%) | 63 (23.8%) |
| 4.0x or more | 52 (26.0%) | 43 (16.2%) |
| Total | 200 (100.0%) | 265 (100.0%) |
Real Estate Taxes by Mortgage Status in Marionville
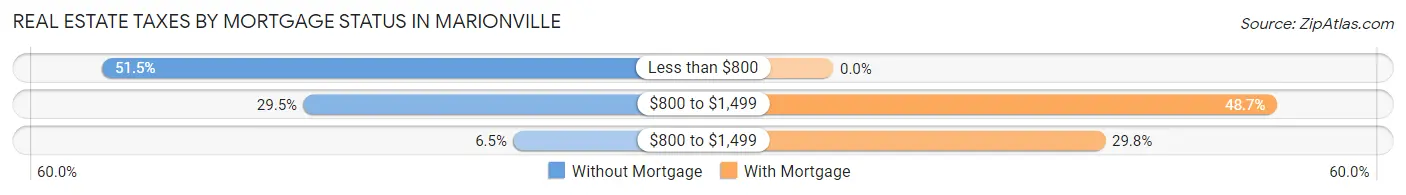
| Property Taxes | Without Mortgage | With Mortgage |
| Less than $800 | 103 (51.5%) | 0 (0.0%) |
| $800 to $1,499 | 59 (29.5%) | 129 (48.7%) |
| $800 to $1,499 | 13 (6.5%) | 79 (29.8%) |
| Total | 200 (100.0%) | 265 (100.0%) |
Health & Disability in Marionville
Health Insurance Coverage by Age in Marionville
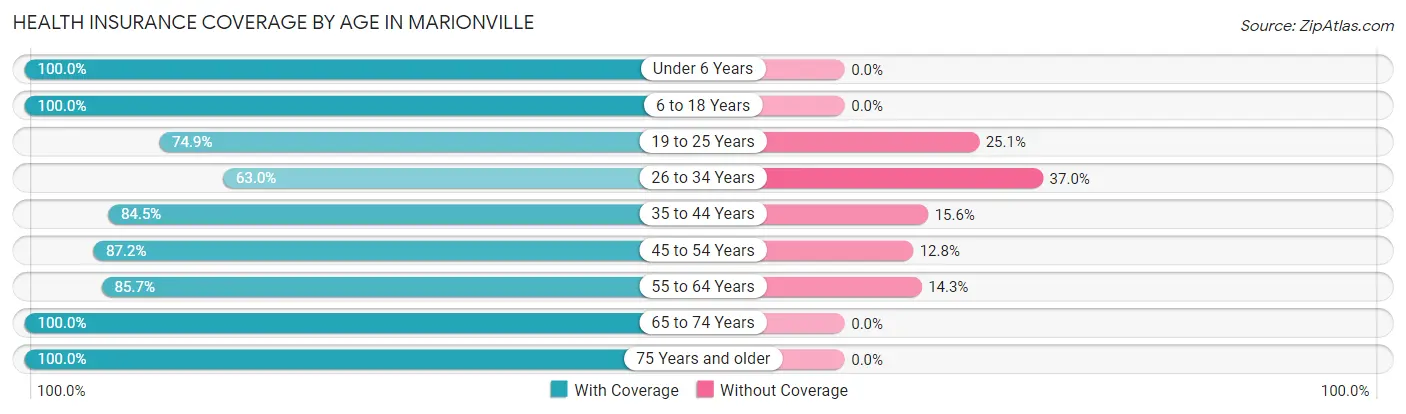
| Age Bracket | With Coverage | Without Coverage |
| Under 6 Years | 308 (100.0%) | 0 (0.0%) |
| 6 to 18 Years | 395 (100.0%) | 0 (0.0%) |
| 19 to 25 Years | 254 (74.9%) | 85 (25.1%) |
| 26 to 34 Years | 230 (63.0%) | 135 (37.0%) |
| 35 to 44 Years | 201 (84.5%) | 37 (15.5%) |
| 45 to 54 Years | 212 (87.2%) | 31 (12.8%) |
| 55 to 64 Years | 221 (85.7%) | 37 (14.3%) |
| 65 to 74 Years | 168 (100.0%) | 0 (0.0%) |
| 75 Years and older | 176 (100.0%) | 0 (0.0%) |
| Total | 2,165 (87.0%) | 325 (13.1%) |
Health Insurance Coverage by Citizenship Status in Marionville
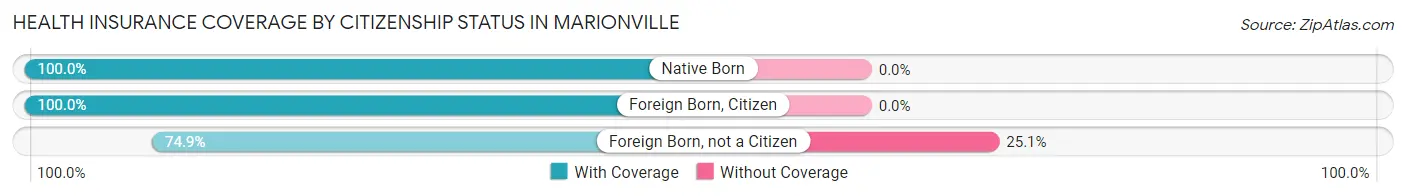
| Citizenship Status | With Coverage | Without Coverage |
| Native Born | 308 (100.0%) | 0 (0.0%) |
| Foreign Born, Citizen | 395 (100.0%) | 0 (0.0%) |
| Foreign Born, not a Citizen | 254 (74.9%) | 85 (25.1%) |
Health Insurance Coverage by Household Income in Marionville
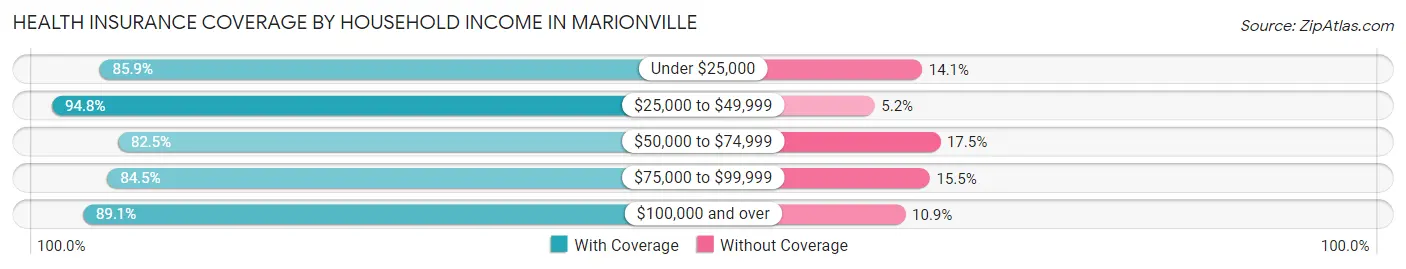
| Household Income | With Coverage | Without Coverage |
| Under $25,000 | 379 (85.9%) | 62 (14.1%) |
| $25,000 to $49,999 | 533 (94.8%) | 29 (5.2%) |
| $50,000 to $74,999 | 714 (82.5%) | 151 (17.5%) |
| $75,000 to $99,999 | 278 (84.5%) | 51 (15.5%) |
| $100,000 and over | 261 (89.1%) | 32 (10.9%) |
Public vs Private Health Insurance Coverage by Age in Marionville
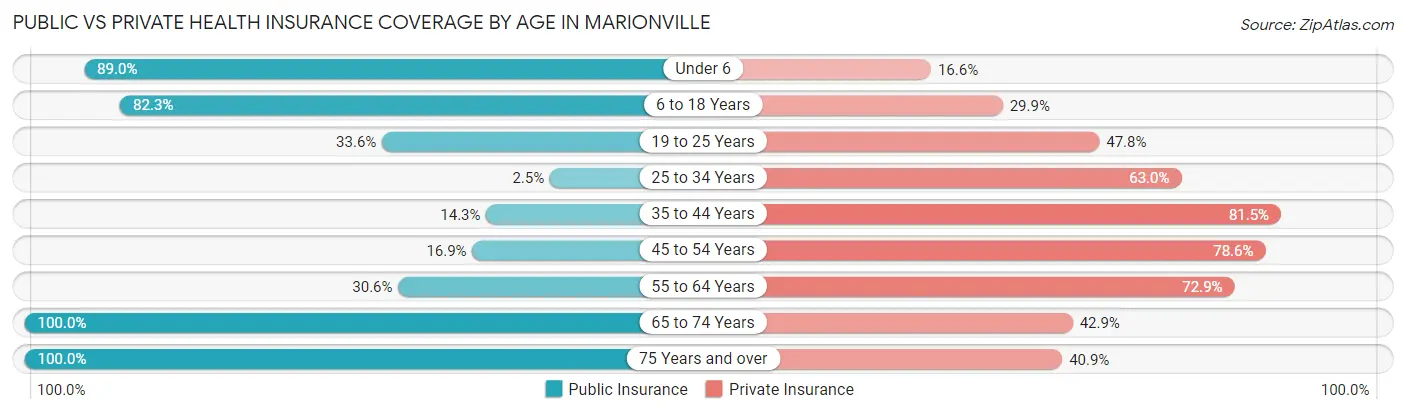
| Age Bracket | Public Insurance | Private Insurance |
| Under 6 | 274 (89.0%) | 51 (16.6%) |
| 6 to 18 Years | 325 (82.3%) | 118 (29.9%) |
| 19 to 25 Years | 114 (33.6%) | 162 (47.8%) |
| 25 to 34 Years | 9 (2.5%) | 230 (63.0%) |
| 35 to 44 Years | 34 (14.3%) | 194 (81.5%) |
| 45 to 54 Years | 41 (16.9%) | 191 (78.6%) |
| 55 to 64 Years | 79 (30.6%) | 188 (72.9%) |
| 65 to 74 Years | 168 (100.0%) | 72 (42.9%) |
| 75 Years and over | 176 (100.0%) | 72 (40.9%) |
| Total | 1,220 (49.0%) | 1,278 (51.3%) |
Disability Status by Sex by Age in Marionville
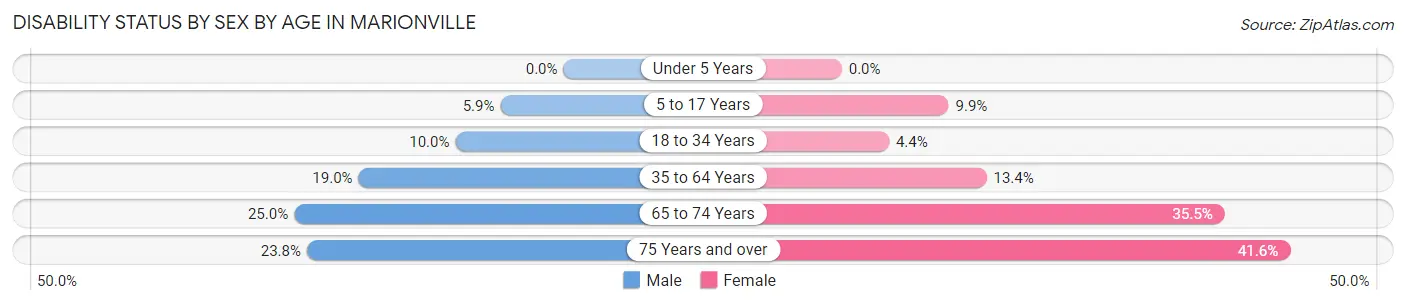
| Age Bracket | Male | Female |
| Under 5 Years | 0 (0.0%) | 0 (0.0%) |
| 5 to 17 Years | 12 (5.9%) | 21 (9.9%) |
| 18 to 34 Years | 32 (10.0%) | 18 (4.4%) |
| 35 to 64 Years | 74 (19.0%) | 47 (13.4%) |
| 65 to 74 Years | 23 (25.0%) | 27 (35.5%) |
| 75 Years and over | 15 (23.8%) | 47 (41.6%) |
Disability Class by Sex by Age in Marionville
Disability Class: Hearing Difficulty
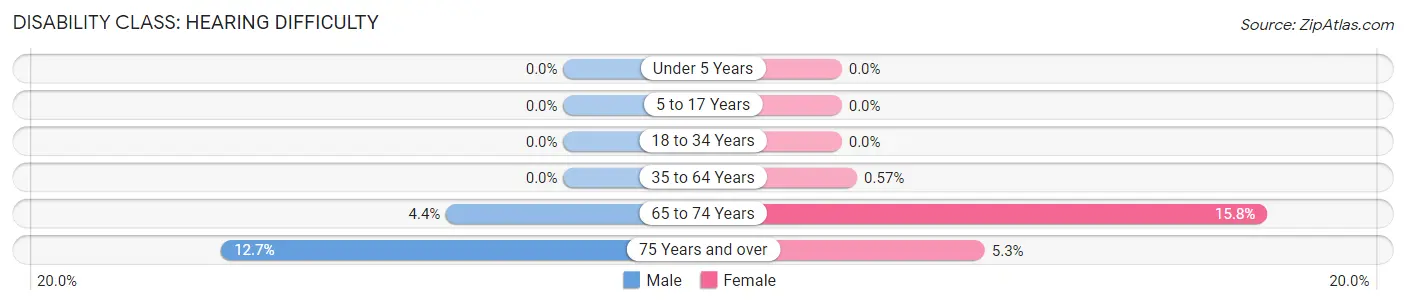
| Age Bracket | Male | Female |
| Under 5 Years | 0 (0.0%) | 0 (0.0%) |
| 5 to 17 Years | 0 (0.0%) | 0 (0.0%) |
| 18 to 34 Years | 0 (0.0%) | 0 (0.0%) |
| 35 to 64 Years | 0 (0.0%) | 2 (0.6%) |
| 65 to 74 Years | 4 (4.3%) | 12 (15.8%) |
| 75 Years and over | 8 (12.7%) | 6 (5.3%) |
Disability Class: Vision Difficulty
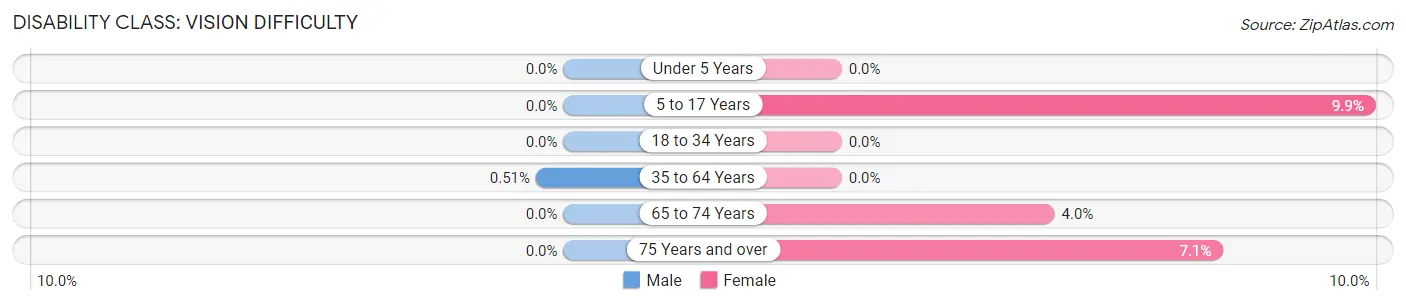
| Age Bracket | Male | Female |
| Under 5 Years | 0 (0.0%) | 0 (0.0%) |
| 5 to 17 Years | 0 (0.0%) | 21 (9.9%) |
| 18 to 34 Years | 0 (0.0%) | 0 (0.0%) |
| 35 to 64 Years | 2 (0.5%) | 0 (0.0%) |
| 65 to 74 Years | 0 (0.0%) | 3 (4.0%) |
| 75 Years and over | 0 (0.0%) | 8 (7.1%) |
Disability Class: Cognitive Difficulty
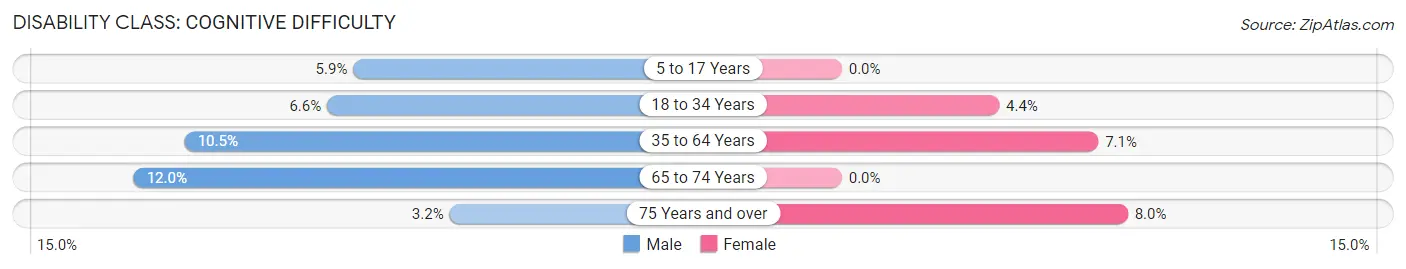
| Age Bracket | Male | Female |
| 5 to 17 Years | 12 (5.9%) | 0 (0.0%) |
| 18 to 34 Years | 21 (6.6%) | 18 (4.4%) |
| 35 to 64 Years | 41 (10.5%) | 25 (7.1%) |
| 65 to 74 Years | 11 (12.0%) | 0 (0.0%) |
| 75 Years and over | 2 (3.2%) | 9 (8.0%) |
Disability Class: Ambulatory Difficulty
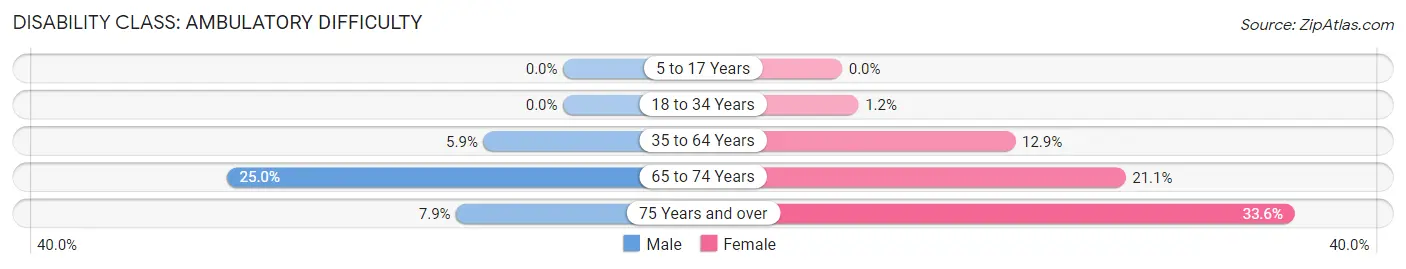
| Age Bracket | Male | Female |
| 5 to 17 Years | 0 (0.0%) | 0 (0.0%) |
| 18 to 34 Years | 0 (0.0%) | 5 (1.2%) |
| 35 to 64 Years | 23 (5.9%) | 45 (12.9%) |
| 65 to 74 Years | 23 (25.0%) | 16 (21.0%) |
| 75 Years and over | 5 (7.9%) | 38 (33.6%) |
Disability Class: Self-Care Difficulty
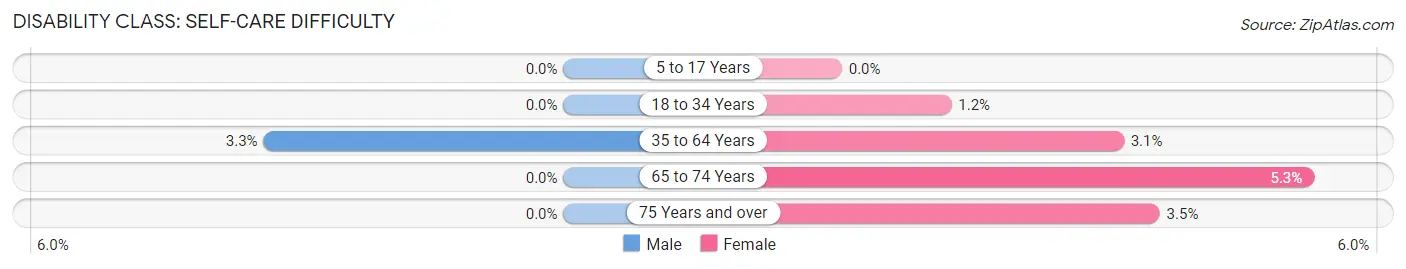
| Age Bracket | Male | Female |
| 5 to 17 Years | 0 (0.0%) | 0 (0.0%) |
| 18 to 34 Years | 0 (0.0%) | 5 (1.2%) |
| 35 to 64 Years | 13 (3.3%) | 11 (3.1%) |
| 65 to 74 Years | 0 (0.0%) | 4 (5.3%) |
| 75 Years and over | 0 (0.0%) | 4 (3.5%) |
Technology Access in Marionville
Computing Device Access in Marionville
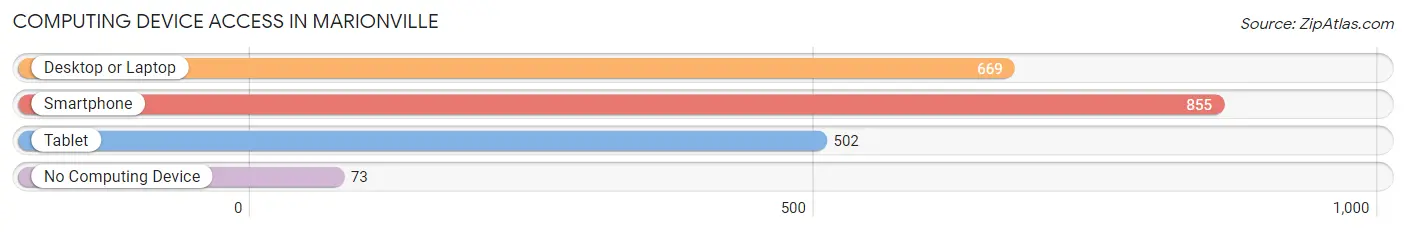
| Device Type | # Households | % Households |
| Desktop or Laptop | 669 | 67.9% |
| Smartphone | 855 | 86.8% |
| Tablet | 502 | 51.0% |
| No Computing Device | 73 | 7.4% |
| Total | 985 | 100.0% |
Internet Access in Marionville
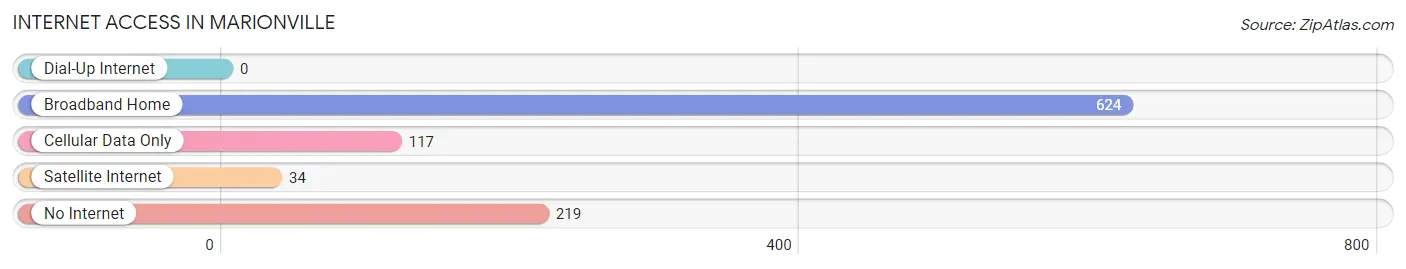
| Internet Type | # Households | % Households |
| Dial-Up Internet | 0 | 0.0% |
| Broadband Home | 624 | 63.3% |
| Cellular Data Only | 117 | 11.9% |
| Satellite Internet | 34 | 3.5% |
| No Internet | 219 | 22.2% |
| Total | 985 | 100.0% |
Marionville Summary
Marionville, Missouri is a small town located in Lawrence County, in the southwestern corner of the state. It is situated on the banks of the James River, and is home to a population of just over 1,000 people. The town was founded in 1845, and has a rich history of farming, industry, and commerce.
Geography
Marionville is located in the Ozark Plateau region of Missouri, and is surrounded by rolling hills and forests. The town is situated on the banks of the James River, and is located about 20 miles south of Springfield, the state’s third-largest city. The town is also located near Table Rock Lake, a popular destination for fishing, boating, and other recreational activities.
Economy
Marionville’s economy is largely based on agriculture and manufacturing. The town is home to several large farms, which produce a variety of crops, including corn, soybeans, and wheat. The town is also home to several manufacturing companies, which produce a variety of products, including furniture, clothing, and automotive parts.
Demographics
As of the 2010 census, Marionville had a population of 1,039 people. The racial makeup of the town was 97.2% White, 0.7% African American, 0.3% Native American, 0.2% Asian, 0.1% Pacific Islander, 0.2% from other races, and 1.3% from two or more races. Hispanic or Latino of any race were 1.2% of the population.
The median income for a household in Marionville was $35,938, and the median income for a family was $41,250. Males had a median income of $30,000 versus $21,250 for females. The per capita income for the town was $17,845. About 11.2% of families and 13.2% of the population were below the poverty line, including 16.7% of those under age 18 and 8.3% of those age 65 or over.
Conclusion
Marionville, Missouri is a small town with a rich history and a vibrant economy. The town is situated on the banks of the James River, and is home to a population of just over 1,000 people. The town’s economy is largely based on agriculture and manufacturing, and the town is home to several large farms and manufacturing companies. The town’s population is largely white, with a small percentage of African American, Native American, Asian, and Pacific Islander residents. The median income for a household in Marionville is $35,938, and the per capita income for the town is $17,845.
Common Questions
What is Per Capita Income in Marionville?
Per Capita income in Marionville is $21,048.
What is the Median Family Income in Marionville?
Median Family Income in Marionville is $50,494.
What is the Median Household income in Marionville?
Median Household Income in Marionville is $47,557.
What is Income or Wage Gap in Marionville?
Income or Wage Gap in Marionville is 31.8%.
Women in Marionville earn 68.2 cents for every dollar earned by a man.
What is Inequality or Gini Index in Marionville?
Inequality or Gini Index in Marionville is 0.39.
What is the Total Population of Marionville?
Total Population of Marionville is 2,551.
What is the Total Male Population of Marionville?
Total Male Population of Marionville is 1,188.
What is the Total Female Population of Marionville?
Total Female Population of Marionville is 1,363.
What is the Ratio of Males per 100 Females in Marionville?
There are 87.16 Males per 100 Females in Marionville.
What is the Ratio of Females per 100 Males in Marionville?
There are 114.73 Females per 100 Males in Marionville.
What is the Median Population Age in Marionville?
Median Population Age in Marionville is 29.6 Years.
What is the Average Family Size in Marionville
Average Family Size in Marionville is 3.5 People.
What is the Average Household Size in Marionville
Average Household Size in Marionville is 2.5 People.
How Large is the Labor Force in Marionville?
There are 1,265 People in the Labor Forcein in Marionville.
What is the Percentage of People in the Labor Force in Marionville?
66.5% of People are in the Labor Force in Marionville.
What is the Unemployment Rate in Marionville?
Unemployment Rate in Marionville is 9.9%.