Lawson, MO Map & Demographics
Lawson Map
Lawson Overview
$28,793
PER CAPITA INCOME
$77,250
AVG FAMILY INCOME
$61,929
AVG HOUSEHOLD INCOME
40.7%
WAGE / INCOME GAP [ % ]
59.3¢/ $1
WAGE / INCOME GAP [ $ ]
0.40
INEQUALITY / GINI INDEX
2,429
TOTAL POPULATION
1,136
MALE POPULATION
1,293
FEMALE POPULATION
87.86
MALES / 100 FEMALES
113.82
FEMALES / 100 MALES
33.3
MEDIAN AGE
3.4
AVG FAMILY SIZE
2.9
AVG HOUSEHOLD SIZE
1,088
LABOR FORCE [ PEOPLE ]
61.0%
PERCENT IN LABOR FORCE
3.1%
UNEMPLOYMENT RATE
Lawson Zip Codes
Lawson Area Codes
Income in Lawson
Income Overview in Lawson
Per Capita Income in Lawson is $28,793, while median incomes of families and households are $77,250 and $61,929 respectively.
| Characteristic | Number | Measure |
| Per Capita Income | 2,429 | $28,793 |
| Median Family Income | 599 | $77,250 |
| Mean Family Income | 599 | $86,836 |
| Median Household Income | 834 | $61,929 |
| Mean Household Income | 834 | $81,801 |
| Income Deficit | 599 | $0 |
| Wage / Income Gap (%) | 2,429 | 40.73% |
| Wage / Income Gap ($) | 2,429 | 59.27¢ per $1 |
| Gini / Inequality Index | 2,429 | 0.40 |
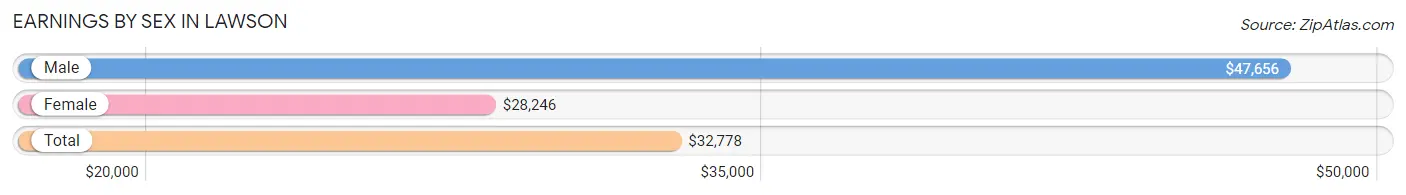
Earnings by Sex in Lawson
Average Earnings in Lawson are $32,778, $47,656 for men and $28,246 for women, a difference of 40.7%.
| Sex | Number | Average Earnings |
| Male | 578 (48.6%) | $47,656 |
| Female | 610 (51.3%) | $28,246 |
| Total | 1,188 (100.0%) | $32,778 |
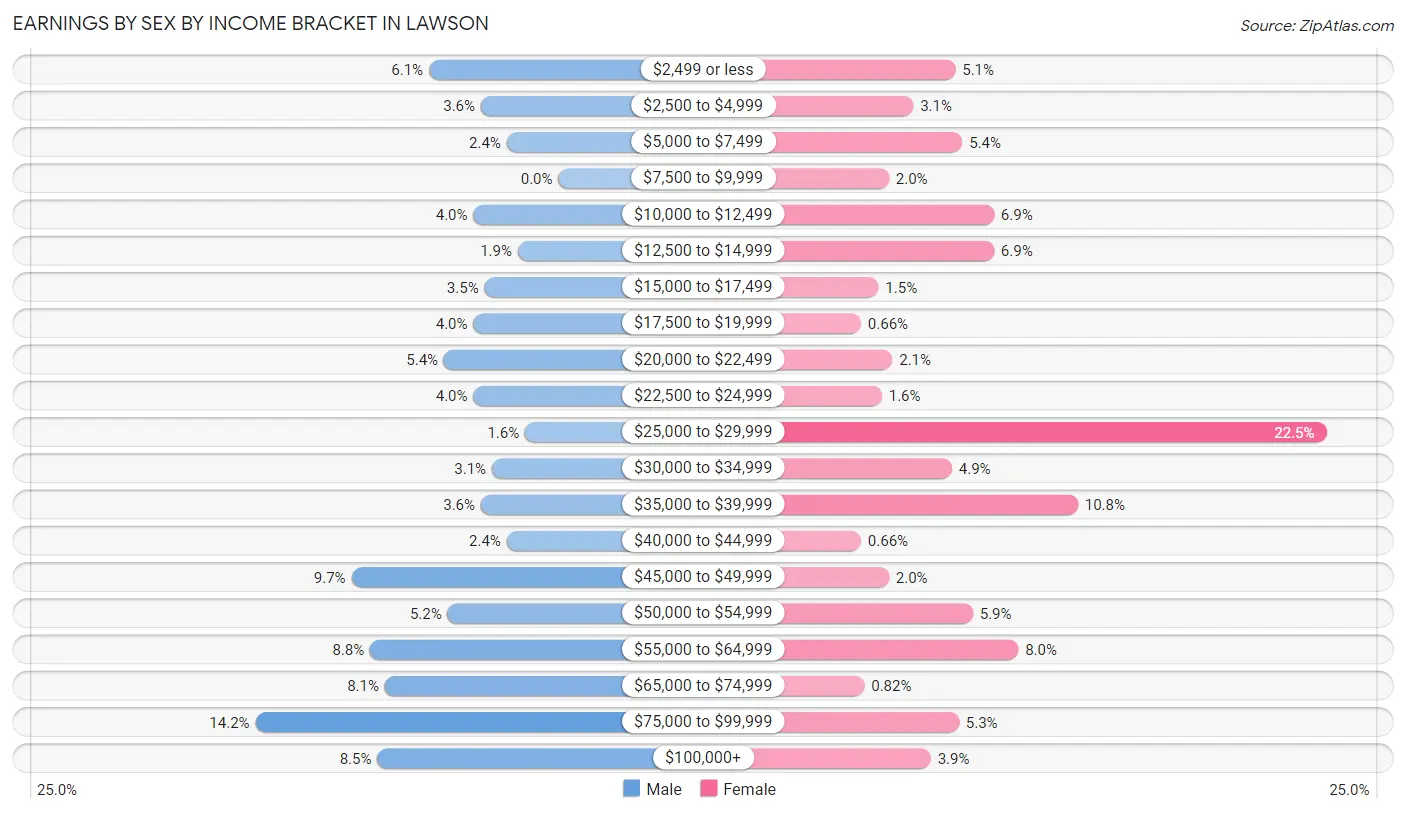
Earnings by Sex by Income Bracket in Lawson
The most common earnings brackets in Lawson are $75,000 to $99,999 for men (82 | 14.2%) and $25,000 to $29,999 for women (137 | 22.5%).
| Income | Male | Female |
| $2,499 or less | 35 (6.1%) | 31 (5.1%) |
| $2,500 to $4,999 | 21 (3.6%) | 19 (3.1%) |
| $5,000 to $7,499 | 14 (2.4%) | 33 (5.4%) |
| $7,500 to $9,999 | 0 (0.0%) | 12 (2.0%) |
| $10,000 to $12,499 | 23 (4.0%) | 42 (6.9%) |
| $12,500 to $14,999 | 11 (1.9%) | 42 (6.9%) |
| $15,000 to $17,499 | 20 (3.5%) | 9 (1.5%) |
| $17,500 to $19,999 | 23 (4.0%) | 4 (0.7%) |
| $20,000 to $22,499 | 31 (5.4%) | 13 (2.1%) |
| $22,500 to $24,999 | 23 (4.0%) | 10 (1.6%) |
| $25,000 to $29,999 | 9 (1.6%) | 137 (22.5%) |
| $30,000 to $34,999 | 18 (3.1%) | 30 (4.9%) |
| $35,000 to $39,999 | 21 (3.6%) | 66 (10.8%) |
| $40,000 to $44,999 | 14 (2.4%) | 4 (0.7%) |
| $45,000 to $49,999 | 56 (9.7%) | 12 (2.0%) |
| $50,000 to $54,999 | 30 (5.2%) | 36 (5.9%) |
| $55,000 to $64,999 | 51 (8.8%) | 49 (8.0%) |
| $65,000 to $74,999 | 47 (8.1%) | 5 (0.8%) |
| $75,000 to $99,999 | 82 (14.2%) | 32 (5.2%) |
| $100,000+ | 49 (8.5%) | 24 (3.9%) |
| Total | 578 (100.0%) | 610 (100.0%) |
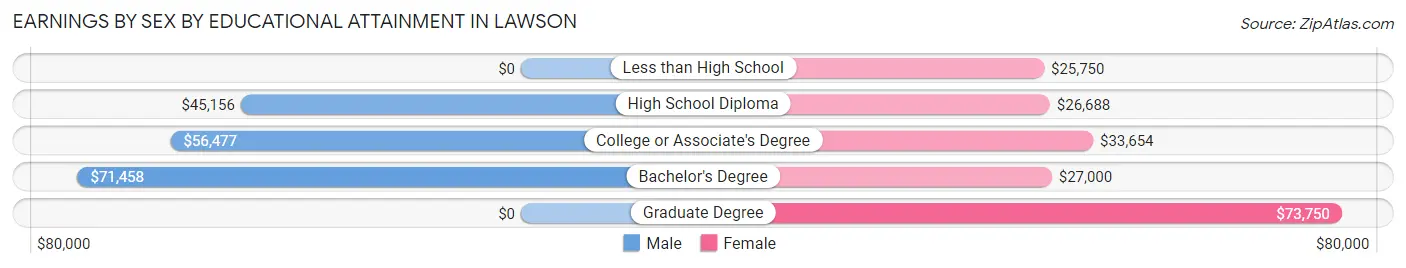
Earnings by Sex by Educational Attainment in Lawson
Average earnings in Lawson are $50,000 for men and $29,570 for women, a difference of 40.9%. Men with an educational attainment of bachelor's degree enjoy the highest average annual earnings of $71,458, while those with high school diploma education earn the least with $45,156. Women with an educational attainment of graduate degree earn the most with the average annual earnings of $73,750, while those with less than high school education have the smallest earnings of $25,750.
| Educational Attainment | Male Income | Female Income |
| Less than High School | - | - |
| High School Diploma | $45,156 | $26,688 |
| College or Associate's Degree | $56,477 | $33,654 |
| Bachelor's Degree | $71,458 | $27,000 |
| Graduate Degree | - | - |
| Total | $50,000 | $29,570 |
Family Income in Lawson
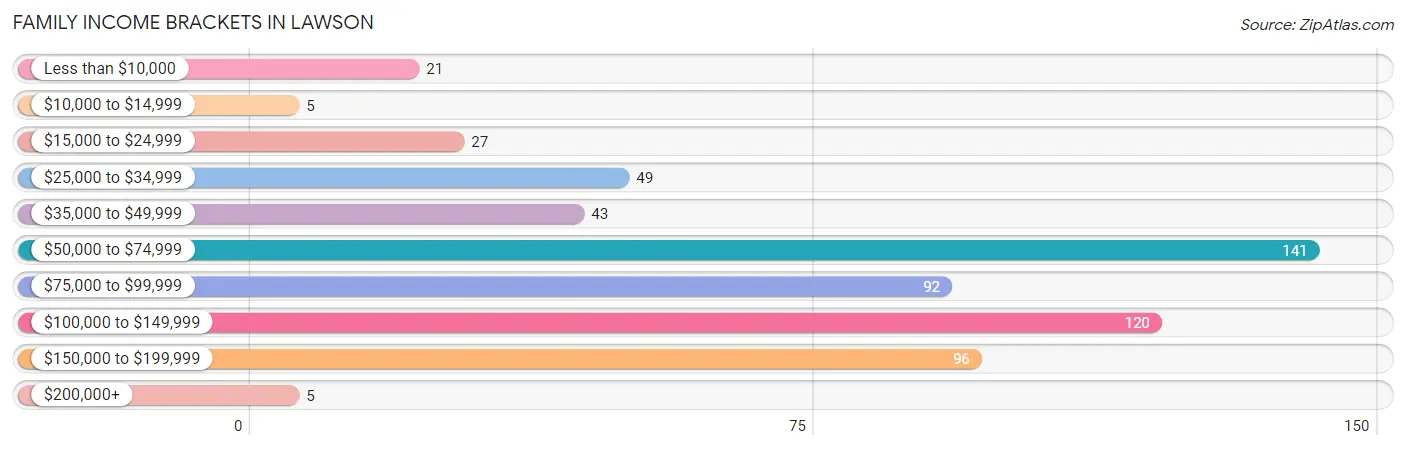
Family Income Brackets in Lawson
According to the Lawson family income data, there are 141 families falling into the $50,000 to $74,999 income range, which is the most common income bracket and makes up 23.5% of all families. Conversely, the $10,000 to $14,999 income bracket is the least frequent group with only 5 families (0.8%) belonging to this category.
| Income Bracket | # Families | % Families |
| Less than $10,000 | 21 | 3.5% |
| $10,000 to $14,999 | 5 | 0.8% |
| $15,000 to $24,999 | 27 | 4.5% |
| $25,000 to $34,999 | 49 | 8.2% |
| $35,000 to $49,999 | 43 | 7.2% |
| $50,000 to $74,999 | 141 | 23.5% |
| $75,000 to $99,999 | 92 | 15.4% |
| $100,000 to $149,999 | 120 | 20.0% |
| $150,000 to $199,999 | 96 | 16.0% |
| $200,000+ | 5 | 0.8% |
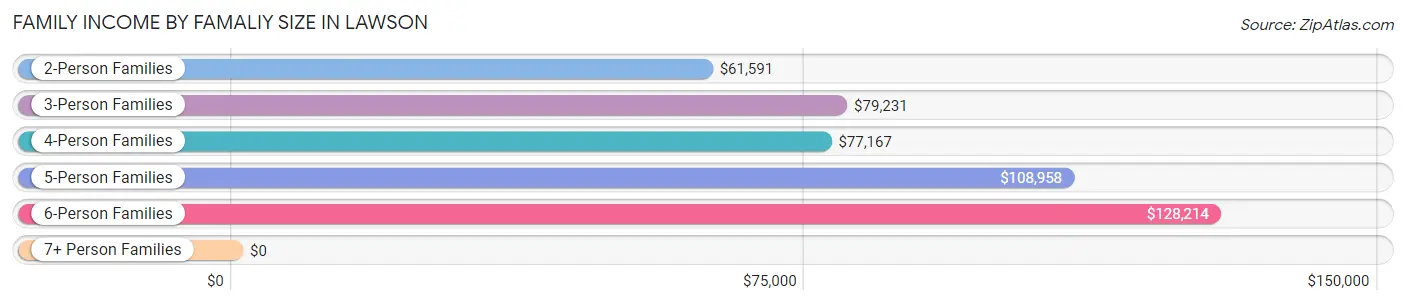
Family Income by Famaliy Size in Lawson
6-person families (20 | 3.3%) account for the highest median family income in Lawson with $128,214 per family, while 2-person families (236 | 39.4%) have the highest median income of $30,796 per family member.
| Income Bracket | # Families | Median Income |
| 2-Person Families | 236 (39.4%) | $61,591 |
| 3-Person Families | 94 (15.7%) | $79,231 |
| 4-Person Families | 124 (20.7%) | $77,167 |
| 5-Person Families | 97 (16.2%) | $108,958 |
| 6-Person Families | 20 (3.3%) | $128,214 |
| 7+ Person Families | 28 (4.7%) | $0 |
| Total | 599 (100.0%) | $77,250 |
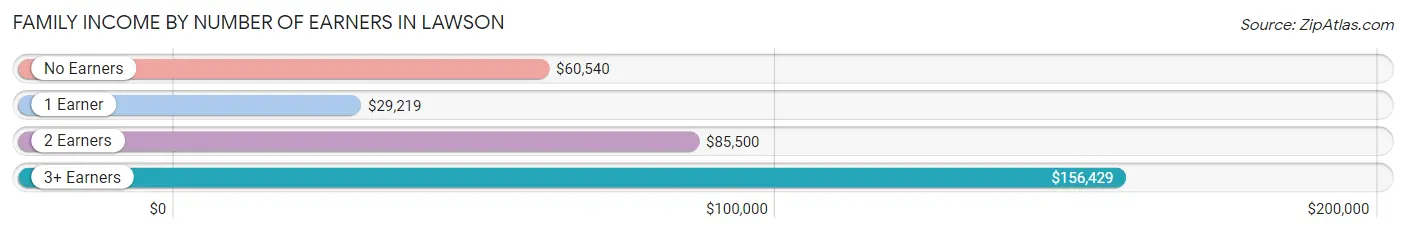
Family Income by Number of Earners in Lawson
The median family income in Lawson is $77,250, with families comprising 3+ earners (106) having the highest median family income of $156,429, while families with 1 earner (132) have the lowest median family income of $29,219, accounting for 17.7% and 22.0% of families, respectively.
| Number of Earners | # Families | Median Income |
| No Earners | 115 (19.2%) | $60,540 |
| 1 Earner | 132 (22.0%) | $29,219 |
| 2 Earners | 246 (41.1%) | $85,500 |
| 3+ Earners | 106 (17.7%) | $156,429 |
| Total | 599 (100.0%) | $77,250 |
Household Income in Lawson
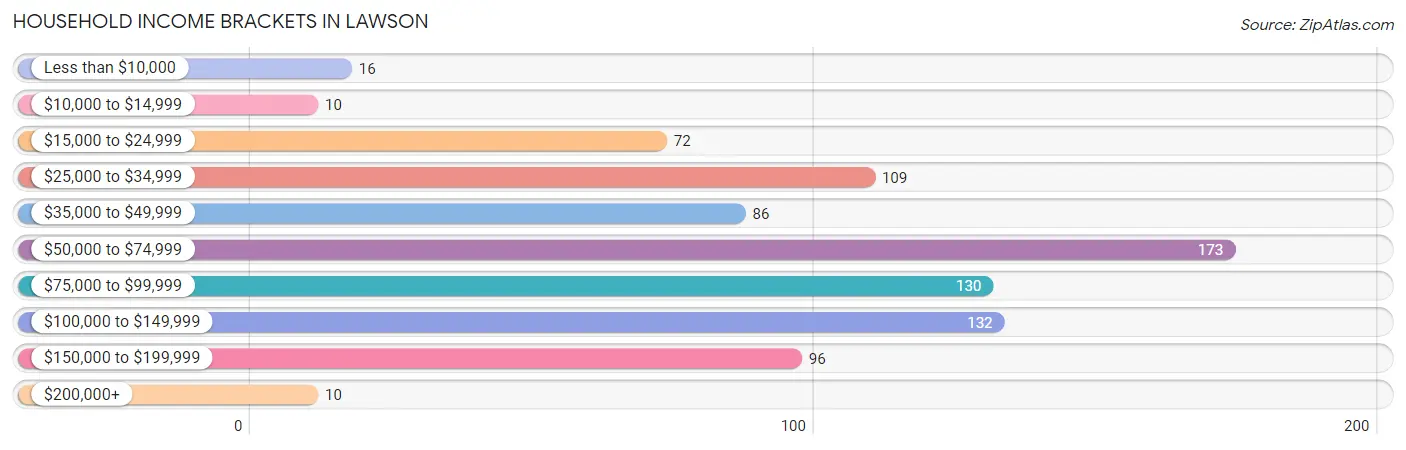
Household Income Brackets in Lawson
With 173 households falling in the category, the $50,000 to $74,999 income range is the most frequent in Lawson, accounting for 20.7% of all households. In contrast, only 10 households (1.2%) fall into the $10,000 to $14,999 income bracket, making it the least populous group.
| Income Bracket | # Households | % Households |
| Less than $10,000 | 16 | 1.9% |
| $10,000 to $14,999 | 10 | 1.2% |
| $15,000 to $24,999 | 72 | 8.6% |
| $25,000 to $34,999 | 109 | 13.1% |
| $35,000 to $49,999 | 86 | 10.3% |
| $50,000 to $74,999 | 173 | 20.7% |
| $75,000 to $99,999 | 130 | 15.6% |
| $100,000 to $149,999 | 132 | 15.8% |
| $150,000 to $199,999 | 96 | 11.5% |
| $200,000+ | 10 | 1.2% |
Household Income by Householder Age in Lawson
The median household income in Lawson is $61,929, with the highest median household income of $100,298 found in the 25 to 44 years age bracket for the primary householder. A total of 253 households (30.3%) fall into this category. Meanwhile, the 65+ years age bracket for the primary householder has the lowest median household income of $45,568, with 260 households (31.2%) in this group.
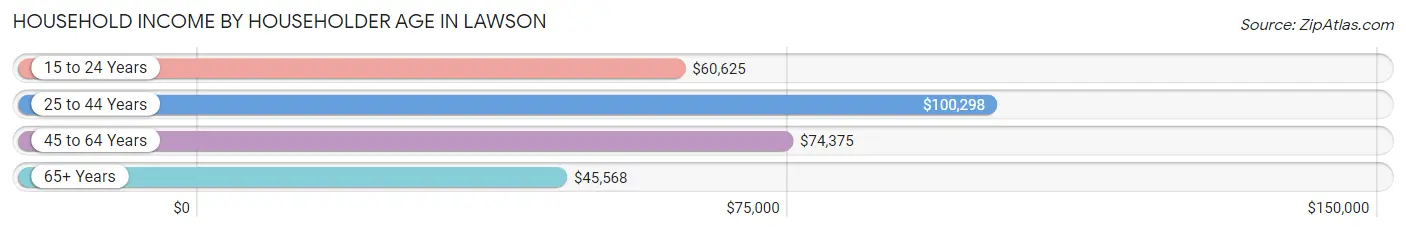
| Income Bracket | # Households | Median Income |
| 15 to 24 Years | 37 (4.4%) | $60,625 |
| 25 to 44 Years | 253 (30.3%) | $100,298 |
| 45 to 64 Years | 284 (34.1%) | $74,375 |
| 65+ Years | 260 (31.2%) | $45,568 |
| Total | 834 (100.0%) | $61,929 |
Poverty in Lawson
Income Below Poverty by Sex and Age in Lawson
With 7.0% poverty level for males and 7.0% for females among the residents of Lawson, 15 year old males and 5 year old females are the most vulnerable to poverty, with 16 males (32.7%) and 24 females (52.2%) in their respective age groups living below the poverty level.
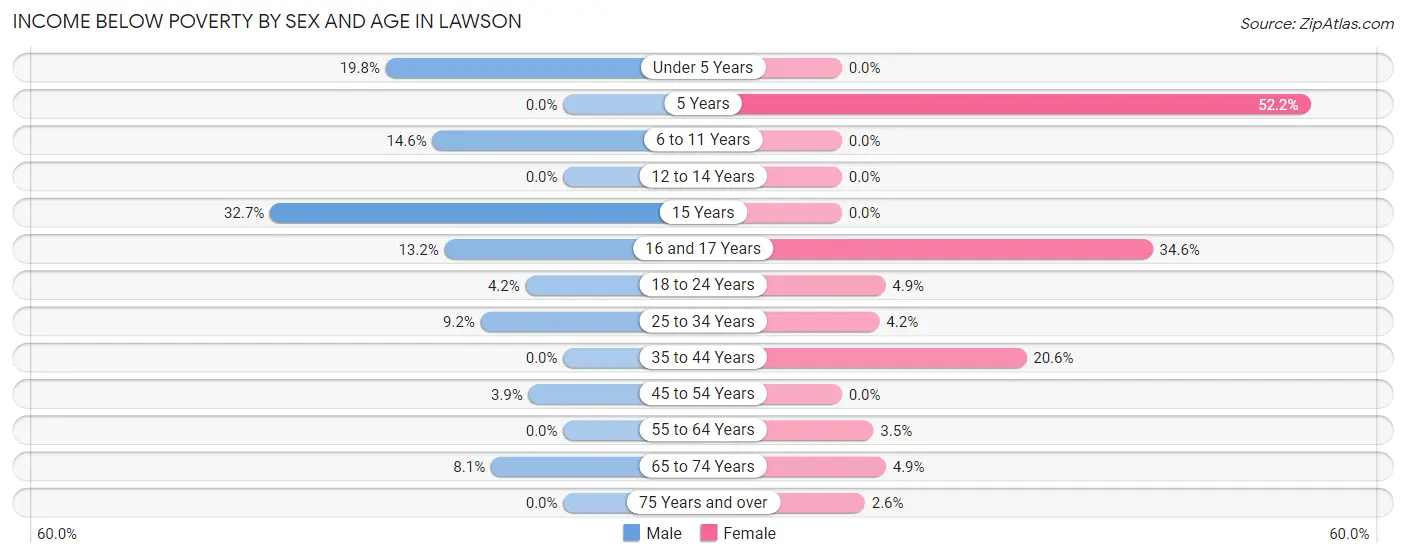
| Age Bracket | Male | Female |
| Under 5 Years | 18 (19.8%) | 0 (0.0%) |
| 5 Years | 0 (0.0%) | 24 (52.2%) |
| 6 to 11 Years | 15 (14.6%) | 0 (0.0%) |
| 12 to 14 Years | 0 (0.0%) | 0 (0.0%) |
| 15 Years | 16 (32.7%) | 0 (0.0%) |
| 16 and 17 Years | 9 (13.2%) | 9 (34.6%) |
| 18 to 24 Years | 4 (4.2%) | 5 (4.9%) |
| 25 to 34 Years | 7 (9.2%) | 9 (4.2%) |
| 35 to 44 Years | 0 (0.0%) | 30 (20.5%) |
| 45 to 54 Years | 5 (3.9%) | 0 (0.0%) |
| 55 to 64 Years | 0 (0.0%) | 5 (3.5%) |
| 65 to 74 Years | 5 (8.1%) | 5 (4.9%) |
| 75 Years and over | 0 (0.0%) | 2 (2.6%) |
| Total | 79 (7.0%) | 89 (7.0%) |
Income Above Poverty by Sex and Age in Lawson
According to the poverty statistics in Lawson, males aged 5 years and females aged under 5 years are the age groups that are most secure financially, with 100.0% of males and 100.0% of females in these age groups living above the poverty line.
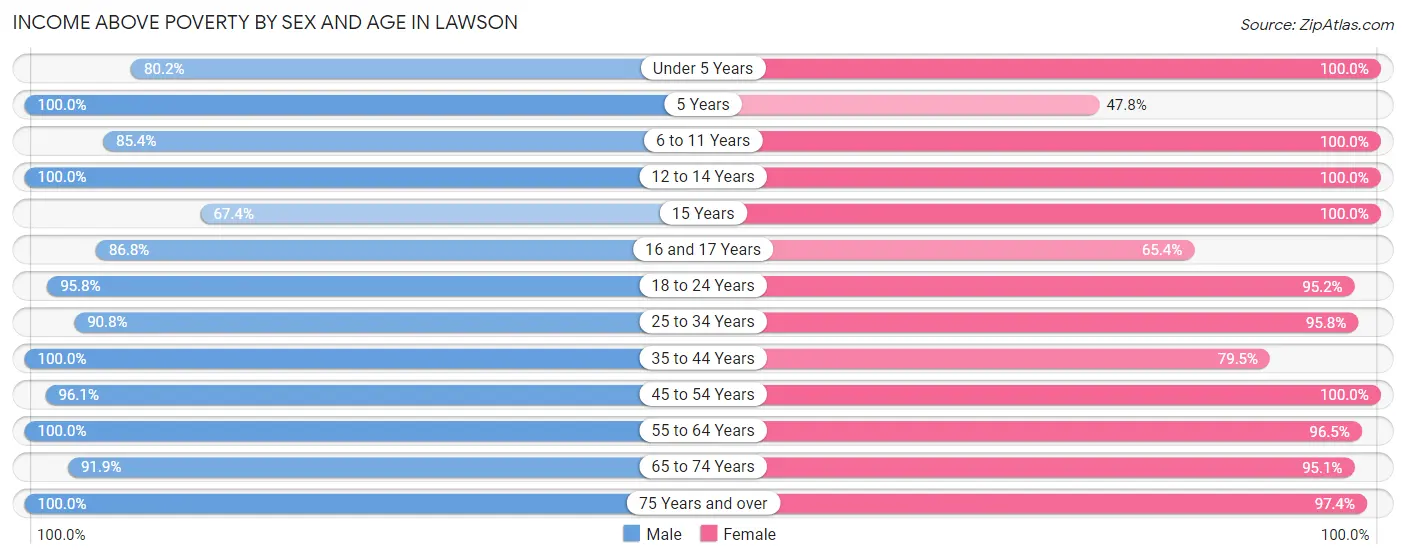
| Age Bracket | Male | Female |
| Under 5 Years | 73 (80.2%) | 91 (100.0%) |
| 5 Years | 4 (100.0%) | 22 (47.8%) |
| 6 to 11 Years | 88 (85.4%) | 107 (100.0%) |
| 12 to 14 Years | 42 (100.0%) | 88 (100.0%) |
| 15 Years | 33 (67.3%) | 24 (100.0%) |
| 16 and 17 Years | 59 (86.8%) | 17 (65.4%) |
| 18 to 24 Years | 91 (95.8%) | 98 (95.2%) |
| 25 to 34 Years | 69 (90.8%) | 206 (95.8%) |
| 35 to 44 Years | 149 (100.0%) | 116 (79.4%) |
| 45 to 54 Years | 124 (96.1%) | 102 (100.0%) |
| 55 to 64 Years | 126 (100.0%) | 137 (96.5%) |
| 65 to 74 Years | 57 (91.9%) | 97 (95.1%) |
| 75 Years and over | 130 (100.0%) | 76 (97.4%) |
| Total | 1,045 (93.0%) | 1,181 (93.0%) |
Income Below Poverty Among Married-Couple Families in Lawson
The poverty statistics for married-couple families in Lawson show that 2.4% or 12 of the total 502 families live below the poverty line. Families with 1 or 2 children have the highest poverty rate of 4.1%, comprising of 7 families. On the other hand, families with 3 or 4 children have the lowest poverty rate of 0.0%, which includes 0 families.
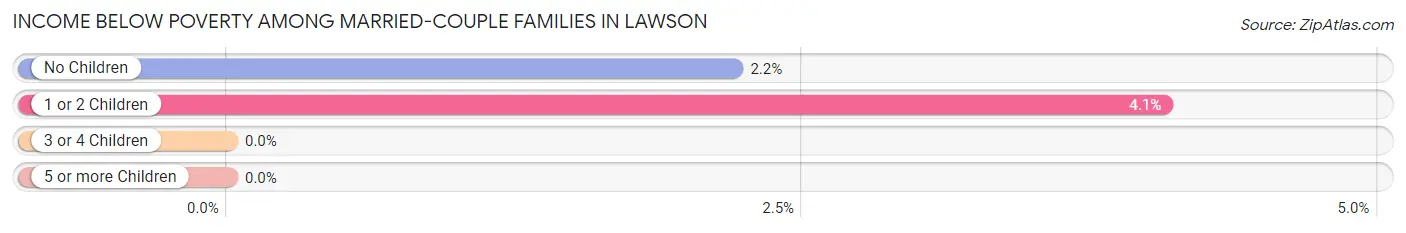
| Children | Above Poverty | Below Poverty |
| No Children | 222 (97.8%) | 5 (2.2%) |
| 1 or 2 Children | 165 (95.9%) | 7 (4.1%) |
| 3 or 4 Children | 90 (100.0%) | 0 (0.0%) |
| 5 or more Children | 13 (100.0%) | 0 (0.0%) |
| Total | 490 (97.6%) | 12 (2.4%) |
Income Below Poverty Among Single-Parent Households in Lawson
According to the poverty data in Lawson, 17.2% or 5 single-father households and 38.2% or 26 single-mother households are living below the poverty line. Among single-father households, those with 1 or 2 children have the highest poverty rate, with 5 households (35.7%) experiencing poverty. Likewise, among single-mother households, those with 3 or 4 children have the highest poverty rate, with 24 households (82.8%) falling below the poverty line.
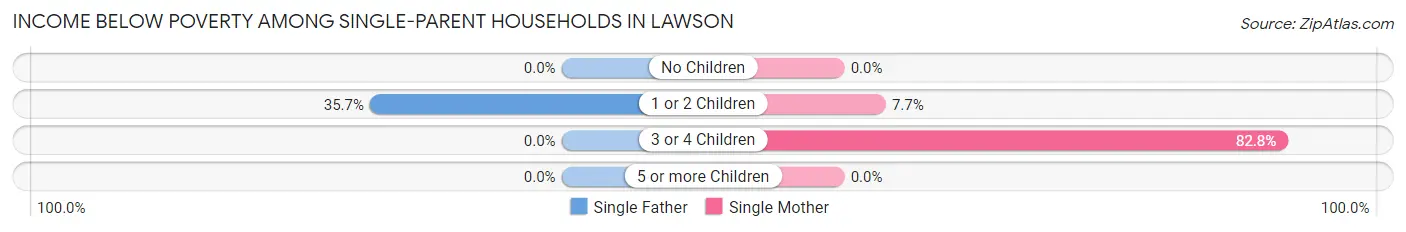
| Children | Single Father | Single Mother |
| No Children | 0 (0.0%) | 0 (0.0%) |
| 1 or 2 Children | 5 (35.7%) | 2 (7.7%) |
| 3 or 4 Children | 0 (0.0%) | 24 (82.8%) |
| 5 or more Children | 0 (0.0%) | 0 (0.0%) |
| Total | 5 (17.2%) | 26 (38.2%) |
Income Below Poverty Among Married-Couple vs Single-Parent Households in Lawson
The poverty data for Lawson shows that 12 of the married-couple family households (2.4%) and 31 of the single-parent households (32.0%) are living below the poverty level. Within the married-couple family households, those with 1 or 2 children have the highest poverty rate, with 7 households (4.1%) falling below the poverty line. Among the single-parent households, those with 3 or 4 children have the highest poverty rate, with 24 household (82.8%) living below poverty.
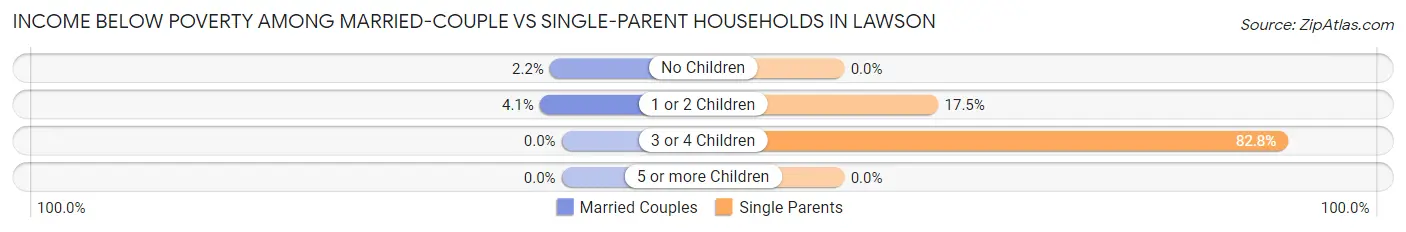
| Children | Married-Couple Families | Single-Parent Households |
| No Children | 5 (2.2%) | 0 (0.0%) |
| 1 or 2 Children | 7 (4.1%) | 7 (17.5%) |
| 3 or 4 Children | 0 (0.0%) | 24 (82.8%) |
| 5 or more Children | 0 (0.0%) | 0 (0.0%) |
| Total | 12 (2.4%) | 31 (32.0%) |
Race in Lawson
The most populous races in Lawson are White / Caucasian (2,349 | 96.7%), Two or more Races (56 | 2.3%), and Hispanic or Latino (46 | 1.9%).
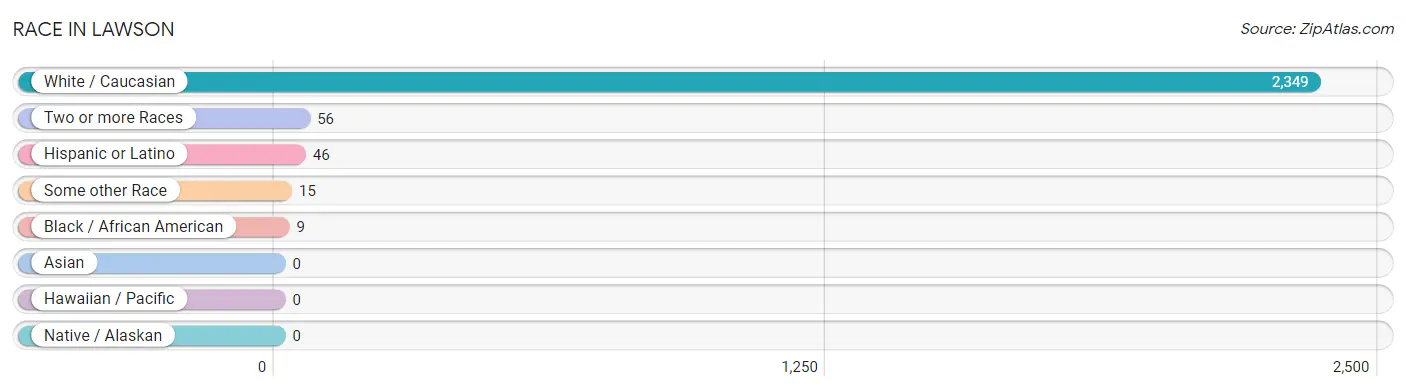
| Race | # Population | % Population |
| Asian | 0 | 0.0% |
| Black / African American | 9 | 0.4% |
| Hawaiian / Pacific | 0 | 0.0% |
| Hispanic or Latino | 46 | 1.9% |
| Native / Alaskan | 0 | 0.0% |
| White / Caucasian | 2,349 | 96.7% |
| Two or more Races | 56 | 2.3% |
| Some other Race | 15 | 0.6% |
| Total | 2,429 | 100.0% |
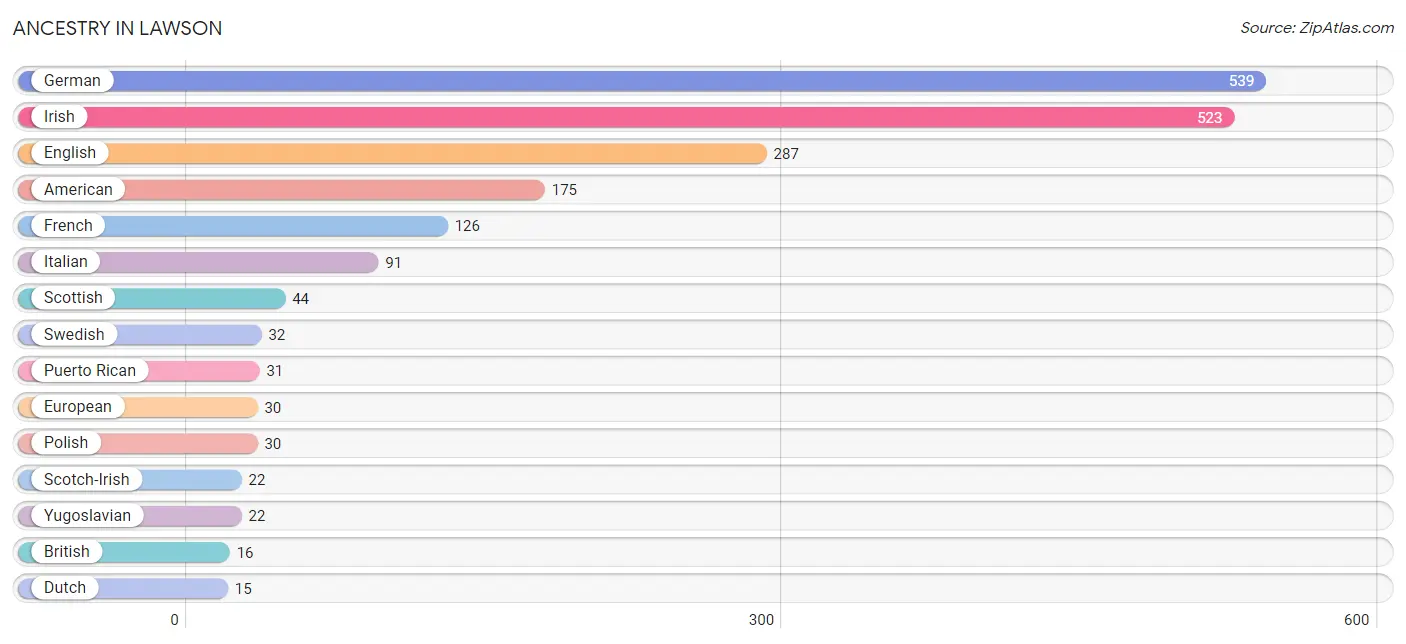
Ancestry in Lawson
The most populous ancestries reported in Lawson are German (539 | 22.2%), Irish (523 | 21.5%), English (287 | 11.8%), American (175 | 7.2%), and French (126 | 5.2%), together accounting for 67.9% of all Lawson residents.
| Ancestry | # Population | % Population |
| African | 6 | 0.3% |
| American | 175 | 7.2% |
| Belgian | 3 | 0.1% |
| British | 16 | 0.7% |
| Cherokee | 1 | 0.0% |
| Danish | 8 | 0.3% |
| Dutch | 15 | 0.6% |
| English | 287 | 11.8% |
| European | 30 | 1.2% |
| French | 126 | 5.2% |
| German | 539 | 22.2% |
| Irish | 523 | 21.5% |
| Italian | 91 | 3.7% |
| Luxembourger | 4 | 0.2% |
| Mexican | 15 | 0.6% |
| Native Hawaiian | 8 | 0.3% |
| Norwegian | 11 | 0.4% |
| Polish | 30 | 1.2% |
| Puerto Rican | 31 | 1.3% |
| Russian | 5 | 0.2% |
| Scandinavian | 4 | 0.2% |
| Scotch-Irish | 22 | 0.9% |
| Scottish | 44 | 1.8% |
| Sioux | 1 | 0.0% |
| Subsaharan African | 6 | 0.3% |
| Swedish | 32 | 1.3% |
| Welsh | 11 | 0.4% |
| Yugoslavian | 22 | 0.9% | View All 28 Rows |
Immigrants in Lawson
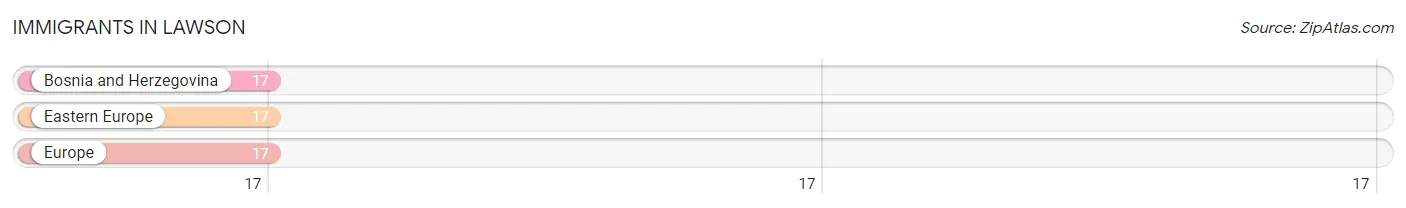
The most numerous immigrant groups reported in Lawson came from Bosnia and Herzegovina (17 | 0.7%), Eastern Europe (17 | 0.7%), and Europe (17 | 0.7%), together accounting for 2.1% of all Lawson residents.
| Immigration Origin | # Population | % Population |
| Bosnia and Herzegovina | 17 | 0.7% |
| Eastern Europe | 17 | 0.7% |
| Europe | 17 | 0.7% | View All 3 Rows |
Sex and Age in Lawson
Sex and Age in Lawson
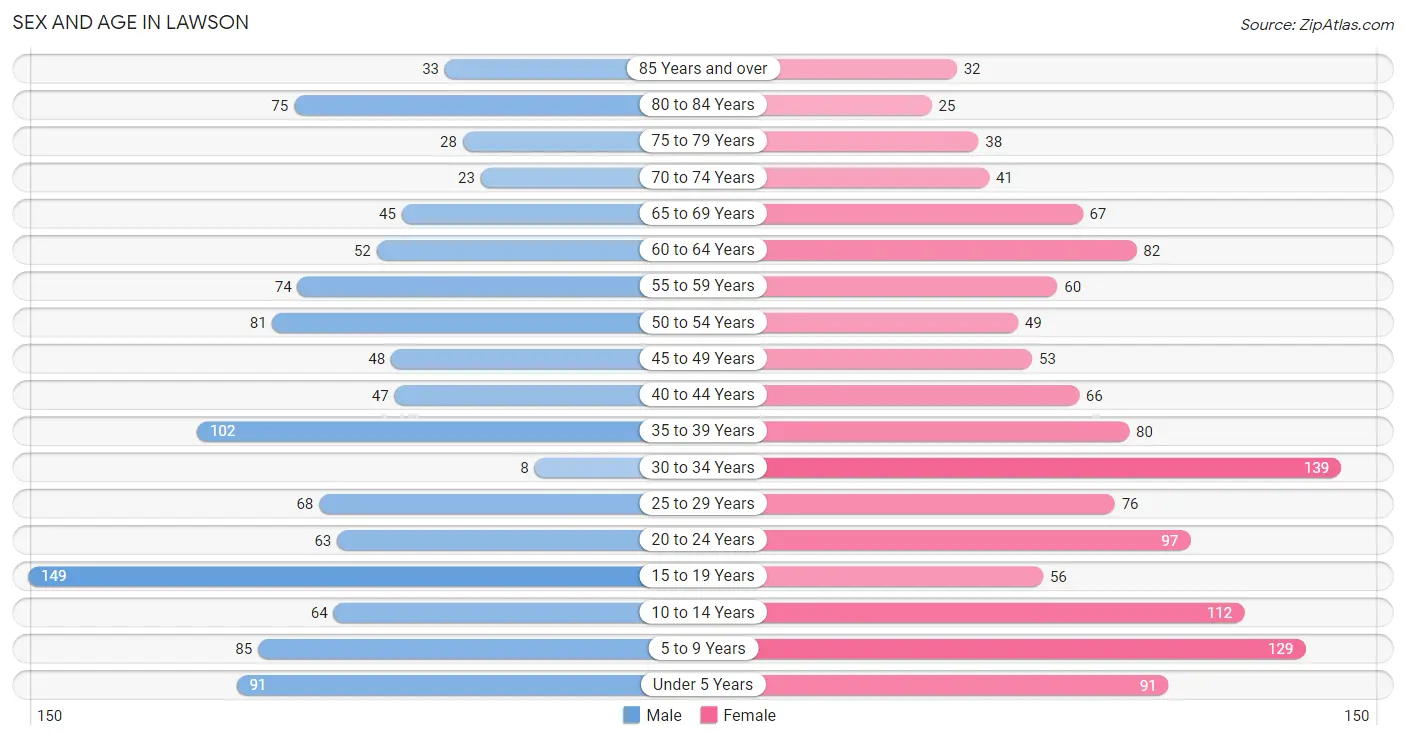
The most populous age groups in Lawson are 15 to 19 Years (149 | 13.1%) for men and 30 to 34 Years (139 | 10.7%) for women.
| Age Bracket | Male | Female |
| Under 5 Years | 91 (8.0%) | 91 (7.0%) |
| 5 to 9 Years | 85 (7.5%) | 129 (10.0%) |
| 10 to 14 Years | 64 (5.6%) | 112 (8.7%) |
| 15 to 19 Years | 149 (13.1%) | 56 (4.3%) |
| 20 to 24 Years | 63 (5.6%) | 97 (7.5%) |
| 25 to 29 Years | 68 (6.0%) | 76 (5.9%) |
| 30 to 34 Years | 8 (0.7%) | 139 (10.7%) |
| 35 to 39 Years | 102 (9.0%) | 80 (6.2%) |
| 40 to 44 Years | 47 (4.1%) | 66 (5.1%) |
| 45 to 49 Years | 48 (4.2%) | 53 (4.1%) |
| 50 to 54 Years | 81 (7.1%) | 49 (3.8%) |
| 55 to 59 Years | 74 (6.5%) | 60 (4.6%) |
| 60 to 64 Years | 52 (4.6%) | 82 (6.3%) |
| 65 to 69 Years | 45 (4.0%) | 67 (5.2%) |
| 70 to 74 Years | 23 (2.0%) | 41 (3.2%) |
| 75 to 79 Years | 28 (2.5%) | 38 (2.9%) |
| 80 to 84 Years | 75 (6.6%) | 25 (1.9%) |
| 85 Years and over | 33 (2.9%) | 32 (2.5%) |
| Total | 1,136 (100.0%) | 1,293 (100.0%) |
Families and Households in Lawson
Median Family Size in Lawson
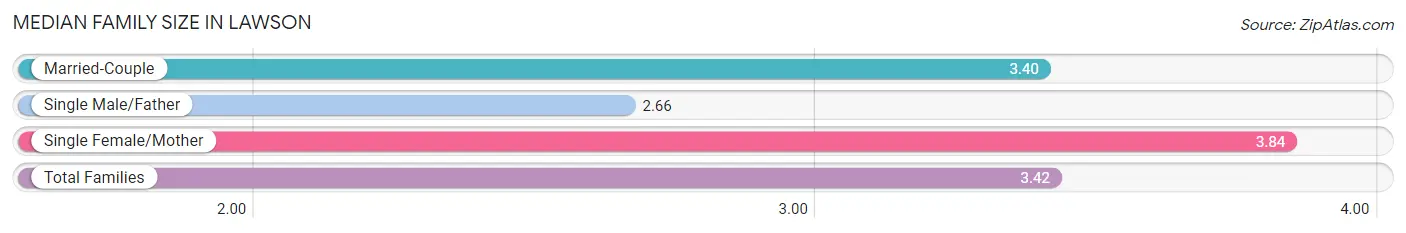
The median family size in Lawson is 3.42 persons per family, with single female/mother families (68 | 11.4%) accounting for the largest median family size of 3.84 persons per family. On the other hand, single male/father families (29 | 4.8%) represent the smallest median family size with 2.66 persons per family.
| Family Type | # Families | Family Size |
| Married-Couple | 502 (83.8%) | 3.40 |
| Single Male/Father | 29 (4.8%) | 2.66 |
| Single Female/Mother | 68 (11.4%) | 3.84 |
| Total Families | 599 (100.0%) | 3.42 |
Median Household Size in Lawson
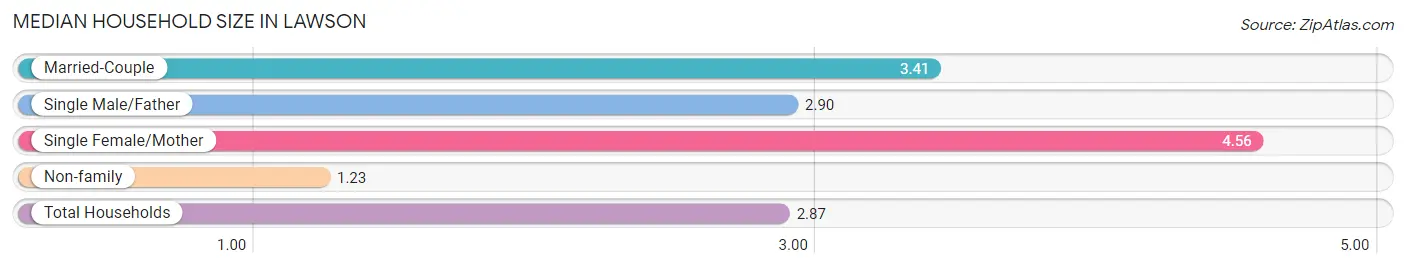
The median household size in Lawson is 2.87 persons per household, with single female/mother households (68 | 8.2%) accounting for the largest median household size of 4.56 persons per household. non-family households (235 | 28.2%) represent the smallest median household size with 1.23 persons per household.
| Household Type | # Households | Household Size |
| Married-Couple | 502 (60.2%) | 3.41 |
| Single Male/Father | 29 (3.5%) | 2.90 |
| Single Female/Mother | 68 (8.2%) | 4.56 |
| Non-family | 235 (28.2%) | 1.23 |
| Total Households | 834 (100.0%) | 2.87 |
Household Size by Marriage Status in Lawson
Out of a total of 834 households in Lawson, 599 (71.8%) are family households, while 235 (28.2%) are nonfamily households. The most numerous type of family households are 2-person households, comprising 222, and the most common type of nonfamily households are 1-person households, comprising 198.
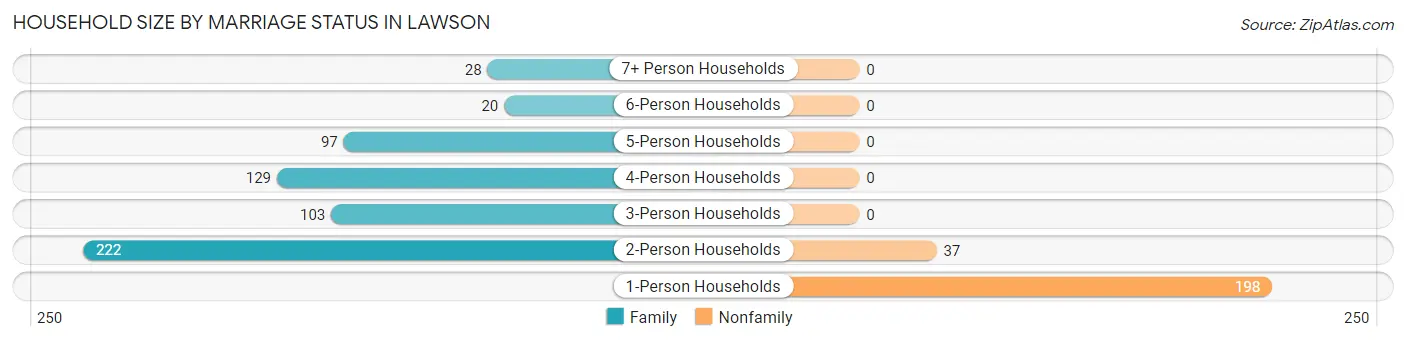
| Household Size | Family Households | Nonfamily Households |
| 1-Person Households | - | 198 (23.7%) |
| 2-Person Households | 222 (26.6%) | 37 (4.4%) |
| 3-Person Households | 103 (12.3%) | 0 (0.0%) |
| 4-Person Households | 129 (15.5%) | 0 (0.0%) |
| 5-Person Households | 97 (11.6%) | 0 (0.0%) |
| 6-Person Households | 20 (2.4%) | 0 (0.0%) |
| 7+ Person Households | 28 (3.4%) | 0 (0.0%) |
| Total | 599 (71.8%) | 235 (28.2%) |
Female Fertility in Lawson
Fertility by Age in Lawson
Average fertility rate in Lawson is 80.0 births per 1,000 women. Women in the age bracket of 20 to 34 years have the highest fertility rate with 141.0 births per 1,000 women. Women in the age bracket of 20 to 34 years acount for 93.6% of all women with births.
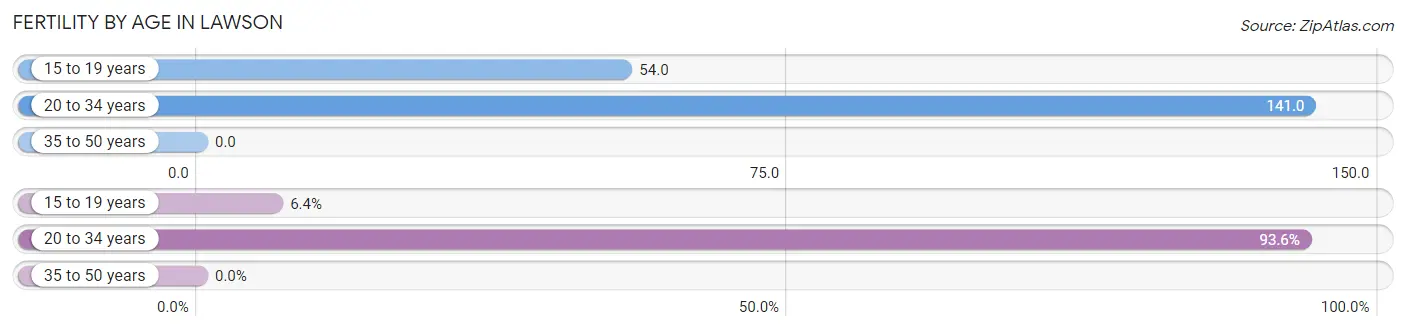
| Age Bracket | Women with Births | Births / 1,000 Women |
| 15 to 19 years | 3 (6.4%) | 54.0 |
| 20 to 34 years | 44 (93.6%) | 141.0 |
| 35 to 50 years | 0 (0.0%) | 0.0 |
| Total | 47 (100.0%) | 80.0 |
Fertility by Age by Marriage Status in Lawson
93.6% of women with births (47) in Lawson are married. The highest percentage of unmarried women with births falls into 15 to 19 years age bracket with 100.0% of them unmarried at the time of birth, while the lowest percentage of unmarried women with births belong to 20 to 34 years age bracket with 0.0% of them unmarried.
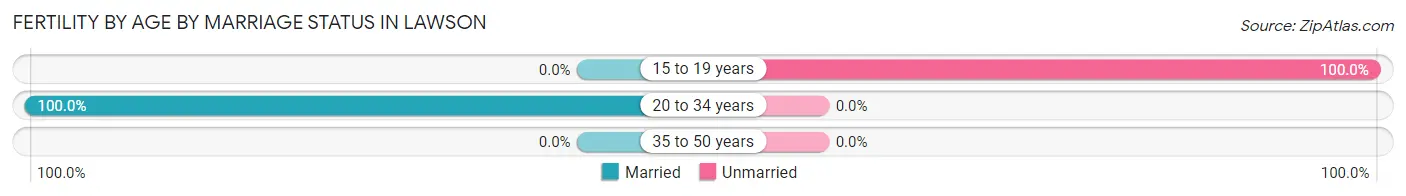
| Age Bracket | Married | Unmarried |
| 15 to 19 years | 0 (0.0%) | 3 (100.0%) |
| 20 to 34 years | 44 (100.0%) | 0 (0.0%) |
| 35 to 50 years | 0 (0.0%) | 0 (0.0%) |
| Total | 44 (93.6%) | 3 (6.4%) |
Fertility by Education in Lawson
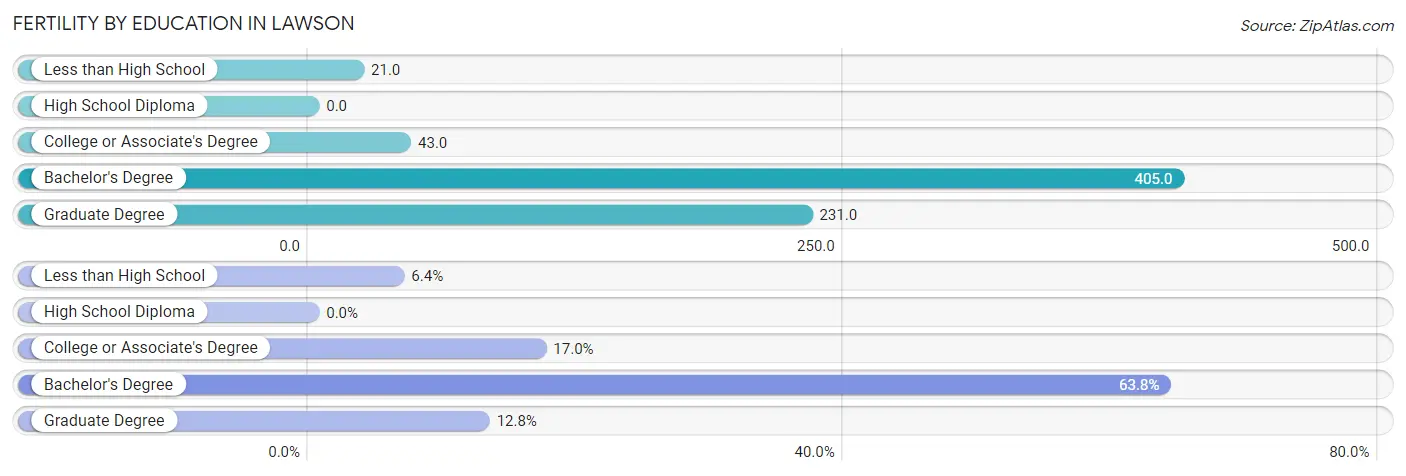
| Educational Attainment | Women with Births | Births / 1,000 Women |
| Less than High School | 3 (6.4%) | 21.0 |
| High School Diploma | 0 (0.0%) | 0.0 |
| College or Associate's Degree | 8 (17.0%) | 43.0 |
| Bachelor's Degree | 30 (63.8%) | 405.0 |
| Graduate Degree | 6 (12.8%) | 231.0 |
| Total | 47 (100.0%) | 80.0 |
Fertility by Education by Marriage Status in Lawson
6.4% of women with births in Lawson are unmarried. Women with the educational attainment of college or associate's degree are most likely to be married with 100.0% of them married at childbirth, while women with the educational attainment of less than high school are least likely to be married with 100.0% of them unmarried at childbirth.
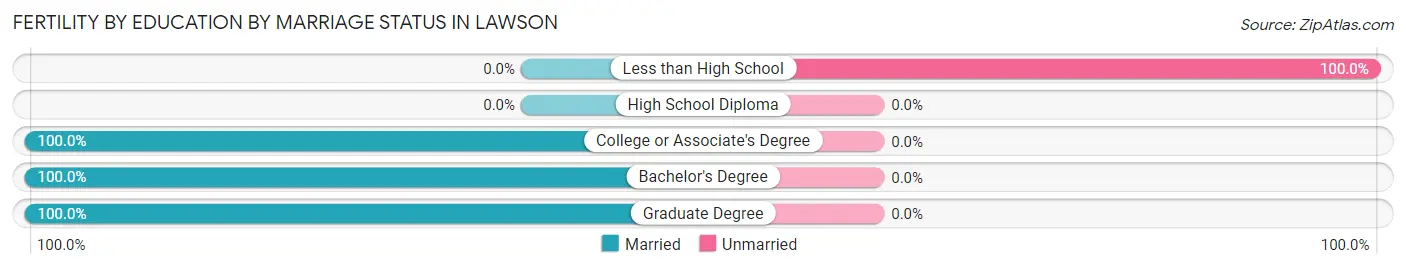
| Educational Attainment | Married | Unmarried |
| Less than High School | 0 (0.0%) | 3 (100.0%) |
| High School Diploma | 0 (0.0%) | 0 (0.0%) |
| College or Associate's Degree | 8 (100.0%) | 0 (0.0%) |
| Bachelor's Degree | 30 (100.0%) | 0 (0.0%) |
| Graduate Degree | 6 (100.0%) | 0 (0.0%) |
| Total | 44 (93.6%) | 3 (6.4%) |
Employment Characteristics in Lawson
Employment by Class of Employer in Lawson
Among the 1,041 employed individuals in Lawson, private company employees (809 | 77.7%), local government employees (59 | 5.7%), and not-for-profit organizations (50 | 4.8%) make up the most common classes of employment.
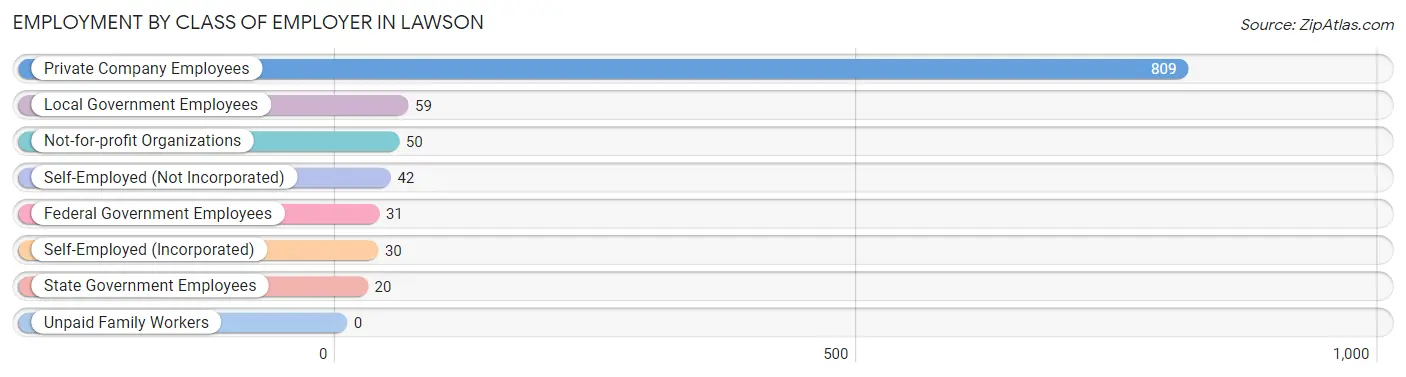
| Employer Class | # Employees | % Employees |
| Private Company Employees | 809 | 77.7% |
| Self-Employed (Incorporated) | 30 | 2.9% |
| Self-Employed (Not Incorporated) | 42 | 4.0% |
| Not-for-profit Organizations | 50 | 4.8% |
| Local Government Employees | 59 | 5.7% |
| State Government Employees | 20 | 1.9% |
| Federal Government Employees | 31 | 3.0% |
| Unpaid Family Workers | 0 | 0.0% |
| Total | 1,041 | 100.0% |
Employment Status by Age in Lawson
According to the labor force statistics for Lawson, out of the total population over 16 years of age (1,784), 61.0% or 1,088 individuals are in the labor force, with 3.1% or 34 of them unemployed. The age group with the highest labor force participation rate is 35 to 44 years, with 88.5% or 261 individuals in the labor force. Within the labor force, the 35 to 44 years age range has the highest percentage of unemployed individuals, with 13.0% or 34 of them being unemployed.
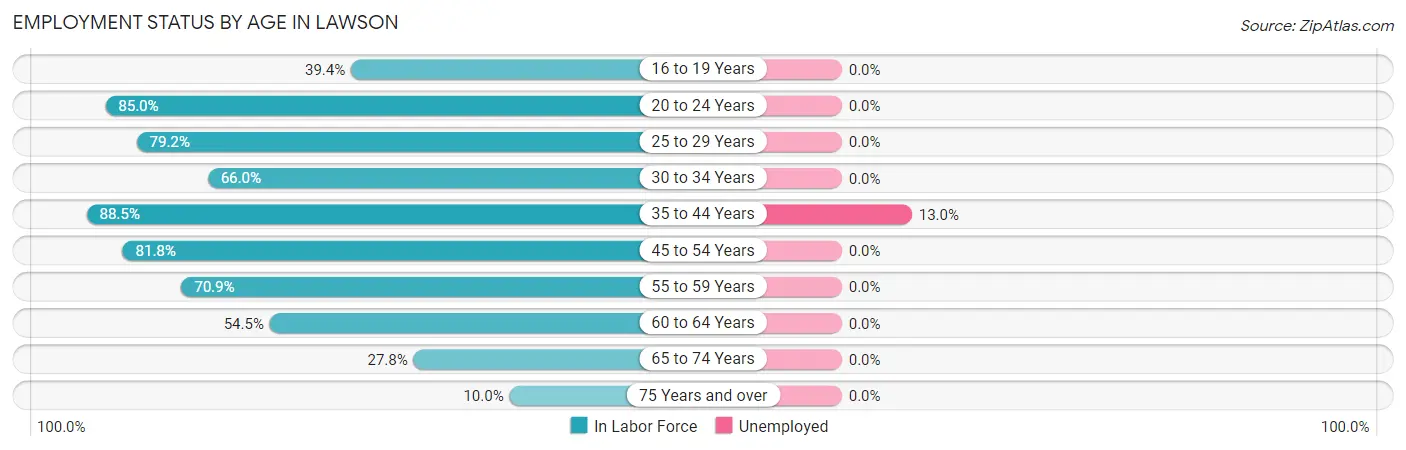
| Age Bracket | In Labor Force | Unemployed |
| 16 to 19 Years | 52 (39.4%) | 0 (0.0%) |
| 20 to 24 Years | 136 (85.0%) | 0 (0.0%) |
| 25 to 29 Years | 114 (79.2%) | 0 (0.0%) |
| 30 to 34 Years | 97 (66.0%) | 0 (0.0%) |
| 35 to 44 Years | 261 (88.5%) | 34 (13.0%) |
| 45 to 54 Years | 189 (81.8%) | 0 (0.0%) |
| 55 to 59 Years | 95 (70.9%) | 0 (0.0%) |
| 60 to 64 Years | 73 (54.5%) | 0 (0.0%) |
| 65 to 74 Years | 49 (27.8%) | 0 (0.0%) |
| 75 Years and over | 23 (10.0%) | 0 (0.0%) |
| Total | 1,088 (61.0%) | 34 (3.1%) |
Employment Status by Educational Attainment in Lawson
According to labor force statistics for Lawson, 76.4% of individuals (829) out of the total population between 25 and 64 years of age (1,085) are in the labor force, with 4.1% or 34 of them being unemployed. The group with the highest labor force participation rate are those with the educational attainment of high school diploma, with 84.0% or 335 individuals in the labor force. Within the labor force, individuals with less than high school education have the highest percentage of unemployment, with 25.0% or 24 of them being unemployed.
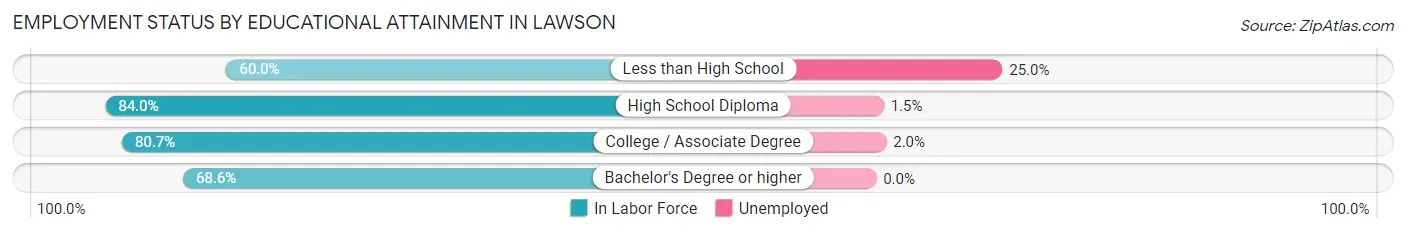
| Educational Attainment | In Labor Force | Unemployed |
| Less than High School | 96 (60.0%) | 40 (25.0%) |
| High School Diploma | 335 (84.0%) | 6 (1.5%) |
| College / Associate Degree | 247 (80.7%) | 6 (2.0%) |
| Bachelor's Degree or higher | 151 (68.6%) | 0 (0.0%) |
| Total | 829 (76.4%) | 44 (4.1%) |
Employment Occupations by Sex in Lawson
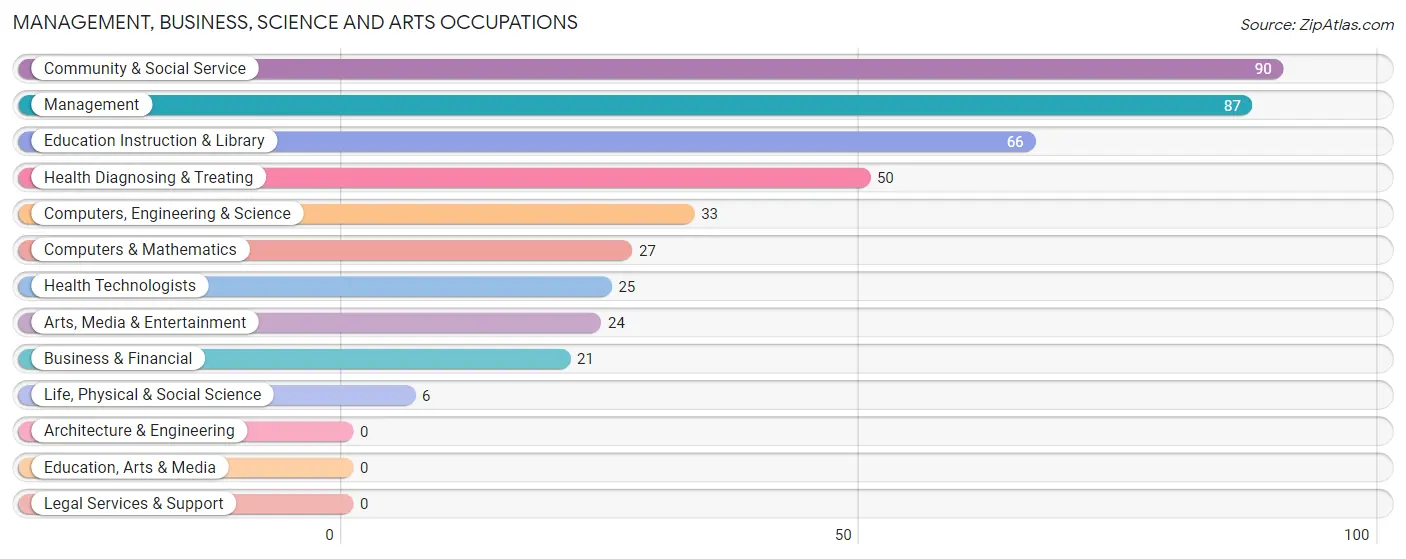
Management, Business, Science and Arts Occupations
The most common Management, Business, Science and Arts occupations in Lawson are Community & Social Service (90 | 8.5%), Management (87 | 8.3%), Education Instruction & Library (66 | 6.3%), Health Diagnosing & Treating (50 | 4.7%), and Computers, Engineering & Science (33 | 3.1%).
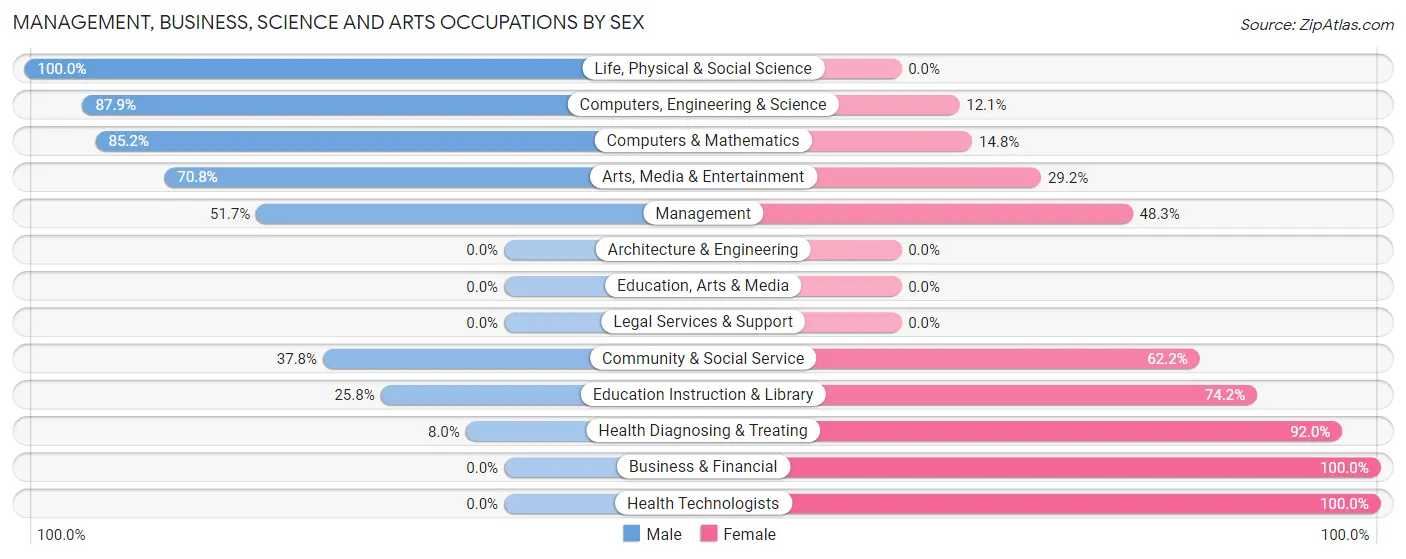
Management, Business, Science and Arts Occupations by Sex
Within the Management, Business, Science and Arts occupations in Lawson, the most male-oriented occupations are Life, Physical & Social Science (100.0%), Computers, Engineering & Science (87.9%), and Computers & Mathematics (85.2%), while the most female-oriented occupations are Business & Financial (100.0%), Health Technologists (100.0%), and Health Diagnosing & Treating (92.0%).
| Occupation | Male | Female |
| Management | 45 (51.7%) | 42 (48.3%) |
| Business & Financial | 0 (0.0%) | 21 (100.0%) |
| Computers, Engineering & Science | 29 (87.9%) | 4 (12.1%) |
| Computers & Mathematics | 23 (85.2%) | 4 (14.8%) |
| Architecture & Engineering | 0 (0.0%) | 0 (0.0%) |
| Life, Physical & Social Science | 6 (100.0%) | 0 (0.0%) |
| Community & Social Service | 34 (37.8%) | 56 (62.2%) |
| Education, Arts & Media | 0 (0.0%) | 0 (0.0%) |
| Legal Services & Support | 0 (0.0%) | 0 (0.0%) |
| Education Instruction & Library | 17 (25.8%) | 49 (74.2%) |
| Arts, Media & Entertainment | 17 (70.8%) | 7 (29.2%) |
| Health Diagnosing & Treating | 4 (8.0%) | 46 (92.0%) |
| Health Technologists | 0 (0.0%) | 25 (100.0%) |
| Total (Category) | 112 (39.9%) | 169 (60.1%) |
| Total (Overall) | 508 (48.1%) | 547 (51.8%) |
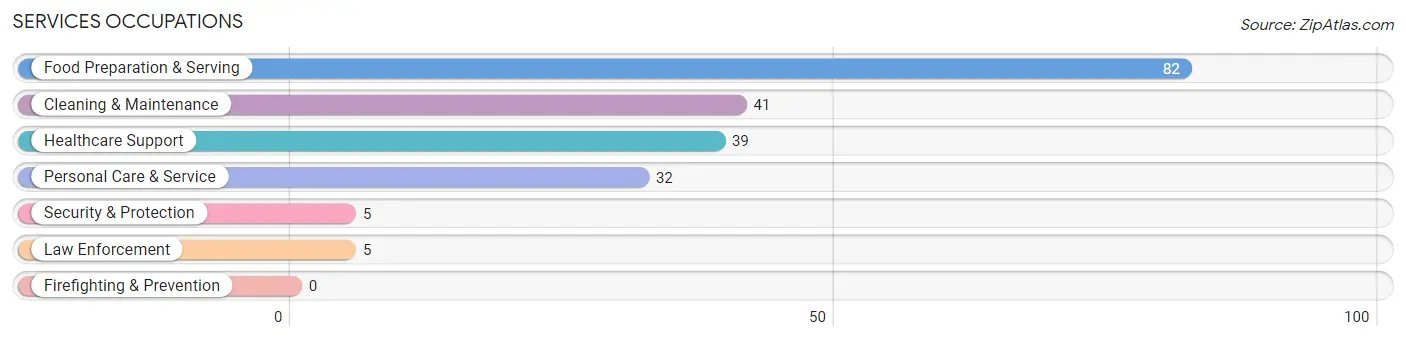
Services Occupations
The most common Services occupations in Lawson are Food Preparation & Serving (82 | 7.8%), Cleaning & Maintenance (41 | 3.9%), Healthcare Support (39 | 3.7%), Personal Care & Service (32 | 3.0%), and Security & Protection (5 | 0.5%).
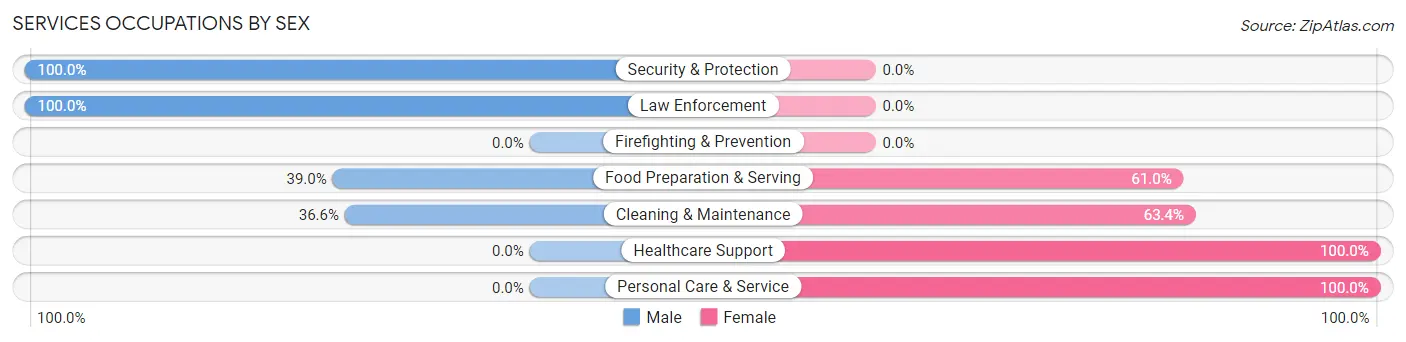
Services Occupations by Sex
Within the Services occupations in Lawson, the most male-oriented occupations are Security & Protection (100.0%), Law Enforcement (100.0%), and Food Preparation & Serving (39.0%), while the most female-oriented occupations are Healthcare Support (100.0%), Personal Care & Service (100.0%), and Cleaning & Maintenance (63.4%).
| Occupation | Male | Female |
| Healthcare Support | 0 (0.0%) | 39 (100.0%) |
| Security & Protection | 5 (100.0%) | 0 (0.0%) |
| Firefighting & Prevention | 0 (0.0%) | 0 (0.0%) |
| Law Enforcement | 5 (100.0%) | 0 (0.0%) |
| Food Preparation & Serving | 32 (39.0%) | 50 (61.0%) |
| Cleaning & Maintenance | 15 (36.6%) | 26 (63.4%) |
| Personal Care & Service | 0 (0.0%) | 32 (100.0%) |
| Total (Category) | 52 (26.1%) | 147 (73.9%) |
| Total (Overall) | 508 (48.1%) | 547 (51.8%) |
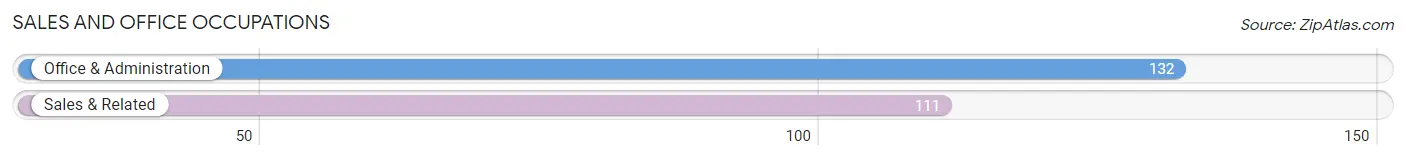
Sales and Office Occupations
The most common Sales and Office occupations in Lawson are Office & Administration (132 | 12.5%), and Sales & Related (111 | 10.5%).
Sales and Office Occupations by Sex
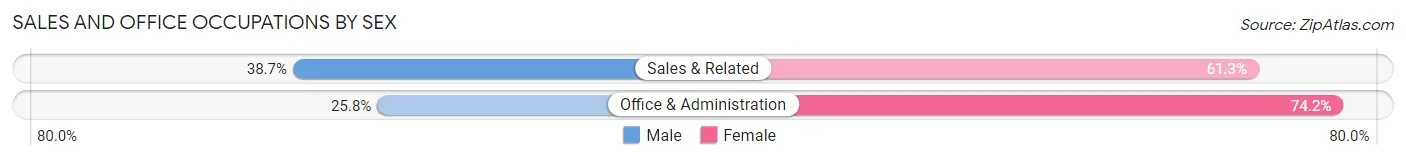
| Occupation | Male | Female |
| Sales & Related | 43 (38.7%) | 68 (61.3%) |
| Office & Administration | 34 (25.8%) | 98 (74.2%) |
| Total (Category) | 77 (31.7%) | 166 (68.3%) |
| Total (Overall) | 508 (48.1%) | 547 (51.8%) |
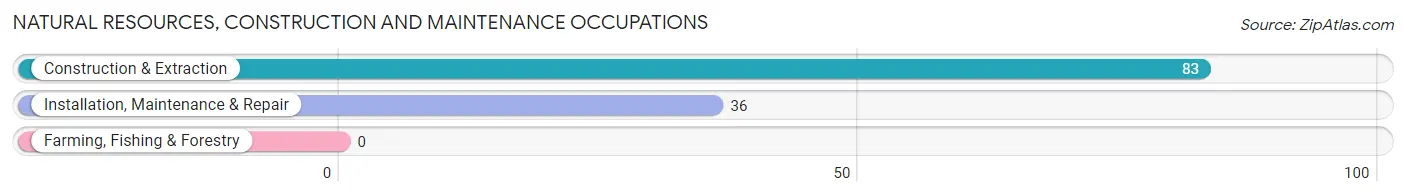
Natural Resources, Construction and Maintenance Occupations
The most common Natural Resources, Construction and Maintenance occupations in Lawson are Construction & Extraction (83 | 7.9%), and Installation, Maintenance & Repair (36 | 3.4%).
Natural Resources, Construction and Maintenance Occupations by Sex
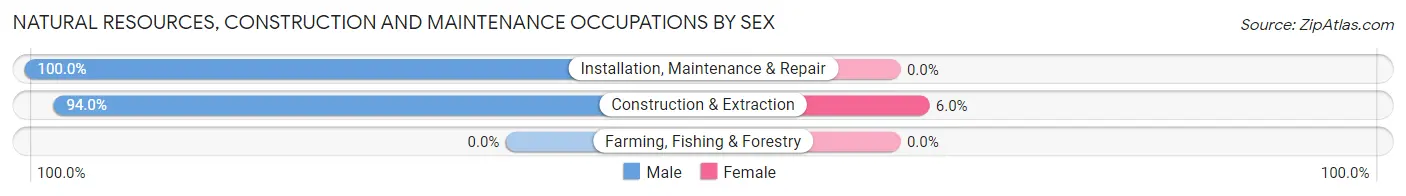
| Occupation | Male | Female |
| Farming, Fishing & Forestry | 0 (0.0%) | 0 (0.0%) |
| Construction & Extraction | 78 (94.0%) | 5 (6.0%) |
| Installation, Maintenance & Repair | 36 (100.0%) | 0 (0.0%) |
| Total (Category) | 114 (95.8%) | 5 (4.2%) |
| Total (Overall) | 508 (48.1%) | 547 (51.8%) |
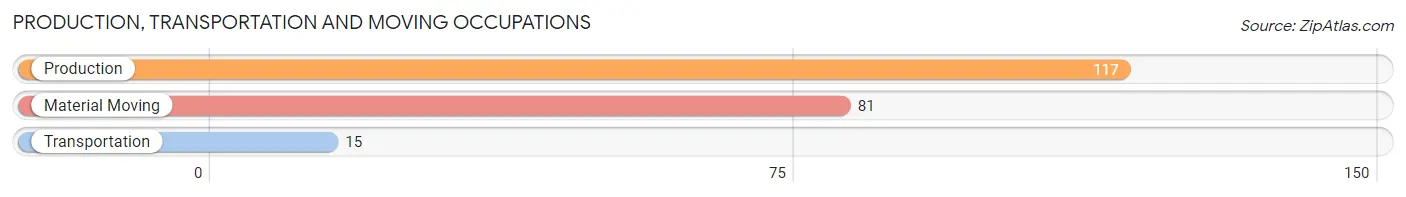
Production, Transportation and Moving Occupations
The most common Production, Transportation and Moving occupations in Lawson are Production (117 | 11.1%), Material Moving (81 | 7.7%), and Transportation (15 | 1.4%).
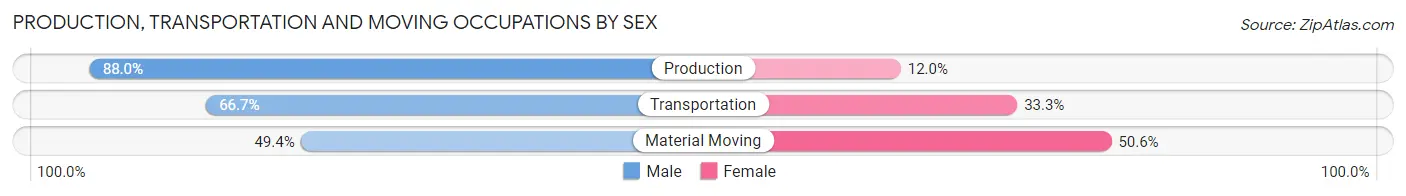
Production, Transportation and Moving Occupations by Sex
| Occupation | Male | Female |
| Production | 103 (88.0%) | 14 (12.0%) |
| Transportation | 10 (66.7%) | 5 (33.3%) |
| Material Moving | 40 (49.4%) | 41 (50.6%) |
| Total (Category) | 153 (71.8%) | 60 (28.2%) |
| Total (Overall) | 508 (48.1%) | 547 (51.8%) |
Employment Industries by Sex in Lawson
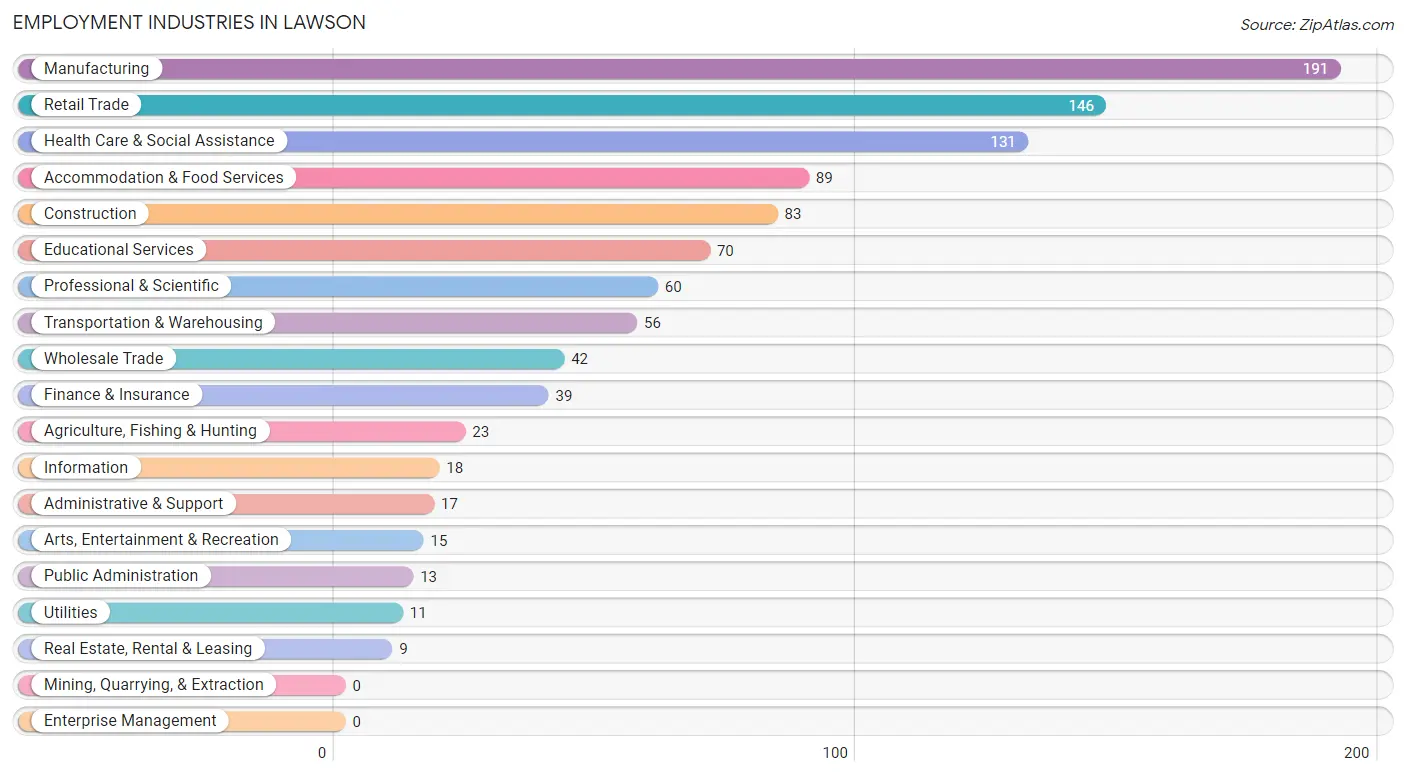
Employment Industries in Lawson
The major employment industries in Lawson include Manufacturing (191 | 18.1%), Retail Trade (146 | 13.8%), Health Care & Social Assistance (131 | 12.4%), Accommodation & Food Services (89 | 8.4%), and Construction (83 | 7.9%).
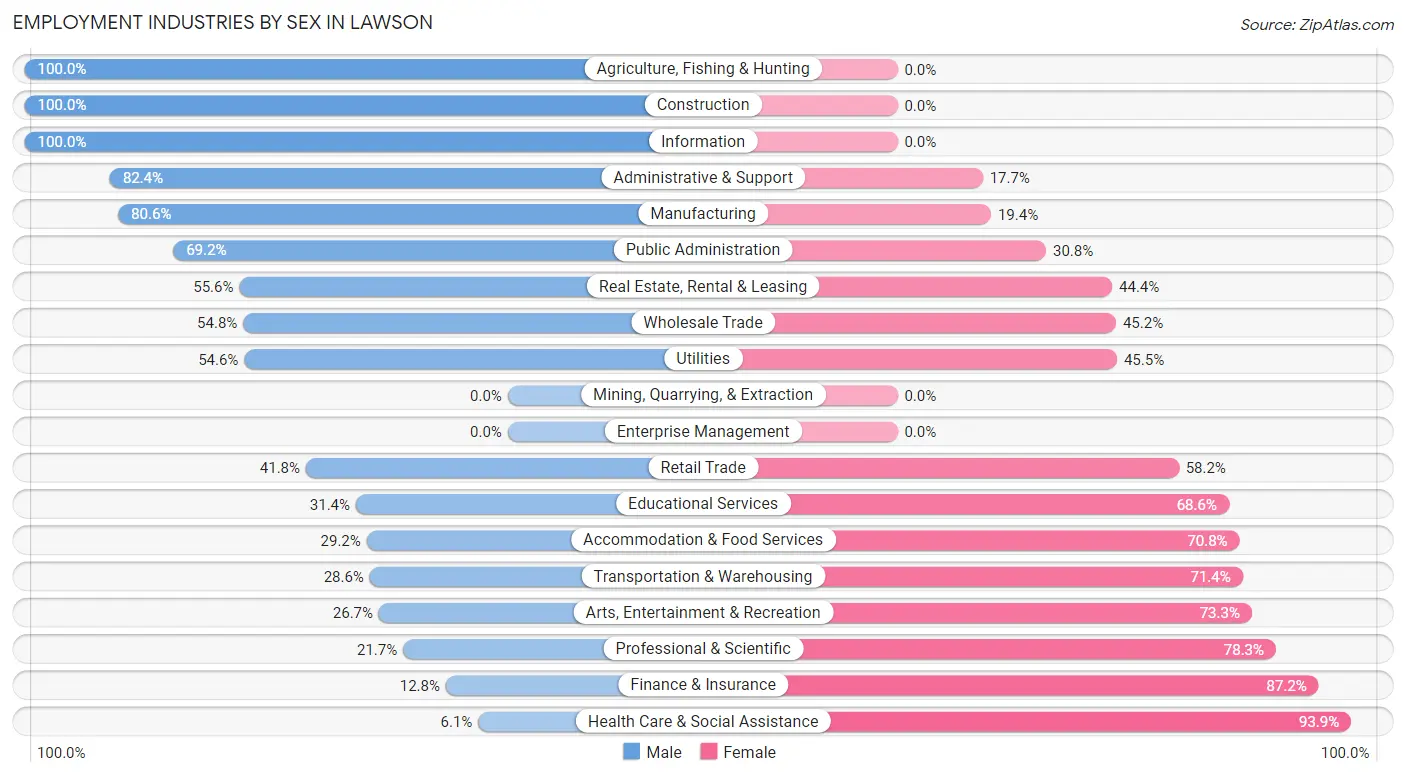
Employment Industries by Sex in Lawson
The Lawson industries that see more men than women are Agriculture, Fishing & Hunting (100.0%), Construction (100.0%), and Information (100.0%), whereas the industries that tend to have a higher number of women are Health Care & Social Assistance (93.9%), Finance & Insurance (87.2%), and Professional & Scientific (78.3%).
| Industry | Male | Female |
| Agriculture, Fishing & Hunting | 23 (100.0%) | 0 (0.0%) |
| Mining, Quarrying, & Extraction | 0 (0.0%) | 0 (0.0%) |
| Construction | 83 (100.0%) | 0 (0.0%) |
| Manufacturing | 154 (80.6%) | 37 (19.4%) |
| Wholesale Trade | 23 (54.8%) | 19 (45.2%) |
| Retail Trade | 61 (41.8%) | 85 (58.2%) |
| Transportation & Warehousing | 16 (28.6%) | 40 (71.4%) |
| Utilities | 6 (54.5%) | 5 (45.5%) |
| Information | 18 (100.0%) | 0 (0.0%) |
| Finance & Insurance | 5 (12.8%) | 34 (87.2%) |
| Real Estate, Rental & Leasing | 5 (55.6%) | 4 (44.4%) |
| Professional & Scientific | 13 (21.7%) | 47 (78.3%) |
| Enterprise Management | 0 (0.0%) | 0 (0.0%) |
| Administrative & Support | 14 (82.4%) | 3 (17.6%) |
| Educational Services | 22 (31.4%) | 48 (68.6%) |
| Health Care & Social Assistance | 8 (6.1%) | 123 (93.9%) |
| Arts, Entertainment & Recreation | 4 (26.7%) | 11 (73.3%) |
| Accommodation & Food Services | 26 (29.2%) | 63 (70.8%) |
| Public Administration | 9 (69.2%) | 4 (30.8%) |
| Total | 508 (48.1%) | 547 (51.8%) |
Education in Lawson
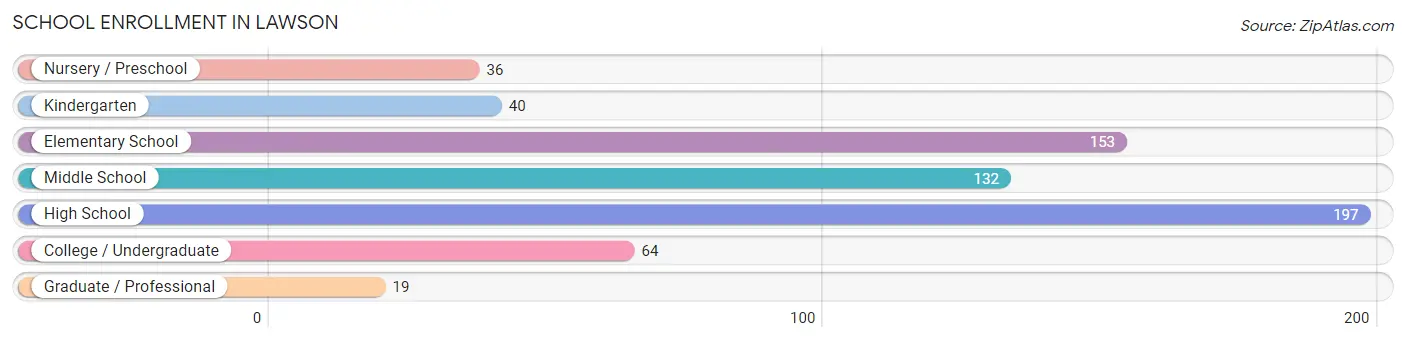
School Enrollment in Lawson
The most common levels of schooling among the 641 students in Lawson are high school (197 | 30.7%), elementary school (153 | 23.9%), and middle school (132 | 20.6%).
| School Level | # Students | % Students |
| Nursery / Preschool | 36 | 5.6% |
| Kindergarten | 40 | 6.2% |
| Elementary School | 153 | 23.9% |
| Middle School | 132 | 20.6% |
| High School | 197 | 30.7% |
| College / Undergraduate | 64 | 10.0% |
| Graduate / Professional | 19 | 3.0% |
| Total | 641 | 100.0% |
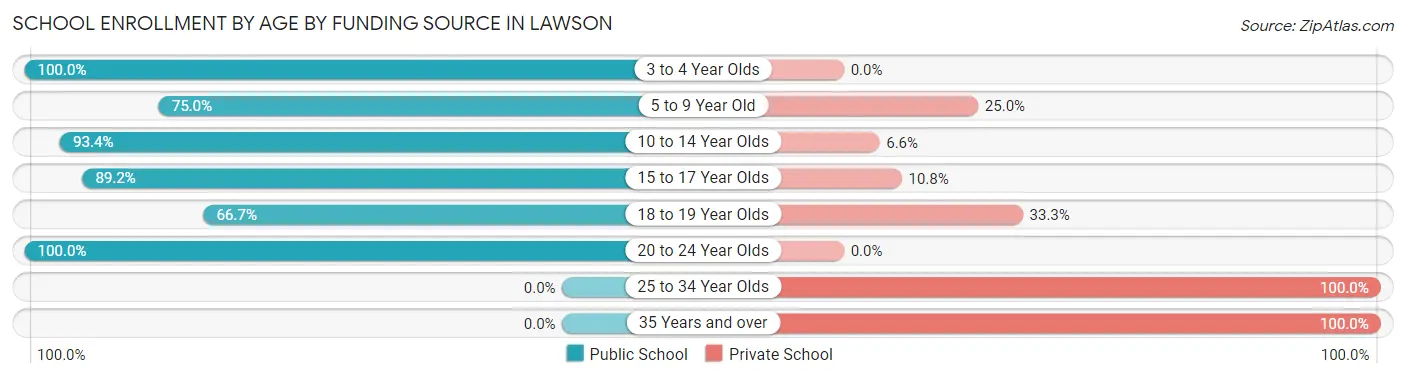
School Enrollment by Age by Funding Source in Lawson
Out of a total of 641 students who are enrolled in schools in Lawson, 102 (15.9%) attend a private institution, while the remaining 539 (84.1%) are enrolled in public schools. The age group of 25 to 34 year olds has the highest likelihood of being enrolled in private schools, with 12 (100.0% in the age bracket) enrolled. Conversely, the age group of 3 to 4 year olds has the lowest likelihood of being enrolled in a private school, with 12 (100.0% in the age bracket) attending a public institution.
| Age Bracket | Public School | Private School |
| 3 to 4 Year Olds | 12 (100.0%) | 0 (0.0%) |
| 5 to 9 Year Old | 144 (75.0%) | 48 (25.0%) |
| 10 to 14 Year Olds | 155 (93.4%) | 11 (6.6%) |
| 15 to 17 Year Olds | 149 (89.2%) | 18 (10.8%) |
| 18 to 19 Year Olds | 14 (66.7%) | 7 (33.3%) |
| 20 to 24 Year Olds | 65 (100.0%) | 0 (0.0%) |
| 25 to 34 Year Olds | 0 (0.0%) | 12 (100.0%) |
| 35 Years and over | 0 (0.0%) | 6 (100.0%) |
| Total | 539 (84.1%) | 102 (15.9%) |
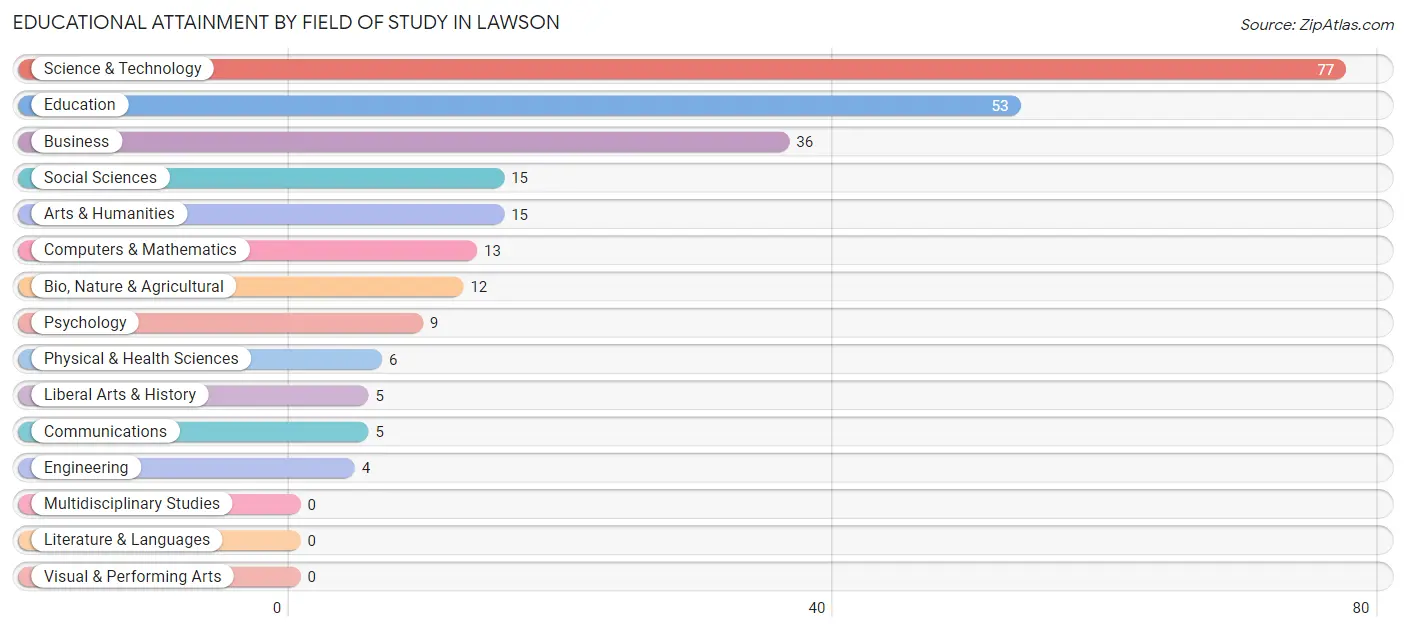
Educational Attainment by Field of Study in Lawson
Science & technology (77 | 30.8%), education (53 | 21.2%), business (36 | 14.4%), social sciences (15 | 6.0%), and arts & humanities (15 | 6.0%) are the most common fields of study among 250 individuals in Lawson who have obtained a bachelor's degree or higher.
| Field of Study | # Graduates | % Graduates |
| Computers & Mathematics | 13 | 5.2% |
| Bio, Nature & Agricultural | 12 | 4.8% |
| Physical & Health Sciences | 6 | 2.4% |
| Psychology | 9 | 3.6% |
| Social Sciences | 15 | 6.0% |
| Engineering | 4 | 1.6% |
| Multidisciplinary Studies | 0 | 0.0% |
| Science & Technology | 77 | 30.8% |
| Business | 36 | 14.4% |
| Education | 53 | 21.2% |
| Literature & Languages | 0 | 0.0% |
| Liberal Arts & History | 5 | 2.0% |
| Visual & Performing Arts | 0 | 0.0% |
| Communications | 5 | 2.0% |
| Arts & Humanities | 15 | 6.0% |
| Total | 250 | 100.0% |
Transportation & Commute in Lawson
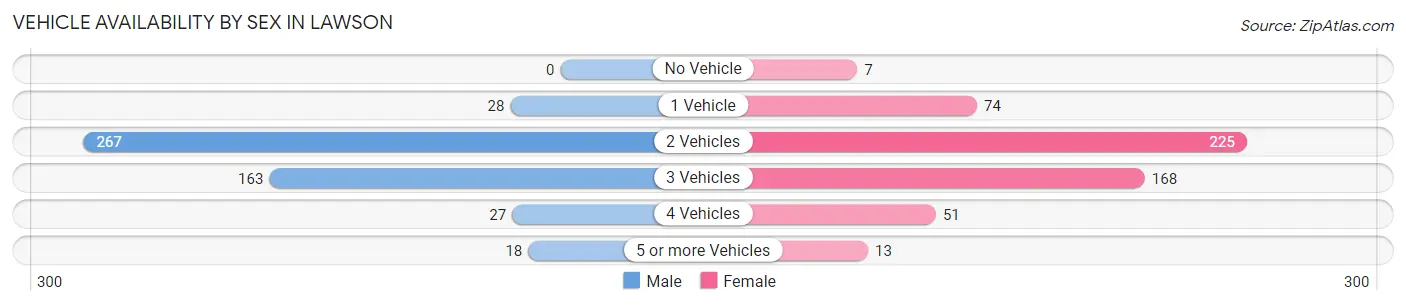
Vehicle Availability by Sex in Lawson
The most prevalent vehicle ownership categories in Lawson are males with 2 vehicles (267, accounting for 53.1%) and females with 2 vehicles (225, making up 49.6%).
| Vehicles Available | Male | Female |
| No Vehicle | 0 (0.0%) | 7 (1.3%) |
| 1 Vehicle | 28 (5.6%) | 74 (13.8%) |
| 2 Vehicles | 267 (53.1%) | 225 (41.8%) |
| 3 Vehicles | 163 (32.4%) | 168 (31.2%) |
| 4 Vehicles | 27 (5.4%) | 51 (9.5%) |
| 5 or more Vehicles | 18 (3.6%) | 13 (2.4%) |
| Total | 503 (100.0%) | 538 (100.0%) |
Commute Time in Lawson
The most frequently occuring commute durations in Lawson are 45 to 59 minutes (178 commuters, 18.3%), 15 to 19 minutes (137 commuters, 14.1%), and 10 to 14 minutes (134 commuters, 13.8%).
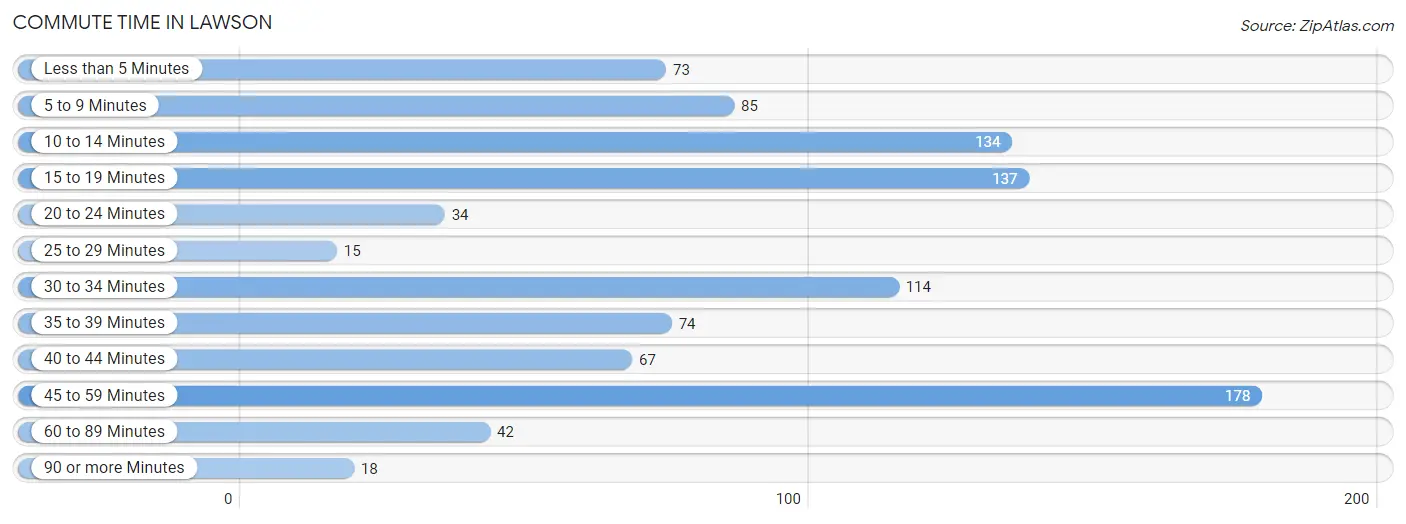
| Commute Time | # Commuters | % Commuters |
| Less than 5 Minutes | 73 | 7.5% |
| 5 to 9 Minutes | 85 | 8.7% |
| 10 to 14 Minutes | 134 | 13.8% |
| 15 to 19 Minutes | 137 | 14.1% |
| 20 to 24 Minutes | 34 | 3.5% |
| 25 to 29 Minutes | 15 | 1.5% |
| 30 to 34 Minutes | 114 | 11.7% |
| 35 to 39 Minutes | 74 | 7.6% |
| 40 to 44 Minutes | 67 | 6.9% |
| 45 to 59 Minutes | 178 | 18.3% |
| 60 to 89 Minutes | 42 | 4.3% |
| 90 or more Minutes | 18 | 1.8% |
Commute Time by Sex in Lawson
The most common commute times in Lawson are 45 to 59 minutes (109 commuters, 23.8%) for males and 15 to 19 minutes (92 commuters, 17.9%) for females.
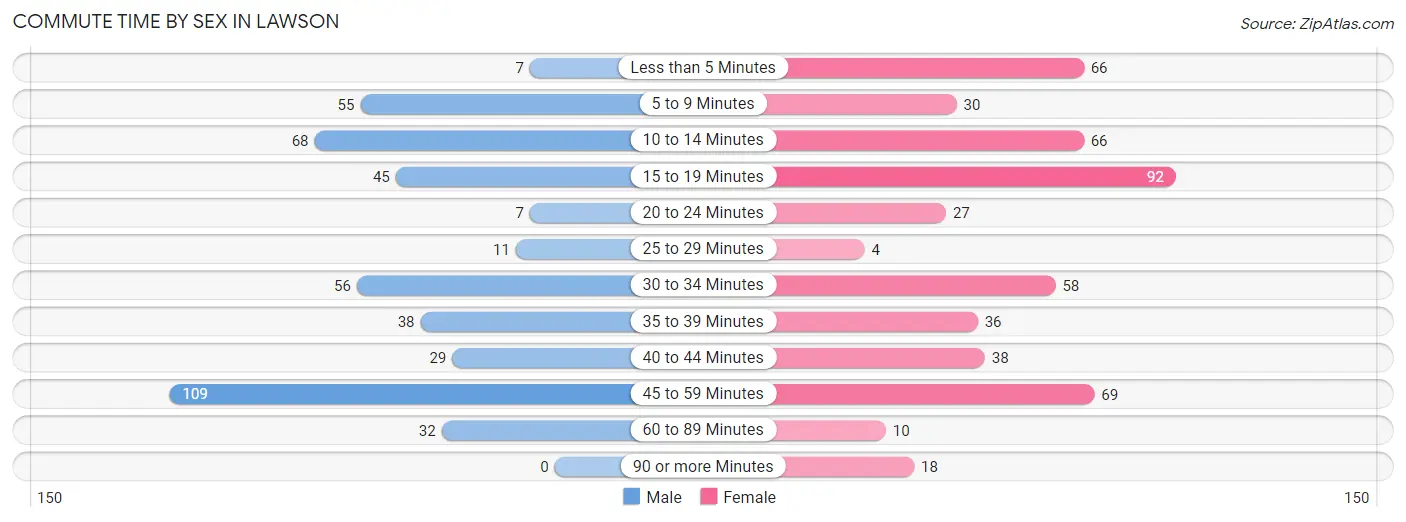
| Commute Time | Male | Female |
| Less than 5 Minutes | 7 (1.5%) | 66 (12.8%) |
| 5 to 9 Minutes | 55 (12.0%) | 30 (5.8%) |
| 10 to 14 Minutes | 68 (14.9%) | 66 (12.8%) |
| 15 to 19 Minutes | 45 (9.9%) | 92 (17.9%) |
| 20 to 24 Minutes | 7 (1.5%) | 27 (5.2%) |
| 25 to 29 Minutes | 11 (2.4%) | 4 (0.8%) |
| 30 to 34 Minutes | 56 (12.2%) | 58 (11.3%) |
| 35 to 39 Minutes | 38 (8.3%) | 36 (7.0%) |
| 40 to 44 Minutes | 29 (6.4%) | 38 (7.4%) |
| 45 to 59 Minutes | 109 (23.8%) | 69 (13.4%) |
| 60 to 89 Minutes | 32 (7.0%) | 10 (1.9%) |
| 90 or more Minutes | 0 (0.0%) | 18 (3.5%) |
Time of Departure to Work by Sex in Lawson
The most frequent times of departure to work in Lawson are 12:00 AM to 4:59 AM (115, 25.2%) for males and 7:30 AM to 7:59 AM (74, 14.4%) for females.
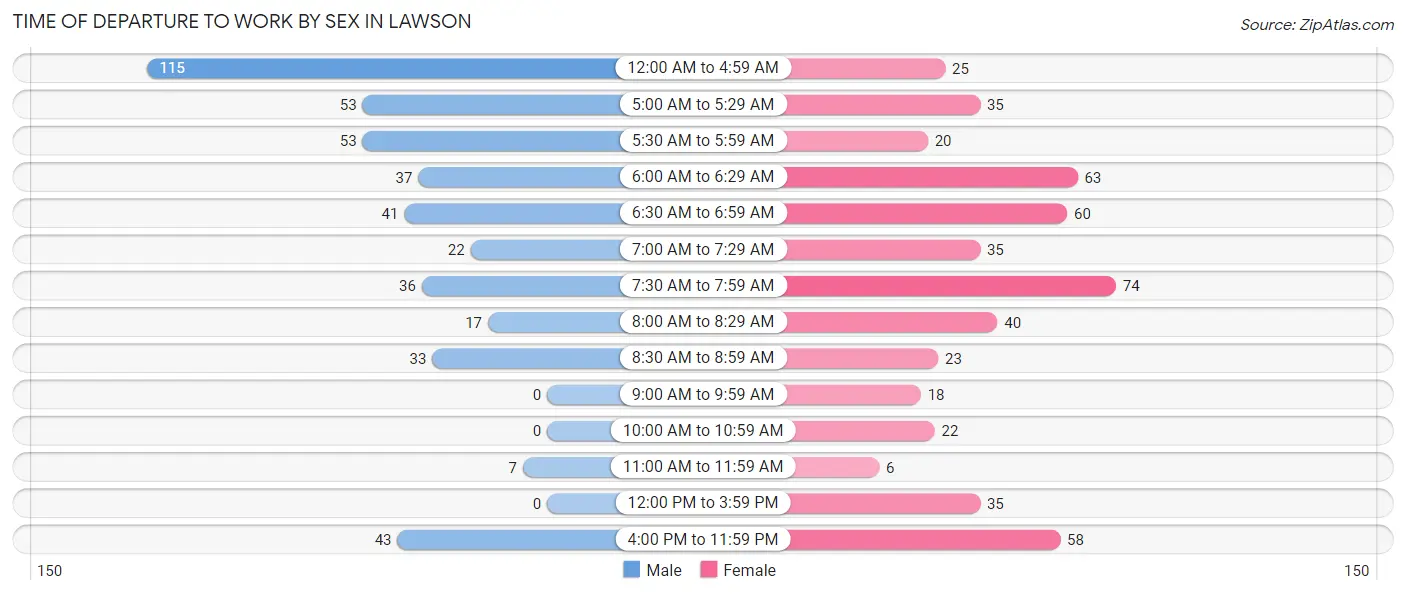
| Time of Departure | Male | Female |
| 12:00 AM to 4:59 AM | 115 (25.2%) | 25 (4.9%) |
| 5:00 AM to 5:29 AM | 53 (11.6%) | 35 (6.8%) |
| 5:30 AM to 5:59 AM | 53 (11.6%) | 20 (3.9%) |
| 6:00 AM to 6:29 AM | 37 (8.1%) | 63 (12.3%) |
| 6:30 AM to 6:59 AM | 41 (9.0%) | 60 (11.7%) |
| 7:00 AM to 7:29 AM | 22 (4.8%) | 35 (6.8%) |
| 7:30 AM to 7:59 AM | 36 (7.9%) | 74 (14.4%) |
| 8:00 AM to 8:29 AM | 17 (3.7%) | 40 (7.8%) |
| 8:30 AM to 8:59 AM | 33 (7.2%) | 23 (4.5%) |
| 9:00 AM to 9:59 AM | 0 (0.0%) | 18 (3.5%) |
| 10:00 AM to 10:59 AM | 0 (0.0%) | 22 (4.3%) |
| 11:00 AM to 11:59 AM | 7 (1.5%) | 6 (1.2%) |
| 12:00 PM to 3:59 PM | 0 (0.0%) | 35 (6.8%) |
| 4:00 PM to 11:59 PM | 43 (9.4%) | 58 (11.3%) |
| Total | 457 (100.0%) | 514 (100.0%) |
Housing Occupancy in Lawson
Occupancy by Ownership in Lawson
Of the total 834 dwellings in Lawson, owner-occupied units account for 614 (73.6%), while renter-occupied units make up 220 (26.4%).
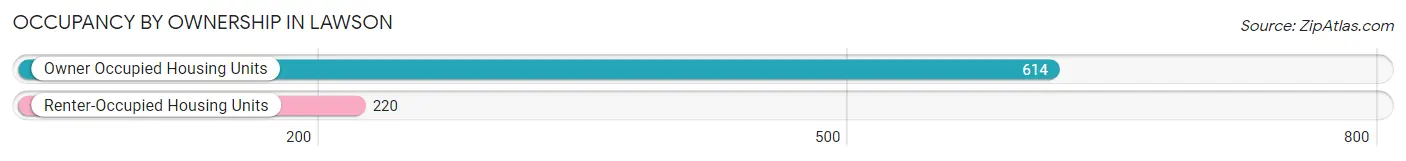
| Occupancy | # Housing Units | % Housing Units |
| Owner Occupied Housing Units | 614 | 73.6% |
| Renter-Occupied Housing Units | 220 | 26.4% |
| Total Occupied Housing Units | 834 | 100.0% |
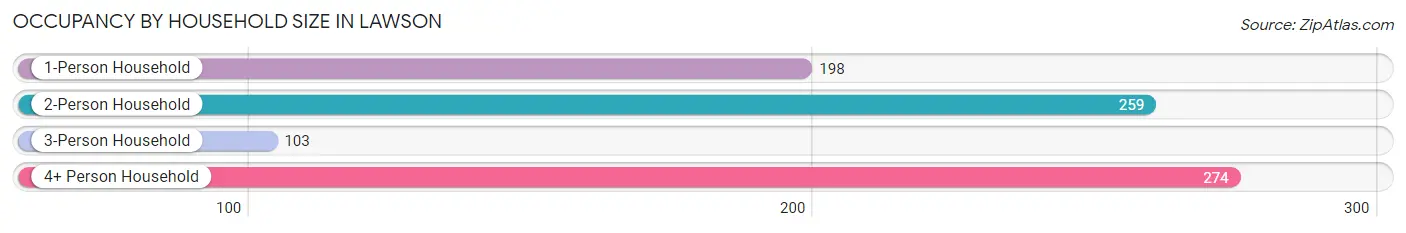
Occupancy by Household Size in Lawson
| Household Size | # Housing Units | % Housing Units |
| 1-Person Household | 198 | 23.7% |
| 2-Person Household | 259 | 31.1% |
| 3-Person Household | 103 | 12.3% |
| 4+ Person Household | 274 | 32.9% |
| Total Housing Units | 834 | 100.0% |
Occupancy by Ownership by Household Size in Lawson
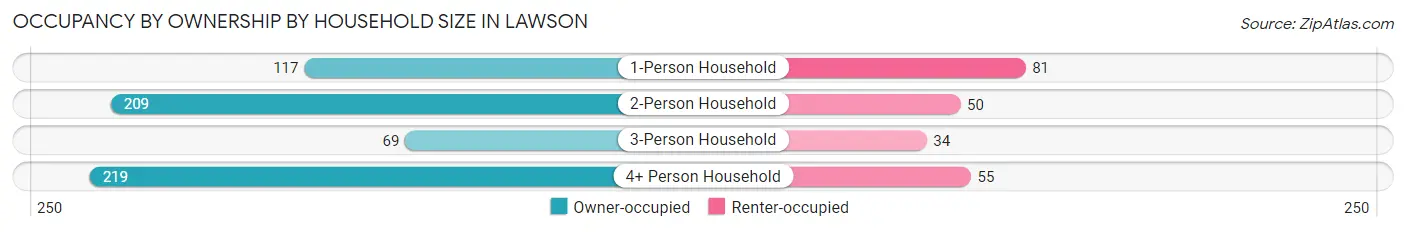
| Household Size | Owner-occupied | Renter-occupied |
| 1-Person Household | 117 (59.1%) | 81 (40.9%) |
| 2-Person Household | 209 (80.7%) | 50 (19.3%) |
| 3-Person Household | 69 (67.0%) | 34 (33.0%) |
| 4+ Person Household | 219 (79.9%) | 55 (20.1%) |
| Total Housing Units | 614 (73.6%) | 220 (26.4%) |
Occupancy by Educational Attainment in Lawson
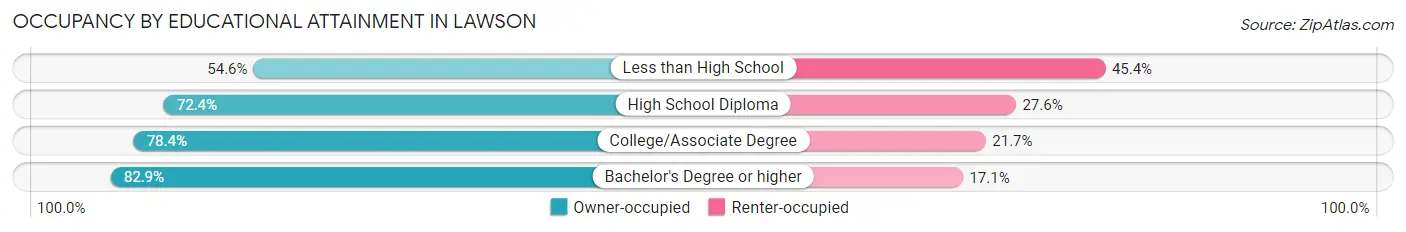
| Household Size | Owner-occupied | Renter-occupied |
| Less than High School | 53 (54.6%) | 44 (45.4%) |
| High School Diploma | 283 (72.4%) | 108 (27.6%) |
| College/Associate Degree | 152 (78.3%) | 42 (21.6%) |
| Bachelor's Degree or higher | 126 (82.9%) | 26 (17.1%) |
Occupancy by Age of Householder in Lawson
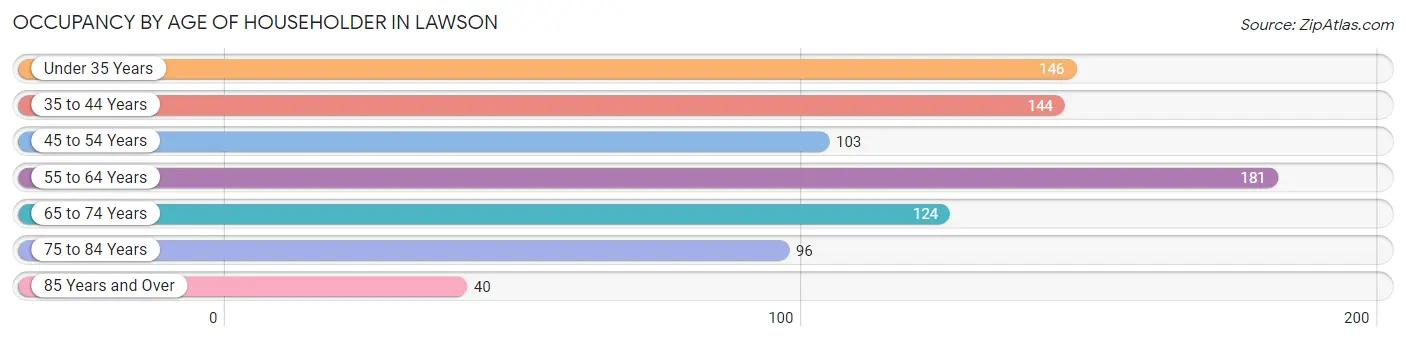
| Age Bracket | # Households | % Households |
| Under 35 Years | 146 | 17.5% |
| 35 to 44 Years | 144 | 17.3% |
| 45 to 54 Years | 103 | 12.3% |
| 55 to 64 Years | 181 | 21.7% |
| 65 to 74 Years | 124 | 14.9% |
| 75 to 84 Years | 96 | 11.5% |
| 85 Years and Over | 40 | 4.8% |
| Total | 834 | 100.0% |
Housing Finances in Lawson
Median Income by Occupancy in Lawson
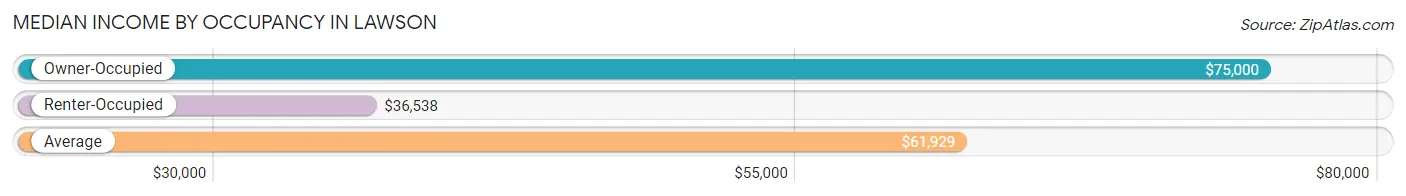
| Occupancy Type | # Households | Median Income |
| Owner-Occupied | 614 (73.6%) | $75,000 |
| Renter-Occupied | 220 (26.4%) | $36,538 |
| Average | 834 (100.0%) | $61,929 |
Occupancy by Householder Income Bracket in Lawson
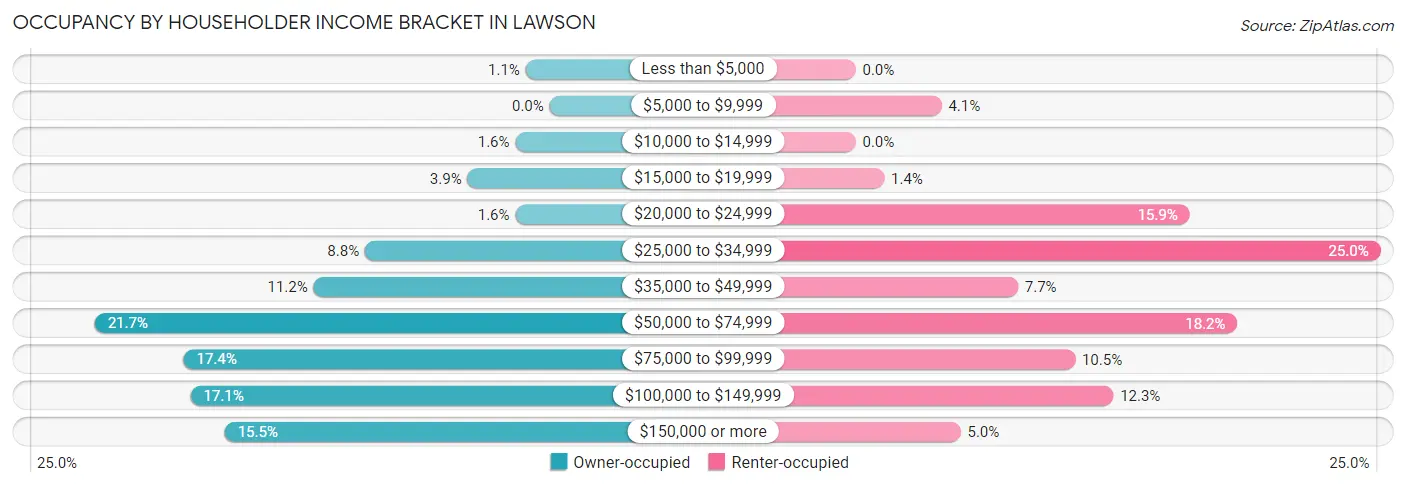
| Income Bracket | Owner-occupied | Renter-occupied |
| Less than $5,000 | 7 (1.1%) | 0 (0.0%) |
| $5,000 to $9,999 | 0 (0.0%) | 9 (4.1%) |
| $10,000 to $14,999 | 10 (1.6%) | 0 (0.0%) |
| $15,000 to $19,999 | 24 (3.9%) | 3 (1.4%) |
| $20,000 to $24,999 | 10 (1.6%) | 35 (15.9%) |
| $25,000 to $34,999 | 54 (8.8%) | 55 (25.0%) |
| $35,000 to $49,999 | 69 (11.2%) | 17 (7.7%) |
| $50,000 to $74,999 | 133 (21.7%) | 40 (18.2%) |
| $75,000 to $99,999 | 107 (17.4%) | 23 (10.4%) |
| $100,000 to $149,999 | 105 (17.1%) | 27 (12.3%) |
| $150,000 or more | 95 (15.5%) | 11 (5.0%) |
| Total | 614 (100.0%) | 220 (100.0%) |
Monthly Housing Cost Tiers in Lawson
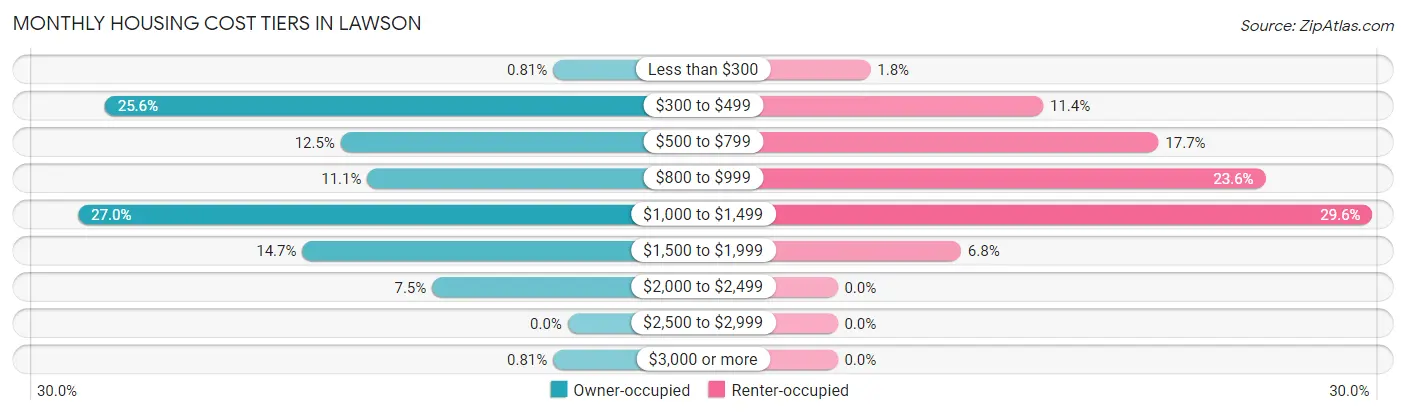
| Monthly Cost | Owner-occupied | Renter-occupied |
| Less than $300 | 5 (0.8%) | 4 (1.8%) |
| $300 to $499 | 157 (25.6%) | 25 (11.4%) |
| $500 to $799 | 77 (12.5%) | 39 (17.7%) |
| $800 to $999 | 68 (11.1%) | 52 (23.6%) |
| $1,000 to $1,499 | 166 (27.0%) | 65 (29.5%) |
| $1,500 to $1,999 | 90 (14.7%) | 15 (6.8%) |
| $2,000 to $2,499 | 46 (7.5%) | 0 (0.0%) |
| $2,500 to $2,999 | 0 (0.0%) | 0 (0.0%) |
| $3,000 or more | 5 (0.8%) | 0 (0.0%) |
| Total | 614 (100.0%) | 220 (100.0%) |
Physical Housing Characteristics in Lawson
Housing Structures in Lawson
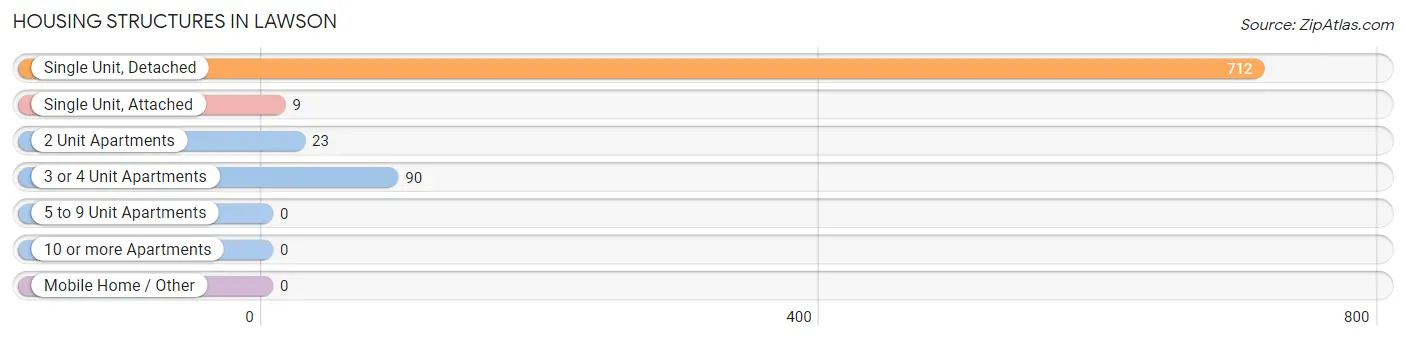
| Structure Type | # Housing Units | % Housing Units |
| Single Unit, Detached | 712 | 85.4% |
| Single Unit, Attached | 9 | 1.1% |
| 2 Unit Apartments | 23 | 2.8% |
| 3 or 4 Unit Apartments | 90 | 10.8% |
| 5 to 9 Unit Apartments | 0 | 0.0% |
| 10 or more Apartments | 0 | 0.0% |
| Mobile Home / Other | 0 | 0.0% |
| Total | 834 | 100.0% |
Housing Structures by Occupancy in Lawson
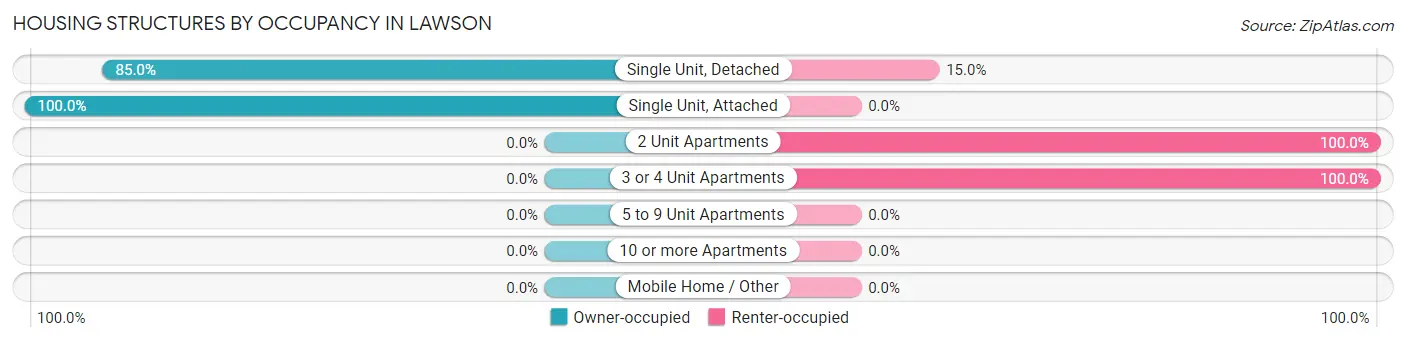
| Structure Type | Owner-occupied | Renter-occupied |
| Single Unit, Detached | 605 (85.0%) | 107 (15.0%) |
| Single Unit, Attached | 9 (100.0%) | 0 (0.0%) |
| 2 Unit Apartments | 0 (0.0%) | 23 (100.0%) |
| 3 or 4 Unit Apartments | 0 (0.0%) | 90 (100.0%) |
| 5 to 9 Unit Apartments | 0 (0.0%) | 0 (0.0%) |
| 10 or more Apartments | 0 (0.0%) | 0 (0.0%) |
| Mobile Home / Other | 0 (0.0%) | 0 (0.0%) |
| Total | 614 (73.6%) | 220 (26.4%) |
Housing Structures by Number of Rooms in Lawson
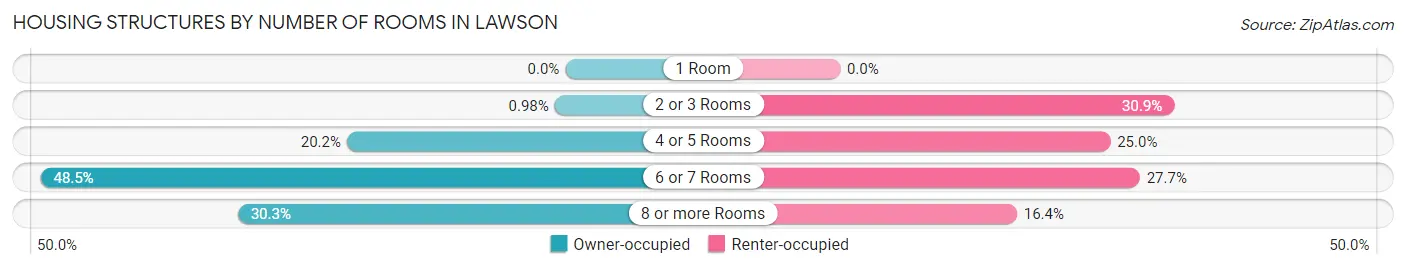
| Number of Rooms | Owner-occupied | Renter-occupied |
| 1 Room | 0 (0.0%) | 0 (0.0%) |
| 2 or 3 Rooms | 6 (1.0%) | 68 (30.9%) |
| 4 or 5 Rooms | 124 (20.2%) | 55 (25.0%) |
| 6 or 7 Rooms | 298 (48.5%) | 61 (27.7%) |
| 8 or more Rooms | 186 (30.3%) | 36 (16.4%) |
| Total | 614 (100.0%) | 220 (100.0%) |
Housing Structure by Heating Type in Lawson
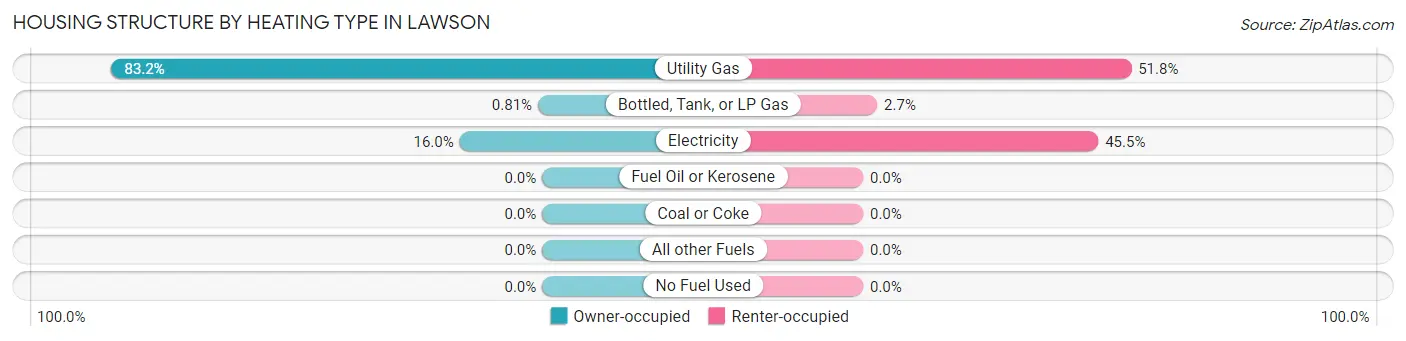
| Heating Type | Owner-occupied | Renter-occupied |
| Utility Gas | 511 (83.2%) | 114 (51.8%) |
| Bottled, Tank, or LP Gas | 5 (0.8%) | 6 (2.7%) |
| Electricity | 98 (16.0%) | 100 (45.5%) |
| Fuel Oil or Kerosene | 0 (0.0%) | 0 (0.0%) |
| Coal or Coke | 0 (0.0%) | 0 (0.0%) |
| All other Fuels | 0 (0.0%) | 0 (0.0%) |
| No Fuel Used | 0 (0.0%) | 0 (0.0%) |
| Total | 614 (100.0%) | 220 (100.0%) |
Household Vehicle Usage in Lawson
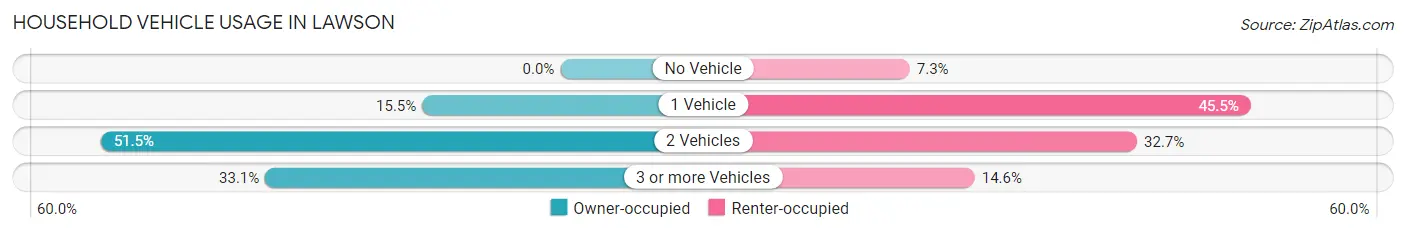
| Vehicles per Household | Owner-occupied | Renter-occupied |
| No Vehicle | 0 (0.0%) | 16 (7.3%) |
| 1 Vehicle | 95 (15.5%) | 100 (45.5%) |
| 2 Vehicles | 316 (51.5%) | 72 (32.7%) |
| 3 or more Vehicles | 203 (33.1%) | 32 (14.5%) |
| Total | 614 (100.0%) | 220 (100.0%) |
Real Estate & Mortgages in Lawson
Real Estate and Mortgage Overview in Lawson
| Characteristic | Without Mortgage | With Mortgage |
| Housing Units | 204 | 410 |
| Median Property Value | $112,000 | $158,100 |
| Median Household Income | $60,663 | $88 |
| Monthly Housing Costs | $450 | $5 |
| Real Estate Taxes | $1,443 | $10 |
Property Value by Mortgage Status in Lawson
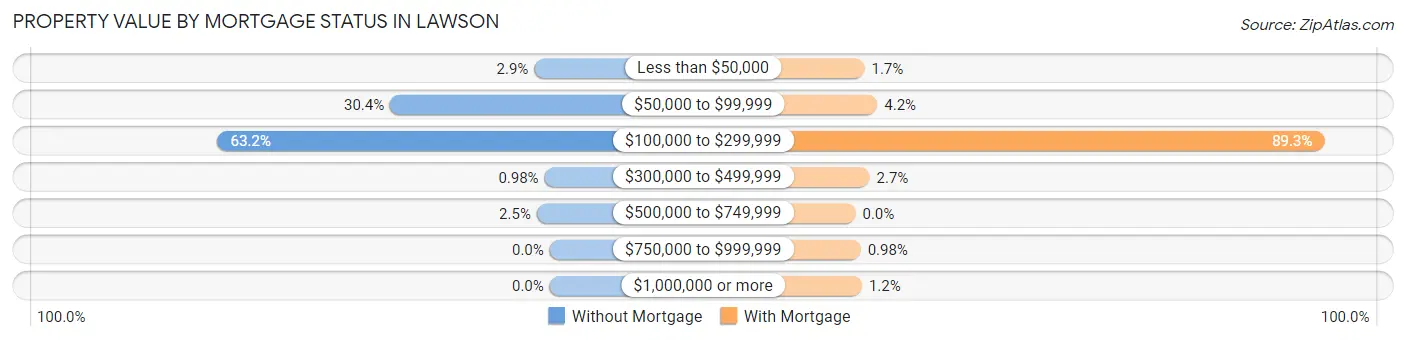
| Property Value | Without Mortgage | With Mortgage |
| Less than $50,000 | 6 (2.9%) | 7 (1.7%) |
| $50,000 to $99,999 | 62 (30.4%) | 17 (4.2%) |
| $100,000 to $299,999 | 129 (63.2%) | 366 (89.3%) |
| $300,000 to $499,999 | 2 (1.0%) | 11 (2.7%) |
| $500,000 to $749,999 | 5 (2.5%) | 0 (0.0%) |
| $750,000 to $999,999 | 0 (0.0%) | 4 (1.0%) |
| $1,000,000 or more | 0 (0.0%) | 5 (1.2%) |
| Total | 204 (100.0%) | 410 (100.0%) |
Household Income by Mortgage Status in Lawson
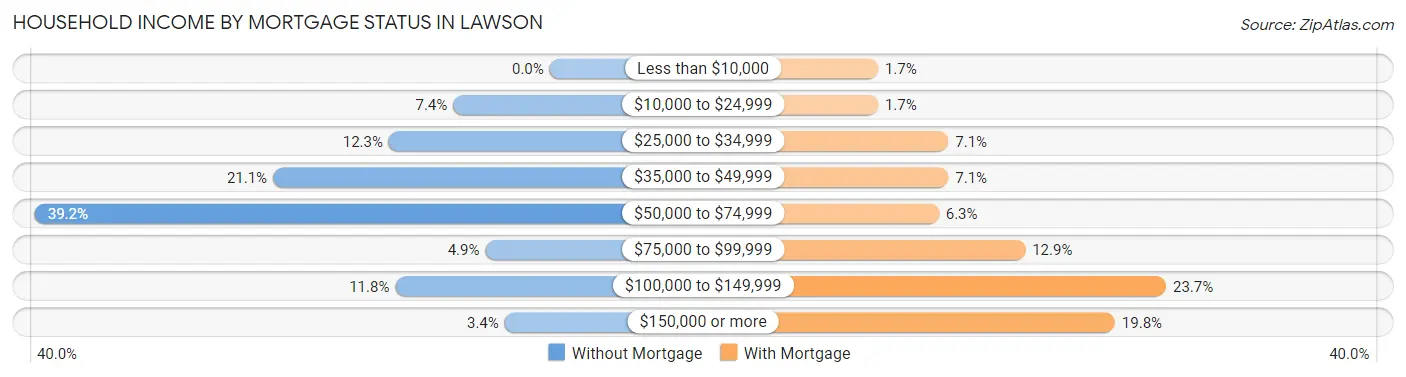
| Household Income | Without Mortgage | With Mortgage |
| Less than $10,000 | 0 (0.0%) | 7 (1.7%) |
| $10,000 to $24,999 | 15 (7.3%) | 7 (1.7%) |
| $25,000 to $34,999 | 25 (12.2%) | 29 (7.1%) |
| $35,000 to $49,999 | 43 (21.1%) | 29 (7.1%) |
| $50,000 to $74,999 | 80 (39.2%) | 26 (6.3%) |
| $75,000 to $99,999 | 10 (4.9%) | 53 (12.9%) |
| $100,000 to $149,999 | 24 (11.8%) | 97 (23.7%) |
| $150,000 or more | 7 (3.4%) | 81 (19.8%) |
| Total | 204 (100.0%) | 410 (100.0%) |
Property Value to Household Income Ratio in Lawson
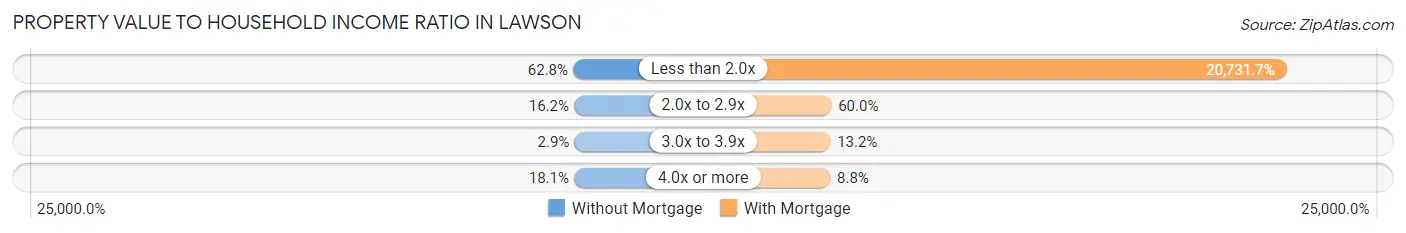
| Value-to-Income Ratio | Without Mortgage | With Mortgage |
| Less than 2.0x | 128 (62.7%) | 85,000 (20,731.7%) |
| 2.0x to 2.9x | 33 (16.2%) | 246 (60.0%) |
| 3.0x to 3.9x | 6 (2.9%) | 54 (13.2%) |
| 4.0x or more | 37 (18.1%) | 36 (8.8%) |
| Total | 204 (100.0%) | 410 (100.0%) |
Real Estate Taxes by Mortgage Status in Lawson
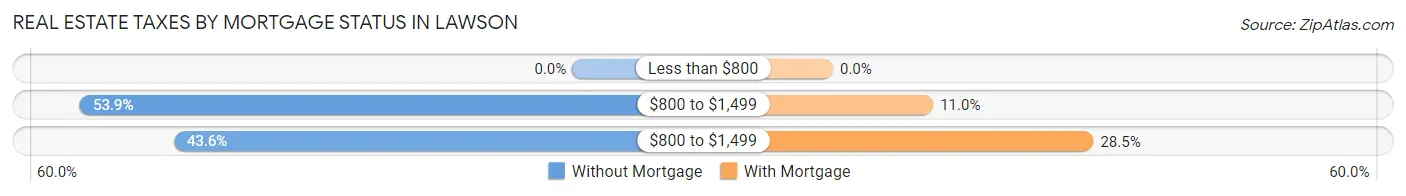
| Property Taxes | Without Mortgage | With Mortgage |
| Less than $800 | 0 (0.0%) | 0 (0.0%) |
| $800 to $1,499 | 110 (53.9%) | 45 (11.0%) |
| $800 to $1,499 | 89 (43.6%) | 117 (28.5%) |
| Total | 204 (100.0%) | 410 (100.0%) |
Health & Disability in Lawson
Health Insurance Coverage by Age in Lawson
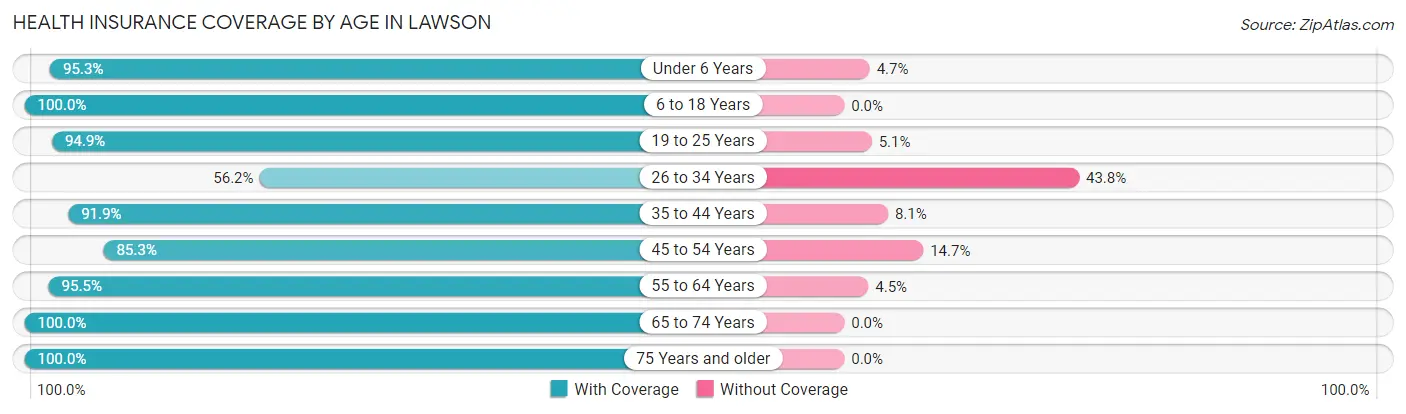
| Age Bracket | With Coverage | Without Coverage |
| Under 6 Years | 221 (95.3%) | 11 (4.7%) |
| 6 to 18 Years | 528 (100.0%) | 0 (0.0%) |
| 19 to 25 Years | 223 (94.9%) | 12 (5.1%) |
| 26 to 34 Years | 131 (56.2%) | 102 (43.8%) |
| 35 to 44 Years | 271 (91.9%) | 24 (8.1%) |
| 45 to 54 Years | 197 (85.3%) | 34 (14.7%) |
| 55 to 64 Years | 256 (95.5%) | 12 (4.5%) |
| 65 to 74 Years | 164 (100.0%) | 0 (0.0%) |
| 75 Years and older | 208 (100.0%) | 0 (0.0%) |
| Total | 2,199 (91.8%) | 195 (8.2%) |
Health Insurance Coverage by Citizenship Status in Lawson
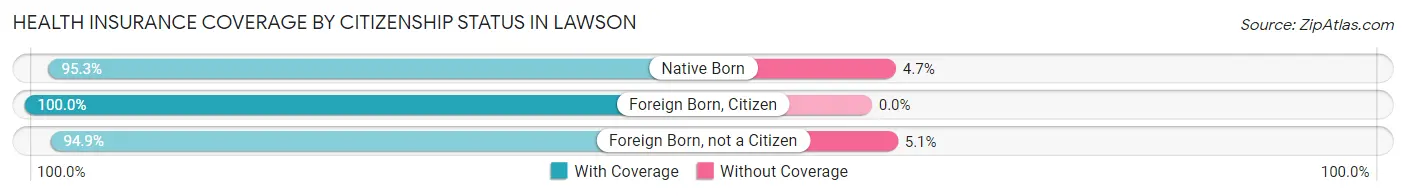
| Citizenship Status | With Coverage | Without Coverage |
| Native Born | 221 (95.3%) | 11 (4.7%) |
| Foreign Born, Citizen | 528 (100.0%) | 0 (0.0%) |
| Foreign Born, not a Citizen | 223 (94.9%) | 12 (5.1%) |
Health Insurance Coverage by Household Income in Lawson
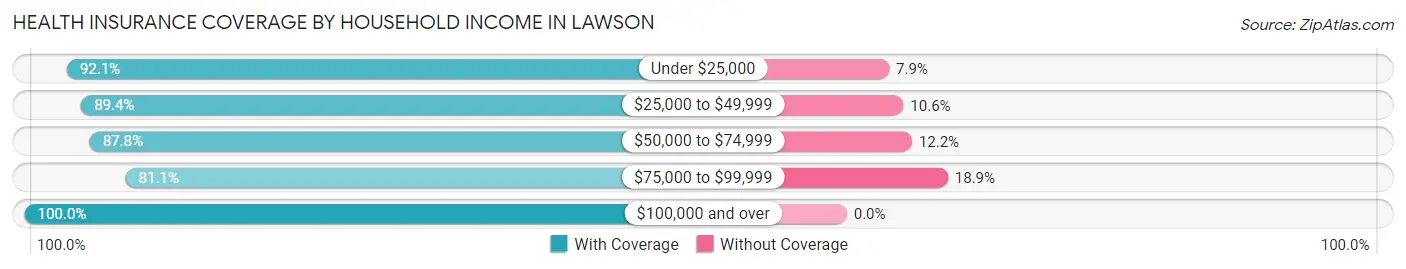
| Household Income | With Coverage | Without Coverage |
| Under $25,000 | 151 (92.1%) | 13 (7.9%) |
| $25,000 to $49,999 | 337 (89.4%) | 40 (10.6%) |
| $50,000 to $74,999 | 381 (87.8%) | 53 (12.2%) |
| $75,000 to $99,999 | 381 (81.1%) | 89 (18.9%) |
| $100,000 and over | 949 (100.0%) | 0 (0.0%) |
Public vs Private Health Insurance Coverage by Age in Lawson
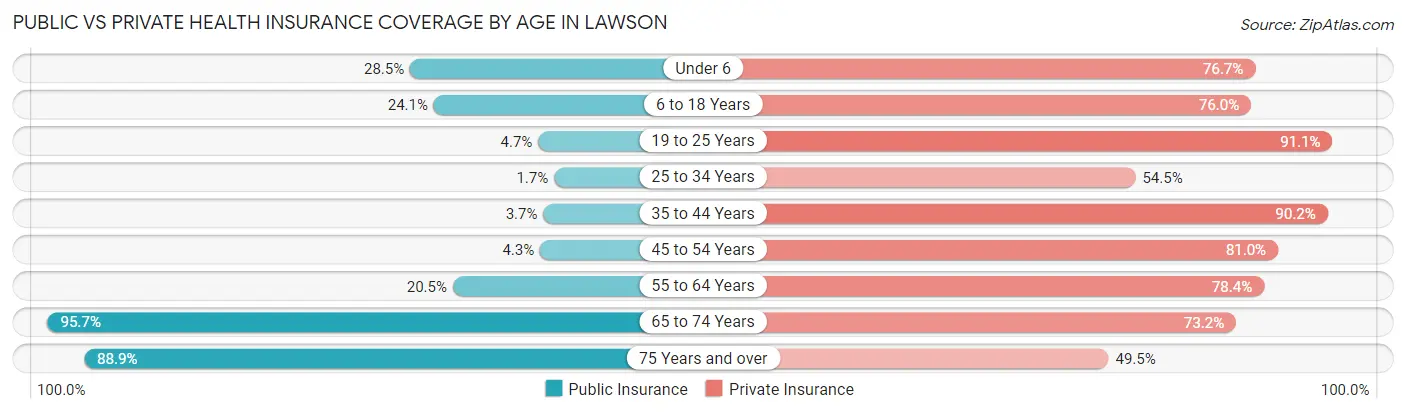
| Age Bracket | Public Insurance | Private Insurance |
| Under 6 | 66 (28.4%) | 178 (76.7%) |
| 6 to 18 Years | 127 (24.0%) | 401 (75.9%) |
| 19 to 25 Years | 11 (4.7%) | 214 (91.1%) |
| 25 to 34 Years | 4 (1.7%) | 127 (54.5%) |
| 35 to 44 Years | 11 (3.7%) | 266 (90.2%) |
| 45 to 54 Years | 10 (4.3%) | 187 (80.9%) |
| 55 to 64 Years | 55 (20.5%) | 210 (78.4%) |
| 65 to 74 Years | 157 (95.7%) | 120 (73.2%) |
| 75 Years and over | 185 (88.9%) | 103 (49.5%) |
| Total | 626 (26.2%) | 1,806 (75.4%) |
Disability Status by Sex by Age in Lawson
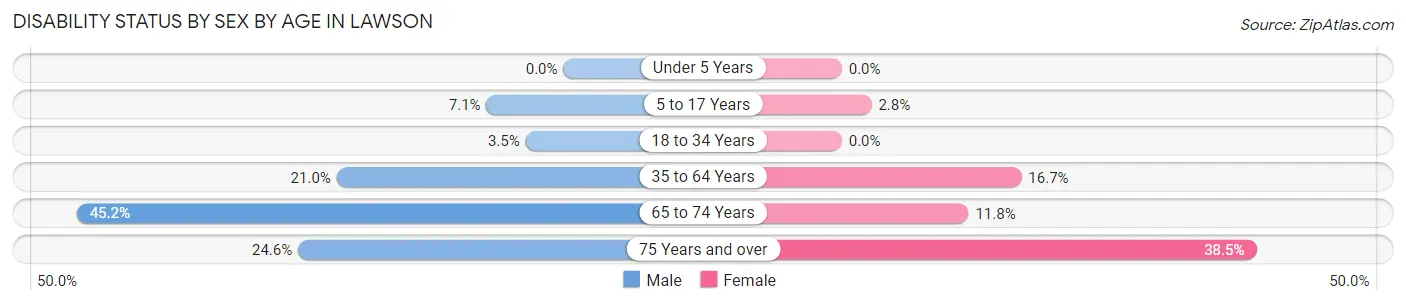
| Age Bracket | Male | Female |
| Under 5 Years | 0 (0.0%) | 0 (0.0%) |
| 5 to 17 Years | 19 (7.1%) | 8 (2.8%) |
| 18 to 34 Years | 6 (3.5%) | 0 (0.0%) |
| 35 to 64 Years | 85 (21.0%) | 65 (16.7%) |
| 65 to 74 Years | 28 (45.2%) | 12 (11.8%) |
| 75 Years and over | 32 (24.6%) | 30 (38.5%) |
Disability Class by Sex by Age in Lawson
Disability Class: Hearing Difficulty
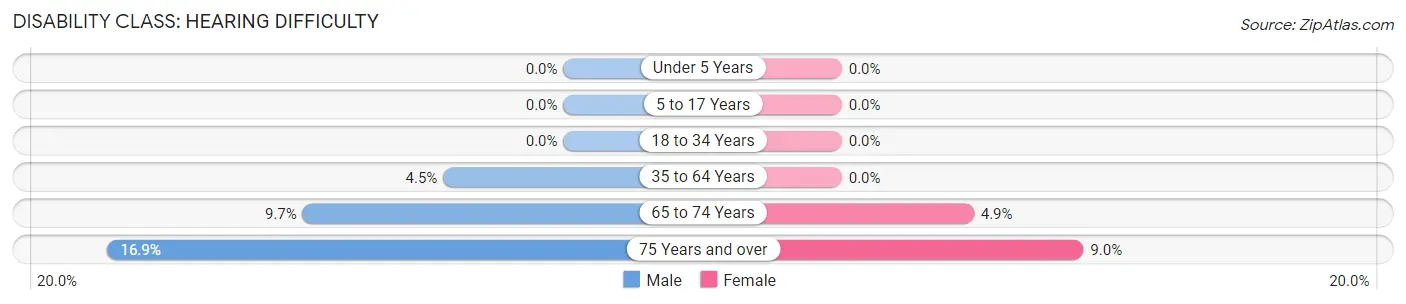
| Age Bracket | Male | Female |
| Under 5 Years | 0 (0.0%) | 0 (0.0%) |
| 5 to 17 Years | 0 (0.0%) | 0 (0.0%) |
| 18 to 34 Years | 0 (0.0%) | 0 (0.0%) |
| 35 to 64 Years | 18 (4.5%) | 0 (0.0%) |
| 65 to 74 Years | 6 (9.7%) | 5 (4.9%) |
| 75 Years and over | 22 (16.9%) | 7 (9.0%) |
Disability Class: Vision Difficulty
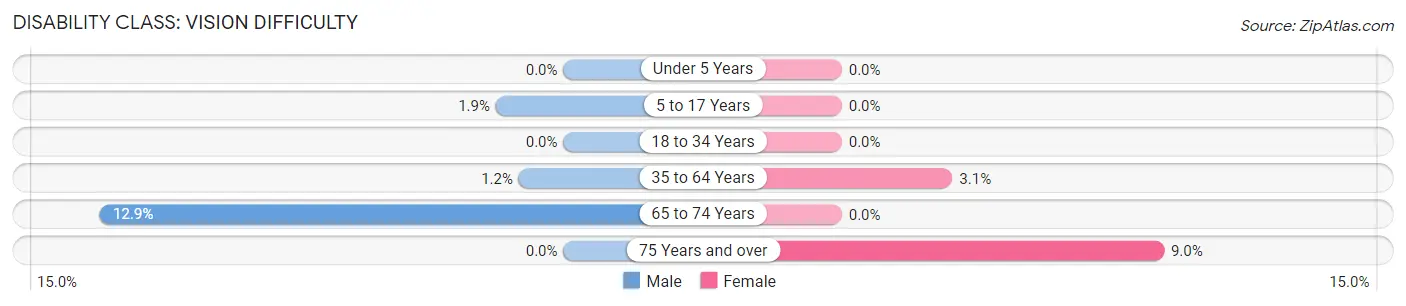
| Age Bracket | Male | Female |
| Under 5 Years | 0 (0.0%) | 0 (0.0%) |
| 5 to 17 Years | 5 (1.9%) | 0 (0.0%) |
| 18 to 34 Years | 0 (0.0%) | 0 (0.0%) |
| 35 to 64 Years | 5 (1.2%) | 12 (3.1%) |
| 65 to 74 Years | 8 (12.9%) | 0 (0.0%) |
| 75 Years and over | 0 (0.0%) | 7 (9.0%) |
Disability Class: Cognitive Difficulty
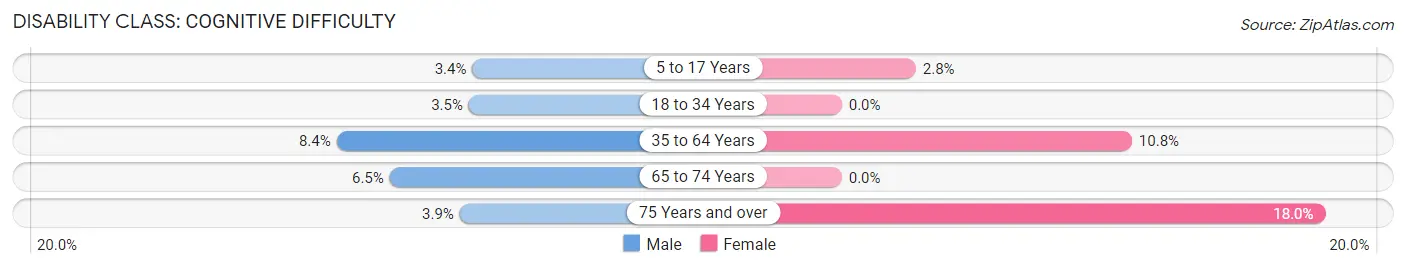
| Age Bracket | Male | Female |
| 5 to 17 Years | 9 (3.4%) | 8 (2.8%) |
| 18 to 34 Years | 6 (3.5%) | 0 (0.0%) |
| 35 to 64 Years | 34 (8.4%) | 42 (10.8%) |
| 65 to 74 Years | 4 (6.5%) | 0 (0.0%) |
| 75 Years and over | 5 (3.8%) | 14 (17.9%) |
Disability Class: Ambulatory Difficulty
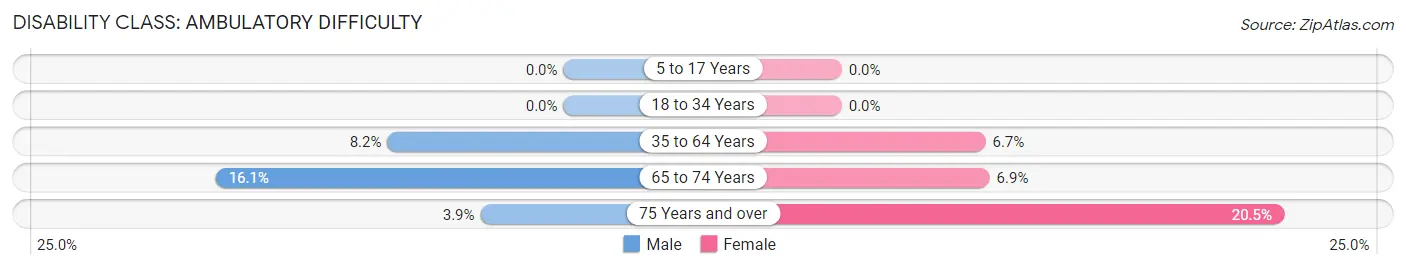
| Age Bracket | Male | Female |
| 5 to 17 Years | 0 (0.0%) | 0 (0.0%) |
| 18 to 34 Years | 0 (0.0%) | 0 (0.0%) |
| 35 to 64 Years | 33 (8.2%) | 26 (6.7%) |
| 65 to 74 Years | 10 (16.1%) | 7 (6.9%) |
| 75 Years and over | 5 (3.8%) | 16 (20.5%) |
Disability Class: Self-Care Difficulty
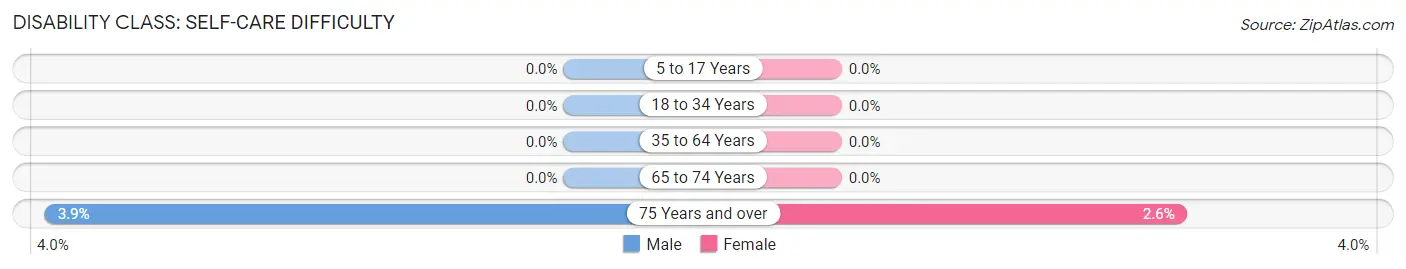
| Age Bracket | Male | Female |
| 5 to 17 Years | 0 (0.0%) | 0 (0.0%) |
| 18 to 34 Years | 0 (0.0%) | 0 (0.0%) |
| 35 to 64 Years | 0 (0.0%) | 0 (0.0%) |
| 65 to 74 Years | 0 (0.0%) | 0 (0.0%) |
| 75 Years and over | 5 (3.8%) | 2 (2.6%) |
Technology Access in Lawson
Computing Device Access in Lawson
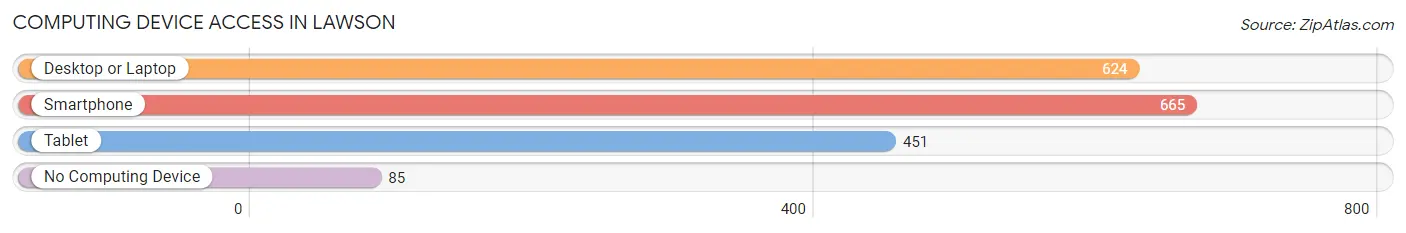
| Device Type | # Households | % Households |
| Desktop or Laptop | 624 | 74.8% |
| Smartphone | 665 | 79.7% |
| Tablet | 451 | 54.1% |
| No Computing Device | 85 | 10.2% |
| Total | 834 | 100.0% |
Internet Access in Lawson
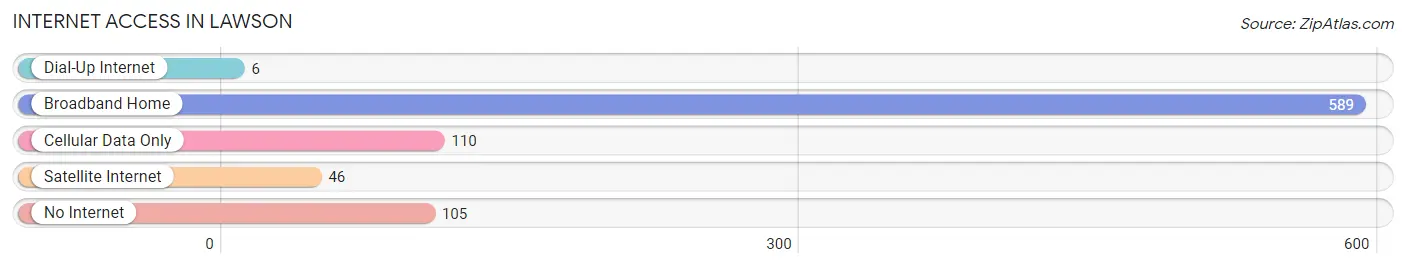
| Internet Type | # Households | % Households |
| Dial-Up Internet | 6 | 0.7% |
| Broadband Home | 589 | 70.6% |
| Cellular Data Only | 110 | 13.2% |
| Satellite Internet | 46 | 5.5% |
| No Internet | 105 | 12.6% |
| Total | 834 | 100.0% |
Lawson Summary
Lawson, Missouri is a small city located in Clay County, Missouri. It is situated approximately 20 miles north of Kansas City and is part of the Kansas City metropolitan area. The city has a population of approximately 4,000 people and is known for its small-town charm and friendly atmosphere.
History
Lawson was founded in 1871 by William Lawson, a former Confederate soldier. The city was originally named “Lawsonville” but was later changed to “Lawson” in 1876. The city was incorporated in 1887 and has remained a small, rural community ever since.
The city was originally a farming community, but in the early 1900s, the railroad came to town and the city began to grow. The railroad brought new businesses and industries to the area, and the population began to increase.
In the 1950s, the city began to experience a population boom as people moved to the area from other parts of the country. This growth continued into the 1960s and 1970s, and the city’s population reached its peak in the 1980s.
Geography
Lawson is located in Clay County, Missouri, approximately 20 miles north of Kansas City. The city is situated on the banks of the Missouri River and is surrounded by rolling hills and farmland. The city has a total area of 4.2 square miles, all of which is land.
The climate in Lawson is typical of the Midwest, with hot, humid summers and cold, snowy winters. The average temperature in the summer is around 80 degrees Fahrenheit, and the average temperature in the winter is around 30 degrees Fahrenheit.
Economy
The economy of Lawson is largely based on agriculture and manufacturing. The city is home to several large farms, as well as several small businesses. The city also has a number of manufacturing plants, including a paper mill and a plastics factory.
The city also has a number of retail stores, restaurants, and other businesses. The city is home to a number of small businesses, including a grocery store, a hardware store, and a pharmacy.
Demographics
As of the 2010 census, the population of Lawson was 4,000 people. The racial makeup of the city was 95.3% White, 1.2% African American, 0.3% Native American, 0.3% Asian, 0.1% Pacific Islander, and 2.7% from other races. Hispanic or Latino of any race were 3.2% of the population.
The median household income in Lawson was $41,250, and the median family income was $50,000. The per capita income for the city was $20,845. About 11.2% of families and 14.2% of the population were below the poverty line, including 18.2% of those under age 18 and 8.3% of those age 65 or over.
Lawson is a small, rural city with a friendly atmosphere and a strong sense of community. The city has a long history and is home to a diverse population. The city’s economy is largely based on agriculture and manufacturing, and the city has a number of small businesses. The city is a great place to live and work, and it is a great place to raise a family.
Common Questions
What is Per Capita Income in Lawson?
Per Capita income in Lawson is $28,793.
What is the Median Family Income in Lawson?
Median Family Income in Lawson is $77,250.
What is the Median Household income in Lawson?
Median Household Income in Lawson is $61,929.
What is Income or Wage Gap in Lawson?
Income or Wage Gap in Lawson is 40.7%.
Women in Lawson earn 59.3 cents for every dollar earned by a man.
What is Inequality or Gini Index in Lawson?
Inequality or Gini Index in Lawson is 0.40.
What is the Total Population of Lawson?
Total Population of Lawson is 2,429.
What is the Total Male Population of Lawson?
Total Male Population of Lawson is 1,136.
What is the Total Female Population of Lawson?
Total Female Population of Lawson is 1,293.
What is the Ratio of Males per 100 Females in Lawson?
There are 87.86 Males per 100 Females in Lawson.
What is the Ratio of Females per 100 Males in Lawson?
There are 113.82 Females per 100 Males in Lawson.
What is the Median Population Age in Lawson?
Median Population Age in Lawson is 33.3 Years.
What is the Average Family Size in Lawson
Average Family Size in Lawson is 3.4 People.
What is the Average Household Size in Lawson
Average Household Size in Lawson is 2.9 People.
How Large is the Labor Force in Lawson?
There are 1,088 People in the Labor Forcein in Lawson.
What is the Percentage of People in the Labor Force in Lawson?
61.0% of People are in the Labor Force in Lawson.
What is the Unemployment Rate in Lawson?
Unemployment Rate in Lawson is 3.1%.