Koshkonong, MO Map & Demographics
Koshkonong Map
Koshkonong Overview
$21,029
PER CAPITA INCOME
$29,375
AVG FAMILY INCOME
$27,857
AVG HOUSEHOLD INCOME
0.64
INEQUALITY / GINI INDEX
174
TOTAL POPULATION
83
MALE POPULATION
91
FEMALE POPULATION
91.21
MALES / 100 FEMALES
109.64
FEMALES / 100 MALES
29.9
MEDIAN AGE
3.7
AVG FAMILY SIZE
3.4
AVG HOUSEHOLD SIZE
65
LABOR FORCE [ PEOPLE ]
57.5%
PERCENT IN LABOR FORCE
7.7%
UNEMPLOYMENT RATE
Koshkonong Zip Codes
Koshkonong Area Codes
Income in Koshkonong
Income Overview in Koshkonong
Per Capita Income in Koshkonong is $21,029, while median incomes of families and households are $29,375 and $27,857 respectively.
| Characteristic | Number | Measure |
| Per Capita Income | 174 | $21,029 |
| Median Family Income | 41 | $29,375 |
| Mean Family Income | 41 | $46,020 |
| Median Household Income | 52 | $27,857 |
| Mean Household Income | 52 | $62,158 |
| Income Deficit | 41 | $0 |
| Wage / Income Gap (%) | 174 | 0.00% |
| Wage / Income Gap ($) | 174 | 100.00¢ per $1 |
| Gini / Inequality Index | 174 | 0.64 |
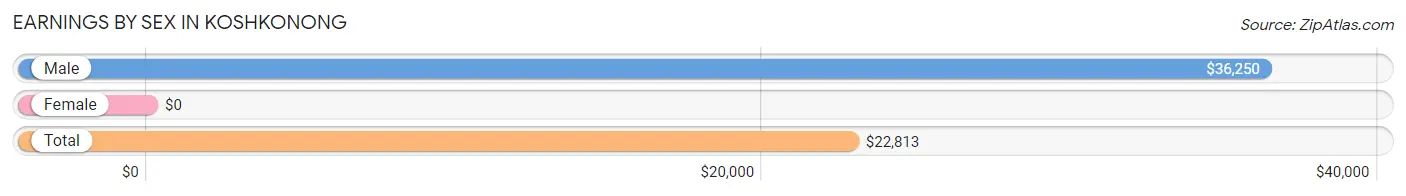
Earnings by Sex in Koshkonong
| Sex | Number | Average Earnings |
| Male | 26 (40.6%) | $36,250 |
| Female | 38 (59.4%) | $0 |
| Total | 64 (100.0%) | $22,813 |
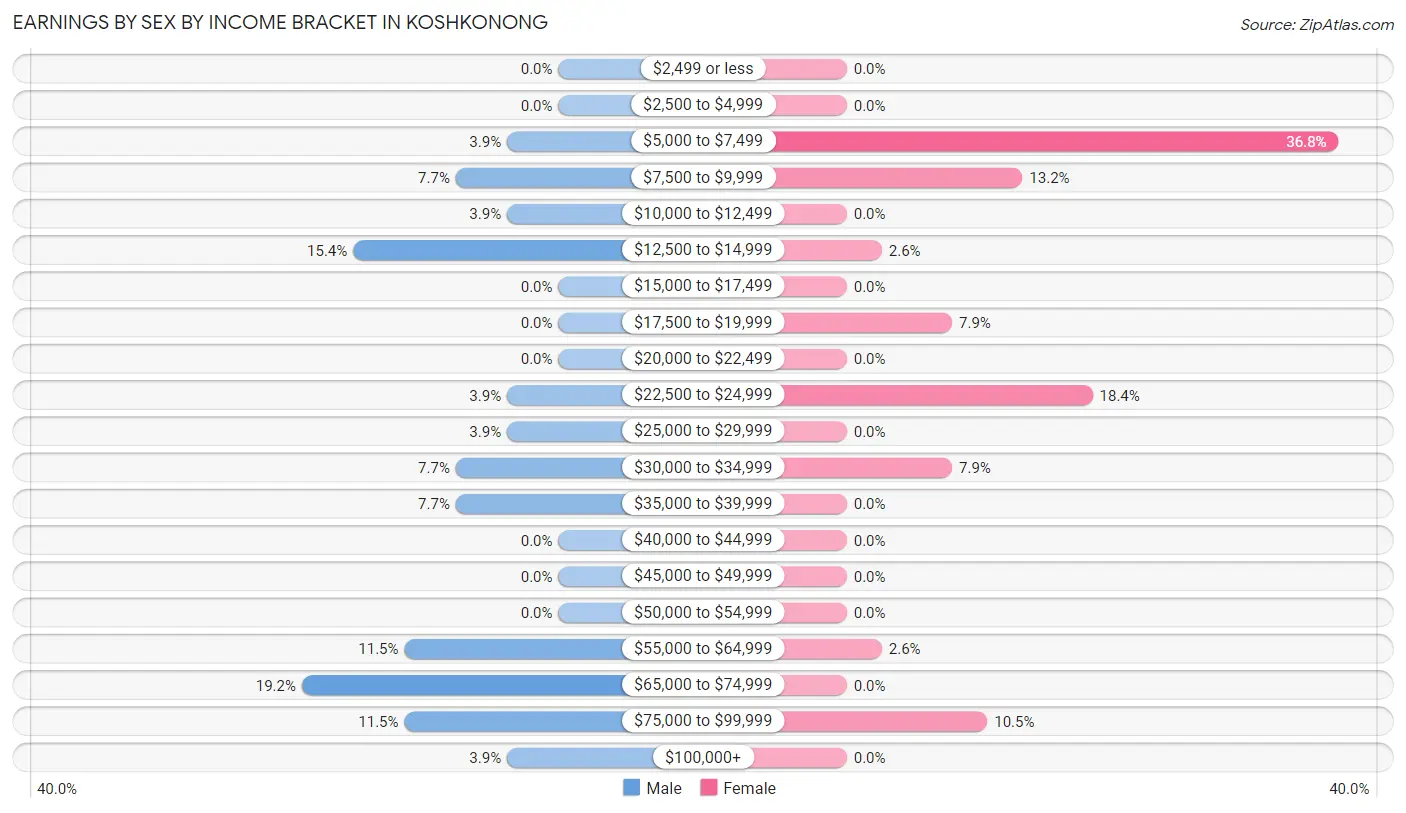
Earnings by Sex by Income Bracket in Koshkonong
The most common earnings brackets in Koshkonong are $65,000 to $74,999 for men (5 | 19.2%) and $5,000 to $7,499 for women (14 | 36.8%).
| Income | Male | Female |
| $2,499 or less | 0 (0.0%) | 0 (0.0%) |
| $2,500 to $4,999 | 0 (0.0%) | 0 (0.0%) |
| $5,000 to $7,499 | 1 (3.8%) | 14 (36.8%) |
| $7,500 to $9,999 | 2 (7.7%) | 5 (13.2%) |
| $10,000 to $12,499 | 1 (3.8%) | 0 (0.0%) |
| $12,500 to $14,999 | 4 (15.4%) | 1 (2.6%) |
| $15,000 to $17,499 | 0 (0.0%) | 0 (0.0%) |
| $17,500 to $19,999 | 0 (0.0%) | 3 (7.9%) |
| $20,000 to $22,499 | 0 (0.0%) | 0 (0.0%) |
| $22,500 to $24,999 | 1 (3.8%) | 7 (18.4%) |
| $25,000 to $29,999 | 1 (3.8%) | 0 (0.0%) |
| $30,000 to $34,999 | 2 (7.7%) | 3 (7.9%) |
| $35,000 to $39,999 | 2 (7.7%) | 0 (0.0%) |
| $40,000 to $44,999 | 0 (0.0%) | 0 (0.0%) |
| $45,000 to $49,999 | 0 (0.0%) | 0 (0.0%) |
| $50,000 to $54,999 | 0 (0.0%) | 0 (0.0%) |
| $55,000 to $64,999 | 3 (11.5%) | 1 (2.6%) |
| $65,000 to $74,999 | 5 (19.2%) | 0 (0.0%) |
| $75,000 to $99,999 | 3 (11.5%) | 4 (10.5%) |
| $100,000+ | 1 (3.8%) | 0 (0.0%) |
| Total | 26 (100.0%) | 38 (100.0%) |
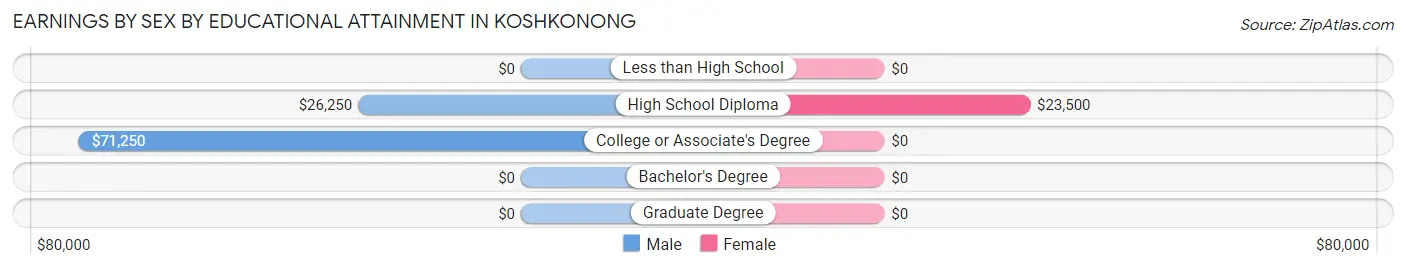
Earnings by Sex by Educational Attainment in Koshkonong
Average earnings in Koshkonong are $60,625 for men and $23,214 for women, a difference of 61.7%. Men with an educational attainment of college or associate's degree enjoy the highest average annual earnings of $71,250, while those with high school diploma education earn the least with $26,250. Women with an educational attainment of high school diploma earn the most with the average annual earnings of $23,500, while those with high school diploma education have the smallest earnings of $23,500.
| Educational Attainment | Male Income | Female Income |
| Less than High School | - | - |
| High School Diploma | $26,250 | $23,500 |
| College or Associate's Degree | $71,250 | $0 |
| Bachelor's Degree | - | - |
| Graduate Degree | - | - |
| Total | $60,625 | $23,214 |
Family Income in Koshkonong
Family Income Brackets in Koshkonong
According to the Koshkonong family income data, there are 11 families falling into the $10,000 to $14,999 income range, which is the most common income bracket and makes up 26.8% of all families.
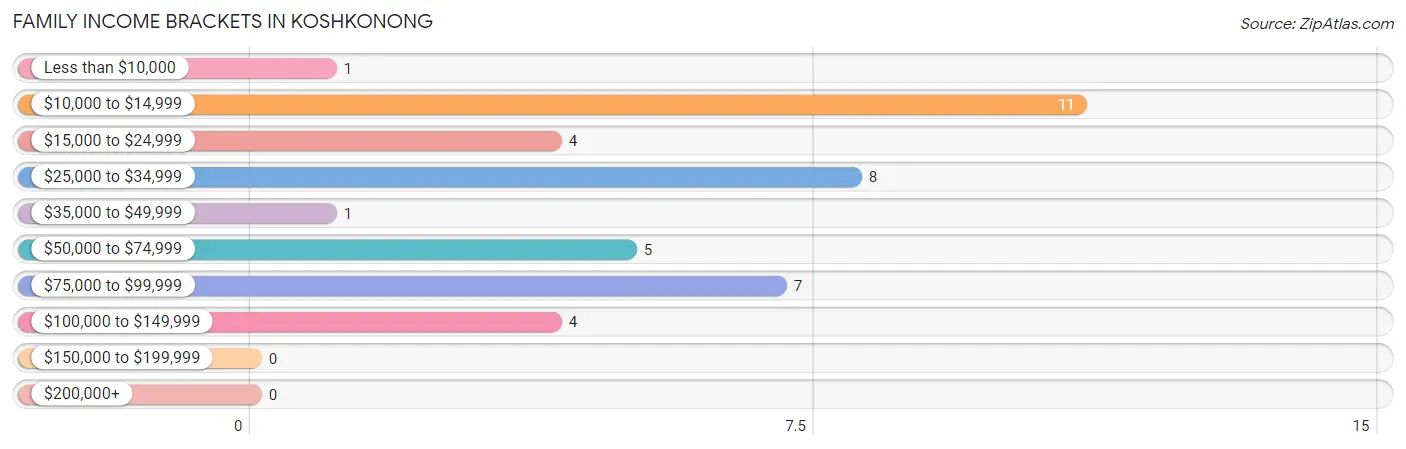
| Income Bracket | # Families | % Families |
| Less than $10,000 | 1 | 2.4% |
| $10,000 to $14,999 | 11 | 26.8% |
| $15,000 to $24,999 | 4 | 9.8% |
| $25,000 to $34,999 | 8 | 19.5% |
| $35,000 to $49,999 | 1 | 2.4% |
| $50,000 to $74,999 | 5 | 12.2% |
| $75,000 to $99,999 | 7 | 17.1% |
| $100,000 to $149,999 | 4 | 9.8% |
| $150,000 to $199,999 | 0 | 0.0% |
| $200,000+ | 0 | 0.0% |
Family Income by Famaliy Size in Koshkonong
3-person families (18 | 43.9%) account for the highest median family income in Koshkonong with $76,250 per family, while 3-person families (18 | 43.9%) have the highest median income of $25,417 per family member.
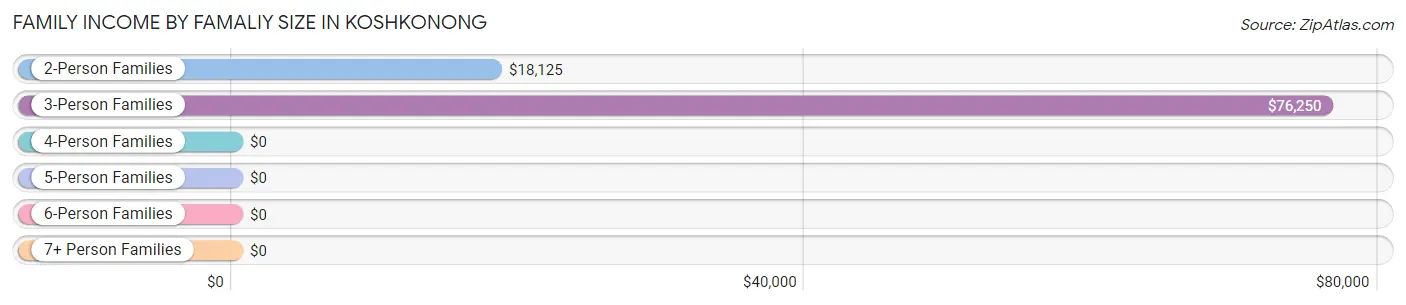
| Income Bracket | # Families | Median Income |
| 2-Person Families | 12 (29.3%) | $18,125 |
| 3-Person Families | 18 (43.9%) | $76,250 |
| 4-Person Families | 7 (17.1%) | $0 |
| 5-Person Families | 2 (4.9%) | $0 |
| 6-Person Families | 2 (4.9%) | $0 |
| 7+ Person Families | 0 (0.0%) | $0 |
| Total | 41 (100.0%) | $29,375 |
Family Income by Number of Earners in Koshkonong
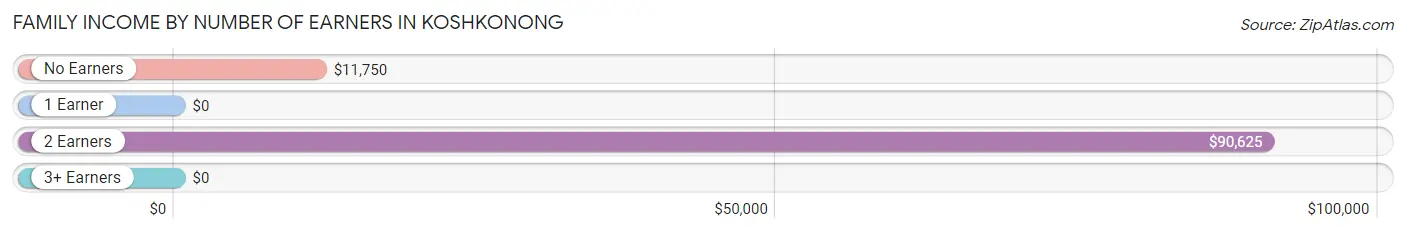
| Number of Earners | # Families | Median Income |
| No Earners | 9 (22.0%) | $11,750 |
| 1 Earner | 15 (36.6%) | $0 |
| 2 Earners | 17 (41.5%) | $90,625 |
| 3+ Earners | 0 (0.0%) | $0 |
| Total | 41 (100.0%) | $29,375 |
Household Income in Koshkonong
Household Income Brackets in Koshkonong
With 13 households falling in the category, the $10,000 to $14,999 income range is the most frequent in Koshkonong, accounting for 25.0% of all households.
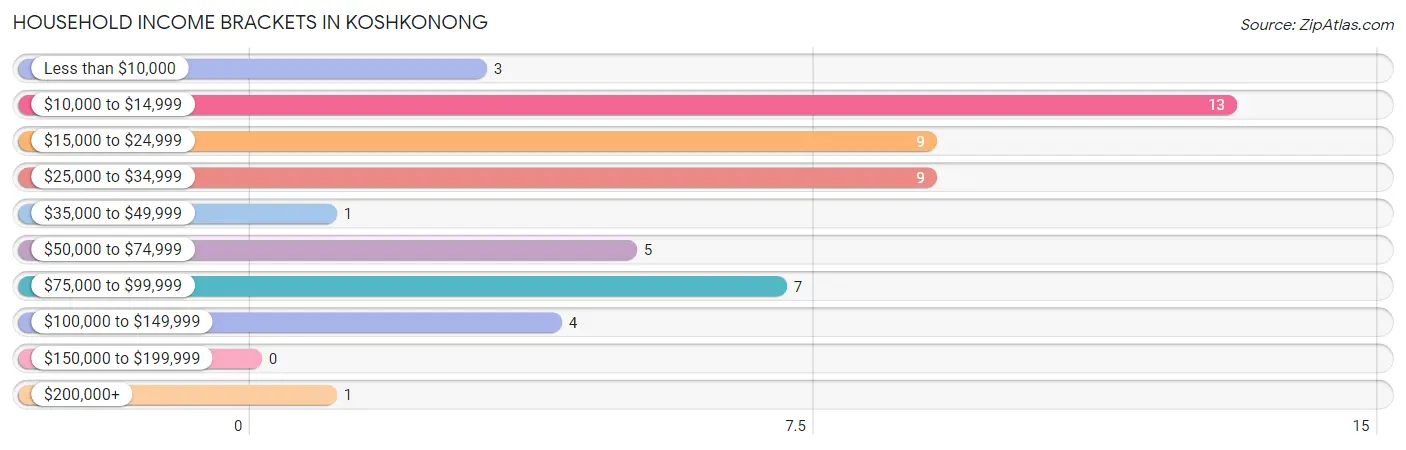
| Income Bracket | # Households | % Households |
| Less than $10,000 | 3 | 5.8% |
| $10,000 to $14,999 | 13 | 25.0% |
| $15,000 to $24,999 | 9 | 17.3% |
| $25,000 to $34,999 | 9 | 17.3% |
| $35,000 to $49,999 | 1 | 1.9% |
| $50,000 to $74,999 | 5 | 9.6% |
| $75,000 to $99,999 | 7 | 13.5% |
| $100,000 to $149,999 | 4 | 7.7% |
| $150,000 to $199,999 | 0 | 0.0% |
| $200,000+ | 1 | 1.9% |
Household Income by Householder Age in Koshkonong
The median household income in Koshkonong is $27,857, with the highest median household income of $28,750 found in the 25 to 44 years age bracket for the primary householder. A total of 21 households (40.4%) fall into this category.
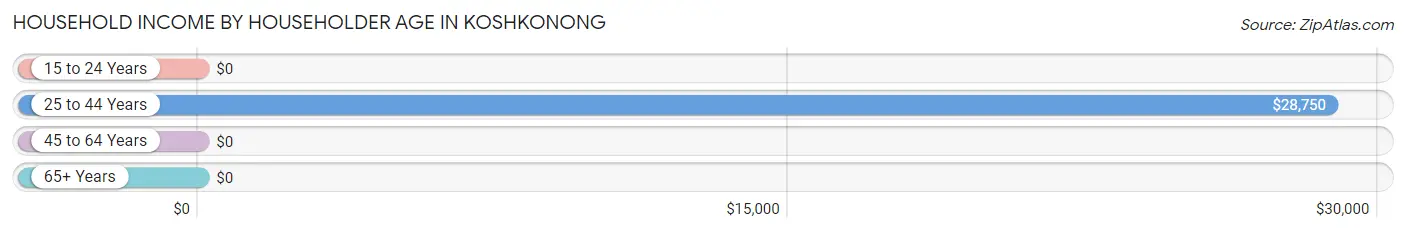
| Income Bracket | # Households | Median Income |
| 15 to 24 Years | 0 (0.0%) | $0 |
| 25 to 44 Years | 21 (40.4%) | $28,750 |
| 45 to 64 Years | 20 (38.5%) | $0 |
| 65+ Years | 11 (21.1%) | $0 |
| Total | 52 (100.0%) | $27,857 |
Poverty in Koshkonong
Income Below Poverty by Sex and Age in Koshkonong
With 37.3% poverty level for males and 48.3% for females among the residents of Koshkonong, 15 year old males and 5 year old females are the most vulnerable to poverty, with 3 males (100.0%) and 5 females (100.0%) in their respective age groups living below the poverty level.
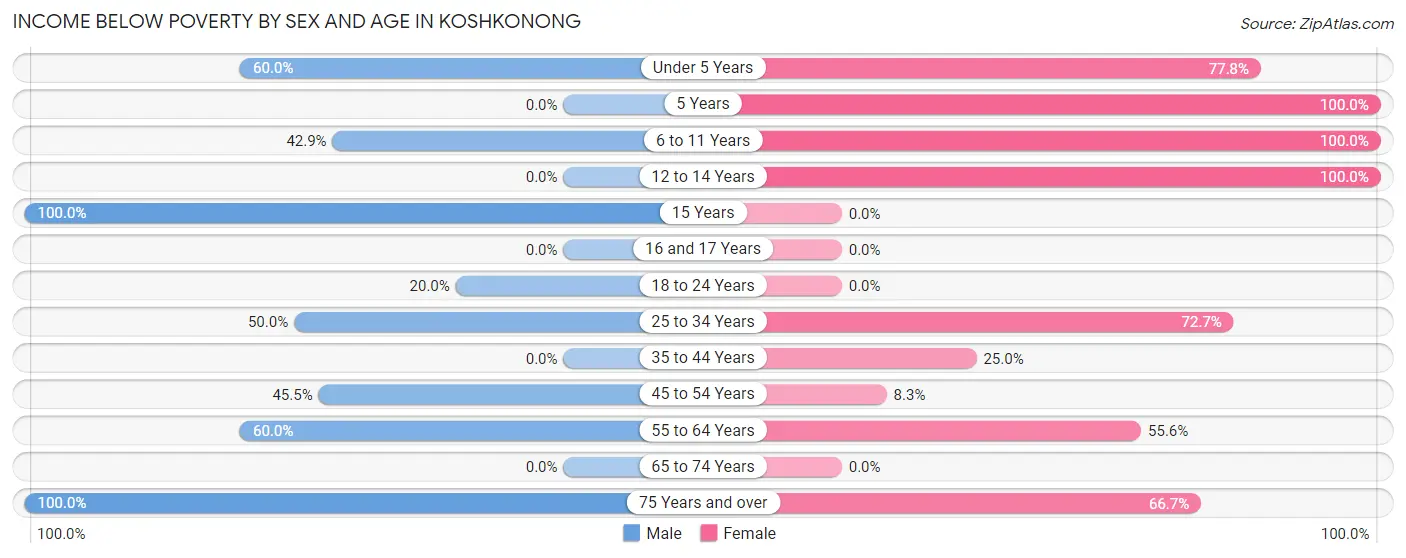
| Age Bracket | Male | Female |
| Under 5 Years | 3 (60.0%) | 7 (77.8%) |
| 5 Years | 0 (0.0%) | 5 (100.0%) |
| 6 to 11 Years | 9 (42.9%) | 8 (100.0%) |
| 12 to 14 Years | 0 (0.0%) | 5 (100.0%) |
| 15 Years | 3 (100.0%) | 0 (0.0%) |
| 16 and 17 Years | 0 (0.0%) | 0 (0.0%) |
| 18 to 24 Years | 1 (20.0%) | 0 (0.0%) |
| 25 to 34 Years | 5 (50.0%) | 8 (72.7%) |
| 35 to 44 Years | 0 (0.0%) | 3 (25.0%) |
| 45 to 54 Years | 5 (45.5%) | 1 (8.3%) |
| 55 to 64 Years | 3 (60.0%) | 5 (55.6%) |
| 65 to 74 Years | 0 (0.0%) | 0 (0.0%) |
| 75 Years and over | 2 (100.0%) | 2 (66.7%) |
| Total | 31 (37.3%) | 44 (48.3%) |
Income Above Poverty by Sex and Age in Koshkonong
According to the poverty statistics in Koshkonong, males aged 5 years and females aged 15 years are the age groups that are most secure financially, with 100.0% of males and 100.0% of females in these age groups living above the poverty line.
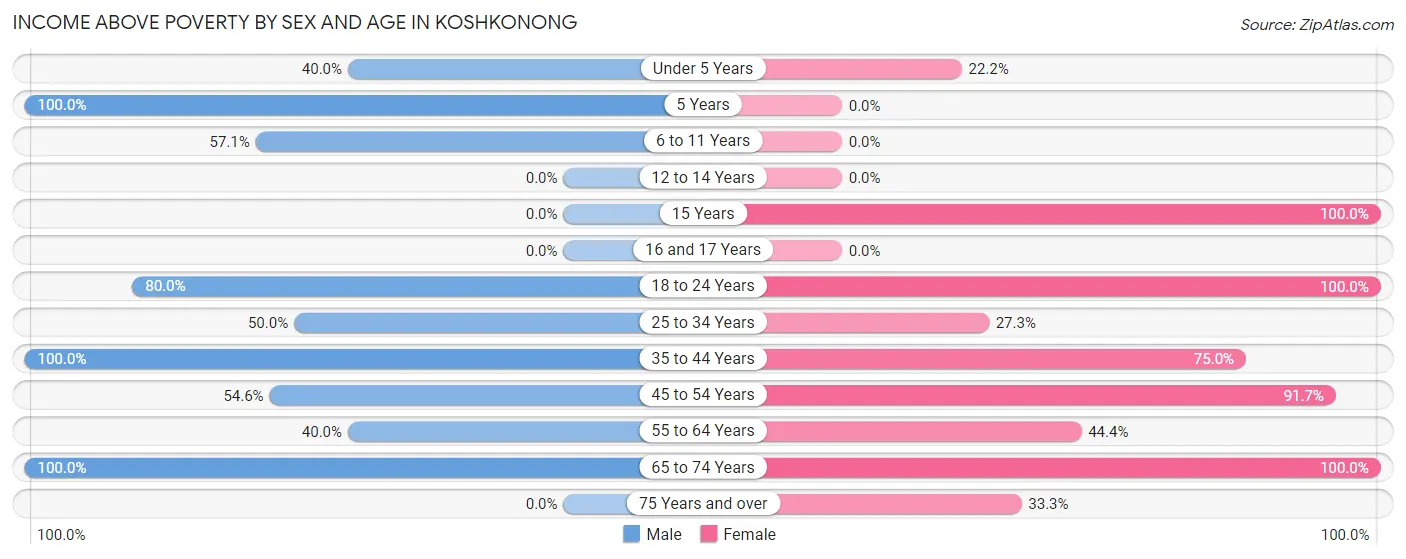
| Age Bracket | Male | Female |
| Under 5 Years | 2 (40.0%) | 2 (22.2%) |
| 5 Years | 4 (100.0%) | 0 (0.0%) |
| 6 to 11 Years | 12 (57.1%) | 0 (0.0%) |
| 12 to 14 Years | 0 (0.0%) | 0 (0.0%) |
| 15 Years | 0 (0.0%) | 1 (100.0%) |
| 16 and 17 Years | 0 (0.0%) | 0 (0.0%) |
| 18 to 24 Years | 4 (80.0%) | 12 (100.0%) |
| 25 to 34 Years | 5 (50.0%) | 3 (27.3%) |
| 35 to 44 Years | 12 (100.0%) | 9 (75.0%) |
| 45 to 54 Years | 6 (54.5%) | 11 (91.7%) |
| 55 to 64 Years | 2 (40.0%) | 4 (44.4%) |
| 65 to 74 Years | 5 (100.0%) | 4 (100.0%) |
| 75 Years and over | 0 (0.0%) | 1 (33.3%) |
| Total | 52 (62.6%) | 47 (51.6%) |
Income Below Poverty Among Married-Couple Families in Koshkonong
The poverty statistics for married-couple families in Koshkonong show that 14.3% or 3 of the total 21 families live below the poverty line. Families with 3 or 4 children have the highest poverty rate of 75.0%, comprising of 3 families. On the other hand, families with no children have the lowest poverty rate of 0.0%, which includes 0 families.
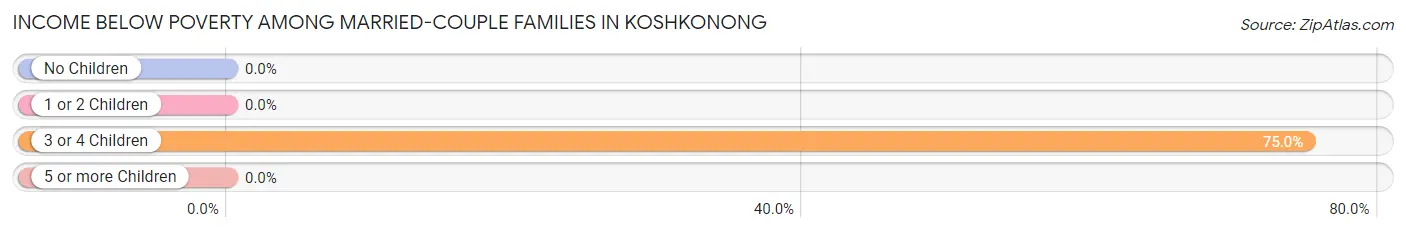
| Children | Above Poverty | Below Poverty |
| No Children | 10 (100.0%) | 0 (0.0%) |
| 1 or 2 Children | 7 (100.0%) | 0 (0.0%) |
| 3 or 4 Children | 1 (25.0%) | 3 (75.0%) |
| 5 or more Children | 0 (0.0%) | 0 (0.0%) |
| Total | 18 (85.7%) | 3 (14.3%) |
Income Below Poverty Among Single-Parent Households in Koshkonong
According to the poverty data in Koshkonong, 100.0% or 2 single-father households and 61.1% or 11 single-mother households are living below the poverty line. Among single-father households, those with 1 or 2 children have the highest poverty rate, with 2 households (100.0%) experiencing poverty. Likewise, among single-mother households, those with 3 or 4 children have the highest poverty rate, with 4 households (100.0%) falling below the poverty line.
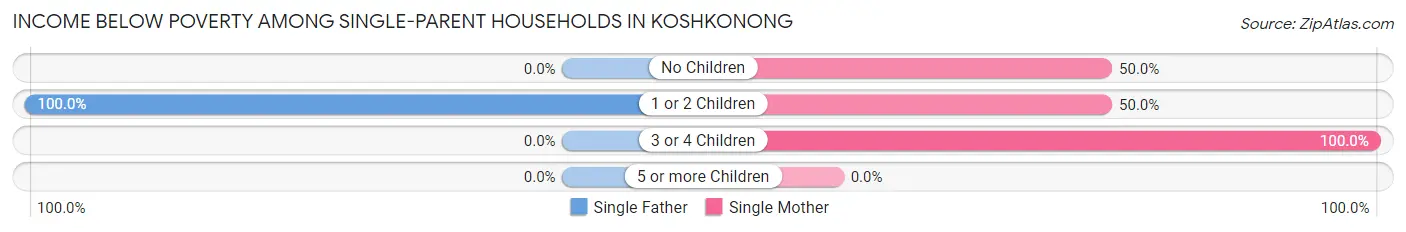
| Children | Single Father | Single Mother |
| No Children | 0 (0.0%) | 1 (50.0%) |
| 1 or 2 Children | 2 (100.0%) | 6 (50.0%) |
| 3 or 4 Children | 0 (0.0%) | 4 (100.0%) |
| 5 or more Children | 0 (0.0%) | 0 (0.0%) |
| Total | 2 (100.0%) | 11 (61.1%) |
Income Below Poverty Among Married-Couple vs Single-Parent Households in Koshkonong
The poverty data for Koshkonong shows that 3 of the married-couple family households (14.3%) and 13 of the single-parent households (65.0%) are living below the poverty level. Within the married-couple family households, those with 3 or 4 children have the highest poverty rate, with 3 households (75.0%) falling below the poverty line. Among the single-parent households, those with 3 or 4 children have the highest poverty rate, with 4 household (100.0%) living below poverty.
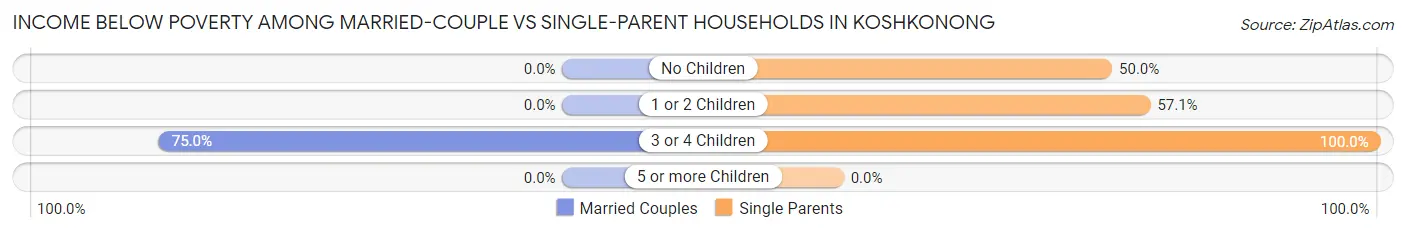
| Children | Married-Couple Families | Single-Parent Households |
| No Children | 0 (0.0%) | 1 (50.0%) |
| 1 or 2 Children | 0 (0.0%) | 8 (57.1%) |
| 3 or 4 Children | 3 (75.0%) | 4 (100.0%) |
| 5 or more Children | 0 (0.0%) | 0 (0.0%) |
| Total | 3 (14.3%) | 13 (65.0%) |
Race in Koshkonong
The most populous races in Koshkonong are White / Caucasian (118 | 67.8%), Two or more Races (54 | 31.0%), and Asian (2 | 1.1%).
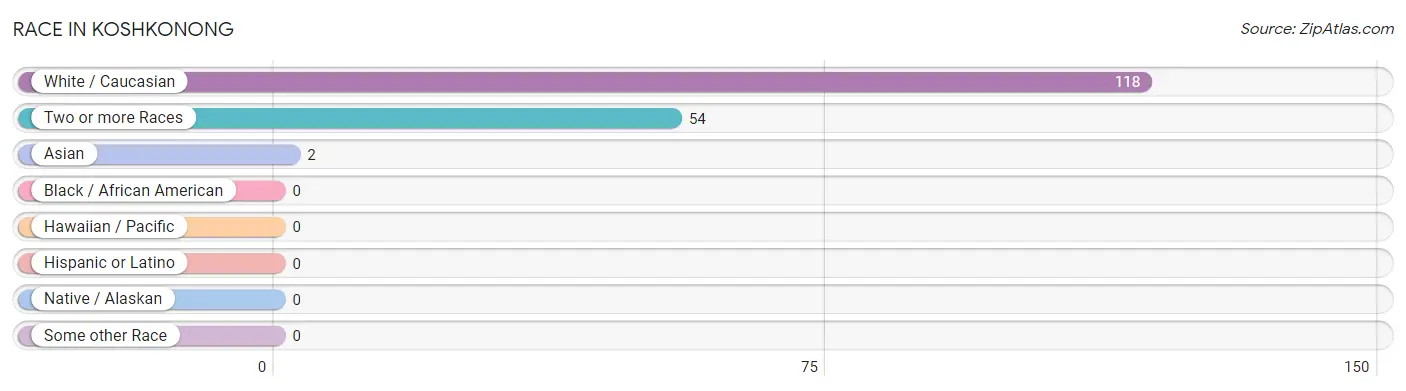
| Race | # Population | % Population |
| Asian | 2 | 1.1% |
| Black / African American | 0 | 0.0% |
| Hawaiian / Pacific | 0 | 0.0% |
| Hispanic or Latino | 0 | 0.0% |
| Native / Alaskan | 0 | 0.0% |
| White / Caucasian | 118 | 67.8% |
| Two or more Races | 54 | 31.0% |
| Some other Race | 0 | 0.0% |
| Total | 174 | 100.0% |
Ancestry in Koshkonong
The most populous ancestries reported in Koshkonong are Korean (25 | 14.4%), American (17 | 9.8%), German (13 | 7.5%), English (11 | 6.3%), and Irish (10 | 5.8%), together accounting for 43.7% of all Koshkonong residents.
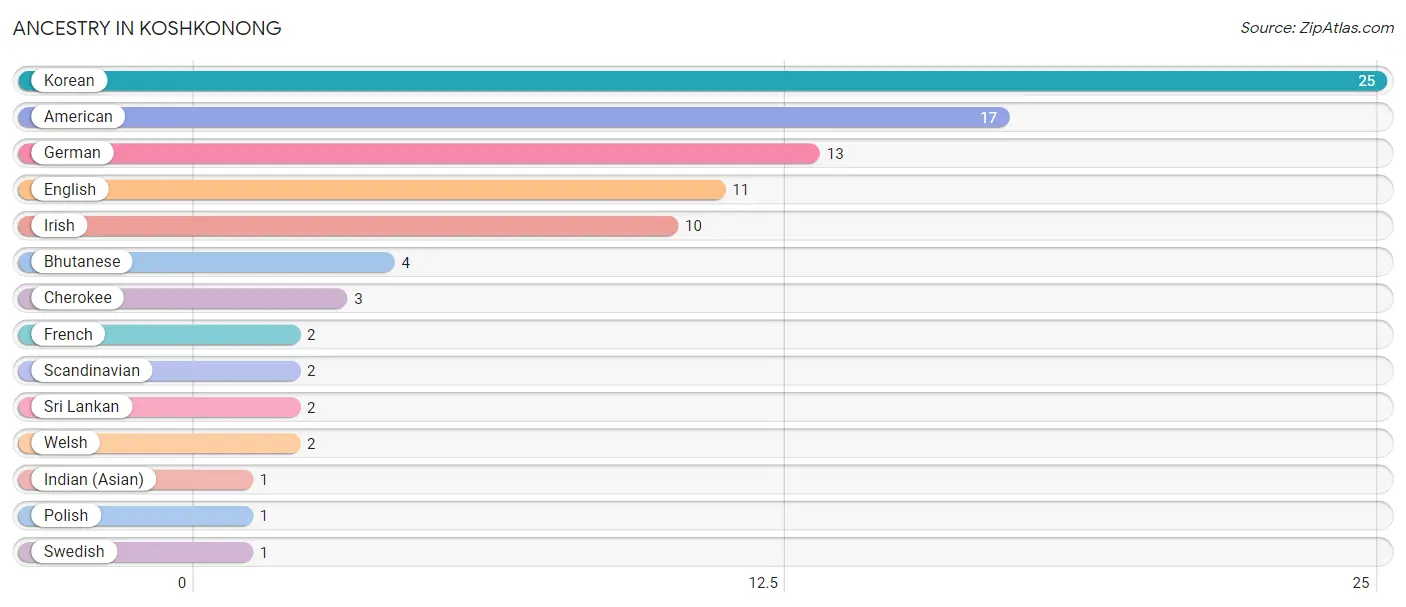
| Ancestry | # Population | % Population |
| American | 17 | 9.8% |
| Bhutanese | 4 | 2.3% |
| Cherokee | 3 | 1.7% |
| English | 11 | 6.3% |
| French | 2 | 1.1% |
| German | 13 | 7.5% |
| Indian (Asian) | 1 | 0.6% |
| Irish | 10 | 5.8% |
| Korean | 25 | 14.4% |
| Polish | 1 | 0.6% |
| Scandinavian | 2 | 1.1% |
| Sri Lankan | 2 | 1.1% |
| Swedish | 1 | 0.6% |
| Welsh | 2 | 1.1% | View All 14 Rows |
Immigrants in Koshkonong
The most numerous immigrant groups reported in Koshkonong came from Asia (4 | 2.3%), Eastern Asia (2 | 1.1%), Korea (2 | 1.1%), Philippines (2 | 1.1%), and South Eastern Asia (2 | 1.1%), together accounting for 6.9% of all Koshkonong residents.
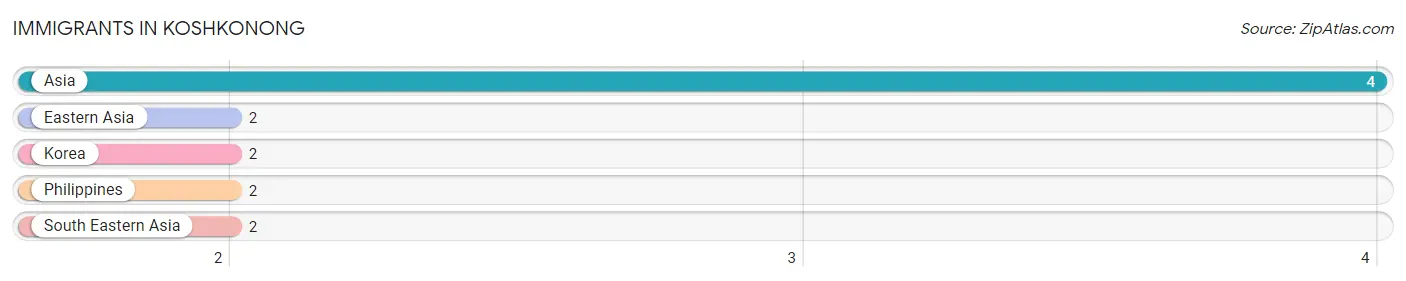
| Immigration Origin | # Population | % Population |
| Asia | 4 | 2.3% |
| Eastern Asia | 2 | 1.1% |
| Korea | 2 | 1.1% |
| Philippines | 2 | 1.1% |
| South Eastern Asia | 2 | 1.1% | View All 5 Rows |
Sex and Age in Koshkonong
Sex and Age in Koshkonong
The most populous age groups in Koshkonong are 5 to 9 Years (24 | 28.9%) for men and 15 to 19 Years (13 | 14.3%) for women.
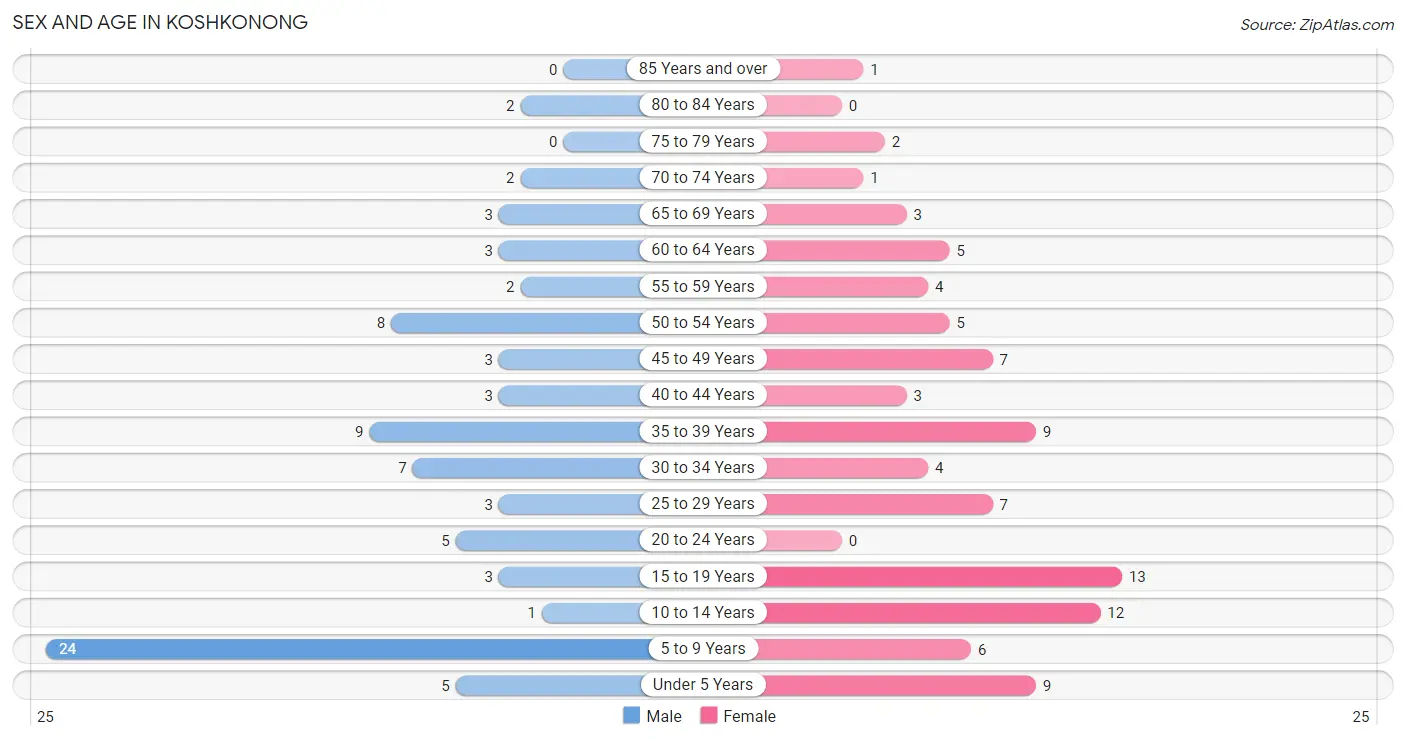
| Age Bracket | Male | Female |
| Under 5 Years | 5 (6.0%) | 9 (9.9%) |
| 5 to 9 Years | 24 (28.9%) | 6 (6.6%) |
| 10 to 14 Years | 1 (1.2%) | 12 (13.2%) |
| 15 to 19 Years | 3 (3.6%) | 13 (14.3%) |
| 20 to 24 Years | 5 (6.0%) | 0 (0.0%) |
| 25 to 29 Years | 3 (3.6%) | 7 (7.7%) |
| 30 to 34 Years | 7 (8.4%) | 4 (4.4%) |
| 35 to 39 Years | 9 (10.8%) | 9 (9.9%) |
| 40 to 44 Years | 3 (3.6%) | 3 (3.3%) |
| 45 to 49 Years | 3 (3.6%) | 7 (7.7%) |
| 50 to 54 Years | 8 (9.6%) | 5 (5.5%) |
| 55 to 59 Years | 2 (2.4%) | 4 (4.4%) |
| 60 to 64 Years | 3 (3.6%) | 5 (5.5%) |
| 65 to 69 Years | 3 (3.6%) | 3 (3.3%) |
| 70 to 74 Years | 2 (2.4%) | 1 (1.1%) |
| 75 to 79 Years | 0 (0.0%) | 2 (2.2%) |
| 80 to 84 Years | 2 (2.4%) | 0 (0.0%) |
| 85 Years and over | 0 (0.0%) | 1 (1.1%) |
| Total | 83 (100.0%) | 91 (100.0%) |
Families and Households in Koshkonong
Median Family Size in Koshkonong
The median family size in Koshkonong is 3.73 persons per family, with married-couple families (21 | 51.2%) accounting for the largest median family size of 4.05 persons per family. On the other hand, single male/father families (2 | 4.9%) represent the smallest median family size with 3.00 persons per family.
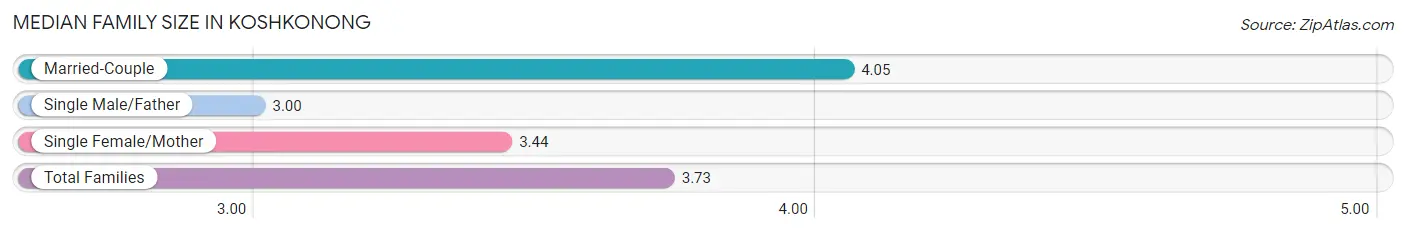
| Family Type | # Families | Family Size |
| Married-Couple | 21 (51.2%) | 4.05 |
| Single Male/Father | 2 (4.9%) | 3.00 |
| Single Female/Mother | 18 (43.9%) | 3.44 |
| Total Families | 41 (100.0%) | 3.73 |
Median Household Size in Koshkonong
The median household size in Koshkonong is 3.35 persons per household, with single male/father households (2 | 3.8%) accounting for the largest median household size of 4.5 persons per household. non-family households (11 | 21.1%) represent the smallest median household size with 1.55 persons per household.
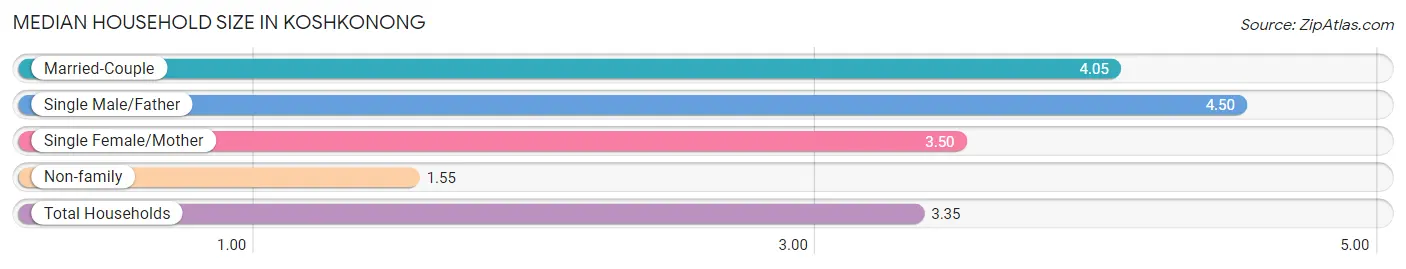
| Household Type | # Households | Household Size |
| Married-Couple | 21 (40.4%) | 4.05 |
| Single Male/Father | 2 (3.8%) | 4.50 |
| Single Female/Mother | 18 (34.6%) | 3.50 |
| Non-family | 11 (21.1%) | 1.55 |
| Total Households | 52 (100.0%) | 3.35 |
Household Size by Marriage Status in Koshkonong
Out of a total of 52 households in Koshkonong, 41 (78.8%) are family households, while 11 (21.1%) are nonfamily households. The most numerous type of family households are 3-person households, comprising 20, and the most common type of nonfamily households are 1-person households, comprising 7.
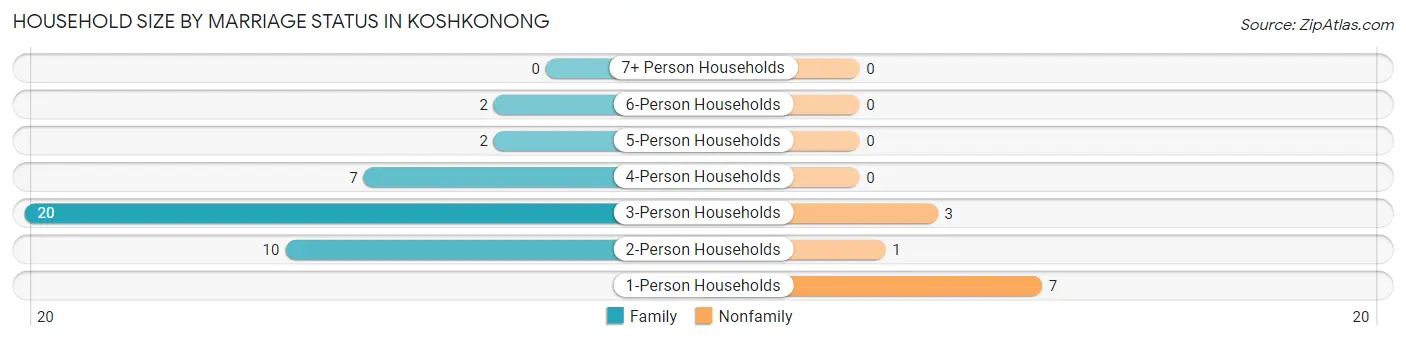
| Household Size | Family Households | Nonfamily Households |
| 1-Person Households | - | 7 (13.5%) |
| 2-Person Households | 10 (19.2%) | 1 (1.9%) |
| 3-Person Households | 20 (38.5%) | 3 (5.8%) |
| 4-Person Households | 7 (13.5%) | 0 (0.0%) |
| 5-Person Households | 2 (3.8%) | 0 (0.0%) |
| 6-Person Households | 2 (3.8%) | 0 (0.0%) |
| 7+ Person Households | 0 (0.0%) | 0 (0.0%) |
| Total | 41 (78.8%) | 11 (21.1%) |
Female Fertility in Koshkonong
Fertility by Age in Koshkonong
Average fertility rate in Koshkonong is 44.0 births per 1,000 women. Women in the age bracket of 20 to 34 years have the highest fertility rate with 182.0 births per 1,000 women. Women in the age bracket of 20 to 34 years acount for 100.0% of all women with births.
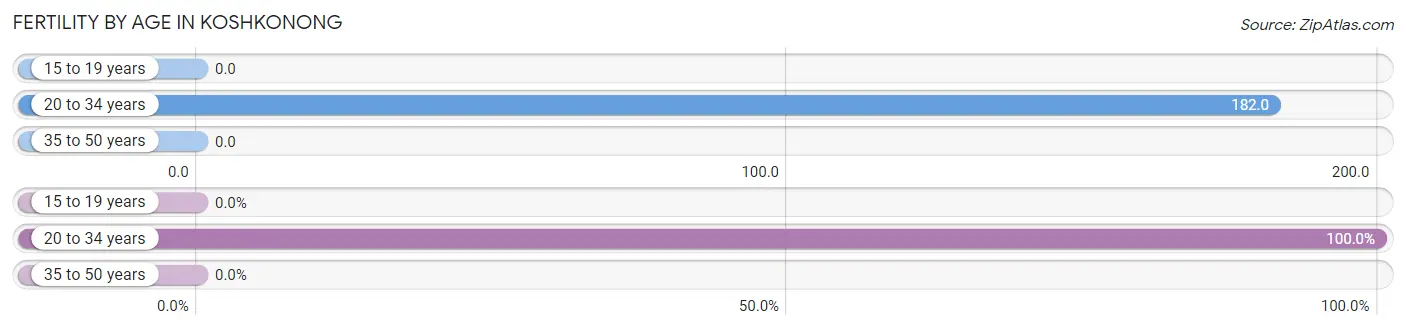
| Age Bracket | Women with Births | Births / 1,000 Women |
| 15 to 19 years | 0 (0.0%) | 0.0 |
| 20 to 34 years | 2 (100.0%) | 182.0 |
| 35 to 50 years | 0 (0.0%) | 0.0 |
| Total | 2 (100.0%) | 44.0 |
Fertility by Age by Marriage Status in Koshkonong
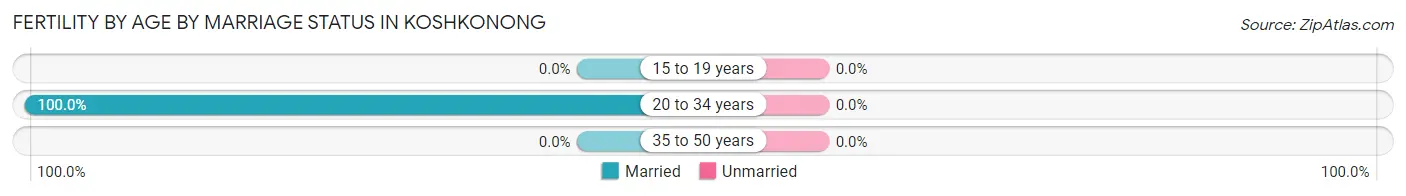
| Age Bracket | Married | Unmarried |
| 15 to 19 years | 0 (0.0%) | 0 (0.0%) |
| 20 to 34 years | 2 (100.0%) | 0 (0.0%) |
| 35 to 50 years | 0 (0.0%) | 0 (0.0%) |
| Total | 2 (100.0%) | 0 (0.0%) |
Fertility by Education in Koshkonong
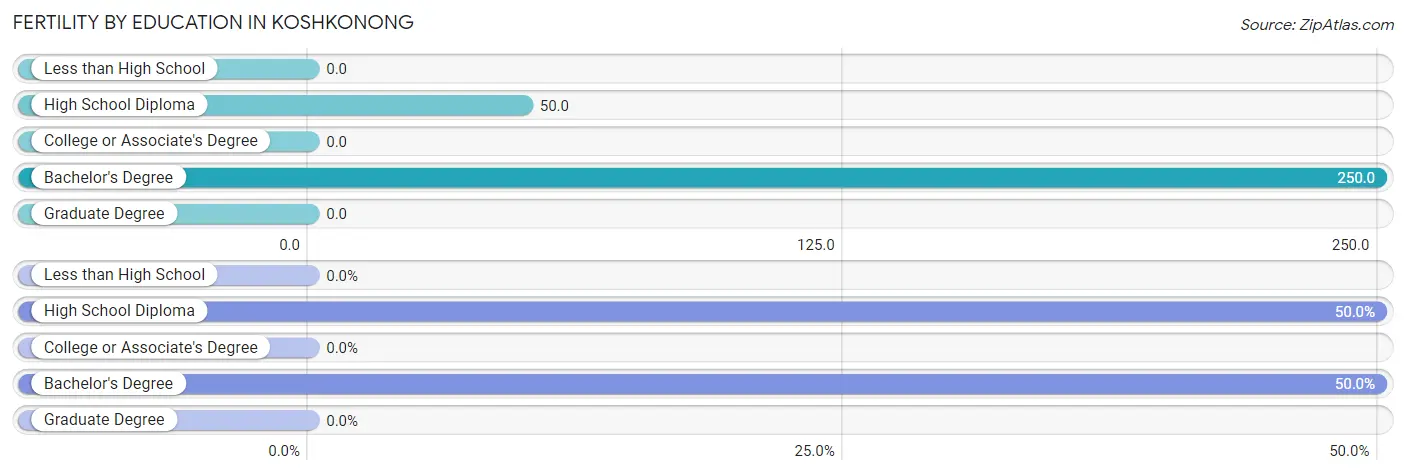
| Educational Attainment | Women with Births | Births / 1,000 Women |
| Less than High School | 0 (0.0%) | 0.0 |
| High School Diploma | 1 (50.0%) | 50.0 |
| College or Associate's Degree | 0 (0.0%) | 0.0 |
| Bachelor's Degree | 1 (50.0%) | 250.0 |
| Graduate Degree | 0 (0.0%) | 0.0 |
| Total | 2 (100.0%) | 44.0 |
Fertility by Education by Marriage Status in Koshkonong
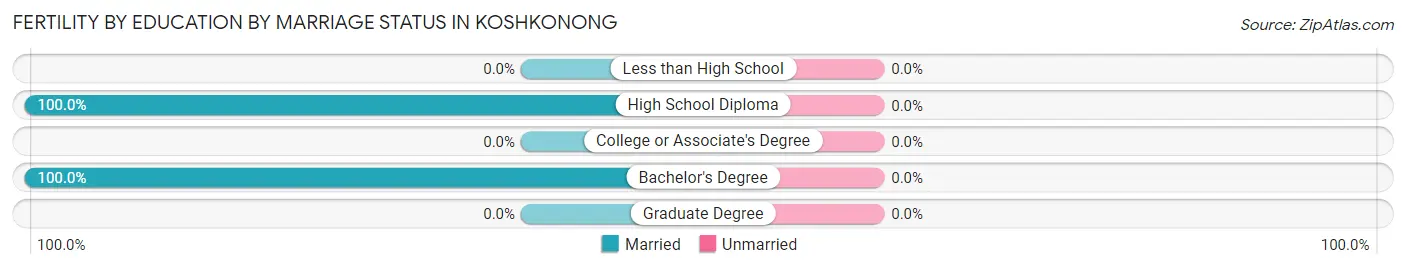
| Educational Attainment | Married | Unmarried |
| Less than High School | 0 (0.0%) | 0 (0.0%) |
| High School Diploma | 1 (100.0%) | 0 (0.0%) |
| College or Associate's Degree | 0 (0.0%) | 0 (0.0%) |
| Bachelor's Degree | 1 (100.0%) | 0 (0.0%) |
| Graduate Degree | 0 (0.0%) | 0 (0.0%) |
| Total | 2 (100.0%) | 0 (0.0%) |
Employment Characteristics in Koshkonong
Employment by Class of Employer in Koshkonong
Among the 60 employed individuals in Koshkonong, private company employees (43 | 71.7%), self-employed (incorporated) (5 | 8.3%), and local government employees (5 | 8.3%) make up the most common classes of employment.
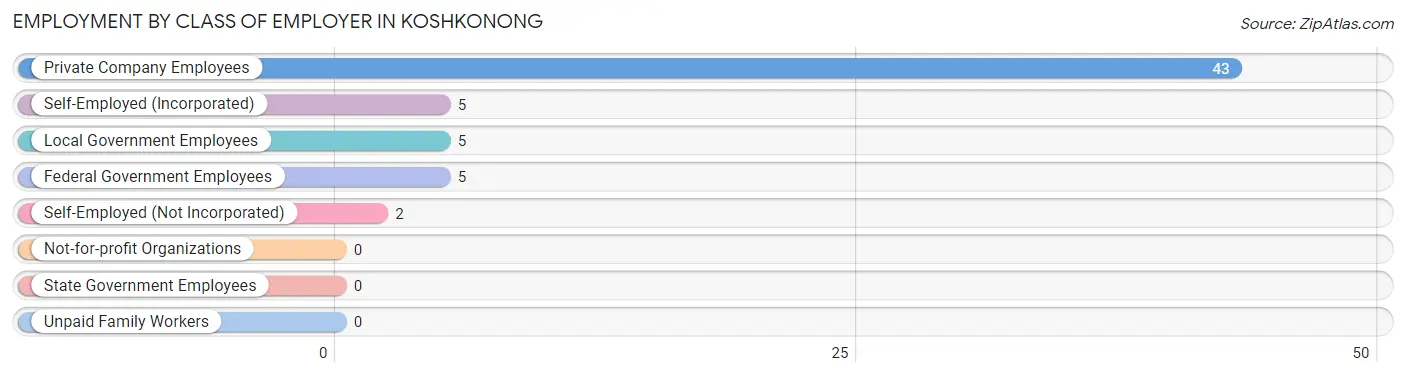
| Employer Class | # Employees | % Employees |
| Private Company Employees | 43 | 71.7% |
| Self-Employed (Incorporated) | 5 | 8.3% |
| Self-Employed (Not Incorporated) | 2 | 3.3% |
| Not-for-profit Organizations | 0 | 0.0% |
| Local Government Employees | 5 | 8.3% |
| State Government Employees | 0 | 0.0% |
| Federal Government Employees | 5 | 8.3% |
| Unpaid Family Workers | 0 | 0.0% |
| Total | 60 | 100.0% |
Employment Status by Age in Koshkonong
According to the labor force statistics for Koshkonong, out of the total population over 16 years of age (113), 57.5% or 65 individuals are in the labor force, with 7.7% or 5 of them unemployed. The age group with the highest labor force participation rate is 16 to 19 years, with 100.0% or 12 individuals in the labor force. Within the labor force, the 25 to 29 years age range has the highest percentage of unemployed individuals, with 83.3% or 5 of them being unemployed.
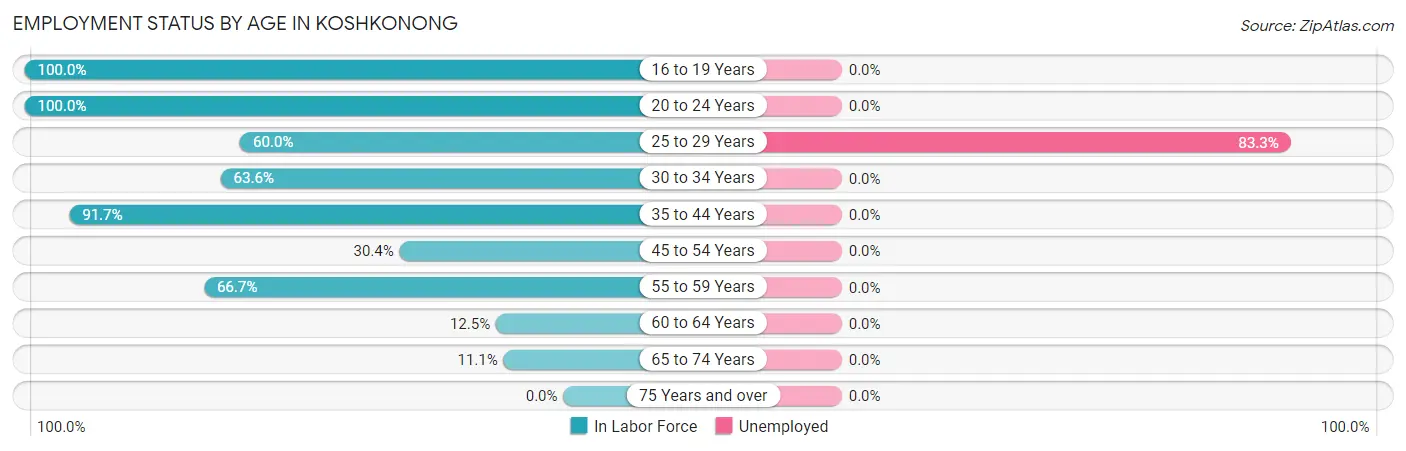
| Age Bracket | In Labor Force | Unemployed |
| 16 to 19 Years | 12 (100.0%) | 0 (0.0%) |
| 20 to 24 Years | 5 (100.0%) | 0 (0.0%) |
| 25 to 29 Years | 6 (60.0%) | 5 (83.3%) |
| 30 to 34 Years | 7 (63.6%) | 0 (0.0%) |
| 35 to 44 Years | 22 (91.7%) | 0 (0.0%) |
| 45 to 54 Years | 7 (30.4%) | 0 (0.0%) |
| 55 to 59 Years | 4 (66.7%) | 0 (0.0%) |
| 60 to 64 Years | 1 (12.5%) | 0 (0.0%) |
| 65 to 74 Years | 1 (11.1%) | 0 (0.0%) |
| 75 Years and over | 0 (0.0%) | 0 (0.0%) |
| Total | 65 (57.5%) | 5 (7.7%) |
Employment Status by Educational Attainment in Koshkonong
According to labor force statistics for Koshkonong, 57.3% of individuals (47) out of the total population between 25 and 64 years of age (82) are in the labor force, with 10.6% or 5 of them being unemployed. The group with the highest labor force participation rate are those with the educational attainment of college / associate degree, with 77.3% or 17 individuals in the labor force. Within the labor force, individuals with high school diploma education have the highest percentage of unemployment, with 19.2% or 5 of them being unemployed.
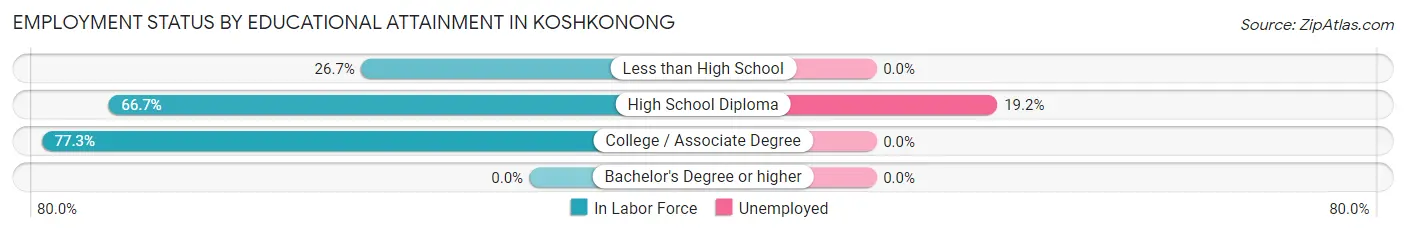
| Educational Attainment | In Labor Force | Unemployed |
| Less than High School | 4 (26.7%) | 0 (0.0%) |
| High School Diploma | 26 (66.7%) | 7 (19.2%) |
| College / Associate Degree | 17 (77.3%) | 0 (0.0%) |
| Bachelor's Degree or higher | 0 (0.0%) | 0 (0.0%) |
| Total | 47 (57.3%) | 9 (10.6%) |
Employment Occupations by Sex in Koshkonong
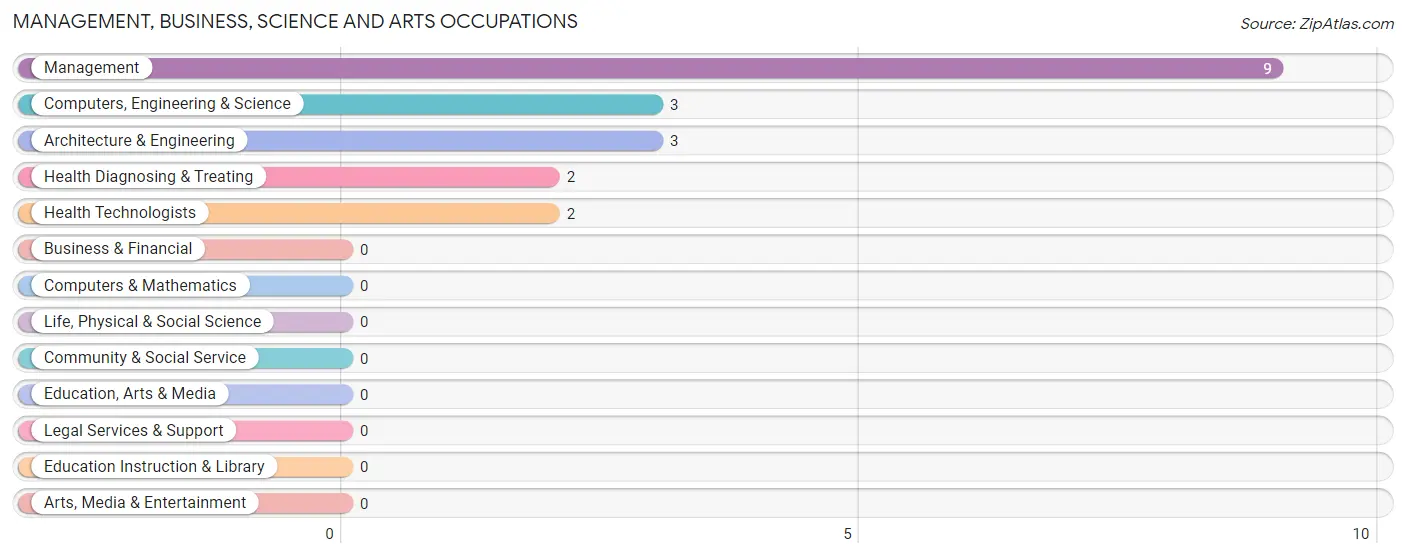
Management, Business, Science and Arts Occupations
The most common Management, Business, Science and Arts occupations in Koshkonong are Management (9 | 15.0%), Computers, Engineering & Science (3 | 5.0%), Architecture & Engineering (3 | 5.0%), Health Diagnosing & Treating (2 | 3.3%), and Health Technologists (2 | 3.3%).
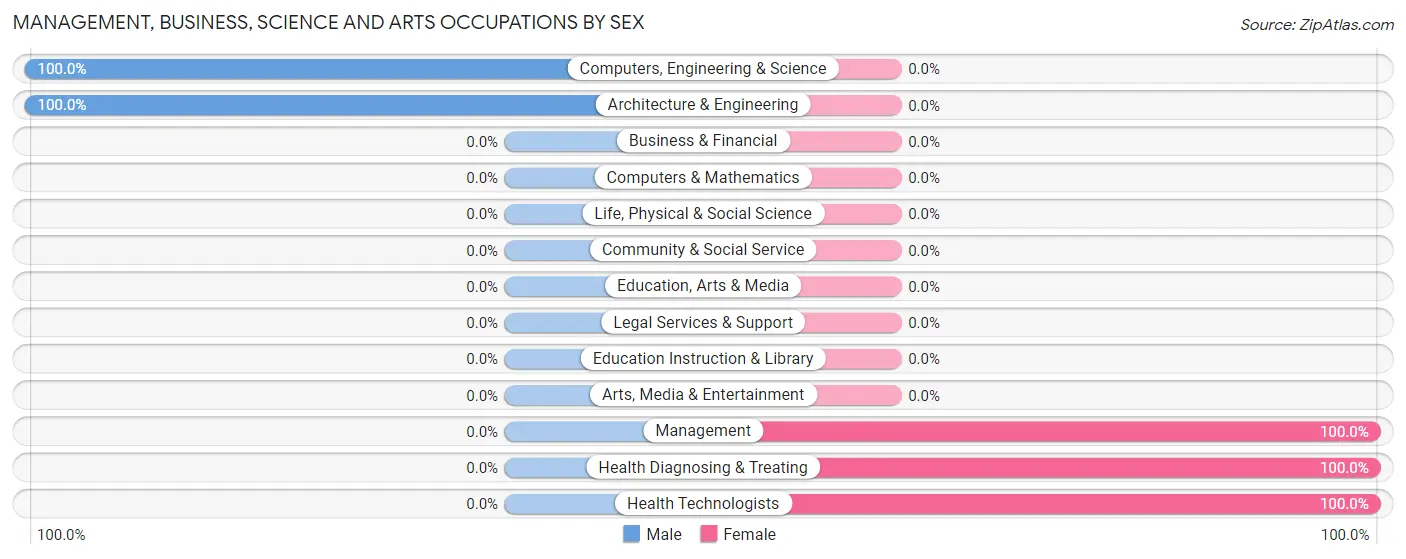
Management, Business, Science and Arts Occupations by Sex
Within the Management, Business, Science and Arts occupations in Koshkonong, the most male-oriented occupations are Computers, Engineering & Science (100.0%), and Architecture & Engineering (100.0%), while the most female-oriented occupations are Management (100.0%), Health Diagnosing & Treating (100.0%), and Health Technologists (100.0%).
| Occupation | Male | Female |
| Management | 0 (0.0%) | 9 (100.0%) |
| Business & Financial | 0 (0.0%) | 0 (0.0%) |
| Computers, Engineering & Science | 3 (100.0%) | 0 (0.0%) |
| Computers & Mathematics | 0 (0.0%) | 0 (0.0%) |
| Architecture & Engineering | 3 (100.0%) | 0 (0.0%) |
| Life, Physical & Social Science | 0 (0.0%) | 0 (0.0%) |
| Community & Social Service | 0 (0.0%) | 0 (0.0%) |
| Education, Arts & Media | 0 (0.0%) | 0 (0.0%) |
| Legal Services & Support | 0 (0.0%) | 0 (0.0%) |
| Education Instruction & Library | 0 (0.0%) | 0 (0.0%) |
| Arts, Media & Entertainment | 0 (0.0%) | 0 (0.0%) |
| Health Diagnosing & Treating | 0 (0.0%) | 2 (100.0%) |
| Health Technologists | 0 (0.0%) | 2 (100.0%) |
| Total (Category) | 3 (21.4%) | 11 (78.6%) |
| Total (Overall) | 26 (43.3%) | 34 (56.7%) |
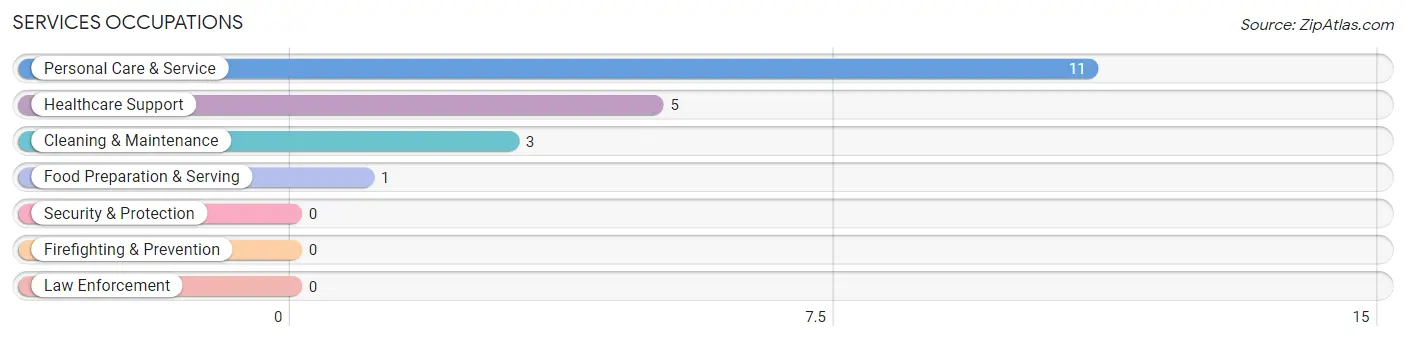
Services Occupations
The most common Services occupations in Koshkonong are Personal Care & Service (11 | 18.3%), Healthcare Support (5 | 8.3%), Cleaning & Maintenance (3 | 5.0%), and Food Preparation & Serving (1 | 1.7%).
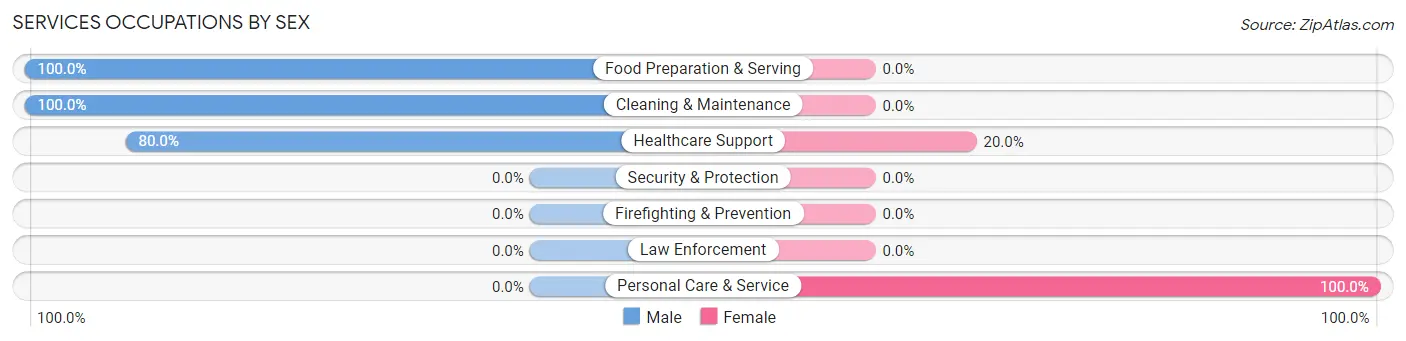
Services Occupations by Sex
Within the Services occupations in Koshkonong, the most male-oriented occupations are Food Preparation & Serving (100.0%), Cleaning & Maintenance (100.0%), and Healthcare Support (80.0%), while the most female-oriented occupations are Personal Care & Service (100.0%), and Healthcare Support (20.0%).
| Occupation | Male | Female |
| Healthcare Support | 4 (80.0%) | 1 (20.0%) |
| Security & Protection | 0 (0.0%) | 0 (0.0%) |
| Firefighting & Prevention | 0 (0.0%) | 0 (0.0%) |
| Law Enforcement | 0 (0.0%) | 0 (0.0%) |
| Food Preparation & Serving | 1 (100.0%) | 0 (0.0%) |
| Cleaning & Maintenance | 3 (100.0%) | 0 (0.0%) |
| Personal Care & Service | 0 (0.0%) | 11 (100.0%) |
| Total (Category) | 8 (40.0%) | 12 (60.0%) |
| Total (Overall) | 26 (43.3%) | 34 (56.7%) |
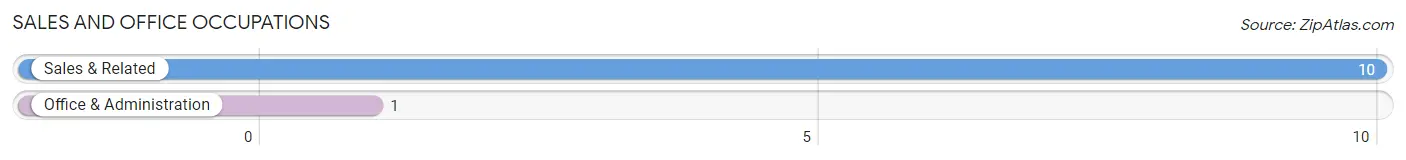
Sales and Office Occupations
The most common Sales and Office occupations in Koshkonong are Sales & Related (10 | 16.7%), and Office & Administration (1 | 1.7%).
Sales and Office Occupations by Sex
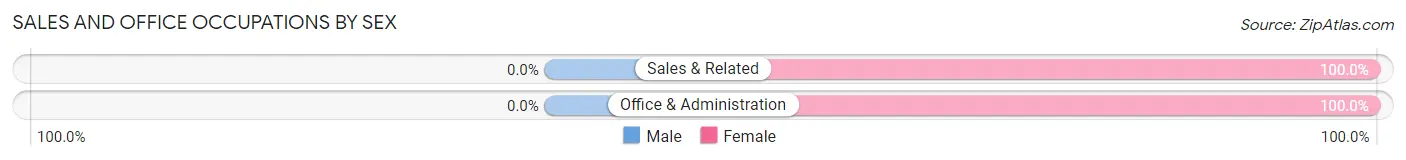
| Occupation | Male | Female |
| Sales & Related | 0 (0.0%) | 10 (100.0%) |
| Office & Administration | 0 (0.0%) | 1 (100.0%) |
| Total (Category) | 0 (0.0%) | 11 (100.0%) |
| Total (Overall) | 26 (43.3%) | 34 (56.7%) |
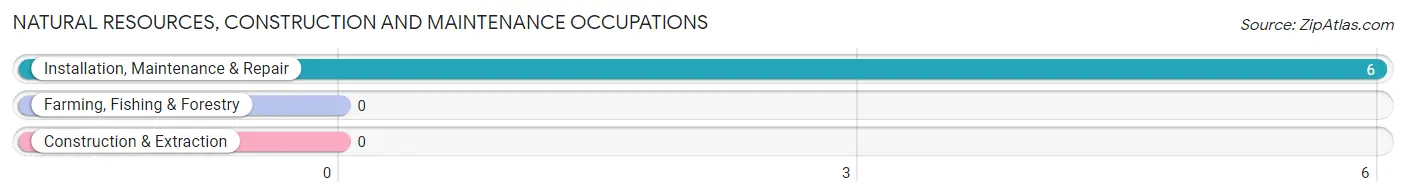
Natural Resources, Construction and Maintenance Occupations
The most common Natural Resources, Construction and Maintenance occupations in Koshkonong are , and Installation, Maintenance & Repair (6 | 10.0%).
Natural Resources, Construction and Maintenance Occupations by Sex
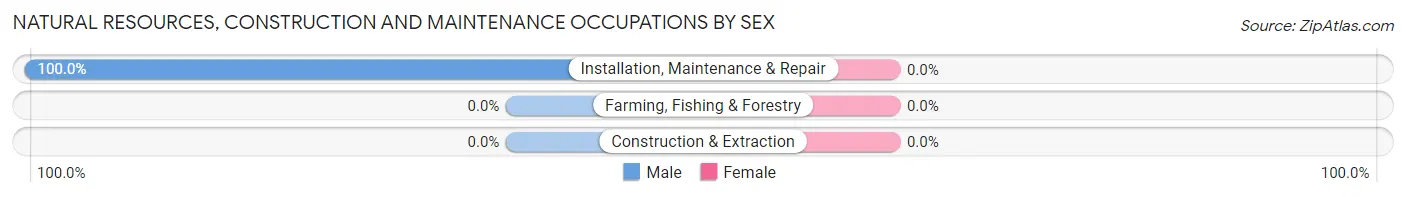
| Occupation | Male | Female |
| Farming, Fishing & Forestry | 0 (0.0%) | 0 (0.0%) |
| Construction & Extraction | 0 (0.0%) | 0 (0.0%) |
| Installation, Maintenance & Repair | 6 (100.0%) | 0 (0.0%) |
| Total (Category) | 6 (100.0%) | 0 (0.0%) |
| Total (Overall) | 26 (43.3%) | 34 (56.7%) |
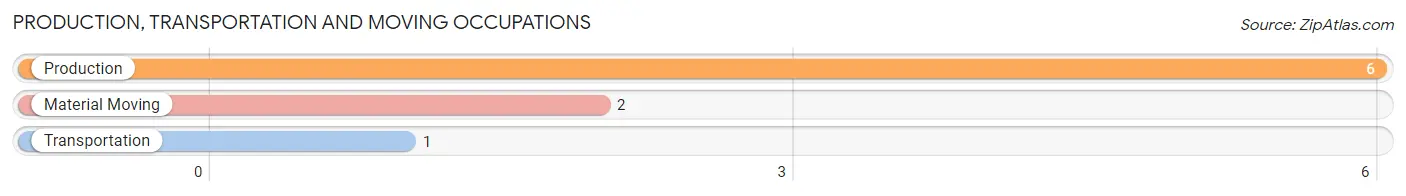
Production, Transportation and Moving Occupations
The most common Production, Transportation and Moving occupations in Koshkonong are Production (6 | 10.0%), Material Moving (2 | 3.3%), and Transportation (1 | 1.7%).
Production, Transportation and Moving Occupations by Sex
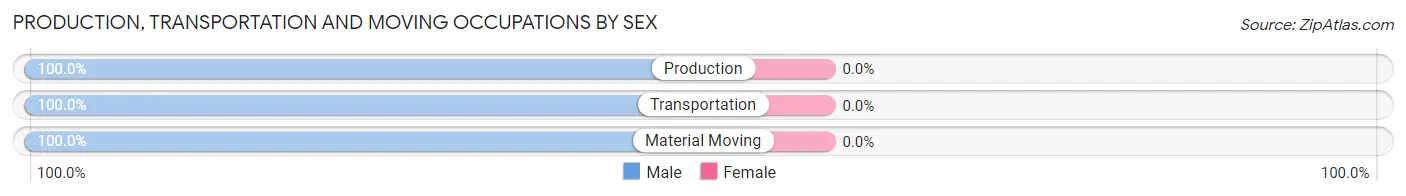
| Occupation | Male | Female |
| Production | 6 (100.0%) | 0 (0.0%) |
| Transportation | 1 (100.0%) | 0 (0.0%) |
| Material Moving | 2 (100.0%) | 0 (0.0%) |
| Total (Category) | 9 (100.0%) | 0 (0.0%) |
| Total (Overall) | 26 (43.3%) | 34 (56.7%) |
Employment Industries by Sex in Koshkonong
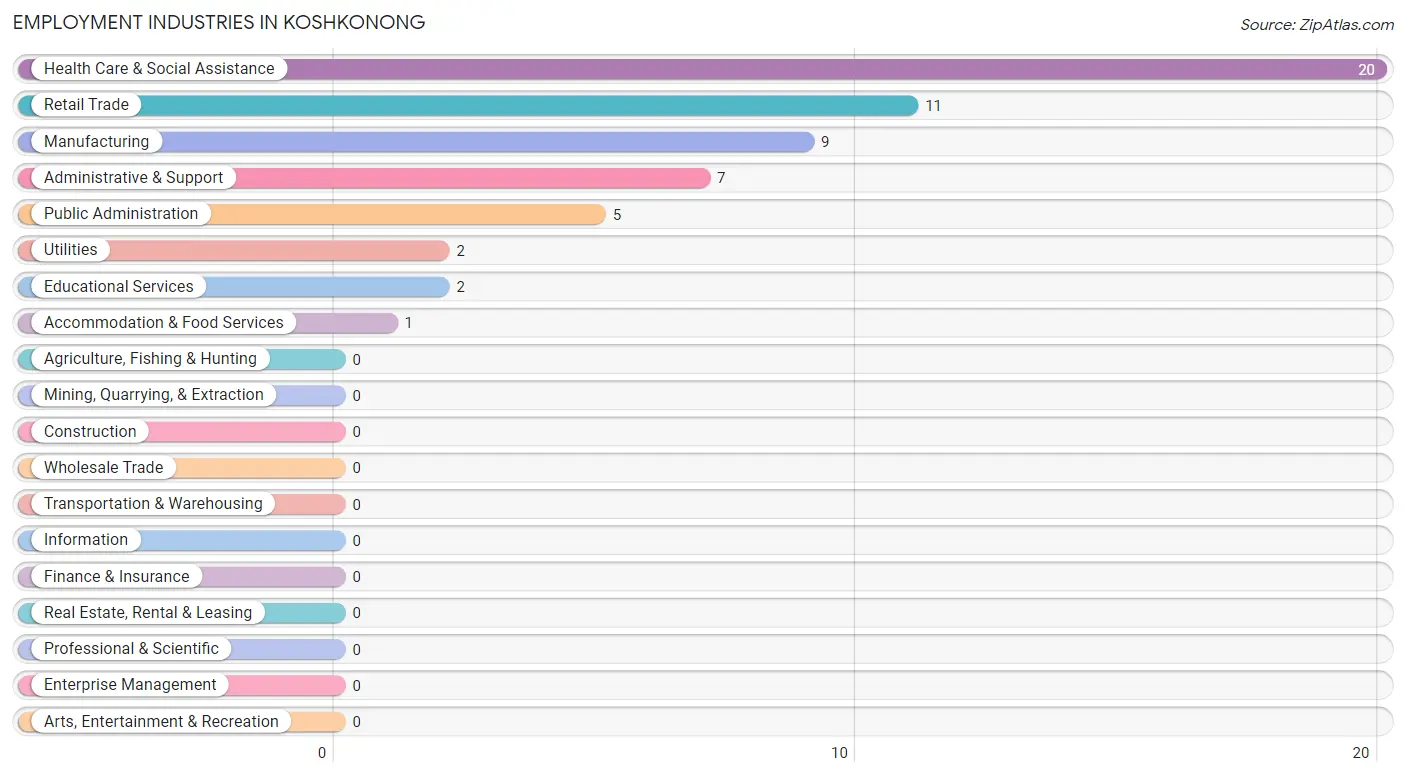
Employment Industries in Koshkonong
The major employment industries in Koshkonong include Health Care & Social Assistance (20 | 33.3%), Retail Trade (11 | 18.3%), Manufacturing (9 | 15.0%), Administrative & Support (7 | 11.7%), and Public Administration (5 | 8.3%).
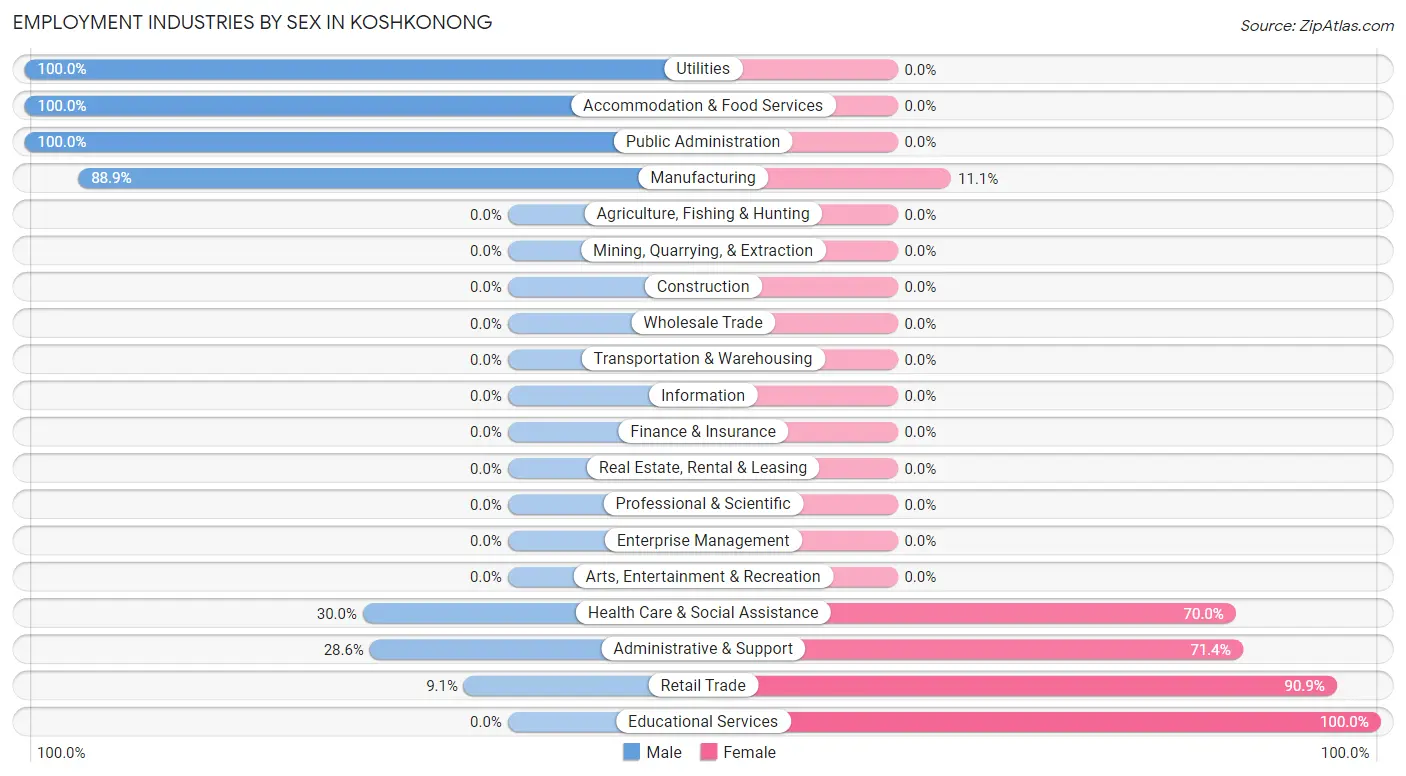
Employment Industries by Sex in Koshkonong
The Koshkonong industries that see more men than women are Utilities (100.0%), Accommodation & Food Services (100.0%), and Public Administration (100.0%), whereas the industries that tend to have a higher number of women are Educational Services (100.0%), Retail Trade (90.9%), and Administrative & Support (71.4%).
| Industry | Male | Female |
| Agriculture, Fishing & Hunting | 0 (0.0%) | 0 (0.0%) |
| Mining, Quarrying, & Extraction | 0 (0.0%) | 0 (0.0%) |
| Construction | 0 (0.0%) | 0 (0.0%) |
| Manufacturing | 8 (88.9%) | 1 (11.1%) |
| Wholesale Trade | 0 (0.0%) | 0 (0.0%) |
| Retail Trade | 1 (9.1%) | 10 (90.9%) |
| Transportation & Warehousing | 0 (0.0%) | 0 (0.0%) |
| Utilities | 2 (100.0%) | 0 (0.0%) |
| Information | 0 (0.0%) | 0 (0.0%) |
| Finance & Insurance | 0 (0.0%) | 0 (0.0%) |
| Real Estate, Rental & Leasing | 0 (0.0%) | 0 (0.0%) |
| Professional & Scientific | 0 (0.0%) | 0 (0.0%) |
| Enterprise Management | 0 (0.0%) | 0 (0.0%) |
| Administrative & Support | 2 (28.6%) | 5 (71.4%) |
| Educational Services | 0 (0.0%) | 2 (100.0%) |
| Health Care & Social Assistance | 6 (30.0%) | 14 (70.0%) |
| Arts, Entertainment & Recreation | 0 (0.0%) | 0 (0.0%) |
| Accommodation & Food Services | 1 (100.0%) | 0 (0.0%) |
| Public Administration | 5 (100.0%) | 0 (0.0%) |
| Total | 26 (43.3%) | 34 (56.7%) |
Education in Koshkonong
School Enrollment in Koshkonong
The most common levels of schooling among the 61 students in Koshkonong are elementary school (23 | 37.7%), high school (12 | 19.7%), and middle school (11 | 18.0%).
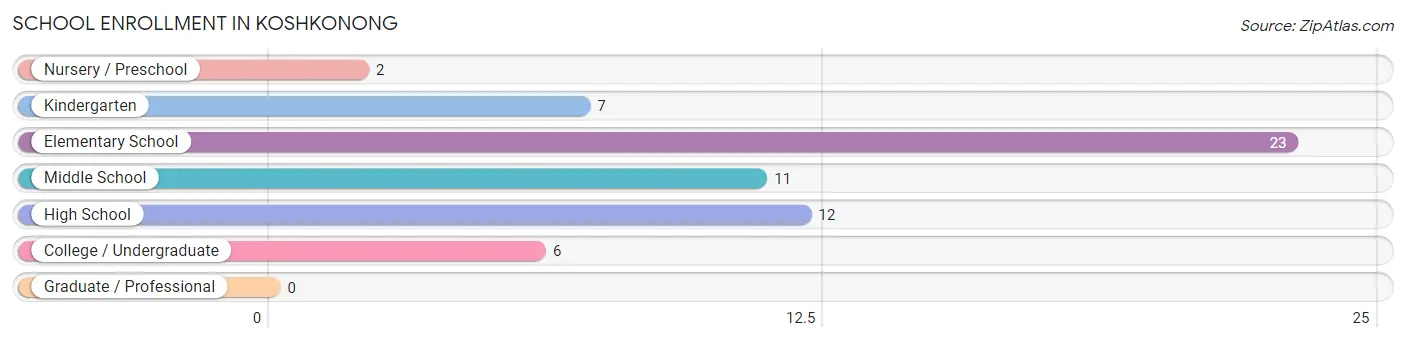
| School Level | # Students | % Students |
| Nursery / Preschool | 2 | 3.3% |
| Kindergarten | 7 | 11.5% |
| Elementary School | 23 | 37.7% |
| Middle School | 11 | 18.0% |
| High School | 12 | 19.7% |
| College / Undergraduate | 6 | 9.8% |
| Graduate / Professional | 0 | 0.0% |
| Total | 61 | 100.0% |
School Enrollment by Age by Funding Source in Koshkonong
Out of a total of 61 students who are enrolled in schools in Koshkonong, 3 (4.9%) attend a private institution, while the remaining 58 (95.1%) are enrolled in public schools. The age group of 25 to 34 year olds has the highest likelihood of being enrolled in private schools, with 1 (50.0% in the age bracket) enrolled. Conversely, the age group of 3 to 4 year olds has the lowest likelihood of being enrolled in a private school, with 2 (100.0% in the age bracket) attending a public institution.
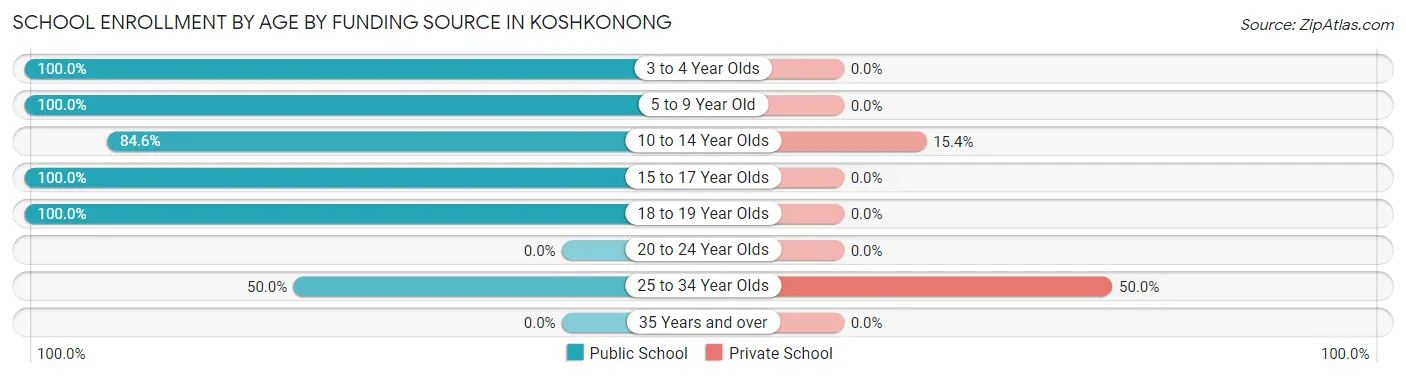
| Age Bracket | Public School | Private School |
| 3 to 4 Year Olds | 2 (100.0%) | 0 (0.0%) |
| 5 to 9 Year Old | 28 (100.0%) | 0 (0.0%) |
| 10 to 14 Year Olds | 11 (84.6%) | 2 (15.4%) |
| 15 to 17 Year Olds | 4 (100.0%) | 0 (0.0%) |
| 18 to 19 Year Olds | 12 (100.0%) | 0 (0.0%) |
| 20 to 24 Year Olds | 0 (0.0%) | 0 (0.0%) |
| 25 to 34 Year Olds | 1 (50.0%) | 1 (50.0%) |
| 35 Years and over | 0 (0.0%) | 0 (0.0%) |
| Total | 58 (95.1%) | 3 (4.9%) |
Educational Attainment by Field of Study in Koshkonong
Arts & humanities (3 | 50.0%), bio, nature & agricultural (2 | 33.3%), and psychology (1 | 16.7%) are the most common fields of study among 6 individuals in Koshkonong who have obtained a bachelor's degree or higher.
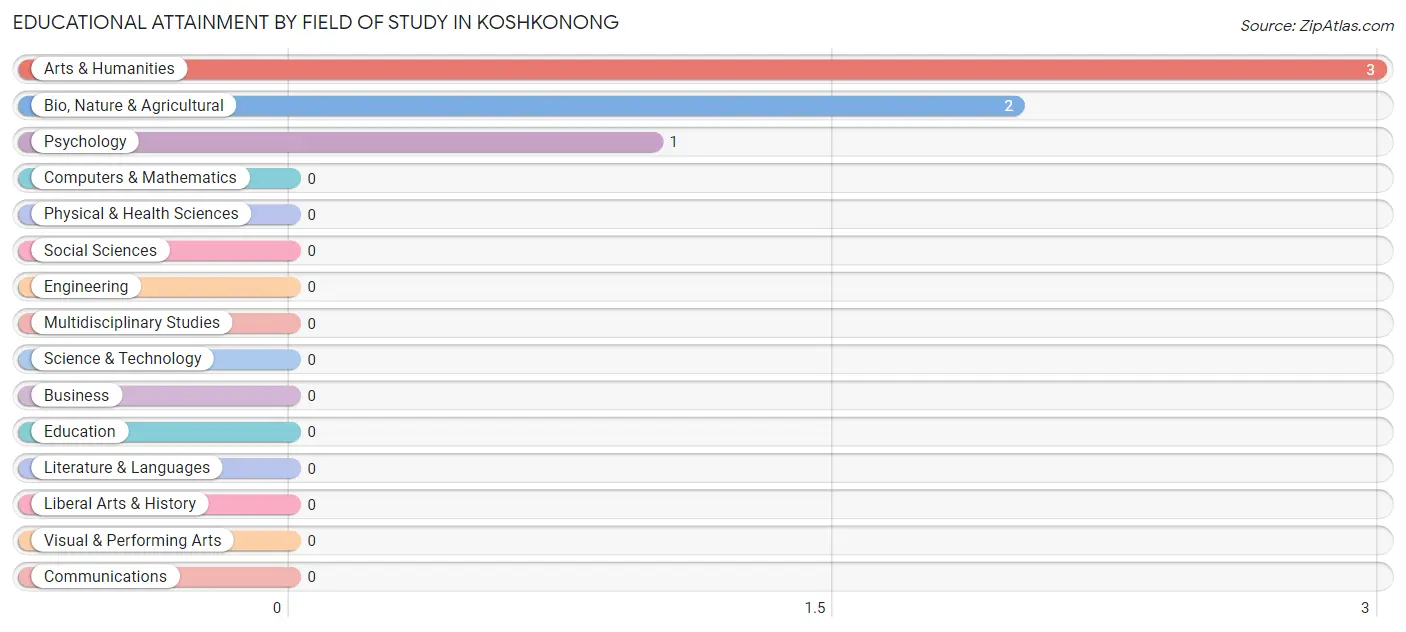
| Field of Study | # Graduates | % Graduates |
| Computers & Mathematics | 0 | 0.0% |
| Bio, Nature & Agricultural | 2 | 33.3% |
| Physical & Health Sciences | 0 | 0.0% |
| Psychology | 1 | 16.7% |
| Social Sciences | 0 | 0.0% |
| Engineering | 0 | 0.0% |
| Multidisciplinary Studies | 0 | 0.0% |
| Science & Technology | 0 | 0.0% |
| Business | 0 | 0.0% |
| Education | 0 | 0.0% |
| Literature & Languages | 0 | 0.0% |
| Liberal Arts & History | 0 | 0.0% |
| Visual & Performing Arts | 0 | 0.0% |
| Communications | 0 | 0.0% |
| Arts & Humanities | 3 | 50.0% |
| Total | 6 | 100.0% |
Transportation & Commute in Koshkonong
Vehicle Availability by Sex in Koshkonong
The most prevalent vehicle ownership categories in Koshkonong are males with 2 vehicles (14, accounting for 53.8%) and females with 2 vehicles (24, making up 41.2%).
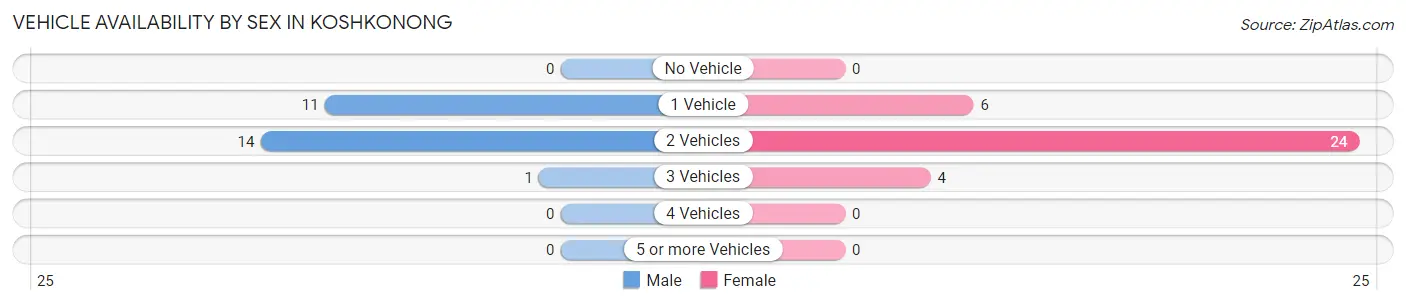
| Vehicles Available | Male | Female |
| No Vehicle | 0 (0.0%) | 0 (0.0%) |
| 1 Vehicle | 11 (42.3%) | 6 (17.6%) |
| 2 Vehicles | 14 (53.8%) | 24 (70.6%) |
| 3 Vehicles | 1 (3.8%) | 4 (11.8%) |
| 4 Vehicles | 0 (0.0%) | 0 (0.0%) |
| 5 or more Vehicles | 0 (0.0%) | 0 (0.0%) |
| Total | 26 (100.0%) | 34 (100.0%) |
Commute Time in Koshkonong
The most frequently occuring commute durations in Koshkonong are 30 to 34 minutes (17 commuters, 28.3%), less than 5 minutes (13 commuters, 21.7%), and 5 to 9 minutes (13 commuters, 21.7%).
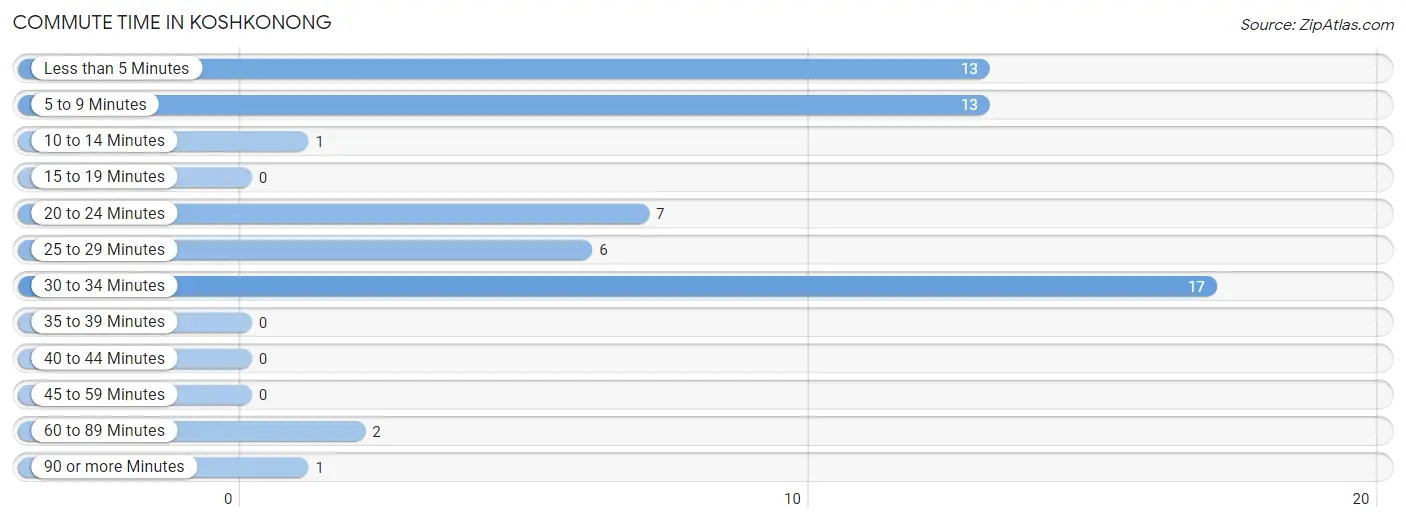
| Commute Time | # Commuters | % Commuters |
| Less than 5 Minutes | 13 | 21.7% |
| 5 to 9 Minutes | 13 | 21.7% |
| 10 to 14 Minutes | 1 | 1.7% |
| 15 to 19 Minutes | 0 | 0.0% |
| 20 to 24 Minutes | 7 | 11.7% |
| 25 to 29 Minutes | 6 | 10.0% |
| 30 to 34 Minutes | 17 | 28.3% |
| 35 to 39 Minutes | 0 | 0.0% |
| 40 to 44 Minutes | 0 | 0.0% |
| 45 to 59 Minutes | 0 | 0.0% |
| 60 to 89 Minutes | 2 | 3.3% |
| 90 or more Minutes | 1 | 1.7% |
Commute Time by Sex in Koshkonong
The most common commute times in Koshkonong are 20 to 24 minutes (7 commuters, 26.9%) for males and 30 to 34 minutes (14 commuters, 41.2%) for females.
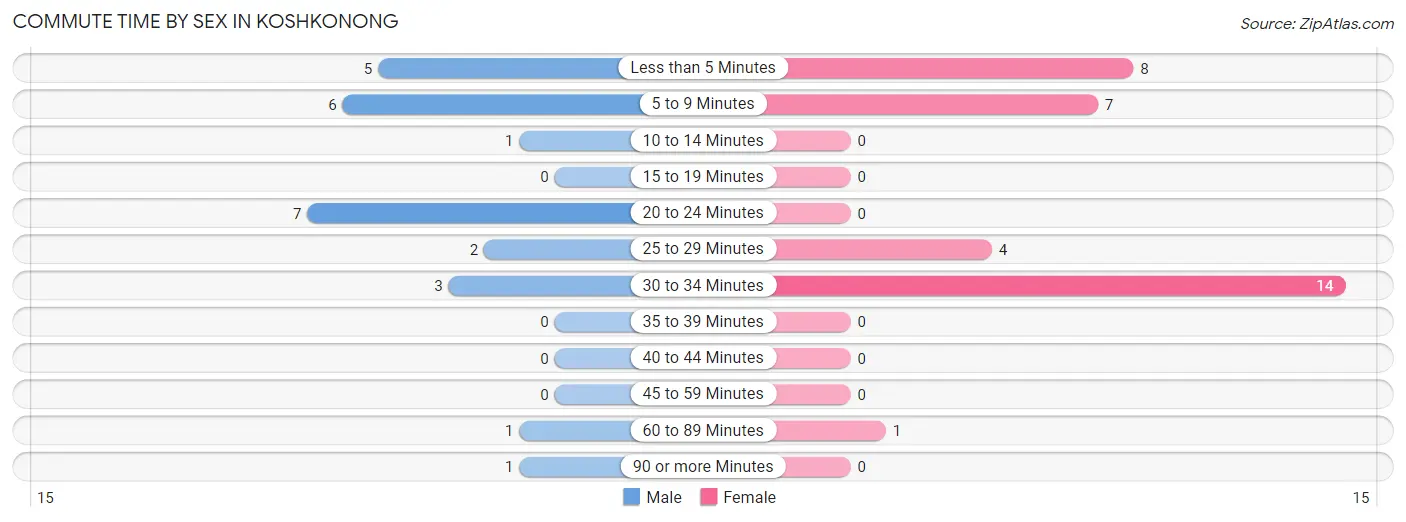
| Commute Time | Male | Female |
| Less than 5 Minutes | 5 (19.2%) | 8 (23.5%) |
| 5 to 9 Minutes | 6 (23.1%) | 7 (20.6%) |
| 10 to 14 Minutes | 1 (3.8%) | 0 (0.0%) |
| 15 to 19 Minutes | 0 (0.0%) | 0 (0.0%) |
| 20 to 24 Minutes | 7 (26.9%) | 0 (0.0%) |
| 25 to 29 Minutes | 2 (7.7%) | 4 (11.8%) |
| 30 to 34 Minutes | 3 (11.5%) | 14 (41.2%) |
| 35 to 39 Minutes | 0 (0.0%) | 0 (0.0%) |
| 40 to 44 Minutes | 0 (0.0%) | 0 (0.0%) |
| 45 to 59 Minutes | 0 (0.0%) | 0 (0.0%) |
| 60 to 89 Minutes | 1 (3.8%) | 1 (2.9%) |
| 90 or more Minutes | 1 (3.8%) | 0 (0.0%) |
Time of Departure to Work by Sex in Koshkonong
The most frequent times of departure to work in Koshkonong are 7:30 AM to 7:59 AM (7, 26.9%) for males and 7:00 AM to 7:29 AM (10, 29.4%) for females.
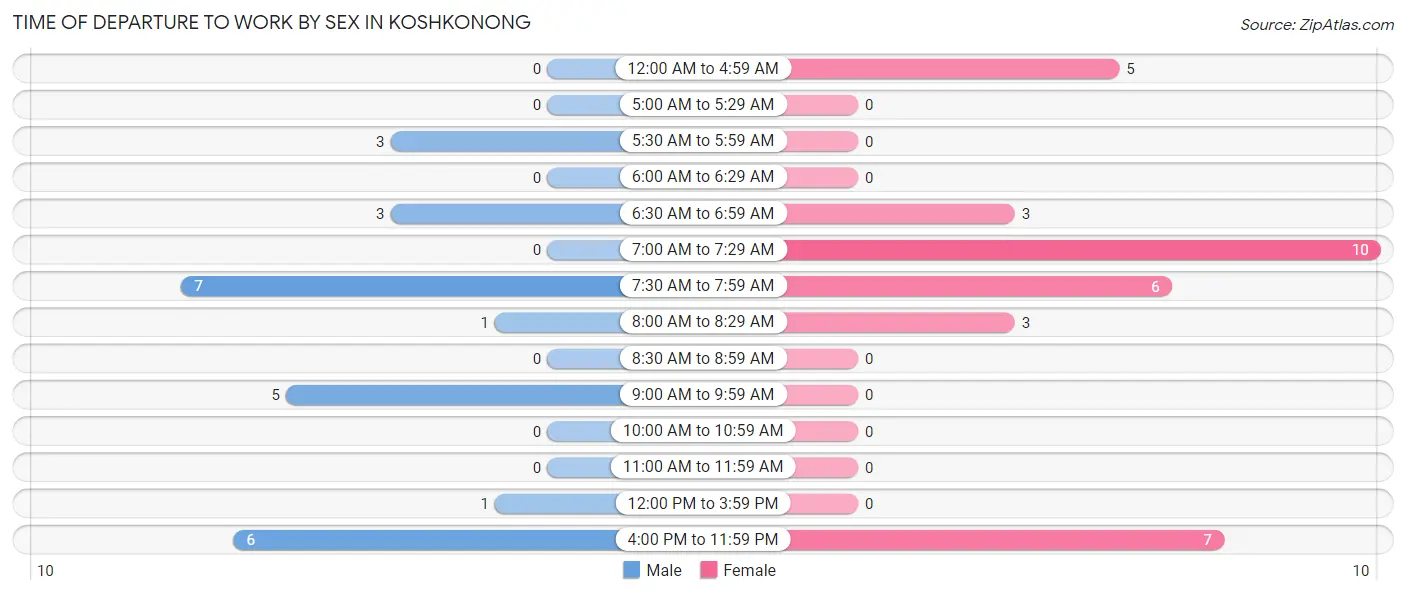
| Time of Departure | Male | Female |
| 12:00 AM to 4:59 AM | 0 (0.0%) | 5 (14.7%) |
| 5:00 AM to 5:29 AM | 0 (0.0%) | 0 (0.0%) |
| 5:30 AM to 5:59 AM | 3 (11.5%) | 0 (0.0%) |
| 6:00 AM to 6:29 AM | 0 (0.0%) | 0 (0.0%) |
| 6:30 AM to 6:59 AM | 3 (11.5%) | 3 (8.8%) |
| 7:00 AM to 7:29 AM | 0 (0.0%) | 10 (29.4%) |
| 7:30 AM to 7:59 AM | 7 (26.9%) | 6 (17.6%) |
| 8:00 AM to 8:29 AM | 1 (3.8%) | 3 (8.8%) |
| 8:30 AM to 8:59 AM | 0 (0.0%) | 0 (0.0%) |
| 9:00 AM to 9:59 AM | 5 (19.2%) | 0 (0.0%) |
| 10:00 AM to 10:59 AM | 0 (0.0%) | 0 (0.0%) |
| 11:00 AM to 11:59 AM | 0 (0.0%) | 0 (0.0%) |
| 12:00 PM to 3:59 PM | 1 (3.8%) | 0 (0.0%) |
| 4:00 PM to 11:59 PM | 6 (23.1%) | 7 (20.6%) |
| Total | 26 (100.0%) | 34 (100.0%) |
Housing Occupancy in Koshkonong
Occupancy by Ownership in Koshkonong
Of the total 52 dwellings in Koshkonong, owner-occupied units account for 36 (69.2%), while renter-occupied units make up 16 (30.8%).
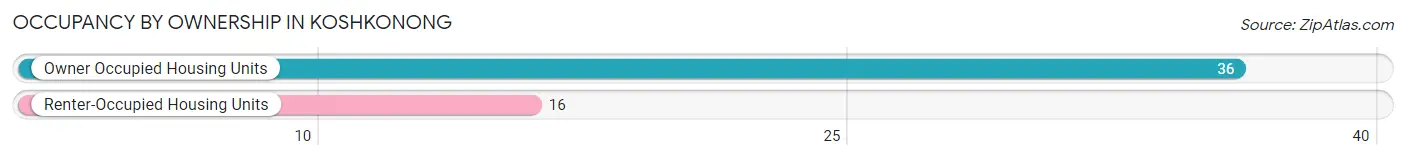
| Occupancy | # Housing Units | % Housing Units |
| Owner Occupied Housing Units | 36 | 69.2% |
| Renter-Occupied Housing Units | 16 | 30.8% |
| Total Occupied Housing Units | 52 | 100.0% |
Occupancy by Household Size in Koshkonong
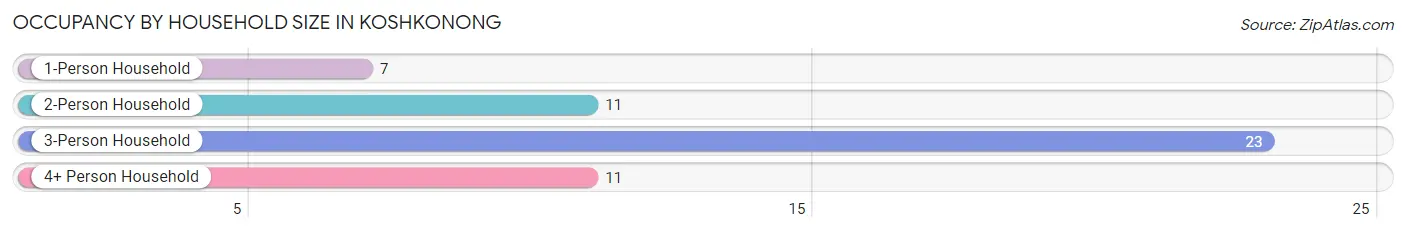
| Household Size | # Housing Units | % Housing Units |
| 1-Person Household | 7 | 13.5% |
| 2-Person Household | 11 | 21.1% |
| 3-Person Household | 23 | 44.2% |
| 4+ Person Household | 11 | 21.1% |
| Total Housing Units | 52 | 100.0% |
Occupancy by Ownership by Household Size in Koshkonong
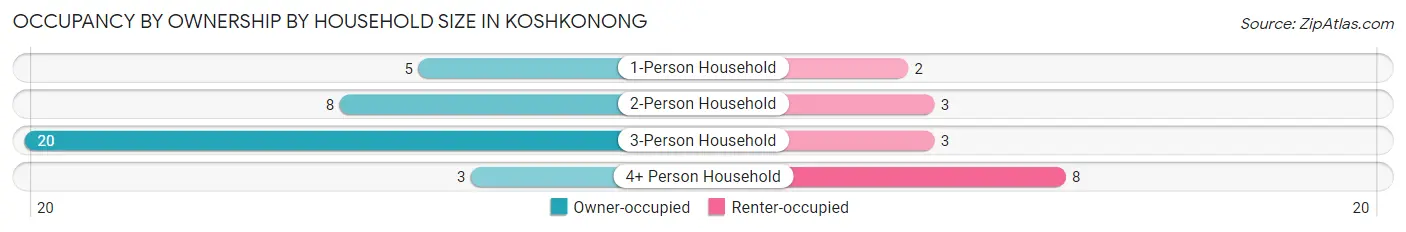
| Household Size | Owner-occupied | Renter-occupied |
| 1-Person Household | 5 (71.4%) | 2 (28.6%) |
| 2-Person Household | 8 (72.7%) | 3 (27.3%) |
| 3-Person Household | 20 (87.0%) | 3 (13.0%) |
| 4+ Person Household | 3 (27.3%) | 8 (72.7%) |
| Total Housing Units | 36 (69.2%) | 16 (30.8%) |
Occupancy by Educational Attainment in Koshkonong
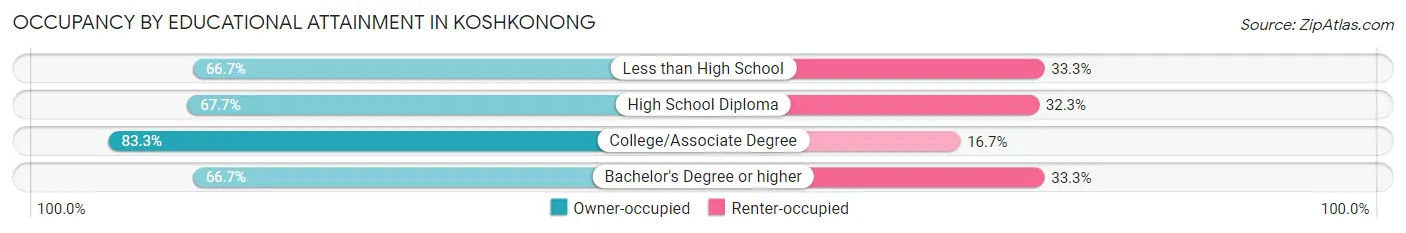
| Household Size | Owner-occupied | Renter-occupied |
| Less than High School | 8 (66.7%) | 4 (33.3%) |
| High School Diploma | 21 (67.7%) | 10 (32.3%) |
| College/Associate Degree | 5 (83.3%) | 1 (16.7%) |
| Bachelor's Degree or higher | 2 (66.7%) | 1 (33.3%) |
Occupancy by Age of Householder in Koshkonong
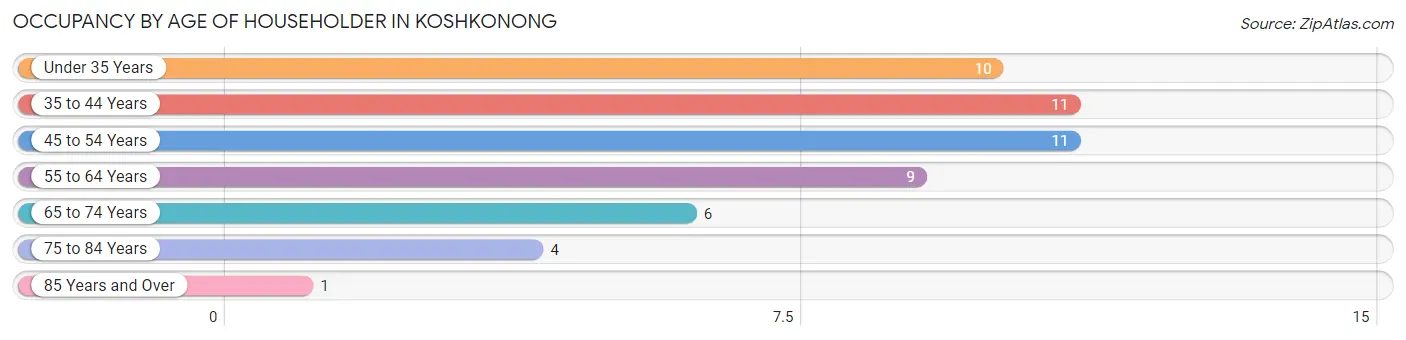
| Age Bracket | # Households | % Households |
| Under 35 Years | 10 | 19.2% |
| 35 to 44 Years | 11 | 21.1% |
| 45 to 54 Years | 11 | 21.1% |
| 55 to 64 Years | 9 | 17.3% |
| 65 to 74 Years | 6 | 11.5% |
| 75 to 84 Years | 4 | 7.7% |
| 85 Years and Over | 1 | 1.9% |
| Total | 52 | 100.0% |
Housing Finances in Koshkonong
Median Income by Occupancy in Koshkonong
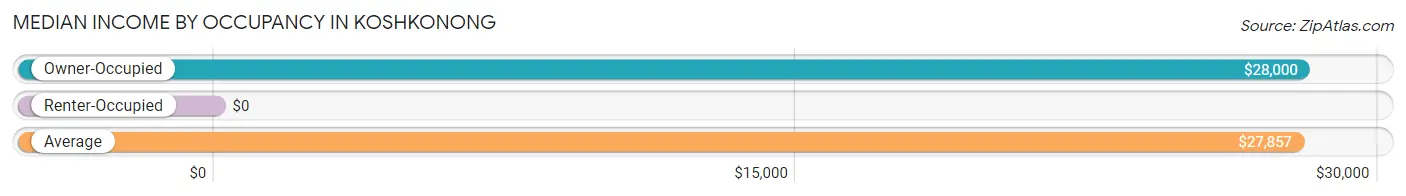
| Occupancy Type | # Households | Median Income |
| Owner-Occupied | 36 (69.2%) | $28,000 |
| Renter-Occupied | 16 (30.8%) | $0 |
| Average | 52 (100.0%) | $27,857 |
Occupancy by Householder Income Bracket in Koshkonong
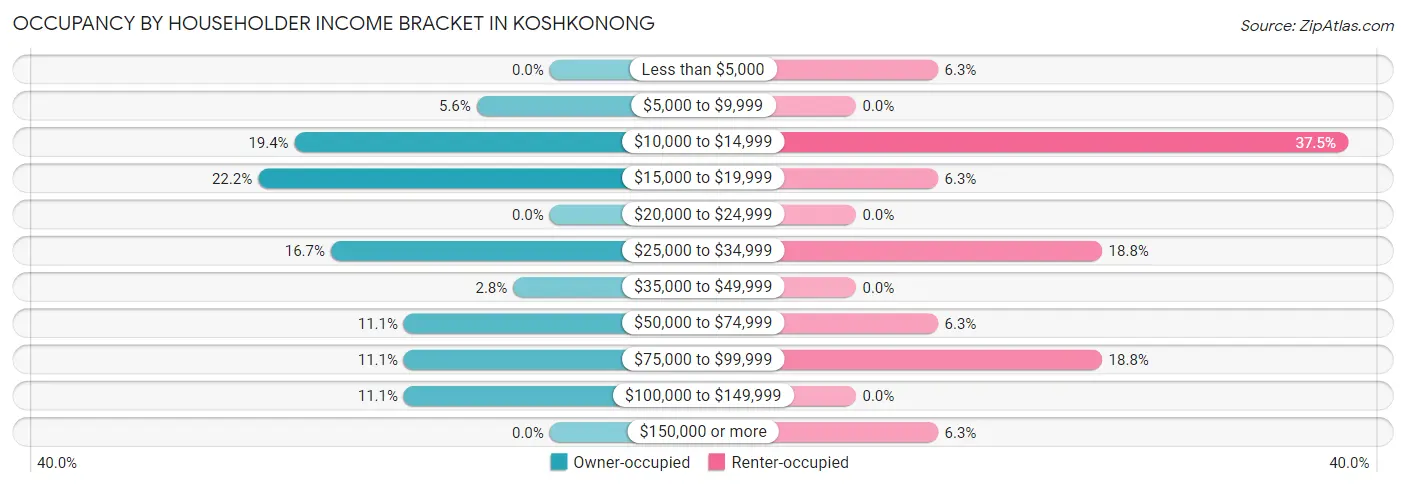
| Income Bracket | Owner-occupied | Renter-occupied |
| Less than $5,000 | 0 (0.0%) | 1 (6.2%) |
| $5,000 to $9,999 | 2 (5.6%) | 0 (0.0%) |
| $10,000 to $14,999 | 7 (19.4%) | 6 (37.5%) |
| $15,000 to $19,999 | 8 (22.2%) | 1 (6.2%) |
| $20,000 to $24,999 | 0 (0.0%) | 0 (0.0%) |
| $25,000 to $34,999 | 6 (16.7%) | 3 (18.8%) |
| $35,000 to $49,999 | 1 (2.8%) | 0 (0.0%) |
| $50,000 to $74,999 | 4 (11.1%) | 1 (6.2%) |
| $75,000 to $99,999 | 4 (11.1%) | 3 (18.8%) |
| $100,000 to $149,999 | 4 (11.1%) | 0 (0.0%) |
| $150,000 or more | 0 (0.0%) | 1 (6.2%) |
| Total | 36 (100.0%) | 16 (100.0%) |
Monthly Housing Cost Tiers in Koshkonong
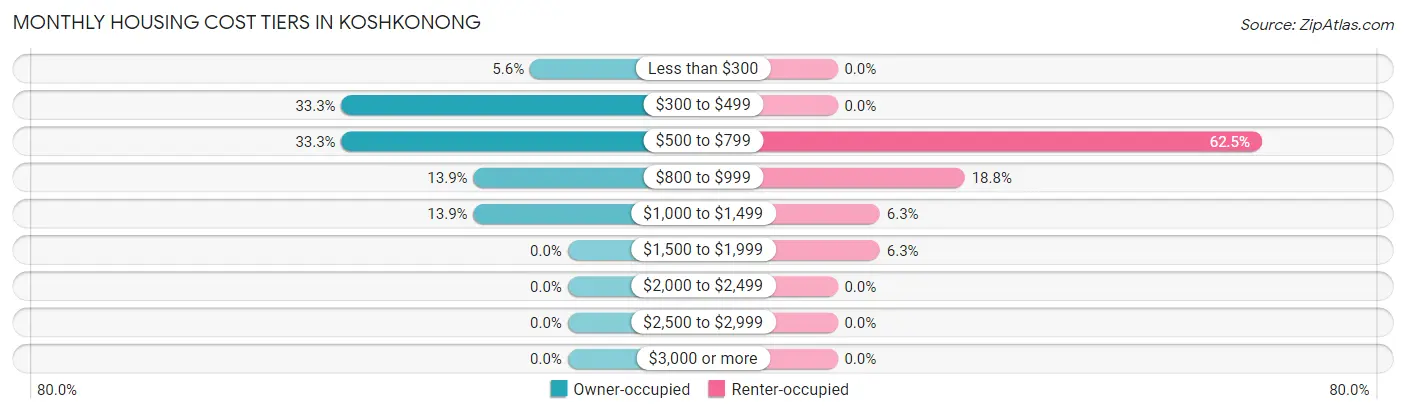
| Monthly Cost | Owner-occupied | Renter-occupied |
| Less than $300 | 2 (5.6%) | 0 (0.0%) |
| $300 to $499 | 12 (33.3%) | 0 (0.0%) |
| $500 to $799 | 12 (33.3%) | 10 (62.5%) |
| $800 to $999 | 5 (13.9%) | 3 (18.8%) |
| $1,000 to $1,499 | 5 (13.9%) | 1 (6.2%) |
| $1,500 to $1,999 | 0 (0.0%) | 1 (6.2%) |
| $2,000 to $2,499 | 0 (0.0%) | 0 (0.0%) |
| $2,500 to $2,999 | 0 (0.0%) | 0 (0.0%) |
| $3,000 or more | 0 (0.0%) | 0 (0.0%) |
| Total | 36 (100.0%) | 16 (100.0%) |
Physical Housing Characteristics in Koshkonong
Housing Structures in Koshkonong
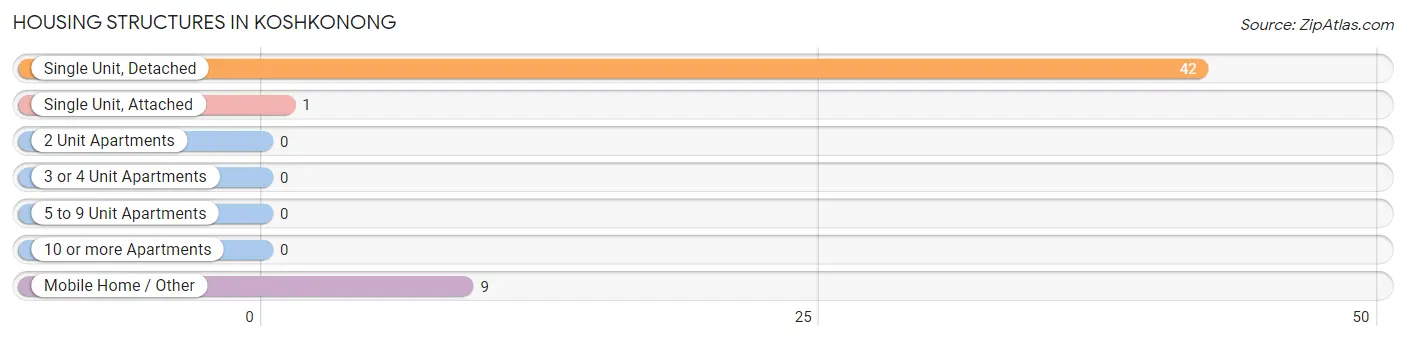
| Structure Type | # Housing Units | % Housing Units |
| Single Unit, Detached | 42 | 80.8% |
| Single Unit, Attached | 1 | 1.9% |
| 2 Unit Apartments | 0 | 0.0% |
| 3 or 4 Unit Apartments | 0 | 0.0% |
| 5 to 9 Unit Apartments | 0 | 0.0% |
| 10 or more Apartments | 0 | 0.0% |
| Mobile Home / Other | 9 | 17.3% |
| Total | 52 | 100.0% |
Housing Structures by Occupancy in Koshkonong
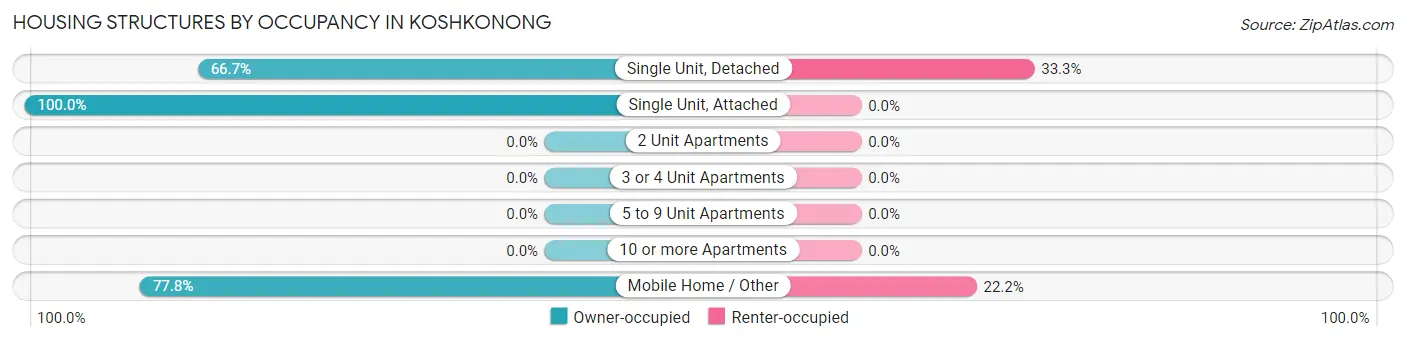
| Structure Type | Owner-occupied | Renter-occupied |
| Single Unit, Detached | 28 (66.7%) | 14 (33.3%) |
| Single Unit, Attached | 1 (100.0%) | 0 (0.0%) |
| 2 Unit Apartments | 0 (0.0%) | 0 (0.0%) |
| 3 or 4 Unit Apartments | 0 (0.0%) | 0 (0.0%) |
| 5 to 9 Unit Apartments | 0 (0.0%) | 0 (0.0%) |
| 10 or more Apartments | 0 (0.0%) | 0 (0.0%) |
| Mobile Home / Other | 7 (77.8%) | 2 (22.2%) |
| Total | 36 (69.2%) | 16 (30.8%) |
Housing Structures by Number of Rooms in Koshkonong
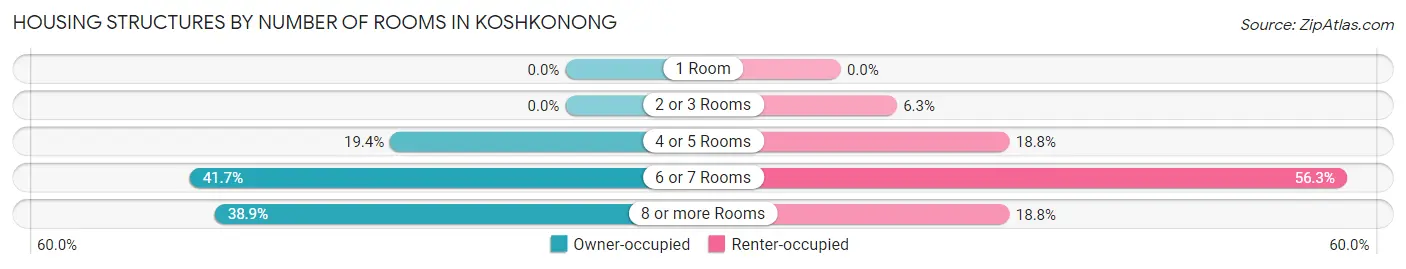
| Number of Rooms | Owner-occupied | Renter-occupied |
| 1 Room | 0 (0.0%) | 0 (0.0%) |
| 2 or 3 Rooms | 0 (0.0%) | 1 (6.2%) |
| 4 or 5 Rooms | 7 (19.4%) | 3 (18.8%) |
| 6 or 7 Rooms | 15 (41.7%) | 9 (56.2%) |
| 8 or more Rooms | 14 (38.9%) | 3 (18.8%) |
| Total | 36 (100.0%) | 16 (100.0%) |
Housing Structure by Heating Type in Koshkonong
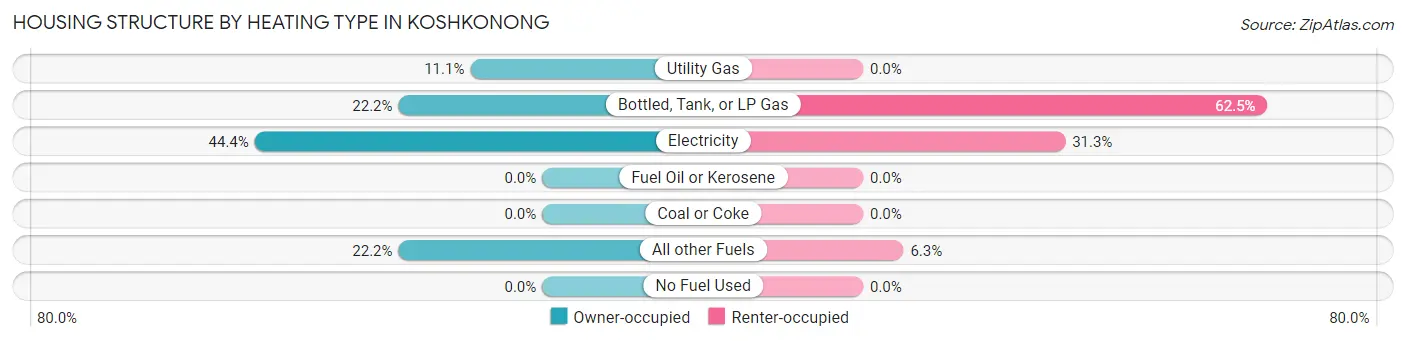
| Heating Type | Owner-occupied | Renter-occupied |
| Utility Gas | 4 (11.1%) | 0 (0.0%) |
| Bottled, Tank, or LP Gas | 8 (22.2%) | 10 (62.5%) |
| Electricity | 16 (44.4%) | 5 (31.2%) |
| Fuel Oil or Kerosene | 0 (0.0%) | 0 (0.0%) |
| Coal or Coke | 0 (0.0%) | 0 (0.0%) |
| All other Fuels | 8 (22.2%) | 1 (6.2%) |
| No Fuel Used | 0 (0.0%) | 0 (0.0%) |
| Total | 36 (100.0%) | 16 (100.0%) |
Household Vehicle Usage in Koshkonong
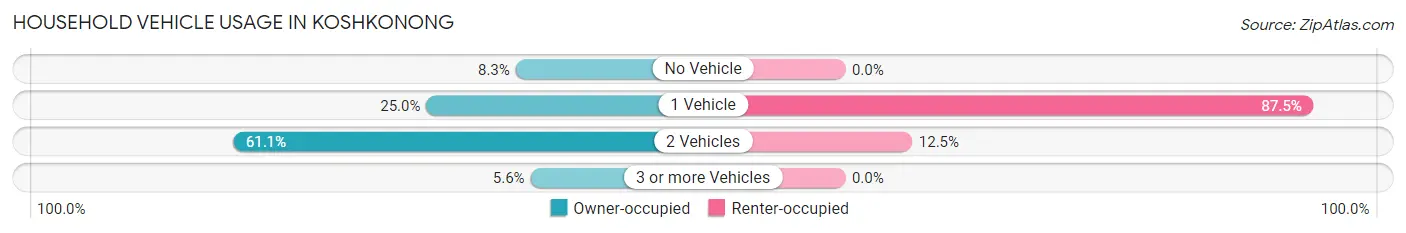
| Vehicles per Household | Owner-occupied | Renter-occupied |
| No Vehicle | 3 (8.3%) | 0 (0.0%) |
| 1 Vehicle | 9 (25.0%) | 14 (87.5%) |
| 2 Vehicles | 22 (61.1%) | 2 (12.5%) |
| 3 or more Vehicles | 2 (5.6%) | 0 (0.0%) |
| Total | 36 (100.0%) | 16 (100.0%) |
Real Estate & Mortgages in Koshkonong
Real Estate and Mortgage Overview in Koshkonong
| Characteristic | Without Mortgage | With Mortgage |
| Housing Units | 16 | 20 |
| Median Property Value | - | - |
| Median Household Income | - | - |
| Monthly Housing Costs | $380 | $0 |
| Real Estate Taxes | $283 | $0 |
Property Value by Mortgage Status in Koshkonong
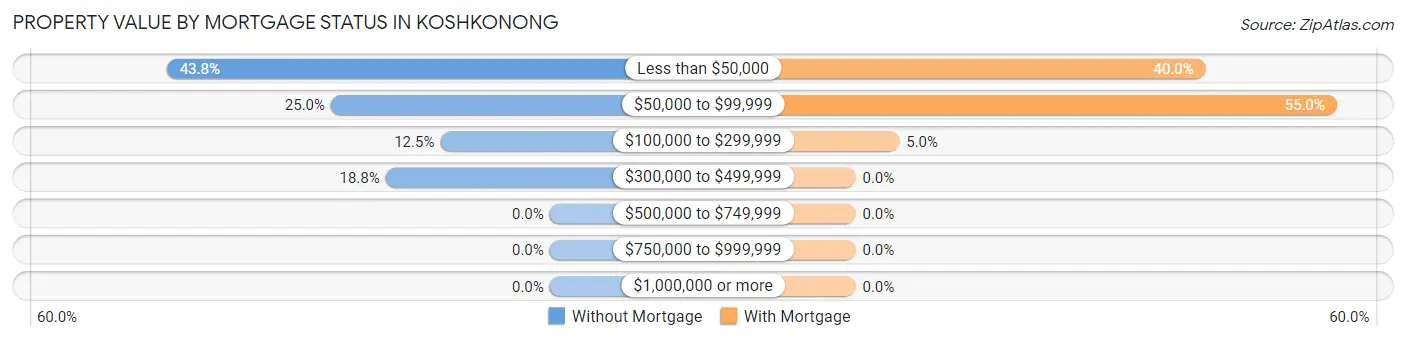
| Property Value | Without Mortgage | With Mortgage |
| Less than $50,000 | 7 (43.8%) | 8 (40.0%) |
| $50,000 to $99,999 | 4 (25.0%) | 11 (55.0%) |
| $100,000 to $299,999 | 2 (12.5%) | 1 (5.0%) |
| $300,000 to $499,999 | 3 (18.8%) | 0 (0.0%) |
| $500,000 to $749,999 | 0 (0.0%) | 0 (0.0%) |
| $750,000 to $999,999 | 0 (0.0%) | 0 (0.0%) |
| $1,000,000 or more | 0 (0.0%) | 0 (0.0%) |
| Total | 16 (100.0%) | 20 (100.0%) |
Household Income by Mortgage Status in Koshkonong
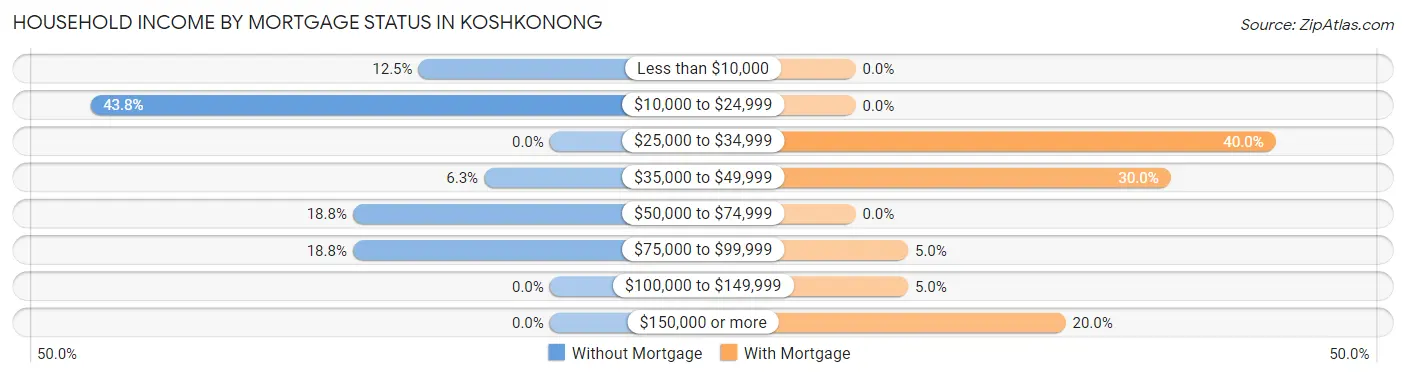
| Household Income | Without Mortgage | With Mortgage |
| Less than $10,000 | 2 (12.5%) | 0 (0.0%) |
| $10,000 to $24,999 | 7 (43.8%) | 0 (0.0%) |
| $25,000 to $34,999 | 0 (0.0%) | 8 (40.0%) |
| $35,000 to $49,999 | 1 (6.2%) | 6 (30.0%) |
| $50,000 to $74,999 | 3 (18.8%) | 0 (0.0%) |
| $75,000 to $99,999 | 3 (18.8%) | 1 (5.0%) |
| $100,000 to $149,999 | 0 (0.0%) | 1 (5.0%) |
| $150,000 or more | 0 (0.0%) | 4 (20.0%) |
| Total | 16 (100.0%) | 20 (100.0%) |
Property Value to Household Income Ratio in Koshkonong
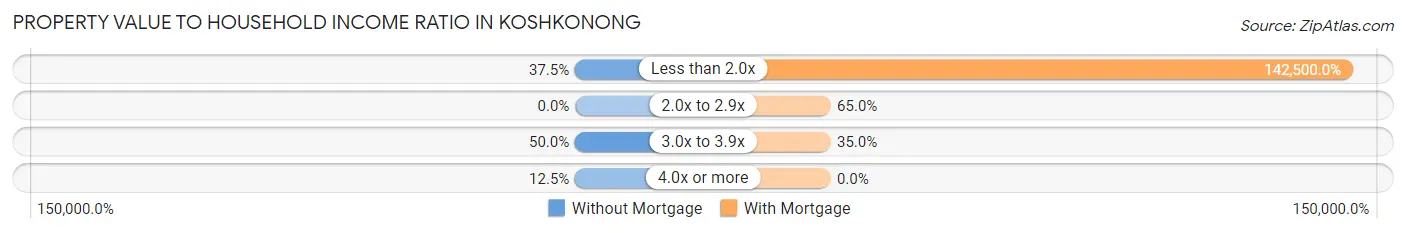
| Value-to-Income Ratio | Without Mortgage | With Mortgage |
| Less than 2.0x | 6 (37.5%) | 28,500 (142,500.0%) |
| 2.0x to 2.9x | 0 (0.0%) | 13 (65.0%) |
| 3.0x to 3.9x | 8 (50.0%) | 7 (35.0%) |
| 4.0x or more | 2 (12.5%) | 0 (0.0%) |
| Total | 16 (100.0%) | 20 (100.0%) |
Real Estate Taxes by Mortgage Status in Koshkonong
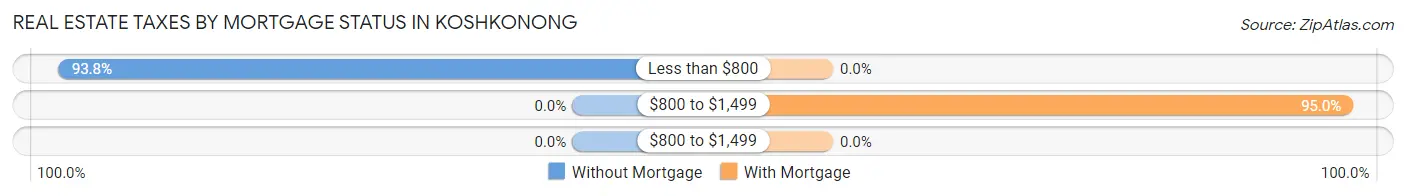
| Property Taxes | Without Mortgage | With Mortgage |
| Less than $800 | 15 (93.8%) | 0 (0.0%) |
| $800 to $1,499 | 0 (0.0%) | 19 (95.0%) |
| $800 to $1,499 | 0 (0.0%) | 0 (0.0%) |
| Total | 16 (100.0%) | 20 (100.0%) |
Health & Disability in Koshkonong
Health Insurance Coverage by Age in Koshkonong
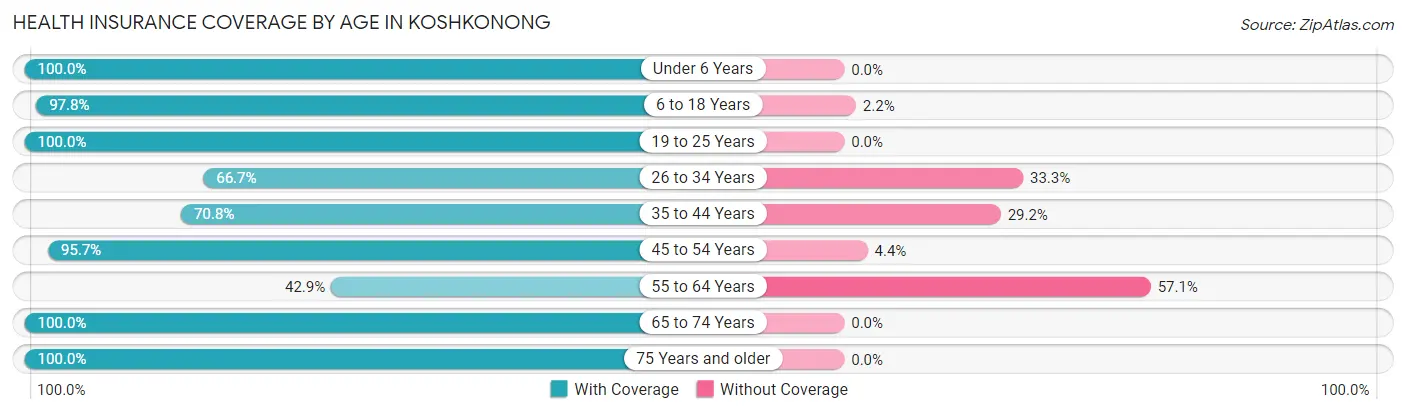
| Age Bracket | With Coverage | Without Coverage |
| Under 6 Years | 23 (100.0%) | 0 (0.0%) |
| 6 to 18 Years | 45 (97.8%) | 1 (2.2%) |
| 19 to 25 Years | 9 (100.0%) | 0 (0.0%) |
| 26 to 34 Years | 14 (66.7%) | 7 (33.3%) |
| 35 to 44 Years | 17 (70.8%) | 7 (29.2%) |
| 45 to 54 Years | 22 (95.7%) | 1 (4.3%) |
| 55 to 64 Years | 6 (42.9%) | 8 (57.1%) |
| 65 to 74 Years | 9 (100.0%) | 0 (0.0%) |
| 75 Years and older | 5 (100.0%) | 0 (0.0%) |
| Total | 150 (86.2%) | 24 (13.8%) |
Health Insurance Coverage by Citizenship Status in Koshkonong
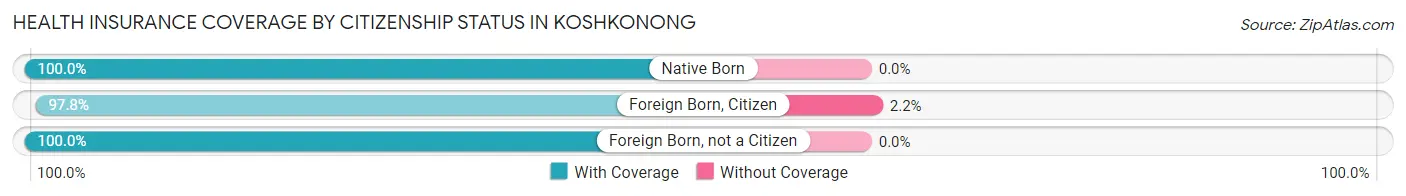
| Citizenship Status | With Coverage | Without Coverage |
| Native Born | 23 (100.0%) | 0 (0.0%) |
| Foreign Born, Citizen | 45 (97.8%) | 1 (2.2%) |
| Foreign Born, not a Citizen | 9 (100.0%) | 0 (0.0%) |
Health Insurance Coverage by Household Income in Koshkonong
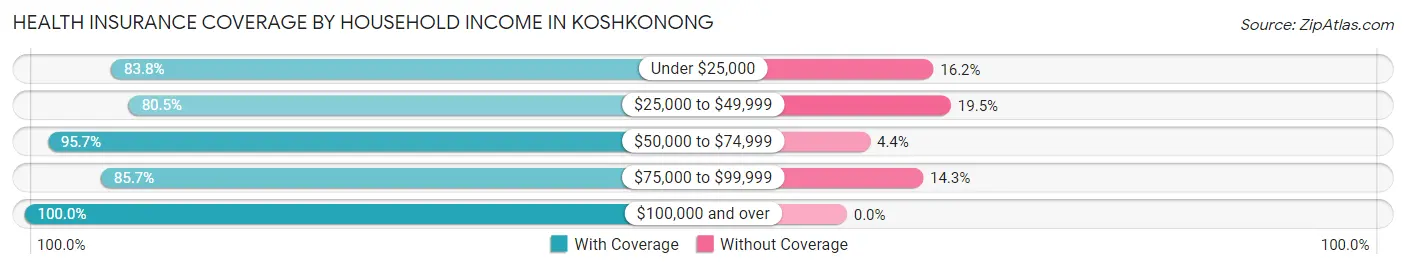
| Household Income | With Coverage | Without Coverage |
| Under $25,000 | 62 (83.8%) | 12 (16.2%) |
| $25,000 to $49,999 | 33 (80.5%) | 8 (19.5%) |
| $50,000 to $74,999 | 22 (95.7%) | 1 (4.3%) |
| $75,000 to $99,999 | 18 (85.7%) | 3 (14.3%) |
| $100,000 and over | 15 (100.0%) | 0 (0.0%) |
Public vs Private Health Insurance Coverage by Age in Koshkonong
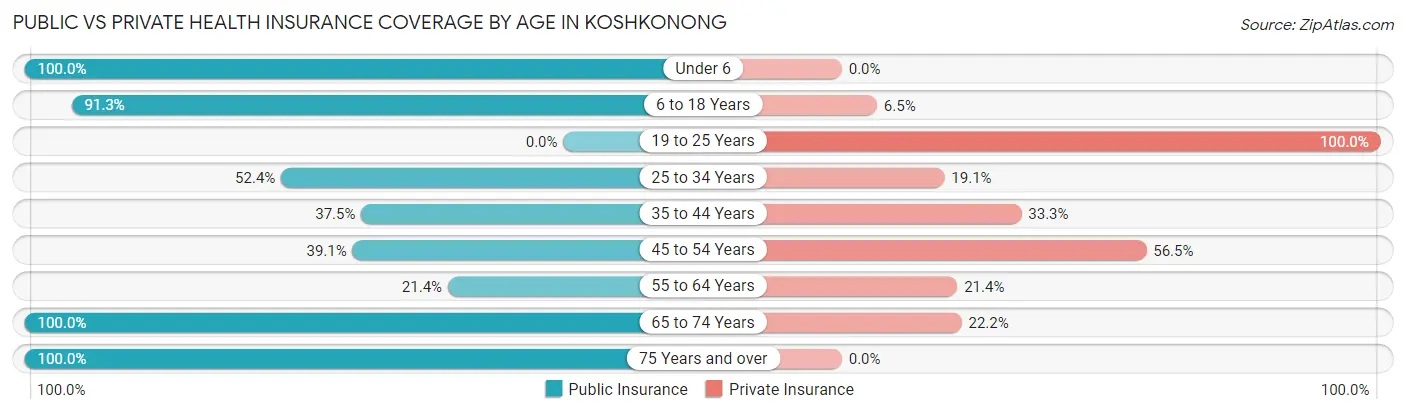
| Age Bracket | Public Insurance | Private Insurance |
| Under 6 | 23 (100.0%) | 0 (0.0%) |
| 6 to 18 Years | 42 (91.3%) | 3 (6.5%) |
| 19 to 25 Years | 0 (0.0%) | 9 (100.0%) |
| 25 to 34 Years | 11 (52.4%) | 4 (19.1%) |
| 35 to 44 Years | 9 (37.5%) | 8 (33.3%) |
| 45 to 54 Years | 9 (39.1%) | 13 (56.5%) |
| 55 to 64 Years | 3 (21.4%) | 3 (21.4%) |
| 65 to 74 Years | 9 (100.0%) | 2 (22.2%) |
| 75 Years and over | 5 (100.0%) | 0 (0.0%) |
| Total | 111 (63.8%) | 42 (24.1%) |
Disability Status by Sex by Age in Koshkonong
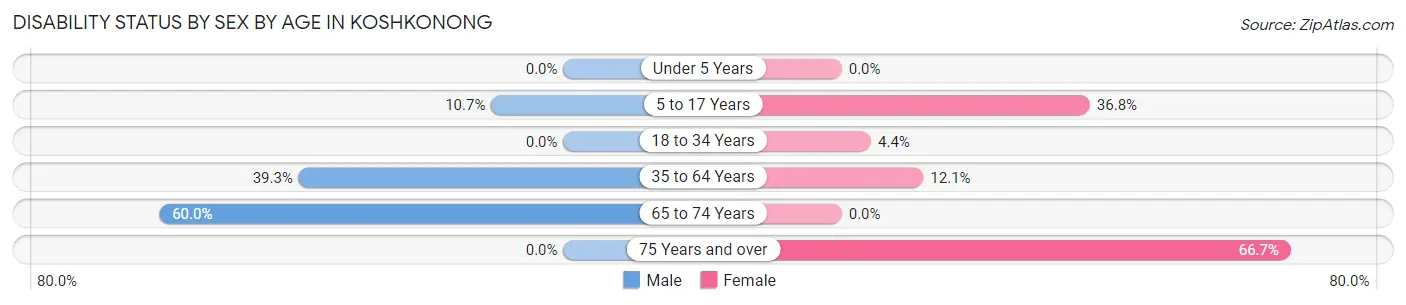
| Age Bracket | Male | Female |
| Under 5 Years | 0 (0.0%) | 0 (0.0%) |
| 5 to 17 Years | 3 (10.7%) | 7 (36.8%) |
| 18 to 34 Years | 0 (0.0%) | 1 (4.3%) |
| 35 to 64 Years | 11 (39.3%) | 4 (12.1%) |
| 65 to 74 Years | 3 (60.0%) | 0 (0.0%) |
| 75 Years and over | 0 (0.0%) | 2 (66.7%) |
Disability Class by Sex by Age in Koshkonong
Disability Class: Hearing Difficulty
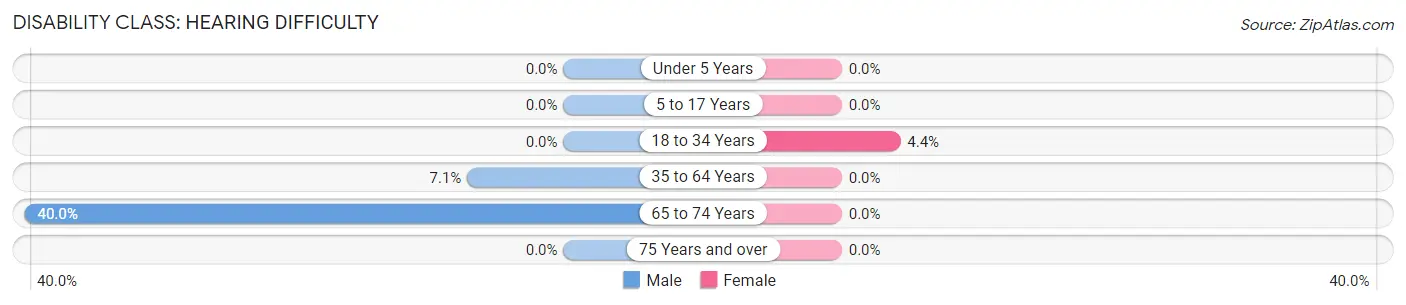
| Age Bracket | Male | Female |
| Under 5 Years | 0 (0.0%) | 0 (0.0%) |
| 5 to 17 Years | 0 (0.0%) | 0 (0.0%) |
| 18 to 34 Years | 0 (0.0%) | 1 (4.3%) |
| 35 to 64 Years | 2 (7.1%) | 0 (0.0%) |
| 65 to 74 Years | 2 (40.0%) | 0 (0.0%) |
| 75 Years and over | 0 (0.0%) | 0 (0.0%) |
Disability Class: Vision Difficulty
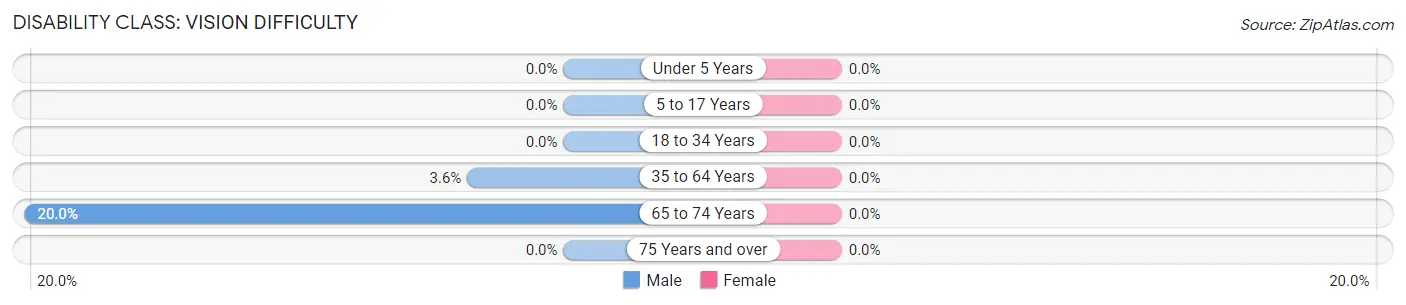
| Age Bracket | Male | Female |
| Under 5 Years | 0 (0.0%) | 0 (0.0%) |
| 5 to 17 Years | 0 (0.0%) | 0 (0.0%) |
| 18 to 34 Years | 0 (0.0%) | 0 (0.0%) |
| 35 to 64 Years | 1 (3.6%) | 0 (0.0%) |
| 65 to 74 Years | 1 (20.0%) | 0 (0.0%) |
| 75 Years and over | 0 (0.0%) | 0 (0.0%) |
Disability Class: Cognitive Difficulty
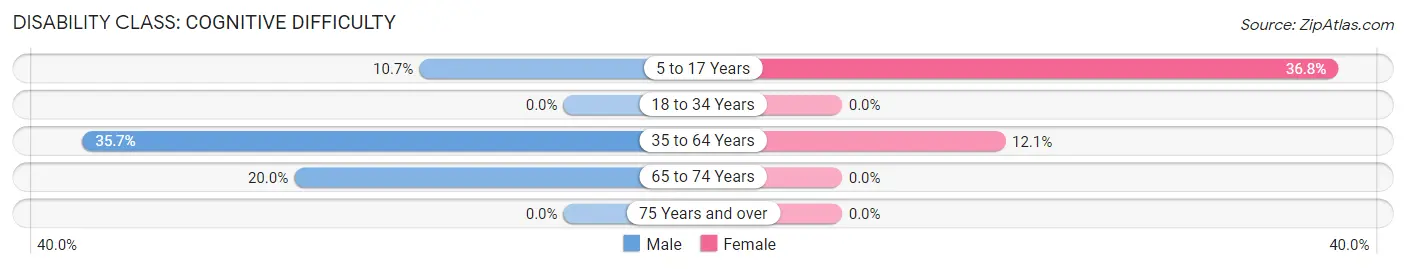
| Age Bracket | Male | Female |
| 5 to 17 Years | 3 (10.7%) | 7 (36.8%) |
| 18 to 34 Years | 0 (0.0%) | 0 (0.0%) |
| 35 to 64 Years | 10 (35.7%) | 4 (12.1%) |
| 65 to 74 Years | 1 (20.0%) | 0 (0.0%) |
| 75 Years and over | 0 (0.0%) | 0 (0.0%) |
Disability Class: Ambulatory Difficulty
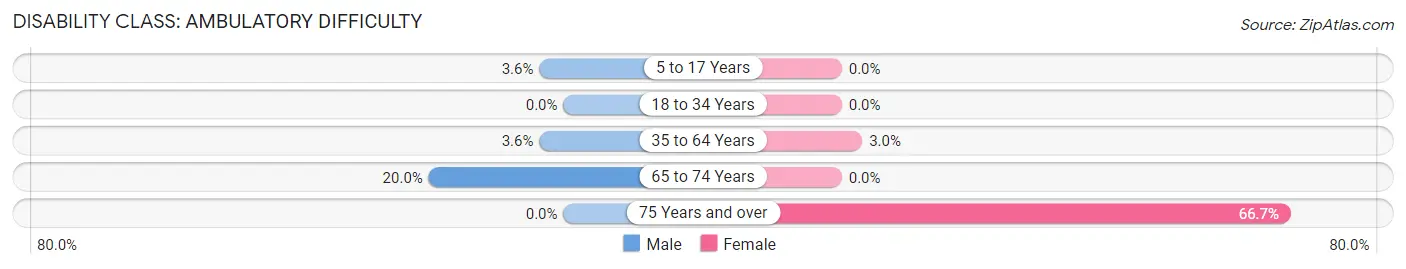
| Age Bracket | Male | Female |
| 5 to 17 Years | 1 (3.6%) | 0 (0.0%) |
| 18 to 34 Years | 0 (0.0%) | 0 (0.0%) |
| 35 to 64 Years | 1 (3.6%) | 1 (3.0%) |
| 65 to 74 Years | 1 (20.0%) | 0 (0.0%) |
| 75 Years and over | 0 (0.0%) | 2 (66.7%) |
Disability Class: Self-Care Difficulty
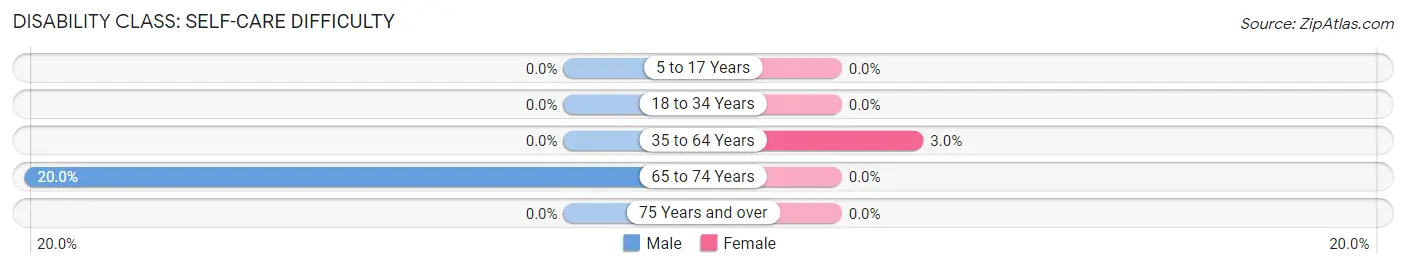
| Age Bracket | Male | Female |
| 5 to 17 Years | 0 (0.0%) | 0 (0.0%) |
| 18 to 34 Years | 0 (0.0%) | 0 (0.0%) |
| 35 to 64 Years | 0 (0.0%) | 1 (3.0%) |
| 65 to 74 Years | 1 (20.0%) | 0 (0.0%) |
| 75 Years and over | 0 (0.0%) | 0 (0.0%) |
Technology Access in Koshkonong
Computing Device Access in Koshkonong
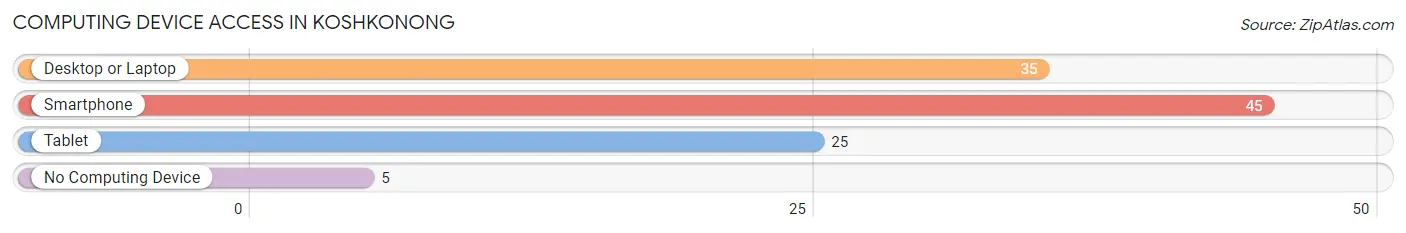
| Device Type | # Households | % Households |
| Desktop or Laptop | 35 | 67.3% |
| Smartphone | 45 | 86.5% |
| Tablet | 25 | 48.1% |
| No Computing Device | 5 | 9.6% |
| Total | 52 | 100.0% |
Internet Access in Koshkonong
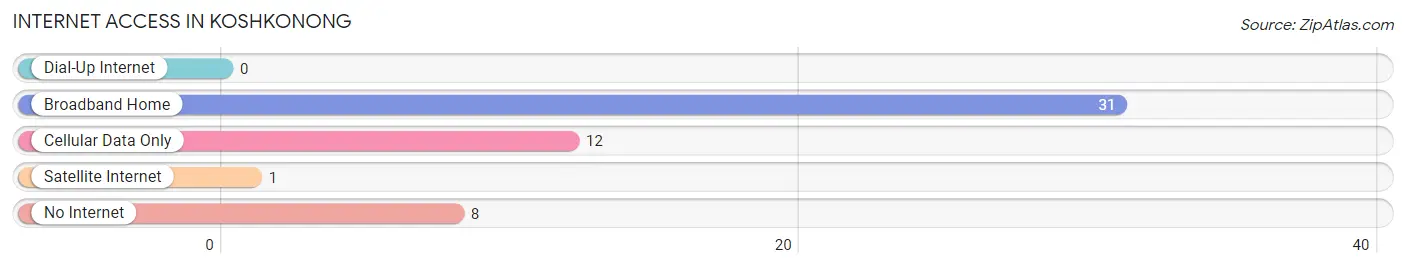
| Internet Type | # Households | % Households |
| Dial-Up Internet | 0 | 0.0% |
| Broadband Home | 31 | 59.6% |
| Cellular Data Only | 12 | 23.1% |
| Satellite Internet | 1 | 1.9% |
| No Internet | 8 | 15.4% |
| Total | 52 | 100.0% |
Koshkonong Summary
Koshkonong is a small unincorporated community located in southeastern Missouri, in the United States. It is situated in the Ozark Mountains, in the foothills of the St. Francois Mountains. The community is located in the Ozark Plateau, and is part of the Ozark National Scenic Riverways.
History
Koshkonong was first settled in the early 1800s by settlers from the Ozark region of Missouri. The community was named after the Koshkonong Creek, which runs through the area. The creek was named after the Koshkonong Indians, who were a tribe of Native Americans that lived in the area. The Koshkonong Indians were part of the Osage Nation, and were known for their hunting and fishing skills.
The first settlers in Koshkonong were mostly farmers, and the community quickly grew. By the mid-1800s, the town had a post office, a general store, a blacksmith shop, and several churches. The town also had a school, which was established in 1876.
In the late 1800s, Koshkonong became a popular tourist destination. The town was known for its natural beauty, and visitors came to enjoy the scenery and the outdoor activities. The town also had a number of resorts, which attracted visitors from all over the country.
Geography
Koshkonong is located in southeastern Missouri, in the Ozark Mountains. The town is situated in the Ozark Plateau, and is part of the Ozark National Scenic Riverways. The town is located near the Koshkonong Creek, which runs through the area. The creek is a tributary of the Black River, and is a popular spot for fishing and canoeing.
The town is located in the foothills of the St. Francois Mountains, and is surrounded by rolling hills and forests. The area is known for its natural beauty, and is a popular destination for outdoor activities such as hiking, camping, and fishing.
Economy
Koshkonong is a small, rural community, and the economy is largely based on agriculture. The town is home to several farms, which produce a variety of crops, including corn, soybeans, and wheat. The town also has a number of small businesses, including a general store, a post office, and a few restaurants.
The town is also home to a number of tourist attractions, including the Koshkonong Creek, which is a popular spot for fishing and canoeing. The town also has a number of resorts, which attract visitors from all over the country.
Demographics
As of the 2010 census, the population of Koshkonong was 1,093. The town has a median age of 44.7 years, and the median household income is $37,917. The town is predominantly white, with 95.3% of the population identifying as white. The town also has a small Hispanic population, with 2.2% of the population identifying as Hispanic or Latino.
Conclusion
Koshkonong is a small, rural community located in southeastern Missouri. The town was first settled in the early 1800s, and has a long history of farming and tourism. The town is situated in the Ozark Plateau, and is part of the Ozark National Scenic Riverways. The town is home to a number of farms, businesses, and tourist attractions, and has a population of 1,093. The town is predominantly white, with a small Hispanic population.
Common Questions
What is Per Capita Income in Koshkonong?
Per Capita income in Koshkonong is $21,029.
What is the Median Family Income in Koshkonong?
Median Family Income in Koshkonong is $29,375.
What is the Median Household income in Koshkonong?
Median Household Income in Koshkonong is $27,857.
What is Inequality or Gini Index in Koshkonong?
Inequality or Gini Index in Koshkonong is 0.64.
What is the Total Population of Koshkonong?
Total Population of Koshkonong is 174.
What is the Total Male Population of Koshkonong?
Total Male Population of Koshkonong is 83.
What is the Total Female Population of Koshkonong?
Total Female Population of Koshkonong is 91.
What is the Ratio of Males per 100 Females in Koshkonong?
There are 91.21 Males per 100 Females in Koshkonong.
What is the Ratio of Females per 100 Males in Koshkonong?
There are 109.64 Females per 100 Males in Koshkonong.
What is the Median Population Age in Koshkonong?
Median Population Age in Koshkonong is 29.9 Years.
What is the Average Family Size in Koshkonong
Average Family Size in Koshkonong is 3.7 People.
What is the Average Household Size in Koshkonong
Average Household Size in Koshkonong is 3.4 People.
How Large is the Labor Force in Koshkonong?
There are 65 People in the Labor Forcein in Koshkonong.
What is the Percentage of People in the Labor Force in Koshkonong?
57.5% of People are in the Labor Force in Koshkonong.
What is the Unemployment Rate in Koshkonong?
Unemployment Rate in Koshkonong is 7.7%.