Kingsville, MO Map & Demographics
Kingsville Map
Kingsville Overview
$25,769
PER CAPITA INCOME
$73,796
AVG FAMILY INCOME
$72,546
AVG HOUSEHOLD INCOME
39.0%
WAGE / INCOME GAP [ % ]
61.0¢/ $1
WAGE / INCOME GAP [ $ ]
0.31
INEQUALITY / GINI INDEX
377
TOTAL POPULATION
178
MALE POPULATION
199
FEMALE POPULATION
89.45
MALES / 100 FEMALES
111.80
FEMALES / 100 MALES
38.1
MEDIAN AGE
3.4
AVG FAMILY SIZE
3.1
AVG HOUSEHOLD SIZE
166
LABOR FORCE [ PEOPLE ]
63.1%
PERCENT IN LABOR FORCE
3.6%
UNEMPLOYMENT RATE
Kingsville Zip Codes
Kingsville Area Codes
Income in Kingsville
Income Overview in Kingsville
Per Capita Income in Kingsville is $25,769, while median incomes of families and households are $73,796 and $72,546 respectively.
| Characteristic | Number | Measure |
| Per Capita Income | 377 | $25,769 |
| Median Family Income | 86 | $73,796 |
| Mean Family Income | 86 | $80,700 |
| Median Household Income | 121 | $72,546 |
| Mean Household Income | 121 | $81,798 |
| Income Deficit | 86 | $0 |
| Wage / Income Gap (%) | 377 | 39.00% |
| Wage / Income Gap ($) | 377 | 61.00¢ per $1 |
| Gini / Inequality Index | 377 | 0.31 |
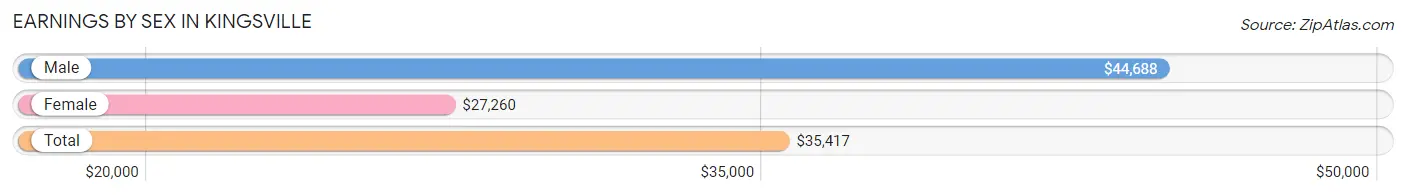
Earnings by Sex in Kingsville
Average Earnings in Kingsville are $35,417, $44,688 for men and $27,260 for women, a difference of 39.0%.
| Sex | Number | Average Earnings |
| Male | 105 (55.3%) | $44,688 |
| Female | 85 (44.7%) | $27,260 |
| Total | 190 (100.0%) | $35,417 |
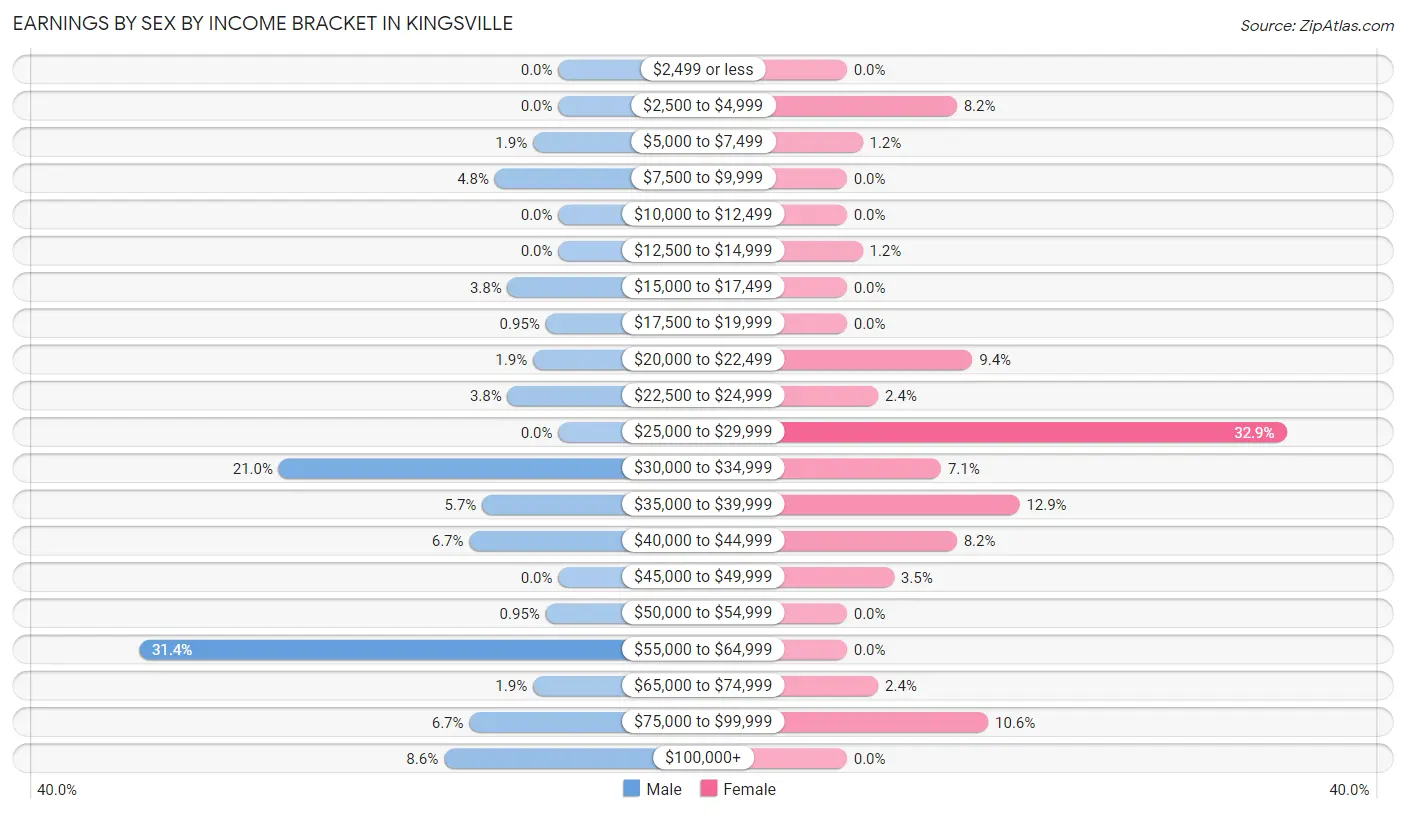
Earnings by Sex by Income Bracket in Kingsville
The most common earnings brackets in Kingsville are $55,000 to $64,999 for men (33 | 31.4%) and $25,000 to $29,999 for women (28 | 32.9%).
| Income | Male | Female |
| $2,499 or less | 0 (0.0%) | 0 (0.0%) |
| $2,500 to $4,999 | 0 (0.0%) | 7 (8.2%) |
| $5,000 to $7,499 | 2 (1.9%) | 1 (1.2%) |
| $7,500 to $9,999 | 5 (4.8%) | 0 (0.0%) |
| $10,000 to $12,499 | 0 (0.0%) | 0 (0.0%) |
| $12,500 to $14,999 | 0 (0.0%) | 1 (1.2%) |
| $15,000 to $17,499 | 4 (3.8%) | 0 (0.0%) |
| $17,500 to $19,999 | 1 (0.9%) | 0 (0.0%) |
| $20,000 to $22,499 | 2 (1.9%) | 8 (9.4%) |
| $22,500 to $24,999 | 4 (3.8%) | 2 (2.4%) |
| $25,000 to $29,999 | 0 (0.0%) | 28 (32.9%) |
| $30,000 to $34,999 | 22 (20.9%) | 6 (7.1%) |
| $35,000 to $39,999 | 6 (5.7%) | 11 (12.9%) |
| $40,000 to $44,999 | 7 (6.7%) | 7 (8.2%) |
| $45,000 to $49,999 | 0 (0.0%) | 3 (3.5%) |
| $50,000 to $54,999 | 1 (0.9%) | 0 (0.0%) |
| $55,000 to $64,999 | 33 (31.4%) | 0 (0.0%) |
| $65,000 to $74,999 | 2 (1.9%) | 2 (2.4%) |
| $75,000 to $99,999 | 7 (6.7%) | 9 (10.6%) |
| $100,000+ | 9 (8.6%) | 0 (0.0%) |
| Total | 105 (100.0%) | 85 (100.0%) |
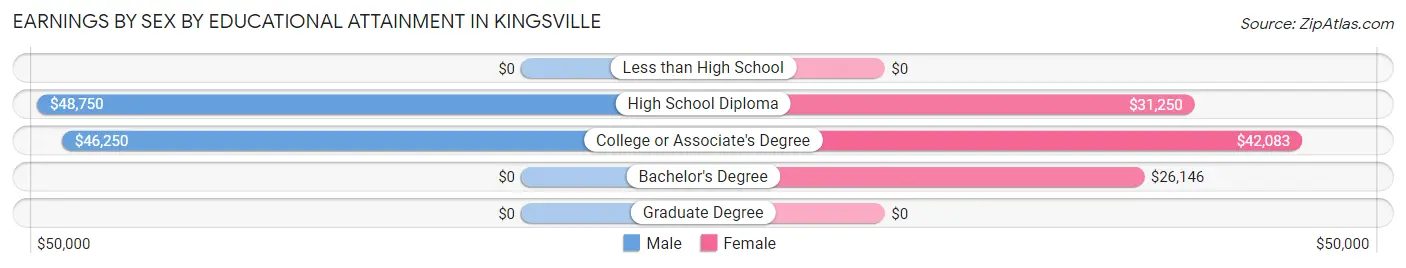
Earnings by Sex by Educational Attainment in Kingsville
Average earnings in Kingsville are $44,688 for men and $28,125 for women, a difference of 37.1%. Men with an educational attainment of high school diploma enjoy the highest average annual earnings of $48,750, while those with college or associate's degree education earn the least with $46,250. Women with an educational attainment of college or associate's degree earn the most with the average annual earnings of $42,083, while those with bachelor's degree education have the smallest earnings of $26,146.
| Educational Attainment | Male Income | Female Income |
| Less than High School | - | - |
| High School Diploma | $48,750 | $31,250 |
| College or Associate's Degree | $46,250 | $42,083 |
| Bachelor's Degree | - | - |
| Graduate Degree | - | - |
| Total | $44,688 | $28,125 |
Family Income in Kingsville
Family Income Brackets in Kingsville
According to the Kingsville family income data, there are 44 families falling into the $50,000 to $74,999 income range, which is the most common income bracket and makes up 51.2% of all families.
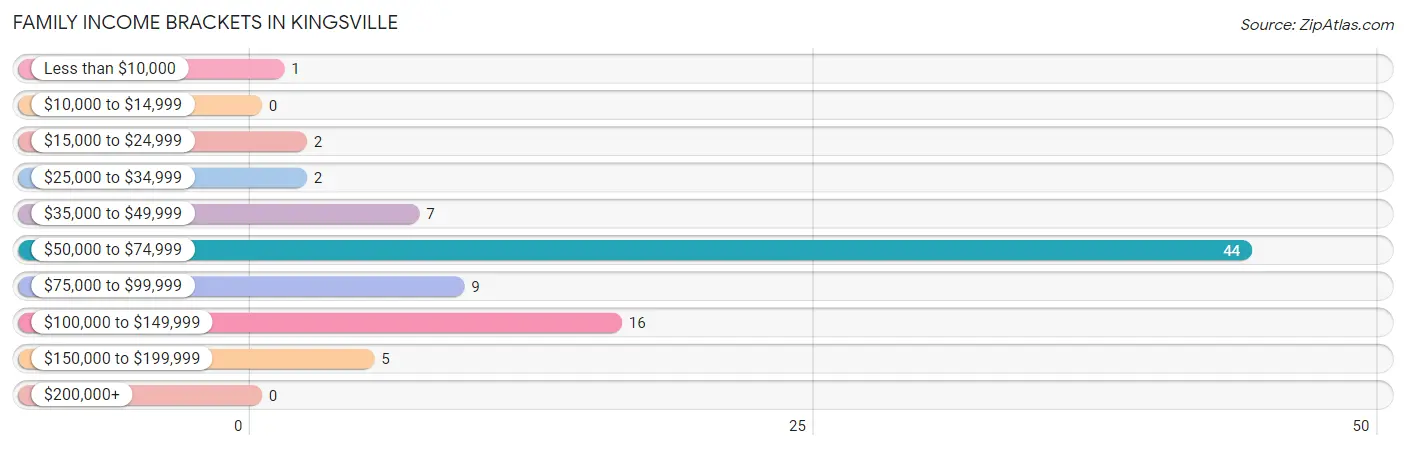
| Income Bracket | # Families | % Families |
| Less than $10,000 | 1 | 1.2% |
| $10,000 to $14,999 | 0 | 0.0% |
| $15,000 to $24,999 | 2 | 2.3% |
| $25,000 to $34,999 | 2 | 2.3% |
| $35,000 to $49,999 | 7 | 8.1% |
| $50,000 to $74,999 | 44 | 51.2% |
| $75,000 to $99,999 | 9 | 10.5% |
| $100,000 to $149,999 | 16 | 18.6% |
| $150,000 to $199,999 | 5 | 5.8% |
| $200,000+ | 0 | 0.0% |
Family Income by Famaliy Size in Kingsville
4-person families (9 | 10.5%) account for the highest median family income in Kingsville with $102,917 per family, while 2-person families (50 | 58.1%) have the highest median income of $36,852 per family member.
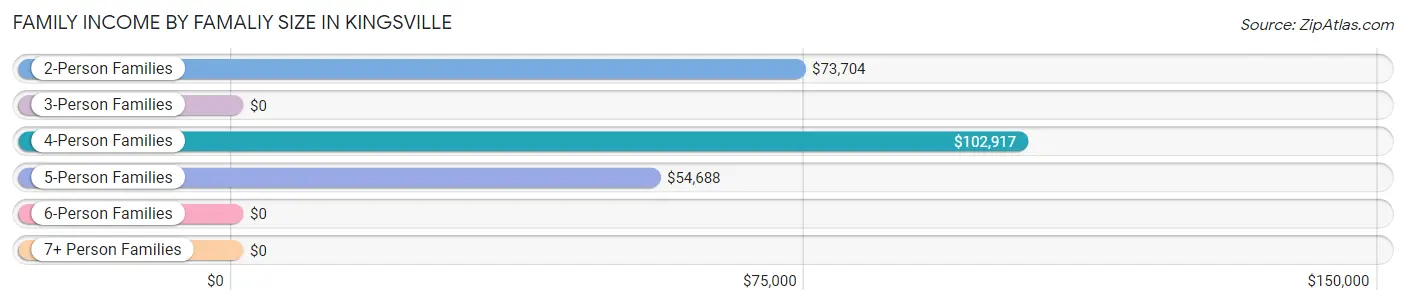
| Income Bracket | # Families | Median Income |
| 2-Person Families | 50 (58.1%) | $73,704 |
| 3-Person Families | 7 (8.1%) | $0 |
| 4-Person Families | 9 (10.5%) | $102,917 |
| 5-Person Families | 11 (12.8%) | $54,688 |
| 6-Person Families | 1 (1.2%) | $0 |
| 7+ Person Families | 8 (9.3%) | $0 |
| Total | 86 (100.0%) | $73,796 |
Family Income by Number of Earners in Kingsville
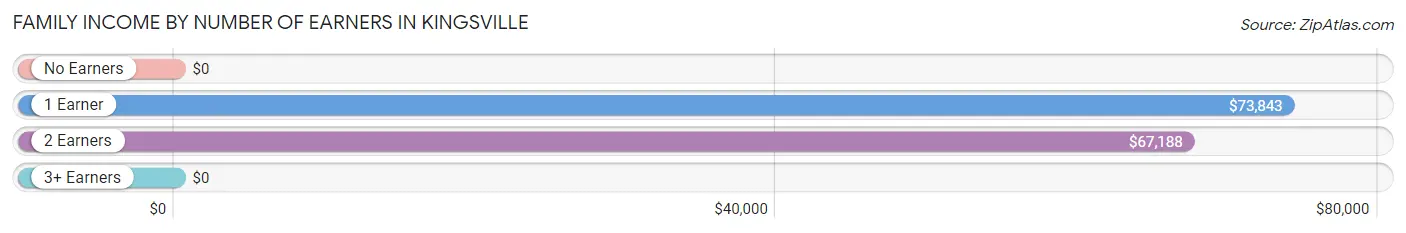
| Number of Earners | # Families | Median Income |
| No Earners | 5 (5.8%) | $0 |
| 1 Earner | 43 (50.0%) | $73,843 |
| 2 Earners | 33 (38.4%) | $67,188 |
| 3+ Earners | 5 (5.8%) | $0 |
| Total | 86 (100.0%) | $73,796 |
Household Income in Kingsville
Household Income Brackets in Kingsville
With 63 households falling in the category, the $50,000 to $74,999 income range is the most frequent in Kingsville, accounting for 52.1% of all households.
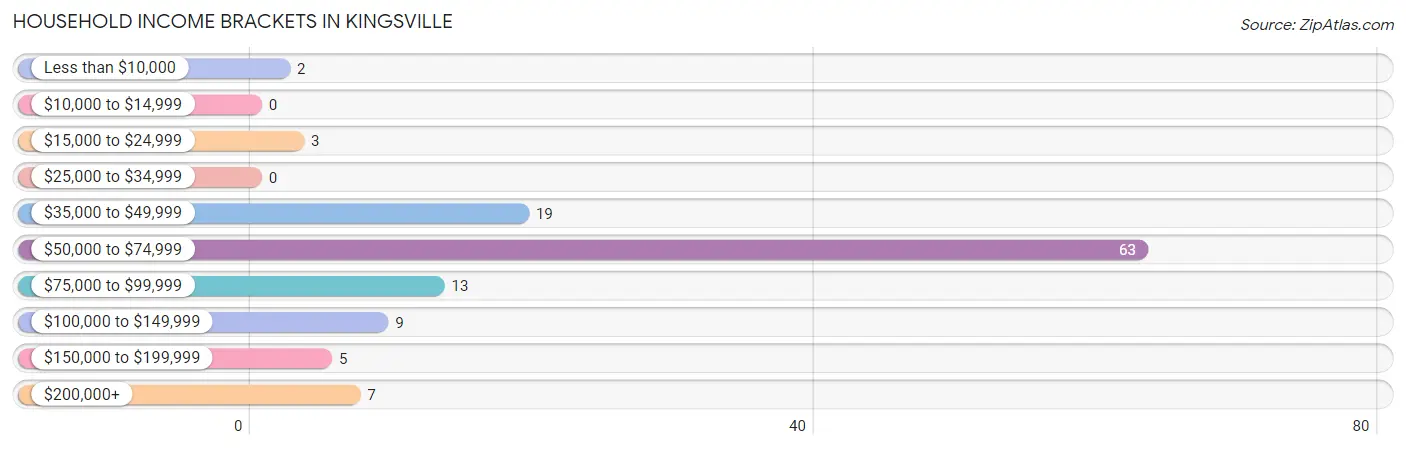
| Income Bracket | # Households | % Households |
| Less than $10,000 | 2 | 1.7% |
| $10,000 to $14,999 | 0 | 0.0% |
| $15,000 to $24,999 | 3 | 2.5% |
| $25,000 to $34,999 | 0 | 0.0% |
| $35,000 to $49,999 | 19 | 15.7% |
| $50,000 to $74,999 | 63 | 52.1% |
| $75,000 to $99,999 | 13 | 10.7% |
| $100,000 to $149,999 | 9 | 7.4% |
| $150,000 to $199,999 | 5 | 4.1% |
| $200,000+ | 7 | 5.8% |
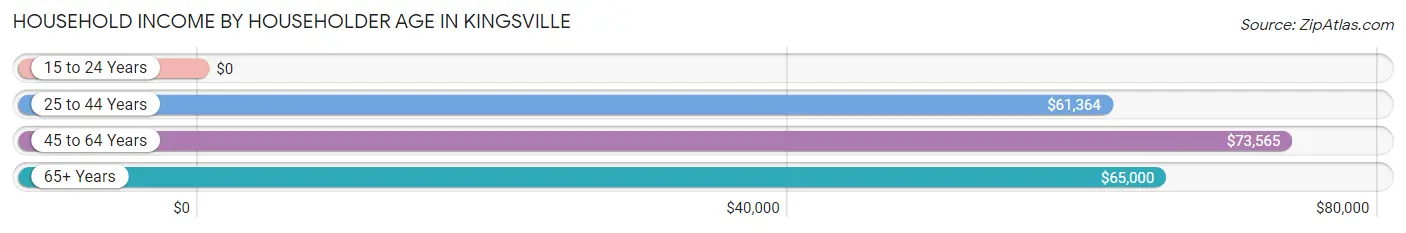
Household Income by Householder Age in Kingsville
The median household income in Kingsville is $72,546, with the highest median household income of $73,565 found in the 45 to 64 years age bracket for the primary householder. A total of 55 households (45.5%) fall into this category.
| Income Bracket | # Households | Median Income |
| 15 to 24 Years | 0 (0.0%) | $0 |
| 25 to 44 Years | 50 (41.3%) | $61,364 |
| 45 to 64 Years | 55 (45.5%) | $73,565 |
| 65+ Years | 16 (13.2%) | $65,000 |
| Total | 121 (100.0%) | $72,546 |
Poverty in Kingsville
Income Below Poverty by Sex and Age in Kingsville
With 6.7% poverty level for males and 4.9% for females among the residents of Kingsville, 12 to 14 year old males and 75 year old and over females are the most vulnerable to poverty, with 3 males (100.0%) and 2 females (40.0%) in their respective age groups living below the poverty level.
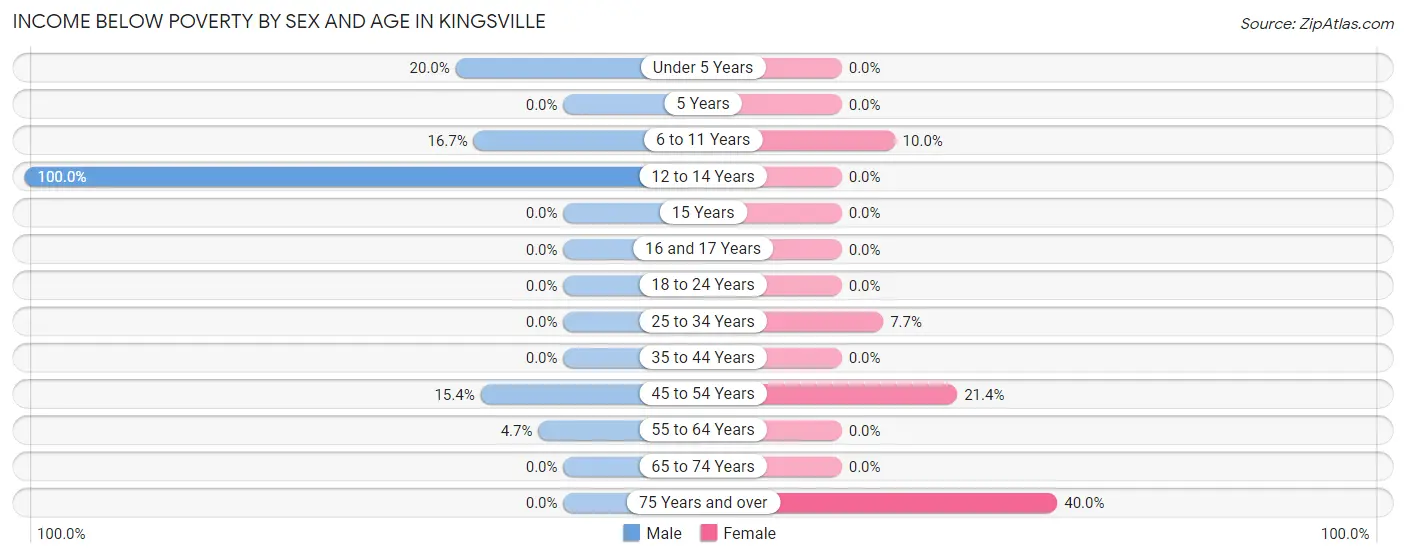
| Age Bracket | Male | Female |
| Under 5 Years | 2 (20.0%) | 0 (0.0%) |
| 5 Years | 0 (0.0%) | 0 (0.0%) |
| 6 to 11 Years | 3 (16.7%) | 2 (10.0%) |
| 12 to 14 Years | 3 (100.0%) | 0 (0.0%) |
| 15 Years | 0 (0.0%) | 0 (0.0%) |
| 16 and 17 Years | 0 (0.0%) | 0 (0.0%) |
| 18 to 24 Years | 0 (0.0%) | 0 (0.0%) |
| 25 to 34 Years | 0 (0.0%) | 2 (7.7%) |
| 35 to 44 Years | 0 (0.0%) | 0 (0.0%) |
| 45 to 54 Years | 2 (15.4%) | 3 (21.4%) |
| 55 to 64 Years | 2 (4.6%) | 0 (0.0%) |
| 65 to 74 Years | 0 (0.0%) | 0 (0.0%) |
| 75 Years and over | 0 (0.0%) | 2 (40.0%) |
| Total | 12 (6.7%) | 9 (4.9%) |
Income Above Poverty by Sex and Age in Kingsville
According to the poverty statistics in Kingsville, males aged 5 years and females aged under 5 years are the age groups that are most secure financially, with 100.0% of males and 100.0% of females in these age groups living above the poverty line.
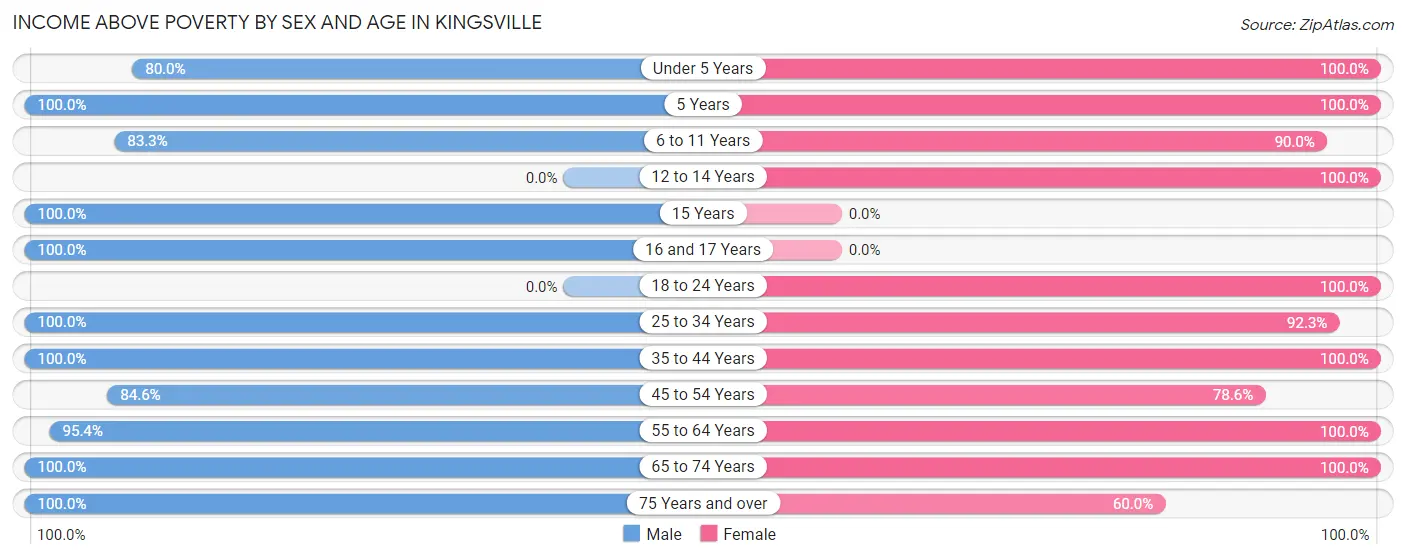
| Age Bracket | Male | Female |
| Under 5 Years | 8 (80.0%) | 16 (100.0%) |
| 5 Years | 8 (100.0%) | 2 (100.0%) |
| 6 to 11 Years | 15 (83.3%) | 18 (90.0%) |
| 12 to 14 Years | 0 (0.0%) | 10 (100.0%) |
| 15 Years | 12 (100.0%) | 0 (0.0%) |
| 16 and 17 Years | 6 (100.0%) | 0 (0.0%) |
| 18 to 24 Years | 0 (0.0%) | 6 (100.0%) |
| 25 to 34 Years | 19 (100.0%) | 24 (92.3%) |
| 35 to 44 Years | 34 (100.0%) | 38 (100.0%) |
| 45 to 54 Years | 11 (84.6%) | 11 (78.6%) |
| 55 to 64 Years | 41 (95.4%) | 38 (100.0%) |
| 65 to 74 Years | 9 (100.0%) | 9 (100.0%) |
| 75 Years and over | 3 (100.0%) | 3 (60.0%) |
| Total | 166 (93.3%) | 175 (95.1%) |
Income Below Poverty Among Married-Couple Families in Kingsville
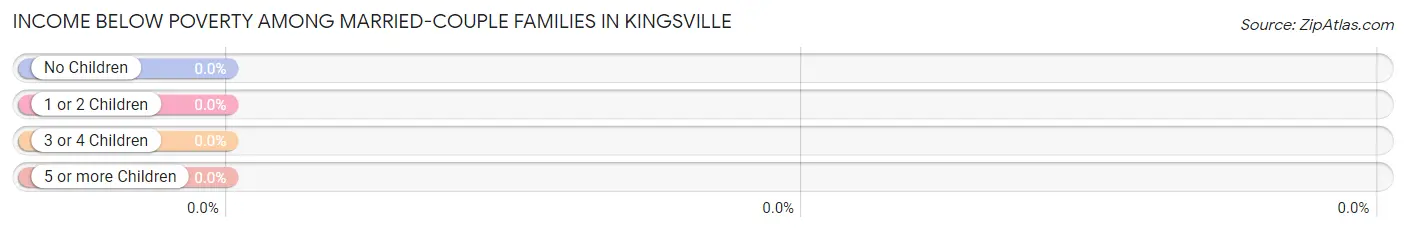
| Children | Above Poverty | Below Poverty |
| No Children | 50 (100.0%) | 0 (0.0%) |
| 1 or 2 Children | 10 (100.0%) | 0 (0.0%) |
| 3 or 4 Children | 9 (100.0%) | 0 (0.0%) |
| 5 or more Children | 1 (100.0%) | 0 (0.0%) |
| Total | 70 (100.0%) | 0 (0.0%) |
Income Below Poverty Among Single-Parent Households in Kingsville
According to the poverty data in Kingsville, 50.0% or 2 single-father households and 25.0% or 3 single-mother households are living below the poverty line. Among single-father households, those with 1 or 2 children have the highest poverty rate, with 2 households (100.0%) experiencing poverty. Likewise, among single-mother households, those with no children have the highest poverty rate, with 1 households (100.0%) falling below the poverty line.
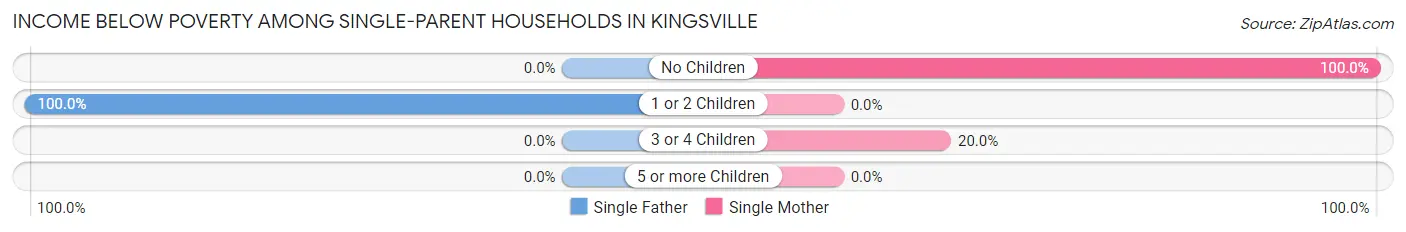
| Children | Single Father | Single Mother |
| No Children | 0 (0.0%) | 1 (100.0%) |
| 1 or 2 Children | 2 (100.0%) | 0 (0.0%) |
| 3 or 4 Children | 0 (0.0%) | 2 (20.0%) |
| 5 or more Children | 0 (0.0%) | 0 (0.0%) |
| Total | 2 (50.0%) | 3 (25.0%) |
Income Below Poverty Among Married-Couple vs Single-Parent Households in Kingsville
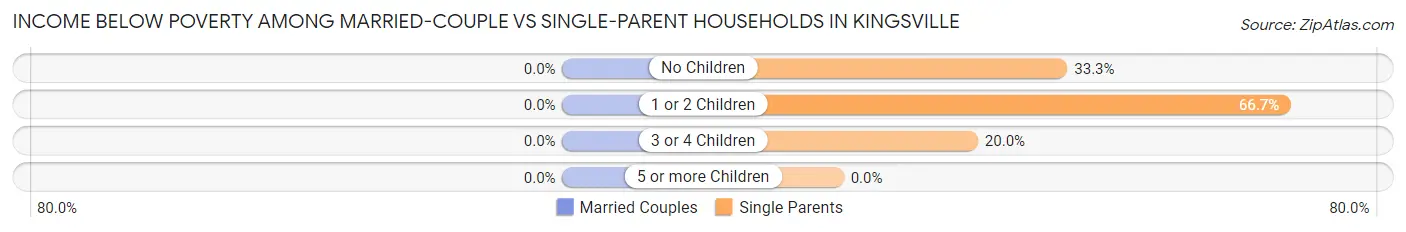
| Children | Married-Couple Families | Single-Parent Households |
| No Children | 0 (0.0%) | 1 (33.3%) |
| 1 or 2 Children | 0 (0.0%) | 2 (66.7%) |
| 3 or 4 Children | 0 (0.0%) | 2 (20.0%) |
| 5 or more Children | 0 (0.0%) | 0 (0.0%) |
| Total | 0 (0.0%) | 5 (31.2%) |
Race in Kingsville
The most populous races in Kingsville are White / Caucasian (346 | 91.8%), Two or more Races (19 | 5.0%), and Hispanic or Latino (6 | 1.6%).
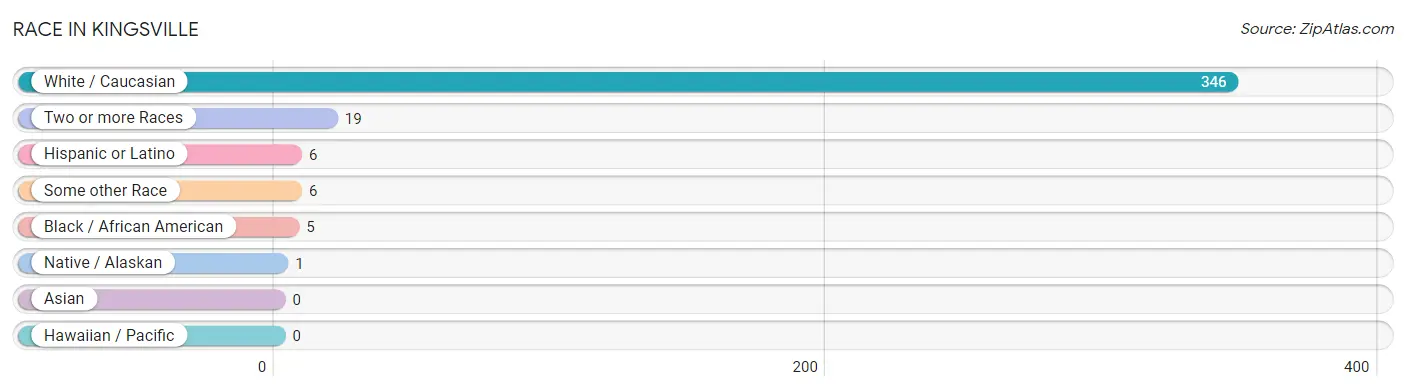
| Race | # Population | % Population |
| Asian | 0 | 0.0% |
| Black / African American | 5 | 1.3% |
| Hawaiian / Pacific | 0 | 0.0% |
| Hispanic or Latino | 6 | 1.6% |
| Native / Alaskan | 1 | 0.3% |
| White / Caucasian | 346 | 91.8% |
| Two or more Races | 19 | 5.0% |
| Some other Race | 6 | 1.6% |
| Total | 377 | 100.0% |
Ancestry in Kingsville
The most populous ancestries reported in Kingsville are Irish (113 | 30.0%), German (58 | 15.4%), English (42 | 11.1%), Italian (40 | 10.6%), and Scotch-Irish (23 | 6.1%), together accounting for 73.2% of all Kingsville residents.
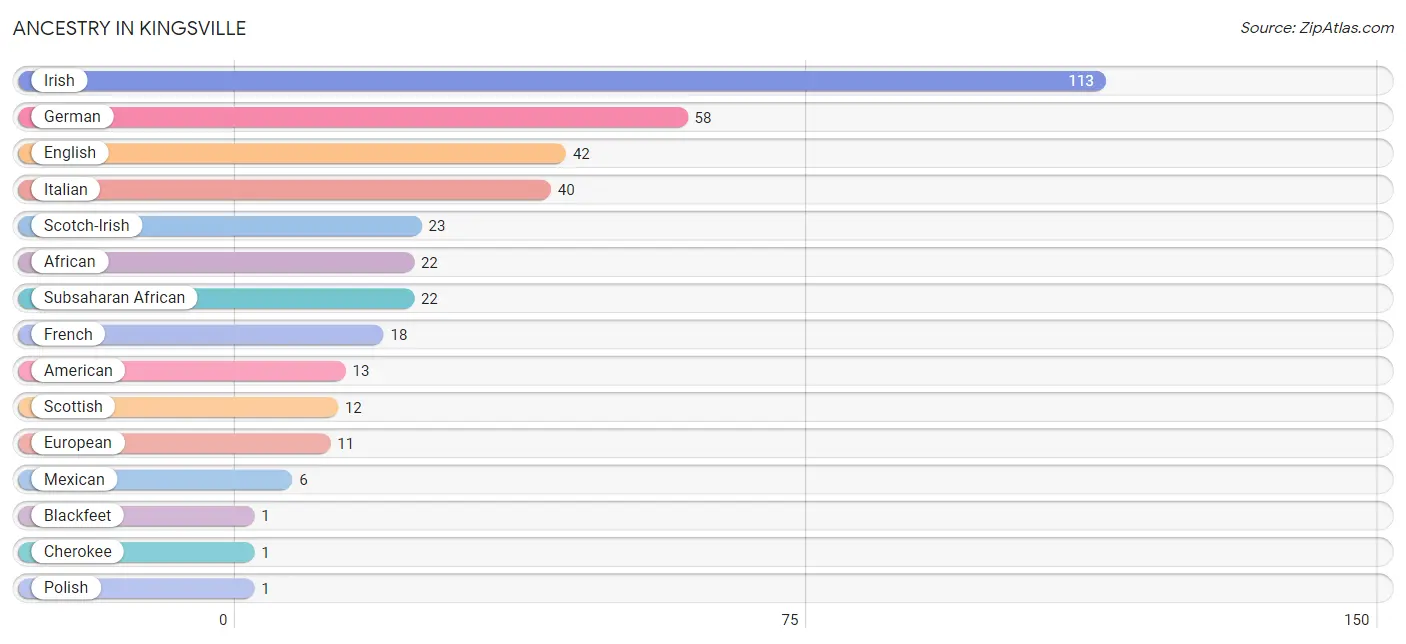
| Ancestry | # Population | % Population |
| African | 22 | 5.8% |
| American | 13 | 3.5% |
| Blackfeet | 1 | 0.3% |
| Cherokee | 1 | 0.3% |
| English | 42 | 11.1% |
| European | 11 | 2.9% |
| French | 18 | 4.8% |
| German | 58 | 15.4% |
| Irish | 113 | 30.0% |
| Italian | 40 | 10.6% |
| Mexican | 6 | 1.6% |
| Polish | 1 | 0.3% |
| Scotch-Irish | 23 | 6.1% |
| Scottish | 12 | 3.2% |
| Subsaharan African | 22 | 5.8% | View All 15 Rows |
Immigrants in Kingsville
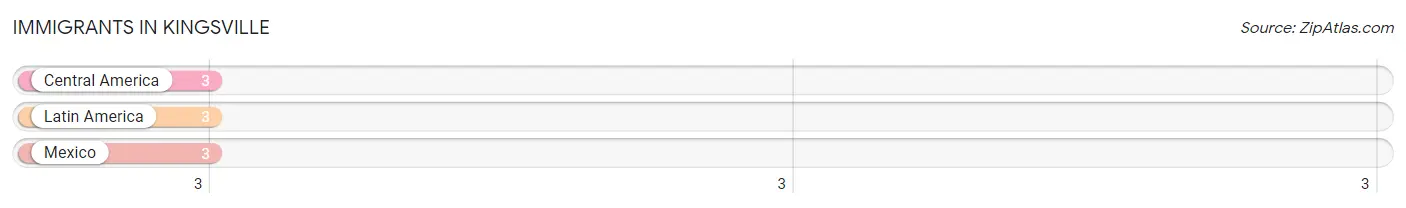
The most numerous immigrant groups reported in Kingsville came from Central America (3 | 0.8%), Latin America (3 | 0.8%), and Mexico (3 | 0.8%), together accounting for 2.4% of all Kingsville residents.
| Immigration Origin | # Population | % Population |
| Central America | 3 | 0.8% |
| Latin America | 3 | 0.8% |
| Mexico | 3 | 0.8% | View All 3 Rows |
Sex and Age in Kingsville
Sex and Age in Kingsville
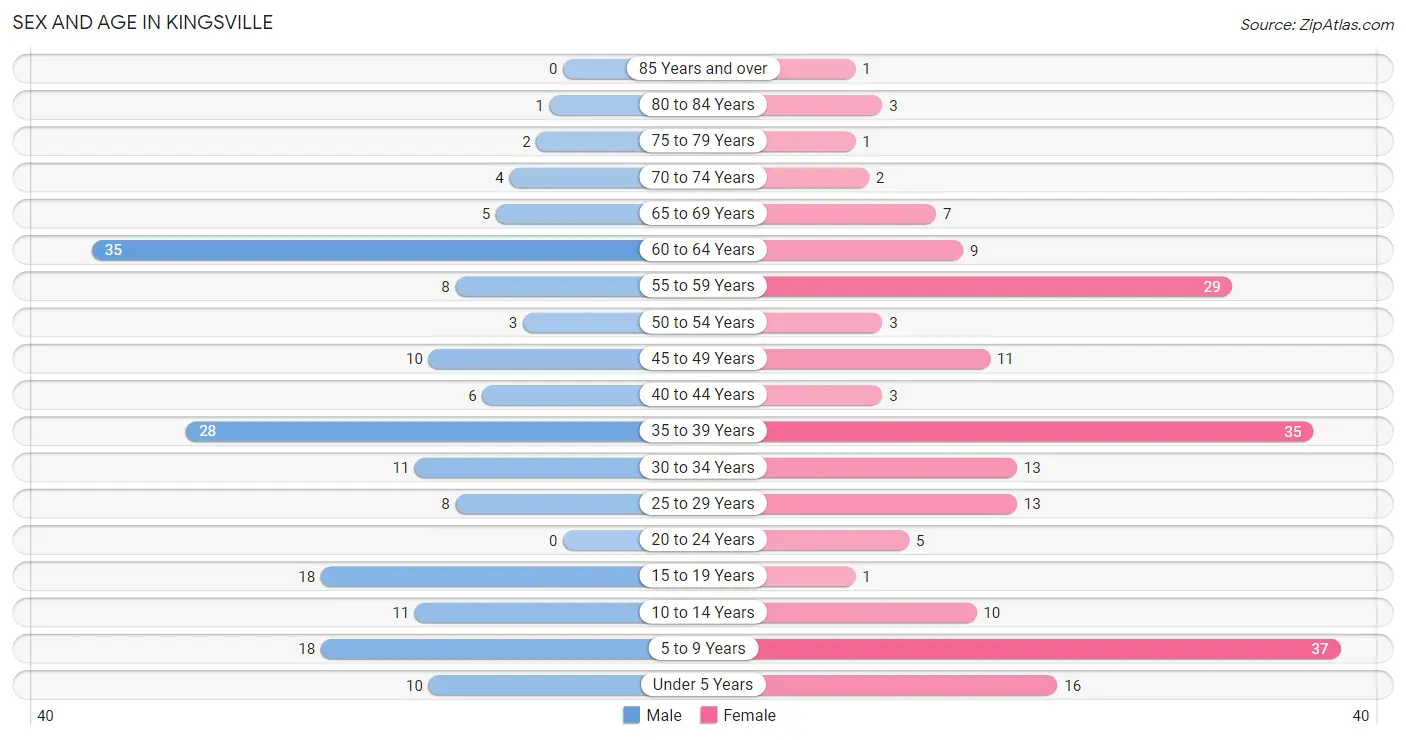
The most populous age groups in Kingsville are 60 to 64 Years (35 | 19.7%) for men and 5 to 9 Years (37 | 18.6%) for women.
| Age Bracket | Male | Female |
| Under 5 Years | 10 (5.6%) | 16 (8.0%) |
| 5 to 9 Years | 18 (10.1%) | 37 (18.6%) |
| 10 to 14 Years | 11 (6.2%) | 10 (5.0%) |
| 15 to 19 Years | 18 (10.1%) | 1 (0.5%) |
| 20 to 24 Years | 0 (0.0%) | 5 (2.5%) |
| 25 to 29 Years | 8 (4.5%) | 13 (6.5%) |
| 30 to 34 Years | 11 (6.2%) | 13 (6.5%) |
| 35 to 39 Years | 28 (15.7%) | 35 (17.6%) |
| 40 to 44 Years | 6 (3.4%) | 3 (1.5%) |
| 45 to 49 Years | 10 (5.6%) | 11 (5.5%) |
| 50 to 54 Years | 3 (1.7%) | 3 (1.5%) |
| 55 to 59 Years | 8 (4.5%) | 29 (14.6%) |
| 60 to 64 Years | 35 (19.7%) | 9 (4.5%) |
| 65 to 69 Years | 5 (2.8%) | 7 (3.5%) |
| 70 to 74 Years | 4 (2.2%) | 2 (1.0%) |
| 75 to 79 Years | 2 (1.1%) | 1 (0.5%) |
| 80 to 84 Years | 1 (0.6%) | 3 (1.5%) |
| 85 Years and over | 0 (0.0%) | 1 (0.5%) |
| Total | 178 (100.0%) | 199 (100.0%) |
Families and Households in Kingsville
Median Family Size in Kingsville
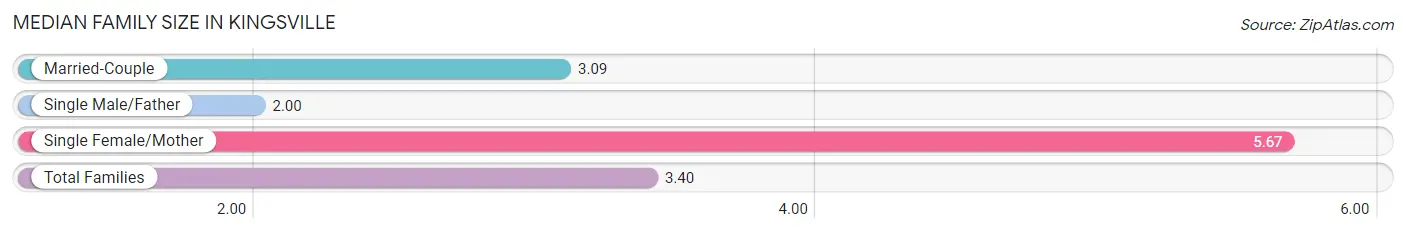
The median family size in Kingsville is 3.40 persons per family, with single female/mother families (12 | 14.0%) accounting for the largest median family size of 5.67 persons per family. On the other hand, single male/father families (4 | 4.6%) represent the smallest median family size with 2.00 persons per family.
| Family Type | # Families | Family Size |
| Married-Couple | 70 (81.4%) | 3.09 |
| Single Male/Father | 4 (4.6%) | 2.00 |
| Single Female/Mother | 12 (14.0%) | 5.67 |
| Total Families | 86 (100.0%) | 3.40 |
Median Household Size in Kingsville
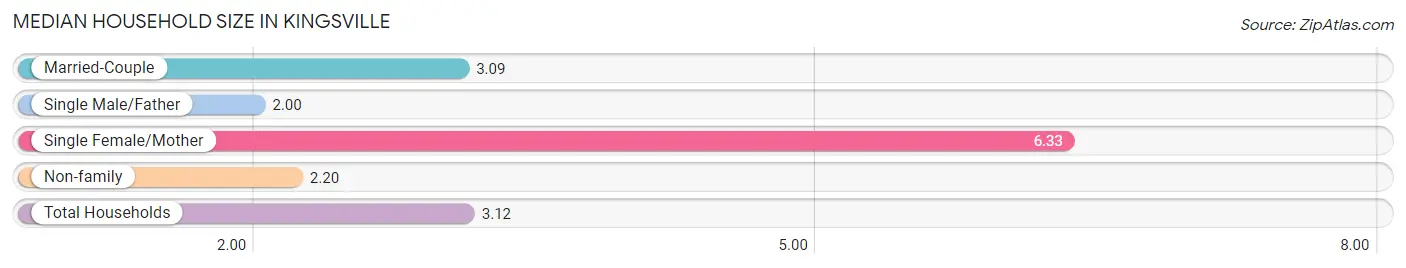
The median household size in Kingsville is 3.12 persons per household, with single female/mother households (12 | 9.9%) accounting for the largest median household size of 6.33 persons per household. single male/father households (4 | 3.3%) represent the smallest median household size with 2.00 persons per household.
| Household Type | # Households | Household Size |
| Married-Couple | 70 (57.9%) | 3.09 |
| Single Male/Father | 4 (3.3%) | 2.00 |
| Single Female/Mother | 12 (9.9%) | 6.33 |
| Non-family | 35 (28.9%) | 2.20 |
| Total Households | 121 (100.0%) | 3.12 |
Household Size by Marriage Status in Kingsville
Out of a total of 121 households in Kingsville, 86 (71.1%) are family households, while 35 (28.9%) are nonfamily households. The most numerous type of family households are 2-person households, comprising 50, and the most common type of nonfamily households are 3-person households, comprising 17.
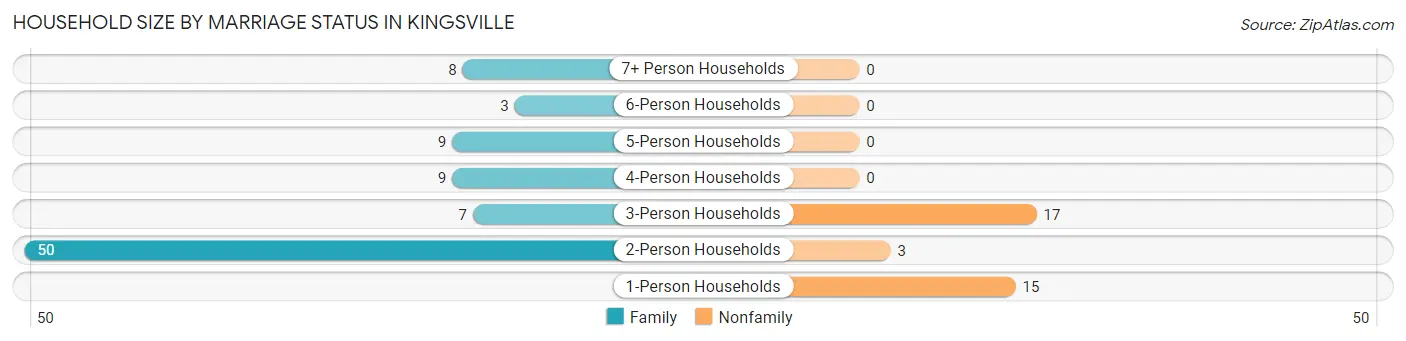
| Household Size | Family Households | Nonfamily Households |
| 1-Person Households | - | 15 (12.4%) |
| 2-Person Households | 50 (41.3%) | 3 (2.5%) |
| 3-Person Households | 7 (5.8%) | 17 (14.1%) |
| 4-Person Households | 9 (7.4%) | 0 (0.0%) |
| 5-Person Households | 9 (7.4%) | 0 (0.0%) |
| 6-Person Households | 3 (2.5%) | 0 (0.0%) |
| 7+ Person Households | 8 (6.6%) | 0 (0.0%) |
| Total | 86 (71.1%) | 35 (28.9%) |
Female Fertility in Kingsville
Fertility by Age in Kingsville
Average fertility rate in Kingsville is 12.0 births per 1,000 women. Women in the age bracket of 20 to 34 years have the highest fertility rate with 32.0 births per 1,000 women. Women in the age bracket of 20 to 34 years acount for 100.0% of all women with births.
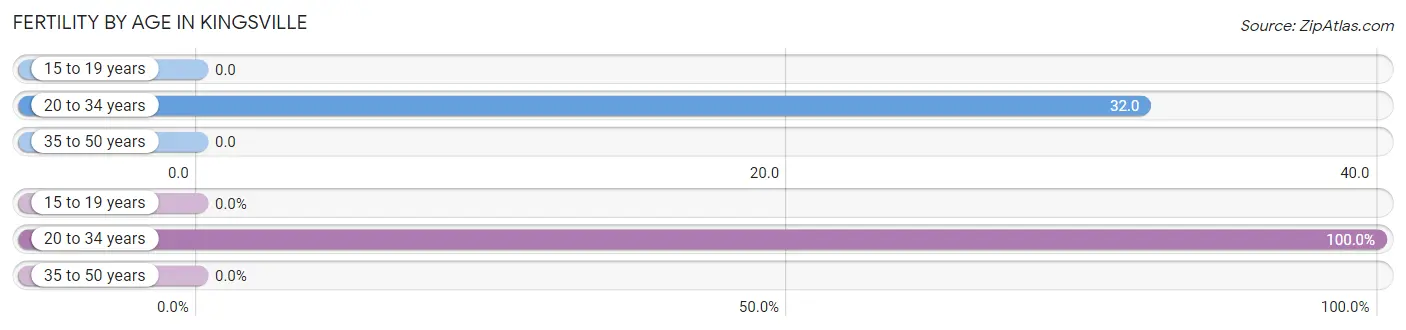
| Age Bracket | Women with Births | Births / 1,000 Women |
| 15 to 19 years | 0 (0.0%) | 0.0 |
| 20 to 34 years | 1 (100.0%) | 32.0 |
| 35 to 50 years | 0 (0.0%) | 0.0 |
| Total | 1 (100.0%) | 12.0 |
Fertility by Age by Marriage Status in Kingsville
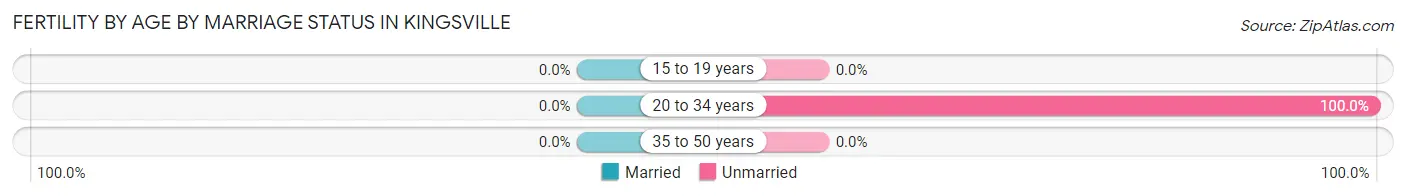
| Age Bracket | Married | Unmarried |
| 15 to 19 years | 0 (0.0%) | 0 (0.0%) |
| 20 to 34 years | 0 (0.0%) | 1 (100.0%) |
| 35 to 50 years | 0 (0.0%) | 0 (0.0%) |
| Total | 0 (0.0%) | 1 (100.0%) |
Fertility by Education in Kingsville
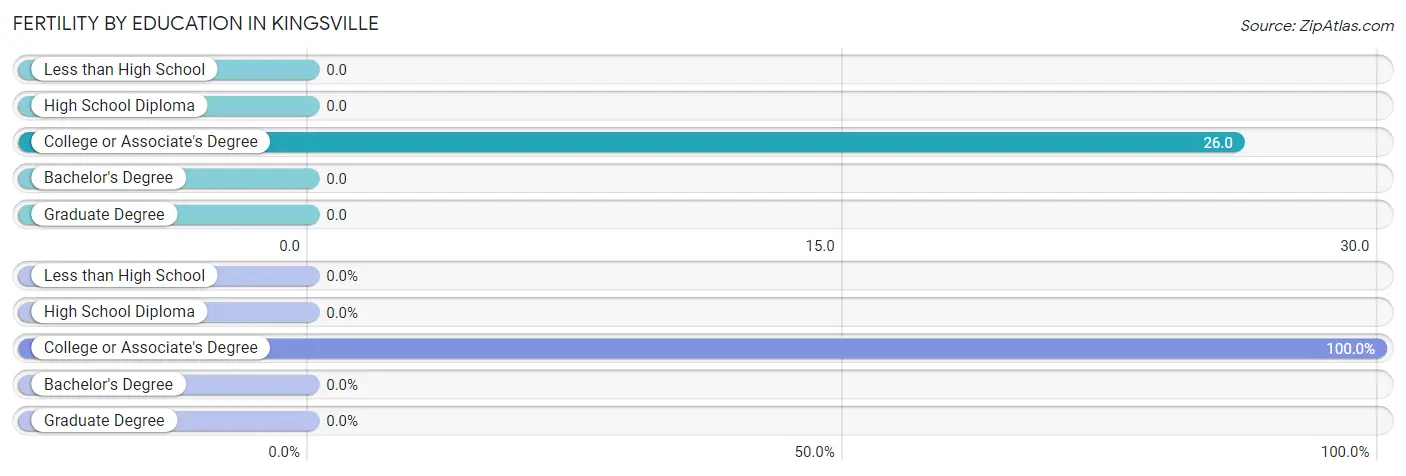
| Educational Attainment | Women with Births | Births / 1,000 Women |
| Less than High School | 0 (0.0%) | 0.0 |
| High School Diploma | 0 (0.0%) | 0.0 |
| College or Associate's Degree | 1 (100.0%) | 26.0 |
| Bachelor's Degree | 0 (0.0%) | 0.0 |
| Graduate Degree | 0 (0.0%) | 0.0 |
| Total | 1 (100.0%) | 12.0 |
Fertility by Education by Marriage Status in Kingsville
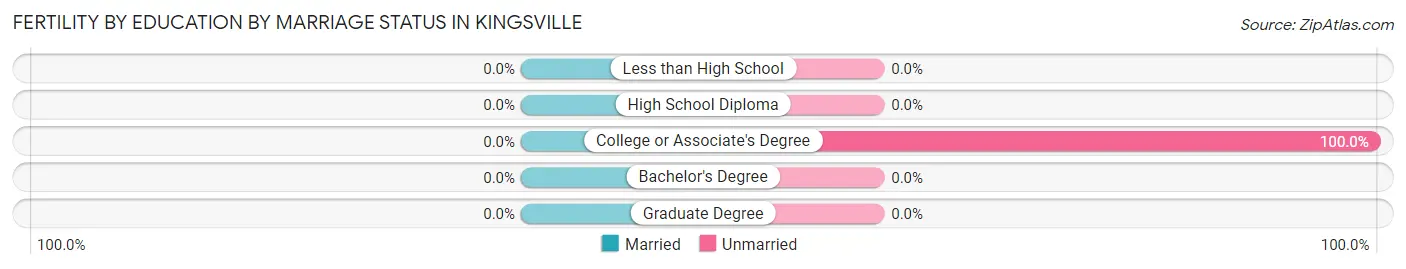
| Educational Attainment | Married | Unmarried |
| Less than High School | 0 (0.0%) | 0 (0.0%) |
| High School Diploma | 0 (0.0%) | 0 (0.0%) |
| College or Associate's Degree | 0 (0.0%) | 1 (100.0%) |
| Bachelor's Degree | 0 (0.0%) | 0 (0.0%) |
| Graduate Degree | 0 (0.0%) | 0 (0.0%) |
| Total | 0 (0.0%) | 1 (100.0%) |
Employment Characteristics in Kingsville
Employment by Class of Employer in Kingsville
Among the 157 employed individuals in Kingsville, private company employees (109 | 69.4%), local government employees (26 | 16.6%), and self-employed (not incorporated) (14 | 8.9%) make up the most common classes of employment.
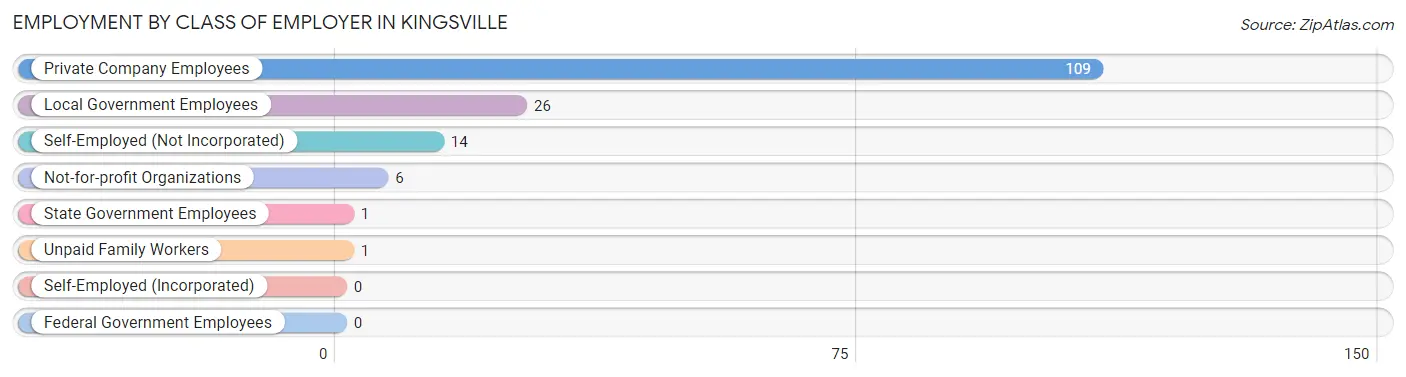
| Employer Class | # Employees | % Employees |
| Private Company Employees | 109 | 69.4% |
| Self-Employed (Incorporated) | 0 | 0.0% |
| Self-Employed (Not Incorporated) | 14 | 8.9% |
| Not-for-profit Organizations | 6 | 3.8% |
| Local Government Employees | 26 | 16.6% |
| State Government Employees | 1 | 0.6% |
| Federal Government Employees | 0 | 0.0% |
| Unpaid Family Workers | 1 | 0.6% |
| Total | 157 | 100.0% |
Employment Status by Age in Kingsville
According to the labor force statistics for Kingsville, out of the total population over 16 years of age (263), 63.1% or 166 individuals are in the labor force, with 3.6% or 6 of them unemployed. The age group with the highest labor force participation rate is 16 to 19 years, with 100.0% or 7 individuals in the labor force. Within the labor force, the 16 to 19 years age range has the highest percentage of unemployed individuals, with 85.7% or 6 of them being unemployed.
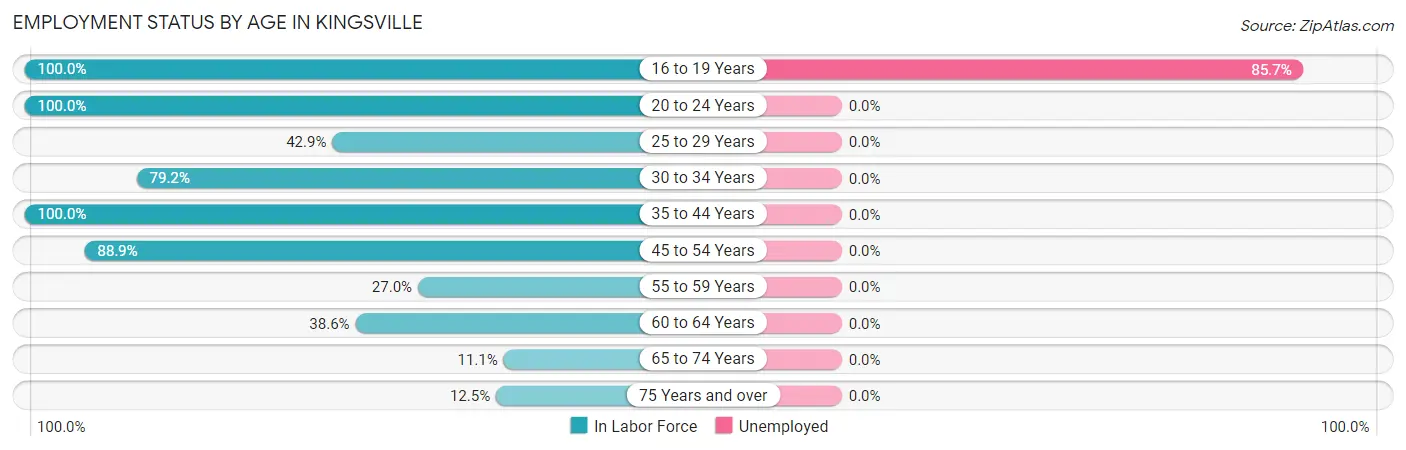
| Age Bracket | In Labor Force | Unemployed |
| 16 to 19 Years | 7 (100.0%) | 6 (85.7%) |
| 20 to 24 Years | 5 (100.0%) | 0 (0.0%) |
| 25 to 29 Years | 9 (42.9%) | 0 (0.0%) |
| 30 to 34 Years | 19 (79.2%) | 0 (0.0%) |
| 35 to 44 Years | 72 (100.0%) | 0 (0.0%) |
| 45 to 54 Years | 24 (88.9%) | 0 (0.0%) |
| 55 to 59 Years | 10 (27.0%) | 0 (0.0%) |
| 60 to 64 Years | 17 (38.6%) | 0 (0.0%) |
| 65 to 74 Years | 2 (11.1%) | 0 (0.0%) |
| 75 Years and over | 1 (12.5%) | 0 (0.0%) |
| Total | 166 (63.1%) | 6 (3.6%) |
Employment Status by Educational Attainment in Kingsville
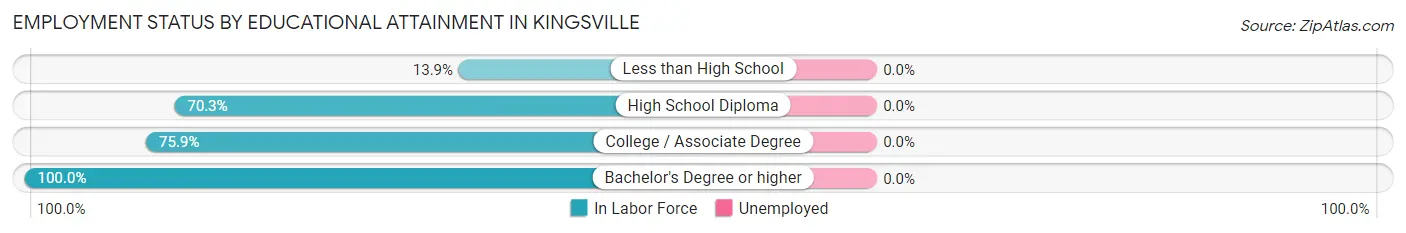
| Educational Attainment | In Labor Force | Unemployed |
| Less than High School | 5 (13.9%) | 0 (0.0%) |
| High School Diploma | 71 (70.3%) | 0 (0.0%) |
| College / Associate Degree | 41 (75.9%) | 0 (0.0%) |
| Bachelor's Degree or higher | 34 (100.0%) | 0 (0.0%) |
| Total | 151 (67.1%) | 0 (0.0%) |
Employment Occupations by Sex in Kingsville
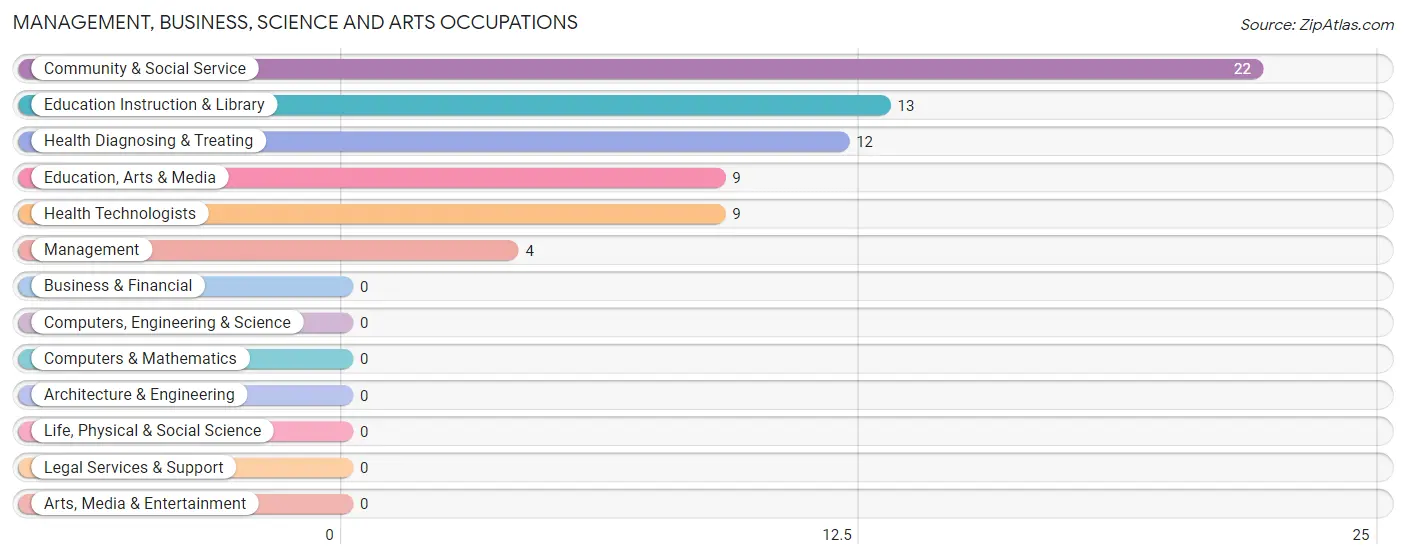
Management, Business, Science and Arts Occupations
The most common Management, Business, Science and Arts occupations in Kingsville are Community & Social Service (22 | 13.8%), Education Instruction & Library (13 | 8.1%), Health Diagnosing & Treating (12 | 7.5%), Education, Arts & Media (9 | 5.6%), and Health Technologists (9 | 5.6%).
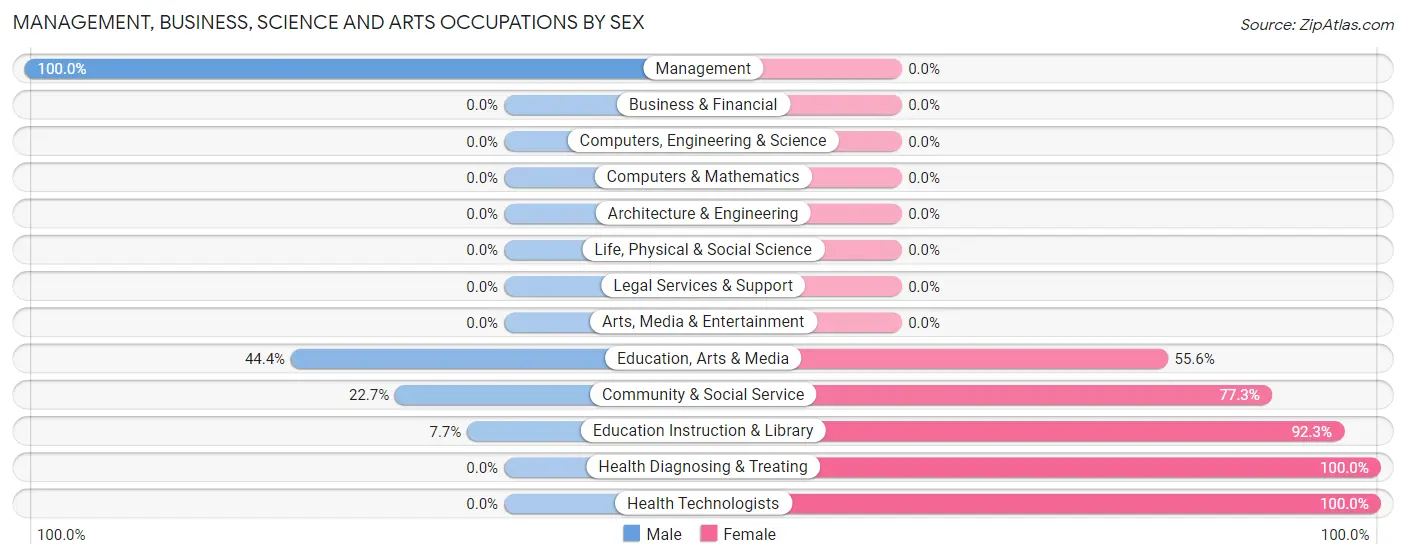
Management, Business, Science and Arts Occupations by Sex
Within the Management, Business, Science and Arts occupations in Kingsville, the most male-oriented occupations are Management (100.0%), Education, Arts & Media (44.4%), and Community & Social Service (22.7%), while the most female-oriented occupations are Health Diagnosing & Treating (100.0%), Health Technologists (100.0%), and Education Instruction & Library (92.3%).
| Occupation | Male | Female |
| Management | 4 (100.0%) | 0 (0.0%) |
| Business & Financial | 0 (0.0%) | 0 (0.0%) |
| Computers, Engineering & Science | 0 (0.0%) | 0 (0.0%) |
| Computers & Mathematics | 0 (0.0%) | 0 (0.0%) |
| Architecture & Engineering | 0 (0.0%) | 0 (0.0%) |
| Life, Physical & Social Science | 0 (0.0%) | 0 (0.0%) |
| Community & Social Service | 5 (22.7%) | 17 (77.3%) |
| Education, Arts & Media | 4 (44.4%) | 5 (55.6%) |
| Legal Services & Support | 0 (0.0%) | 0 (0.0%) |
| Education Instruction & Library | 1 (7.7%) | 12 (92.3%) |
| Arts, Media & Entertainment | 0 (0.0%) | 0 (0.0%) |
| Health Diagnosing & Treating | 0 (0.0%) | 12 (100.0%) |
| Health Technologists | 0 (0.0%) | 9 (100.0%) |
| Total (Category) | 9 (23.7%) | 29 (76.3%) |
| Total (Overall) | 77 (48.1%) | 83 (51.9%) |
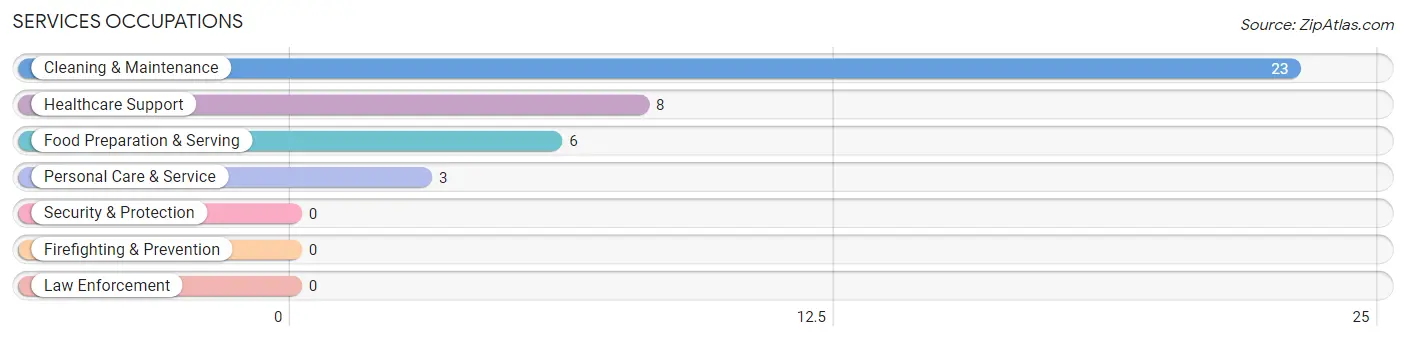
Services Occupations
The most common Services occupations in Kingsville are Cleaning & Maintenance (23 | 14.4%), Healthcare Support (8 | 5.0%), Food Preparation & Serving (6 | 3.7%), and Personal Care & Service (3 | 1.9%).
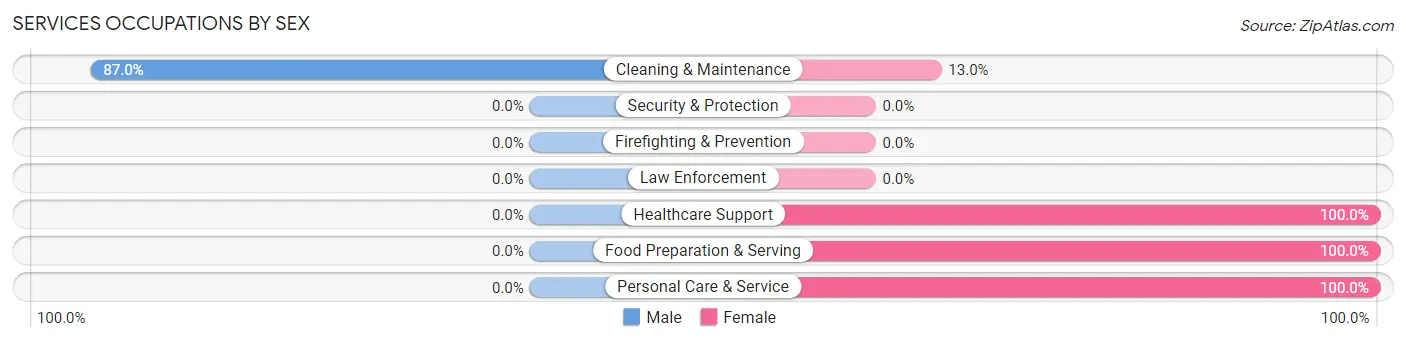
Services Occupations by Sex
| Occupation | Male | Female |
| Healthcare Support | 0 (0.0%) | 8 (100.0%) |
| Security & Protection | 0 (0.0%) | 0 (0.0%) |
| Firefighting & Prevention | 0 (0.0%) | 0 (0.0%) |
| Law Enforcement | 0 (0.0%) | 0 (0.0%) |
| Food Preparation & Serving | 0 (0.0%) | 6 (100.0%) |
| Cleaning & Maintenance | 20 (87.0%) | 3 (13.0%) |
| Personal Care & Service | 0 (0.0%) | 3 (100.0%) |
| Total (Category) | 20 (50.0%) | 20 (50.0%) |
| Total (Overall) | 77 (48.1%) | 83 (51.9%) |
Sales and Office Occupations
The most common Sales and Office occupations in Kingsville are Sales & Related (41 | 25.6%), and Office & Administration (5 | 3.1%).
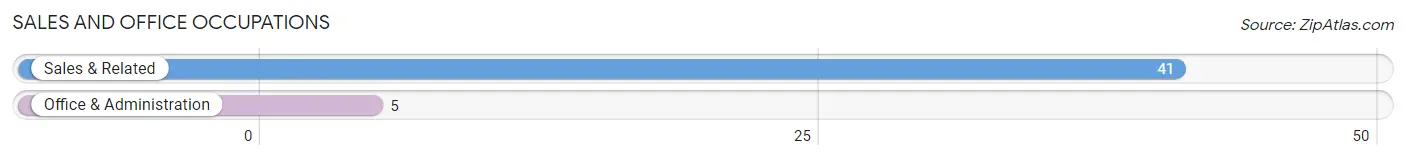
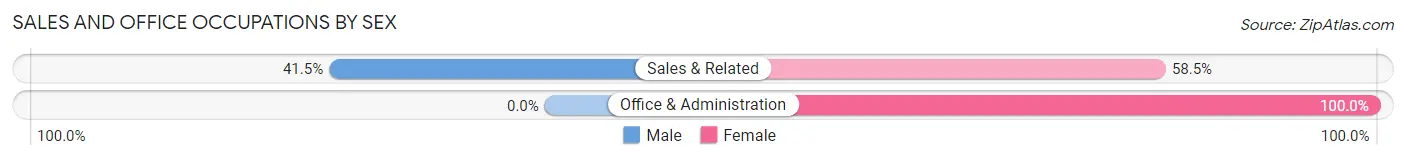
Sales and Office Occupations by Sex
| Occupation | Male | Female |
| Sales & Related | 17 (41.5%) | 24 (58.5%) |
| Office & Administration | 0 (0.0%) | 5 (100.0%) |
| Total (Category) | 17 (37.0%) | 29 (63.0%) |
| Total (Overall) | 77 (48.1%) | 83 (51.9%) |
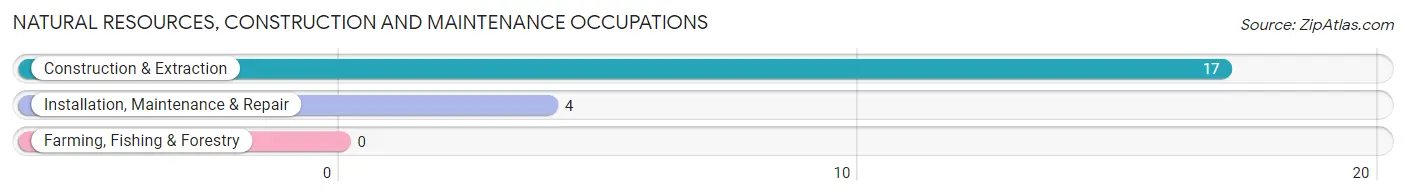
Natural Resources, Construction and Maintenance Occupations
The most common Natural Resources, Construction and Maintenance occupations in Kingsville are Construction & Extraction (17 | 10.6%), and Installation, Maintenance & Repair (4 | 2.5%).
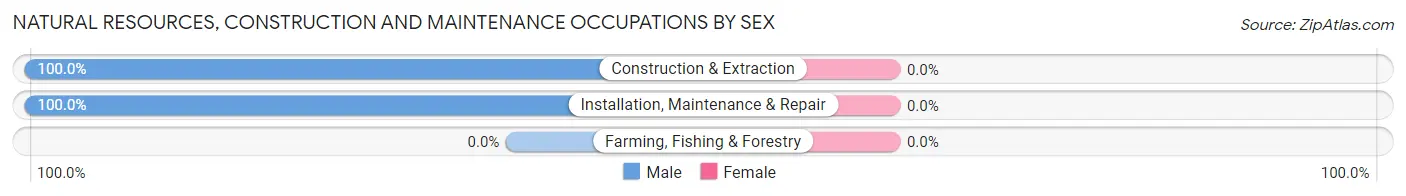
Natural Resources, Construction and Maintenance Occupations by Sex
| Occupation | Male | Female |
| Farming, Fishing & Forestry | 0 (0.0%) | 0 (0.0%) |
| Construction & Extraction | 17 (100.0%) | 0 (0.0%) |
| Installation, Maintenance & Repair | 4 (100.0%) | 0 (0.0%) |
| Total (Category) | 21 (100.0%) | 0 (0.0%) |
| Total (Overall) | 77 (48.1%) | 83 (51.9%) |
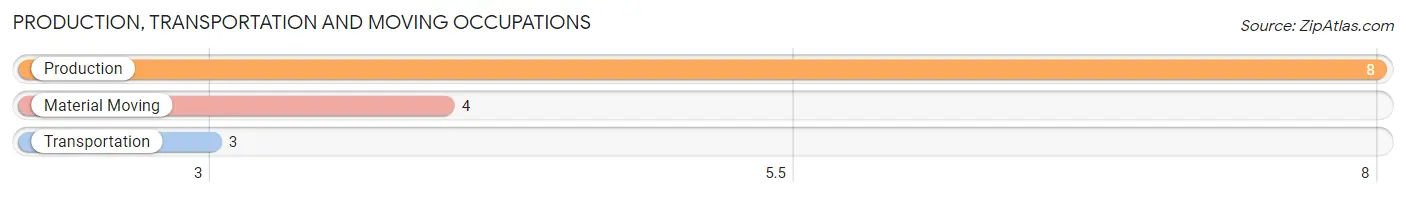
Production, Transportation and Moving Occupations
The most common Production, Transportation and Moving occupations in Kingsville are Production (8 | 5.0%), Material Moving (4 | 2.5%), and Transportation (3 | 1.9%).
Production, Transportation and Moving Occupations by Sex
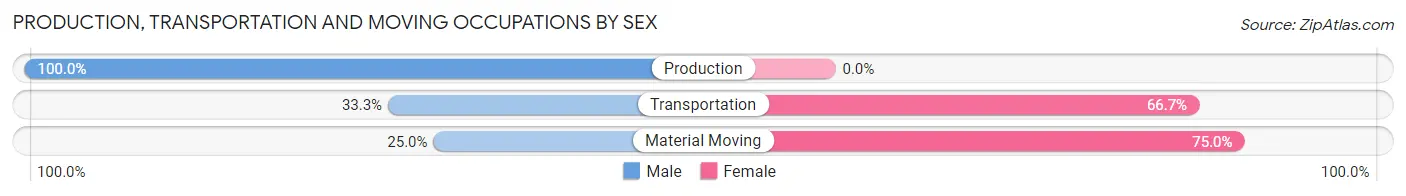
| Occupation | Male | Female |
| Production | 8 (100.0%) | 0 (0.0%) |
| Transportation | 1 (33.3%) | 2 (66.7%) |
| Material Moving | 1 (25.0%) | 3 (75.0%) |
| Total (Category) | 10 (66.7%) | 5 (33.3%) |
| Total (Overall) | 77 (48.1%) | 83 (51.9%) |
Employment Industries by Sex in Kingsville
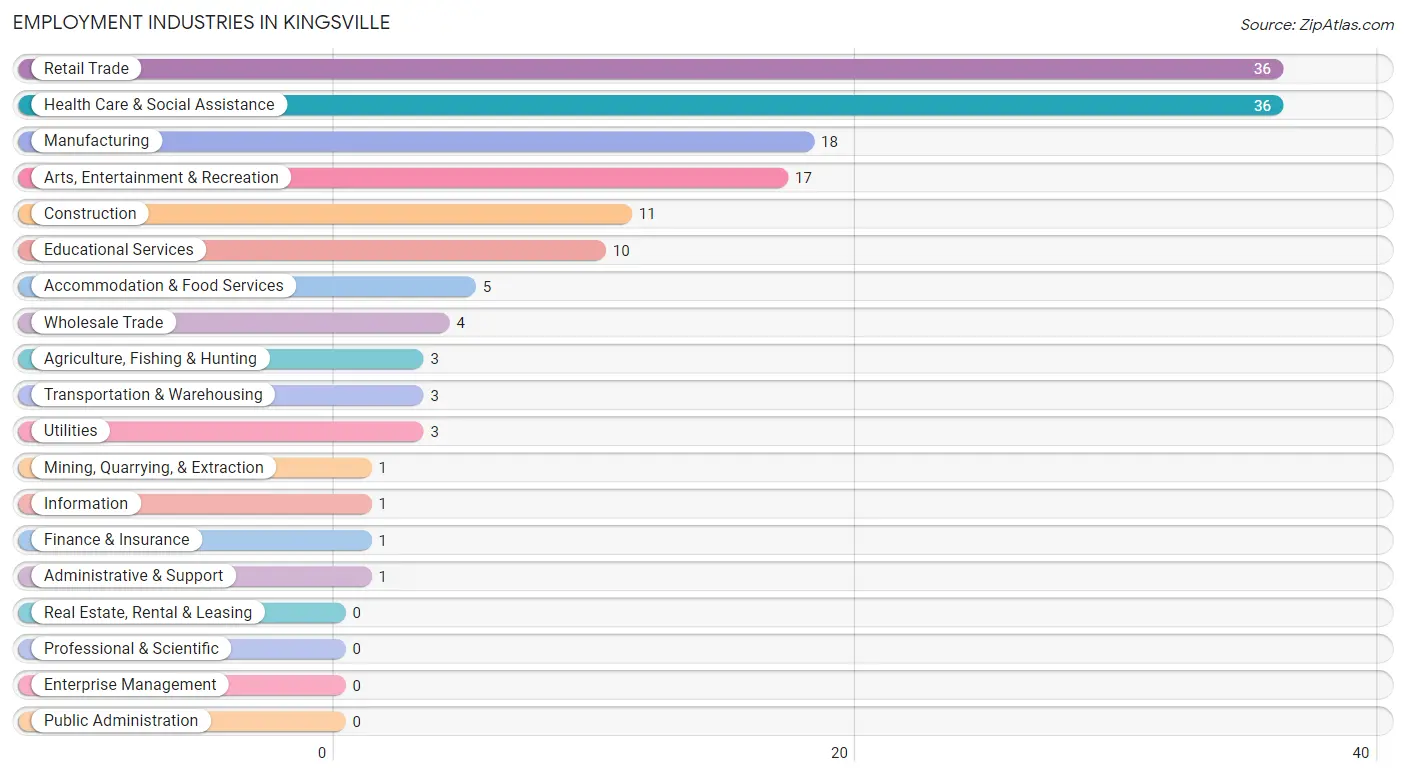
Employment Industries in Kingsville
The major employment industries in Kingsville include Retail Trade (36 | 22.5%), Health Care & Social Assistance (36 | 22.5%), Manufacturing (18 | 11.3%), Arts, Entertainment & Recreation (17 | 10.6%), and Construction (11 | 6.9%).
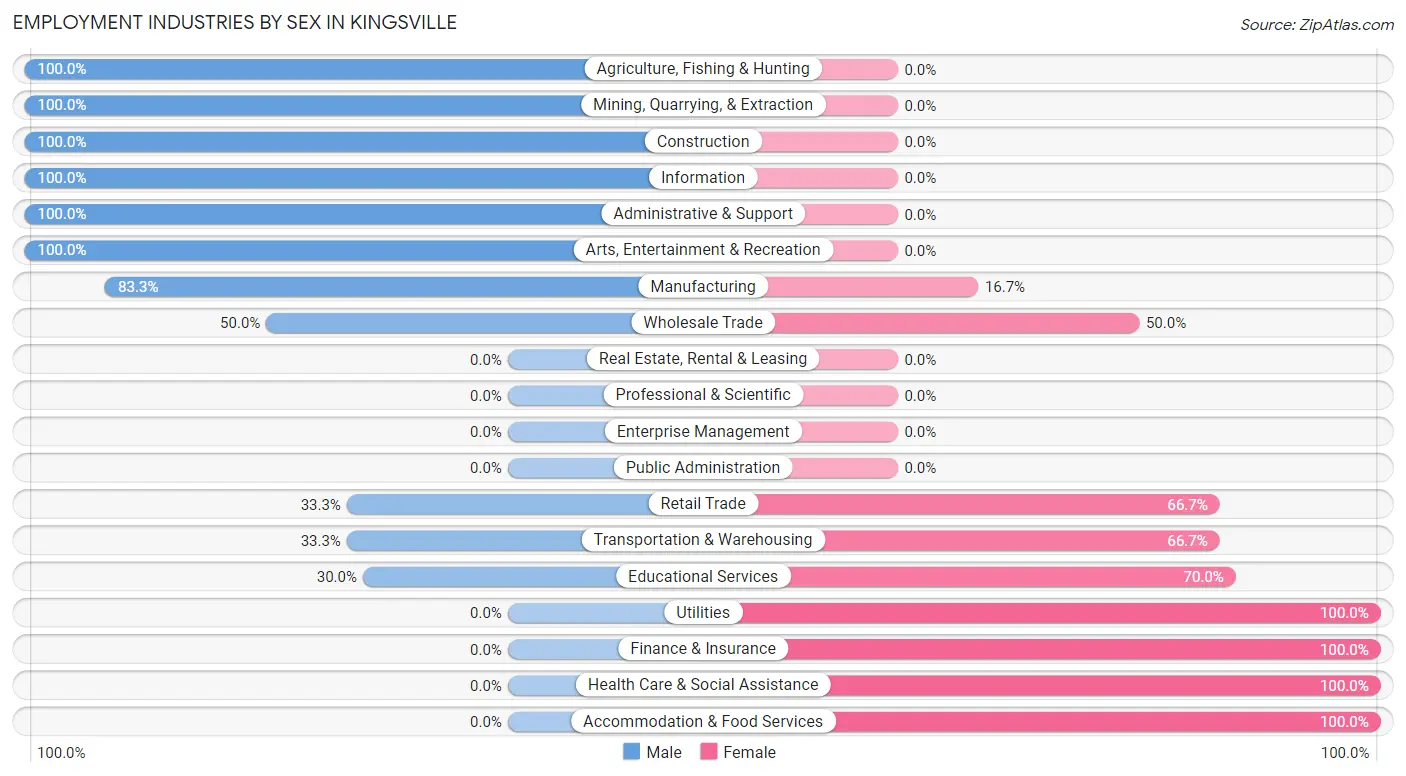
Employment Industries by Sex in Kingsville
The Kingsville industries that see more men than women are Agriculture, Fishing & Hunting (100.0%), Mining, Quarrying, & Extraction (100.0%), and Construction (100.0%), whereas the industries that tend to have a higher number of women are Utilities (100.0%), Finance & Insurance (100.0%), and Health Care & Social Assistance (100.0%).
| Industry | Male | Female |
| Agriculture, Fishing & Hunting | 3 (100.0%) | 0 (0.0%) |
| Mining, Quarrying, & Extraction | 1 (100.0%) | 0 (0.0%) |
| Construction | 11 (100.0%) | 0 (0.0%) |
| Manufacturing | 15 (83.3%) | 3 (16.7%) |
| Wholesale Trade | 2 (50.0%) | 2 (50.0%) |
| Retail Trade | 12 (33.3%) | 24 (66.7%) |
| Transportation & Warehousing | 1 (33.3%) | 2 (66.7%) |
| Utilities | 0 (0.0%) | 3 (100.0%) |
| Information | 1 (100.0%) | 0 (0.0%) |
| Finance & Insurance | 0 (0.0%) | 1 (100.0%) |
| Real Estate, Rental & Leasing | 0 (0.0%) | 0 (0.0%) |
| Professional & Scientific | 0 (0.0%) | 0 (0.0%) |
| Enterprise Management | 0 (0.0%) | 0 (0.0%) |
| Administrative & Support | 1 (100.0%) | 0 (0.0%) |
| Educational Services | 3 (30.0%) | 7 (70.0%) |
| Health Care & Social Assistance | 0 (0.0%) | 36 (100.0%) |
| Arts, Entertainment & Recreation | 17 (100.0%) | 0 (0.0%) |
| Accommodation & Food Services | 0 (0.0%) | 5 (100.0%) |
| Public Administration | 0 (0.0%) | 0 (0.0%) |
| Total | 77 (48.1%) | 83 (51.9%) |
Education in Kingsville
School Enrollment in Kingsville
The most common levels of schooling among the 105 students in Kingsville are elementary school (46 | 43.8%), high school (18 | 17.1%), and middle school (13 | 12.4%).
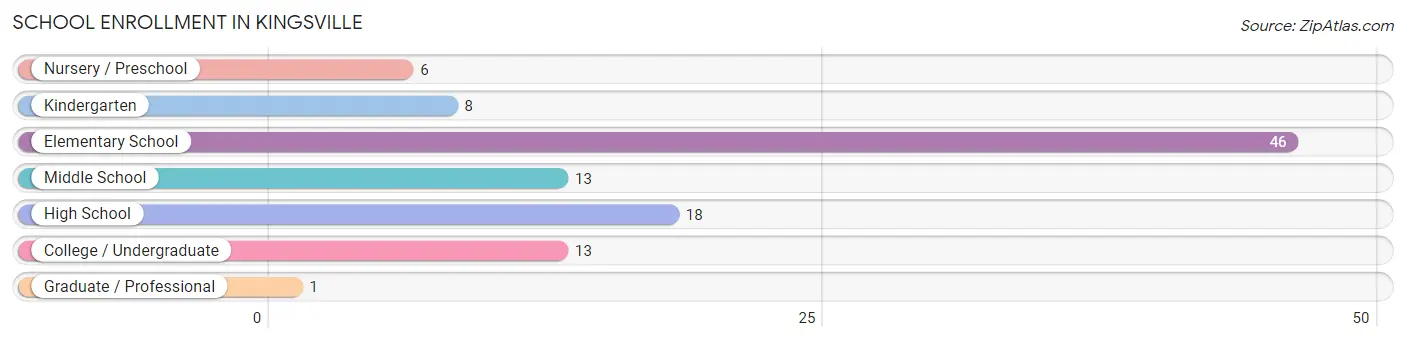
| School Level | # Students | % Students |
| Nursery / Preschool | 6 | 5.7% |
| Kindergarten | 8 | 7.6% |
| Elementary School | 46 | 43.8% |
| Middle School | 13 | 12.4% |
| High School | 18 | 17.1% |
| College / Undergraduate | 13 | 12.4% |
| Graduate / Professional | 1 | 0.9% |
| Total | 105 | 100.0% |
School Enrollment by Age by Funding Source in Kingsville
Out of a total of 105 students who are enrolled in schools in Kingsville, 12 (11.4%) attend a private institution, while the remaining 93 (88.6%) are enrolled in public schools. The age group of 3 to 4 year olds has the highest likelihood of being enrolled in private schools, with 4 (66.7% in the age bracket) enrolled. Conversely, the age group of 15 to 17 year olds has the lowest likelihood of being enrolled in a private school, with 18 (100.0% in the age bracket) attending a public institution.
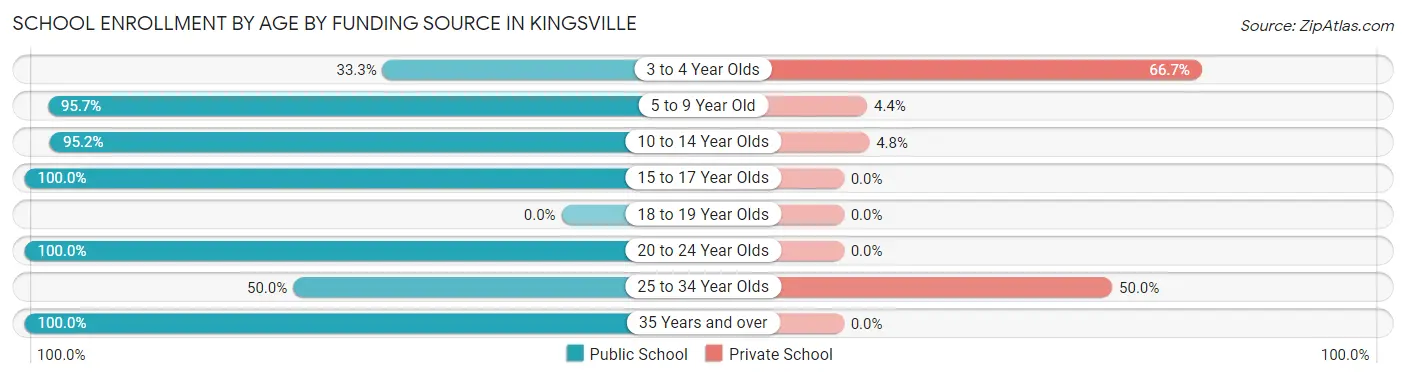
| Age Bracket | Public School | Private School |
| 3 to 4 Year Olds | 2 (33.3%) | 4 (66.7%) |
| 5 to 9 Year Old | 44 (95.7%) | 2 (4.3%) |
| 10 to 14 Year Olds | 20 (95.2%) | 1 (4.8%) |
| 15 to 17 Year Olds | 18 (100.0%) | 0 (0.0%) |
| 18 to 19 Year Olds | 0 (0.0%) | 0 (0.0%) |
| 20 to 24 Year Olds | 3 (100.0%) | 0 (0.0%) |
| 25 to 34 Year Olds | 5 (50.0%) | 5 (50.0%) |
| 35 Years and over | 1 (100.0%) | 0 (0.0%) |
| Total | 93 (88.6%) | 12 (11.4%) |
Educational Attainment by Field of Study in Kingsville
Education (29 | 78.4%), liberal arts & history (4 | 10.8%), multidisciplinary studies (3 | 8.1%), and science & technology (1 | 2.7%) are the most common fields of study among 37 individuals in Kingsville who have obtained a bachelor's degree or higher.
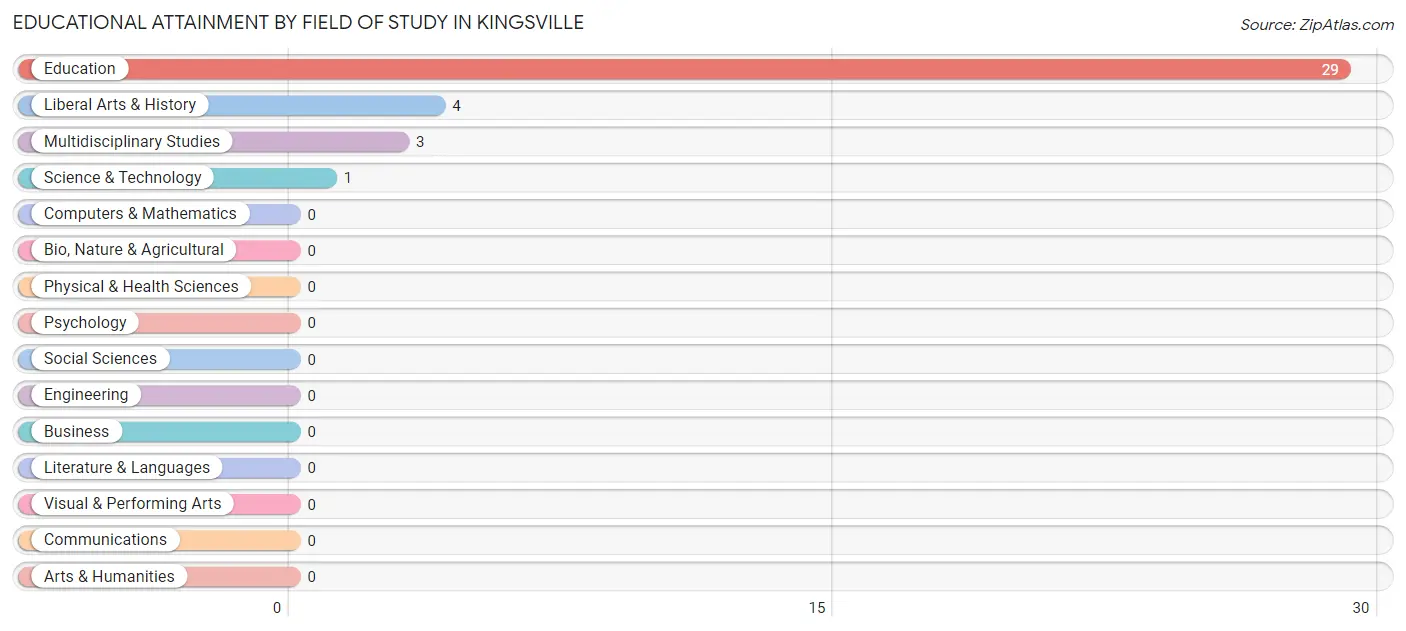
| Field of Study | # Graduates | % Graduates |
| Computers & Mathematics | 0 | 0.0% |
| Bio, Nature & Agricultural | 0 | 0.0% |
| Physical & Health Sciences | 0 | 0.0% |
| Psychology | 0 | 0.0% |
| Social Sciences | 0 | 0.0% |
| Engineering | 0 | 0.0% |
| Multidisciplinary Studies | 3 | 8.1% |
| Science & Technology | 1 | 2.7% |
| Business | 0 | 0.0% |
| Education | 29 | 78.4% |
| Literature & Languages | 0 | 0.0% |
| Liberal Arts & History | 4 | 10.8% |
| Visual & Performing Arts | 0 | 0.0% |
| Communications | 0 | 0.0% |
| Arts & Humanities | 0 | 0.0% |
| Total | 37 | 100.0% |
Transportation & Commute in Kingsville
Vehicle Availability by Sex in Kingsville
The most prevalent vehicle ownership categories in Kingsville are males with 2 vehicles (34, accounting for 44.2%) and females with 2 vehicles (37, making up 42.5%).
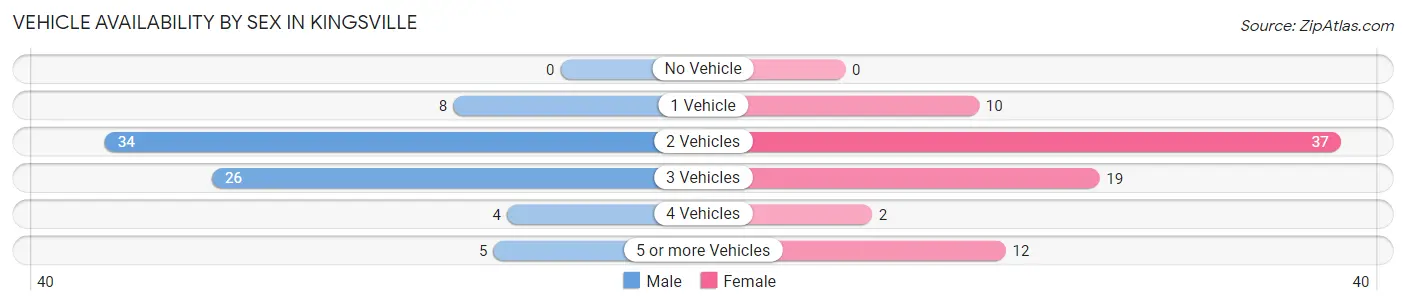
| Vehicles Available | Male | Female |
| No Vehicle | 0 (0.0%) | 0 (0.0%) |
| 1 Vehicle | 8 (10.4%) | 10 (12.5%) |
| 2 Vehicles | 34 (44.2%) | 37 (46.3%) |
| 3 Vehicles | 26 (33.8%) | 19 (23.7%) |
| 4 Vehicles | 4 (5.2%) | 2 (2.5%) |
| 5 or more Vehicles | 5 (6.5%) | 12 (15.0%) |
| Total | 77 (100.0%) | 80 (100.0%) |
Commute Time in Kingsville
The most frequently occuring commute durations in Kingsville are 45 to 59 minutes (38 commuters, 24.4%), 5 to 9 minutes (27 commuters, 17.3%), and 30 to 34 minutes (25 commuters, 16.0%).
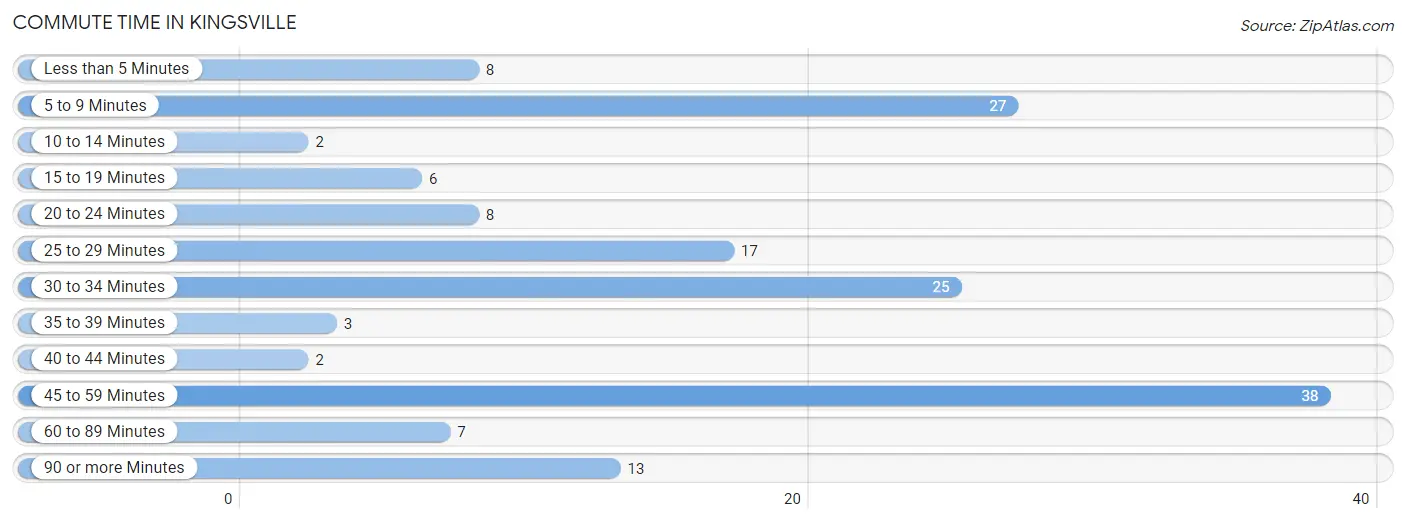
| Commute Time | # Commuters | % Commuters |
| Less than 5 Minutes | 8 | 5.1% |
| 5 to 9 Minutes | 27 | 17.3% |
| 10 to 14 Minutes | 2 | 1.3% |
| 15 to 19 Minutes | 6 | 3.8% |
| 20 to 24 Minutes | 8 | 5.1% |
| 25 to 29 Minutes | 17 | 10.9% |
| 30 to 34 Minutes | 25 | 16.0% |
| 35 to 39 Minutes | 3 | 1.9% |
| 40 to 44 Minutes | 2 | 1.3% |
| 45 to 59 Minutes | 38 | 24.4% |
| 60 to 89 Minutes | 7 | 4.5% |
| 90 or more Minutes | 13 | 8.3% |
Commute Time by Sex in Kingsville
The most common commute times in Kingsville are 45 to 59 minutes (21 commuters, 27.3%) for males and 5 to 9 minutes (24 commuters, 30.4%) for females.
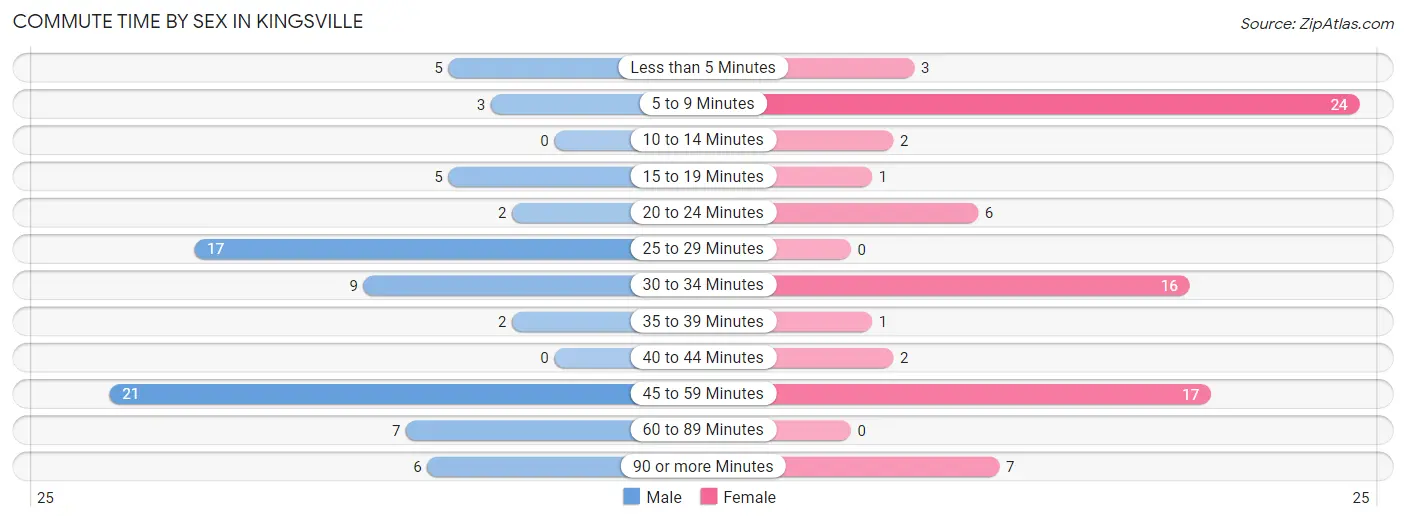
| Commute Time | Male | Female |
| Less than 5 Minutes | 5 (6.5%) | 3 (3.8%) |
| 5 to 9 Minutes | 3 (3.9%) | 24 (30.4%) |
| 10 to 14 Minutes | 0 (0.0%) | 2 (2.5%) |
| 15 to 19 Minutes | 5 (6.5%) | 1 (1.3%) |
| 20 to 24 Minutes | 2 (2.6%) | 6 (7.6%) |
| 25 to 29 Minutes | 17 (22.1%) | 0 (0.0%) |
| 30 to 34 Minutes | 9 (11.7%) | 16 (20.3%) |
| 35 to 39 Minutes | 2 (2.6%) | 1 (1.3%) |
| 40 to 44 Minutes | 0 (0.0%) | 2 (2.5%) |
| 45 to 59 Minutes | 21 (27.3%) | 17 (21.5%) |
| 60 to 89 Minutes | 7 (9.1%) | 0 (0.0%) |
| 90 or more Minutes | 6 (7.8%) | 7 (8.9%) |
Time of Departure to Work by Sex in Kingsville
The most frequent times of departure to work in Kingsville are 7:00 AM to 7:29 AM (25, 32.5%) for males and 12:00 PM to 3:59 PM (26, 32.9%) for females.
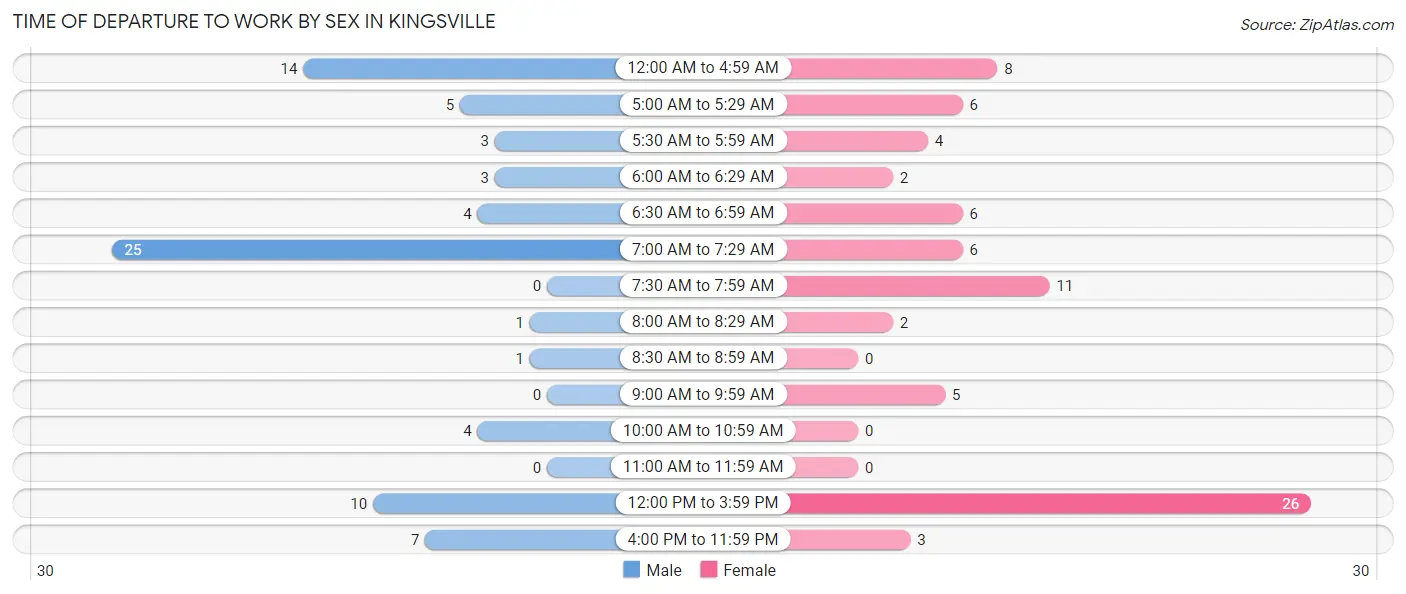
| Time of Departure | Male | Female |
| 12:00 AM to 4:59 AM | 14 (18.2%) | 8 (10.1%) |
| 5:00 AM to 5:29 AM | 5 (6.5%) | 6 (7.6%) |
| 5:30 AM to 5:59 AM | 3 (3.9%) | 4 (5.1%) |
| 6:00 AM to 6:29 AM | 3 (3.9%) | 2 (2.5%) |
| 6:30 AM to 6:59 AM | 4 (5.2%) | 6 (7.6%) |
| 7:00 AM to 7:29 AM | 25 (32.5%) | 6 (7.6%) |
| 7:30 AM to 7:59 AM | 0 (0.0%) | 11 (13.9%) |
| 8:00 AM to 8:29 AM | 1 (1.3%) | 2 (2.5%) |
| 8:30 AM to 8:59 AM | 1 (1.3%) | 0 (0.0%) |
| 9:00 AM to 9:59 AM | 0 (0.0%) | 5 (6.3%) |
| 10:00 AM to 10:59 AM | 4 (5.2%) | 0 (0.0%) |
| 11:00 AM to 11:59 AM | 0 (0.0%) | 0 (0.0%) |
| 12:00 PM to 3:59 PM | 10 (13.0%) | 26 (32.9%) |
| 4:00 PM to 11:59 PM | 7 (9.1%) | 3 (3.8%) |
| Total | 77 (100.0%) | 79 (100.0%) |
Housing Occupancy in Kingsville
Occupancy by Ownership in Kingsville
Of the total 121 dwellings in Kingsville, owner-occupied units account for 88 (72.7%), while renter-occupied units make up 33 (27.3%).
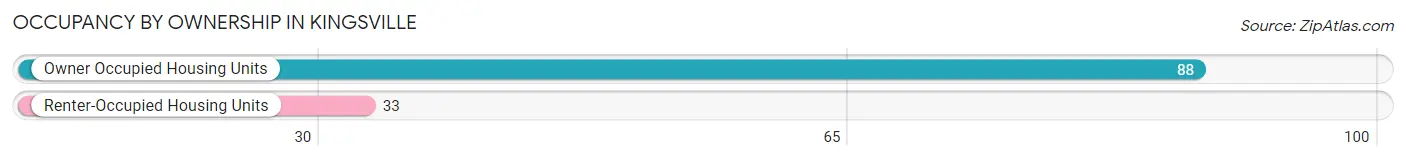
| Occupancy | # Housing Units | % Housing Units |
| Owner Occupied Housing Units | 88 | 72.7% |
| Renter-Occupied Housing Units | 33 | 27.3% |
| Total Occupied Housing Units | 121 | 100.0% |
Occupancy by Household Size in Kingsville
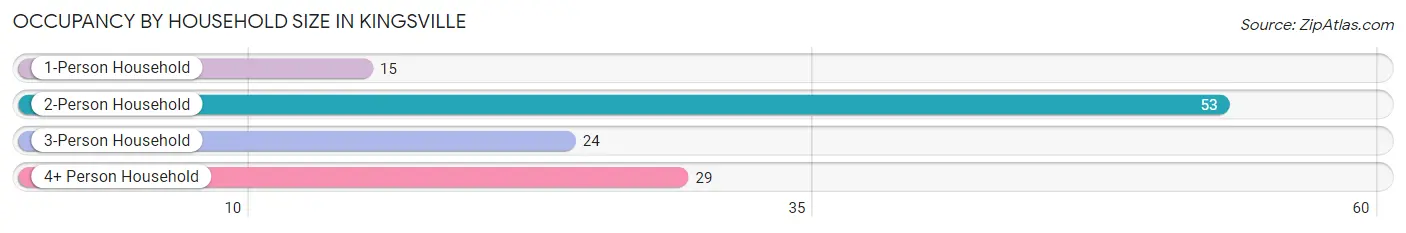
| Household Size | # Housing Units | % Housing Units |
| 1-Person Household | 15 | 12.4% |
| 2-Person Household | 53 | 43.8% |
| 3-Person Household | 24 | 19.8% |
| 4+ Person Household | 29 | 24.0% |
| Total Housing Units | 121 | 100.0% |
Occupancy by Ownership by Household Size in Kingsville
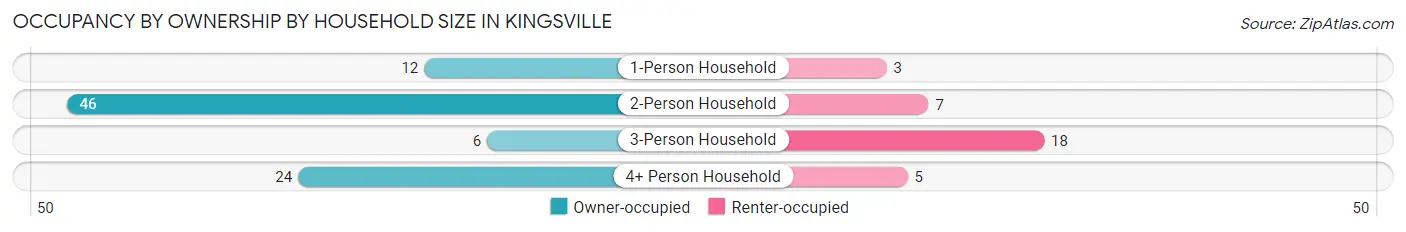
| Household Size | Owner-occupied | Renter-occupied |
| 1-Person Household | 12 (80.0%) | 3 (20.0%) |
| 2-Person Household | 46 (86.8%) | 7 (13.2%) |
| 3-Person Household | 6 (25.0%) | 18 (75.0%) |
| 4+ Person Household | 24 (82.8%) | 5 (17.2%) |
| Total Housing Units | 88 (72.7%) | 33 (27.3%) |
Occupancy by Educational Attainment in Kingsville
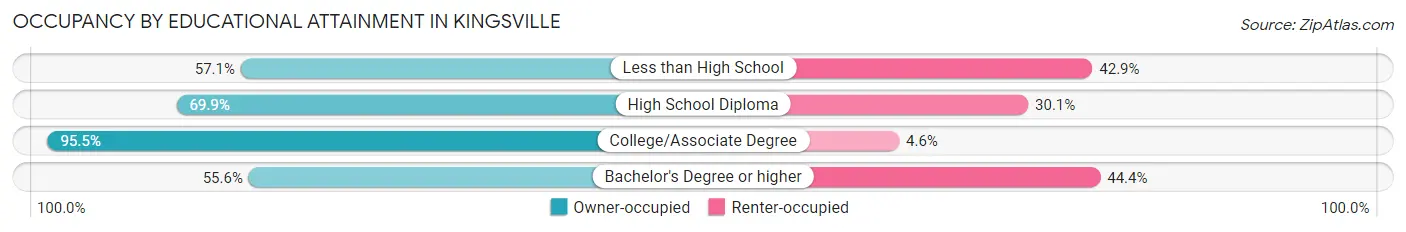
| Household Size | Owner-occupied | Renter-occupied |
| Less than High School | 4 (57.1%) | 3 (42.9%) |
| High School Diploma | 58 (69.9%) | 25 (30.1%) |
| College/Associate Degree | 21 (95.5%) | 1 (4.5%) |
| Bachelor's Degree or higher | 5 (55.6%) | 4 (44.4%) |
Occupancy by Age of Householder in Kingsville
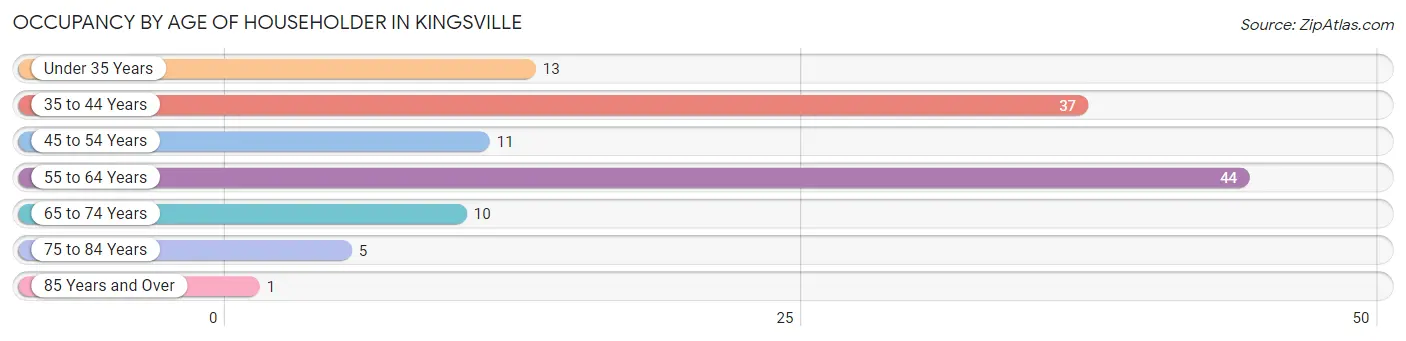
| Age Bracket | # Households | % Households |
| Under 35 Years | 13 | 10.7% |
| 35 to 44 Years | 37 | 30.6% |
| 45 to 54 Years | 11 | 9.1% |
| 55 to 64 Years | 44 | 36.4% |
| 65 to 74 Years | 10 | 8.3% |
| 75 to 84 Years | 5 | 4.1% |
| 85 Years and Over | 1 | 0.8% |
| Total | 121 | 100.0% |
Housing Finances in Kingsville
Median Income by Occupancy in Kingsville
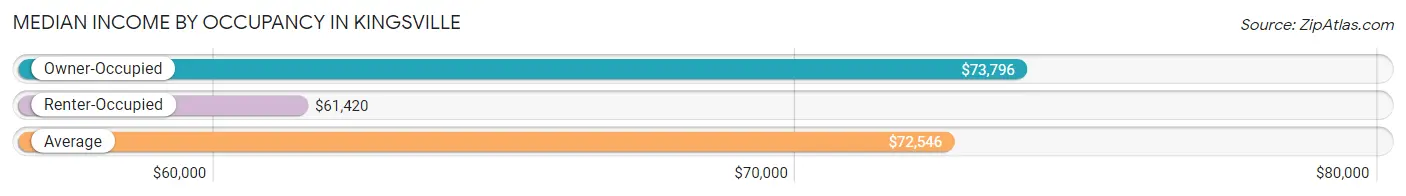
| Occupancy Type | # Households | Median Income |
| Owner-Occupied | 88 (72.7%) | $73,796 |
| Renter-Occupied | 33 (27.3%) | $61,420 |
| Average | 121 (100.0%) | $72,546 |
Occupancy by Householder Income Bracket in Kingsville
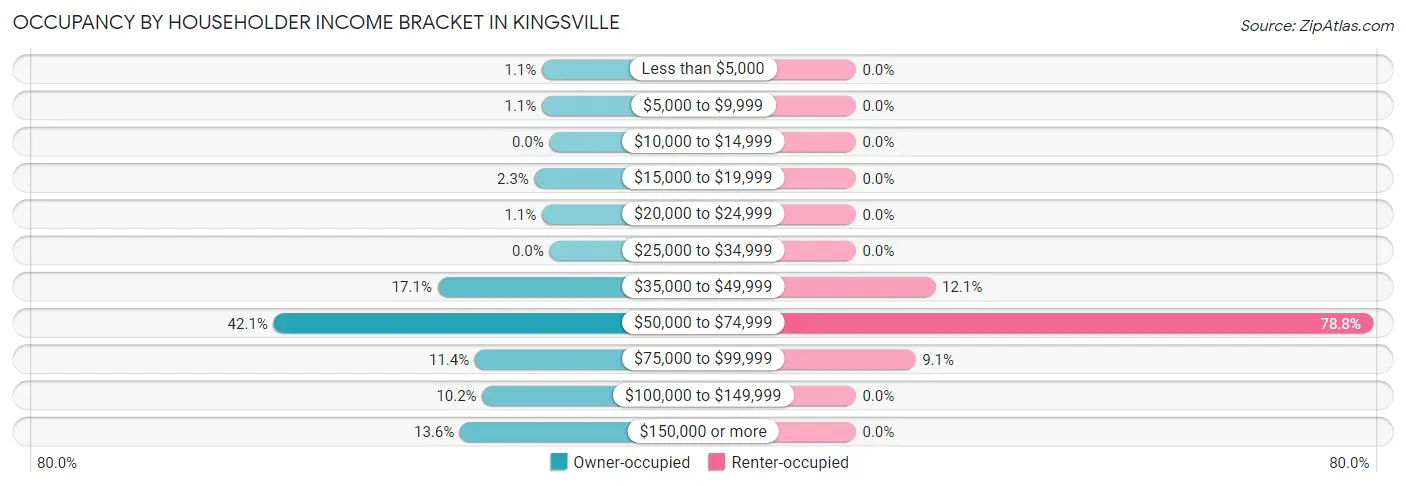
| Income Bracket | Owner-occupied | Renter-occupied |
| Less than $5,000 | 1 (1.1%) | 0 (0.0%) |
| $5,000 to $9,999 | 1 (1.1%) | 0 (0.0%) |
| $10,000 to $14,999 | 0 (0.0%) | 0 (0.0%) |
| $15,000 to $19,999 | 2 (2.3%) | 0 (0.0%) |
| $20,000 to $24,999 | 1 (1.1%) | 0 (0.0%) |
| $25,000 to $34,999 | 0 (0.0%) | 0 (0.0%) |
| $35,000 to $49,999 | 15 (17.1%) | 4 (12.1%) |
| $50,000 to $74,999 | 37 (42.0%) | 26 (78.8%) |
| $75,000 to $99,999 | 10 (11.4%) | 3 (9.1%) |
| $100,000 to $149,999 | 9 (10.2%) | 0 (0.0%) |
| $150,000 or more | 12 (13.6%) | 0 (0.0%) |
| Total | 88 (100.0%) | 33 (100.0%) |
Monthly Housing Cost Tiers in Kingsville
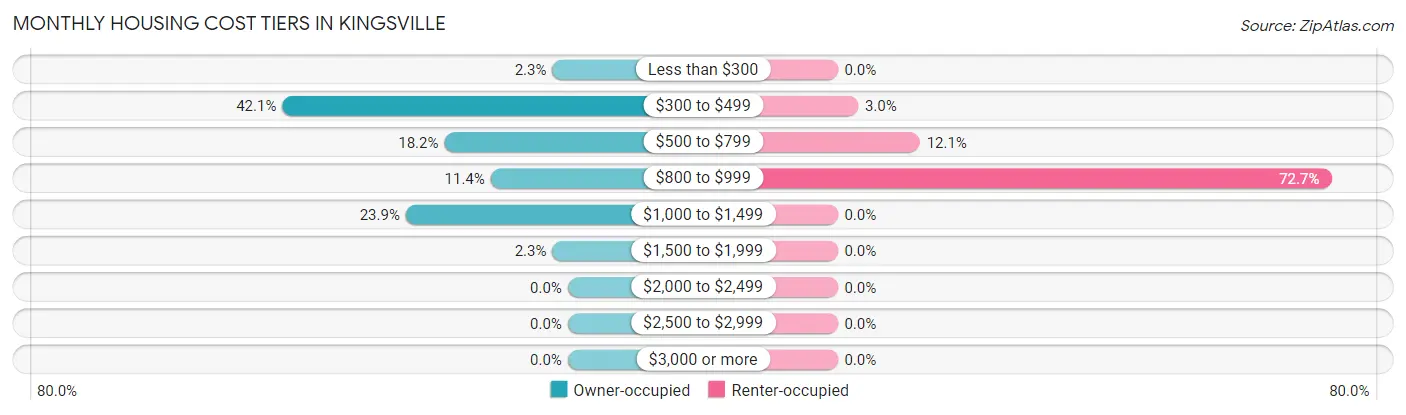
| Monthly Cost | Owner-occupied | Renter-occupied |
| Less than $300 | 2 (2.3%) | 0 (0.0%) |
| $300 to $499 | 37 (42.0%) | 1 (3.0%) |
| $500 to $799 | 16 (18.2%) | 4 (12.1%) |
| $800 to $999 | 10 (11.4%) | 24 (72.7%) |
| $1,000 to $1,499 | 21 (23.9%) | 0 (0.0%) |
| $1,500 to $1,999 | 2 (2.3%) | 0 (0.0%) |
| $2,000 to $2,499 | 0 (0.0%) | 0 (0.0%) |
| $2,500 to $2,999 | 0 (0.0%) | 0 (0.0%) |
| $3,000 or more | 0 (0.0%) | 0 (0.0%) |
| Total | 88 (100.0%) | 33 (100.0%) |
Physical Housing Characteristics in Kingsville
Housing Structures in Kingsville
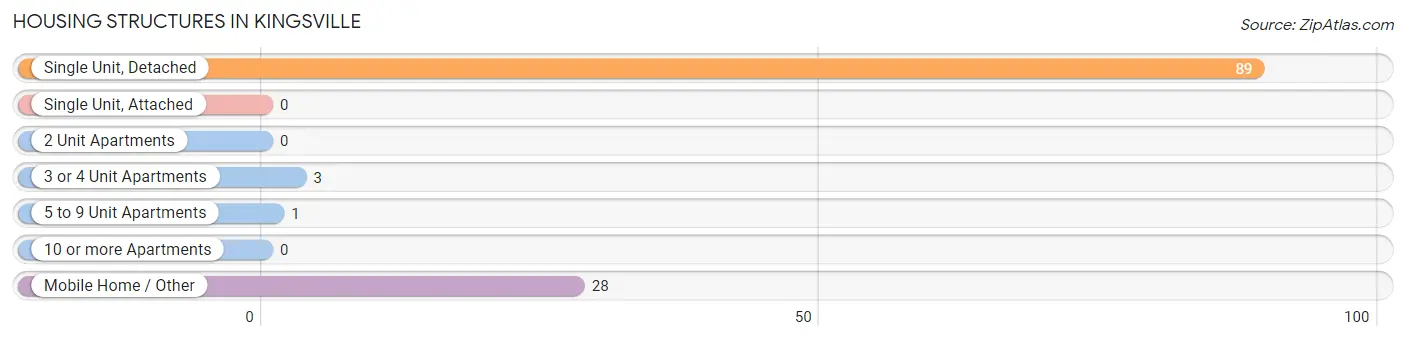
| Structure Type | # Housing Units | % Housing Units |
| Single Unit, Detached | 89 | 73.6% |
| Single Unit, Attached | 0 | 0.0% |
| 2 Unit Apartments | 0 | 0.0% |
| 3 or 4 Unit Apartments | 3 | 2.5% |
| 5 to 9 Unit Apartments | 1 | 0.8% |
| 10 or more Apartments | 0 | 0.0% |
| Mobile Home / Other | 28 | 23.1% |
| Total | 121 | 100.0% |
Housing Structures by Occupancy in Kingsville
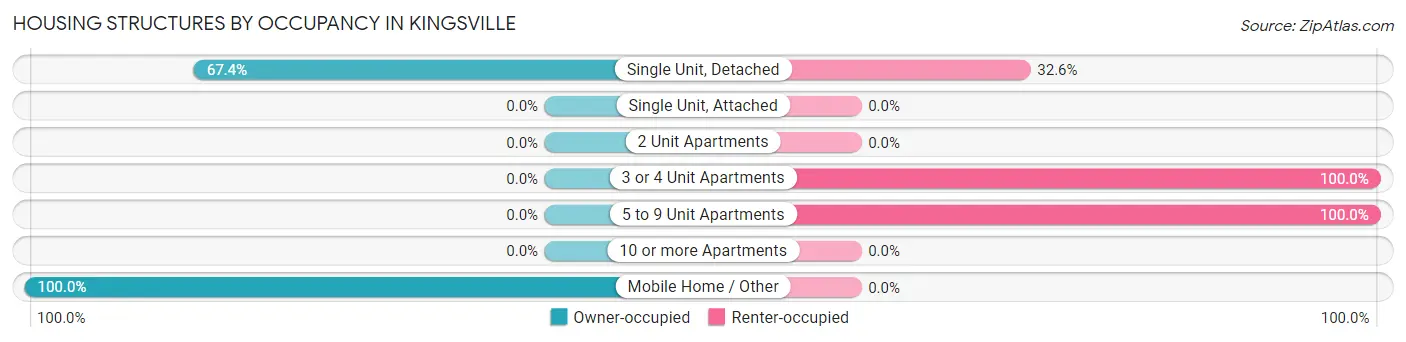
| Structure Type | Owner-occupied | Renter-occupied |
| Single Unit, Detached | 60 (67.4%) | 29 (32.6%) |
| Single Unit, Attached | 0 (0.0%) | 0 (0.0%) |
| 2 Unit Apartments | 0 (0.0%) | 0 (0.0%) |
| 3 or 4 Unit Apartments | 0 (0.0%) | 3 (100.0%) |
| 5 to 9 Unit Apartments | 0 (0.0%) | 1 (100.0%) |
| 10 or more Apartments | 0 (0.0%) | 0 (0.0%) |
| Mobile Home / Other | 28 (100.0%) | 0 (0.0%) |
| Total | 88 (72.7%) | 33 (27.3%) |
Housing Structures by Number of Rooms in Kingsville
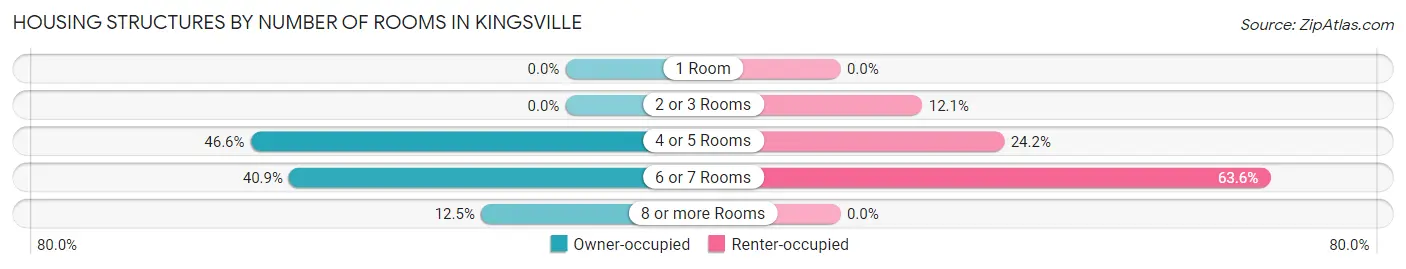
| Number of Rooms | Owner-occupied | Renter-occupied |
| 1 Room | 0 (0.0%) | 0 (0.0%) |
| 2 or 3 Rooms | 0 (0.0%) | 4 (12.1%) |
| 4 or 5 Rooms | 41 (46.6%) | 8 (24.2%) |
| 6 or 7 Rooms | 36 (40.9%) | 21 (63.6%) |
| 8 or more Rooms | 11 (12.5%) | 0 (0.0%) |
| Total | 88 (100.0%) | 33 (100.0%) |
Housing Structure by Heating Type in Kingsville
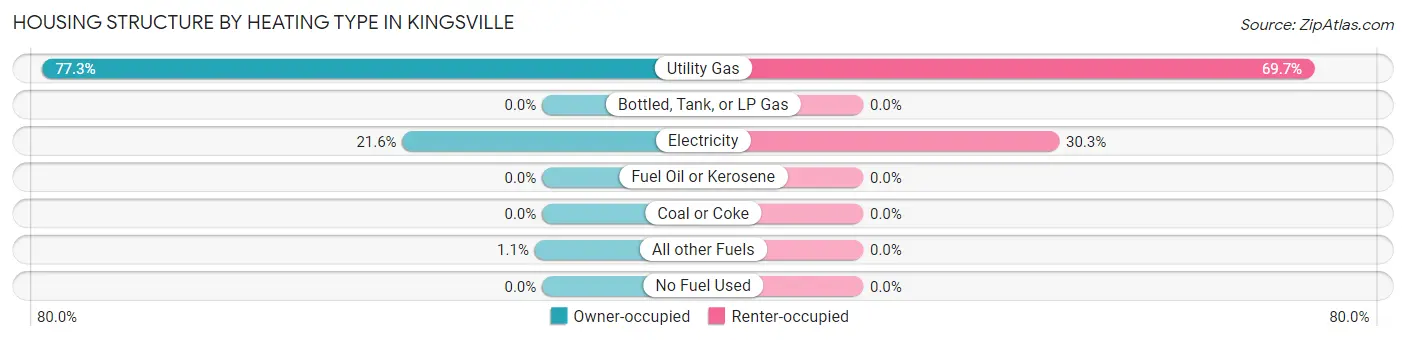
| Heating Type | Owner-occupied | Renter-occupied |
| Utility Gas | 68 (77.3%) | 23 (69.7%) |
| Bottled, Tank, or LP Gas | 0 (0.0%) | 0 (0.0%) |
| Electricity | 19 (21.6%) | 10 (30.3%) |
| Fuel Oil or Kerosene | 0 (0.0%) | 0 (0.0%) |
| Coal or Coke | 0 (0.0%) | 0 (0.0%) |
| All other Fuels | 1 (1.1%) | 0 (0.0%) |
| No Fuel Used | 0 (0.0%) | 0 (0.0%) |
| Total | 88 (100.0%) | 33 (100.0%) |
Household Vehicle Usage in Kingsville
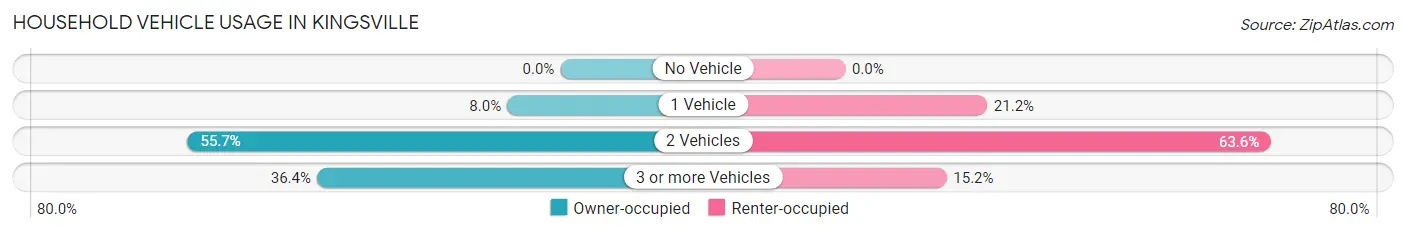
| Vehicles per Household | Owner-occupied | Renter-occupied |
| No Vehicle | 0 (0.0%) | 0 (0.0%) |
| 1 Vehicle | 7 (8.0%) | 7 (21.2%) |
| 2 Vehicles | 49 (55.7%) | 21 (63.6%) |
| 3 or more Vehicles | 32 (36.4%) | 5 (15.1%) |
| Total | 88 (100.0%) | 33 (100.0%) |
Real Estate & Mortgages in Kingsville
Real Estate and Mortgage Overview in Kingsville
| Characteristic | Without Mortgage | With Mortgage |
| Housing Units | 50 | 38 |
| Median Property Value | $97,400 | $130,600 |
| Median Household Income | $73,889 | $5 |
| Monthly Housing Costs | $460 | $0 |
| Real Estate Taxes | $1,284 | $0 |
Property Value by Mortgage Status in Kingsville
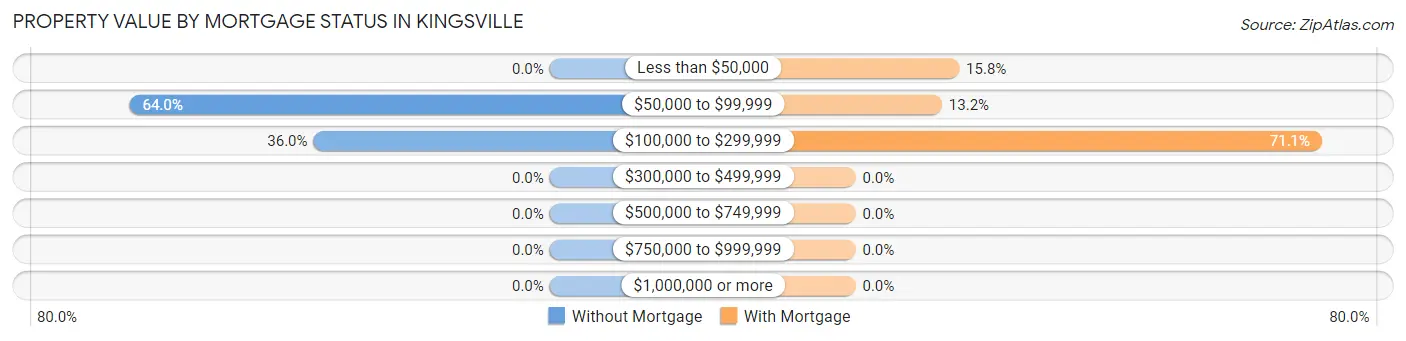
| Property Value | Without Mortgage | With Mortgage |
| Less than $50,000 | 0 (0.0%) | 6 (15.8%) |
| $50,000 to $99,999 | 32 (64.0%) | 5 (13.2%) |
| $100,000 to $299,999 | 18 (36.0%) | 27 (71.1%) |
| $300,000 to $499,999 | 0 (0.0%) | 0 (0.0%) |
| $500,000 to $749,999 | 0 (0.0%) | 0 (0.0%) |
| $750,000 to $999,999 | 0 (0.0%) | 0 (0.0%) |
| $1,000,000 or more | 0 (0.0%) | 0 (0.0%) |
| Total | 50 (100.0%) | 38 (100.0%) |
Household Income by Mortgage Status in Kingsville
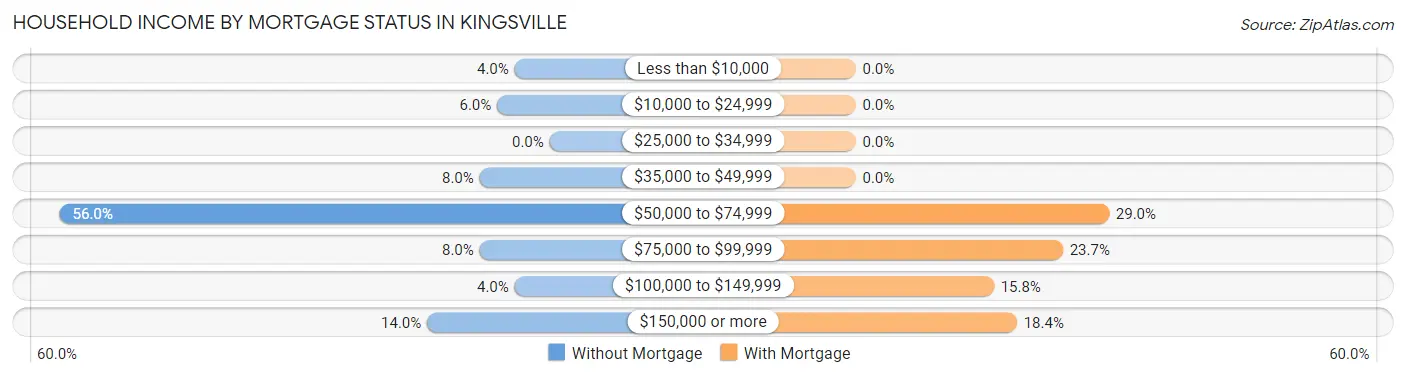
| Household Income | Without Mortgage | With Mortgage |
| Less than $10,000 | 2 (4.0%) | 0 (0.0%) |
| $10,000 to $24,999 | 3 (6.0%) | 0 (0.0%) |
| $25,000 to $34,999 | 0 (0.0%) | 0 (0.0%) |
| $35,000 to $49,999 | 4 (8.0%) | 0 (0.0%) |
| $50,000 to $74,999 | 28 (56.0%) | 11 (28.9%) |
| $75,000 to $99,999 | 4 (8.0%) | 9 (23.7%) |
| $100,000 to $149,999 | 2 (4.0%) | 6 (15.8%) |
| $150,000 or more | 7 (14.0%) | 7 (18.4%) |
| Total | 50 (100.0%) | 38 (100.0%) |
Property Value to Household Income Ratio in Kingsville
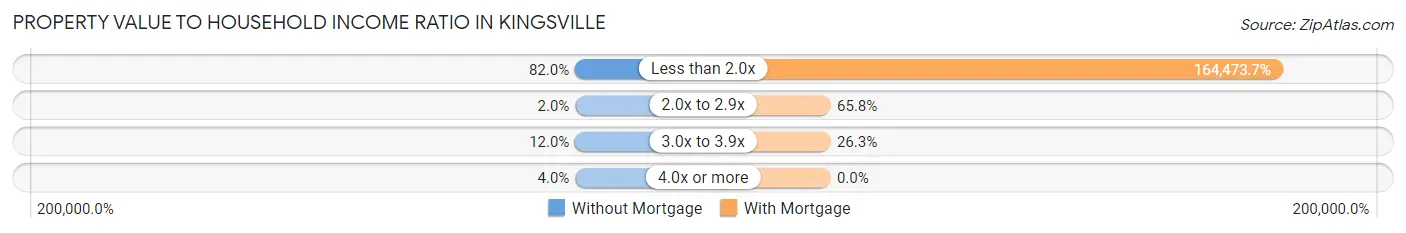
| Value-to-Income Ratio | Without Mortgage | With Mortgage |
| Less than 2.0x | 41 (82.0%) | 62,500 (164,473.7%) |
| 2.0x to 2.9x | 1 (2.0%) | 25 (65.8%) |
| 3.0x to 3.9x | 6 (12.0%) | 10 (26.3%) |
| 4.0x or more | 2 (4.0%) | 0 (0.0%) |
| Total | 50 (100.0%) | 38 (100.0%) |
Real Estate Taxes by Mortgage Status in Kingsville
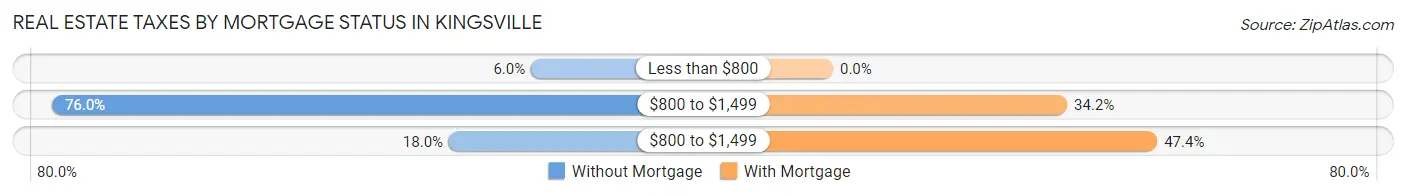
| Property Taxes | Without Mortgage | With Mortgage |
| Less than $800 | 3 (6.0%) | 0 (0.0%) |
| $800 to $1,499 | 38 (76.0%) | 13 (34.2%) |
| $800 to $1,499 | 9 (18.0%) | 18 (47.4%) |
| Total | 50 (100.0%) | 38 (100.0%) |
Health & Disability in Kingsville
Health Insurance Coverage by Age in Kingsville
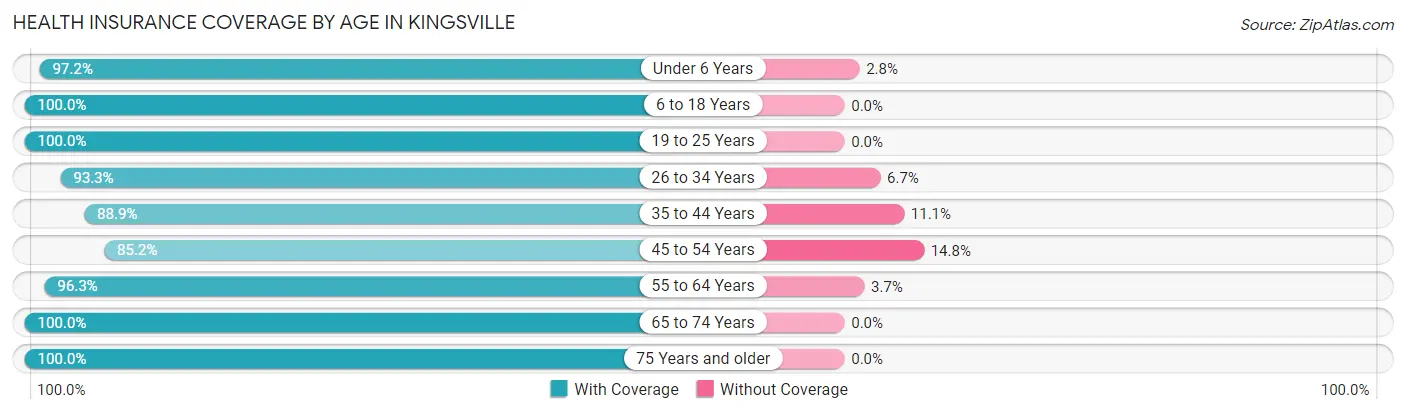
| Age Bracket | With Coverage | Without Coverage |
| Under 6 Years | 35 (97.2%) | 1 (2.8%) |
| 6 to 18 Years | 85 (100.0%) | 0 (0.0%) |
| 19 to 25 Years | 5 (100.0%) | 0 (0.0%) |
| 26 to 34 Years | 42 (93.3%) | 3 (6.7%) |
| 35 to 44 Years | 64 (88.9%) | 8 (11.1%) |
| 45 to 54 Years | 23 (85.2%) | 4 (14.8%) |
| 55 to 64 Years | 78 (96.3%) | 3 (3.7%) |
| 65 to 74 Years | 18 (100.0%) | 0 (0.0%) |
| 75 Years and older | 8 (100.0%) | 0 (0.0%) |
| Total | 358 (95.0%) | 19 (5.0%) |
Health Insurance Coverage by Citizenship Status in Kingsville
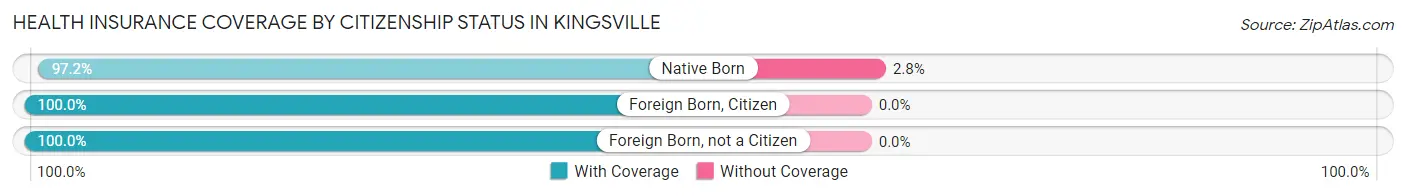
| Citizenship Status | With Coverage | Without Coverage |
| Native Born | 35 (97.2%) | 1 (2.8%) |
| Foreign Born, Citizen | 85 (100.0%) | 0 (0.0%) |
| Foreign Born, not a Citizen | 5 (100.0%) | 0 (0.0%) |
Health Insurance Coverage by Household Income in Kingsville
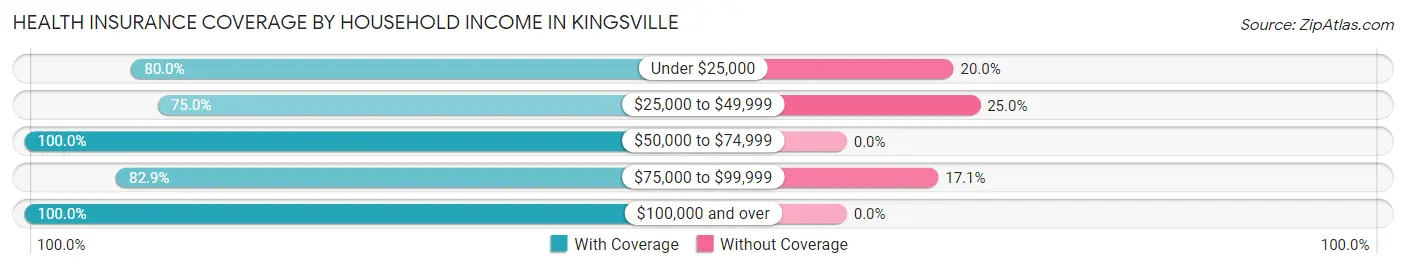
| Household Income | With Coverage | Without Coverage |
| Under $25,000 | 8 (80.0%) | 2 (20.0%) |
| $25,000 to $49,999 | 33 (75.0%) | 11 (25.0%) |
| $50,000 to $74,999 | 179 (100.0%) | 0 (0.0%) |
| $75,000 to $99,999 | 29 (82.9%) | 6 (17.1%) |
| $100,000 and over | 109 (100.0%) | 0 (0.0%) |
Public vs Private Health Insurance Coverage by Age in Kingsville
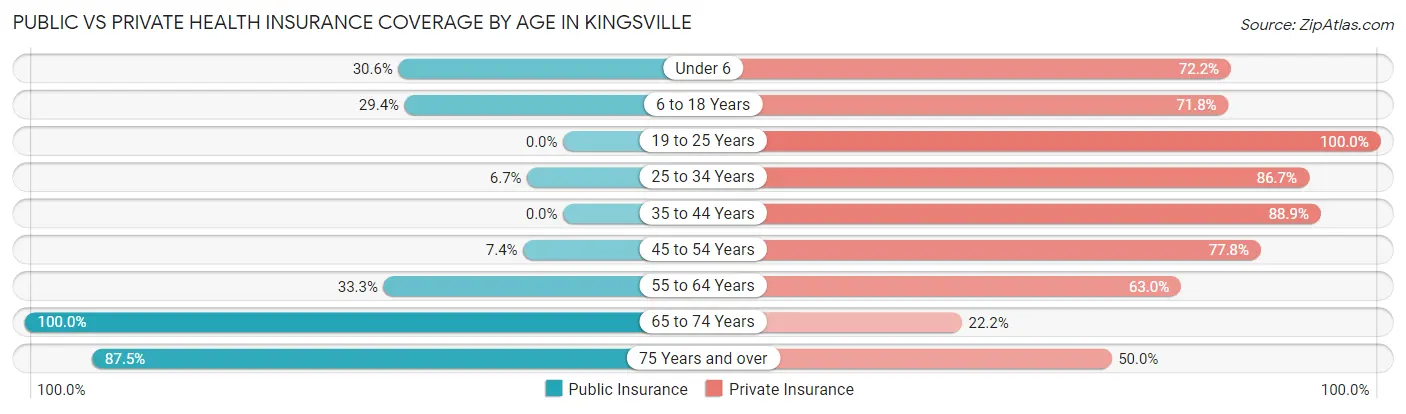
| Age Bracket | Public Insurance | Private Insurance |
| Under 6 | 11 (30.6%) | 26 (72.2%) |
| 6 to 18 Years | 25 (29.4%) | 61 (71.8%) |
| 19 to 25 Years | 0 (0.0%) | 5 (100.0%) |
| 25 to 34 Years | 3 (6.7%) | 39 (86.7%) |
| 35 to 44 Years | 0 (0.0%) | 64 (88.9%) |
| 45 to 54 Years | 2 (7.4%) | 21 (77.8%) |
| 55 to 64 Years | 27 (33.3%) | 51 (63.0%) |
| 65 to 74 Years | 18 (100.0%) | 4 (22.2%) |
| 75 Years and over | 7 (87.5%) | 4 (50.0%) |
| Total | 93 (24.7%) | 275 (72.9%) |
Disability Status by Sex by Age in Kingsville
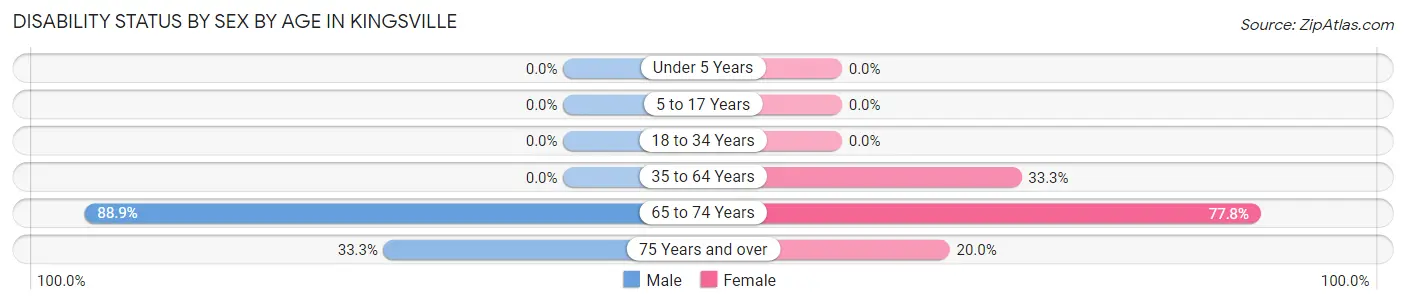
| Age Bracket | Male | Female |
| Under 5 Years | 0 (0.0%) | 0 (0.0%) |
| 5 to 17 Years | 0 (0.0%) | 0 (0.0%) |
| 18 to 34 Years | 0 (0.0%) | 0 (0.0%) |
| 35 to 64 Years | 0 (0.0%) | 30 (33.3%) |
| 65 to 74 Years | 8 (88.9%) | 7 (77.8%) |
| 75 Years and over | 1 (33.3%) | 1 (20.0%) |
Disability Class by Sex by Age in Kingsville
Disability Class: Hearing Difficulty
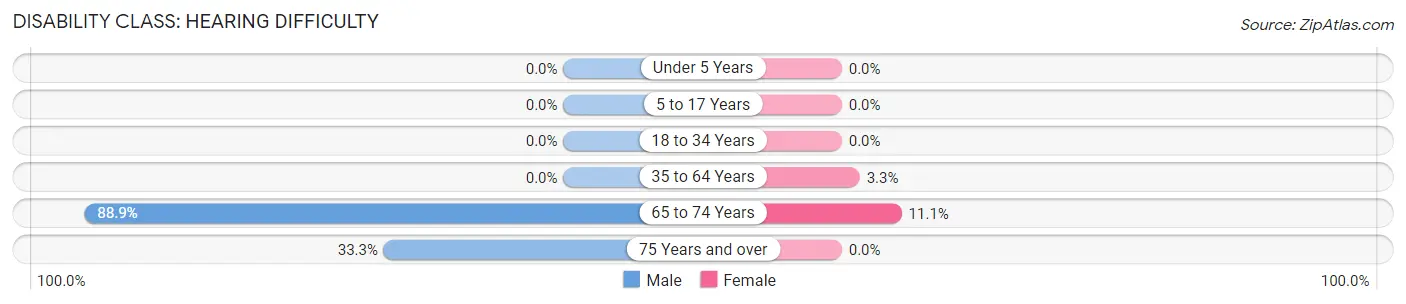
| Age Bracket | Male | Female |
| Under 5 Years | 0 (0.0%) | 0 (0.0%) |
| 5 to 17 Years | 0 (0.0%) | 0 (0.0%) |
| 18 to 34 Years | 0 (0.0%) | 0 (0.0%) |
| 35 to 64 Years | 0 (0.0%) | 3 (3.3%) |
| 65 to 74 Years | 8 (88.9%) | 1 (11.1%) |
| 75 Years and over | 1 (33.3%) | 0 (0.0%) |
Disability Class: Vision Difficulty
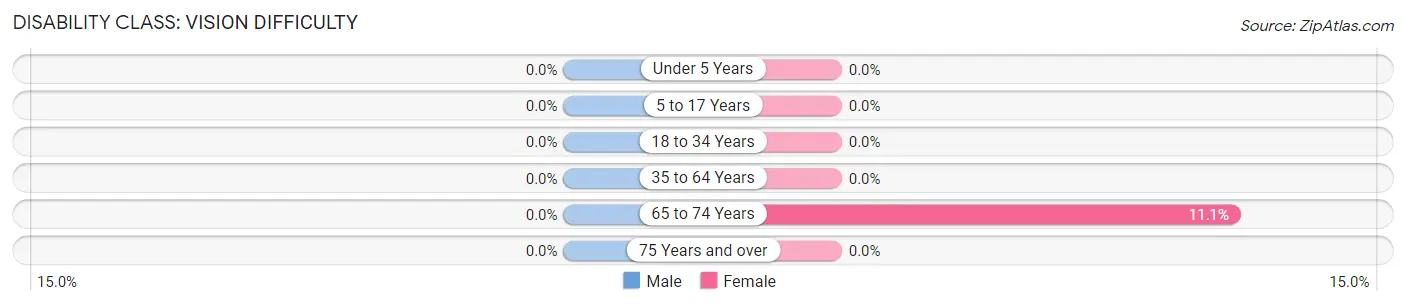
| Age Bracket | Male | Female |
| Under 5 Years | 0 (0.0%) | 0 (0.0%) |
| 5 to 17 Years | 0 (0.0%) | 0 (0.0%) |
| 18 to 34 Years | 0 (0.0%) | 0 (0.0%) |
| 35 to 64 Years | 0 (0.0%) | 0 (0.0%) |
| 65 to 74 Years | 0 (0.0%) | 1 (11.1%) |
| 75 Years and over | 0 (0.0%) | 0 (0.0%) |
Disability Class: Cognitive Difficulty
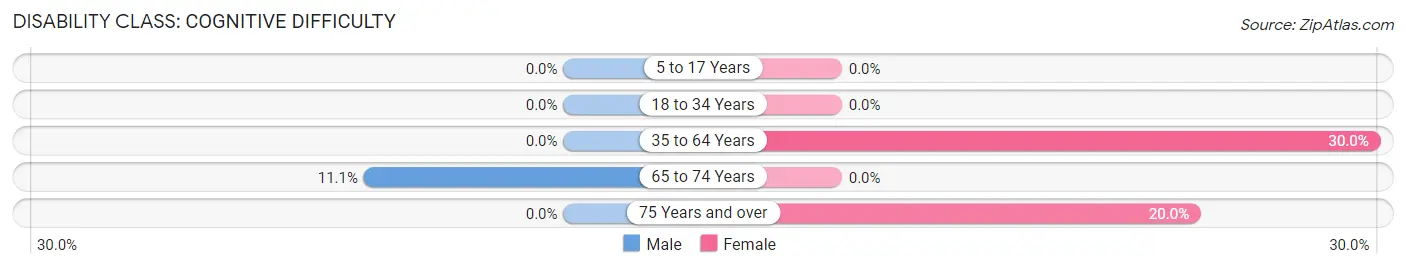
| Age Bracket | Male | Female |
| 5 to 17 Years | 0 (0.0%) | 0 (0.0%) |
| 18 to 34 Years | 0 (0.0%) | 0 (0.0%) |
| 35 to 64 Years | 0 (0.0%) | 27 (30.0%) |
| 65 to 74 Years | 1 (11.1%) | 0 (0.0%) |
| 75 Years and over | 0 (0.0%) | 1 (20.0%) |
Disability Class: Ambulatory Difficulty
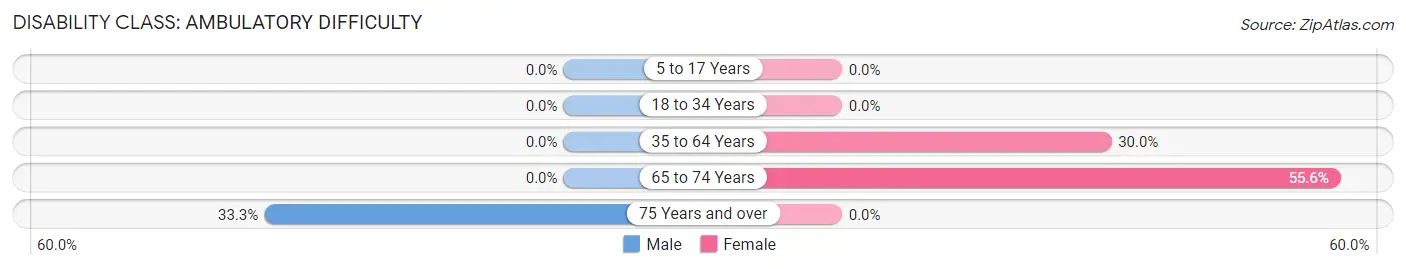
| Age Bracket | Male | Female |
| 5 to 17 Years | 0 (0.0%) | 0 (0.0%) |
| 18 to 34 Years | 0 (0.0%) | 0 (0.0%) |
| 35 to 64 Years | 0 (0.0%) | 27 (30.0%) |
| 65 to 74 Years | 0 (0.0%) | 5 (55.6%) |
| 75 Years and over | 1 (33.3%) | 0 (0.0%) |
Disability Class: Self-Care Difficulty
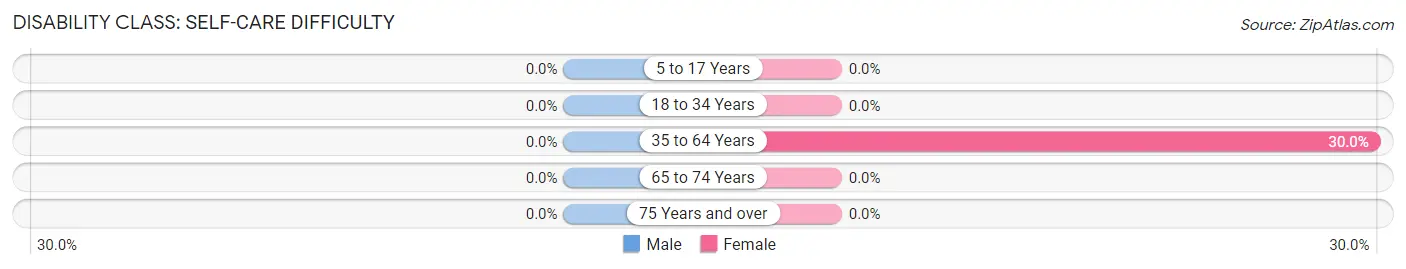
| Age Bracket | Male | Female |
| 5 to 17 Years | 0 (0.0%) | 0 (0.0%) |
| 18 to 34 Years | 0 (0.0%) | 0 (0.0%) |
| 35 to 64 Years | 0 (0.0%) | 27 (30.0%) |
| 65 to 74 Years | 0 (0.0%) | 0 (0.0%) |
| 75 Years and over | 0 (0.0%) | 0 (0.0%) |
Technology Access in Kingsville
Computing Device Access in Kingsville
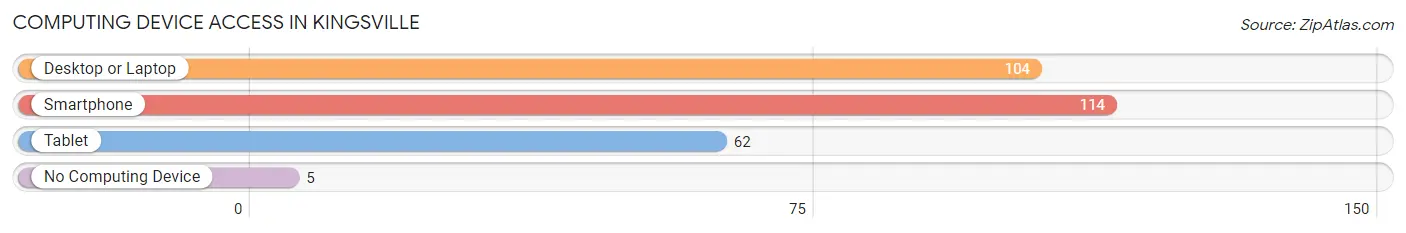
| Device Type | # Households | % Households |
| Desktop or Laptop | 104 | 86.0% |
| Smartphone | 114 | 94.2% |
| Tablet | 62 | 51.2% |
| No Computing Device | 5 | 4.1% |
| Total | 121 | 100.0% |
Internet Access in Kingsville
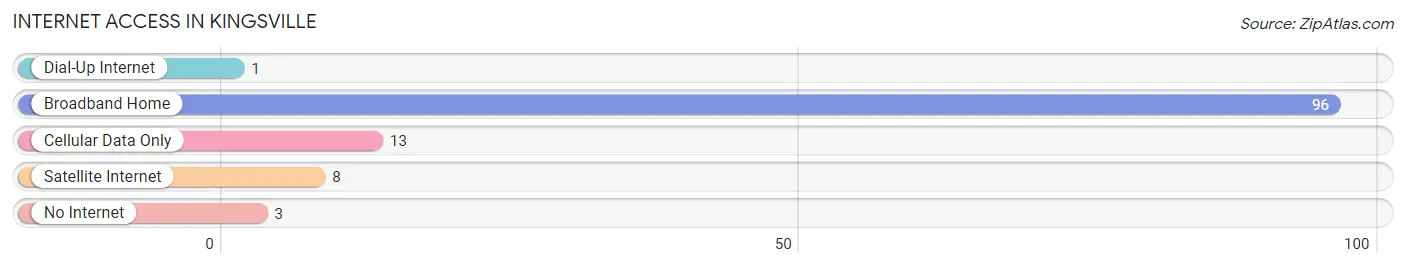
| Internet Type | # Households | % Households |
| Dial-Up Internet | 1 | 0.8% |
| Broadband Home | 96 | 79.3% |
| Cellular Data Only | 13 | 10.7% |
| Satellite Internet | 8 | 6.6% |
| No Internet | 3 | 2.5% |
| Total | 121 | 100.0% |
Kingsville Summary
History
The small town of Kingsville, Missouri is located in Johnson County, approximately 30 miles southeast of Kansas City. The town was founded in 1871 by a group of settlers from Kentucky, led by William King. The town was originally known as King’s Station, but was later changed to Kingsville. The town was officially incorporated in 1876.
The town was originally a farming community, with the main crops being corn, wheat, and hay. The town also had a few small businesses, including a general store, a blacksmith shop, and a post office. In the late 1800s, the town began to grow and prosper, with the addition of a railroad line and a new school.
In the early 1900s, the town continued to grow, with the addition of a bank, a hotel, and a newspaper. The town also had a thriving business district, with several stores and businesses. The town was also home to several churches, including the Methodist, Baptist, and Presbyterian churches.
In the 1920s, the town began to decline, as the railroad line was abandoned and the businesses began to close. The town was also hit hard by the Great Depression, and many of the businesses closed. The town was able to survive, however, and by the 1950s, the town had begun to recover.
The town continued to grow in the 1960s and 1970s, with the addition of a new school and several new businesses. The town also had a thriving business district, with several stores and businesses. The town was also home to several churches, including the Methodist, Baptist, and Presbyterian churches.
In the 1980s, the town began to decline again, as the businesses began to close and the population began to decline. The town was able to survive, however, and by the 1990s, the town had begun to recover. The town has continued to grow in recent years, with the addition of several new businesses and a new school.
Geography
Kingsville is located in Johnson County, Missouri, approximately 30 miles southeast of Kansas City. The town is situated on the banks of the Missouri River, and is surrounded by rolling hills and farmland. The town is located in the Ozark Mountains, and is home to several small lakes and streams.
The town has a total area of 1.2 square miles, all of which is land. The town has a humid continental climate, with hot summers and cold winters. The average annual temperature is around 54 degrees Fahrenheit, and the average annual precipitation is around 40 inches.
Economy
The economy of Kingsville is largely based on agriculture. The town is home to several farms, which produce corn, wheat, hay, and other crops. The town also has several small businesses, including a general store, a blacksmith shop, and a post office. The town also has several churches, which provide employment for local residents.
The town is also home to several manufacturing companies, which produce a variety of products, including furniture, clothing, and electronics. The town also has several restaurants, which provide employment for local residents.
Demographics
As of the 2010 census, the population of Kingsville was 1,845. The town has a population density of 1,521 people per square mile. The median age of the population is 43.7 years, and the median household income is $41,250.
The town is predominantly white, with 92.3% of the population being white. The town also has a small Hispanic population, with 4.2% of the population being Hispanic. The town also has a small African American population, with 1.3% of the population being African American.
Conclusion
Kingsville, Missouri is a small town located in Johnson County, approximately 30 miles southeast of Kansas City. The town was founded in 1871 by a group of settlers from Kentucky, and was originally known as King’s Station. The town was officially incorporated in 1876. The town has a population of 1,845, and has a humid continental climate, with hot summers and cold winters. The economy of the town is largely based on agriculture, and the town also has several small businesses, churches, and manufacturing companies. The town is predominantly white, with 92.3% of the population being white.
Common Questions
What is Per Capita Income in Kingsville?
Per Capita income in Kingsville is $25,769.
What is the Median Family Income in Kingsville?
Median Family Income in Kingsville is $73,796.
What is the Median Household income in Kingsville?
Median Household Income in Kingsville is $72,546.
What is Income or Wage Gap in Kingsville?
Income or Wage Gap in Kingsville is 39.0%.
Women in Kingsville earn 61.0 cents for every dollar earned by a man.
What is Inequality or Gini Index in Kingsville?
Inequality or Gini Index in Kingsville is 0.31.
What is the Total Population of Kingsville?
Total Population of Kingsville is 377.
What is the Total Male Population of Kingsville?
Total Male Population of Kingsville is 178.
What is the Total Female Population of Kingsville?
Total Female Population of Kingsville is 199.
What is the Ratio of Males per 100 Females in Kingsville?
There are 89.45 Males per 100 Females in Kingsville.
What is the Ratio of Females per 100 Males in Kingsville?
There are 111.80 Females per 100 Males in Kingsville.
What is the Median Population Age in Kingsville?
Median Population Age in Kingsville is 38.1 Years.
What is the Average Family Size in Kingsville
Average Family Size in Kingsville is 3.4 People.
What is the Average Household Size in Kingsville
Average Household Size in Kingsville is 3.1 People.
How Large is the Labor Force in Kingsville?
There are 166 People in the Labor Forcein in Kingsville.
What is the Percentage of People in the Labor Force in Kingsville?
63.1% of People are in the Labor Force in Kingsville.
What is the Unemployment Rate in Kingsville?
Unemployment Rate in Kingsville is 3.6%.