Zip Codes with the Highest Percentage of Population Employed in Transportation in Independence, MO
RELATED REPORTS & OPTIONS
Transportation
Independence
Compare Zip Codes
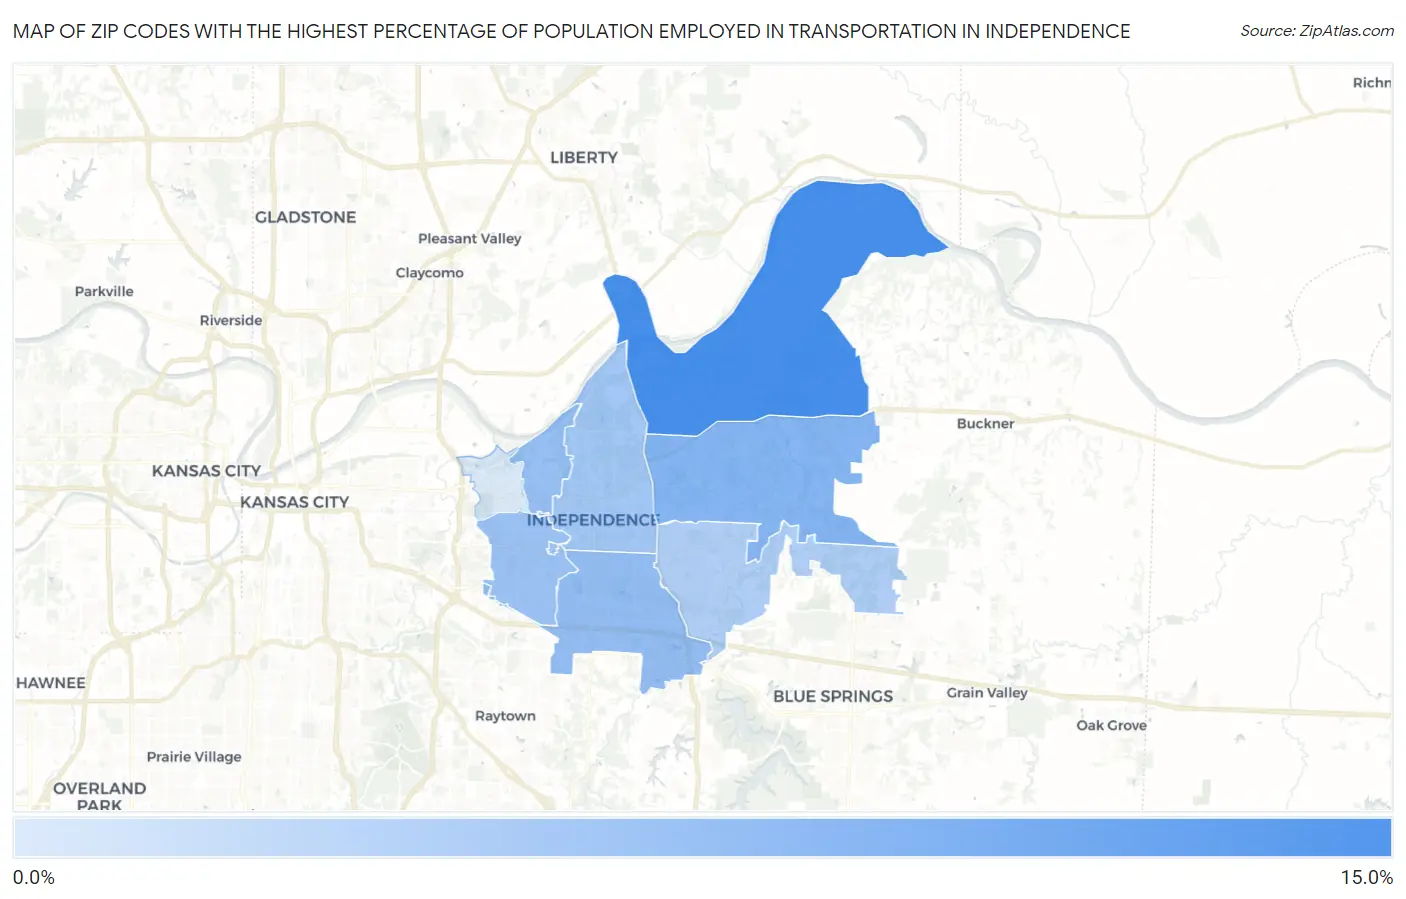
Map of Zip Codes with the Highest Percentage of Population Employed in Transportation in Independence
0.0%
15.0%
Zip Codes with the Highest Percentage of Population Employed in Transportation in Independence, MO
| Zip Code | % Employed | vs State | vs National | |
| 1. | 64058 | 10.7% | 3.9%(+6.78)#87 | 3.8%(+6.89)#2,011 |
| 2. | 64056 | 7.1% | 3.9%(+3.18)#210 | 3.8%(+3.28)#5,163 |
| 3. | 64055 | 6.2% | 3.9%(+2.29)#270 | 3.8%(+2.39)#6,861 |
| 4. | 64054 | 6.0% | 3.9%(+2.04)#294 | 3.8%(+2.14)#7,470 |
| 5. | 64052 | 5.9% | 3.9%(+1.94)#303 | 3.8%(+2.04)#7,745 |
| 6. | 64050 | 5.4% | 3.9%(+1.50)#347 | 3.8%(+1.60)#8,994 |
| 7. | 64057 | 4.7% | 3.9%(+0.825)#413 | 3.8%(+0.927)#11,310 |
| 8. | 64053 | 2.1% | 3.9%(-1.78)#726 | 3.8%(-1.68)#23,126 |
1
Common Questions
What are the Top 5 Zip Codes with the Highest Percentage of Population Employed in Transportation in Independence, MO?
Top 5 Zip Codes with the Highest Percentage of Population Employed in Transportation in Independence, MO are:
What zip code has the Highest Percentage of Population Employed in Transportation in Independence, MO?
64058 has the Highest Percentage of Population Employed in Transportation in Independence, MO with 10.7%.
What is the Percentage of Population Employed in Transportation in Independence, MO?
Percentage of Population Employed in Transportation in Independence is 5.7%.
What is the Percentage of Population Employed in Transportation in Missouri?
Percentage of Population Employed in Transportation in Missouri is 3.9%.
What is the Percentage of Population Employed in Transportation in the United States?
Percentage of Population Employed in Transportation in the United States is 3.8%.