Zip Codes with the Highest Percentage of Renter-Occupied Units in Independence, MO
RELATED REPORTS & OPTIONS
Highest Renter-Occupied
Independence
Compare Zip Codes
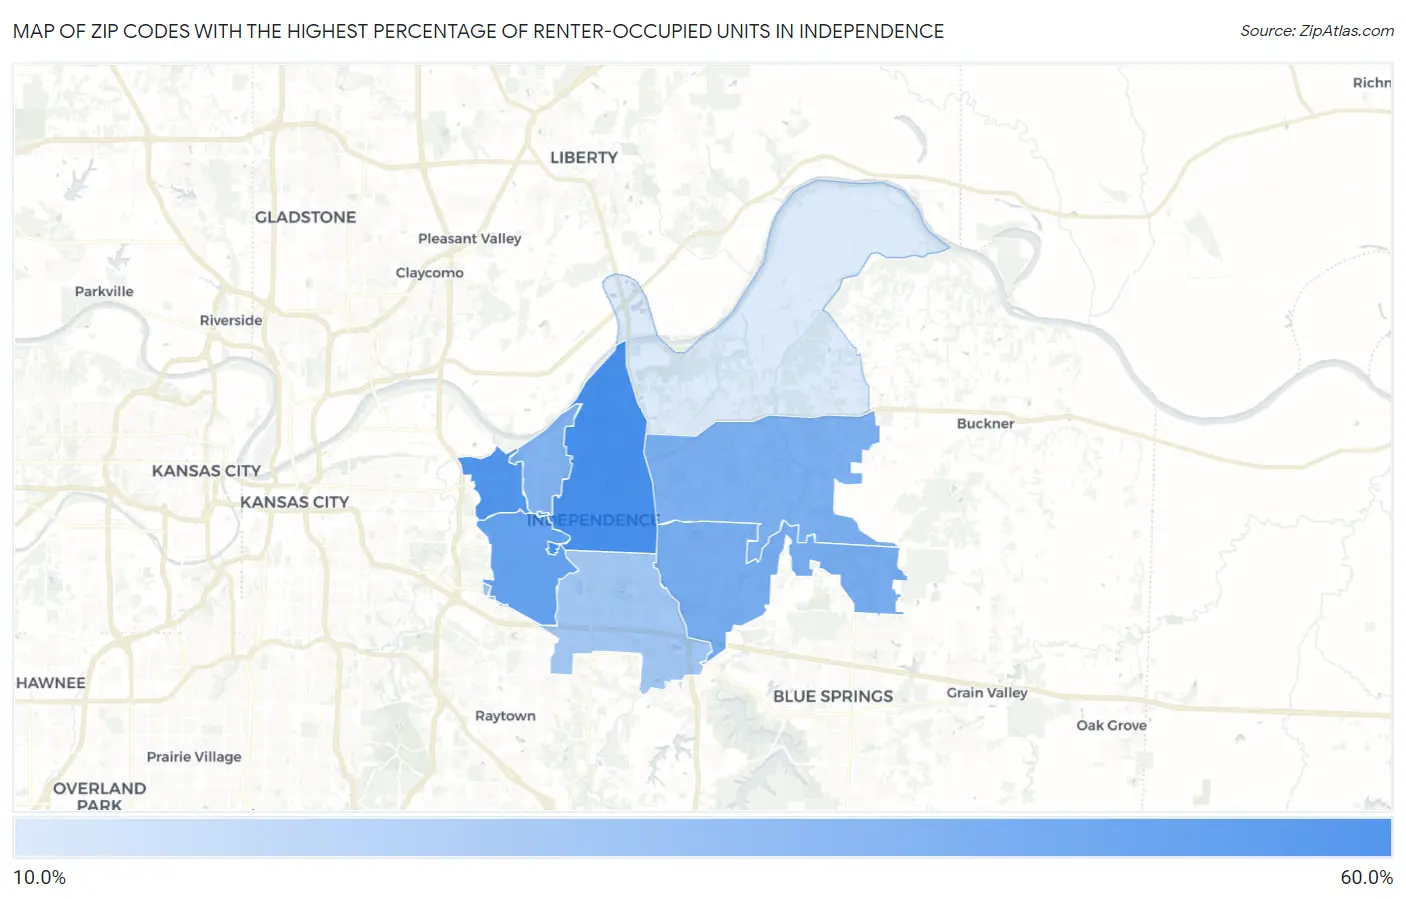
Map of Zip Codes with the Highest Percentage of Renter-Occupied Units in Independence
0.0%
60.0%
Zip Codes with the Highest Percentage of Renter-Occupied Units in Independence, MO
| Zip Code | % Renter-Occupied | vs State | vs National | |
| 1. | 64050 | 51.4% | 32.4%(+19.0)#61 | 35.2%(+16.2)#2,859 |
| 2. | 64053 | 48.4% | 32.4%(+16.0)#77 | 35.2%(+13.3)#3,371 |
| 3. | 64052 | 44.3% | 32.4%(+11.9)#105 | 35.2%(+9.11)#4,252 |
| 4. | 64057 | 40.2% | 32.4%(+7.76)#130 | 35.2%(+4.97)#5,363 |
| 5. | 64056 | 39.3% | 32.4%(+6.88)#138 | 35.2%(+4.10)#5,621 |
| 6. | 64054 | 37.6% | 32.4%(+5.16)#153 | 35.2%(+2.38)#6,243 |
| 7. | 64055 | 31.1% | 32.4%(-1.28)#255 | 35.2%(-4.07)#9,375 |
| 8. | 64058 | 19.5% | 32.4%(-12.9)#562 | 35.2%(-15.7)#18,670 |
1
Common Questions
What are the Top 5 Zip Codes with the Highest Percentage of Renter-Occupied Units in Independence, MO?
Top 5 Zip Codes with the Highest Percentage of Renter-Occupied Units in Independence, MO are:
What zip code has the Highest Percentage of Renter-Occupied Units in Independence, MO?
64050 has the Highest Percentage of Renter-Occupied Units in Independence, MO with 51.4%.
What is the Percentage of Renter-Occupied Units in Independence, MO?
Percentage of Renter-Occupied Units in Independence is 39.5%.
What is the Percentage of Renter-Occupied Units in Missouri?
Percentage of Renter-Occupied Units in Missouri is 32.4%.
What is the Percentage of Renter-Occupied Units in the United States?
Percentage of Renter-Occupied Units in the United States is 35.2%.