Herculaneum, MO Map & Demographics
Herculaneum Map
Herculaneum Overview
$33,525
PER CAPITA INCOME
$94,544
AVG FAMILY INCOME
$79,824
AVG HOUSEHOLD INCOME
28.7%
WAGE / INCOME GAP [ % ]
71.3¢/ $1
WAGE / INCOME GAP [ $ ]
0.32
INEQUALITY / GINI INDEX
4,767
TOTAL POPULATION
2,234
MALE POPULATION
2,533
FEMALE POPULATION
88.20
MALES / 100 FEMALES
113.38
FEMALES / 100 MALES
39.7
MEDIAN AGE
3.1
AVG FAMILY SIZE
2.6
AVG HOUSEHOLD SIZE
2,384
LABOR FORCE [ PEOPLE ]
62.7%
PERCENT IN LABOR FORCE
5.7%
UNEMPLOYMENT RATE
Herculaneum Zip Codes
Herculaneum Area Codes
Income in Herculaneum
Income Overview in Herculaneum
Per Capita Income in Herculaneum is $33,525, while median incomes of families and households are $94,544 and $79,824 respectively.
| Characteristic | Number | Measure |
| Per Capita Income | 4,767 | $33,525 |
| Median Family Income | 1,185 | $94,544 |
| Mean Family Income | 1,185 | $100,475 |
| Median Household Income | 1,762 | $79,824 |
| Mean Household Income | 1,762 | $86,755 |
| Income Deficit | 1,185 | $0 |
| Wage / Income Gap (%) | 4,767 | 28.71% |
| Wage / Income Gap ($) | 4,767 | 71.29¢ per $1 |
| Gini / Inequality Index | 4,767 | 0.32 |
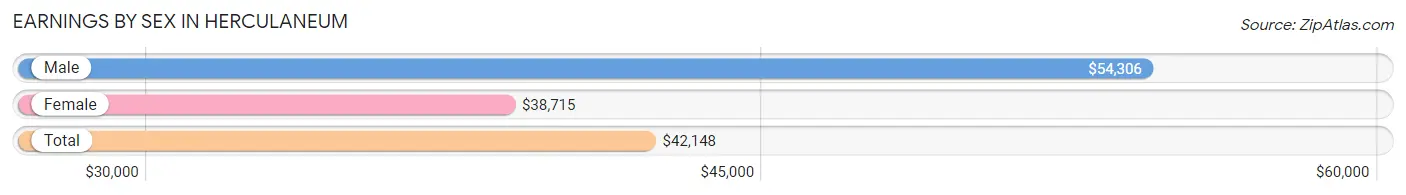
Earnings by Sex in Herculaneum
Average Earnings in Herculaneum are $42,148, $54,306 for men and $38,715 for women, a difference of 28.7%.
| Sex | Number | Average Earnings |
| Male | 1,211 (49.7%) | $54,306 |
| Female | 1,225 (50.3%) | $38,715 |
| Total | 2,436 (100.0%) | $42,148 |
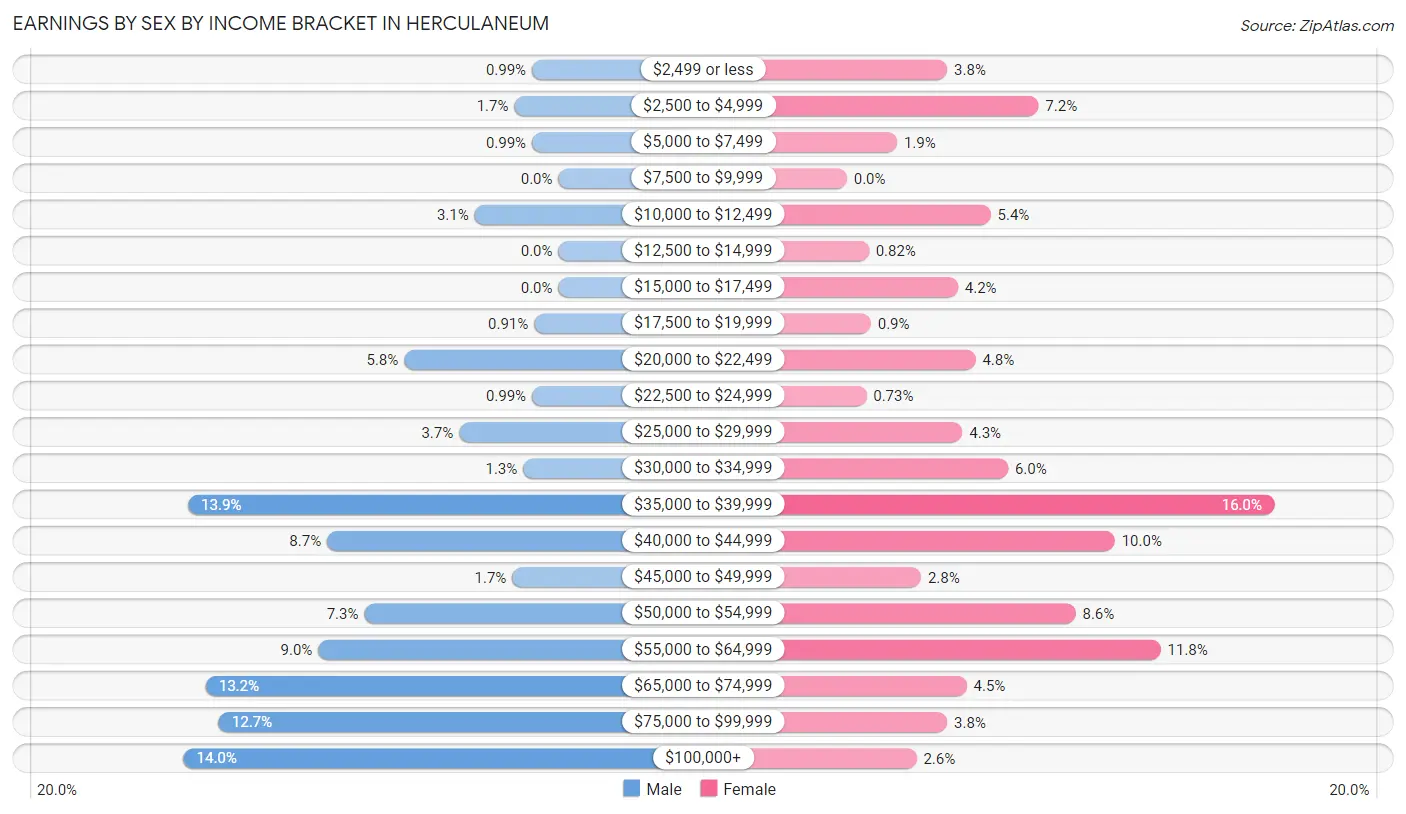
Earnings by Sex by Income Bracket in Herculaneum
The most common earnings brackets in Herculaneum are $100,000+ for men (170 | 14.0%) and $35,000 to $39,999 for women (196 | 16.0%).
| Income | Male | Female |
| $2,499 or less | 12 (1.0%) | 46 (3.8%) |
| $2,500 to $4,999 | 20 (1.7%) | 88 (7.2%) |
| $5,000 to $7,499 | 12 (1.0%) | 23 (1.9%) |
| $7,500 to $9,999 | 0 (0.0%) | 0 (0.0%) |
| $10,000 to $12,499 | 38 (3.1%) | 66 (5.4%) |
| $12,500 to $14,999 | 0 (0.0%) | 10 (0.8%) |
| $15,000 to $17,499 | 0 (0.0%) | 51 (4.2%) |
| $17,500 to $19,999 | 11 (0.9%) | 11 (0.9%) |
| $20,000 to $22,499 | 70 (5.8%) | 59 (4.8%) |
| $22,500 to $24,999 | 12 (1.0%) | 9 (0.7%) |
| $25,000 to $29,999 | 45 (3.7%) | 53 (4.3%) |
| $30,000 to $34,999 | 16 (1.3%) | 74 (6.0%) |
| $35,000 to $39,999 | 168 (13.9%) | 196 (16.0%) |
| $40,000 to $44,999 | 105 (8.7%) | 123 (10.0%) |
| $45,000 to $49,999 | 21 (1.7%) | 34 (2.8%) |
| $50,000 to $54,999 | 88 (7.3%) | 105 (8.6%) |
| $55,000 to $64,999 | 109 (9.0%) | 144 (11.8%) |
| $65,000 to $74,999 | 160 (13.2%) | 55 (4.5%) |
| $75,000 to $99,999 | 154 (12.7%) | 46 (3.8%) |
| $100,000+ | 170 (14.0%) | 32 (2.6%) |
| Total | 1,211 (100.0%) | 1,225 (100.0%) |
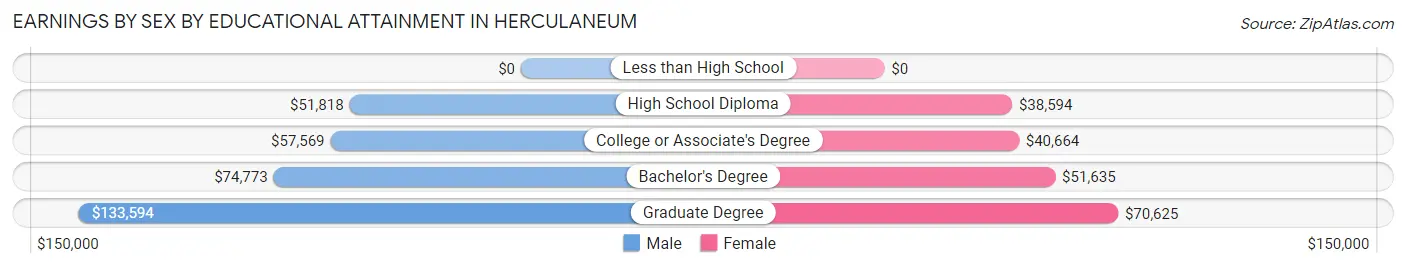
Earnings by Sex by Educational Attainment in Herculaneum
Average earnings in Herculaneum are $59,097 for men and $40,342 for women, a difference of 31.7%. Men with an educational attainment of graduate degree enjoy the highest average annual earnings of $133,594, while those with high school diploma education earn the least with $51,818. Women with an educational attainment of graduate degree earn the most with the average annual earnings of $70,625, while those with high school diploma education have the smallest earnings of $38,594.
| Educational Attainment | Male Income | Female Income |
| Less than High School | - | - |
| High School Diploma | $51,818 | $38,594 |
| College or Associate's Degree | $57,569 | $40,664 |
| Bachelor's Degree | $74,773 | $51,635 |
| Graduate Degree | $133,594 | $70,625 |
| Total | $59,097 | $40,342 |
Family Income in Herculaneum
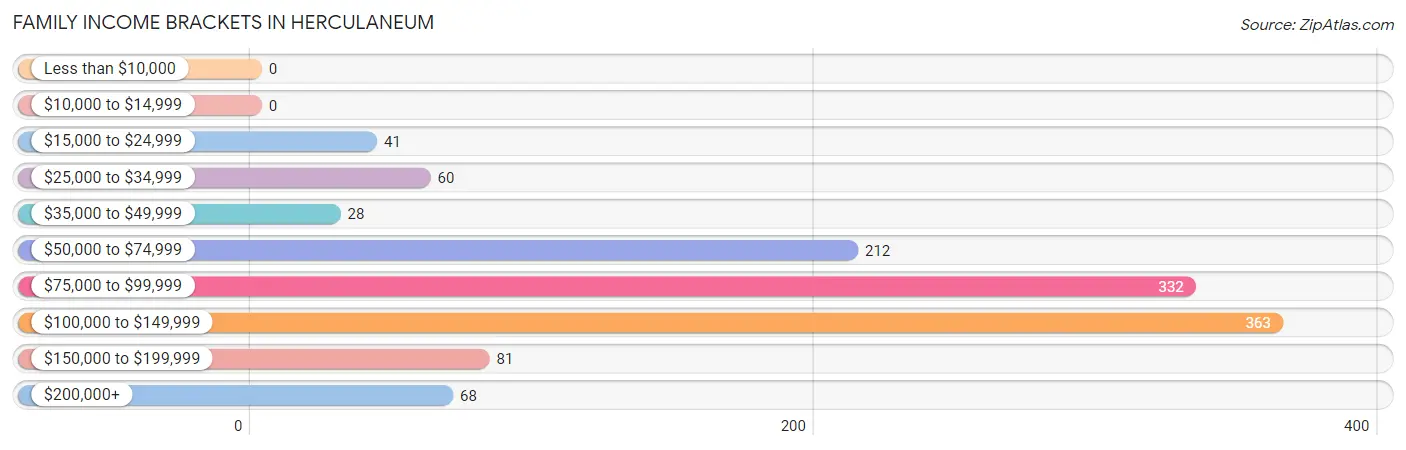
Family Income Brackets in Herculaneum
According to the Herculaneum family income data, there are 363 families falling into the $100,000 to $149,999 income range, which is the most common income bracket and makes up 30.6% of all families.
| Income Bracket | # Families | % Families |
| Less than $10,000 | 0 | 0.0% |
| $10,000 to $14,999 | 0 | 0.0% |
| $15,000 to $24,999 | 41 | 3.5% |
| $25,000 to $34,999 | 60 | 5.1% |
| $35,000 to $49,999 | 28 | 2.4% |
| $50,000 to $74,999 | 212 | 17.9% |
| $75,000 to $99,999 | 332 | 28.0% |
| $100,000 to $149,999 | 363 | 30.6% |
| $150,000 to $199,999 | 81 | 6.8% |
| $200,000+ | 68 | 5.7% |
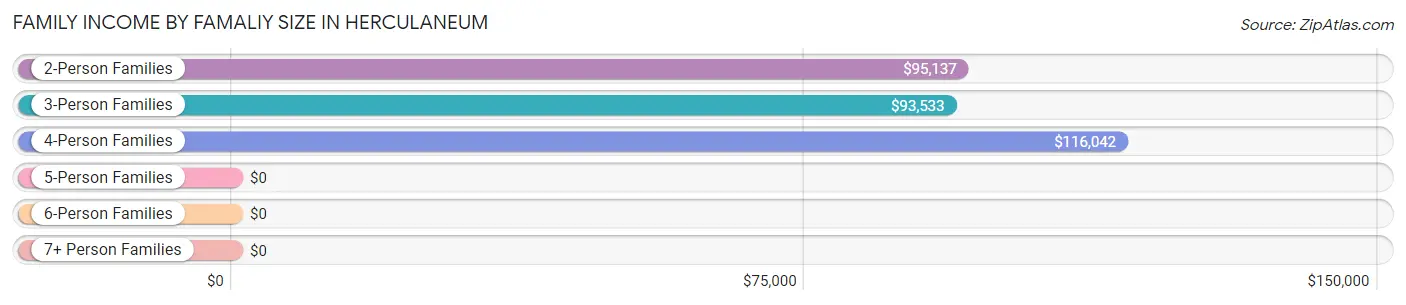
Family Income by Famaliy Size in Herculaneum
4-person families (212 | 17.9%) account for the highest median family income in Herculaneum with $116,042 per family, while 2-person families (545 | 46.0%) have the highest median income of $47,568 per family member.
| Income Bracket | # Families | Median Income |
| 2-Person Families | 545 (46.0%) | $95,137 |
| 3-Person Families | 329 (27.8%) | $93,533 |
| 4-Person Families | 212 (17.9%) | $116,042 |
| 5-Person Families | 9 (0.8%) | $0 |
| 6-Person Families | 78 (6.6%) | $0 |
| 7+ Person Families | 12 (1.0%) | $0 |
| Total | 1,185 (100.0%) | $94,544 |
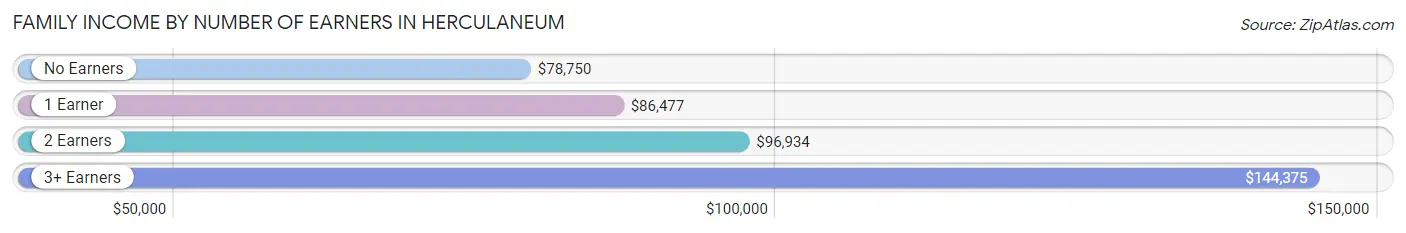
Family Income by Number of Earners in Herculaneum
The median family income in Herculaneum is $94,544, with families comprising 3+ earners (166) having the highest median family income of $144,375, while families with no earners (220) have the lowest median family income of $78,750, accounting for 14.0% and 18.6% of families, respectively.
| Number of Earners | # Families | Median Income |
| No Earners | 220 (18.6%) | $78,750 |
| 1 Earner | 280 (23.6%) | $86,477 |
| 2 Earners | 519 (43.8%) | $96,934 |
| 3+ Earners | 166 (14.0%) | $144,375 |
| Total | 1,185 (100.0%) | $94,544 |
Household Income in Herculaneum
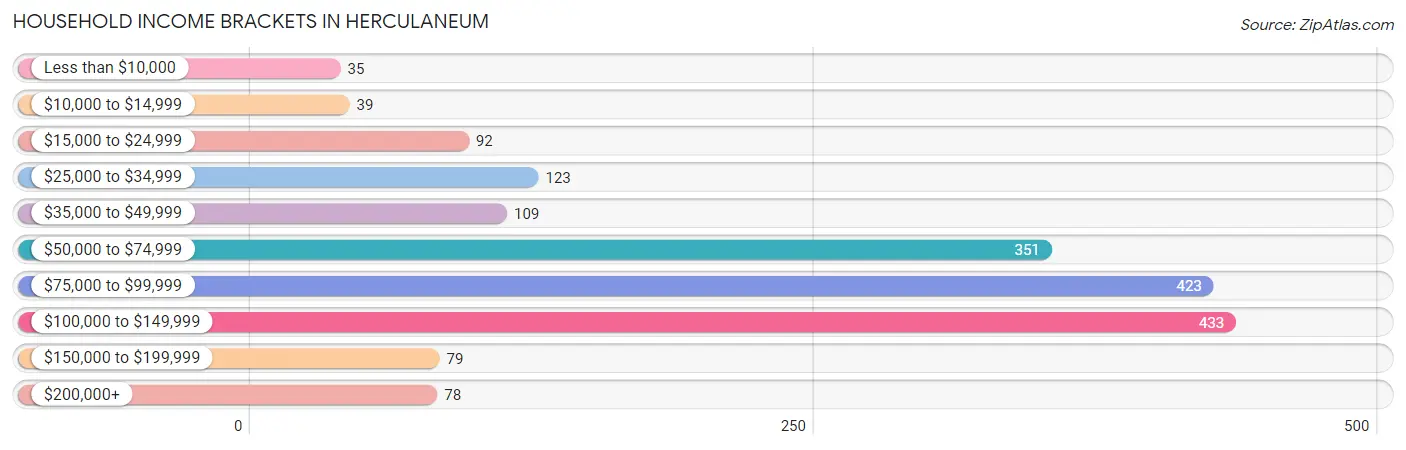
Household Income Brackets in Herculaneum
With 433 households falling in the category, the $100,000 to $149,999 income range is the most frequent in Herculaneum, accounting for 24.6% of all households. In contrast, only 35 households (2.0%) fall into the less than $10,000 income bracket, making it the least populous group.
| Income Bracket | # Households | % Households |
| Less than $10,000 | 35 | 2.0% |
| $10,000 to $14,999 | 39 | 2.2% |
| $15,000 to $24,999 | 92 | 5.2% |
| $25,000 to $34,999 | 123 | 7.0% |
| $35,000 to $49,999 | 109 | 6.2% |
| $50,000 to $74,999 | 351 | 19.9% |
| $75,000 to $99,999 | 423 | 24.0% |
| $100,000 to $149,999 | 433 | 24.6% |
| $150,000 to $199,999 | 79 | 4.5% |
| $200,000+ | 78 | 4.4% |
Household Income by Householder Age in Herculaneum
The median household income in Herculaneum is $79,824, with the highest median household income of $95,352 found in the 45 to 64 years age bracket for the primary householder. A total of 672 households (38.1%) fall into this category. Meanwhile, the 15 to 24 years age bracket for the primary householder has the lowest median household income of $0, with 16 households (0.9%) in this group.
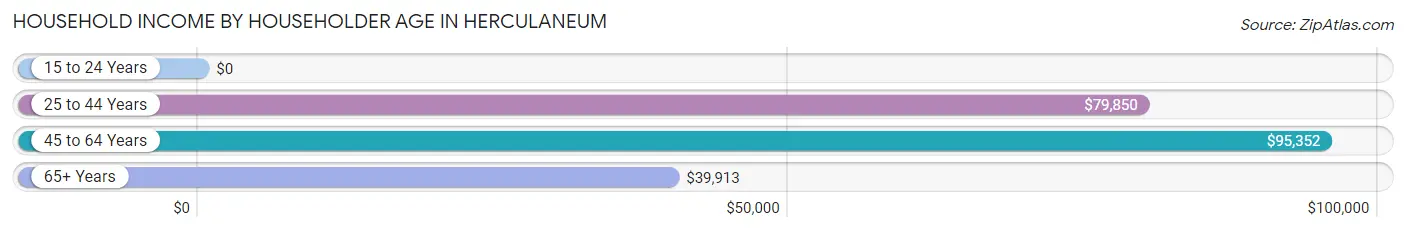
| Income Bracket | # Households | Median Income |
| 15 to 24 Years | 16 (0.9%) | $0 |
| 25 to 44 Years | 613 (34.8%) | $79,850 |
| 45 to 64 Years | 672 (38.1%) | $95,352 |
| 65+ Years | 461 (26.2%) | $39,913 |
| Total | 1,762 (100.0%) | $79,824 |
Poverty in Herculaneum
Income Below Poverty by Sex and Age in Herculaneum
With 4.3% poverty level for males and 6.3% for females among the residents of Herculaneum, 6 to 11 year old males and 25 to 34 year old females are the most vulnerable to poverty, with 36 males (56.2%) and 90 females (31.0%) in their respective age groups living below the poverty level.
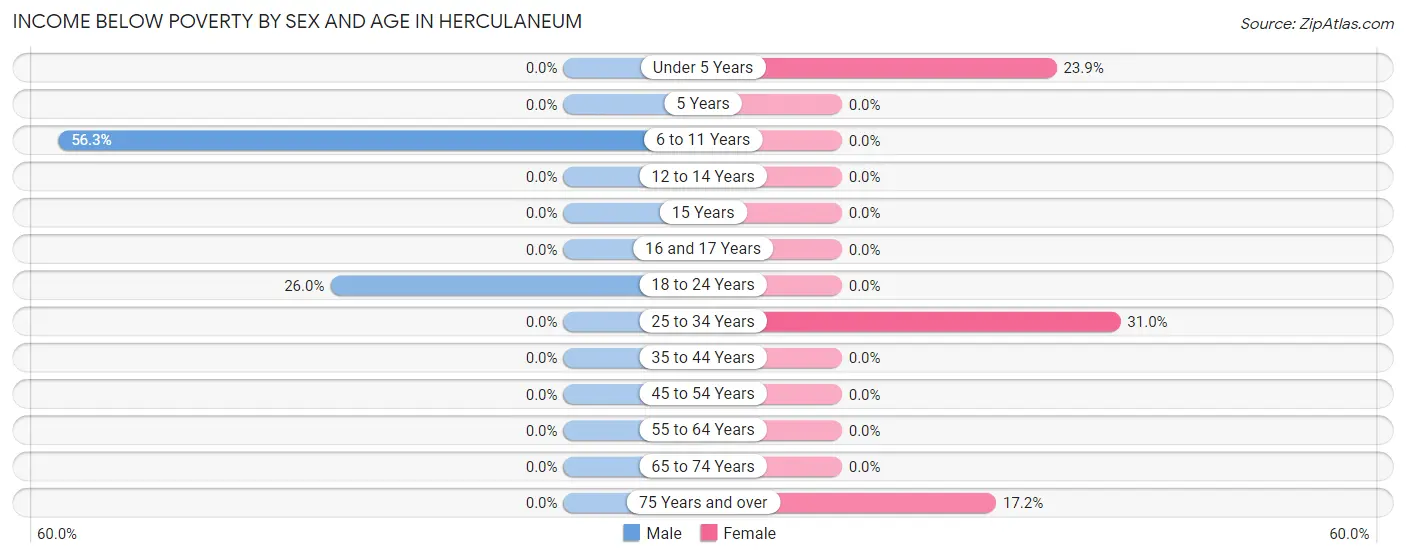
| Age Bracket | Male | Female |
| Under 5 Years | 0 (0.0%) | 22 (23.9%) |
| 5 Years | 0 (0.0%) | 0 (0.0%) |
| 6 to 11 Years | 36 (56.2%) | 0 (0.0%) |
| 12 to 14 Years | 0 (0.0%) | 0 (0.0%) |
| 15 Years | 0 (0.0%) | 0 (0.0%) |
| 16 and 17 Years | 0 (0.0%) | 0 (0.0%) |
| 18 to 24 Years | 54 (26.0%) | 0 (0.0%) |
| 25 to 34 Years | 0 (0.0%) | 90 (31.0%) |
| 35 to 44 Years | 0 (0.0%) | 0 (0.0%) |
| 45 to 54 Years | 0 (0.0%) | 0 (0.0%) |
| 55 to 64 Years | 0 (0.0%) | 0 (0.0%) |
| 65 to 74 Years | 0 (0.0%) | 0 (0.0%) |
| 75 Years and over | 0 (0.0%) | 39 (17.2%) |
| Total | 90 (4.3%) | 151 (6.3%) |
Income Above Poverty by Sex and Age in Herculaneum
According to the poverty statistics in Herculaneum, males aged under 5 years and females aged 5 years are the age groups that are most secure financially, with 100.0% of males and 100.0% of females in these age groups living above the poverty line.
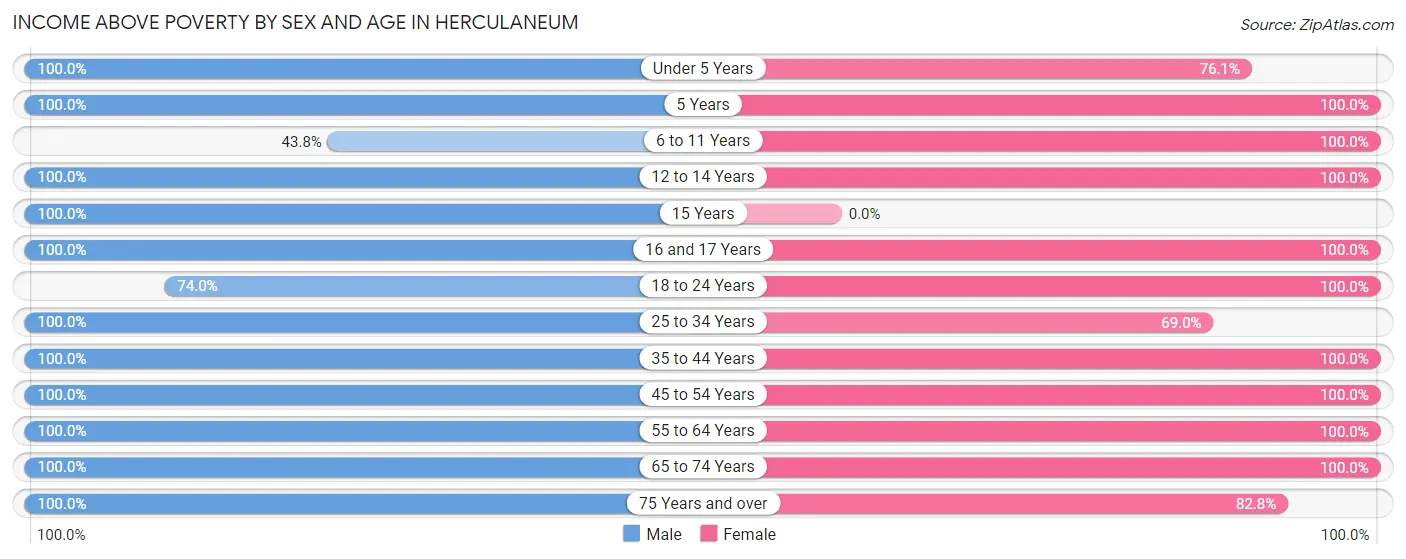
| Age Bracket | Male | Female |
| Under 5 Years | 58 (100.0%) | 70 (76.1%) |
| 5 Years | 21 (100.0%) | 43 (100.0%) |
| 6 to 11 Years | 28 (43.8%) | 198 (100.0%) |
| 12 to 14 Years | 145 (100.0%) | 123 (100.0%) |
| 15 Years | 108 (100.0%) | 0 (0.0%) |
| 16 and 17 Years | 10 (100.0%) | 12 (100.0%) |
| 18 to 24 Years | 154 (74.0%) | 245 (100.0%) |
| 25 to 34 Years | 341 (100.0%) | 200 (69.0%) |
| 35 to 44 Years | 335 (100.0%) | 328 (100.0%) |
| 45 to 54 Years | 195 (100.0%) | 279 (100.0%) |
| 55 to 64 Years | 355 (100.0%) | 342 (100.0%) |
| 65 to 74 Years | 172 (100.0%) | 220 (100.0%) |
| 75 Years and over | 88 (100.0%) | 188 (82.8%) |
| Total | 2,010 (95.7%) | 2,248 (93.7%) |
Income Below Poverty Among Married-Couple Families in Herculaneum
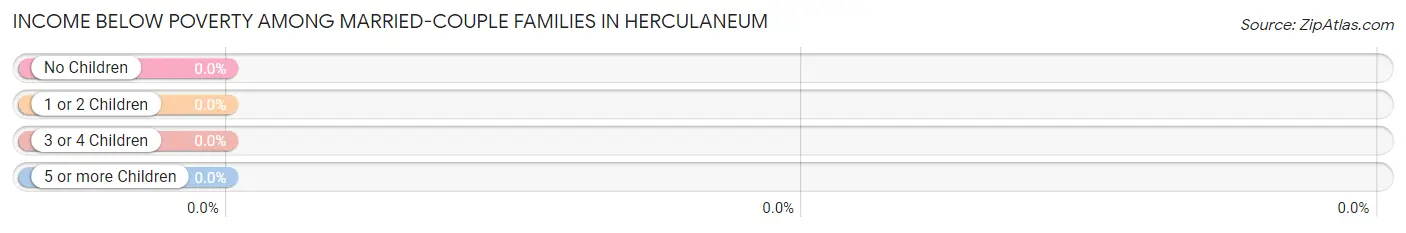
| Children | Above Poverty | Below Poverty |
| No Children | 632 (100.0%) | 0 (0.0%) |
| 1 or 2 Children | 191 (100.0%) | 0 (0.0%) |
| 3 or 4 Children | 87 (100.0%) | 0 (0.0%) |
| 5 or more Children | 0 (0.0%) | 0 (0.0%) |
| Total | 910 (100.0%) | 0 (0.0%) |
Income Below Poverty Among Single-Parent Households in Herculaneum
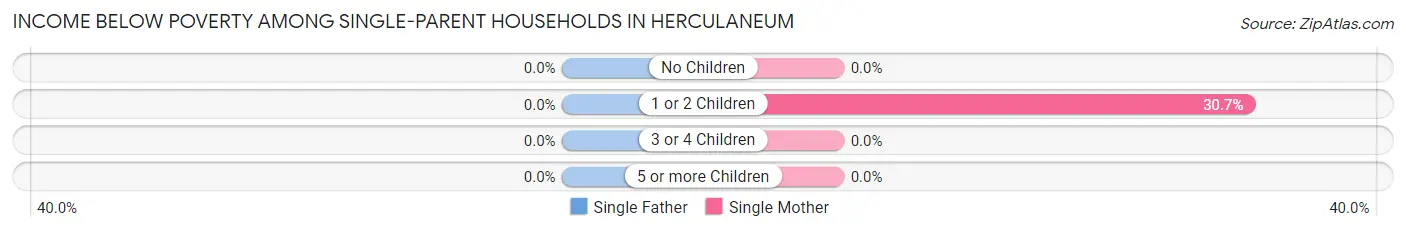
| Children | Single Father | Single Mother |
| No Children | 0 (0.0%) | 0 (0.0%) |
| 1 or 2 Children | 0 (0.0%) | 42 (30.7%) |
| 3 or 4 Children | 0 (0.0%) | 0 (0.0%) |
| 5 or more Children | 0 (0.0%) | 0 (0.0%) |
| Total | 0 (0.0%) | 42 (19.4%) |
Income Below Poverty Among Married-Couple vs Single-Parent Households in Herculaneum
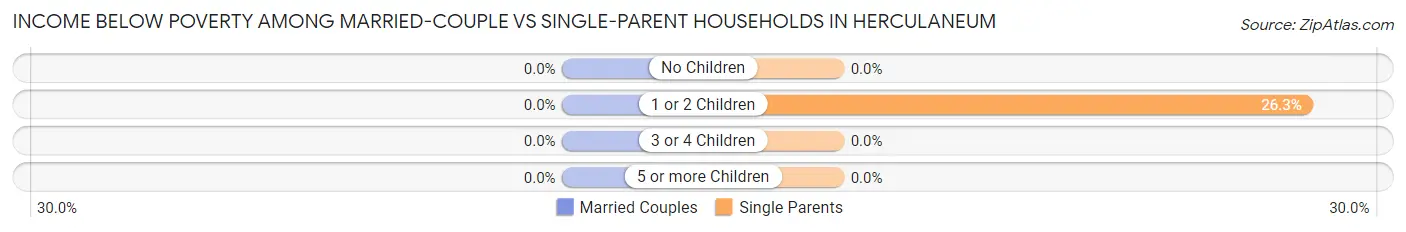
| Children | Married-Couple Families | Single-Parent Households |
| No Children | 0 (0.0%) | 0 (0.0%) |
| 1 or 2 Children | 0 (0.0%) | 42 (26.3%) |
| 3 or 4 Children | 0 (0.0%) | 0 (0.0%) |
| 5 or more Children | 0 (0.0%) | 0 (0.0%) |
| Total | 0 (0.0%) | 42 (15.3%) |
Race in Herculaneum
The most populous races in Herculaneum are White / Caucasian (3,841 | 80.6%), Two or more Races (506 | 10.6%), and Black / African American (393 | 8.2%).
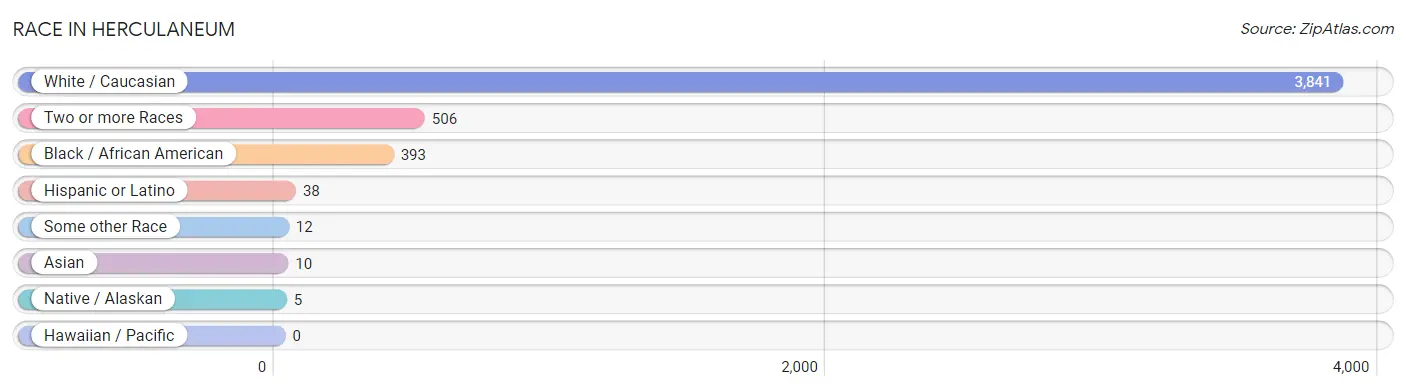
| Race | # Population | % Population |
| Asian | 10 | 0.2% |
| Black / African American | 393 | 8.2% |
| Hawaiian / Pacific | 0 | 0.0% |
| Hispanic or Latino | 38 | 0.8% |
| Native / Alaskan | 5 | 0.1% |
| White / Caucasian | 3,841 | 80.6% |
| Two or more Races | 506 | 10.6% |
| Some other Race | 12 | 0.3% |
| Total | 4,767 | 100.0% |
Ancestry in Herculaneum
The most populous ancestries reported in Herculaneum are German (1,516 | 31.8%), English (599 | 12.6%), American (485 | 10.2%), Irish (441 | 9.2%), and French (327 | 6.9%), together accounting for 70.7% of all Herculaneum residents.
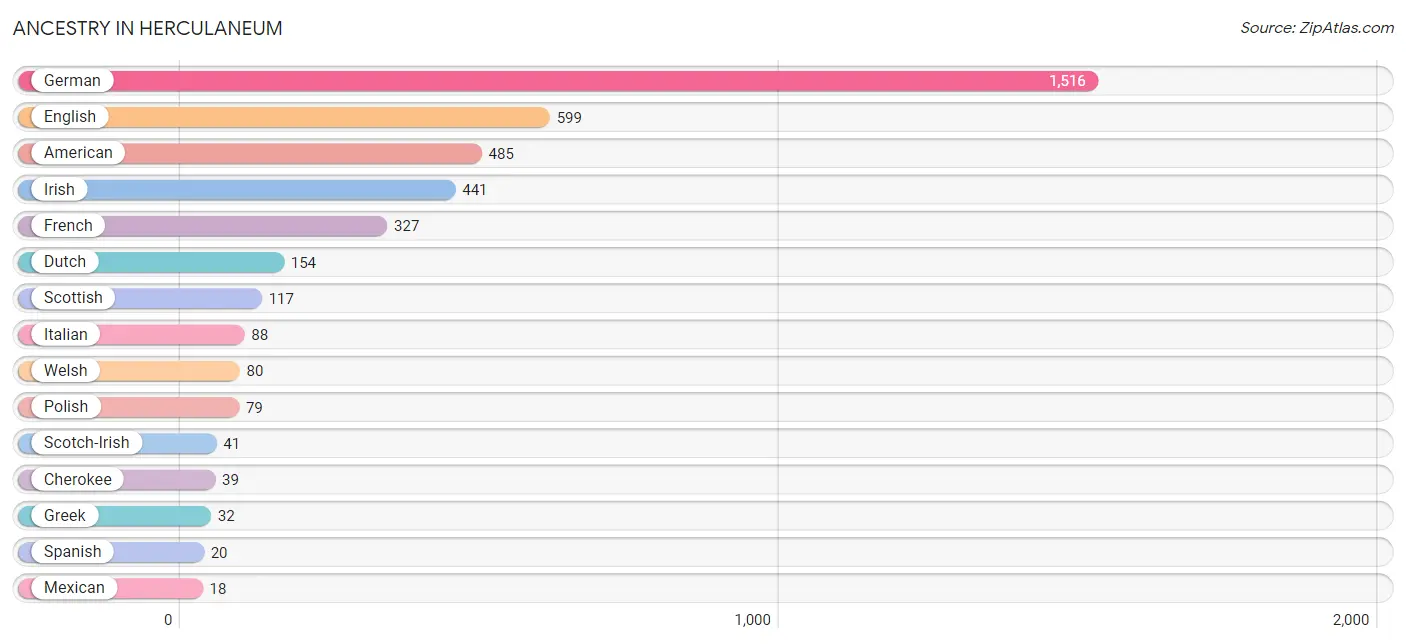
| Ancestry | # Population | % Population |
| American | 485 | 10.2% |
| Cherokee | 39 | 0.8% |
| Chickasaw | 5 | 0.1% |
| Dutch | 154 | 3.2% |
| English | 599 | 12.6% |
| French | 327 | 6.9% |
| German | 1,516 | 31.8% |
| Greek | 32 | 0.7% |
| Irish | 441 | 9.2% |
| Italian | 88 | 1.8% |
| Korean | 10 | 0.2% |
| Mexican | 18 | 0.4% |
| Polish | 79 | 1.7% |
| Russian | 11 | 0.2% |
| Scotch-Irish | 41 | 0.9% |
| Scottish | 117 | 2.5% |
| Spanish | 20 | 0.4% |
| Welsh | 80 | 1.7% | View All 18 Rows |
Immigrants in Herculaneum
The most numerous immigrant groups reported in Herculaneum came from Asia (10 | 0.2%), Philippines (10 | 0.2%), and South Eastern Asia (10 | 0.2%), together accounting for 0.6% of all Herculaneum residents.
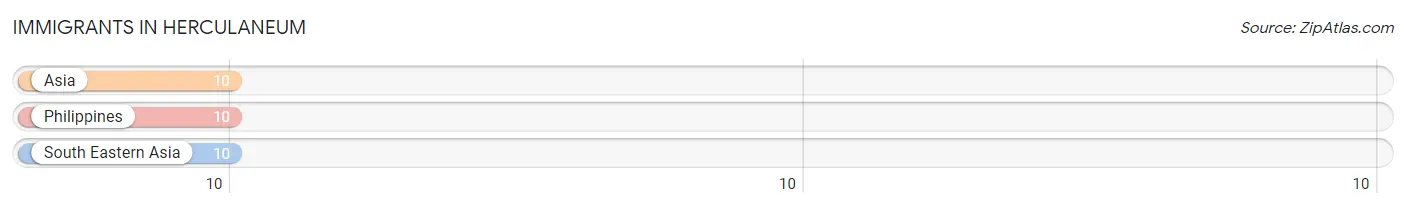
| Immigration Origin | # Population | % Population |
| Asia | 10 | 0.2% |
| Philippines | 10 | 0.2% |
| South Eastern Asia | 10 | 0.2% | View All 3 Rows |
Sex and Age in Herculaneum
Sex and Age in Herculaneum
The most populous age groups in Herculaneum are 25 to 29 Years (250 | 11.2%) for men and 5 to 9 Years (264 | 10.4%) for women.
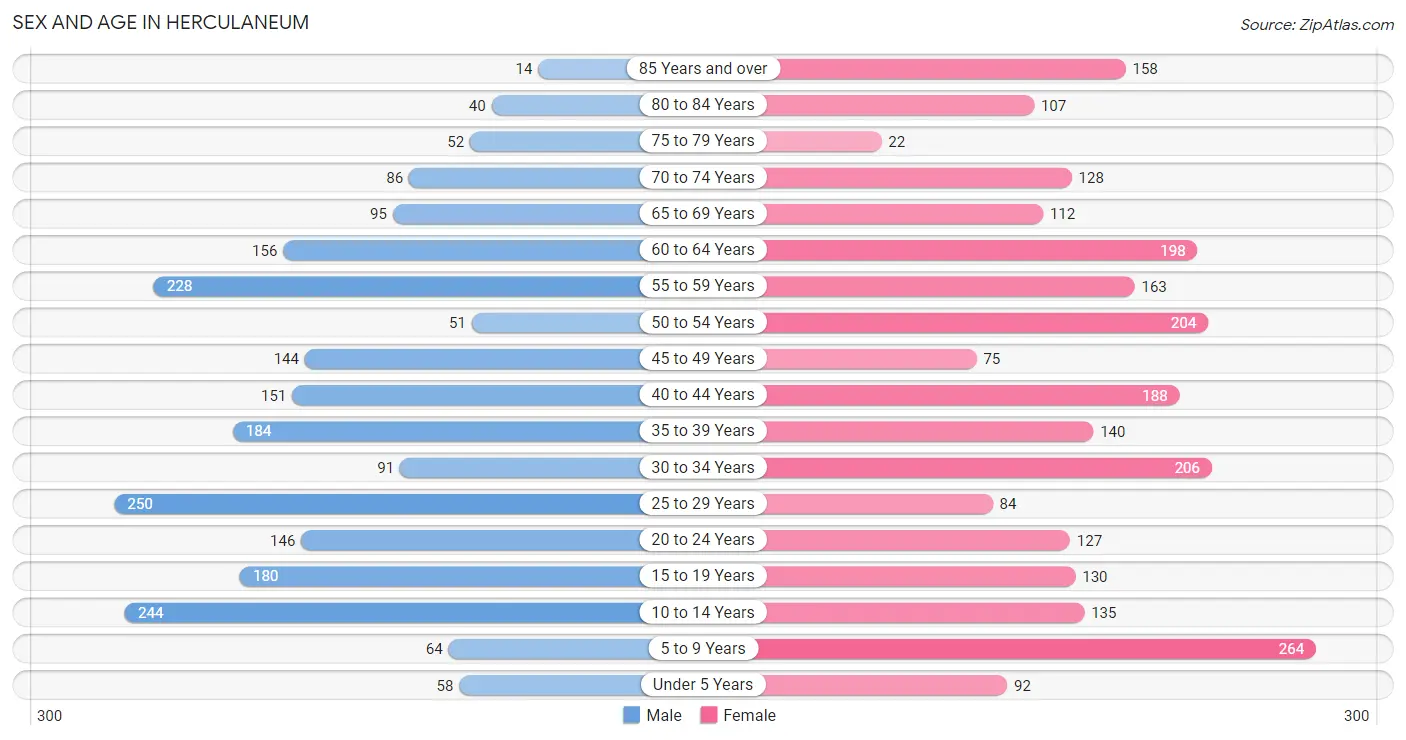
| Age Bracket | Male | Female |
| Under 5 Years | 58 (2.6%) | 92 (3.6%) |
| 5 to 9 Years | 64 (2.9%) | 264 (10.4%) |
| 10 to 14 Years | 244 (10.9%) | 135 (5.3%) |
| 15 to 19 Years | 180 (8.1%) | 130 (5.1%) |
| 20 to 24 Years | 146 (6.5%) | 127 (5.0%) |
| 25 to 29 Years | 250 (11.2%) | 84 (3.3%) |
| 30 to 34 Years | 91 (4.1%) | 206 (8.1%) |
| 35 to 39 Years | 184 (8.2%) | 140 (5.5%) |
| 40 to 44 Years | 151 (6.8%) | 188 (7.4%) |
| 45 to 49 Years | 144 (6.5%) | 75 (3.0%) |
| 50 to 54 Years | 51 (2.3%) | 204 (8.1%) |
| 55 to 59 Years | 228 (10.2%) | 163 (6.4%) |
| 60 to 64 Years | 156 (7.0%) | 198 (7.8%) |
| 65 to 69 Years | 95 (4.3%) | 112 (4.4%) |
| 70 to 74 Years | 86 (3.8%) | 128 (5.1%) |
| 75 to 79 Years | 52 (2.3%) | 22 (0.9%) |
| 80 to 84 Years | 40 (1.8%) | 107 (4.2%) |
| 85 Years and over | 14 (0.6%) | 158 (6.2%) |
| Total | 2,234 (100.0%) | 2,533 (100.0%) |
Families and Households in Herculaneum
Median Family Size in Herculaneum
The median family size in Herculaneum is 3.08 persons per family, with married-couple families (910 | 76.8%) accounting for the largest median family size of 3.16 persons per family. On the other hand, single male/father families (59 | 5.0%) represent the smallest median family size with 2.64 persons per family.
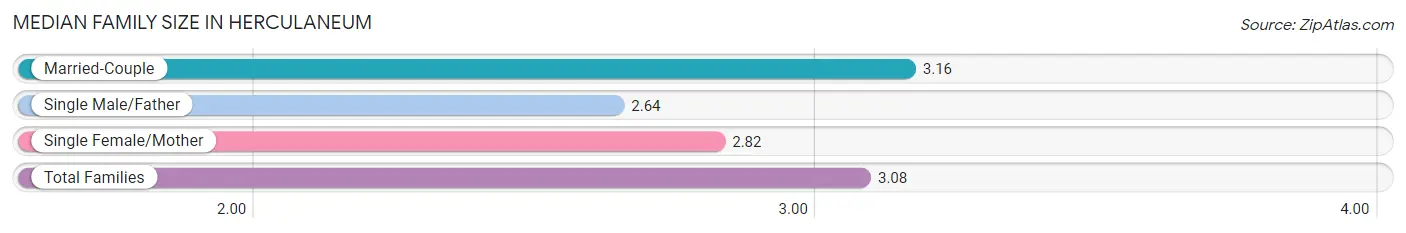
| Family Type | # Families | Family Size |
| Married-Couple | 910 (76.8%) | 3.16 |
| Single Male/Father | 59 (5.0%) | 2.64 |
| Single Female/Mother | 216 (18.2%) | 2.82 |
| Total Families | 1,185 (100.0%) | 3.08 |
Median Household Size in Herculaneum
The median household size in Herculaneum is 2.62 persons per household, with single female/mother households (216 | 12.3%) accounting for the largest median household size of 3.66 persons per household. non-family households (577 | 32.8%) represent the smallest median household size with 1.20 persons per household.
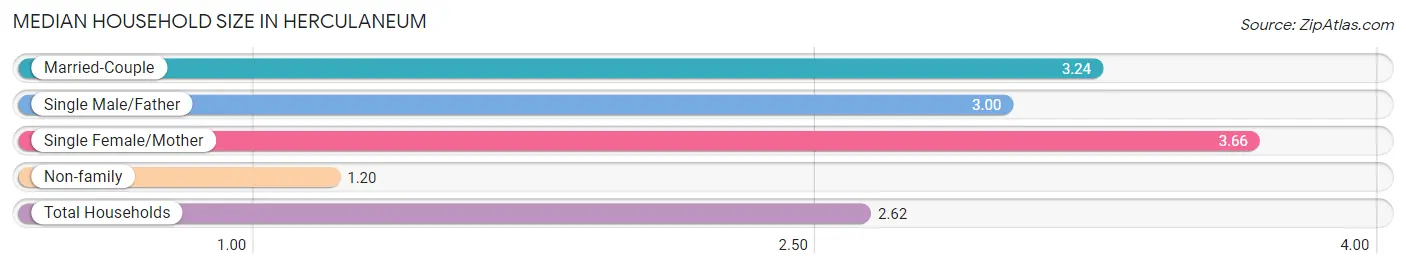
| Household Type | # Households | Household Size |
| Married-Couple | 910 (51.6%) | 3.24 |
| Single Male/Father | 59 (3.4%) | 3.00 |
| Single Female/Mother | 216 (12.3%) | 3.66 |
| Non-family | 577 (32.8%) | 1.20 |
| Total Households | 1,762 (100.0%) | 2.62 |
Household Size by Marriage Status in Herculaneum
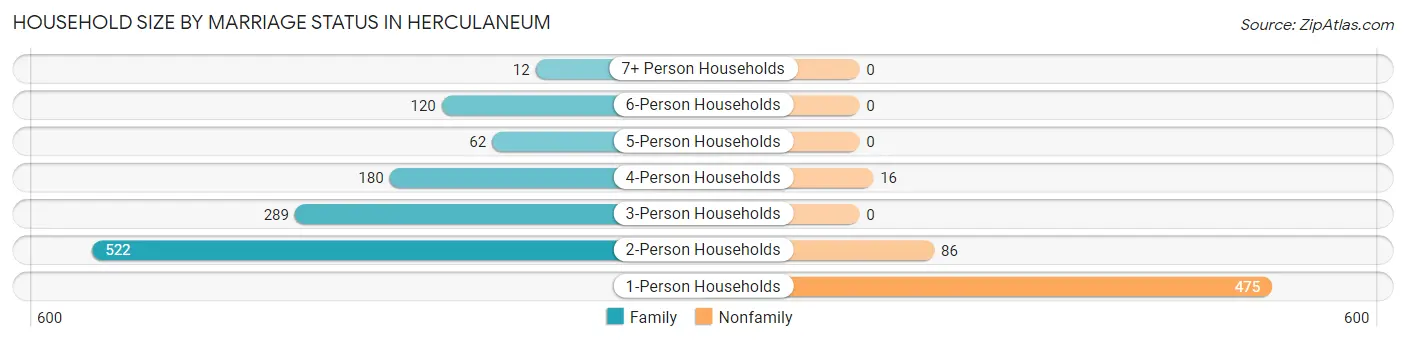
Out of a total of 1,762 households in Herculaneum, 1,185 (67.2%) are family households, while 577 (32.8%) are nonfamily households. The most numerous type of family households are 2-person households, comprising 522, and the most common type of nonfamily households are 1-person households, comprising 475.
| Household Size | Family Households | Nonfamily Households |
| 1-Person Households | - | 475 (27.0%) |
| 2-Person Households | 522 (29.6%) | 86 (4.9%) |
| 3-Person Households | 289 (16.4%) | 0 (0.0%) |
| 4-Person Households | 180 (10.2%) | 16 (0.9%) |
| 5-Person Households | 62 (3.5%) | 0 (0.0%) |
| 6-Person Households | 120 (6.8%) | 0 (0.0%) |
| 7+ Person Households | 12 (0.7%) | 0 (0.0%) |
| Total | 1,185 (67.2%) | 577 (32.8%) |
Female Fertility in Herculaneum
Fertility by Age in Herculaneum
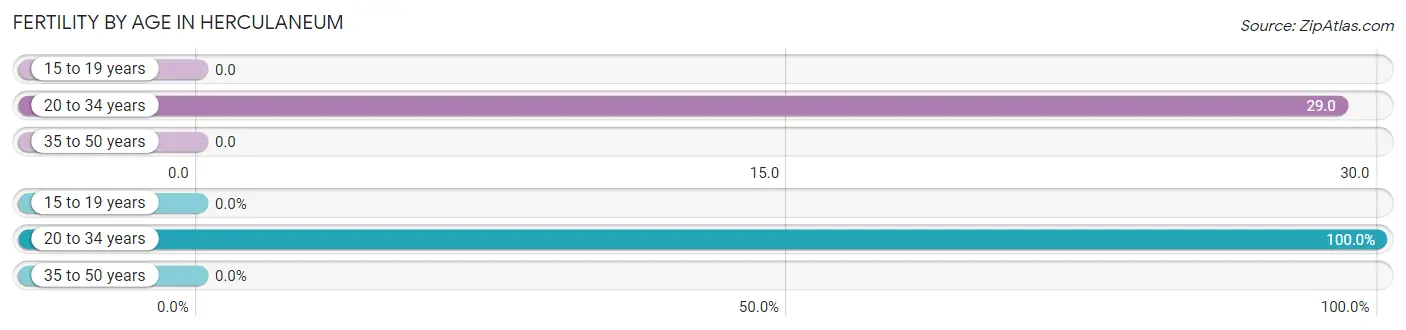
Average fertility rate in Herculaneum is 12.0 births per 1,000 women. Women in the age bracket of 20 to 34 years have the highest fertility rate with 29.0 births per 1,000 women. Women in the age bracket of 20 to 34 years acount for 100.0% of all women with births.
| Age Bracket | Women with Births | Births / 1,000 Women |
| 15 to 19 years | 0 (0.0%) | 0.0 |
| 20 to 34 years | 12 (100.0%) | 29.0 |
| 35 to 50 years | 0 (0.0%) | 0.0 |
| Total | 12 (100.0%) | 12.0 |
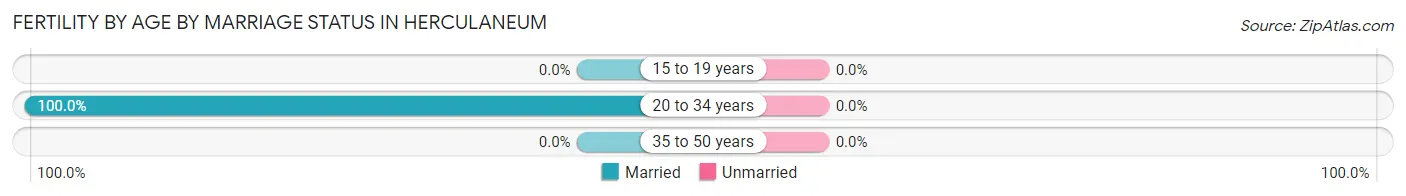
Fertility by Age by Marriage Status in Herculaneum
| Age Bracket | Married | Unmarried |
| 15 to 19 years | 0 (0.0%) | 0 (0.0%) |
| 20 to 34 years | 12 (100.0%) | 0 (0.0%) |
| 35 to 50 years | 0 (0.0%) | 0 (0.0%) |
| Total | 12 (100.0%) | 0 (0.0%) |
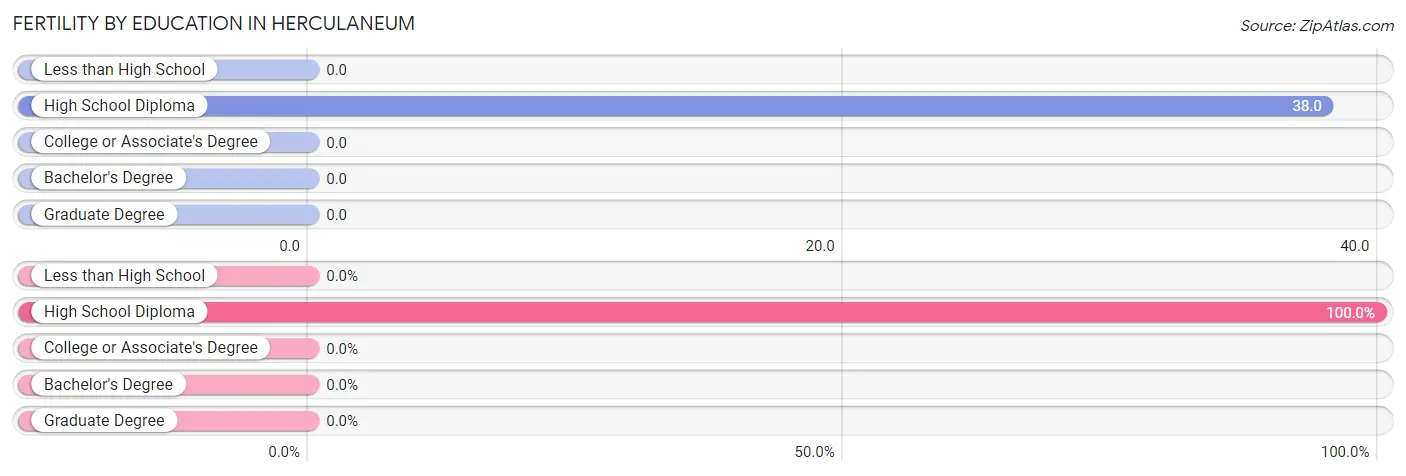
Fertility by Education in Herculaneum
| Educational Attainment | Women with Births | Births / 1,000 Women |
| Less than High School | 0 (0.0%) | 0.0 |
| High School Diploma | 12 (100.0%) | 38.0 |
| College or Associate's Degree | 0 (0.0%) | 0.0 |
| Bachelor's Degree | 0 (0.0%) | 0.0 |
| Graduate Degree | 0 (0.0%) | 0.0 |
| Total | 12 (100.0%) | 12.0 |
Fertility by Education by Marriage Status in Herculaneum
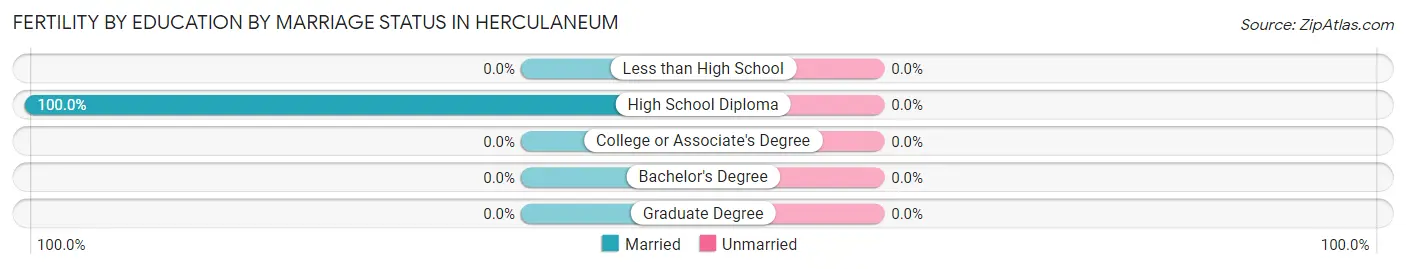
| Educational Attainment | Married | Unmarried |
| Less than High School | 0 (0.0%) | 0 (0.0%) |
| High School Diploma | 12 (100.0%) | 0 (0.0%) |
| College or Associate's Degree | 0 (0.0%) | 0 (0.0%) |
| Bachelor's Degree | 0 (0.0%) | 0 (0.0%) |
| Graduate Degree | 0 (0.0%) | 0 (0.0%) |
| Total | 12 (100.0%) | 0 (0.0%) |
Employment Characteristics in Herculaneum
Employment by Class of Employer in Herculaneum
Among the 2,250 employed individuals in Herculaneum, private company employees (1,724 | 76.6%), not-for-profit organizations (254 | 11.3%), and self-employed (incorporated) (132 | 5.9%) make up the most common classes of employment.
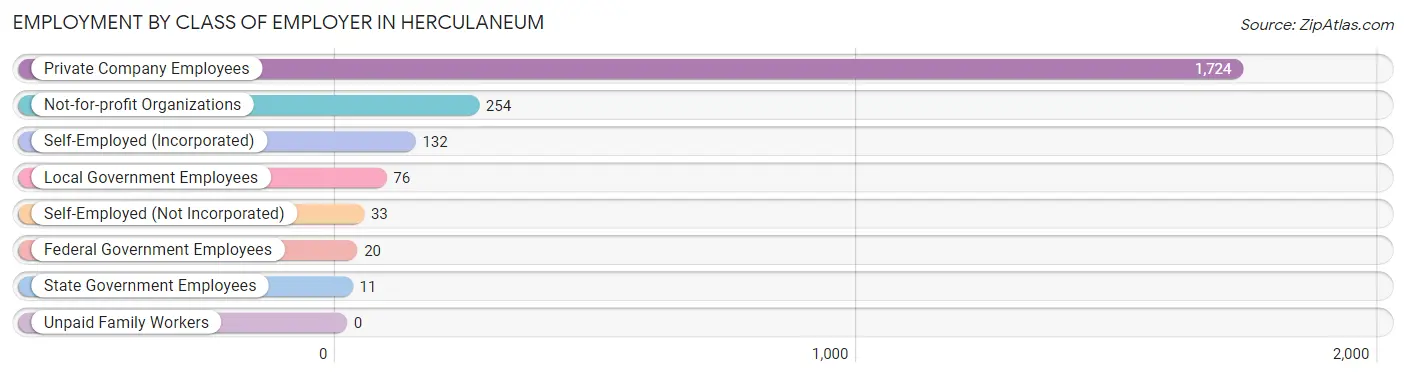
| Employer Class | # Employees | % Employees |
| Private Company Employees | 1,724 | 76.6% |
| Self-Employed (Incorporated) | 132 | 5.9% |
| Self-Employed (Not Incorporated) | 33 | 1.5% |
| Not-for-profit Organizations | 254 | 11.3% |
| Local Government Employees | 76 | 3.4% |
| State Government Employees | 11 | 0.5% |
| Federal Government Employees | 20 | 0.9% |
| Unpaid Family Workers | 0 | 0.0% |
| Total | 2,250 | 100.0% |
Employment Status by Age in Herculaneum
According to the labor force statistics for Herculaneum, out of the total population over 16 years of age (3,802), 62.7% or 2,384 individuals are in the labor force, with 5.7% or 136 of them unemployed. The age group with the highest labor force participation rate is 45 to 54 years, with 89.5% or 424 individuals in the labor force. Within the labor force, the 16 to 19 years age range has the highest percentage of unemployed individuals, with 63.4% or 59 of them being unemployed.
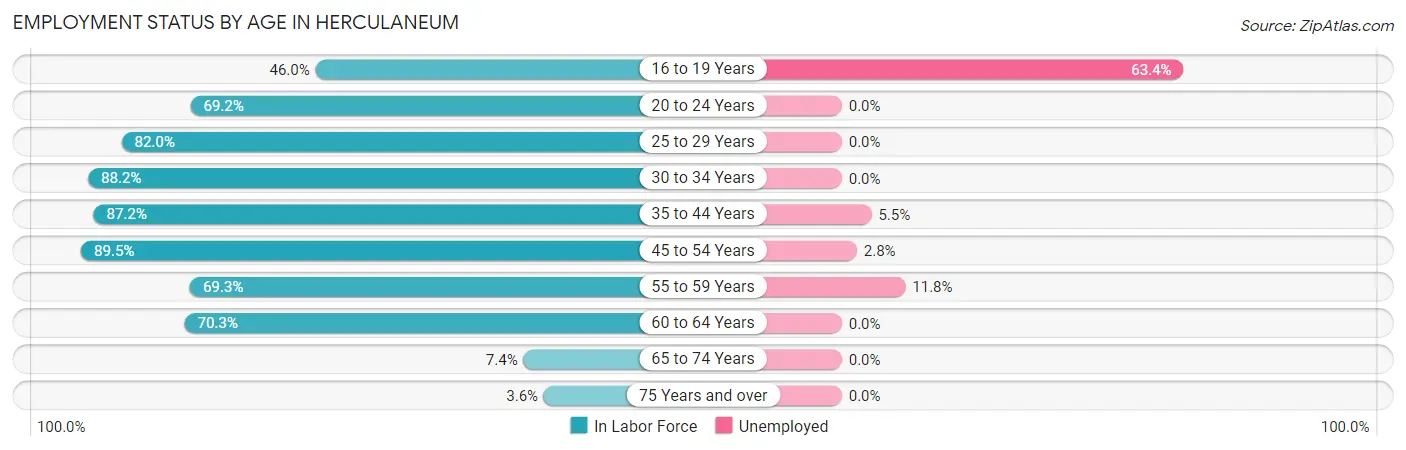
| Age Bracket | In Labor Force | Unemployed |
| 16 to 19 Years | 93 (46.0%) | 59 (63.4%) |
| 20 to 24 Years | 189 (69.2%) | 0 (0.0%) |
| 25 to 29 Years | 274 (82.0%) | 0 (0.0%) |
| 30 to 34 Years | 262 (88.2%) | 0 (0.0%) |
| 35 to 44 Years | 578 (87.2%) | 32 (5.5%) |
| 45 to 54 Years | 424 (89.5%) | 12 (2.8%) |
| 55 to 59 Years | 271 (69.3%) | 32 (11.8%) |
| 60 to 64 Years | 249 (70.3%) | 0 (0.0%) |
| 65 to 74 Years | 31 (7.4%) | 0 (0.0%) |
| 75 Years and over | 14 (3.6%) | 0 (0.0%) |
| Total | 2,384 (62.7%) | 136 (5.7%) |
Employment Status by Educational Attainment in Herculaneum
According to labor force statistics for Herculaneum, 81.9% of individuals (2,058) out of the total population between 25 and 64 years of age (2,513) are in the labor force, with 3.7% or 76 of them being unemployed. The group with the highest labor force participation rate are those with the educational attainment of high school diploma, with 85.5% or 683 individuals in the labor force. Within the labor force, individuals with high school diploma education have the highest percentage of unemployment, with 9.4% or 64 of them being unemployed.
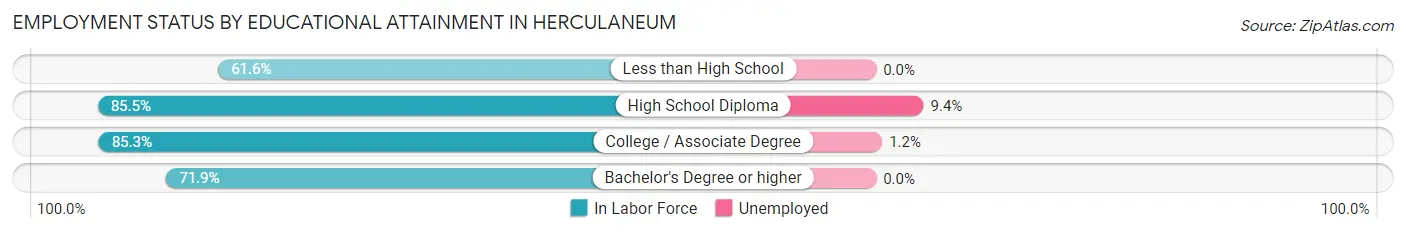
| Educational Attainment | In Labor Force | Unemployed |
| Less than High School | 77 (61.6%) | 0 (0.0%) |
| High School Diploma | 683 (85.5%) | 75 (9.4%) |
| College / Associate Degree | 988 (85.3%) | 14 (1.2%) |
| Bachelor's Degree or higher | 310 (71.9%) | 0 (0.0%) |
| Total | 2,058 (81.9%) | 93 (3.7%) |
Employment Occupations by Sex in Herculaneum
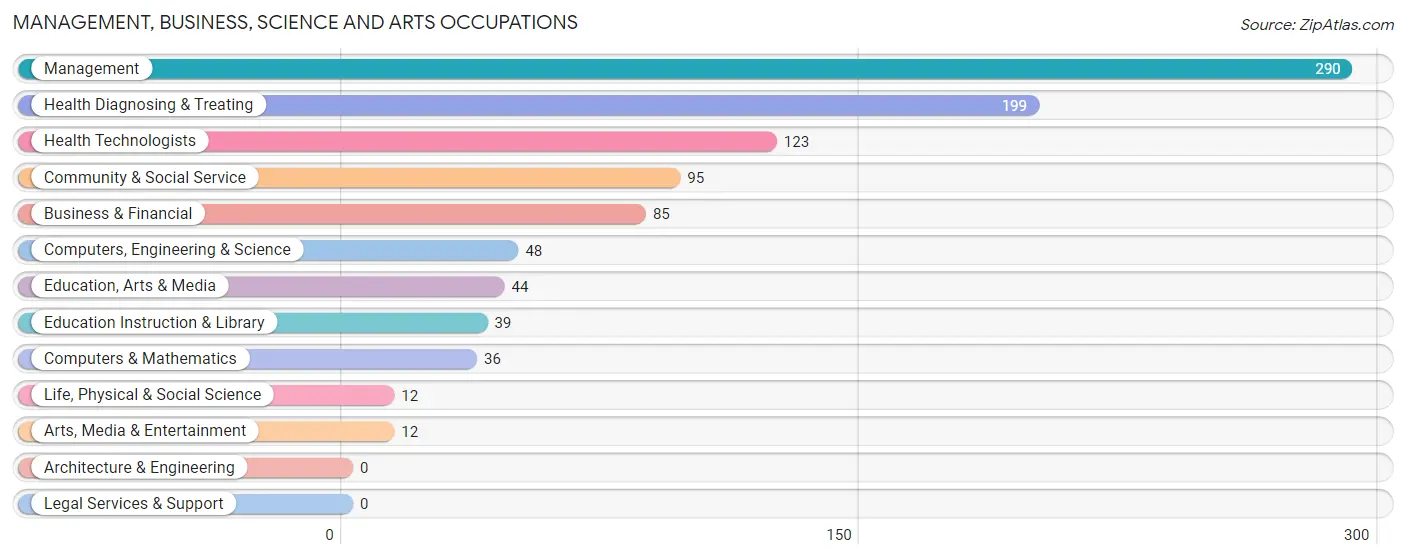
Management, Business, Science and Arts Occupations
The most common Management, Business, Science and Arts occupations in Herculaneum are Management (290 | 12.9%), Health Diagnosing & Treating (199 | 8.8%), Health Technologists (123 | 5.5%), Community & Social Service (95 | 4.2%), and Business & Financial (85 | 3.8%).
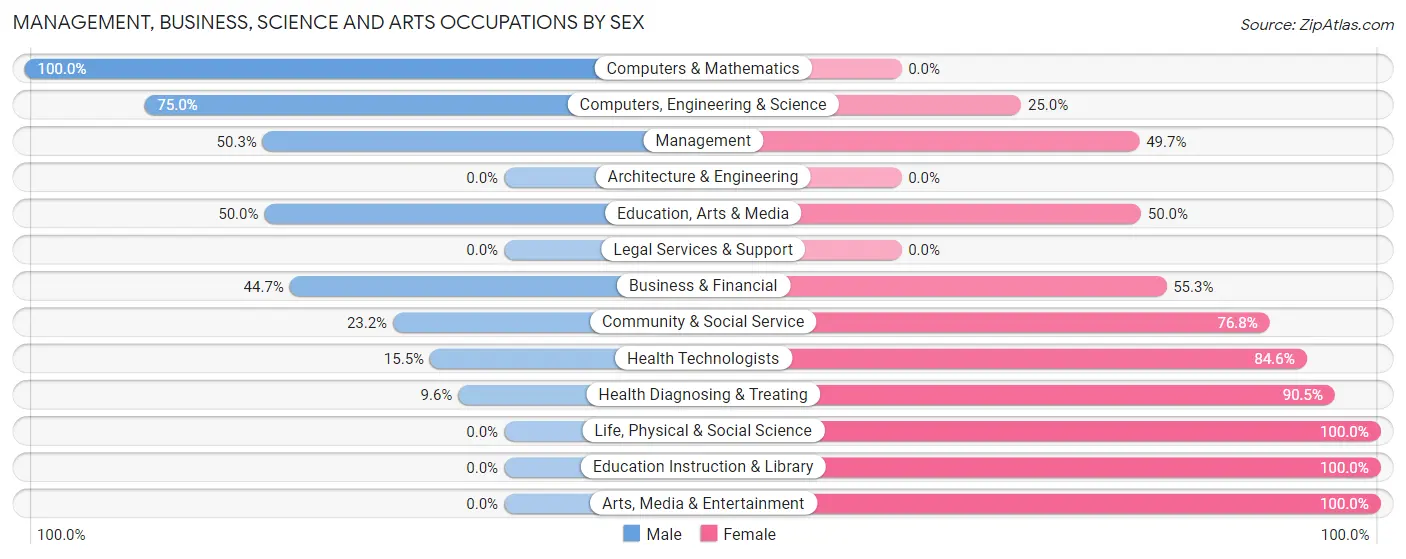
Management, Business, Science and Arts Occupations by Sex
Within the Management, Business, Science and Arts occupations in Herculaneum, the most male-oriented occupations are Computers & Mathematics (100.0%), Computers, Engineering & Science (75.0%), and Management (50.3%), while the most female-oriented occupations are Life, Physical & Social Science (100.0%), Education Instruction & Library (100.0%), and Arts, Media & Entertainment (100.0%).
| Occupation | Male | Female |
| Management | 146 (50.3%) | 144 (49.7%) |
| Business & Financial | 38 (44.7%) | 47 (55.3%) |
| Computers, Engineering & Science | 36 (75.0%) | 12 (25.0%) |
| Computers & Mathematics | 36 (100.0%) | 0 (0.0%) |
| Architecture & Engineering | 0 (0.0%) | 0 (0.0%) |
| Life, Physical & Social Science | 0 (0.0%) | 12 (100.0%) |
| Community & Social Service | 22 (23.2%) | 73 (76.8%) |
| Education, Arts & Media | 22 (50.0%) | 22 (50.0%) |
| Legal Services & Support | 0 (0.0%) | 0 (0.0%) |
| Education Instruction & Library | 0 (0.0%) | 39 (100.0%) |
| Arts, Media & Entertainment | 0 (0.0%) | 12 (100.0%) |
| Health Diagnosing & Treating | 19 (9.6%) | 180 (90.4%) |
| Health Technologists | 19 (15.4%) | 104 (84.6%) |
| Total (Category) | 261 (36.4%) | 456 (63.6%) |
| Total (Overall) | 1,149 (51.1%) | 1,101 (48.9%) |
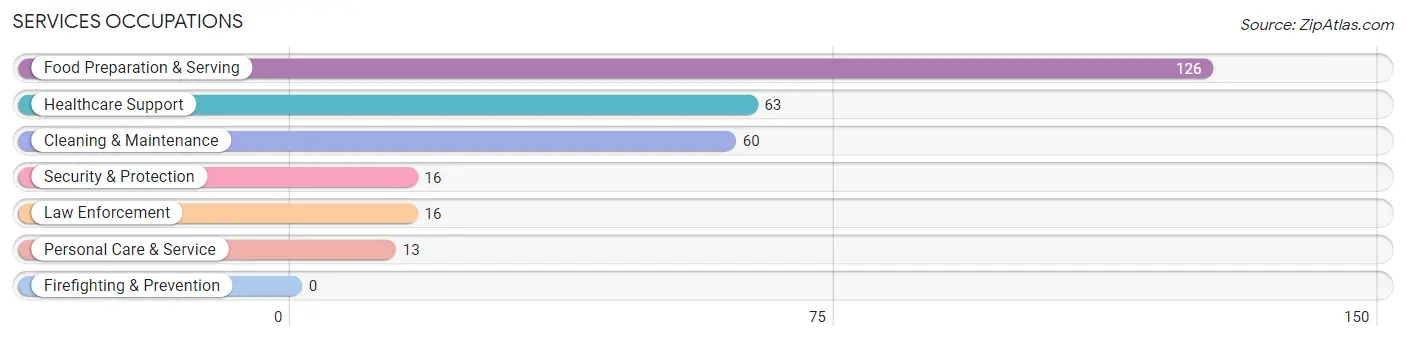
Services Occupations
The most common Services occupations in Herculaneum are Food Preparation & Serving (126 | 5.6%), Healthcare Support (63 | 2.8%), Cleaning & Maintenance (60 | 2.7%), Security & Protection (16 | 0.7%), and Law Enforcement (16 | 0.7%).
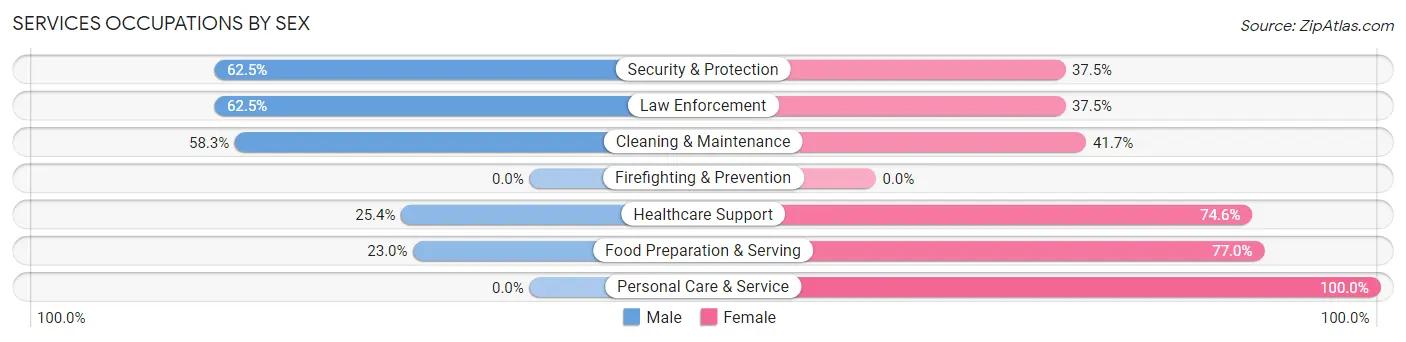
Services Occupations by Sex
Within the Services occupations in Herculaneum, the most male-oriented occupations are Security & Protection (62.5%), Law Enforcement (62.5%), and Cleaning & Maintenance (58.3%), while the most female-oriented occupations are Personal Care & Service (100.0%), Food Preparation & Serving (77.0%), and Healthcare Support (74.6%).
| Occupation | Male | Female |
| Healthcare Support | 16 (25.4%) | 47 (74.6%) |
| Security & Protection | 10 (62.5%) | 6 (37.5%) |
| Firefighting & Prevention | 0 (0.0%) | 0 (0.0%) |
| Law Enforcement | 10 (62.5%) | 6 (37.5%) |
| Food Preparation & Serving | 29 (23.0%) | 97 (77.0%) |
| Cleaning & Maintenance | 35 (58.3%) | 25 (41.7%) |
| Personal Care & Service | 0 (0.0%) | 13 (100.0%) |
| Total (Category) | 90 (32.4%) | 188 (67.6%) |
| Total (Overall) | 1,149 (51.1%) | 1,101 (48.9%) |
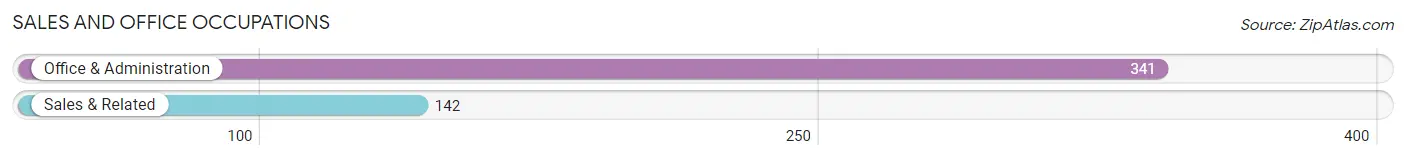
Sales and Office Occupations
The most common Sales and Office occupations in Herculaneum are Office & Administration (341 | 15.2%), and Sales & Related (142 | 6.3%).
Sales and Office Occupations by Sex
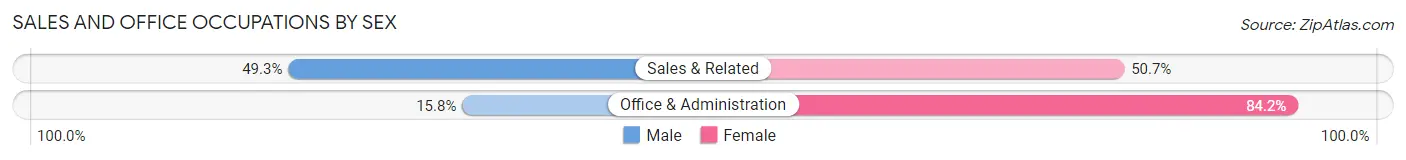
| Occupation | Male | Female |
| Sales & Related | 70 (49.3%) | 72 (50.7%) |
| Office & Administration | 54 (15.8%) | 287 (84.2%) |
| Total (Category) | 124 (25.7%) | 359 (74.3%) |
| Total (Overall) | 1,149 (51.1%) | 1,101 (48.9%) |
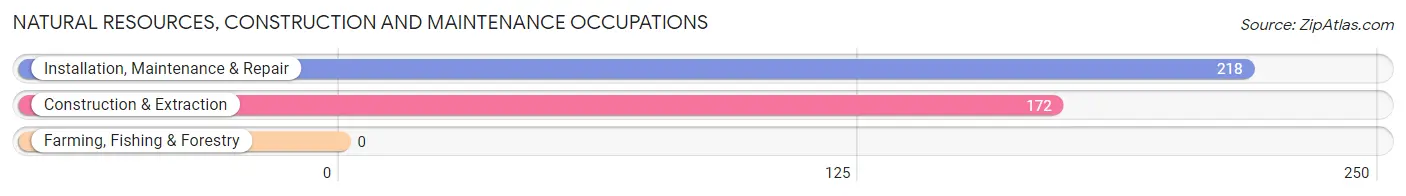
Natural Resources, Construction and Maintenance Occupations
The most common Natural Resources, Construction and Maintenance occupations in Herculaneum are Installation, Maintenance & Repair (218 | 9.7%), and Construction & Extraction (172 | 7.6%).
Natural Resources, Construction and Maintenance Occupations by Sex
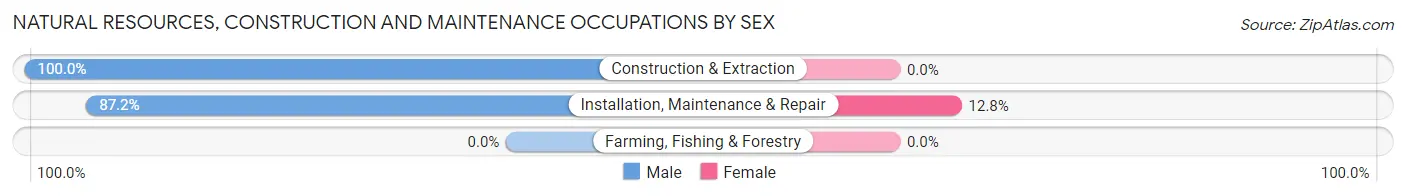
| Occupation | Male | Female |
| Farming, Fishing & Forestry | 0 (0.0%) | 0 (0.0%) |
| Construction & Extraction | 172 (100.0%) | 0 (0.0%) |
| Installation, Maintenance & Repair | 190 (87.2%) | 28 (12.8%) |
| Total (Category) | 362 (92.8%) | 28 (7.2%) |
| Total (Overall) | 1,149 (51.1%) | 1,101 (48.9%) |
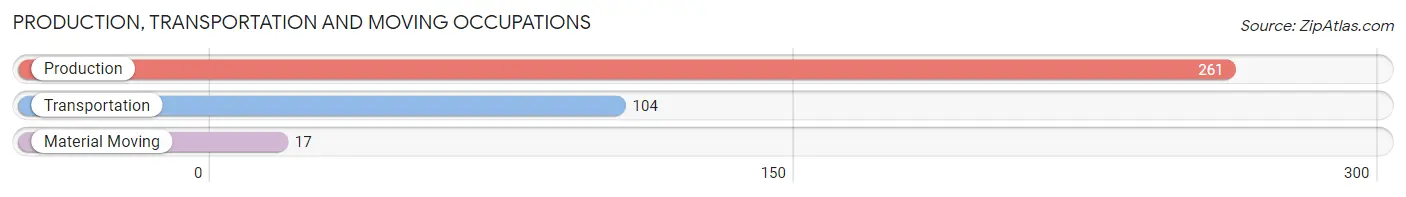
Production, Transportation and Moving Occupations
The most common Production, Transportation and Moving occupations in Herculaneum are Production (261 | 11.6%), Transportation (104 | 4.6%), and Material Moving (17 | 0.8%).
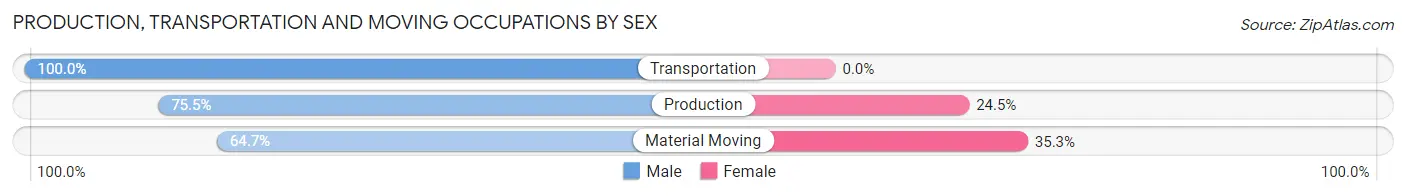
Production, Transportation and Moving Occupations by Sex
| Occupation | Male | Female |
| Production | 197 (75.5%) | 64 (24.5%) |
| Transportation | 104 (100.0%) | 0 (0.0%) |
| Material Moving | 11 (64.7%) | 6 (35.3%) |
| Total (Category) | 312 (81.7%) | 70 (18.3%) |
| Total (Overall) | 1,149 (51.1%) | 1,101 (48.9%) |
Employment Industries by Sex in Herculaneum
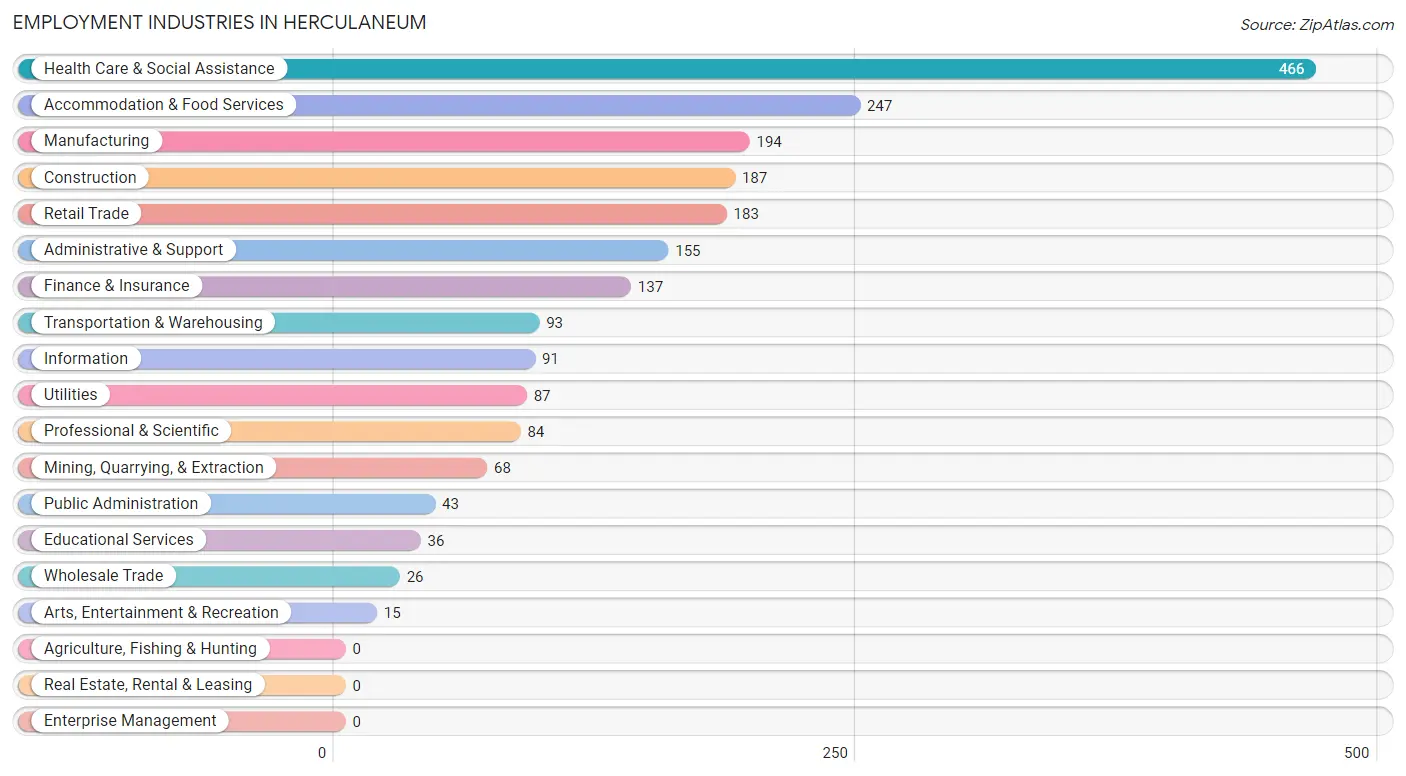
Employment Industries in Herculaneum
The major employment industries in Herculaneum include Health Care & Social Assistance (466 | 20.7%), Accommodation & Food Services (247 | 11.0%), Manufacturing (194 | 8.6%), Construction (187 | 8.3%), and Retail Trade (183 | 8.1%).
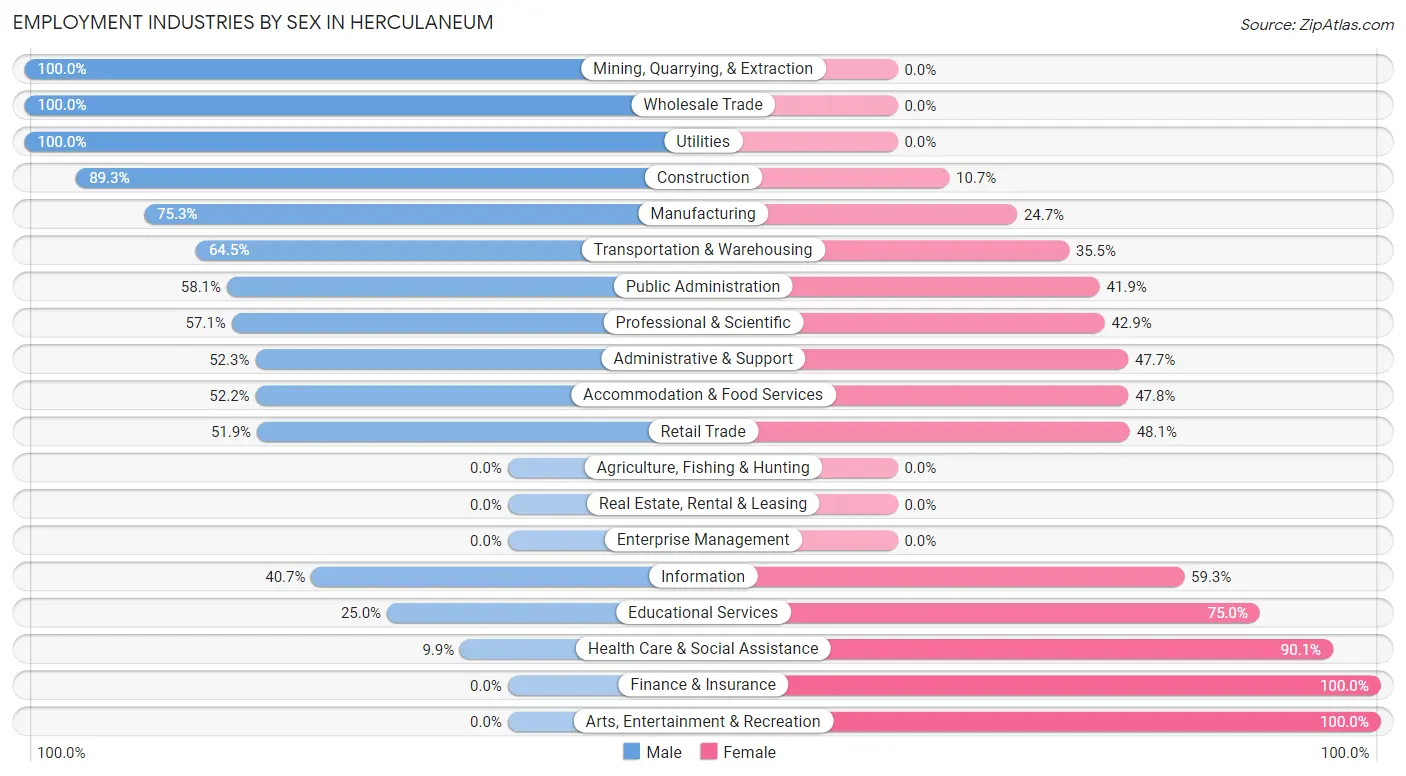
Employment Industries by Sex in Herculaneum
The Herculaneum industries that see more men than women are Mining, Quarrying, & Extraction (100.0%), Wholesale Trade (100.0%), and Utilities (100.0%), whereas the industries that tend to have a higher number of women are Finance & Insurance (100.0%), Arts, Entertainment & Recreation (100.0%), and Health Care & Social Assistance (90.1%).
| Industry | Male | Female |
| Agriculture, Fishing & Hunting | 0 (0.0%) | 0 (0.0%) |
| Mining, Quarrying, & Extraction | 68 (100.0%) | 0 (0.0%) |
| Construction | 167 (89.3%) | 20 (10.7%) |
| Manufacturing | 146 (75.3%) | 48 (24.7%) |
| Wholesale Trade | 26 (100.0%) | 0 (0.0%) |
| Retail Trade | 95 (51.9%) | 88 (48.1%) |
| Transportation & Warehousing | 60 (64.5%) | 33 (35.5%) |
| Utilities | 87 (100.0%) | 0 (0.0%) |
| Information | 37 (40.7%) | 54 (59.3%) |
| Finance & Insurance | 0 (0.0%) | 137 (100.0%) |
| Real Estate, Rental & Leasing | 0 (0.0%) | 0 (0.0%) |
| Professional & Scientific | 48 (57.1%) | 36 (42.9%) |
| Enterprise Management | 0 (0.0%) | 0 (0.0%) |
| Administrative & Support | 81 (52.3%) | 74 (47.7%) |
| Educational Services | 9 (25.0%) | 27 (75.0%) |
| Health Care & Social Assistance | 46 (9.9%) | 420 (90.1%) |
| Arts, Entertainment & Recreation | 0 (0.0%) | 15 (100.0%) |
| Accommodation & Food Services | 129 (52.2%) | 118 (47.8%) |
| Public Administration | 25 (58.1%) | 18 (41.9%) |
| Total | 1,149 (51.1%) | 1,101 (48.9%) |
Education in Herculaneum
School Enrollment in Herculaneum
The most common levels of schooling among the 1,151 students in Herculaneum are high school (309 | 26.9%), middle school (287 | 24.9%), and elementary school (229 | 19.9%).
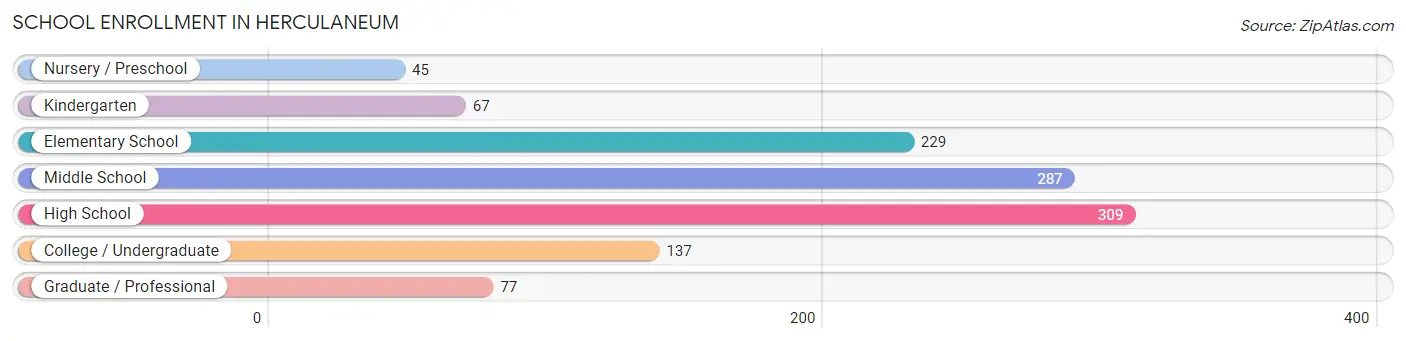
| School Level | # Students | % Students |
| Nursery / Preschool | 45 | 3.9% |
| Kindergarten | 67 | 5.8% |
| Elementary School | 229 | 19.9% |
| Middle School | 287 | 24.9% |
| High School | 309 | 26.9% |
| College / Undergraduate | 137 | 11.9% |
| Graduate / Professional | 77 | 6.7% |
| Total | 1,151 | 100.0% |
School Enrollment by Age by Funding Source in Herculaneum
Out of a total of 1,151 students who are enrolled in schools in Herculaneum, 192 (16.7%) attend a private institution, while the remaining 959 (83.3%) are enrolled in public schools. The age group of 3 to 4 year olds has the highest likelihood of being enrolled in private schools, with 13 (100.0% in the age bracket) enrolled. Conversely, the age group of 10 to 14 year olds has the lowest likelihood of being enrolled in a private school, with 379 (100.0% in the age bracket) attending a public institution.
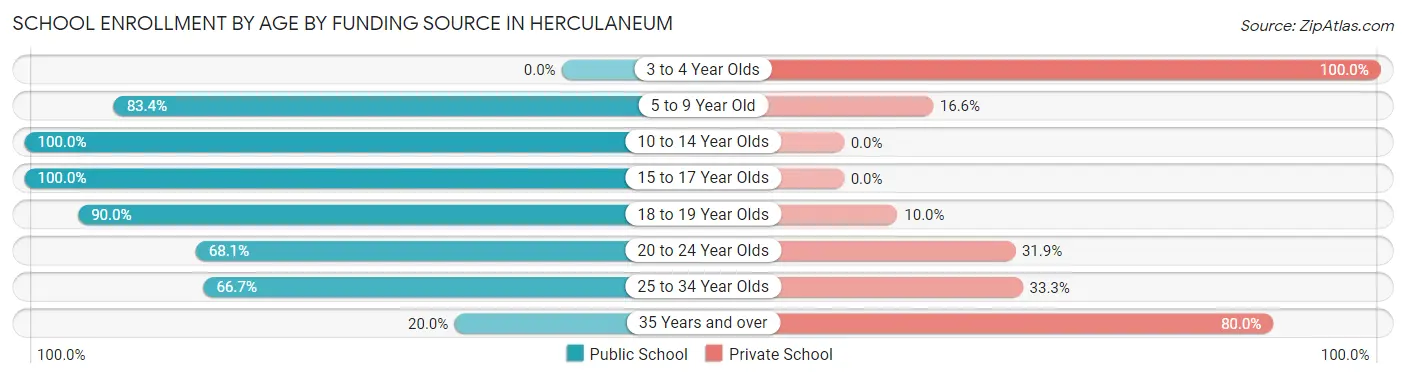
| Age Bracket | Public School | Private School |
| 3 to 4 Year Olds | 0 (0.0%) | 13 (100.0%) |
| 5 to 9 Year Old | 266 (83.4%) | 53 (16.6%) |
| 10 to 14 Year Olds | 379 (100.0%) | 0 (0.0%) |
| 15 to 17 Year Olds | 130 (100.0%) | 0 (0.0%) |
| 18 to 19 Year Olds | 108 (90.0%) | 12 (10.0%) |
| 20 to 24 Year Olds | 32 (68.1%) | 15 (31.9%) |
| 25 to 34 Year Olds | 22 (66.7%) | 11 (33.3%) |
| 35 Years and over | 22 (20.0%) | 88 (80.0%) |
| Total | 959 (83.3%) | 192 (16.7%) |
Educational Attainment by Field of Study in Herculaneum
Business (212 | 31.1%), education (204 | 29.9%), arts & humanities (49 | 7.2%), physical & health sciences (47 | 6.9%), and science & technology (37 | 5.4%) are the most common fields of study among 682 individuals in Herculaneum who have obtained a bachelor's degree or higher.
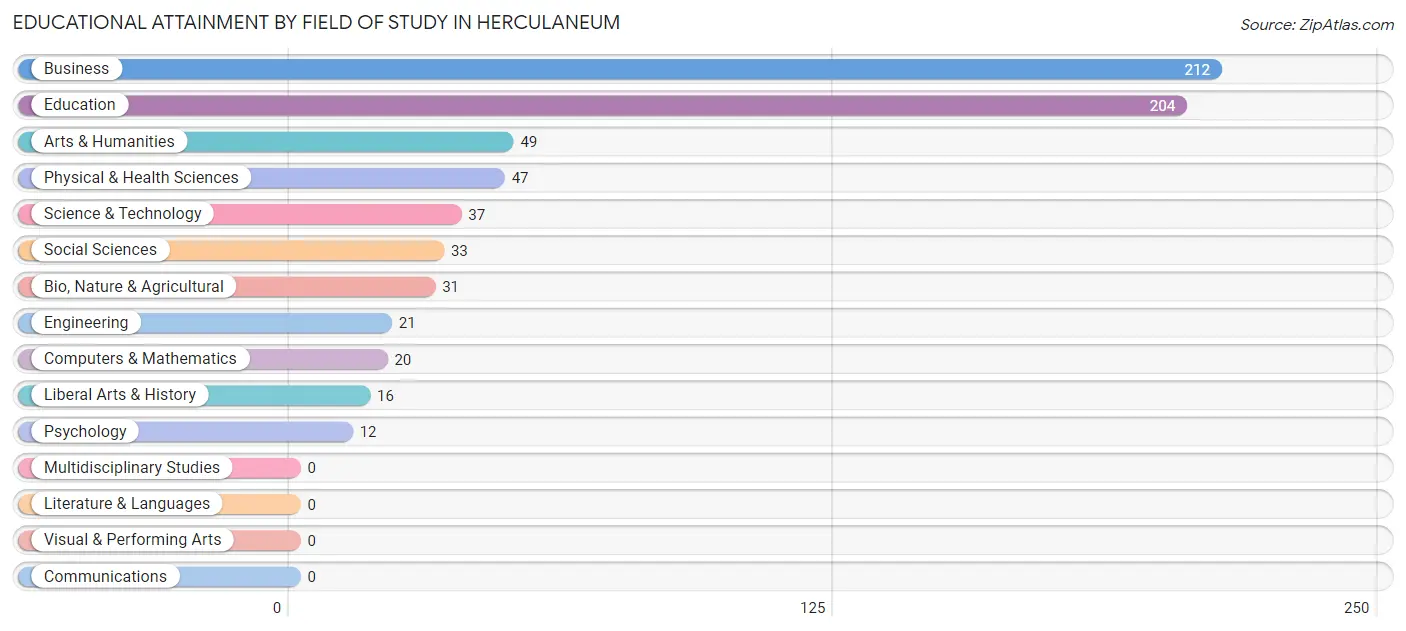
| Field of Study | # Graduates | % Graduates |
| Computers & Mathematics | 20 | 2.9% |
| Bio, Nature & Agricultural | 31 | 4.5% |
| Physical & Health Sciences | 47 | 6.9% |
| Psychology | 12 | 1.8% |
| Social Sciences | 33 | 4.8% |
| Engineering | 21 | 3.1% |
| Multidisciplinary Studies | 0 | 0.0% |
| Science & Technology | 37 | 5.4% |
| Business | 212 | 31.1% |
| Education | 204 | 29.9% |
| Literature & Languages | 0 | 0.0% |
| Liberal Arts & History | 16 | 2.4% |
| Visual & Performing Arts | 0 | 0.0% |
| Communications | 0 | 0.0% |
| Arts & Humanities | 49 | 7.2% |
| Total | 682 | 100.0% |
Transportation & Commute in Herculaneum
Vehicle Availability by Sex in Herculaneum
The most prevalent vehicle ownership categories in Herculaneum are males with 2 vehicles (492, accounting for 42.8%) and females with 2 vehicles (497, making up 44.7%).
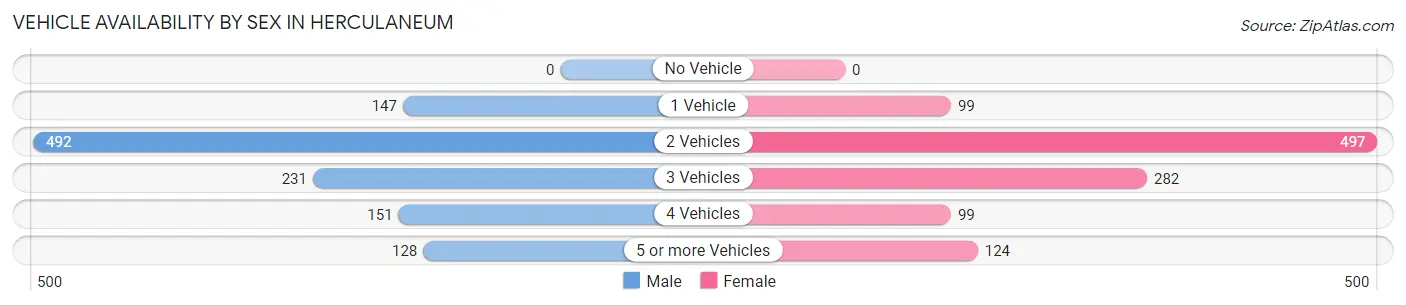
| Vehicles Available | Male | Female |
| No Vehicle | 0 (0.0%) | 0 (0.0%) |
| 1 Vehicle | 147 (12.8%) | 99 (9.0%) |
| 2 Vehicles | 492 (42.8%) | 497 (45.1%) |
| 3 Vehicles | 231 (20.1%) | 282 (25.6%) |
| 4 Vehicles | 151 (13.1%) | 99 (9.0%) |
| 5 or more Vehicles | 128 (11.1%) | 124 (11.3%) |
| Total | 1,149 (100.0%) | 1,101 (100.0%) |
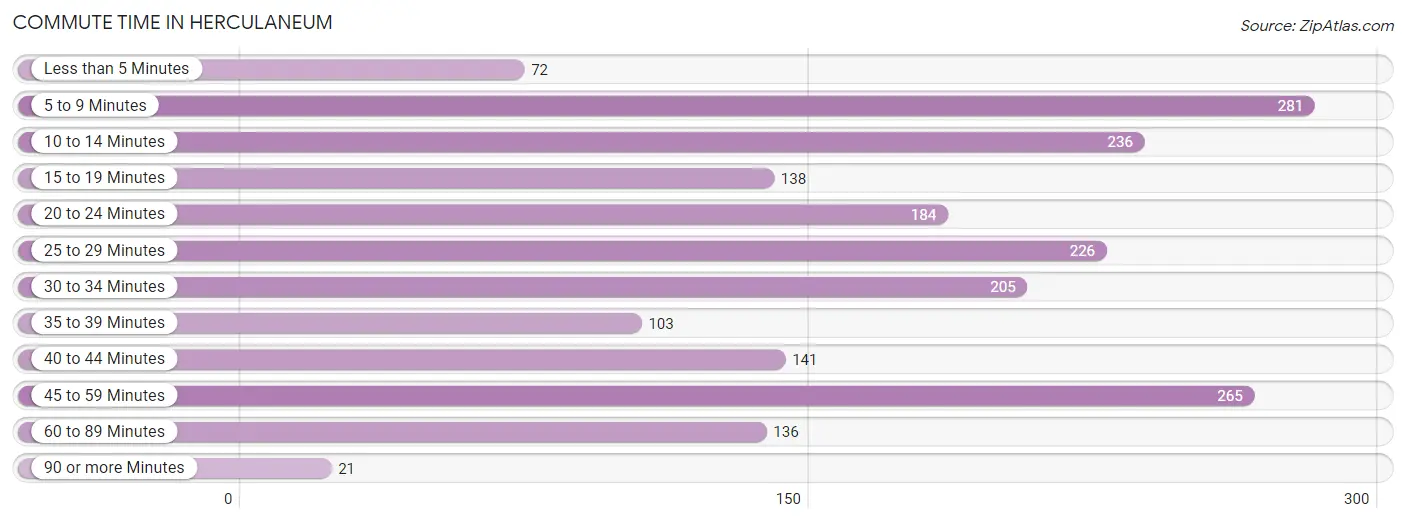
Commute Time in Herculaneum
The most frequently occuring commute durations in Herculaneum are 5 to 9 minutes (281 commuters, 14.0%), 45 to 59 minutes (265 commuters, 13.2%), and 10 to 14 minutes (236 commuters, 11.7%).
| Commute Time | # Commuters | % Commuters |
| Less than 5 Minutes | 72 | 3.6% |
| 5 to 9 Minutes | 281 | 14.0% |
| 10 to 14 Minutes | 236 | 11.7% |
| 15 to 19 Minutes | 138 | 6.9% |
| 20 to 24 Minutes | 184 | 9.2% |
| 25 to 29 Minutes | 226 | 11.3% |
| 30 to 34 Minutes | 205 | 10.2% |
| 35 to 39 Minutes | 103 | 5.1% |
| 40 to 44 Minutes | 141 | 7.0% |
| 45 to 59 Minutes | 265 | 13.2% |
| 60 to 89 Minutes | 136 | 6.8% |
| 90 or more Minutes | 21 | 1.1% |
Commute Time by Sex in Herculaneum
The most common commute times in Herculaneum are 45 to 59 minutes (189 commuters, 17.3%) for males and 5 to 9 minutes (147 commuters, 16.1%) for females.
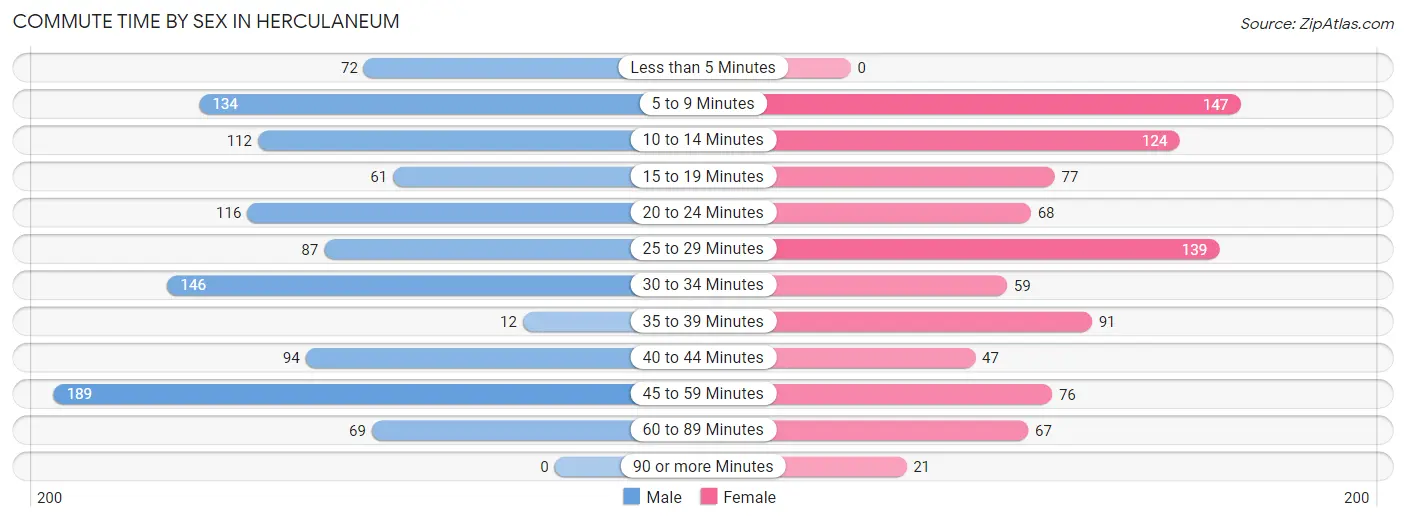
| Commute Time | Male | Female |
| Less than 5 Minutes | 72 (6.6%) | 0 (0.0%) |
| 5 to 9 Minutes | 134 (12.3%) | 147 (16.1%) |
| 10 to 14 Minutes | 112 (10.3%) | 124 (13.5%) |
| 15 to 19 Minutes | 61 (5.6%) | 77 (8.4%) |
| 20 to 24 Minutes | 116 (10.6%) | 68 (7.4%) |
| 25 to 29 Minutes | 87 (8.0%) | 139 (15.2%) |
| 30 to 34 Minutes | 146 (13.4%) | 59 (6.4%) |
| 35 to 39 Minutes | 12 (1.1%) | 91 (9.9%) |
| 40 to 44 Minutes | 94 (8.6%) | 47 (5.1%) |
| 45 to 59 Minutes | 189 (17.3%) | 76 (8.3%) |
| 60 to 89 Minutes | 69 (6.3%) | 67 (7.3%) |
| 90 or more Minutes | 0 (0.0%) | 21 (2.3%) |
Time of Departure to Work by Sex in Herculaneum
The most frequent times of departure to work in Herculaneum are 5:30 AM to 5:59 AM (224, 20.5%) for males and 6:30 AM to 6:59 AM (198, 21.6%) for females.
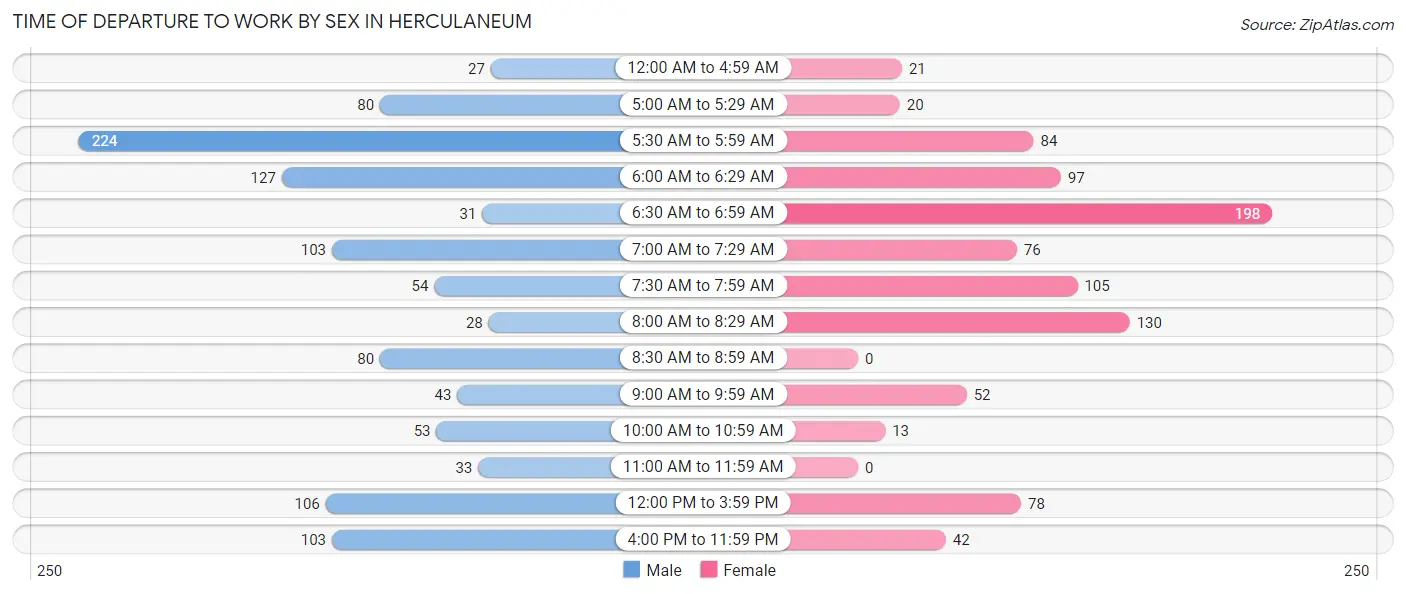
| Time of Departure | Male | Female |
| 12:00 AM to 4:59 AM | 27 (2.5%) | 21 (2.3%) |
| 5:00 AM to 5:29 AM | 80 (7.3%) | 20 (2.2%) |
| 5:30 AM to 5:59 AM | 224 (20.5%) | 84 (9.2%) |
| 6:00 AM to 6:29 AM | 127 (11.6%) | 97 (10.6%) |
| 6:30 AM to 6:59 AM | 31 (2.8%) | 198 (21.6%) |
| 7:00 AM to 7:29 AM | 103 (9.4%) | 76 (8.3%) |
| 7:30 AM to 7:59 AM | 54 (5.0%) | 105 (11.5%) |
| 8:00 AM to 8:29 AM | 28 (2.6%) | 130 (14.2%) |
| 8:30 AM to 8:59 AM | 80 (7.3%) | 0 (0.0%) |
| 9:00 AM to 9:59 AM | 43 (3.9%) | 52 (5.7%) |
| 10:00 AM to 10:59 AM | 53 (4.9%) | 13 (1.4%) |
| 11:00 AM to 11:59 AM | 33 (3.0%) | 0 (0.0%) |
| 12:00 PM to 3:59 PM | 106 (9.7%) | 78 (8.5%) |
| 4:00 PM to 11:59 PM | 103 (9.4%) | 42 (4.6%) |
| Total | 1,092 (100.0%) | 916 (100.0%) |
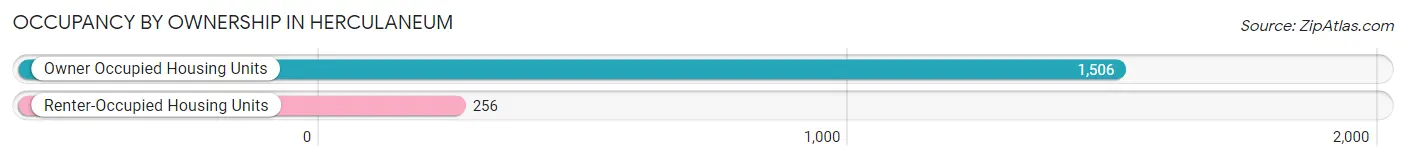
Housing Occupancy in Herculaneum
Occupancy by Ownership in Herculaneum
Of the total 1,762 dwellings in Herculaneum, owner-occupied units account for 1,506 (85.5%), while renter-occupied units make up 256 (14.5%).
| Occupancy | # Housing Units | % Housing Units |
| Owner Occupied Housing Units | 1,506 | 85.5% |
| Renter-Occupied Housing Units | 256 | 14.5% |
| Total Occupied Housing Units | 1,762 | 100.0% |
Occupancy by Household Size in Herculaneum
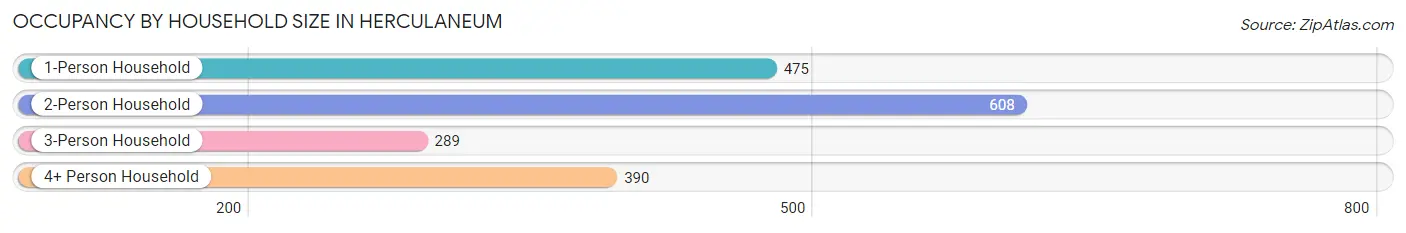
| Household Size | # Housing Units | % Housing Units |
| 1-Person Household | 475 | 27.0% |
| 2-Person Household | 608 | 34.5% |
| 3-Person Household | 289 | 16.4% |
| 4+ Person Household | 390 | 22.1% |
| Total Housing Units | 1,762 | 100.0% |
Occupancy by Ownership by Household Size in Herculaneum
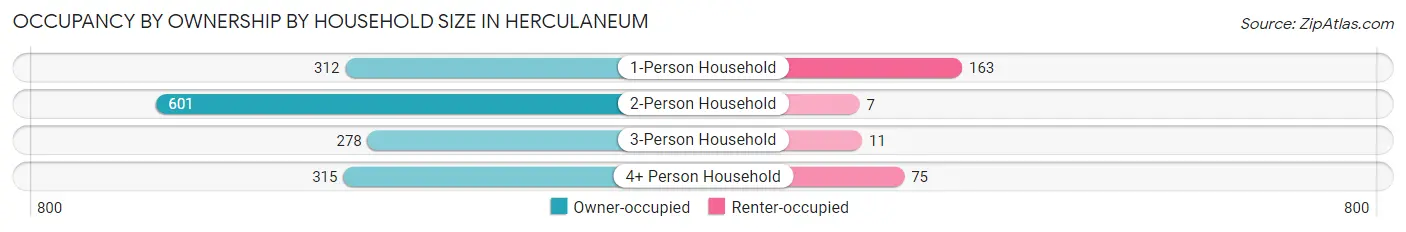
| Household Size | Owner-occupied | Renter-occupied |
| 1-Person Household | 312 (65.7%) | 163 (34.3%) |
| 2-Person Household | 601 (98.9%) | 7 (1.1%) |
| 3-Person Household | 278 (96.2%) | 11 (3.8%) |
| 4+ Person Household | 315 (80.8%) | 75 (19.2%) |
| Total Housing Units | 1,506 (85.5%) | 256 (14.5%) |
Occupancy by Educational Attainment in Herculaneum
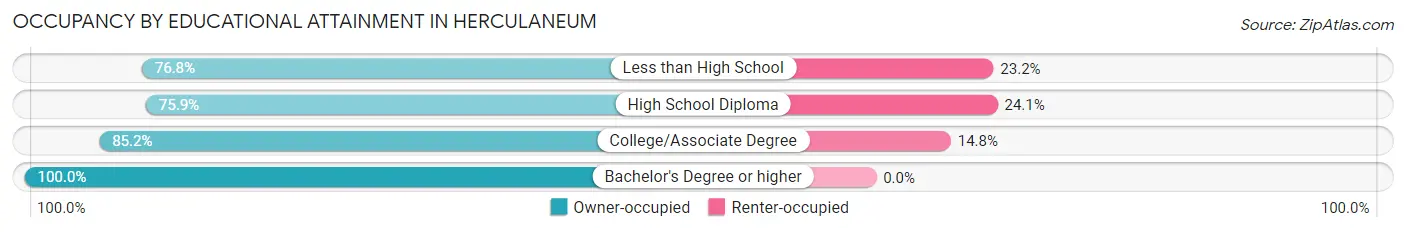
| Household Size | Owner-occupied | Renter-occupied |
| Less than High School | 109 (76.8%) | 33 (23.2%) |
| High School Diploma | 303 (75.9%) | 96 (24.1%) |
| College/Associate Degree | 731 (85.2%) | 127 (14.8%) |
| Bachelor's Degree or higher | 363 (100.0%) | 0 (0.0%) |
Occupancy by Age of Householder in Herculaneum
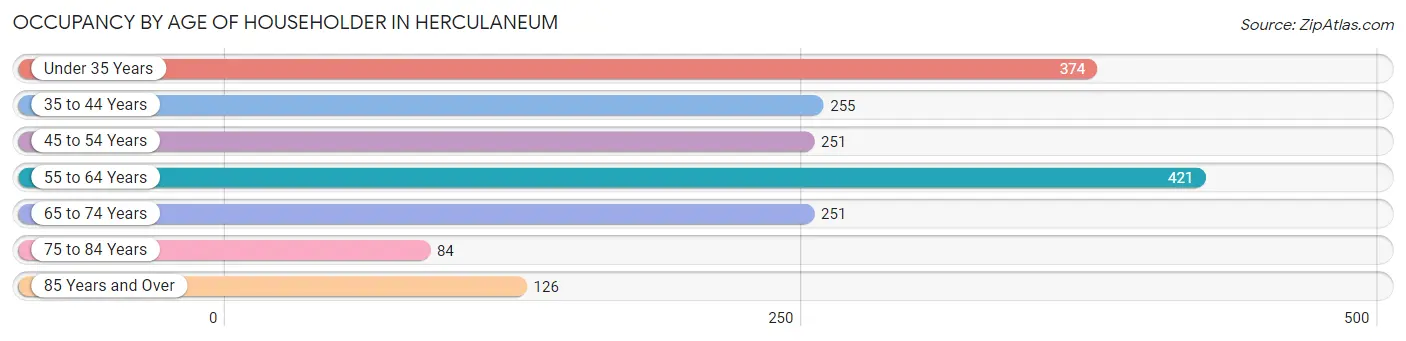
| Age Bracket | # Households | % Households |
| Under 35 Years | 374 | 21.2% |
| 35 to 44 Years | 255 | 14.5% |
| 45 to 54 Years | 251 | 14.2% |
| 55 to 64 Years | 421 | 23.9% |
| 65 to 74 Years | 251 | 14.2% |
| 75 to 84 Years | 84 | 4.8% |
| 85 Years and Over | 126 | 7.1% |
| Total | 1,762 | 100.0% |
Housing Finances in Herculaneum
Median Income by Occupancy in Herculaneum
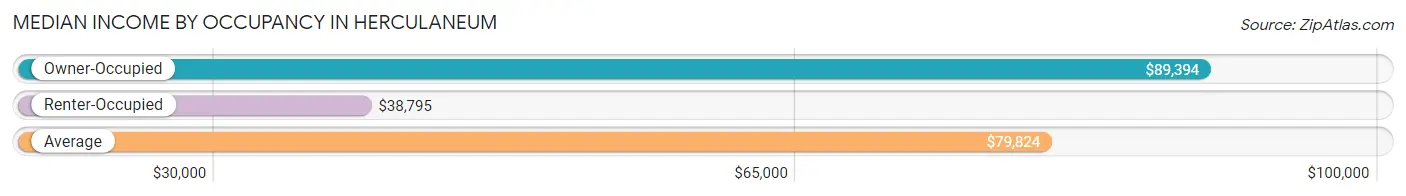
| Occupancy Type | # Households | Median Income |
| Owner-Occupied | 1,506 (85.5%) | $89,394 |
| Renter-Occupied | 256 (14.5%) | $38,795 |
| Average | 1,762 (100.0%) | $79,824 |
Occupancy by Householder Income Bracket in Herculaneum
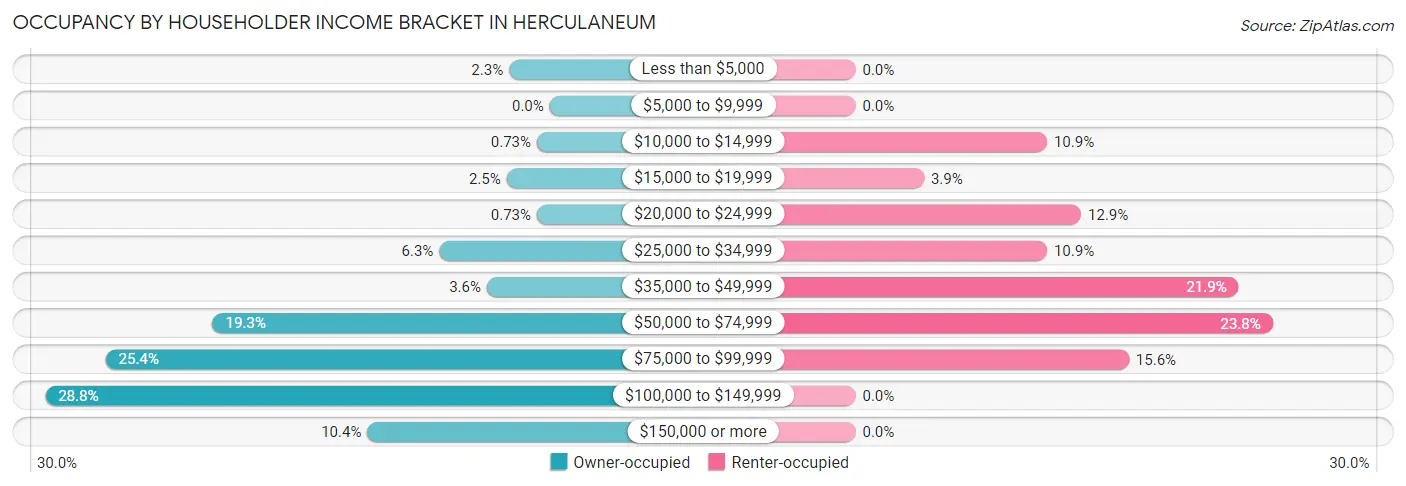
| Income Bracket | Owner-occupied | Renter-occupied |
| Less than $5,000 | 35 (2.3%) | 0 (0.0%) |
| $5,000 to $9,999 | 0 (0.0%) | 0 (0.0%) |
| $10,000 to $14,999 | 11 (0.7%) | 28 (10.9%) |
| $15,000 to $19,999 | 37 (2.5%) | 10 (3.9%) |
| $20,000 to $24,999 | 11 (0.7%) | 33 (12.9%) |
| $25,000 to $34,999 | 95 (6.3%) | 28 (10.9%) |
| $35,000 to $49,999 | 54 (3.6%) | 56 (21.9%) |
| $50,000 to $74,999 | 290 (19.3%) | 61 (23.8%) |
| $75,000 to $99,999 | 382 (25.4%) | 40 (15.6%) |
| $100,000 to $149,999 | 434 (28.8%) | 0 (0.0%) |
| $150,000 or more | 157 (10.4%) | 0 (0.0%) |
| Total | 1,506 (100.0%) | 256 (100.0%) |
Monthly Housing Cost Tiers in Herculaneum
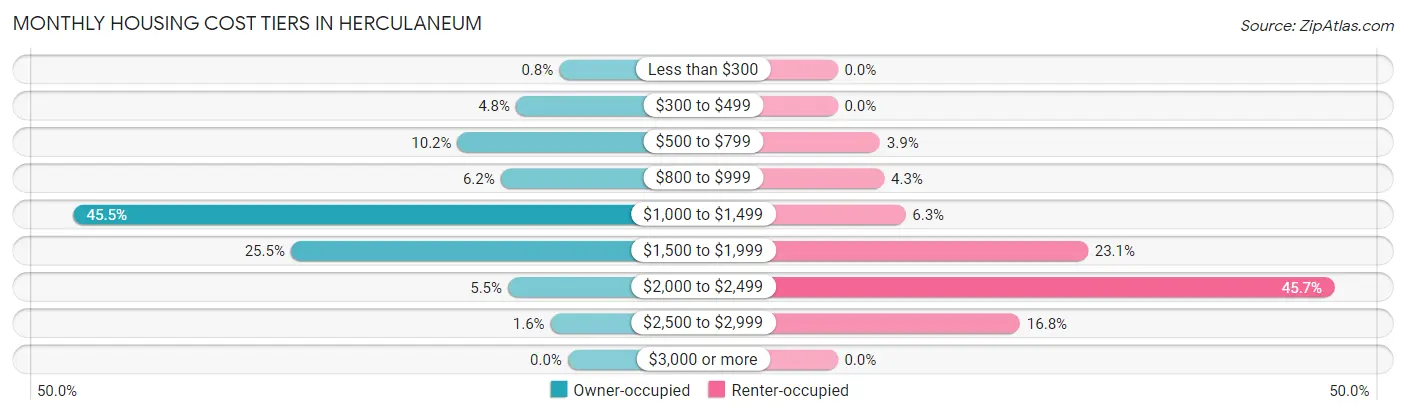
| Monthly Cost | Owner-occupied | Renter-occupied |
| Less than $300 | 12 (0.8%) | 0 (0.0%) |
| $300 to $499 | 72 (4.8%) | 0 (0.0%) |
| $500 to $799 | 153 (10.2%) | 10 (3.9%) |
| $800 to $999 | 93 (6.2%) | 11 (4.3%) |
| $1,000 to $1,499 | 685 (45.5%) | 16 (6.2%) |
| $1,500 to $1,999 | 384 (25.5%) | 59 (23.1%) |
| $2,000 to $2,499 | 83 (5.5%) | 117 (45.7%) |
| $2,500 to $2,999 | 24 (1.6%) | 43 (16.8%) |
| $3,000 or more | 0 (0.0%) | 0 (0.0%) |
| Total | 1,506 (100.0%) | 256 (100.0%) |
Physical Housing Characteristics in Herculaneum
Housing Structures in Herculaneum
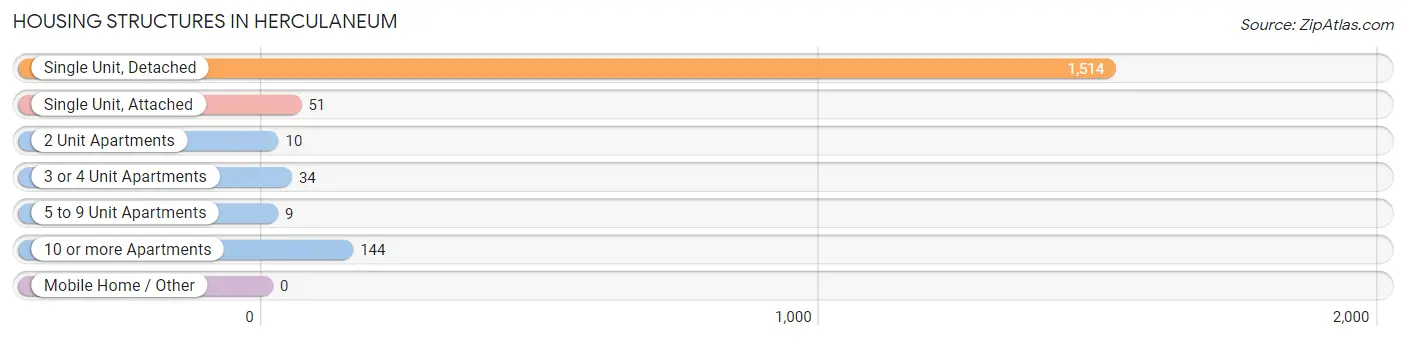
| Structure Type | # Housing Units | % Housing Units |
| Single Unit, Detached | 1,514 | 85.9% |
| Single Unit, Attached | 51 | 2.9% |
| 2 Unit Apartments | 10 | 0.6% |
| 3 or 4 Unit Apartments | 34 | 1.9% |
| 5 to 9 Unit Apartments | 9 | 0.5% |
| 10 or more Apartments | 144 | 8.2% |
| Mobile Home / Other | 0 | 0.0% |
| Total | 1,762 | 100.0% |
Housing Structures by Occupancy in Herculaneum
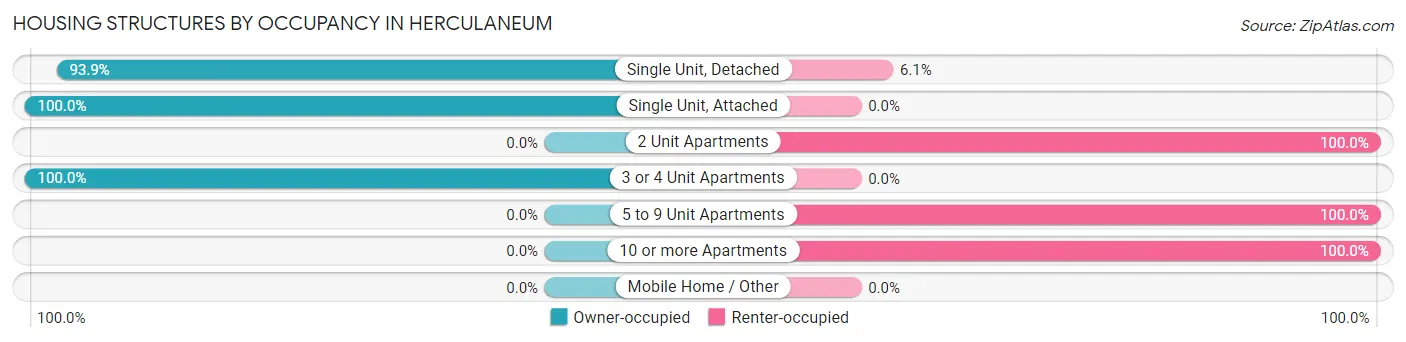
| Structure Type | Owner-occupied | Renter-occupied |
| Single Unit, Detached | 1,421 (93.9%) | 93 (6.1%) |
| Single Unit, Attached | 51 (100.0%) | 0 (0.0%) |
| 2 Unit Apartments | 0 (0.0%) | 10 (100.0%) |
| 3 or 4 Unit Apartments | 34 (100.0%) | 0 (0.0%) |
| 5 to 9 Unit Apartments | 0 (0.0%) | 9 (100.0%) |
| 10 or more Apartments | 0 (0.0%) | 144 (100.0%) |
| Mobile Home / Other | 0 (0.0%) | 0 (0.0%) |
| Total | 1,506 (85.5%) | 256 (14.5%) |
Housing Structures by Number of Rooms in Herculaneum
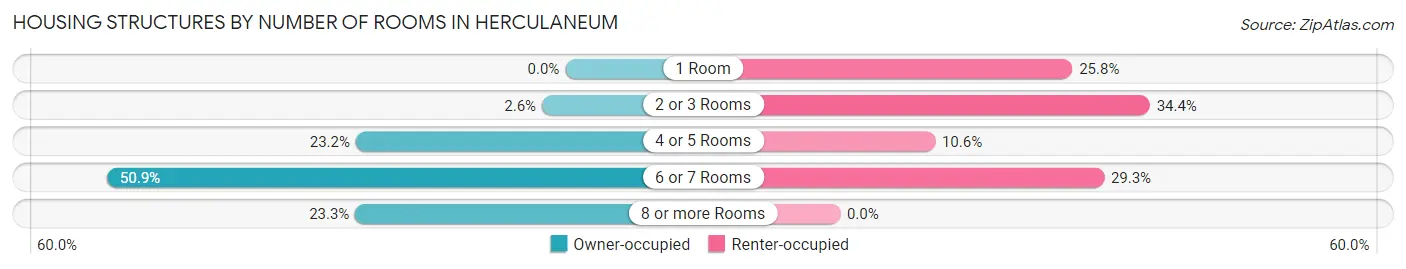
| Number of Rooms | Owner-occupied | Renter-occupied |
| 1 Room | 0 (0.0%) | 66 (25.8%) |
| 2 or 3 Rooms | 39 (2.6%) | 88 (34.4%) |
| 4 or 5 Rooms | 350 (23.2%) | 27 (10.5%) |
| 6 or 7 Rooms | 766 (50.9%) | 75 (29.3%) |
| 8 or more Rooms | 351 (23.3%) | 0 (0.0%) |
| Total | 1,506 (100.0%) | 256 (100.0%) |
Housing Structure by Heating Type in Herculaneum
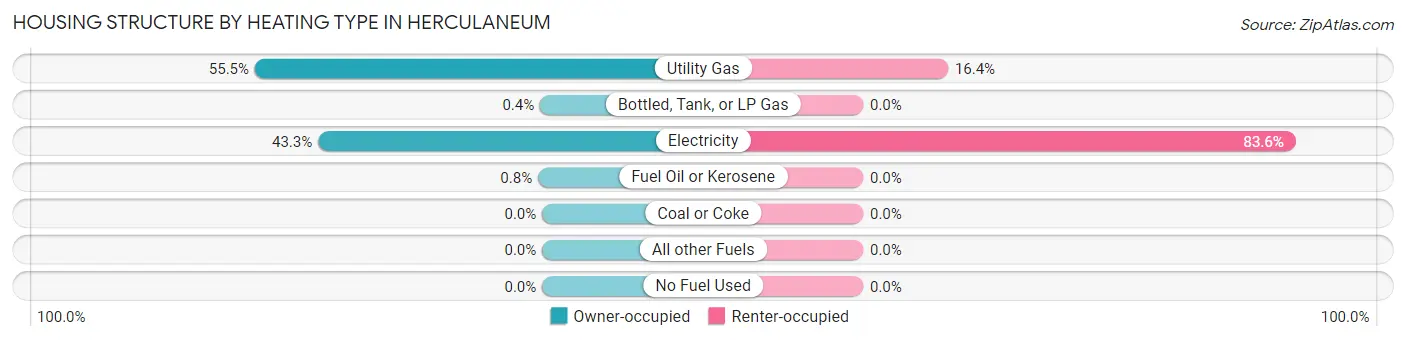
| Heating Type | Owner-occupied | Renter-occupied |
| Utility Gas | 836 (55.5%) | 42 (16.4%) |
| Bottled, Tank, or LP Gas | 6 (0.4%) | 0 (0.0%) |
| Electricity | 652 (43.3%) | 214 (83.6%) |
| Fuel Oil or Kerosene | 12 (0.8%) | 0 (0.0%) |
| Coal or Coke | 0 (0.0%) | 0 (0.0%) |
| All other Fuels | 0 (0.0%) | 0 (0.0%) |
| No Fuel Used | 0 (0.0%) | 0 (0.0%) |
| Total | 1,506 (100.0%) | 256 (100.0%) |
Household Vehicle Usage in Herculaneum
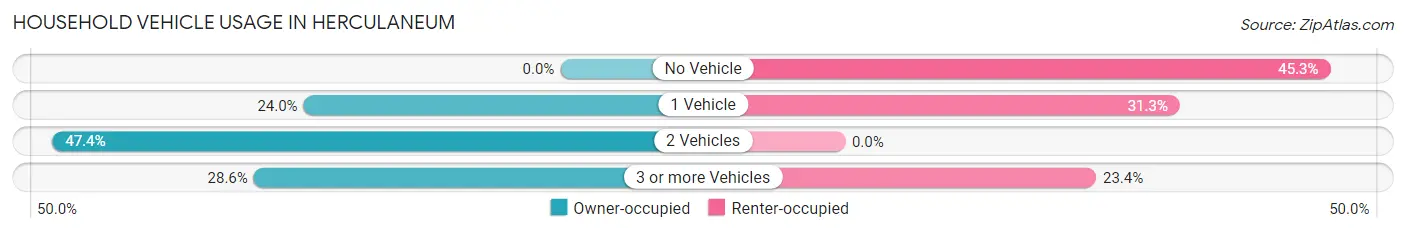
| Vehicles per Household | Owner-occupied | Renter-occupied |
| No Vehicle | 0 (0.0%) | 116 (45.3%) |
| 1 Vehicle | 361 (24.0%) | 80 (31.2%) |
| 2 Vehicles | 714 (47.4%) | 0 (0.0%) |
| 3 or more Vehicles | 431 (28.6%) | 60 (23.4%) |
| Total | 1,506 (100.0%) | 256 (100.0%) |
Real Estate & Mortgages in Herculaneum
Real Estate and Mortgage Overview in Herculaneum
| Characteristic | Without Mortgage | With Mortgage |
| Housing Units | 223 | 1,283 |
| Median Property Value | $183,000 | $201,200 |
| Median Household Income | $74,028 | $122 |
| Monthly Housing Costs | $538 | $0 |
| Real Estate Taxes | $1,633 | $55 |
Property Value by Mortgage Status in Herculaneum
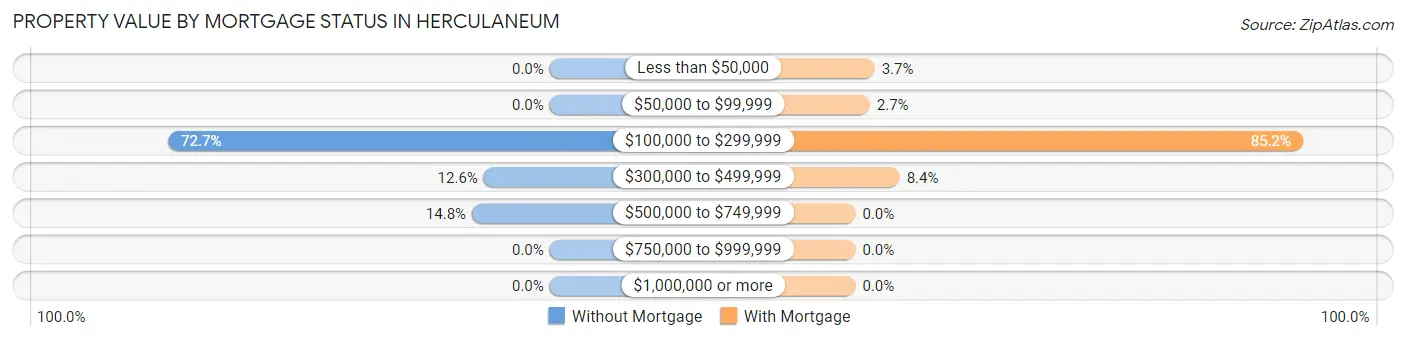
| Property Value | Without Mortgage | With Mortgage |
| Less than $50,000 | 0 (0.0%) | 47 (3.7%) |
| $50,000 to $99,999 | 0 (0.0%) | 35 (2.7%) |
| $100,000 to $299,999 | 162 (72.7%) | 1,093 (85.2%) |
| $300,000 to $499,999 | 28 (12.6%) | 108 (8.4%) |
| $500,000 to $749,999 | 33 (14.8%) | 0 (0.0%) |
| $750,000 to $999,999 | 0 (0.0%) | 0 (0.0%) |
| $1,000,000 or more | 0 (0.0%) | 0 (0.0%) |
| Total | 223 (100.0%) | 1,283 (100.0%) |
Household Income by Mortgage Status in Herculaneum
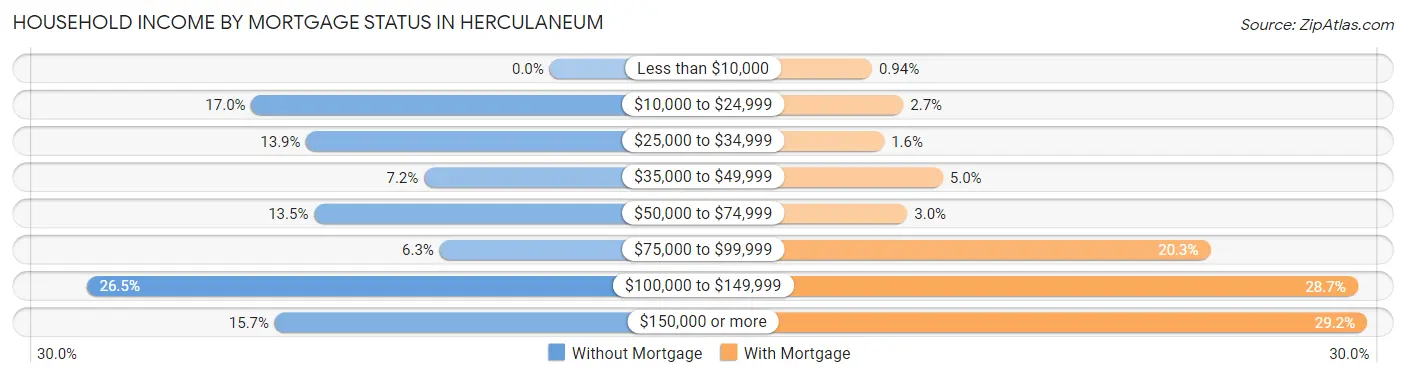
| Household Income | Without Mortgage | With Mortgage |
| Less than $10,000 | 0 (0.0%) | 12 (0.9%) |
| $10,000 to $24,999 | 38 (17.0%) | 35 (2.7%) |
| $25,000 to $34,999 | 31 (13.9%) | 21 (1.6%) |
| $35,000 to $49,999 | 16 (7.2%) | 64 (5.0%) |
| $50,000 to $74,999 | 30 (13.5%) | 38 (3.0%) |
| $75,000 to $99,999 | 14 (6.3%) | 260 (20.3%) |
| $100,000 to $149,999 | 59 (26.5%) | 368 (28.7%) |
| $150,000 or more | 35 (15.7%) | 375 (29.2%) |
| Total | 223 (100.0%) | 1,283 (100.0%) |
Property Value to Household Income Ratio in Herculaneum
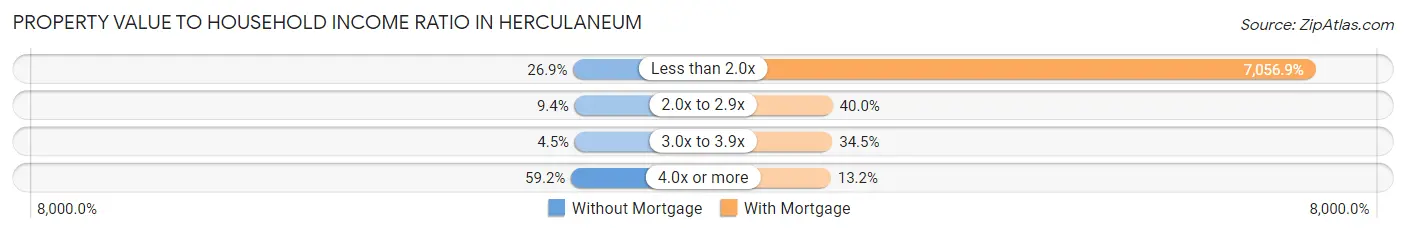
| Value-to-Income Ratio | Without Mortgage | With Mortgage |
| Less than 2.0x | 60 (26.9%) | 90,540 (7,056.9%) |
| 2.0x to 2.9x | 21 (9.4%) | 513 (40.0%) |
| 3.0x to 3.9x | 10 (4.5%) | 442 (34.4%) |
| 4.0x or more | 132 (59.2%) | 169 (13.2%) |
| Total | 223 (100.0%) | 1,283 (100.0%) |
Real Estate Taxes by Mortgage Status in Herculaneum
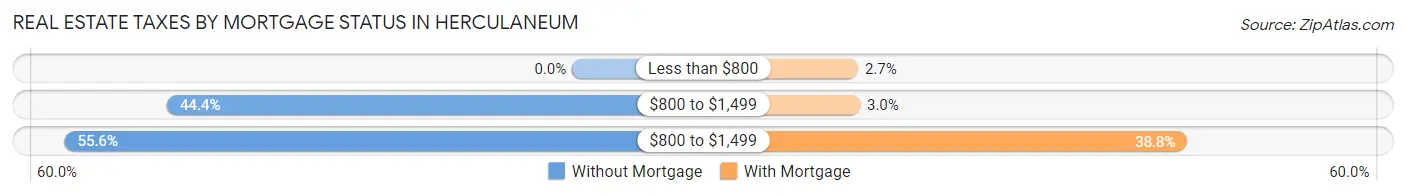
| Property Taxes | Without Mortgage | With Mortgage |
| Less than $800 | 0 (0.0%) | 35 (2.7%) |
| $800 to $1,499 | 99 (44.4%) | 38 (3.0%) |
| $800 to $1,499 | 124 (55.6%) | 498 (38.8%) |
| Total | 223 (100.0%) | 1,283 (100.0%) |
Health & Disability in Herculaneum
Health Insurance Coverage by Age in Herculaneum
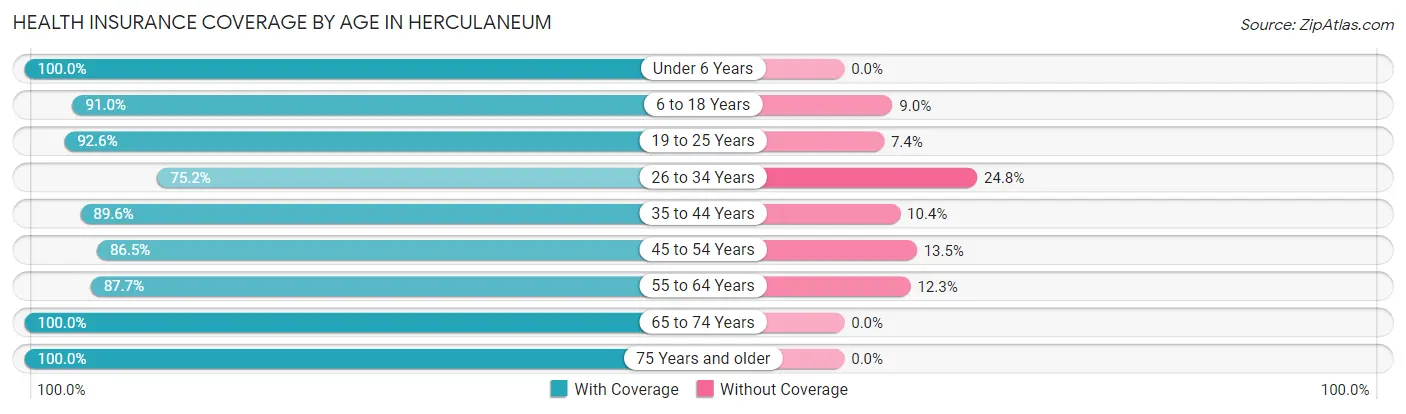
| Age Bracket | With Coverage | Without Coverage |
| Under 6 Years | 214 (100.0%) | 0 (0.0%) |
| 6 to 18 Years | 792 (91.0%) | 78 (9.0%) |
| 19 to 25 Years | 413 (92.6%) | 33 (7.4%) |
| 26 to 34 Years | 407 (75.2%) | 134 (24.8%) |
| 35 to 44 Years | 594 (89.6%) | 69 (10.4%) |
| 45 to 54 Years | 410 (86.5%) | 64 (13.5%) |
| 55 to 64 Years | 611 (87.7%) | 86 (12.3%) |
| 65 to 74 Years | 392 (100.0%) | 0 (0.0%) |
| 75 Years and older | 315 (100.0%) | 0 (0.0%) |
| Total | 4,148 (89.9%) | 464 (10.1%) |
Health Insurance Coverage by Citizenship Status in Herculaneum
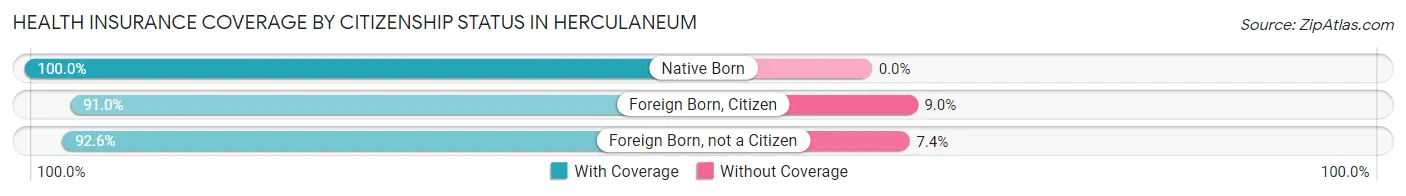
| Citizenship Status | With Coverage | Without Coverage |
| Native Born | 214 (100.0%) | 0 (0.0%) |
| Foreign Born, Citizen | 792 (91.0%) | 78 (9.0%) |
| Foreign Born, not a Citizen | 413 (92.6%) | 33 (7.4%) |
Health Insurance Coverage by Household Income in Herculaneum
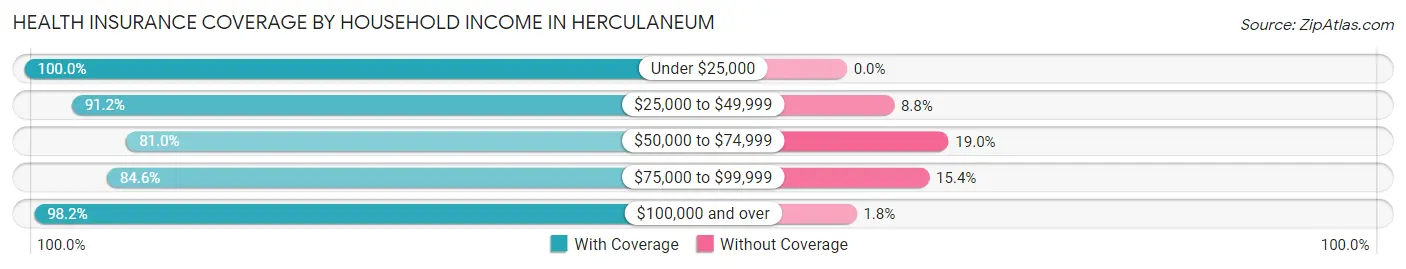
| Household Income | With Coverage | Without Coverage |
| Under $25,000 | 165 (100.0%) | 0 (0.0%) |
| $25,000 to $49,999 | 320 (91.2%) | 31 (8.8%) |
| $50,000 to $74,999 | 944 (81.0%) | 222 (19.0%) |
| $75,000 to $99,999 | 981 (84.6%) | 179 (15.4%) |
| $100,000 and over | 1,738 (98.2%) | 32 (1.8%) |
Public vs Private Health Insurance Coverage by Age in Herculaneum
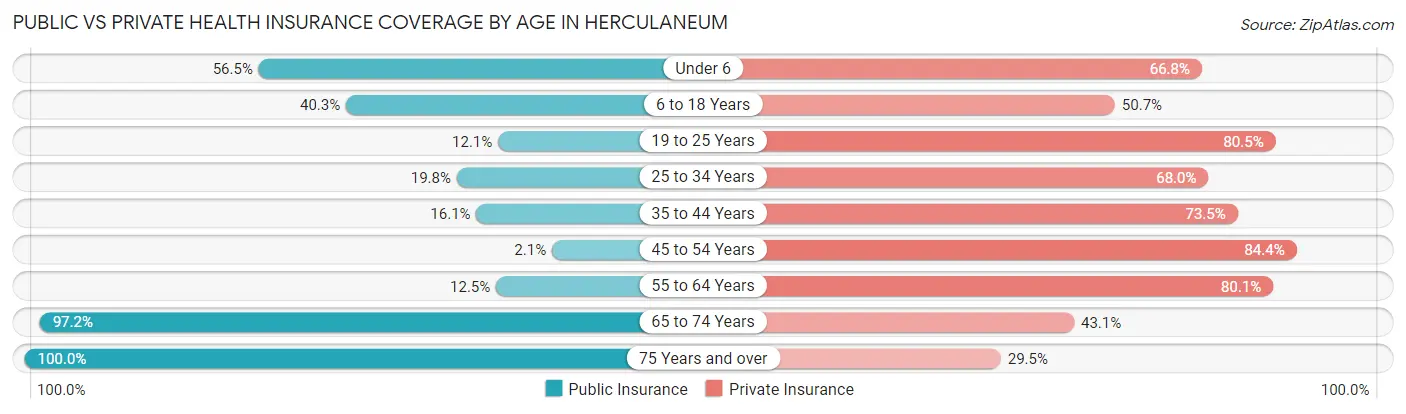
| Age Bracket | Public Insurance | Private Insurance |
| Under 6 | 121 (56.5%) | 143 (66.8%) |
| 6 to 18 Years | 351 (40.3%) | 441 (50.7%) |
| 19 to 25 Years | 54 (12.1%) | 359 (80.5%) |
| 25 to 34 Years | 107 (19.8%) | 368 (68.0%) |
| 35 to 44 Years | 107 (16.1%) | 487 (73.5%) |
| 45 to 54 Years | 10 (2.1%) | 400 (84.4%) |
| 55 to 64 Years | 87 (12.5%) | 558 (80.1%) |
| 65 to 74 Years | 381 (97.2%) | 169 (43.1%) |
| 75 Years and over | 315 (100.0%) | 93 (29.5%) |
| Total | 1,533 (33.2%) | 3,018 (65.4%) |
Disability Status by Sex by Age in Herculaneum
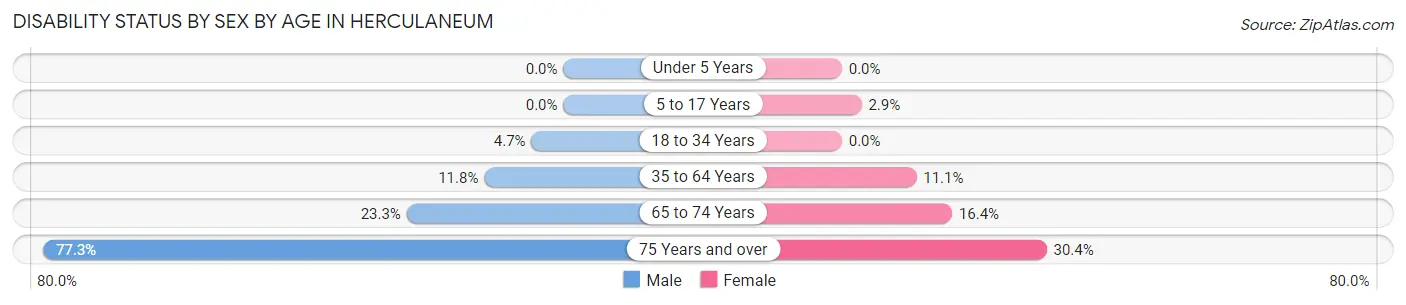
| Age Bracket | Male | Female |
| Under 5 Years | 0 (0.0%) | 0 (0.0%) |
| 5 to 17 Years | 0 (0.0%) | 12 (2.9%) |
| 18 to 34 Years | 26 (4.7%) | 0 (0.0%) |
| 35 to 64 Years | 104 (11.7%) | 105 (11.1%) |
| 65 to 74 Years | 40 (23.3%) | 36 (16.4%) |
| 75 Years and over | 68 (77.3%) | 69 (30.4%) |
Disability Class by Sex by Age in Herculaneum
Disability Class: Hearing Difficulty
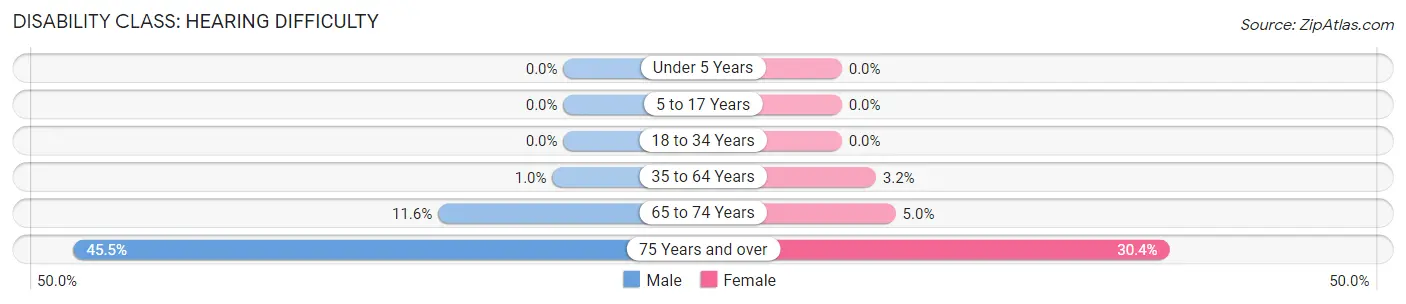
| Age Bracket | Male | Female |
| Under 5 Years | 0 (0.0%) | 0 (0.0%) |
| 5 to 17 Years | 0 (0.0%) | 0 (0.0%) |
| 18 to 34 Years | 0 (0.0%) | 0 (0.0%) |
| 35 to 64 Years | 9 (1.0%) | 30 (3.2%) |
| 65 to 74 Years | 20 (11.6%) | 11 (5.0%) |
| 75 Years and over | 40 (45.5%) | 69 (30.4%) |
Disability Class: Vision Difficulty
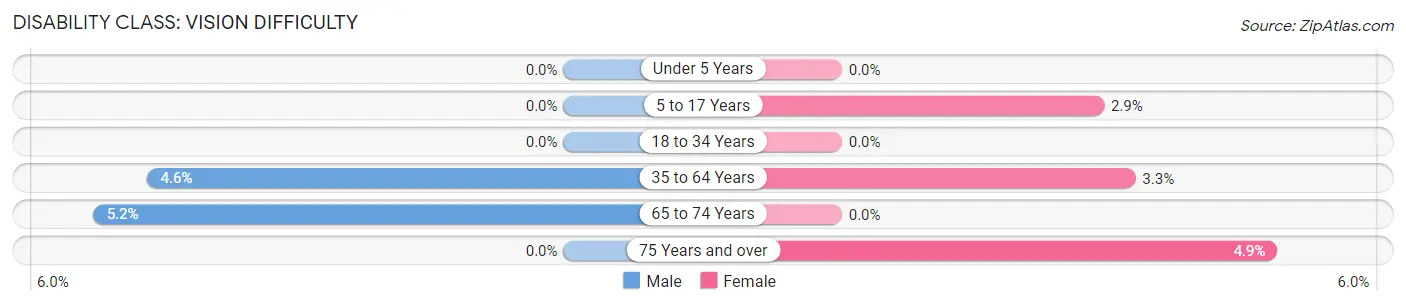
| Age Bracket | Male | Female |
| Under 5 Years | 0 (0.0%) | 0 (0.0%) |
| 5 to 17 Years | 0 (0.0%) | 12 (2.9%) |
| 18 to 34 Years | 0 (0.0%) | 0 (0.0%) |
| 35 to 64 Years | 41 (4.6%) | 31 (3.3%) |
| 65 to 74 Years | 9 (5.2%) | 0 (0.0%) |
| 75 Years and over | 0 (0.0%) | 11 (4.9%) |
Disability Class: Cognitive Difficulty
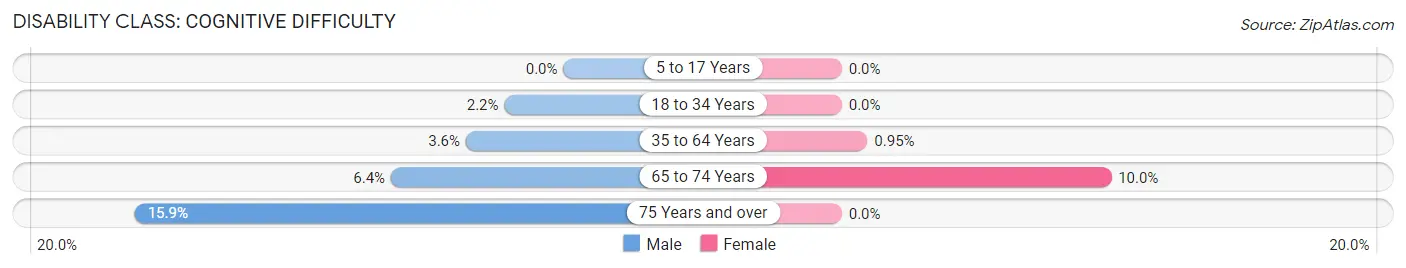
| Age Bracket | Male | Female |
| 5 to 17 Years | 0 (0.0%) | 0 (0.0%) |
| 18 to 34 Years | 12 (2.2%) | 0 (0.0%) |
| 35 to 64 Years | 32 (3.6%) | 9 (0.9%) |
| 65 to 74 Years | 11 (6.4%) | 22 (10.0%) |
| 75 Years and over | 14 (15.9%) | 0 (0.0%) |
Disability Class: Ambulatory Difficulty
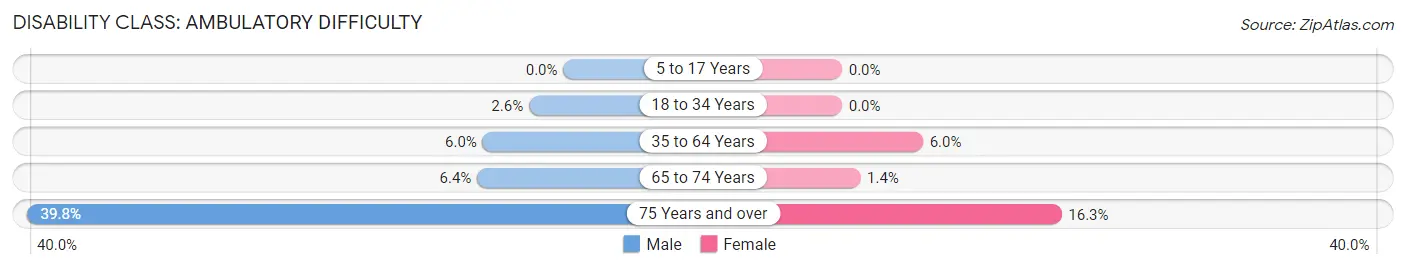
| Age Bracket | Male | Female |
| 5 to 17 Years | 0 (0.0%) | 0 (0.0%) |
| 18 to 34 Years | 14 (2.5%) | 0 (0.0%) |
| 35 to 64 Years | 53 (6.0%) | 57 (6.0%) |
| 65 to 74 Years | 11 (6.4%) | 3 (1.4%) |
| 75 Years and over | 35 (39.8%) | 37 (16.3%) |
Disability Class: Self-Care Difficulty
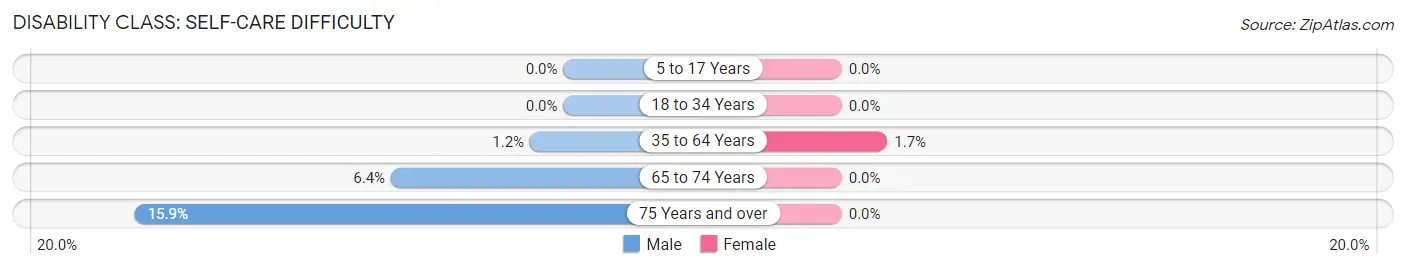
| Age Bracket | Male | Female |
| 5 to 17 Years | 0 (0.0%) | 0 (0.0%) |
| 18 to 34 Years | 0 (0.0%) | 0 (0.0%) |
| 35 to 64 Years | 11 (1.2%) | 16 (1.7%) |
| 65 to 74 Years | 11 (6.4%) | 0 (0.0%) |
| 75 Years and over | 14 (15.9%) | 0 (0.0%) |
Technology Access in Herculaneum
Computing Device Access in Herculaneum
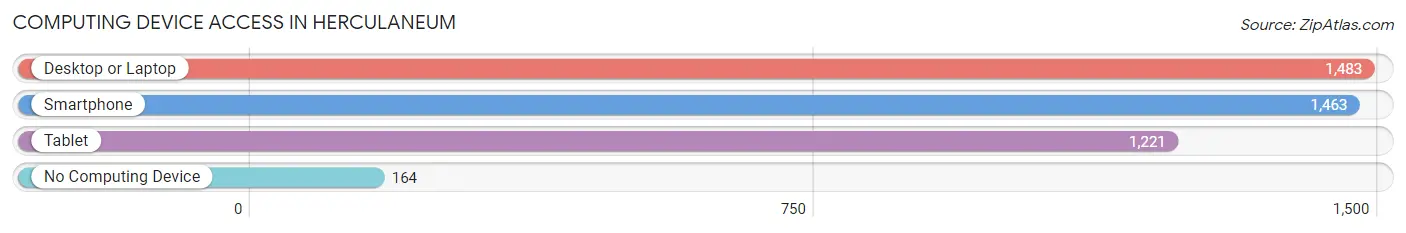
| Device Type | # Households | % Households |
| Desktop or Laptop | 1,483 | 84.2% |
| Smartphone | 1,463 | 83.0% |
| Tablet | 1,221 | 69.3% |
| No Computing Device | 164 | 9.3% |
| Total | 1,762 | 100.0% |
Internet Access in Herculaneum
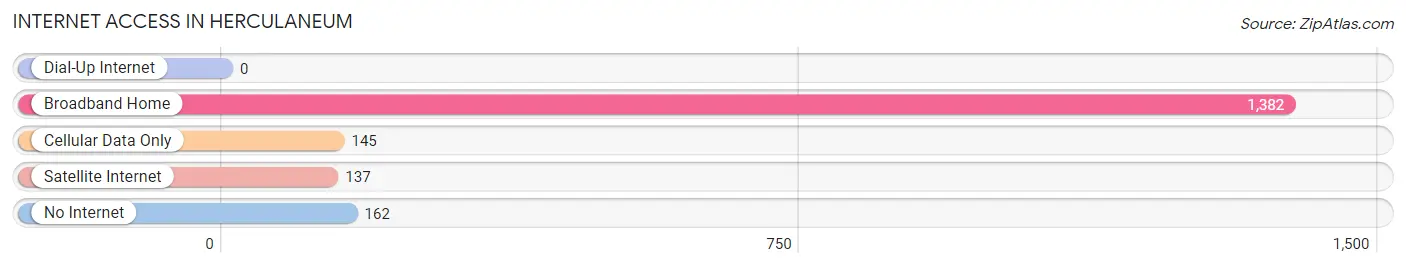
| Internet Type | # Households | % Households |
| Dial-Up Internet | 0 | 0.0% |
| Broadband Home | 1,382 | 78.4% |
| Cellular Data Only | 145 | 8.2% |
| Satellite Internet | 137 | 7.8% |
| No Internet | 162 | 9.2% |
| Total | 1,762 | 100.0% |
Herculaneum Summary
Herculaneum, Missouri is a small town located in Jefferson County, Missouri, United States. It is situated on the banks of the Mississippi River, approximately 25 miles south of St. Louis. The town was founded in 1808 and is named after the ancient Roman city of Herculaneum, which was destroyed by the eruption of Mount Vesuvius in 79 AD.
History
Herculaneum was founded in 1808 by a group of settlers from Kentucky. The town was originally known as “Hercules”, but the name was changed to Herculaneum in 1817. The town was incorporated in 1819 and was the first town in Jefferson County to be incorporated.
The town was an important port on the Mississippi River, and it was a major center for the production of lead and zinc. The town was also home to several large brickyards, which supplied bricks for many of the buildings in St. Louis.
In the late 19th century, Herculaneum was a popular tourist destination, and it was home to several large resorts. The town was also home to several large manufacturing plants, including the Herculaneum Lead Works, which was the largest lead smelter in the United States.
Geography
Herculaneum is located in Jefferson County, Missouri, on the banks of the Mississippi River. The town is situated at an elevation of approximately 500 feet above sea level. The town is located approximately 25 miles south of St. Louis.
The town is located in a region of rolling hills and valleys, and it is surrounded by several small towns and villages. The town is located in a temperate climate, with hot summers and cold winters.
Economy
Herculaneum’s economy is largely based on tourism and manufacturing. The town is home to several large manufacturing plants, including the Herculaneum Lead Works, which is the largest lead smelter in the United States. The town is also home to several large resorts, which attract tourists from all over the world.
The town is also home to several small businesses, including restaurants, shops, and other services. The town is also home to several small farms, which produce a variety of crops, including corn, soybeans, and wheat.
Demographics
As of the 2010 census, the population of Herculaneum was 2,717. The town has a population density of 1,092 people per square mile. The median age of the population is 43.7 years, and the median household income is $45,945.
The town is predominantly white, with 92.3% of the population identifying as white. The town is also home to a small African American population, with 4.2% of the population identifying as African American. The town is also home to a small Hispanic population, with 2.2% of the population identifying as Hispanic or Latino.
Conclusion
Herculaneum, Missouri is a small town located in Jefferson County, Missouri, United States. It is situated on the banks of the Mississippi River, approximately 25 miles south of St. Louis. The town was founded in 1808 and is named after the ancient Roman city of Herculaneum, which was destroyed by the eruption of Mount Vesuvius in 79 AD. The town’s economy is largely based on tourism and manufacturing, and it is home to several large resorts and manufacturing plants. The town has a population of 2,717, with a median age of 43.7 years and a median household income of $45,945. The town is predominantly white, with 92.3% of the population identifying as white.
Common Questions
What is Per Capita Income in Herculaneum?
Per Capita income in Herculaneum is $33,525.
What is the Median Family Income in Herculaneum?
Median Family Income in Herculaneum is $94,544.
What is the Median Household income in Herculaneum?
Median Household Income in Herculaneum is $79,824.
What is Income or Wage Gap in Herculaneum?
Income or Wage Gap in Herculaneum is 28.7%.
Women in Herculaneum earn 71.3 cents for every dollar earned by a man.
What is Inequality or Gini Index in Herculaneum?
Inequality or Gini Index in Herculaneum is 0.32.
What is the Total Population of Herculaneum?
Total Population of Herculaneum is 4,767.
What is the Total Male Population of Herculaneum?
Total Male Population of Herculaneum is 2,234.
What is the Total Female Population of Herculaneum?
Total Female Population of Herculaneum is 2,533.
What is the Ratio of Males per 100 Females in Herculaneum?
There are 88.20 Males per 100 Females in Herculaneum.
What is the Ratio of Females per 100 Males in Herculaneum?
There are 113.38 Females per 100 Males in Herculaneum.
What is the Median Population Age in Herculaneum?
Median Population Age in Herculaneum is 39.7 Years.
What is the Average Family Size in Herculaneum
Average Family Size in Herculaneum is 3.1 People.
What is the Average Household Size in Herculaneum
Average Household Size in Herculaneum is 2.6 People.
How Large is the Labor Force in Herculaneum?
There are 2,384 People in the Labor Forcein in Herculaneum.
What is the Percentage of People in the Labor Force in Herculaneum?
62.7% of People are in the Labor Force in Herculaneum.
What is the Unemployment Rate in Herculaneum?
Unemployment Rate in Herculaneum is 5.7%.