Henrietta, MO
Henrietta Map
Henrietta Overview
295
TOTAL POPULATION
173
MALE POPULATION
122
FEMALE POPULATION
141.80
MALES / 100 FEMALES
70.52
FEMALES / 100 MALES
31.8
MEDIAN AGE
3.3
AVG FAMILY SIZE
2.5
AVG HOUSEHOLD SIZE
$18,412
PER CAPITA INCOME
$50,625
AVG FAMILY INCOME
$43,750
AVG HOUSEHOLD INCOME
0.39
INEQUALITY / GINI INDEX
123
LABOR FORCE [ PEOPLE ]
50.8%
PERCENT IN LABOR FORCE
6.6%
UNEMPLOYMENT RATE
Henrietta Zip Codes
Henrietta Area Codes
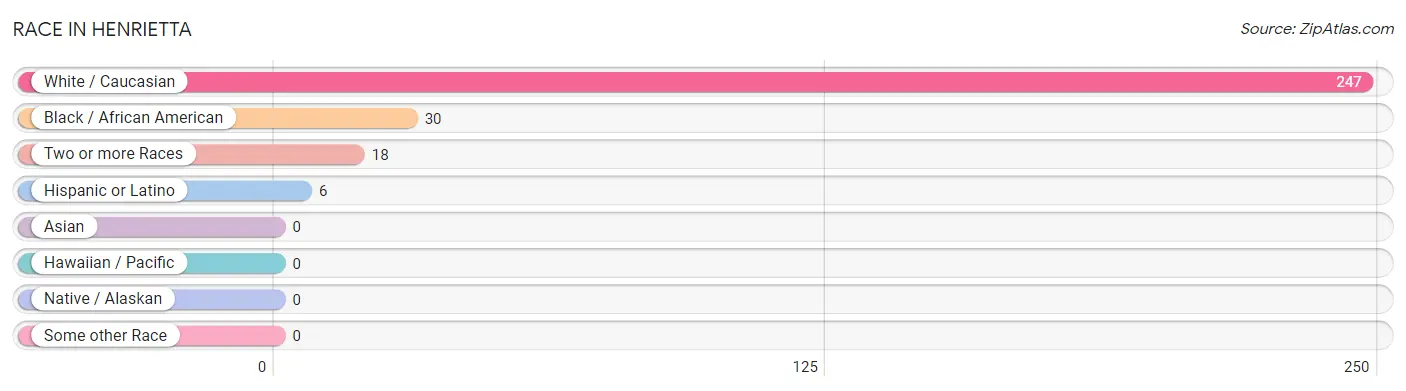
Race in Henrietta
The most populous races in Henrietta are White / Caucasian (247 | 83.7%), Black / African American (30 | 10.2%), and Two or more Races (18 | 6.1%).
| Race | # Population | % Population |
| Asian | 0 | 0.0% |
| Black / African American | 30 | 10.2% |
| Hawaiian / Pacific | 0 | 0.0% |
| Hispanic or Latino | 6 | 2.0% |
| Native / Alaskan | 0 | 0.0% |
| White / Caucasian | 247 | 83.7% |
| Two or more Races | 18 | 6.1% |
| Some other Race | 0 | 0.0% |
| Total | 295 | 100.0% |
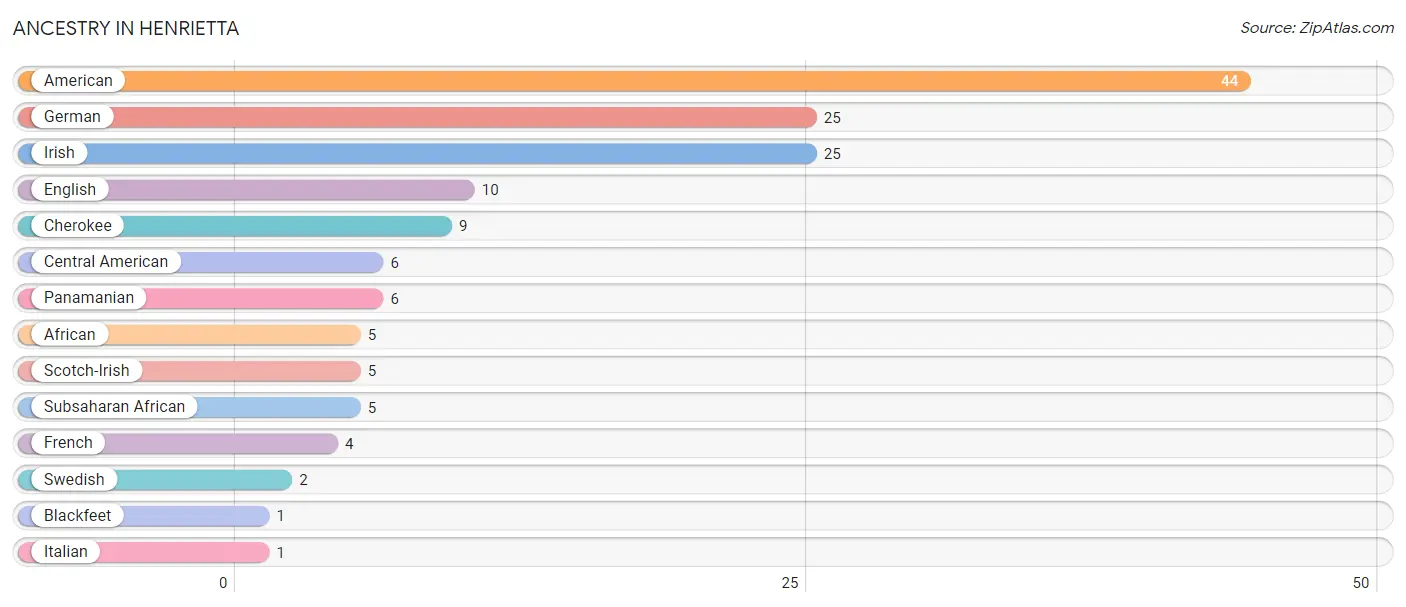
Ancestry in Henrietta
The most populous ancestries reported in Henrietta are American (44 | 14.9%), German (25 | 8.5%), Irish (25 | 8.5%), English (10 | 3.4%), and Cherokee (9 | 3.0%), together accounting for 38.3% of all Henrietta residents.
| Ancestry | # Population | % Population |
| African | 5 | 1.7% |
| American | 44 | 14.9% |
| Blackfeet | 1 | 0.3% |
| Central American | 6 | 2.0% |
| Cherokee | 9 | 3.0% |
| English | 10 | 3.4% |
| French | 4 | 1.4% |
| German | 25 | 8.5% |
| Irish | 25 | 8.5% |
| Italian | 1 | 0.3% |
| Panamanian | 6 | 2.0% |
| Scotch-Irish | 5 | 1.7% |
| Subsaharan African | 5 | 1.7% |
| Swedish | 2 | 0.7% | View All 14 Rows |
Immigrants in Henrietta

| Immigration Origin | # Population | % Population | View All 0 Rows |
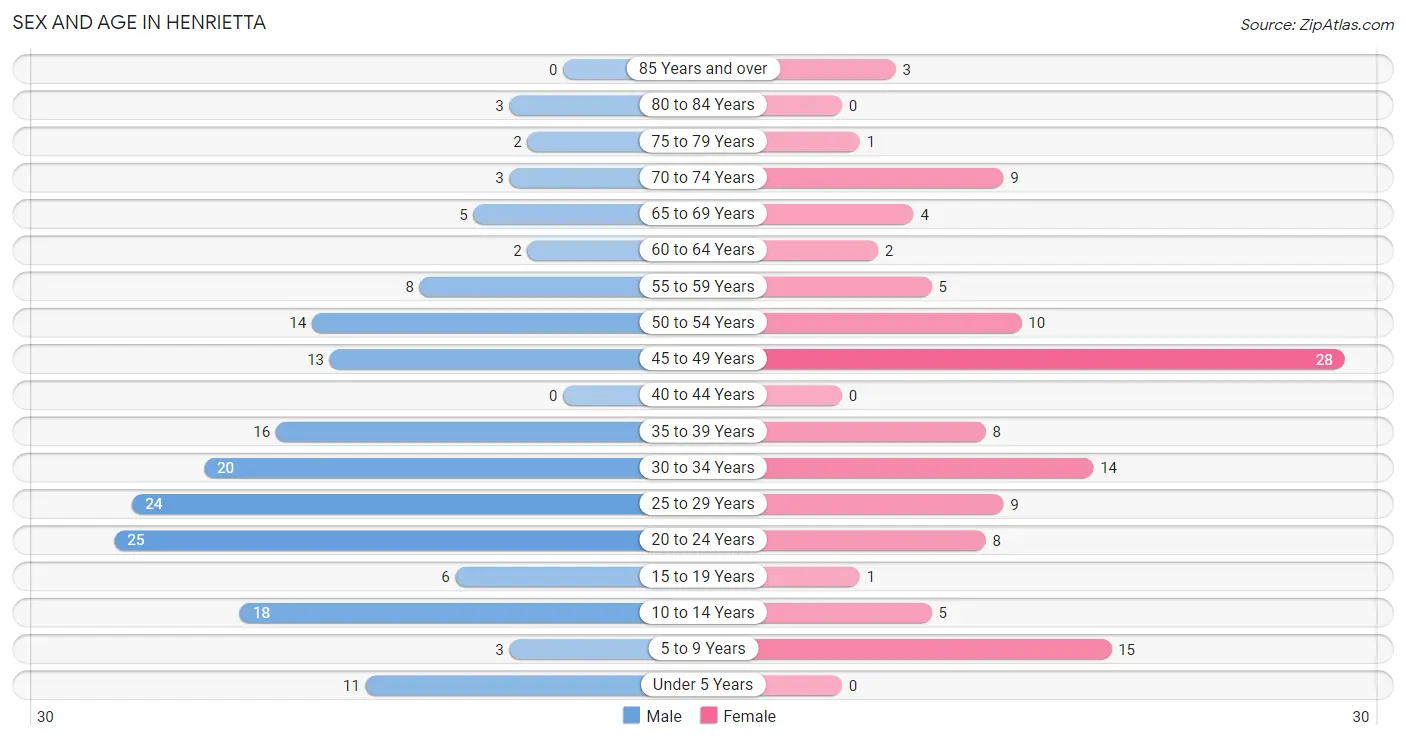
Sex and Age in Henrietta
Sex and Age in Henrietta
The most populous age groups in Henrietta are 20 to 24 Years (25 | 14.4%) for men and 45 to 49 Years (28 | 23.0%) for women.
| Age Bracket | Male | Female |
| Under 5 Years | 11 (6.4%) | 0 (0.0%) |
| 5 to 9 Years | 3 (1.7%) | 15 (12.3%) |
| 10 to 14 Years | 18 (10.4%) | 5 (4.1%) |
| 15 to 19 Years | 6 (3.5%) | 1 (0.8%) |
| 20 to 24 Years | 25 (14.4%) | 8 (6.6%) |
| 25 to 29 Years | 24 (13.9%) | 9 (7.4%) |
| 30 to 34 Years | 20 (11.6%) | 14 (11.5%) |
| 35 to 39 Years | 16 (9.2%) | 8 (6.6%) |
| 40 to 44 Years | 0 (0.0%) | 0 (0.0%) |
| 45 to 49 Years | 13 (7.5%) | 28 (23.0%) |
| 50 to 54 Years | 14 (8.1%) | 10 (8.2%) |
| 55 to 59 Years | 8 (4.6%) | 5 (4.1%) |
| 60 to 64 Years | 2 (1.2%) | 2 (1.6%) |
| 65 to 69 Years | 5 (2.9%) | 4 (3.3%) |
| 70 to 74 Years | 3 (1.7%) | 9 (7.4%) |
| 75 to 79 Years | 2 (1.2%) | 1 (0.8%) |
| 80 to 84 Years | 3 (1.7%) | 0 (0.0%) |
| 85 Years and over | 0 (0.0%) | 3 (2.5%) |
| Total | 173 (100.0%) | 122 (100.0%) |
Families and Households in Henrietta
Median Family Size in Henrietta
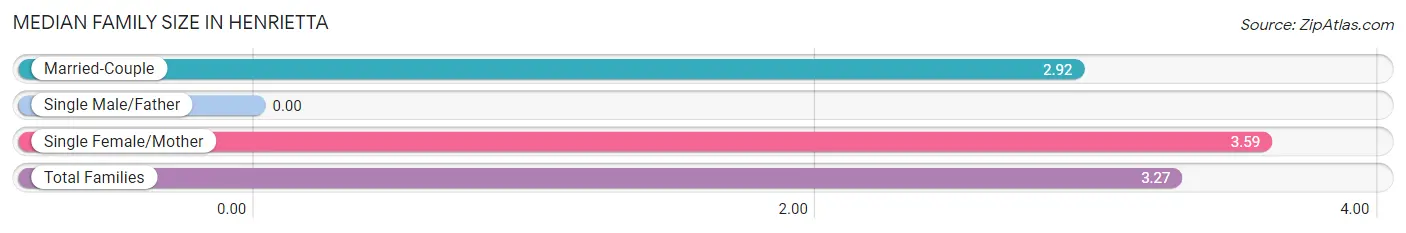
| Family Type | # Families | Family Size |
| Married-Couple | 26 (47.3%) | 2.92 |
| Single Male/Father | 0 (0.0%) | - |
| Single Female/Mother | 29 (52.7%) | 3.59 |
| Total Families | 55 (100.0%) | 3.27 |
Median Household Size in Henrietta
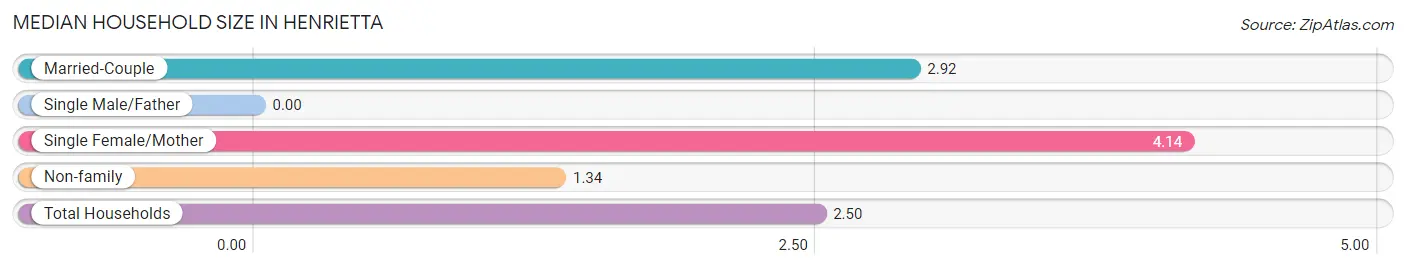
| Household Type | # Households | Household Size |
| Married-Couple | 26 (24.8%) | 2.92 |
| Single Male/Father | 0 (0.0%) | - |
| Single Female/Mother | 29 (27.6%) | 4.14 |
| Non-family | 50 (47.6%) | 1.34 |
| Total Households | 105 (100.0%) | 2.50 |
Household Size by Marriage Status in Henrietta
Out of a total of 105 households in Henrietta, 55 (52.4%) are family households, while 50 (47.6%) are nonfamily households. The most numerous type of family households are 2-person households, comprising 26, and the most common type of nonfamily households are 1-person households, comprising 31.
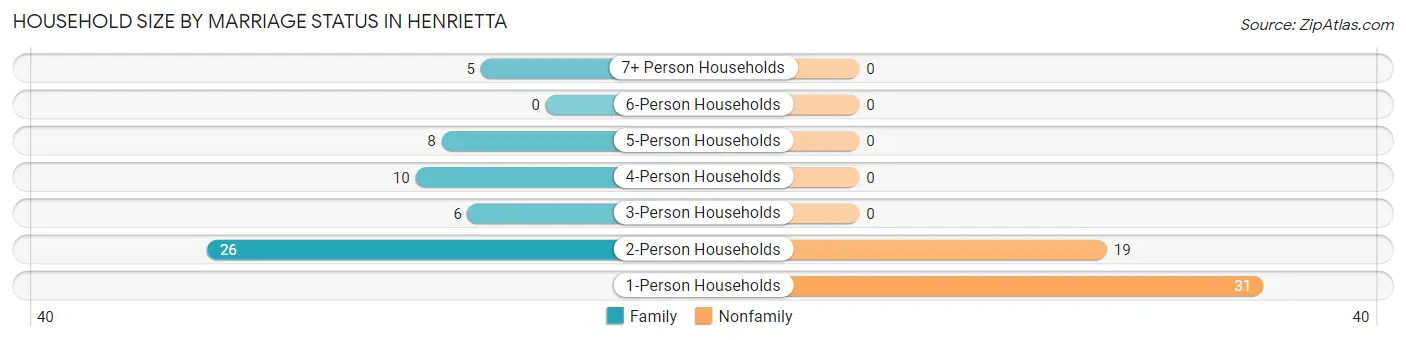
| Household Size | Family Households | Nonfamily Households |
| 1-Person Households | - | 31 (29.5%) |
| 2-Person Households | 26 (24.8%) | 19 (18.1%) |
| 3-Person Households | 6 (5.7%) | 0 (0.0%) |
| 4-Person Households | 10 (9.5%) | 0 (0.0%) |
| 5-Person Households | 8 (7.6%) | 0 (0.0%) |
| 6-Person Households | 0 (0.0%) | 0 (0.0%) |
| 7+ Person Households | 5 (4.8%) | 0 (0.0%) |
| Total | 55 (52.4%) | 50 (47.6%) |
Female Fertility in Henrietta
Fertility by Age in Henrietta
Average fertility rate in Henrietta is 29.0 births per 1,000 women. Women in the age bracket of 35 to 50 years have the highest fertility rate with 53.0 births per 1,000 women. Women in the age bracket of 35 to 50 years acount for 100.0% of all women with births.
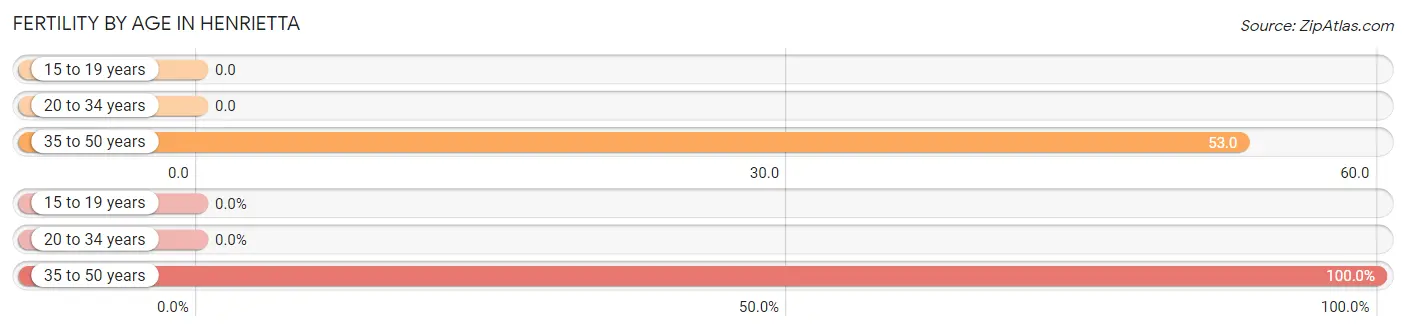
| Age Bracket | Women with Births | Births / 1,000 Women |
| 15 to 19 years | 0 (0.0%) | 0.0 |
| 20 to 34 years | 0 (0.0%) | 0.0 |
| 35 to 50 years | 2 (100.0%) | 53.0 |
| Total | 2 (100.0%) | 29.0 |
Fertility by Age by Marriage Status in Henrietta
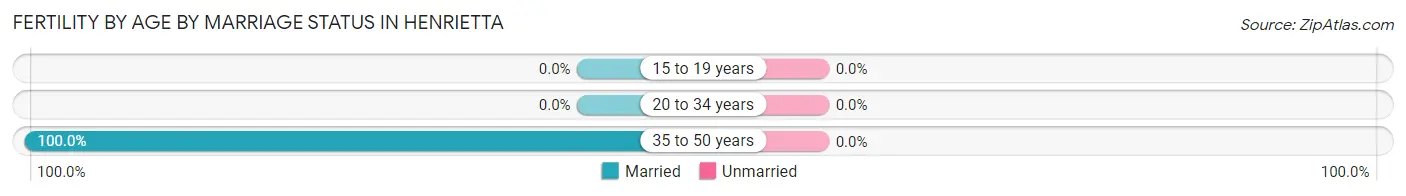
| Age Bracket | Married | Unmarried |
| 15 to 19 years | 0 (0.0%) | 0 (0.0%) |
| 20 to 34 years | 0 (0.0%) | 0 (0.0%) |
| 35 to 50 years | 2 (100.0%) | 0 (0.0%) |
| Total | 2 (100.0%) | 0 (0.0%) |
Fertility by Education in Henrietta
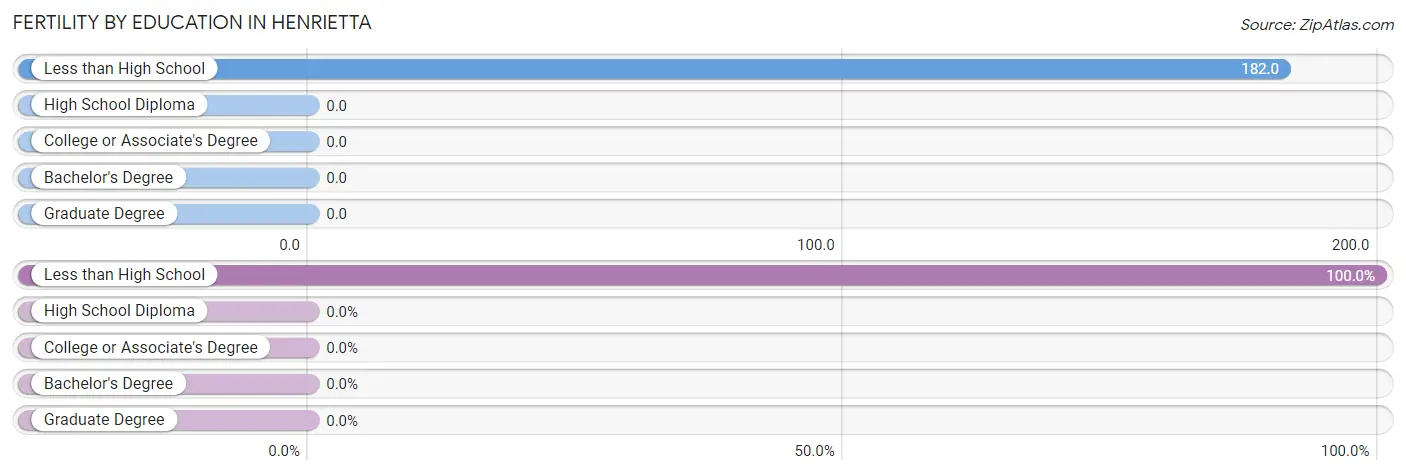
| Educational Attainment | Women with Births | Births / 1,000 Women |
| Less than High School | 2 (100.0%) | 182.0 |
| High School Diploma | 0 (0.0%) | 0.0 |
| College or Associate's Degree | 0 (0.0%) | 0.0 |
| Bachelor's Degree | 0 (0.0%) | 0.0 |
| Graduate Degree | 0 (0.0%) | 0.0 |
| Total | 2 (100.0%) | 29.0 |
Fertility by Education by Marriage Status in Henrietta
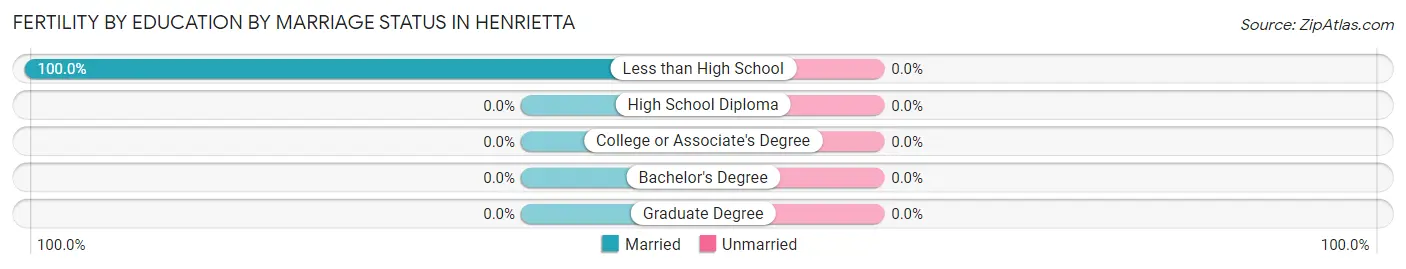
| Educational Attainment | Married | Unmarried |
| Less than High School | 2 (100.0%) | 0 (0.0%) |
| High School Diploma | 0 (0.0%) | 0 (0.0%) |
| College or Associate's Degree | 0 (0.0%) | 0 (0.0%) |
| Bachelor's Degree | 0 (0.0%) | 0 (0.0%) |
| Graduate Degree | 0 (0.0%) | 0 (0.0%) |
| Total | 2 (100.0%) | 0 (0.0%) |
Income in Henrietta
Income Overview in Henrietta
Per Capita Income in Henrietta is $18,412, while median incomes of families and households are $50,625 and $43,750 respectively.
| Characteristic | Number | Measure |
| Per Capita Income | 295 | $18,412 |
| Median Family Income | 55 | $50,625 |
| Mean Family Income | 55 | $49,813 |
| Median Household Income | 105 | $43,750 |
| Mean Household Income | 105 | $45,396 |
| Income Deficit | 55 | $0 |
| Wage / Income Gap (%) | 295 | 0.00% |
| Wage / Income Gap ($) | 295 | 100.00¢ per $1 |
| Gini / Inequality Index | 295 | 0.39 |
Earnings by Sex in Henrietta
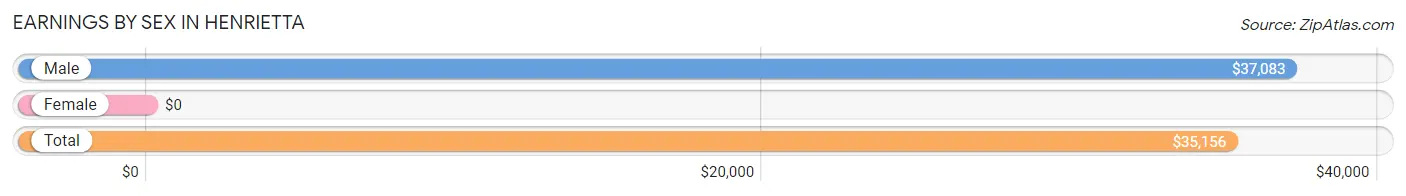
| Sex | Number | Average Earnings |
| Male | 85 (60.7%) | $37,083 |
| Female | 55 (39.3%) | $0 |
| Total | 140 (100.0%) | $35,156 |
Earnings by Sex by Income Bracket in Henrietta
The most common earnings brackets in Henrietta are $35,000 to $39,999 for men (21 | 24.7%) and $2,500 to $4,999 for women (9 | 16.4%).
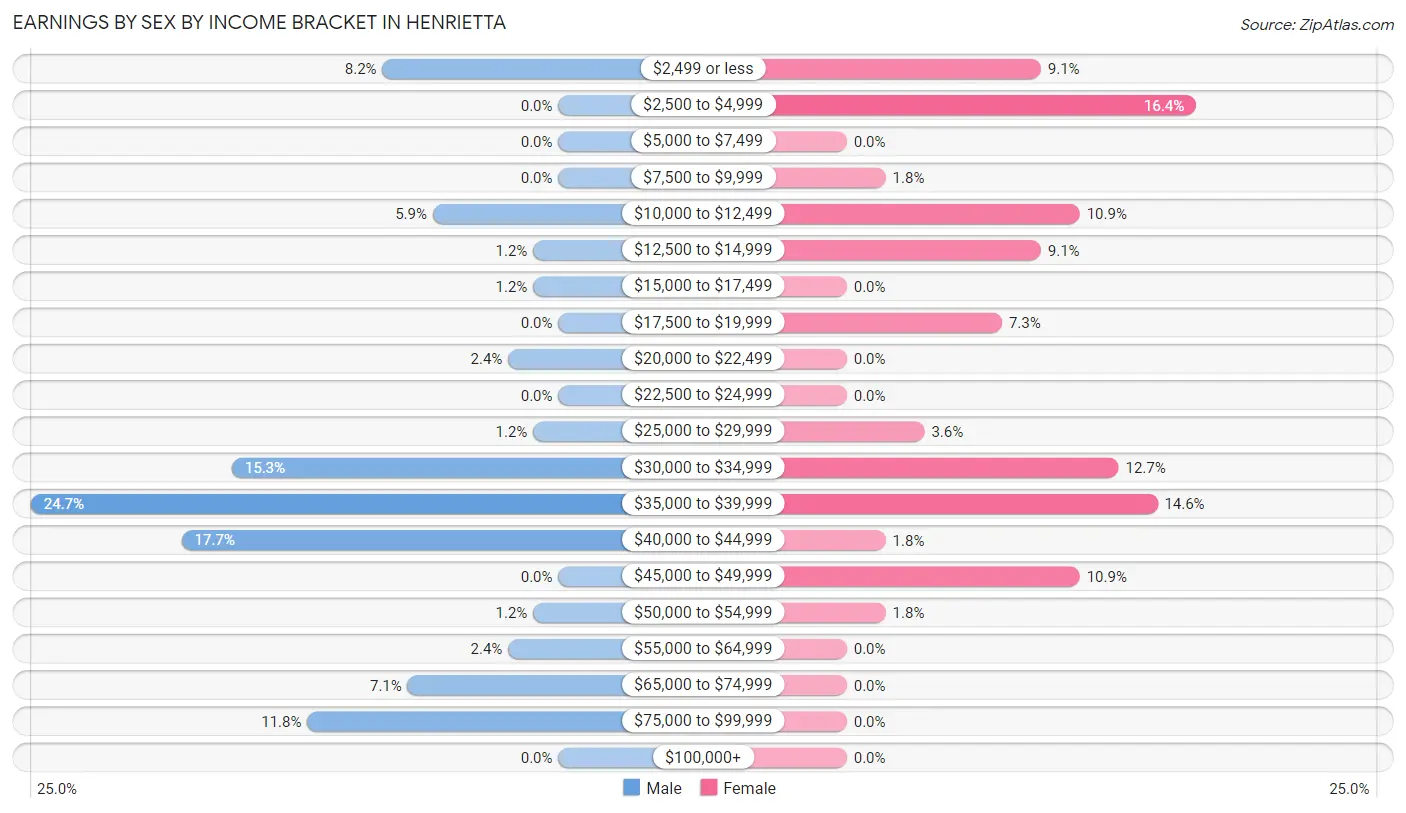
| Income | Male | Female |
| $2,499 or less | 7 (8.2%) | 5 (9.1%) |
| $2,500 to $4,999 | 0 (0.0%) | 9 (16.4%) |
| $5,000 to $7,499 | 0 (0.0%) | 0 (0.0%) |
| $7,500 to $9,999 | 0 (0.0%) | 1 (1.8%) |
| $10,000 to $12,499 | 5 (5.9%) | 6 (10.9%) |
| $12,500 to $14,999 | 1 (1.2%) | 5 (9.1%) |
| $15,000 to $17,499 | 1 (1.2%) | 0 (0.0%) |
| $17,500 to $19,999 | 0 (0.0%) | 4 (7.3%) |
| $20,000 to $22,499 | 2 (2.4%) | 0 (0.0%) |
| $22,500 to $24,999 | 0 (0.0%) | 0 (0.0%) |
| $25,000 to $29,999 | 1 (1.2%) | 2 (3.6%) |
| $30,000 to $34,999 | 13 (15.3%) | 7 (12.7%) |
| $35,000 to $39,999 | 21 (24.7%) | 8 (14.5%) |
| $40,000 to $44,999 | 15 (17.6%) | 1 (1.8%) |
| $45,000 to $49,999 | 0 (0.0%) | 6 (10.9%) |
| $50,000 to $54,999 | 1 (1.2%) | 1 (1.8%) |
| $55,000 to $64,999 | 2 (2.4%) | 0 (0.0%) |
| $65,000 to $74,999 | 6 (7.1%) | 0 (0.0%) |
| $75,000 to $99,999 | 10 (11.8%) | 0 (0.0%) |
| $100,000+ | 0 (0.0%) | 0 (0.0%) |
| Total | 85 (100.0%) | 55 (100.0%) |
Earnings by Sex by Educational Attainment in Henrietta
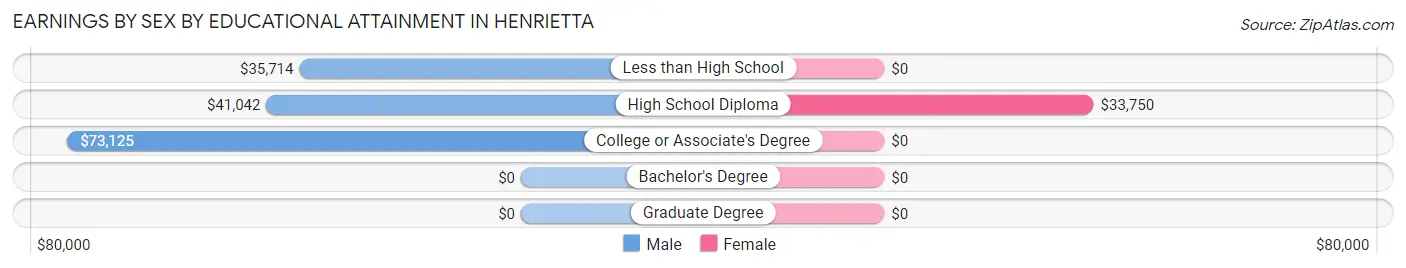
| Educational Attainment | Male Income | Female Income |
| Less than High School | $35,714 | $0 |
| High School Diploma | $41,042 | $33,750 |
| College or Associate's Degree | $73,125 | $0 |
| Bachelor's Degree | - | - |
| Graduate Degree | - | - |
| Total | $40,500 | $0 |
Family Income in Henrietta
Family Income Brackets in Henrietta
According to the Henrietta family income data, there are 14 families falling into the $50,000 to $74,999 income range, which is the most common income bracket and makes up 25.5% of all families.
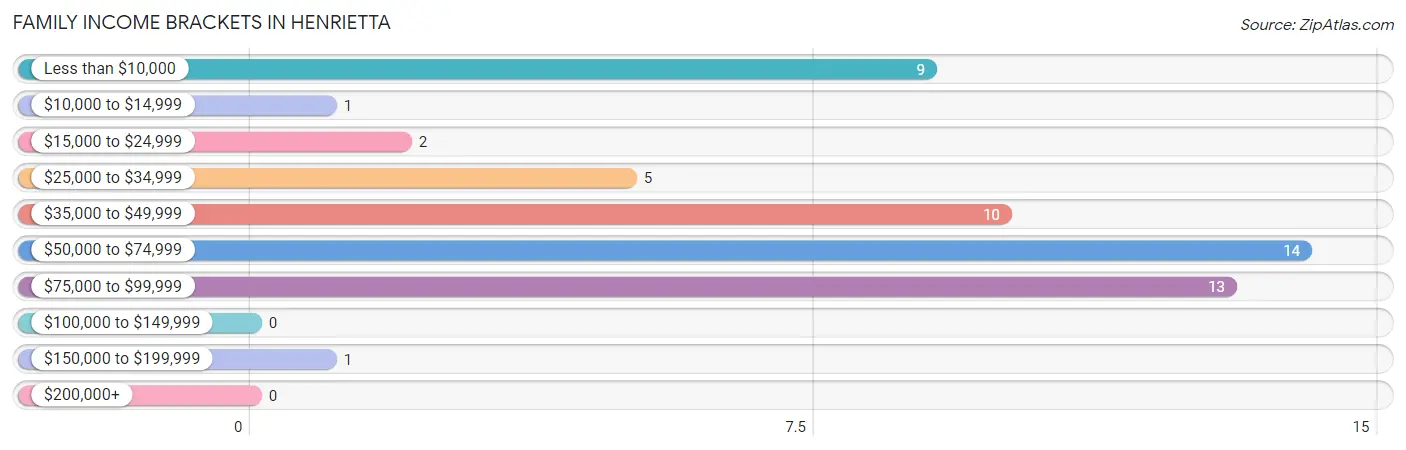
| Income Bracket | # Families | % Families |
| Less than $10,000 | 9 | 16.4% |
| $10,000 to $14,999 | 1 | 1.8% |
| $15,000 to $24,999 | 2 | 3.6% |
| $25,000 to $34,999 | 5 | 9.1% |
| $35,000 to $49,999 | 10 | 18.2% |
| $50,000 to $74,999 | 14 | 25.5% |
| $75,000 to $99,999 | 13 | 23.6% |
| $100,000 to $149,999 | 0 | 0.0% |
| $150,000 to $199,999 | 1 | 1.8% |
| $200,000+ | 0 | 0.0% |
Family Income by Famaliy Size in Henrietta
2-person families (26 | 47.3%) account for the highest median family income in Henrietta with $58,750 per family, while 2-person families (26 | 47.3%) have the highest median income of $29,375 per family member.
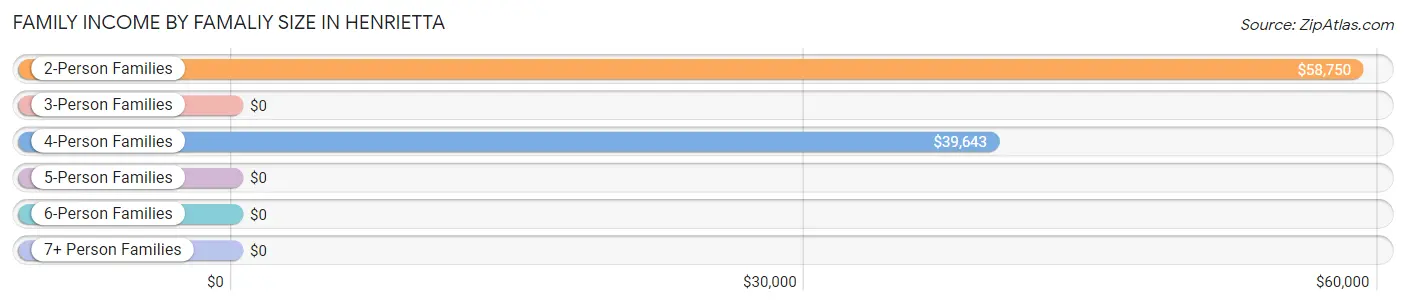
| Income Bracket | # Families | Median Income |
| 2-Person Families | 26 (47.3%) | $58,750 |
| 3-Person Families | 11 (20.0%) | $0 |
| 4-Person Families | 12 (21.8%) | $39,643 |
| 5-Person Families | 1 (1.8%) | $0 |
| 6-Person Families | 0 (0.0%) | $0 |
| 7+ Person Families | 5 (9.1%) | $0 |
| Total | 55 (100.0%) | $50,625 |
Family Income by Number of Earners in Henrietta
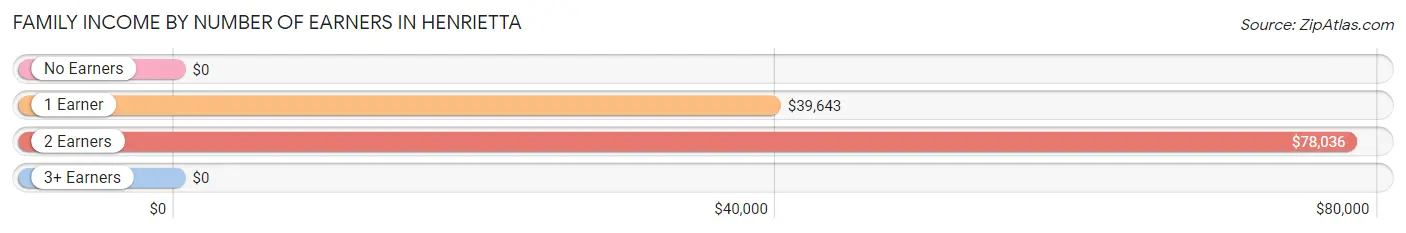
| Number of Earners | # Families | Median Income |
| No Earners | 10 (18.2%) | $0 |
| 1 Earner | 30 (54.5%) | $39,643 |
| 2 Earners | 13 (23.6%) | $78,036 |
| 3+ Earners | 2 (3.6%) | $0 |
| Total | 55 (100.0%) | $50,625 |
Household Income in Henrietta
Household Income Brackets in Henrietta
With 29 households falling in the category, the $50,000 to $74,999 income range is the most frequent in Henrietta, accounting for 27.6% of all households.
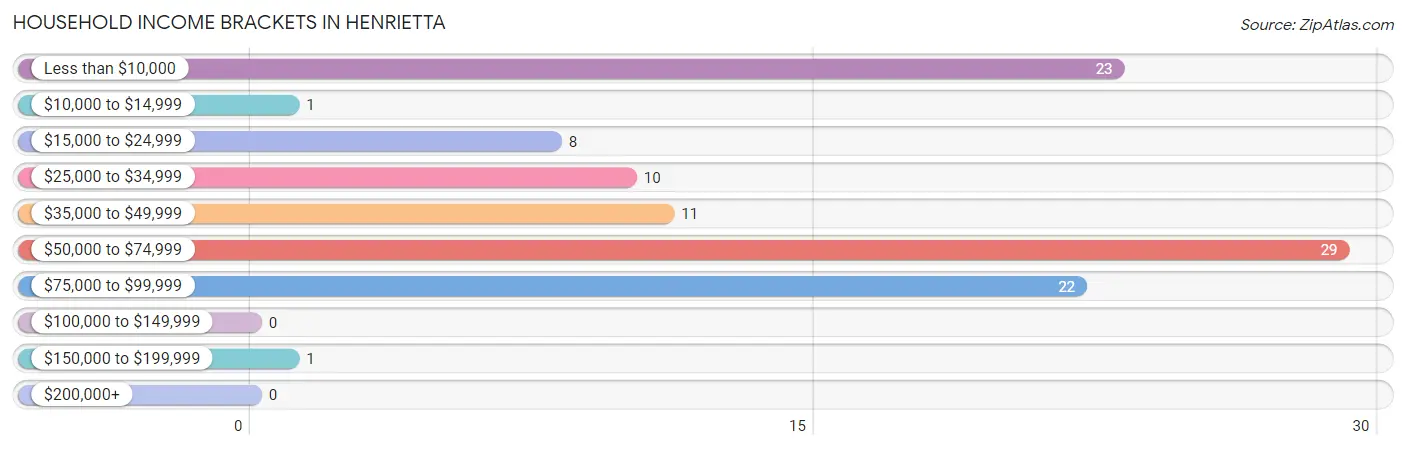
| Income Bracket | # Households | % Households |
| Less than $10,000 | 23 | 21.9% |
| $10,000 to $14,999 | 1 | 1.0% |
| $15,000 to $24,999 | 8 | 7.6% |
| $25,000 to $34,999 | 10 | 9.5% |
| $35,000 to $49,999 | 11 | 10.5% |
| $50,000 to $74,999 | 29 | 27.6% |
| $75,000 to $99,999 | 22 | 21.0% |
| $100,000 to $149,999 | 0 | 0.0% |
| $150,000 to $199,999 | 1 | 1.0% |
| $200,000+ | 0 | 0.0% |
Household Income by Householder Age in Henrietta
The median household income in Henrietta is $43,750, with the highest median household income of $57,500 found in the 25 to 44 years age bracket for the primary householder. A total of 36 households (34.3%) fall into this category. Meanwhile, the 15 to 24 years age bracket for the primary householder has the lowest median household income of $0, with 5 households (4.8%) in this group.
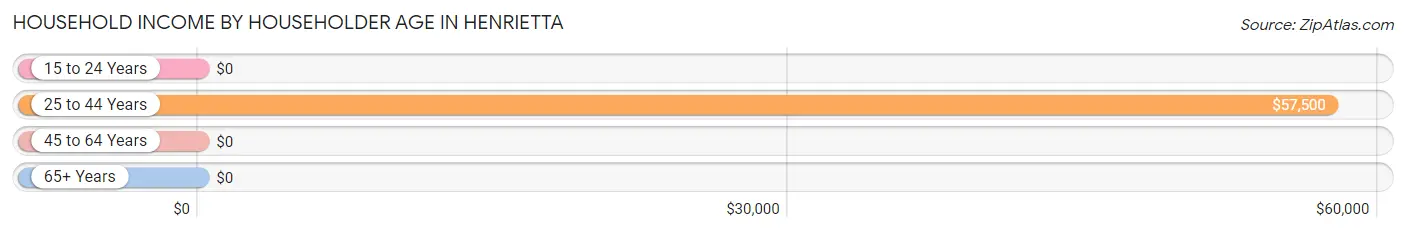
| Income Bracket | # Households | Median Income |
| 15 to 24 Years | 5 (4.8%) | $0 |
| 25 to 44 Years | 36 (34.3%) | $57,500 |
| 45 to 64 Years | 43 (40.9%) | $0 |
| 65+ Years | 21 (20.0%) | $0 |
| Total | 105 (100.0%) | $43,750 |
Poverty in Henrietta
Income Below Poverty by Sex and Age in Henrietta
With 23.1% poverty level for males and 36.3% for females among the residents of Henrietta, 15 year old males and 35 to 44 year old females are the most vulnerable to poverty, with 1 males (100.0%) and 7 females (87.5%) in their respective age groups living below the poverty level.
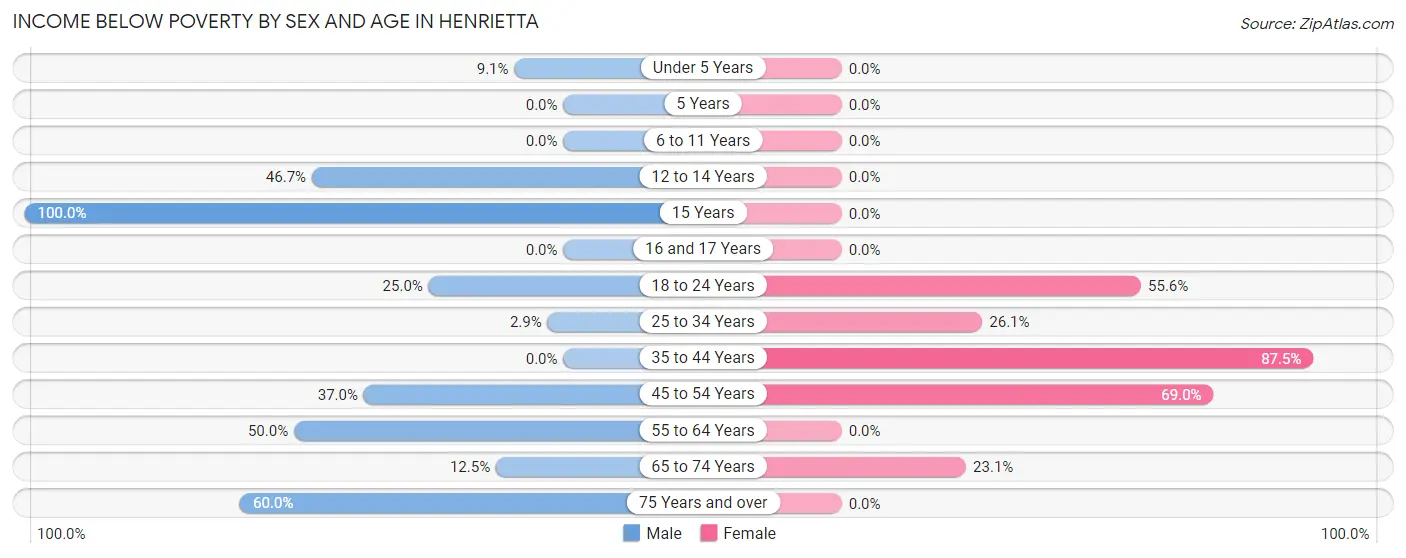
| Age Bracket | Male | Female |
| Under 5 Years | 1 (9.1%) | 0 (0.0%) |
| 5 Years | 0 (0.0%) | 0 (0.0%) |
| 6 to 11 Years | 0 (0.0%) | 0 (0.0%) |
| 12 to 14 Years | 7 (46.7%) | 0 (0.0%) |
| 15 Years | 1 (100.0%) | 0 (0.0%) |
| 16 and 17 Years | 0 (0.0%) | 0 (0.0%) |
| 18 to 24 Years | 5 (25.0%) | 5 (55.6%) |
| 25 to 34 Years | 1 (2.9%) | 6 (26.1%) |
| 35 to 44 Years | 0 (0.0%) | 7 (87.5%) |
| 45 to 54 Years | 10 (37.0%) | 20 (69.0%) |
| 55 to 64 Years | 5 (50.0%) | 0 (0.0%) |
| 65 to 74 Years | 1 (12.5%) | 3 (23.1%) |
| 75 Years and over | 3 (60.0%) | 0 (0.0%) |
| Total | 34 (23.1%) | 41 (36.3%) |
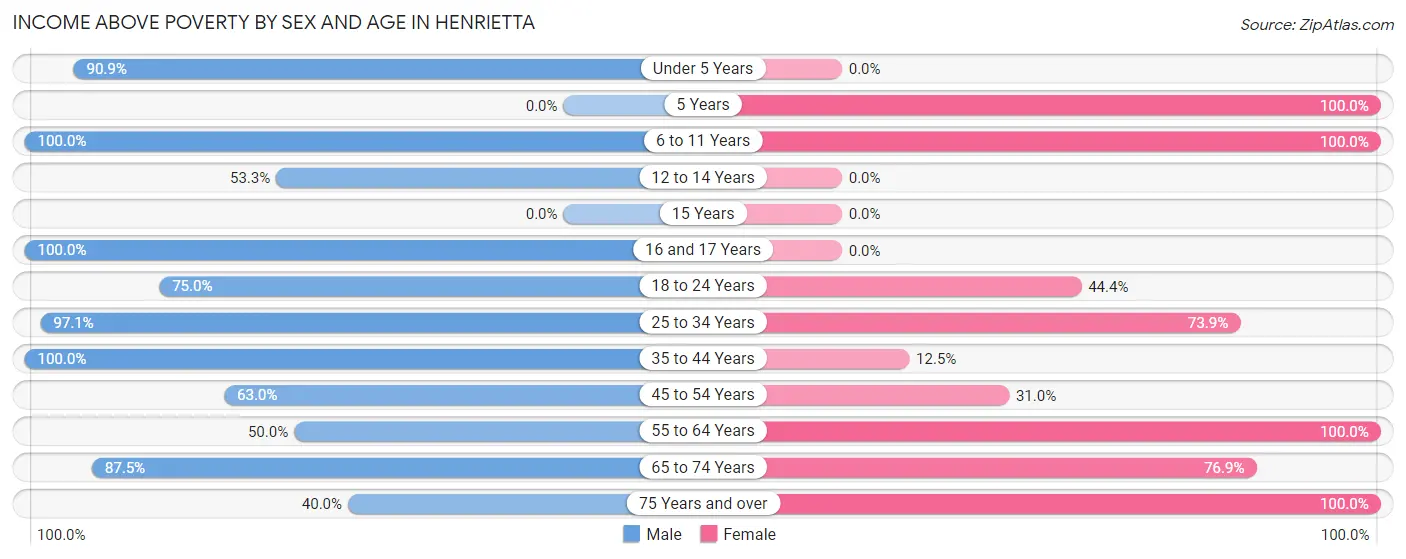
Income Above Poverty by Sex and Age in Henrietta
According to the poverty statistics in Henrietta, males aged 6 to 11 years and females aged 5 years are the age groups that are most secure financially, with 100.0% of males and 100.0% of females in these age groups living above the poverty line.
| Age Bracket | Male | Female |
| Under 5 Years | 10 (90.9%) | 0 (0.0%) |
| 5 Years | 0 (0.0%) | 5 (100.0%) |
| 6 to 11 Years | 3 (100.0%) | 15 (100.0%) |
| 12 to 14 Years | 8 (53.3%) | 0 (0.0%) |
| 15 Years | 0 (0.0%) | 0 (0.0%) |
| 16 and 17 Years | 4 (100.0%) | 0 (0.0%) |
| 18 to 24 Years | 15 (75.0%) | 4 (44.4%) |
| 25 to 34 Years | 33 (97.1%) | 17 (73.9%) |
| 35 to 44 Years | 9 (100.0%) | 1 (12.5%) |
| 45 to 54 Years | 17 (63.0%) | 9 (31.0%) |
| 55 to 64 Years | 5 (50.0%) | 7 (100.0%) |
| 65 to 74 Years | 7 (87.5%) | 10 (76.9%) |
| 75 Years and over | 2 (40.0%) | 4 (100.0%) |
| Total | 113 (76.9%) | 72 (63.7%) |
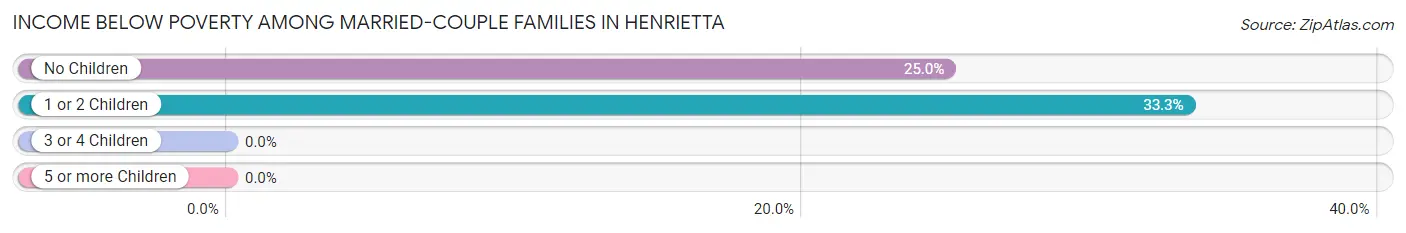
Income Below Poverty Among Married-Couple Families in Henrietta
The poverty statistics for married-couple families in Henrietta show that 26.9% or 7 of the total 26 families live below the poverty line. Families with 1 or 2 children have the highest poverty rate of 33.3%, comprising of 2 families. On the other hand, families with no children have the lowest poverty rate of 25.0%, which includes 5 families.
| Children | Above Poverty | Below Poverty |
| No Children | 15 (75.0%) | 5 (25.0%) |
| 1 or 2 Children | 4 (66.7%) | 2 (33.3%) |
| 3 or 4 Children | 0 (0.0%) | 0 (0.0%) |
| 5 or more Children | 0 (0.0%) | 0 (0.0%) |
| Total | 19 (73.1%) | 7 (26.9%) |
Income Below Poverty Among Single-Parent Households in Henrietta
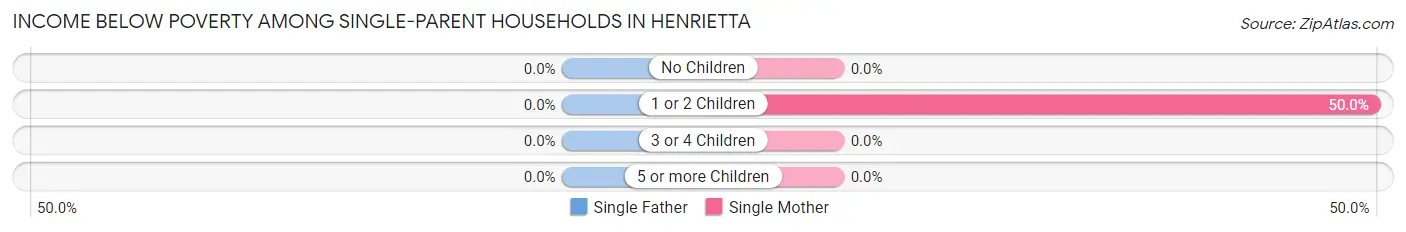
| Children | Single Father | Single Mother |
| No Children | 0 (0.0%) | 0 (0.0%) |
| 1 or 2 Children | 0 (0.0%) | 5 (50.0%) |
| 3 or 4 Children | 0 (0.0%) | 0 (0.0%) |
| 5 or more Children | 0 (0.0%) | 0 (0.0%) |
| Total | 0 (0.0%) | 5 (17.2%) |
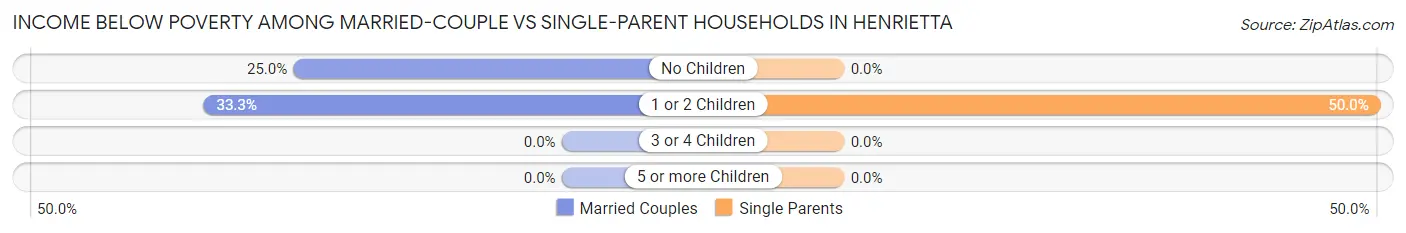
Income Below Poverty Among Married-Couple vs Single-Parent Households in Henrietta
The poverty data for Henrietta shows that 7 of the married-couple family households (26.9%) and 5 of the single-parent households (17.2%) are living below the poverty level. Within the married-couple family households, those with 1 or 2 children have the highest poverty rate, with 2 households (33.3%) falling below the poverty line. Among the single-parent households, those with 1 or 2 children have the highest poverty rate, with 5 household (50.0%) living below poverty.
| Children | Married-Couple Families | Single-Parent Households |
| No Children | 5 (25.0%) | 0 (0.0%) |
| 1 or 2 Children | 2 (33.3%) | 5 (50.0%) |
| 3 or 4 Children | 0 (0.0%) | 0 (0.0%) |
| 5 or more Children | 0 (0.0%) | 0 (0.0%) |
| Total | 7 (26.9%) | 5 (17.2%) |
Employment Characteristics in Henrietta
Employment by Class of Employer in Henrietta
Among the 115 employed individuals in Henrietta, private company employees (69 | 60.0%), self-employed (not incorporated) (16 | 13.9%), and local government employees (14 | 12.2%) make up the most common classes of employment.
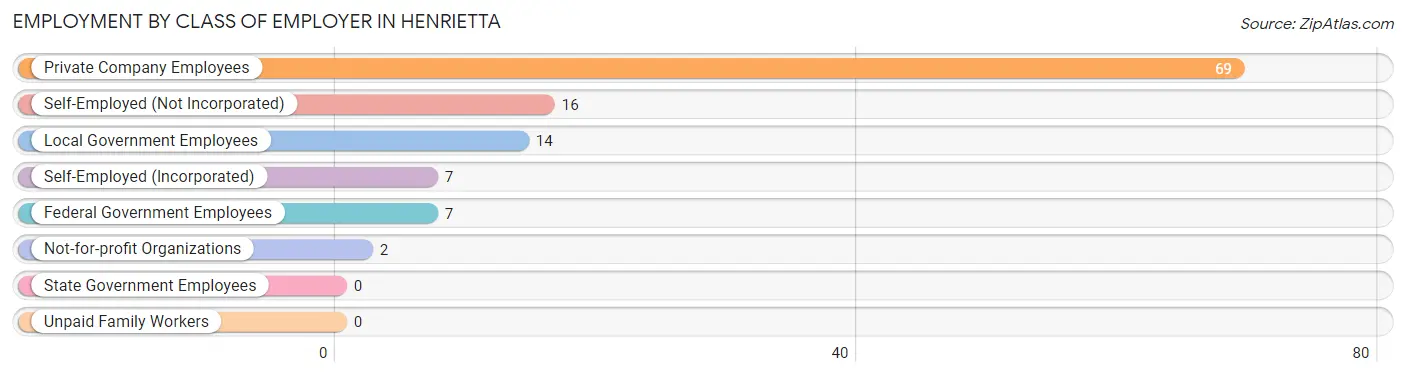
| Employer Class | # Employees | % Employees |
| Private Company Employees | 69 | 60.0% |
| Self-Employed (Incorporated) | 7 | 6.1% |
| Self-Employed (Not Incorporated) | 16 | 13.9% |
| Not-for-profit Organizations | 2 | 1.7% |
| Local Government Employees | 14 | 12.2% |
| State Government Employees | 0 | 0.0% |
| Federal Government Employees | 7 | 6.1% |
| Unpaid Family Workers | 0 | 0.0% |
| Total | 115 | 100.0% |
Employment Status by Age in Henrietta
According to the labor force statistics for Henrietta, out of the total population over 16 years of age (242), 50.8% or 123 individuals are in the labor force, with 6.6% or 8 of them unemployed. The age group with the highest labor force participation rate is 25 to 29 years, with 100.0% or 33 individuals in the labor force. Within the labor force, the 45 to 54 years age range has the highest percentage of unemployed individuals, with 25.0% or 8 of them being unemployed.
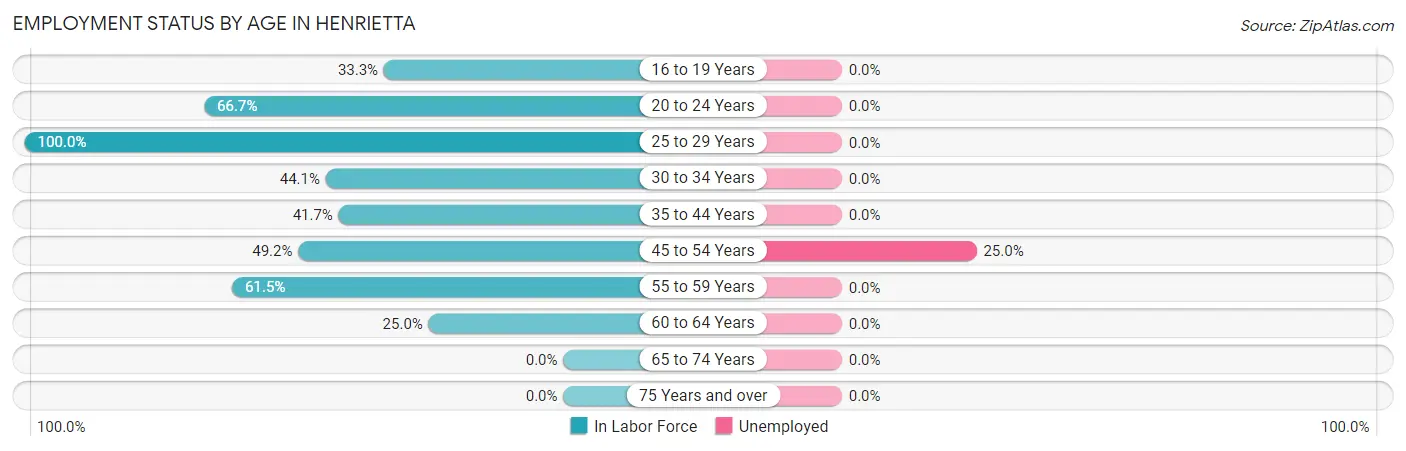
| Age Bracket | In Labor Force | Unemployed |
| 16 to 19 Years | 2 (33.3%) | 0 (0.0%) |
| 20 to 24 Years | 22 (66.7%) | 0 (0.0%) |
| 25 to 29 Years | 33 (100.0%) | 0 (0.0%) |
| 30 to 34 Years | 15 (44.1%) | 0 (0.0%) |
| 35 to 44 Years | 10 (41.7%) | 0 (0.0%) |
| 45 to 54 Years | 32 (49.2%) | 8 (25.0%) |
| 55 to 59 Years | 8 (61.5%) | 0 (0.0%) |
| 60 to 64 Years | 1 (25.0%) | 0 (0.0%) |
| 65 to 74 Years | 0 (0.0%) | 0 (0.0%) |
| 75 Years and over | 0 (0.0%) | 0 (0.0%) |
| Total | 123 (50.8%) | 8 (6.6%) |
Employment Status by Educational Attainment in Henrietta
According to labor force statistics for Henrietta, 57.2% of individuals (99) out of the total population between 25 and 64 years of age (173) are in the labor force, with 8.2% or 8 of them being unemployed. The group with the highest labor force participation rate are those with the educational attainment of bachelor's degree or higher, with 100.0% or 6 individuals in the labor force. Within the labor force, individuals with college / associate degree education have the highest percentage of unemployment, with 30.0% or 6 of them being unemployed.
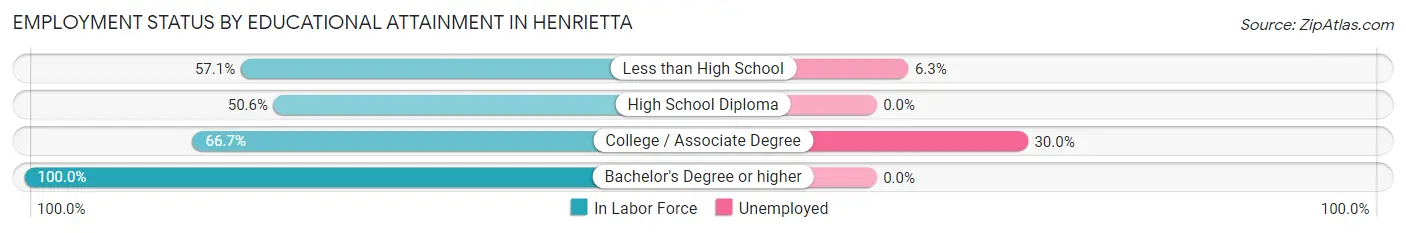
| Educational Attainment | In Labor Force | Unemployed |
| Less than High School | 32 (57.1%) | 4 (6.3%) |
| High School Diploma | 41 (50.6%) | 0 (0.0%) |
| College / Associate Degree | 20 (66.7%) | 9 (30.0%) |
| Bachelor's Degree or higher | 6 (100.0%) | 0 (0.0%) |
| Total | 99 (57.2%) | 14 (8.2%) |
Employment Occupations by Sex in Henrietta
Management, Business, Science and Arts Occupations
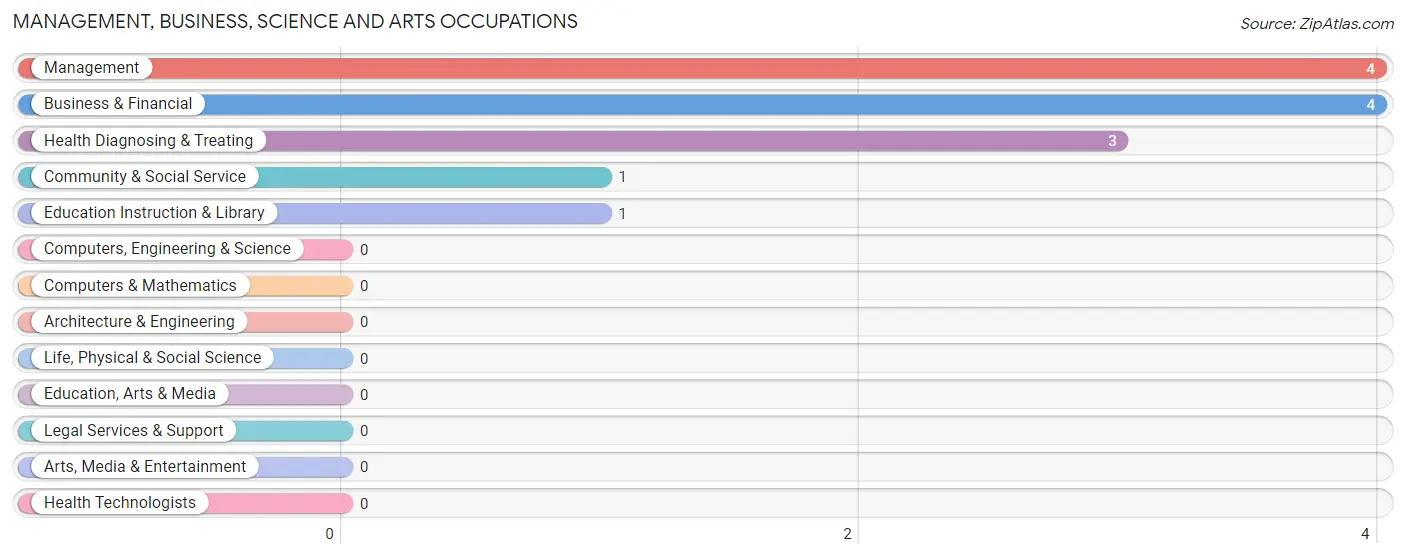
The most common Management, Business, Science and Arts occupations in Henrietta are Management (4 | 3.5%), Business & Financial (4 | 3.5%), Health Diagnosing & Treating (3 | 2.6%), Community & Social Service (1 | 0.9%), and Education Instruction & Library (1 | 0.9%).
Management, Business, Science and Arts Occupations by Sex
Within the Management, Business, Science and Arts occupations in Henrietta, the most male-oriented occupations are Business & Financial (100.0%), and Health Diagnosing & Treating (66.7%), while the most female-oriented occupations are Management (100.0%), Community & Social Service (100.0%), and Education Instruction & Library (100.0%).
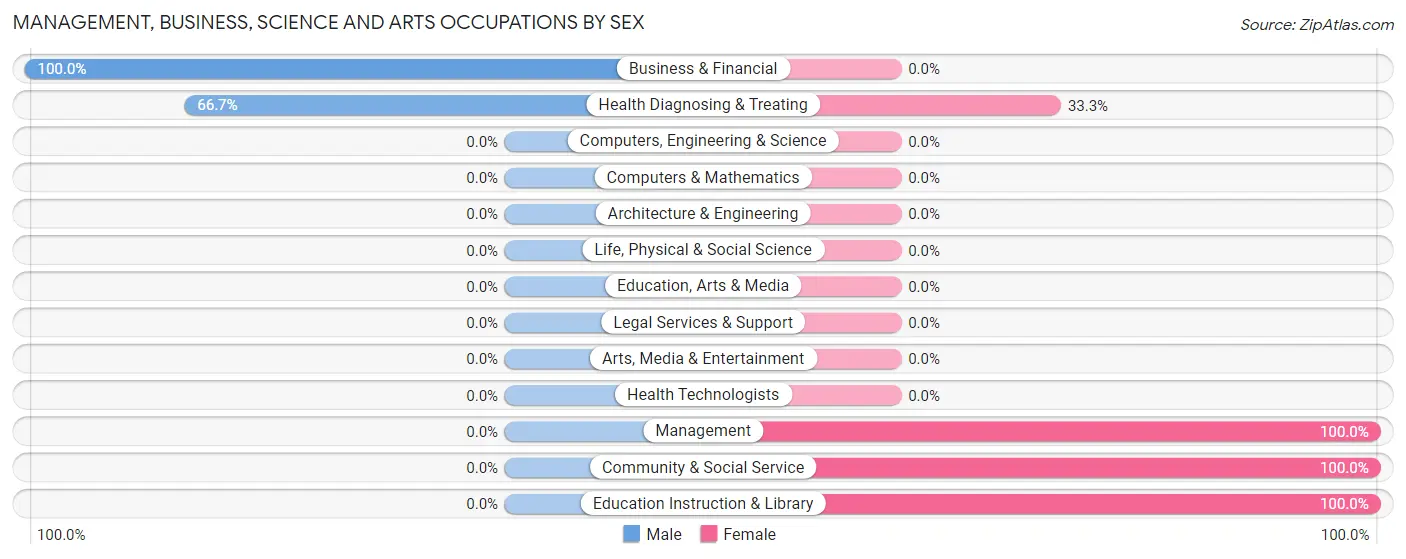
| Occupation | Male | Female |
| Management | 0 (0.0%) | 4 (100.0%) |
| Business & Financial | 4 (100.0%) | 0 (0.0%) |
| Computers, Engineering & Science | 0 (0.0%) | 0 (0.0%) |
| Computers & Mathematics | 0 (0.0%) | 0 (0.0%) |
| Architecture & Engineering | 0 (0.0%) | 0 (0.0%) |
| Life, Physical & Social Science | 0 (0.0%) | 0 (0.0%) |
| Community & Social Service | 0 (0.0%) | 1 (100.0%) |
| Education, Arts & Media | 0 (0.0%) | 0 (0.0%) |
| Legal Services & Support | 0 (0.0%) | 0 (0.0%) |
| Education Instruction & Library | 0 (0.0%) | 1 (100.0%) |
| Arts, Media & Entertainment | 0 (0.0%) | 0 (0.0%) |
| Health Diagnosing & Treating | 2 (66.7%) | 1 (33.3%) |
| Health Technologists | 0 (0.0%) | 0 (0.0%) |
| Total (Category) | 6 (50.0%) | 6 (50.0%) |
| Total (Overall) | 71 (62.8%) | 42 (37.2%) |
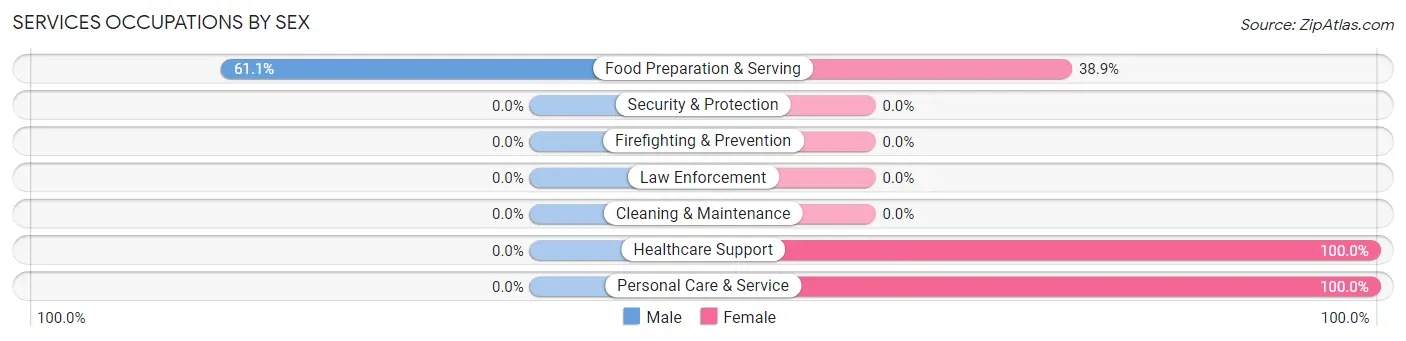
Services Occupations
The most common Services occupations in Henrietta are Food Preparation & Serving (18 | 15.9%), Healthcare Support (7 | 6.2%), and Personal Care & Service (7 | 6.2%).
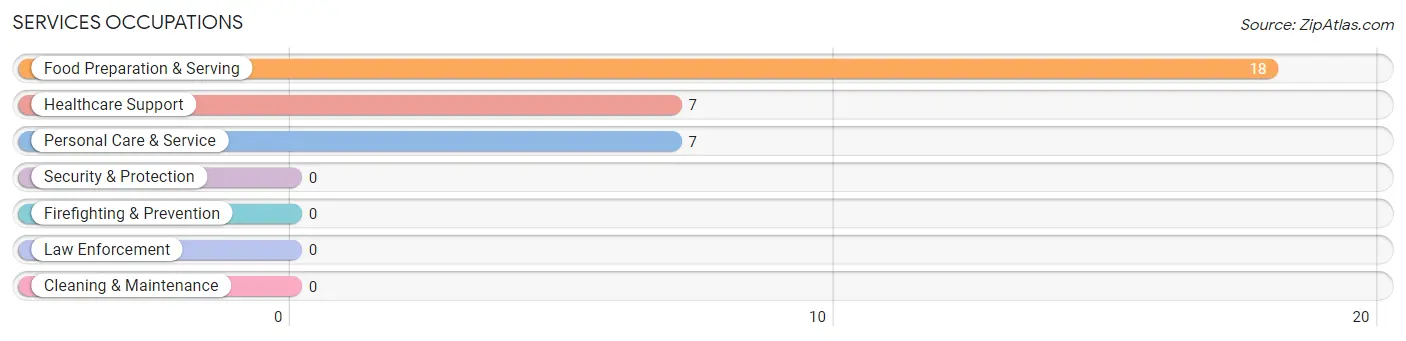
Services Occupations by Sex
| Occupation | Male | Female |
| Healthcare Support | 0 (0.0%) | 7 (100.0%) |
| Security & Protection | 0 (0.0%) | 0 (0.0%) |
| Firefighting & Prevention | 0 (0.0%) | 0 (0.0%) |
| Law Enforcement | 0 (0.0%) | 0 (0.0%) |
| Food Preparation & Serving | 11 (61.1%) | 7 (38.9%) |
| Cleaning & Maintenance | 0 (0.0%) | 0 (0.0%) |
| Personal Care & Service | 0 (0.0%) | 7 (100.0%) |
| Total (Category) | 11 (34.4%) | 21 (65.6%) |
| Total (Overall) | 71 (62.8%) | 42 (37.2%) |
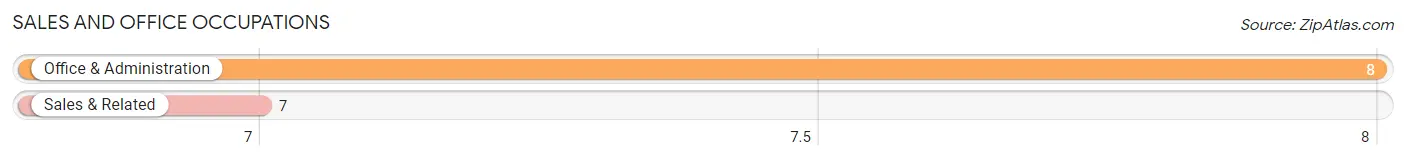
Sales and Office Occupations
The most common Sales and Office occupations in Henrietta are Office & Administration (8 | 7.1%), and Sales & Related (7 | 6.2%).
Sales and Office Occupations by Sex
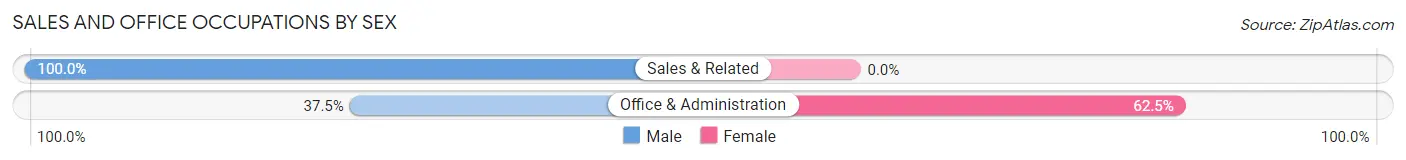
| Occupation | Male | Female |
| Sales & Related | 7 (100.0%) | 0 (0.0%) |
| Office & Administration | 3 (37.5%) | 5 (62.5%) |
| Total (Category) | 10 (66.7%) | 5 (33.3%) |
| Total (Overall) | 71 (62.8%) | 42 (37.2%) |
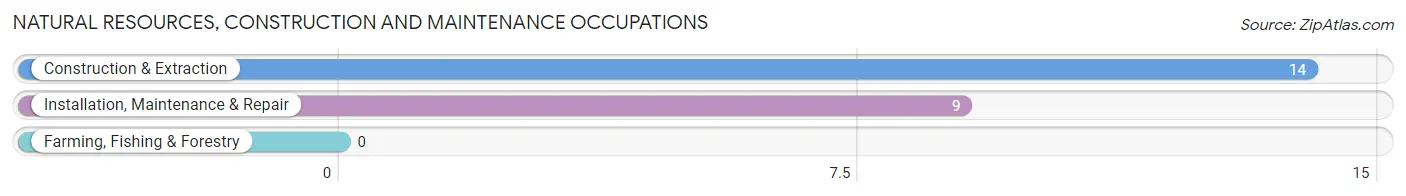
Natural Resources, Construction and Maintenance Occupations
The most common Natural Resources, Construction and Maintenance occupations in Henrietta are Construction & Extraction (14 | 12.4%), and Installation, Maintenance & Repair (9 | 8.0%).
Natural Resources, Construction and Maintenance Occupations by Sex
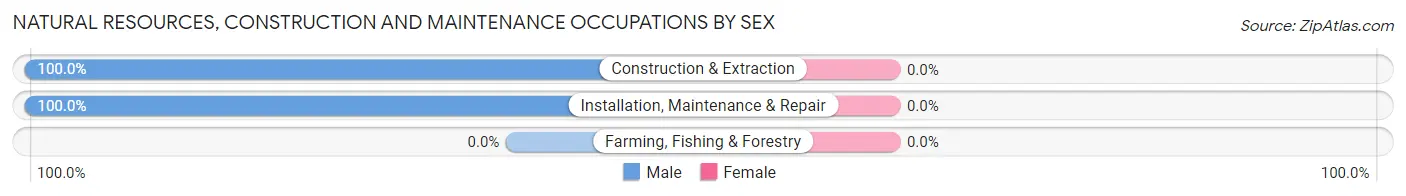
| Occupation | Male | Female |
| Farming, Fishing & Forestry | 0 (0.0%) | 0 (0.0%) |
| Construction & Extraction | 14 (100.0%) | 0 (0.0%) |
| Installation, Maintenance & Repair | 9 (100.0%) | 0 (0.0%) |
| Total (Category) | 23 (100.0%) | 0 (0.0%) |
| Total (Overall) | 71 (62.8%) | 42 (37.2%) |
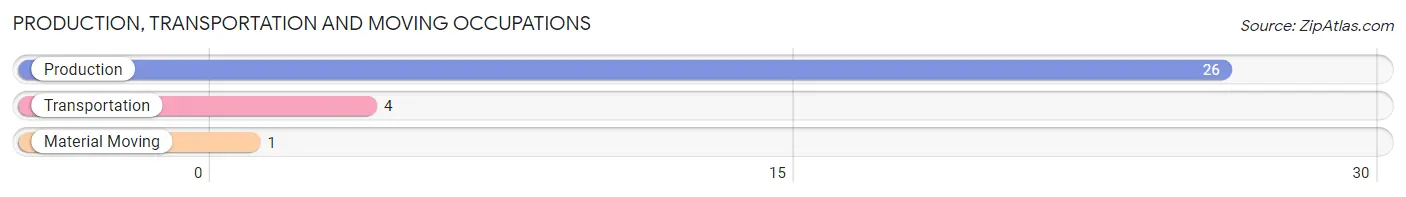
Production, Transportation and Moving Occupations
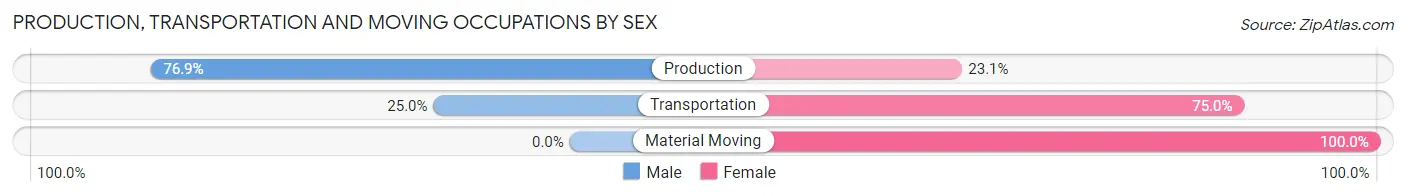
The most common Production, Transportation and Moving occupations in Henrietta are Production (26 | 23.0%), Transportation (4 | 3.5%), and Material Moving (1 | 0.9%).
Production, Transportation and Moving Occupations by Sex
| Occupation | Male | Female |
| Production | 20 (76.9%) | 6 (23.1%) |
| Transportation | 1 (25.0%) | 3 (75.0%) |
| Material Moving | 0 (0.0%) | 1 (100.0%) |
| Total (Category) | 21 (67.7%) | 10 (32.3%) |
| Total (Overall) | 71 (62.8%) | 42 (37.2%) |
Employment Industries by Sex in Henrietta
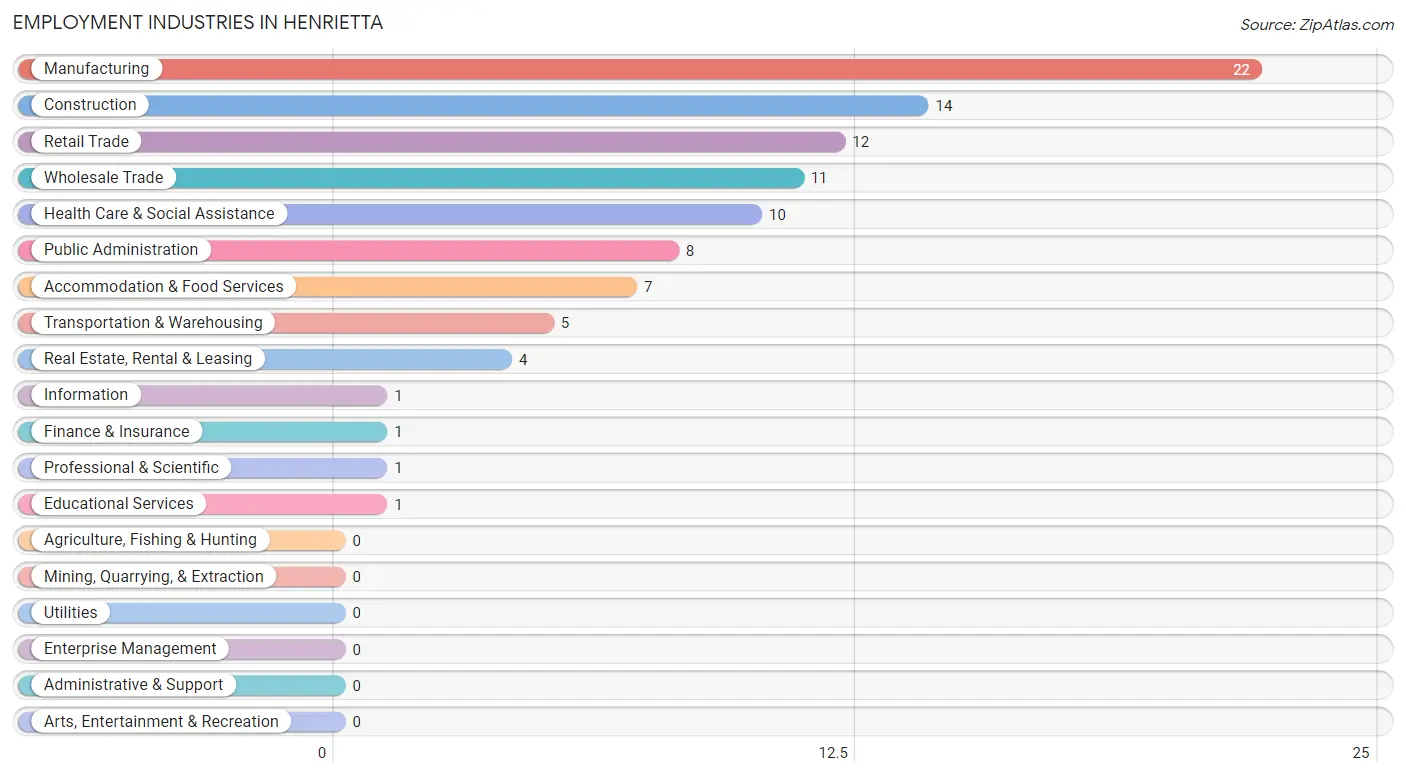
Employment Industries in Henrietta
The major employment industries in Henrietta include Manufacturing (22 | 19.5%), Construction (14 | 12.4%), Retail Trade (12 | 10.6%), Wholesale Trade (11 | 9.7%), and Health Care & Social Assistance (10 | 8.8%).
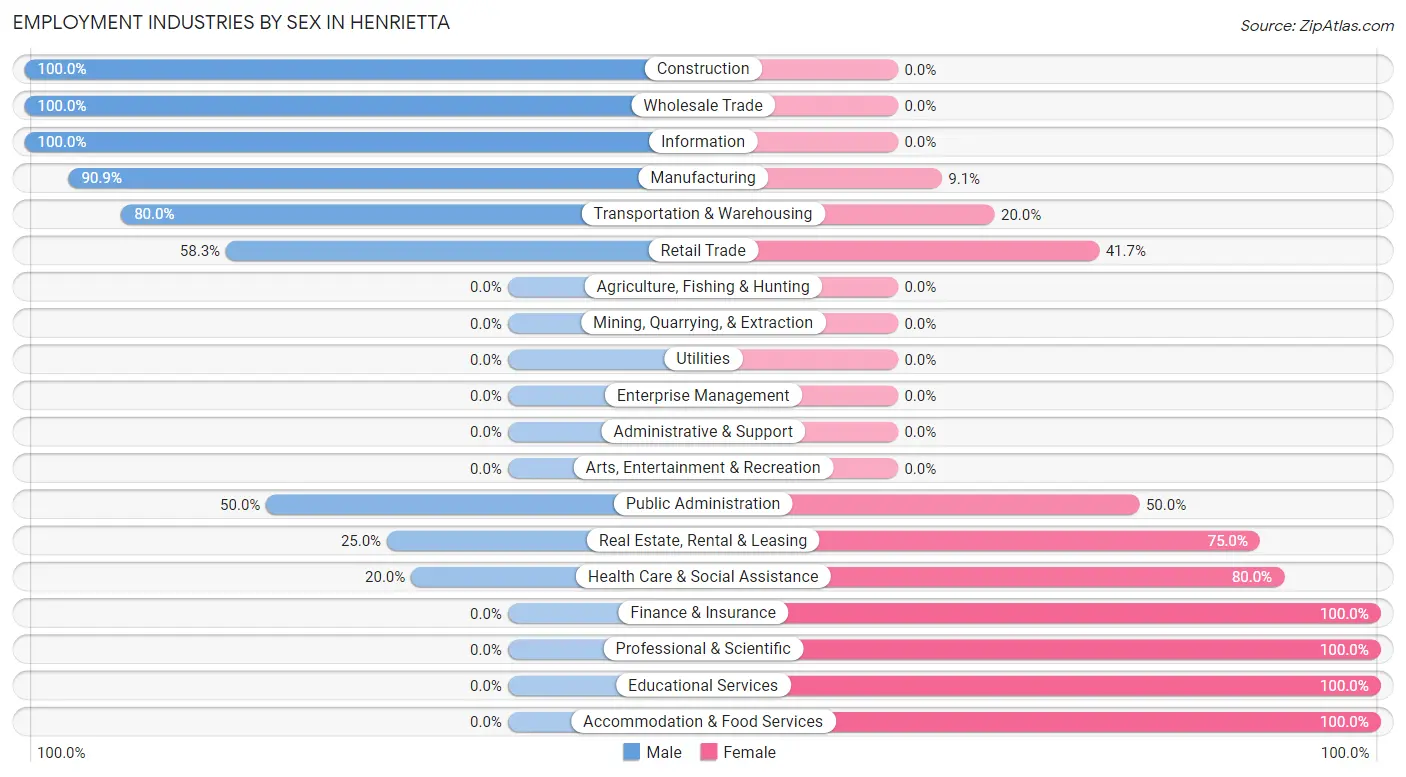
Employment Industries by Sex in Henrietta
The Henrietta industries that see more men than women are Construction (100.0%), Wholesale Trade (100.0%), and Information (100.0%), whereas the industries that tend to have a higher number of women are Finance & Insurance (100.0%), Professional & Scientific (100.0%), and Educational Services (100.0%).
| Industry | Male | Female |
| Agriculture, Fishing & Hunting | 0 (0.0%) | 0 (0.0%) |
| Mining, Quarrying, & Extraction | 0 (0.0%) | 0 (0.0%) |
| Construction | 14 (100.0%) | 0 (0.0%) |
| Manufacturing | 20 (90.9%) | 2 (9.1%) |
| Wholesale Trade | 11 (100.0%) | 0 (0.0%) |
| Retail Trade | 7 (58.3%) | 5 (41.7%) |
| Transportation & Warehousing | 4 (80.0%) | 1 (20.0%) |
| Utilities | 0 (0.0%) | 0 (0.0%) |
| Information | 1 (100.0%) | 0 (0.0%) |
| Finance & Insurance | 0 (0.0%) | 1 (100.0%) |
| Real Estate, Rental & Leasing | 1 (25.0%) | 3 (75.0%) |
| Professional & Scientific | 0 (0.0%) | 1 (100.0%) |
| Enterprise Management | 0 (0.0%) | 0 (0.0%) |
| Administrative & Support | 0 (0.0%) | 0 (0.0%) |
| Educational Services | 0 (0.0%) | 1 (100.0%) |
| Health Care & Social Assistance | 2 (20.0%) | 8 (80.0%) |
| Arts, Entertainment & Recreation | 0 (0.0%) | 0 (0.0%) |
| Accommodation & Food Services | 0 (0.0%) | 7 (100.0%) |
| Public Administration | 4 (50.0%) | 4 (50.0%) |
| Total | 71 (62.8%) | 42 (37.2%) |
Education in Henrietta
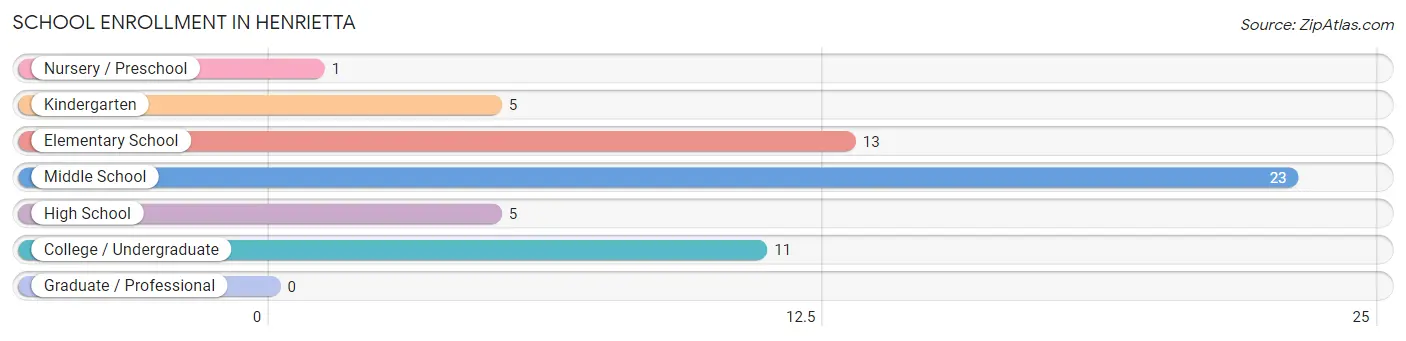
School Enrollment in Henrietta
The most common levels of schooling among the 58 students in Henrietta are middle school (23 | 39.7%), elementary school (13 | 22.4%), and college / undergraduate (11 | 19.0%).
| School Level | # Students | % Students |
| Nursery / Preschool | 1 | 1.7% |
| Kindergarten | 5 | 8.6% |
| Elementary School | 13 | 22.4% |
| Middle School | 23 | 39.7% |
| High School | 5 | 8.6% |
| College / Undergraduate | 11 | 19.0% |
| Graduate / Professional | 0 | 0.0% |
| Total | 58 | 100.0% |
School Enrollment by Age by Funding Source in Henrietta
Out of a total of 58 students who are enrolled in schools in Henrietta, 4 (6.9%) attend a private institution, while the remaining 54 (93.1%) are enrolled in public schools. The age group of 10 to 14 year olds has the highest likelihood of being enrolled in private schools, with 4 (17.4% in the age bracket) enrolled. Conversely, the age group of 3 to 4 year olds has the lowest likelihood of being enrolled in a private school, with 1 (100.0% in the age bracket) attending a public institution.
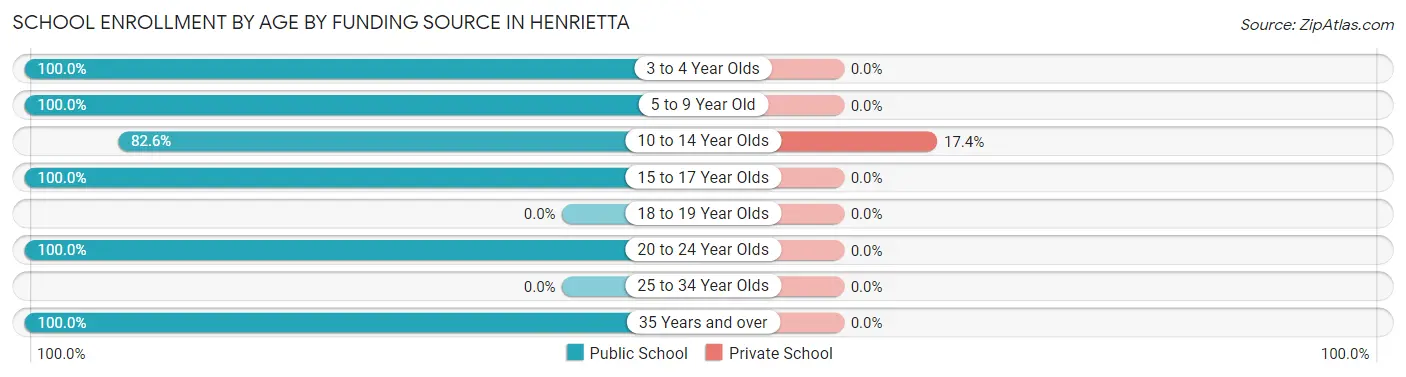
| Age Bracket | Public School | Private School |
| 3 to 4 Year Olds | 1 (100.0%) | 0 (0.0%) |
| 5 to 9 Year Old | 18 (100.0%) | 0 (0.0%) |
| 10 to 14 Year Olds | 19 (82.6%) | 4 (17.4%) |
| 15 to 17 Year Olds | 5 (100.0%) | 0 (0.0%) |
| 18 to 19 Year Olds | 0 (0.0%) | 0 (0.0%) |
| 20 to 24 Year Olds | 5 (100.0%) | 0 (0.0%) |
| 25 to 34 Year Olds | 0 (0.0%) | 0 (0.0%) |
| 35 Years and over | 6 (100.0%) | 0 (0.0%) |
| Total | 54 (93.1%) | 4 (6.9%) |
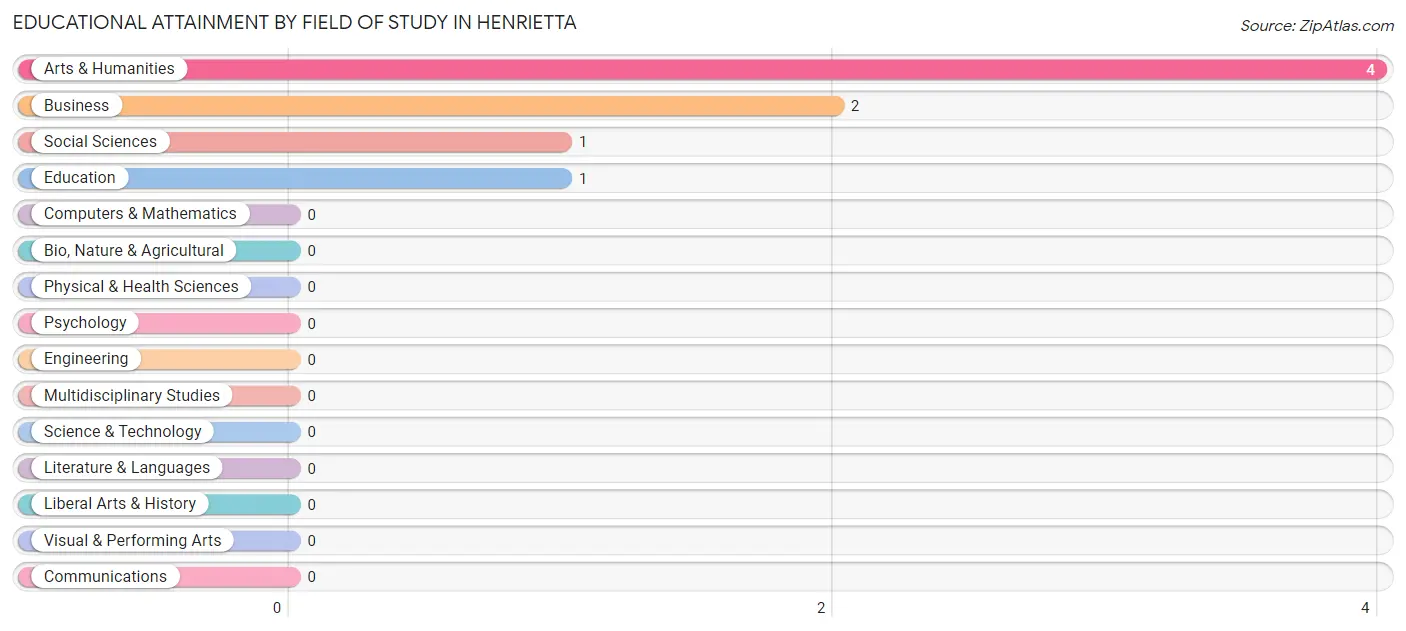
Educational Attainment by Field of Study in Henrietta
Arts & humanities (4 | 50.0%), business (2 | 25.0%), social sciences (1 | 12.5%), and education (1 | 12.5%) are the most common fields of study among 8 individuals in Henrietta who have obtained a bachelor's degree or higher.
| Field of Study | # Graduates | % Graduates |
| Computers & Mathematics | 0 | 0.0% |
| Bio, Nature & Agricultural | 0 | 0.0% |
| Physical & Health Sciences | 0 | 0.0% |
| Psychology | 0 | 0.0% |
| Social Sciences | 1 | 12.5% |
| Engineering | 0 | 0.0% |
| Multidisciplinary Studies | 0 | 0.0% |
| Science & Technology | 0 | 0.0% |
| Business | 2 | 25.0% |
| Education | 1 | 12.5% |
| Literature & Languages | 0 | 0.0% |
| Liberal Arts & History | 0 | 0.0% |
| Visual & Performing Arts | 0 | 0.0% |
| Communications | 0 | 0.0% |
| Arts & Humanities | 4 | 50.0% |
| Total | 8 | 100.0% |
Transportation & Commute in Henrietta
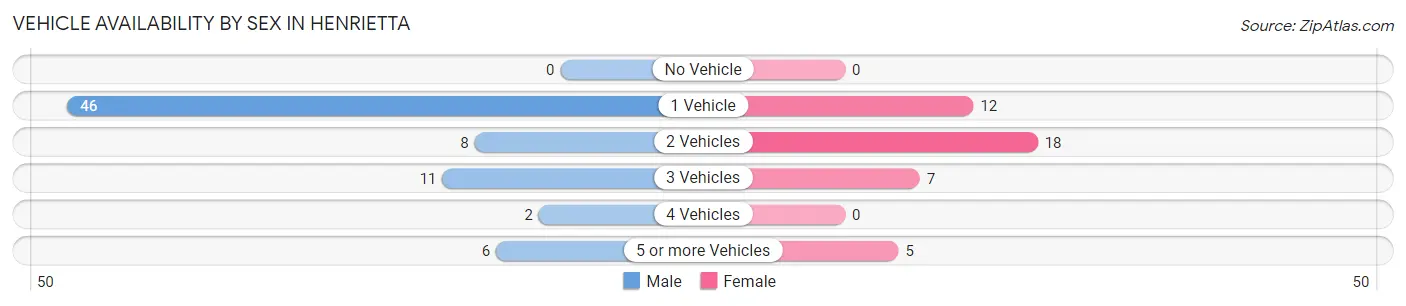
Vehicle Availability by Sex in Henrietta
The most prevalent vehicle ownership categories in Henrietta are males with 1 vehicle (46, accounting for 63.0%) and females with 1 vehicle (12, making up 109.5%).
| Vehicles Available | Male | Female |
| No Vehicle | 0 (0.0%) | 0 (0.0%) |
| 1 Vehicle | 46 (63.0%) | 12 (28.6%) |
| 2 Vehicles | 8 (11.0%) | 18 (42.9%) |
| 3 Vehicles | 11 (15.1%) | 7 (16.7%) |
| 4 Vehicles | 2 (2.7%) | 0 (0.0%) |
| 5 or more Vehicles | 6 (8.2%) | 5 (11.9%) |
| Total | 73 (100.0%) | 42 (100.0%) |
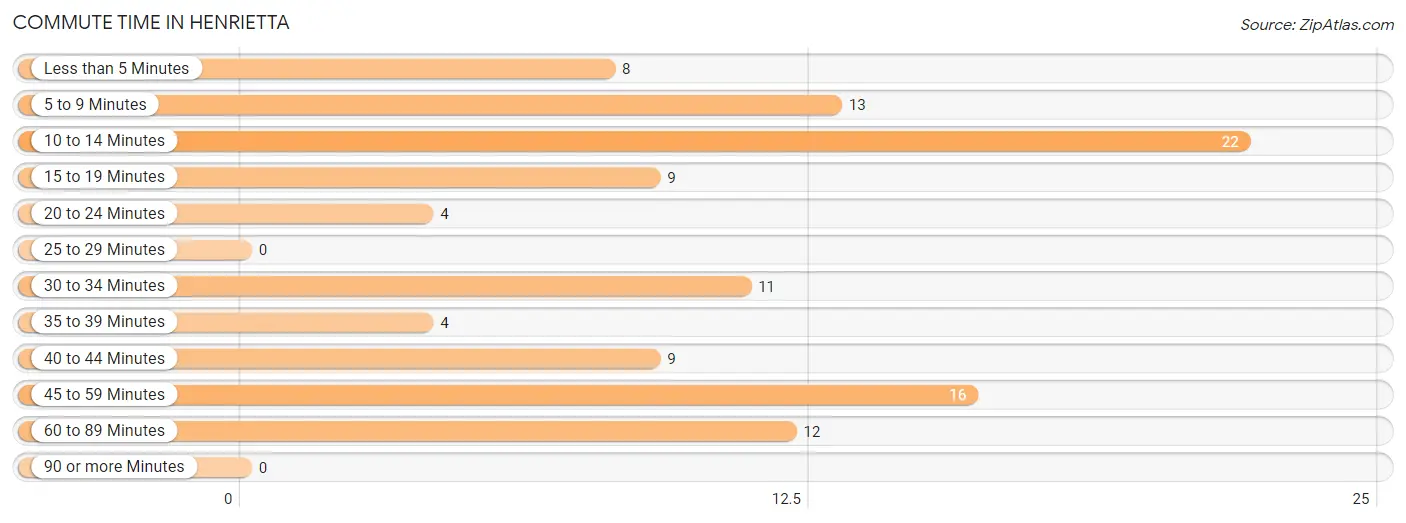
Commute Time in Henrietta
The most frequently occuring commute durations in Henrietta are 10 to 14 minutes (22 commuters, 20.4%), 45 to 59 minutes (16 commuters, 14.8%), and 5 to 9 minutes (13 commuters, 12.0%).
| Commute Time | # Commuters | % Commuters |
| Less than 5 Minutes | 8 | 7.4% |
| 5 to 9 Minutes | 13 | 12.0% |
| 10 to 14 Minutes | 22 | 20.4% |
| 15 to 19 Minutes | 9 | 8.3% |
| 20 to 24 Minutes | 4 | 3.7% |
| 25 to 29 Minutes | 0 | 0.0% |
| 30 to 34 Minutes | 11 | 10.2% |
| 35 to 39 Minutes | 4 | 3.7% |
| 40 to 44 Minutes | 9 | 8.3% |
| 45 to 59 Minutes | 16 | 14.8% |
| 60 to 89 Minutes | 12 | 11.1% |
| 90 or more Minutes | 0 | 0.0% |
Commute Time by Sex in Henrietta
The most common commute times in Henrietta are 10 to 14 minutes (16 commuters, 24.2%) for males and 45 to 59 minutes (10 commuters, 23.8%) for females.
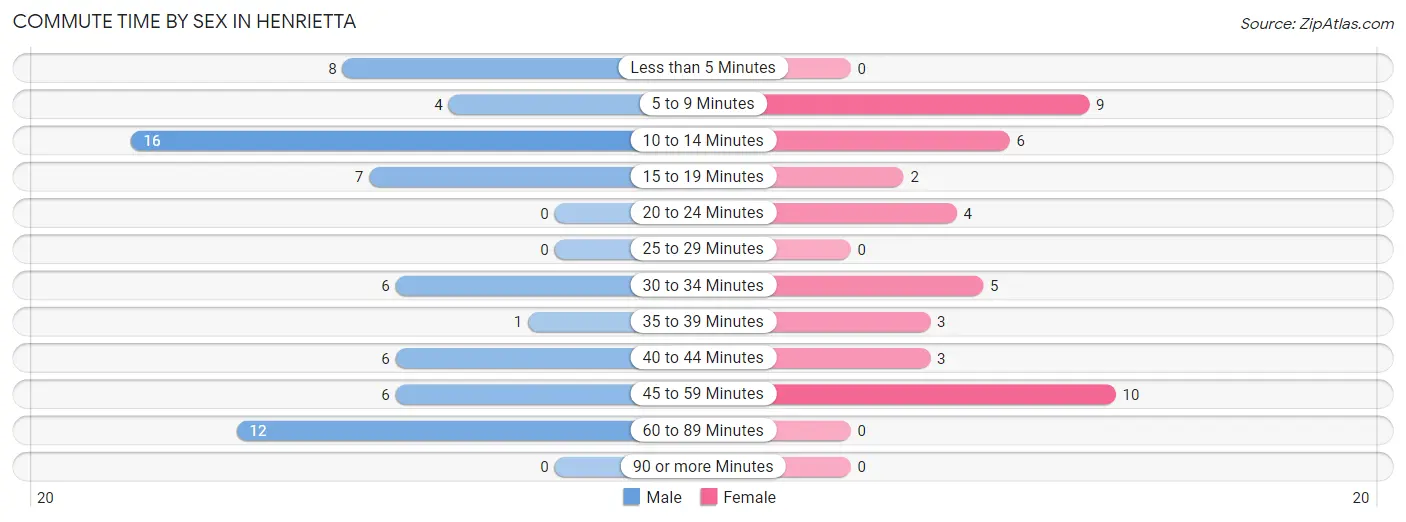
| Commute Time | Male | Female |
| Less than 5 Minutes | 8 (12.1%) | 0 (0.0%) |
| 5 to 9 Minutes | 4 (6.1%) | 9 (21.4%) |
| 10 to 14 Minutes | 16 (24.2%) | 6 (14.3%) |
| 15 to 19 Minutes | 7 (10.6%) | 2 (4.8%) |
| 20 to 24 Minutes | 0 (0.0%) | 4 (9.5%) |
| 25 to 29 Minutes | 0 (0.0%) | 0 (0.0%) |
| 30 to 34 Minutes | 6 (9.1%) | 5 (11.9%) |
| 35 to 39 Minutes | 1 (1.5%) | 3 (7.1%) |
| 40 to 44 Minutes | 6 (9.1%) | 3 (7.1%) |
| 45 to 59 Minutes | 6 (9.1%) | 10 (23.8%) |
| 60 to 89 Minutes | 12 (18.2%) | 0 (0.0%) |
| 90 or more Minutes | 0 (0.0%) | 0 (0.0%) |
Time of Departure to Work by Sex in Henrietta
The most frequent times of departure to work in Henrietta are 7:00 AM to 7:29 AM (30, 45.5%) for males and 9:00 AM to 9:59 AM (12, 28.6%) for females.
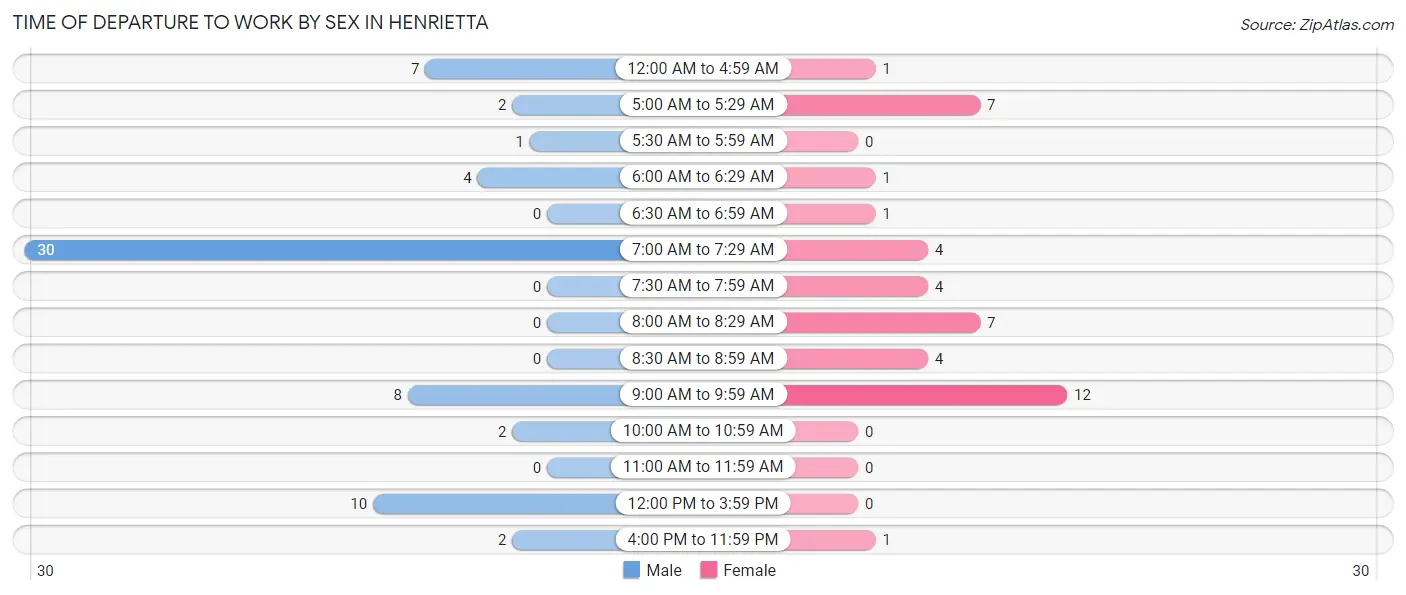
| Time of Departure | Male | Female |
| 12:00 AM to 4:59 AM | 7 (10.6%) | 1 (2.4%) |
| 5:00 AM to 5:29 AM | 2 (3.0%) | 7 (16.7%) |
| 5:30 AM to 5:59 AM | 1 (1.5%) | 0 (0.0%) |
| 6:00 AM to 6:29 AM | 4 (6.1%) | 1 (2.4%) |
| 6:30 AM to 6:59 AM | 0 (0.0%) | 1 (2.4%) |
| 7:00 AM to 7:29 AM | 30 (45.5%) | 4 (9.5%) |
| 7:30 AM to 7:59 AM | 0 (0.0%) | 4 (9.5%) |
| 8:00 AM to 8:29 AM | 0 (0.0%) | 7 (16.7%) |
| 8:30 AM to 8:59 AM | 0 (0.0%) | 4 (9.5%) |
| 9:00 AM to 9:59 AM | 8 (12.1%) | 12 (28.6%) |
| 10:00 AM to 10:59 AM | 2 (3.0%) | 0 (0.0%) |
| 11:00 AM to 11:59 AM | 0 (0.0%) | 0 (0.0%) |
| 12:00 PM to 3:59 PM | 10 (15.1%) | 0 (0.0%) |
| 4:00 PM to 11:59 PM | 2 (3.0%) | 1 (2.4%) |
| Total | 66 (100.0%) | 42 (100.0%) |
Housing Occupancy in Henrietta
Occupancy by Ownership in Henrietta
Of the total 105 dwellings in Henrietta, owner-occupied units account for 60 (57.1%), while renter-occupied units make up 45 (42.9%).
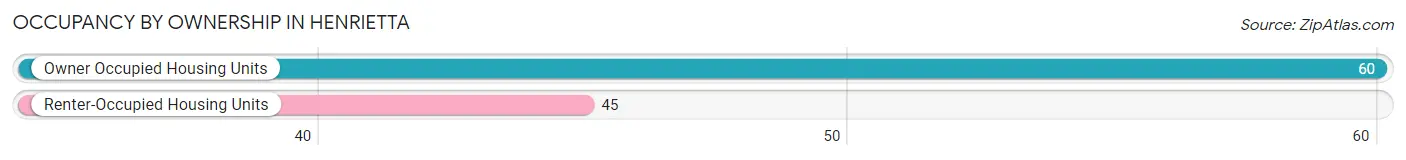
| Occupancy | # Housing Units | % Housing Units |
| Owner Occupied Housing Units | 60 | 57.1% |
| Renter-Occupied Housing Units | 45 | 42.9% |
| Total Occupied Housing Units | 105 | 100.0% |
Occupancy by Household Size in Henrietta
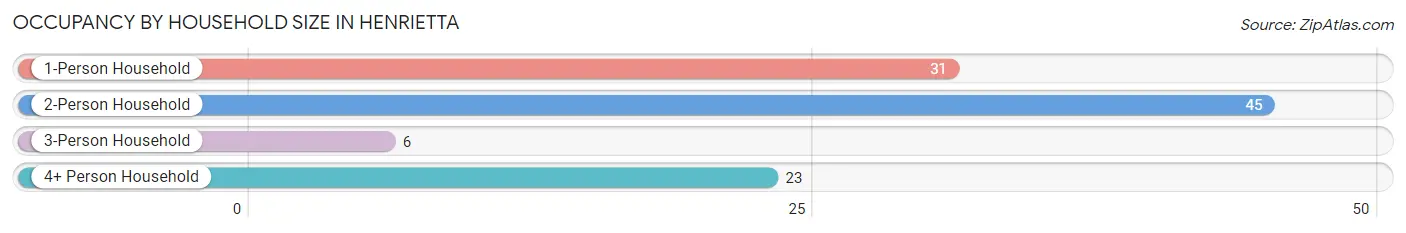
| Household Size | # Housing Units | % Housing Units |
| 1-Person Household | 31 | 29.5% |
| 2-Person Household | 45 | 42.9% |
| 3-Person Household | 6 | 5.7% |
| 4+ Person Household | 23 | 21.9% |
| Total Housing Units | 105 | 100.0% |
Occupancy by Ownership by Household Size in Henrietta
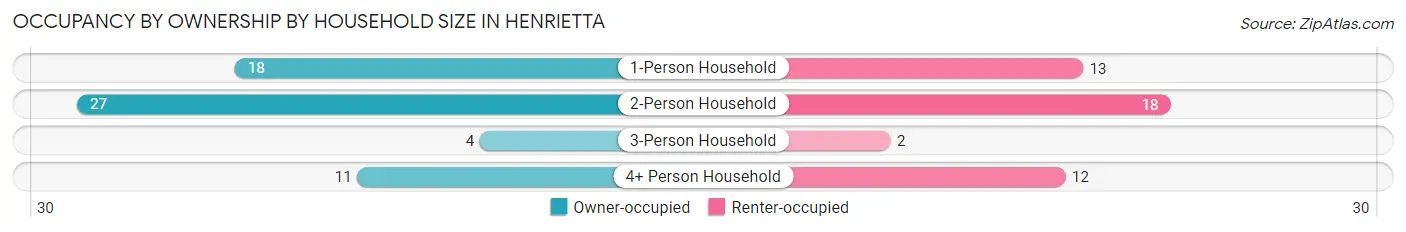
| Household Size | Owner-occupied | Renter-occupied |
| 1-Person Household | 18 (58.1%) | 13 (41.9%) |
| 2-Person Household | 27 (60.0%) | 18 (40.0%) |
| 3-Person Household | 4 (66.7%) | 2 (33.3%) |
| 4+ Person Household | 11 (47.8%) | 12 (52.2%) |
| Total Housing Units | 60 (57.1%) | 45 (42.9%) |
Occupancy by Educational Attainment in Henrietta
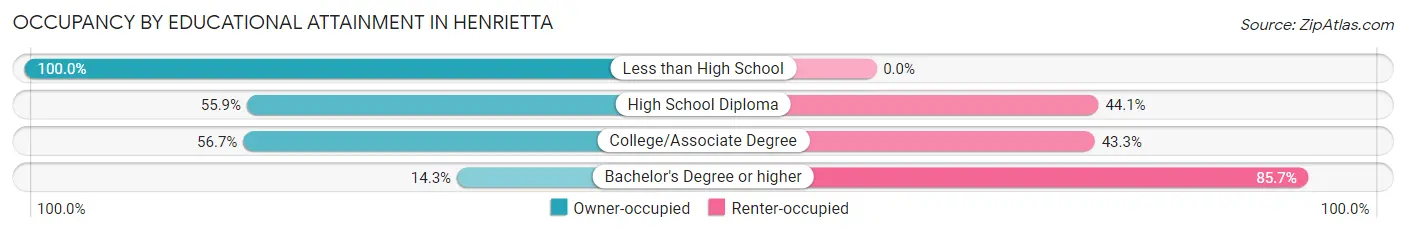
| Household Size | Owner-occupied | Renter-occupied |
| Less than High School | 9 (100.0%) | 0 (0.0%) |
| High School Diploma | 33 (55.9%) | 26 (44.1%) |
| College/Associate Degree | 17 (56.7%) | 13 (43.3%) |
| Bachelor's Degree or higher | 1 (14.3%) | 6 (85.7%) |
Occupancy by Age of Householder in Henrietta
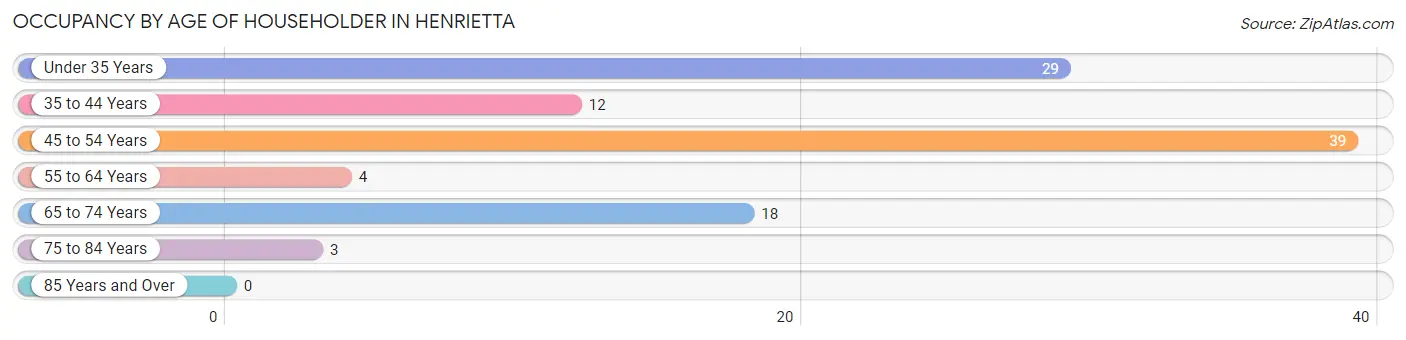
| Age Bracket | # Households | % Households |
| Under 35 Years | 29 | 27.6% |
| 35 to 44 Years | 12 | 11.4% |
| 45 to 54 Years | 39 | 37.1% |
| 55 to 64 Years | 4 | 3.8% |
| 65 to 74 Years | 18 | 17.1% |
| 75 to 84 Years | 3 | 2.9% |
| 85 Years and Over | 0 | 0.0% |
| Total | 105 | 100.0% |
Housing Finances in Henrietta
Median Income by Occupancy in Henrietta
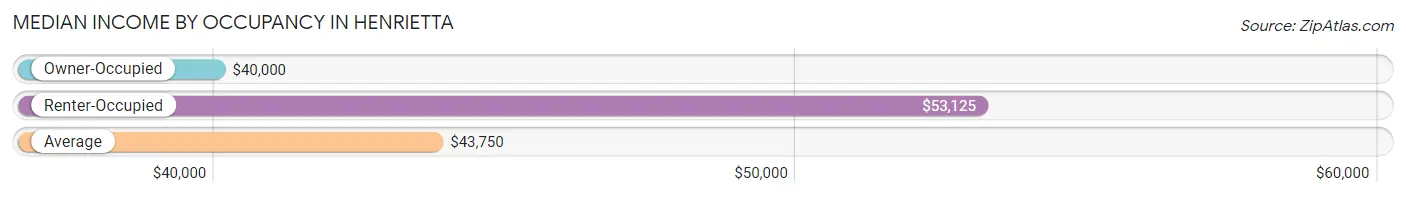
| Occupancy Type | # Households | Median Income |
| Owner-Occupied | 60 (57.1%) | $40,000 |
| Renter-Occupied | 45 (42.9%) | $53,125 |
| Average | 105 (100.0%) | $43,750 |
Occupancy by Householder Income Bracket in Henrietta
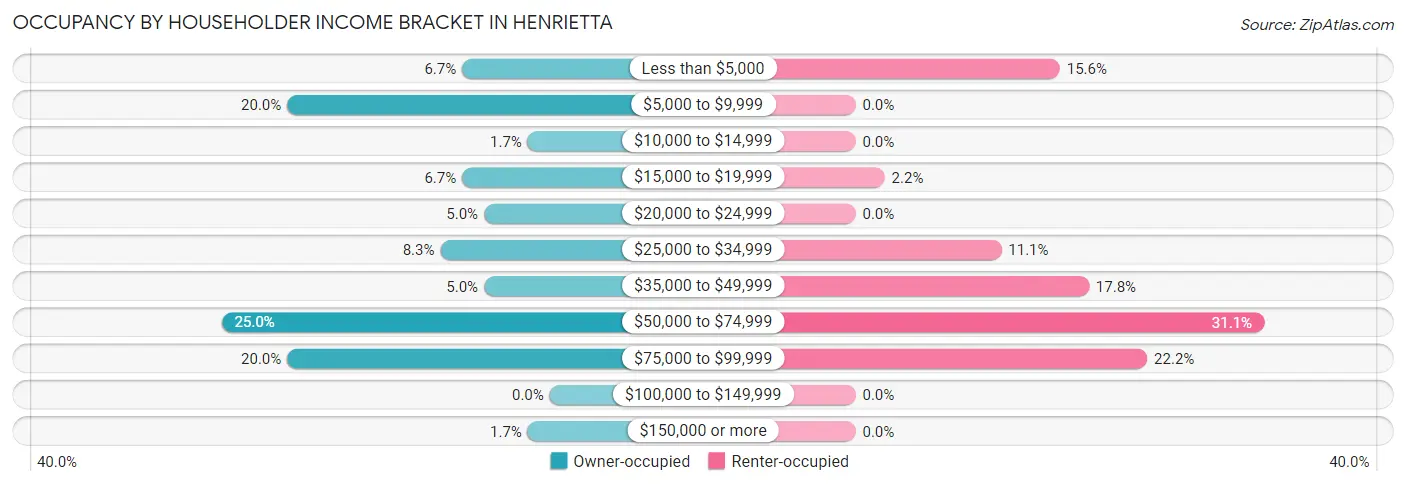
| Income Bracket | Owner-occupied | Renter-occupied |
| Less than $5,000 | 4 (6.7%) | 7 (15.6%) |
| $5,000 to $9,999 | 12 (20.0%) | 0 (0.0%) |
| $10,000 to $14,999 | 1 (1.7%) | 0 (0.0%) |
| $15,000 to $19,999 | 4 (6.7%) | 1 (2.2%) |
| $20,000 to $24,999 | 3 (5.0%) | 0 (0.0%) |
| $25,000 to $34,999 | 5 (8.3%) | 5 (11.1%) |
| $35,000 to $49,999 | 3 (5.0%) | 8 (17.8%) |
| $50,000 to $74,999 | 15 (25.0%) | 14 (31.1%) |
| $75,000 to $99,999 | 12 (20.0%) | 10 (22.2%) |
| $100,000 to $149,999 | 0 (0.0%) | 0 (0.0%) |
| $150,000 or more | 1 (1.7%) | 0 (0.0%) |
| Total | 60 (100.0%) | 45 (100.0%) |
Monthly Housing Cost Tiers in Henrietta
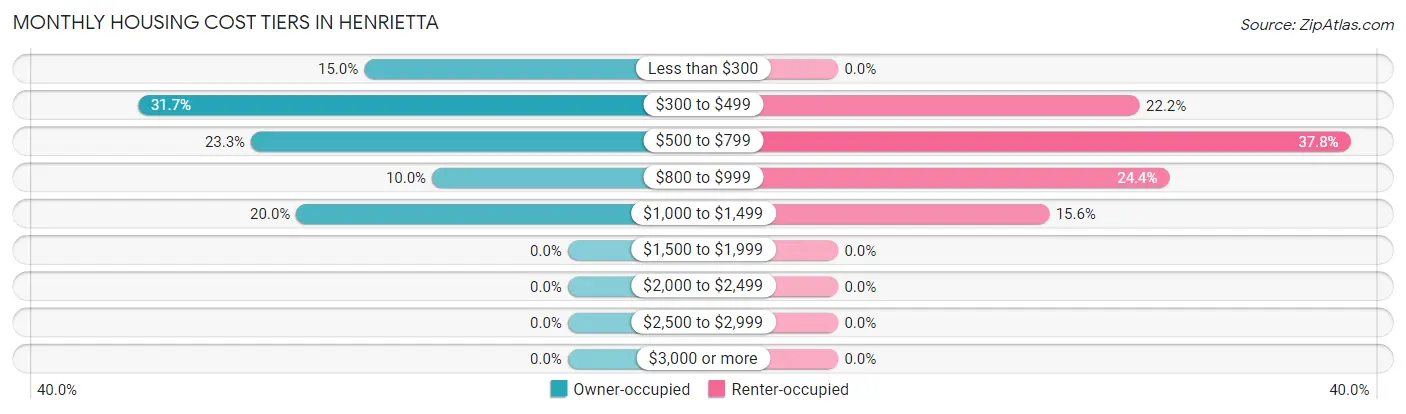
| Monthly Cost | Owner-occupied | Renter-occupied |
| Less than $300 | 9 (15.0%) | 0 (0.0%) |
| $300 to $499 | 19 (31.7%) | 10 (22.2%) |
| $500 to $799 | 14 (23.3%) | 17 (37.8%) |
| $800 to $999 | 6 (10.0%) | 11 (24.4%) |
| $1,000 to $1,499 | 12 (20.0%) | 7 (15.6%) |
| $1,500 to $1,999 | 0 (0.0%) | 0 (0.0%) |
| $2,000 to $2,499 | 0 (0.0%) | 0 (0.0%) |
| $2,500 to $2,999 | 0 (0.0%) | 0 (0.0%) |
| $3,000 or more | 0 (0.0%) | 0 (0.0%) |
| Total | 60 (100.0%) | 45 (100.0%) |
Physical Housing Characteristics in Henrietta
Housing Structures in Henrietta
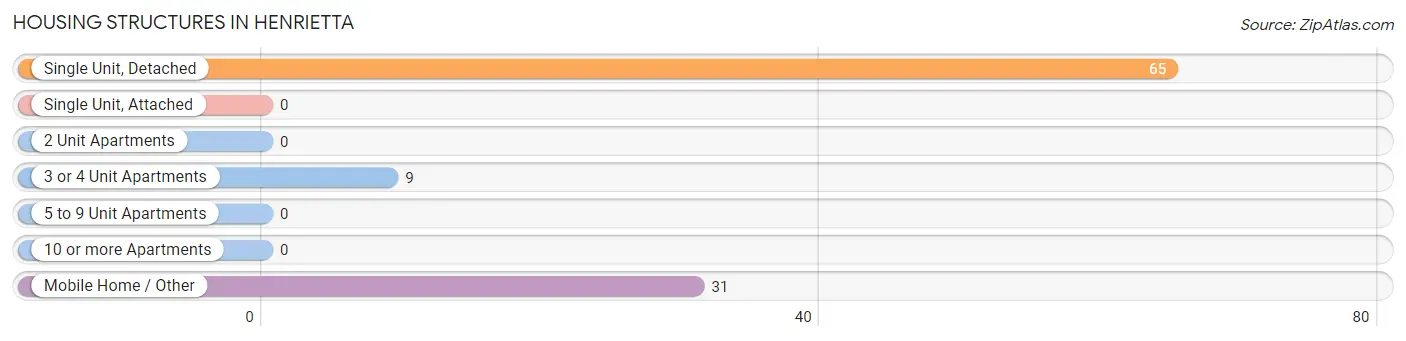
| Structure Type | # Housing Units | % Housing Units |
| Single Unit, Detached | 65 | 61.9% |
| Single Unit, Attached | 0 | 0.0% |
| 2 Unit Apartments | 0 | 0.0% |
| 3 or 4 Unit Apartments | 9 | 8.6% |
| 5 to 9 Unit Apartments | 0 | 0.0% |
| 10 or more Apartments | 0 | 0.0% |
| Mobile Home / Other | 31 | 29.5% |
| Total | 105 | 100.0% |
Housing Structures by Occupancy in Henrietta
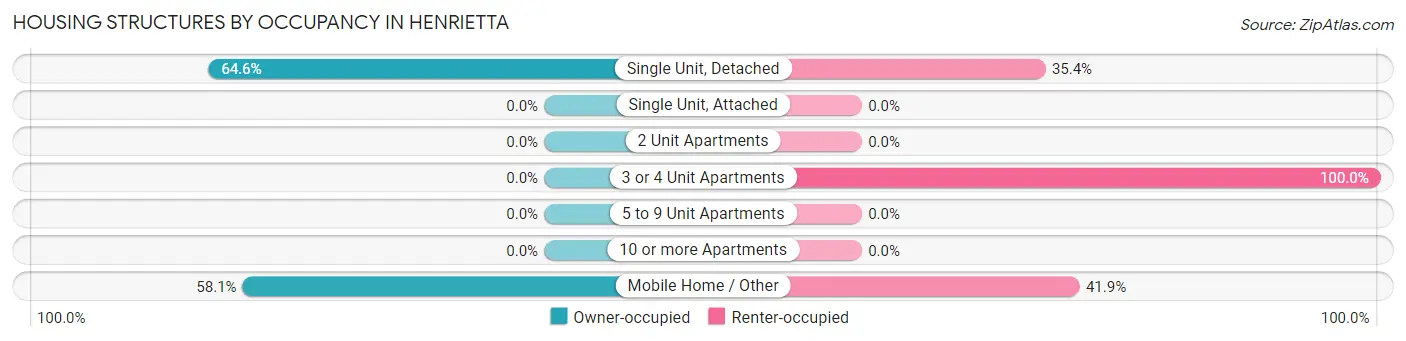
| Structure Type | Owner-occupied | Renter-occupied |
| Single Unit, Detached | 42 (64.6%) | 23 (35.4%) |
| Single Unit, Attached | 0 (0.0%) | 0 (0.0%) |
| 2 Unit Apartments | 0 (0.0%) | 0 (0.0%) |
| 3 or 4 Unit Apartments | 0 (0.0%) | 9 (100.0%) |
| 5 to 9 Unit Apartments | 0 (0.0%) | 0 (0.0%) |
| 10 or more Apartments | 0 (0.0%) | 0 (0.0%) |
| Mobile Home / Other | 18 (58.1%) | 13 (41.9%) |
| Total | 60 (57.1%) | 45 (42.9%) |
Housing Structures by Number of Rooms in Henrietta
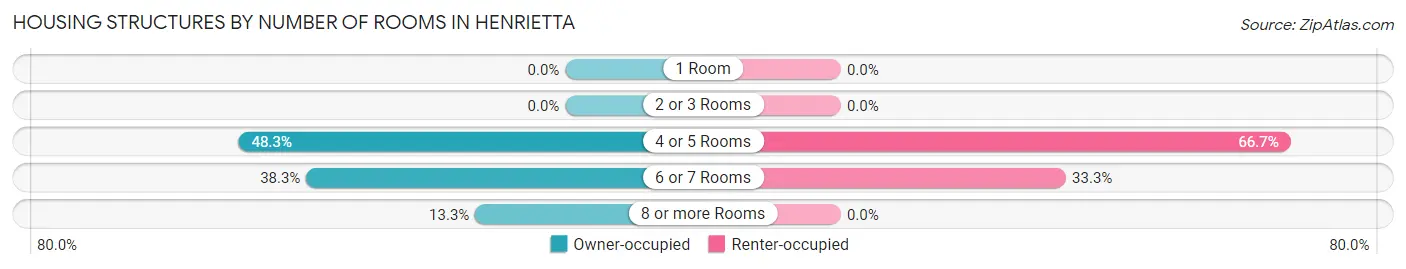
| Number of Rooms | Owner-occupied | Renter-occupied |
| 1 Room | 0 (0.0%) | 0 (0.0%) |
| 2 or 3 Rooms | 0 (0.0%) | 0 (0.0%) |
| 4 or 5 Rooms | 29 (48.3%) | 30 (66.7%) |
| 6 or 7 Rooms | 23 (38.3%) | 15 (33.3%) |
| 8 or more Rooms | 8 (13.3%) | 0 (0.0%) |
| Total | 60 (100.0%) | 45 (100.0%) |
Housing Structure by Heating Type in Henrietta
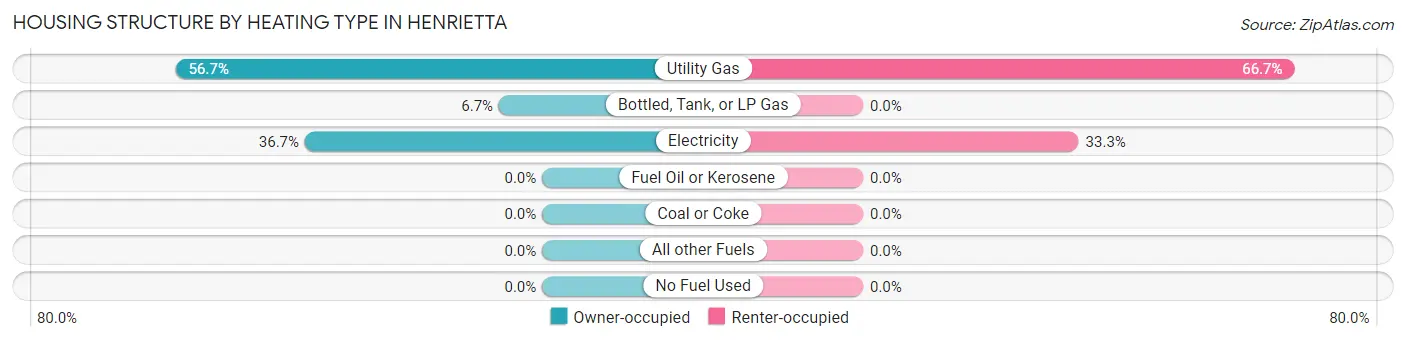
| Heating Type | Owner-occupied | Renter-occupied |
| Utility Gas | 34 (56.7%) | 30 (66.7%) |
| Bottled, Tank, or LP Gas | 4 (6.7%) | 0 (0.0%) |
| Electricity | 22 (36.7%) | 15 (33.3%) |
| Fuel Oil or Kerosene | 0 (0.0%) | 0 (0.0%) |
| Coal or Coke | 0 (0.0%) | 0 (0.0%) |
| All other Fuels | 0 (0.0%) | 0 (0.0%) |
| No Fuel Used | 0 (0.0%) | 0 (0.0%) |
| Total | 60 (100.0%) | 45 (100.0%) |
Household Vehicle Usage in Henrietta
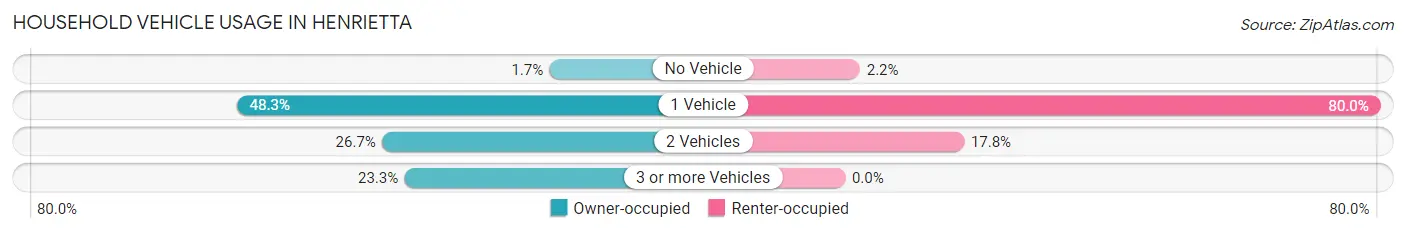
| Vehicles per Household | Owner-occupied | Renter-occupied |
| No Vehicle | 1 (1.7%) | 1 (2.2%) |
| 1 Vehicle | 29 (48.3%) | 36 (80.0%) |
| 2 Vehicles | 16 (26.7%) | 8 (17.8%) |
| 3 or more Vehicles | 14 (23.3%) | 0 (0.0%) |
| Total | 60 (100.0%) | 45 (100.0%) |
Real Estate & Mortgages in Henrietta
Real Estate and Mortgage Overview in Henrietta
| Characteristic | Without Mortgage | With Mortgage |
| Housing Units | 35 | 25 |
| Median Property Value | $9,999 | $85,000 |
| Median Household Income | $23,750 | $1 |
| Monthly Housing Costs | $365 | $0 |
| Real Estate Taxes | $411 | $4 |
Property Value by Mortgage Status in Henrietta
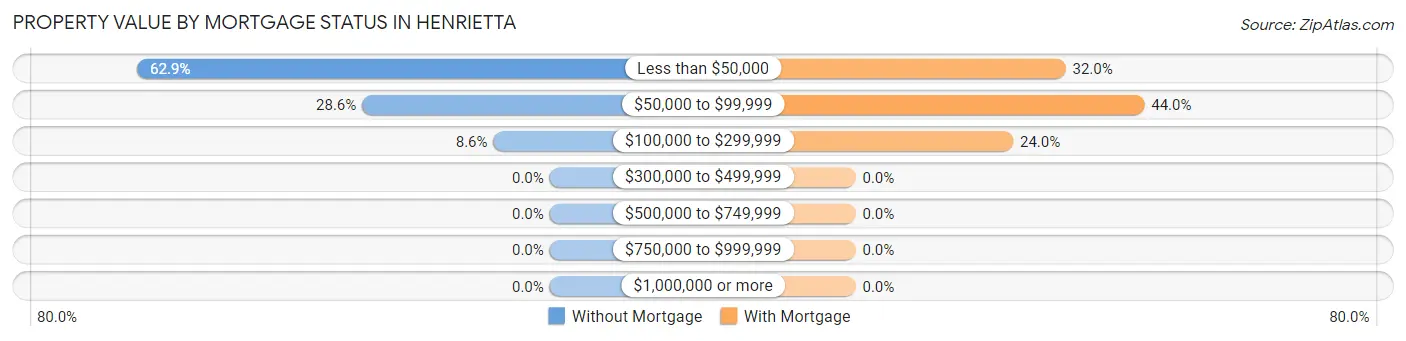
| Property Value | Without Mortgage | With Mortgage |
| Less than $50,000 | 22 (62.9%) | 8 (32.0%) |
| $50,000 to $99,999 | 10 (28.6%) | 11 (44.0%) |
| $100,000 to $299,999 | 3 (8.6%) | 6 (24.0%) |
| $300,000 to $499,999 | 0 (0.0%) | 0 (0.0%) |
| $500,000 to $749,999 | 0 (0.0%) | 0 (0.0%) |
| $750,000 to $999,999 | 0 (0.0%) | 0 (0.0%) |
| $1,000,000 or more | 0 (0.0%) | 0 (0.0%) |
| Total | 35 (100.0%) | 25 (100.0%) |
Household Income by Mortgage Status in Henrietta
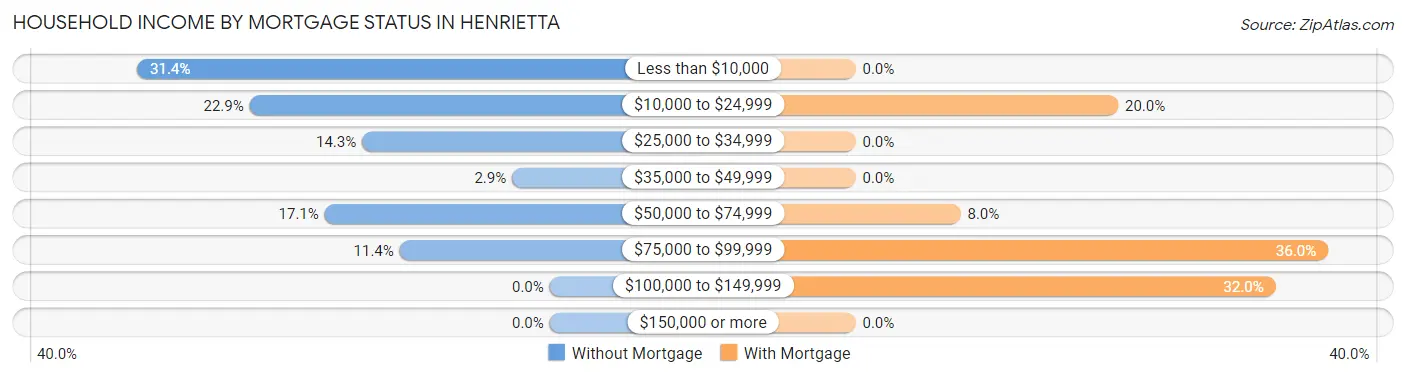
| Household Income | Without Mortgage | With Mortgage |
| Less than $10,000 | 11 (31.4%) | 0 (0.0%) |
| $10,000 to $24,999 | 8 (22.9%) | 5 (20.0%) |
| $25,000 to $34,999 | 5 (14.3%) | 0 (0.0%) |
| $35,000 to $49,999 | 1 (2.9%) | 0 (0.0%) |
| $50,000 to $74,999 | 6 (17.1%) | 2 (8.0%) |
| $75,000 to $99,999 | 4 (11.4%) | 9 (36.0%) |
| $100,000 to $149,999 | 0 (0.0%) | 8 (32.0%) |
| $150,000 or more | 0 (0.0%) | 0 (0.0%) |
| Total | 35 (100.0%) | 25 (100.0%) |
Property Value to Household Income Ratio in Henrietta
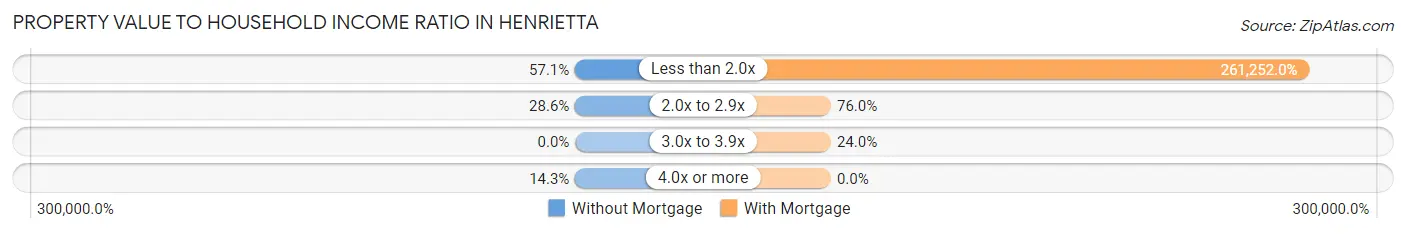
| Value-to-Income Ratio | Without Mortgage | With Mortgage |
| Less than 2.0x | 20 (57.1%) | 65,313 (261,252.0%) |
| 2.0x to 2.9x | 10 (28.6%) | 19 (76.0%) |
| 3.0x to 3.9x | 0 (0.0%) | 6 (24.0%) |
| 4.0x or more | 5 (14.3%) | 0 (0.0%) |
| Total | 35 (100.0%) | 25 (100.0%) |
Real Estate Taxes by Mortgage Status in Henrietta
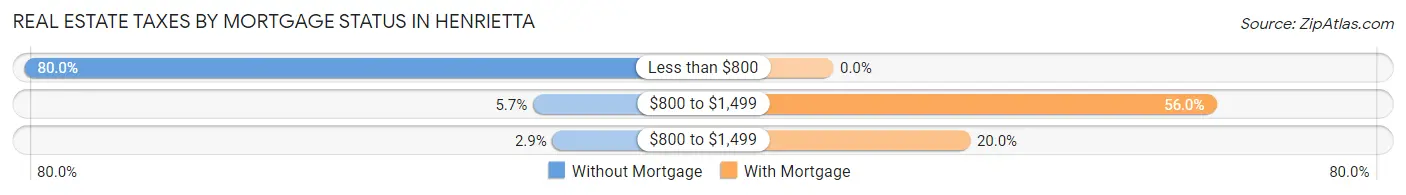
| Property Taxes | Without Mortgage | With Mortgage |
| Less than $800 | 28 (80.0%) | 0 (0.0%) |
| $800 to $1,499 | 2 (5.7%) | 14 (56.0%) |
| $800 to $1,499 | 1 (2.9%) | 5 (20.0%) |
| Total | 35 (100.0%) | 25 (100.0%) |
Health & Disability in Henrietta
Health Insurance Coverage by Age in Henrietta
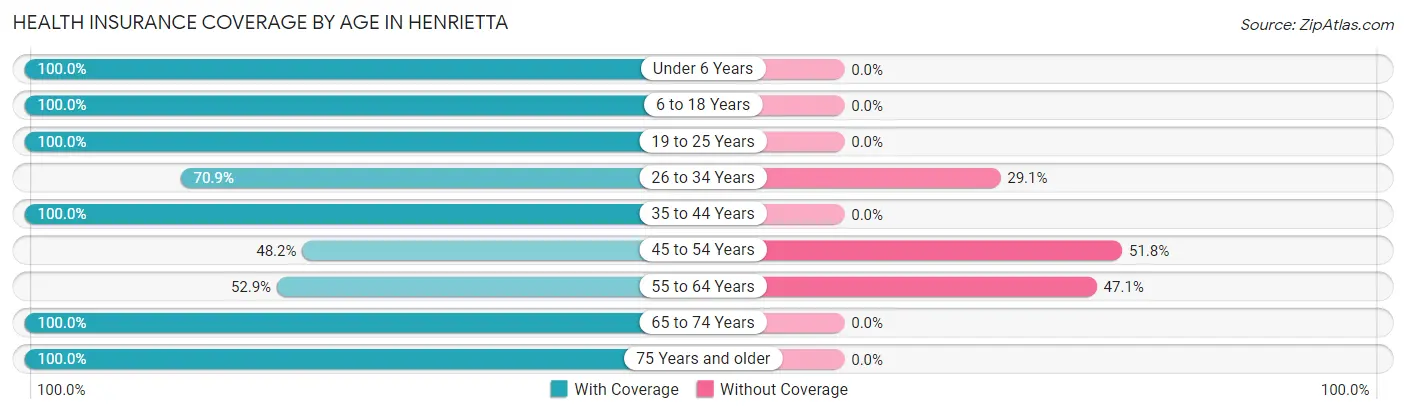
| Age Bracket | With Coverage | Without Coverage |
| Under 6 Years | 16 (100.0%) | 0 (0.0%) |
| 6 to 18 Years | 41 (100.0%) | 0 (0.0%) |
| 19 to 25 Years | 29 (100.0%) | 0 (0.0%) |
| 26 to 34 Years | 39 (70.9%) | 16 (29.1%) |
| 35 to 44 Years | 17 (100.0%) | 0 (0.0%) |
| 45 to 54 Years | 27 (48.2%) | 29 (51.8%) |
| 55 to 64 Years | 9 (52.9%) | 8 (47.1%) |
| 65 to 74 Years | 21 (100.0%) | 0 (0.0%) |
| 75 Years and older | 9 (100.0%) | 0 (0.0%) |
| Total | 208 (79.7%) | 53 (20.3%) |
Health Insurance Coverage by Citizenship Status in Henrietta
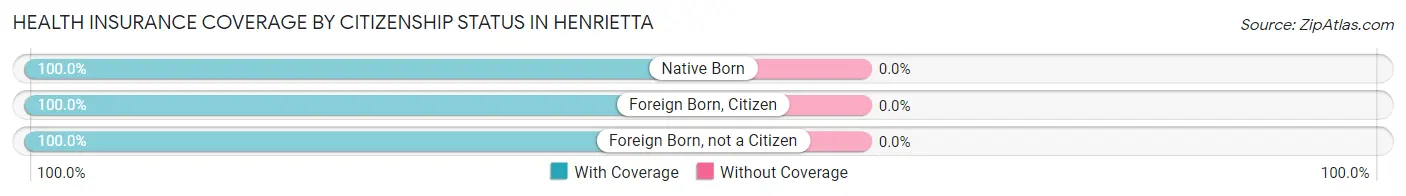
| Citizenship Status | With Coverage | Without Coverage |
| Native Born | 16 (100.0%) | 0 (0.0%) |
| Foreign Born, Citizen | 41 (100.0%) | 0 (0.0%) |
| Foreign Born, not a Citizen | 29 (100.0%) | 0 (0.0%) |
Health Insurance Coverage by Household Income in Henrietta
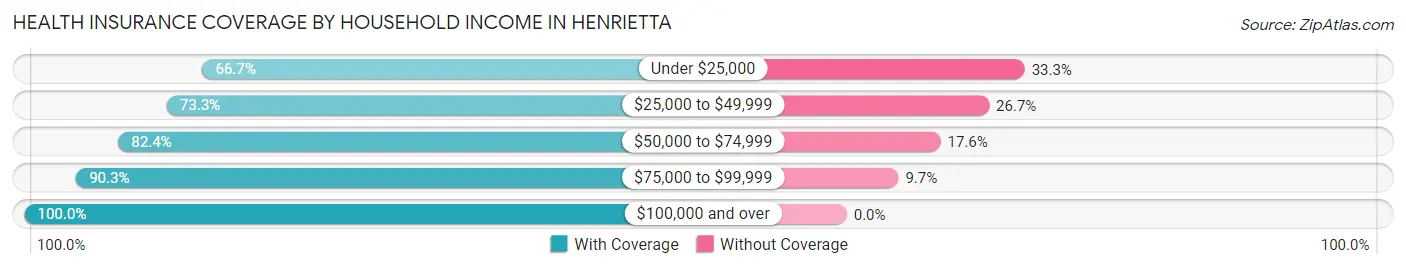
| Household Income | With Coverage | Without Coverage |
| Under $25,000 | 38 (66.7%) | 19 (33.3%) |
| $25,000 to $49,999 | 33 (73.3%) | 12 (26.7%) |
| $50,000 to $74,999 | 75 (82.4%) | 16 (17.6%) |
| $75,000 to $99,999 | 56 (90.3%) | 6 (9.7%) |
| $100,000 and over | 6 (100.0%) | 0 (0.0%) |
Public vs Private Health Insurance Coverage by Age in Henrietta
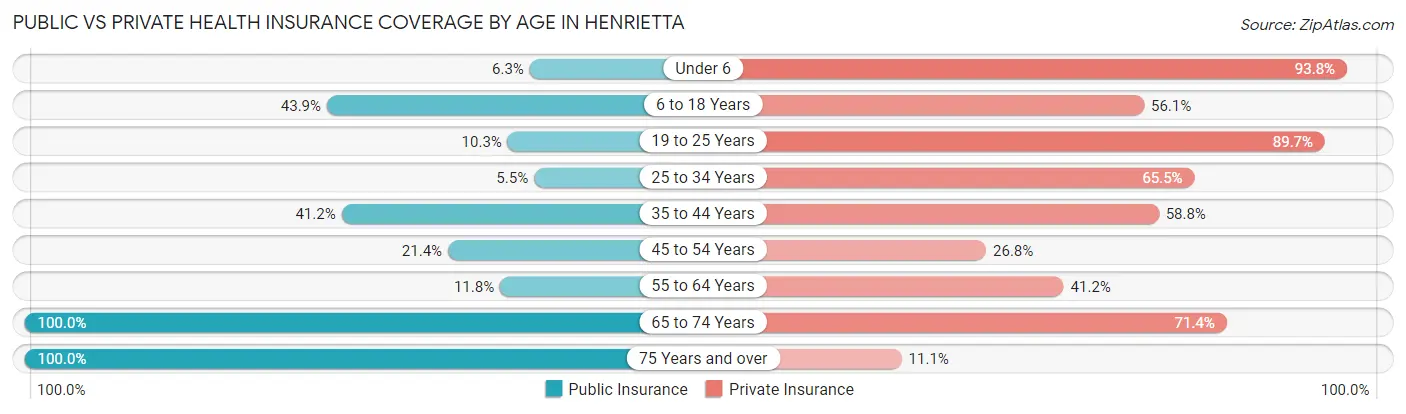
| Age Bracket | Public Insurance | Private Insurance |
| Under 6 | 1 (6.2%) | 15 (93.8%) |
| 6 to 18 Years | 18 (43.9%) | 23 (56.1%) |
| 19 to 25 Years | 3 (10.3%) | 26 (89.7%) |
| 25 to 34 Years | 3 (5.4%) | 36 (65.4%) |
| 35 to 44 Years | 7 (41.2%) | 10 (58.8%) |
| 45 to 54 Years | 12 (21.4%) | 15 (26.8%) |
| 55 to 64 Years | 2 (11.8%) | 7 (41.2%) |
| 65 to 74 Years | 21 (100.0%) | 15 (71.4%) |
| 75 Years and over | 9 (100.0%) | 1 (11.1%) |
| Total | 76 (29.1%) | 148 (56.7%) |
Disability Status by Sex by Age in Henrietta
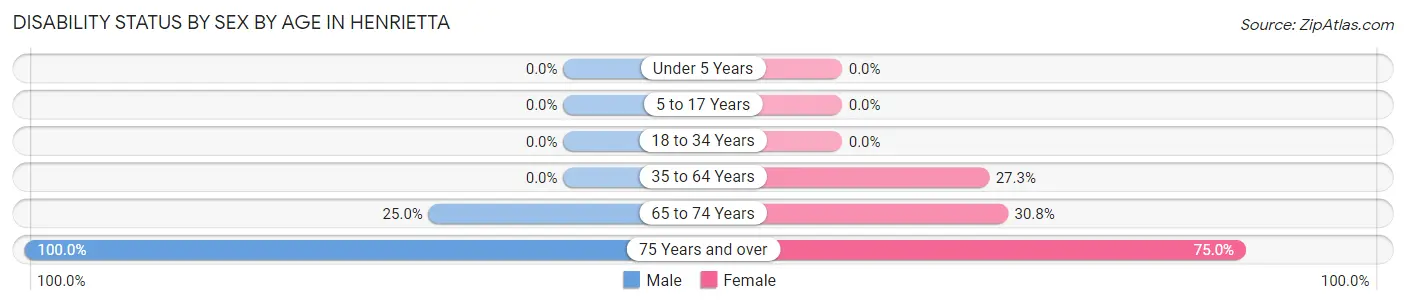
| Age Bracket | Male | Female |
| Under 5 Years | 0 (0.0%) | 0 (0.0%) |
| 5 to 17 Years | 0 (0.0%) | 0 (0.0%) |
| 18 to 34 Years | 0 (0.0%) | 0 (0.0%) |
| 35 to 64 Years | 0 (0.0%) | 12 (27.3%) |
| 65 to 74 Years | 2 (25.0%) | 4 (30.8%) |
| 75 Years and over | 5 (100.0%) | 3 (75.0%) |
Disability Class by Sex by Age in Henrietta
Disability Class: Hearing Difficulty
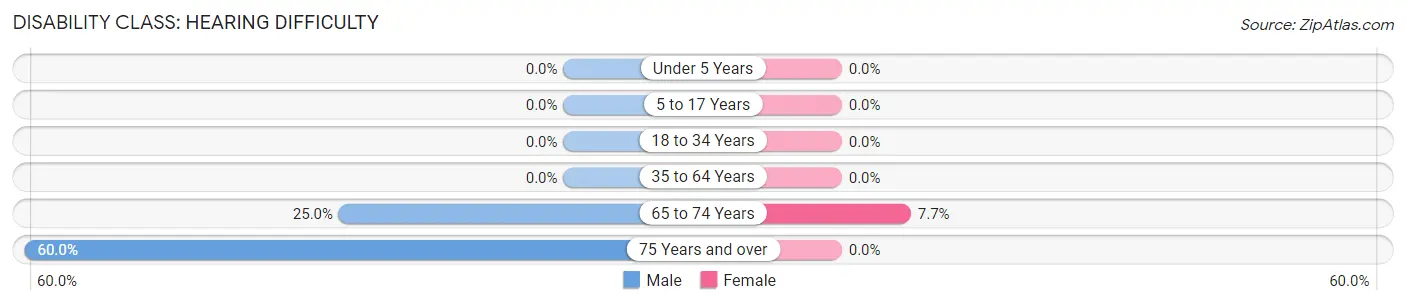
| Age Bracket | Male | Female |
| Under 5 Years | 0 (0.0%) | 0 (0.0%) |
| 5 to 17 Years | 0 (0.0%) | 0 (0.0%) |
| 18 to 34 Years | 0 (0.0%) | 0 (0.0%) |
| 35 to 64 Years | 0 (0.0%) | 0 (0.0%) |
| 65 to 74 Years | 2 (25.0%) | 1 (7.7%) |
| 75 Years and over | 3 (60.0%) | 0 (0.0%) |
Disability Class: Vision Difficulty
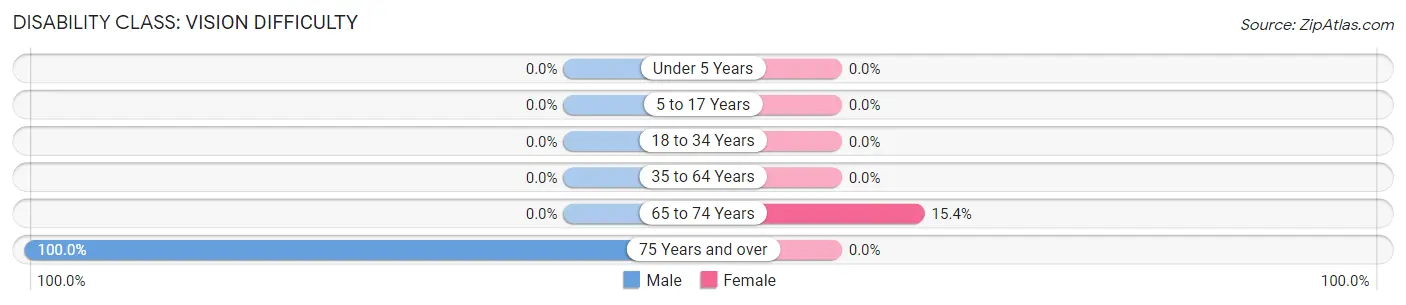
| Age Bracket | Male | Female |
| Under 5 Years | 0 (0.0%) | 0 (0.0%) |
| 5 to 17 Years | 0 (0.0%) | 0 (0.0%) |
| 18 to 34 Years | 0 (0.0%) | 0 (0.0%) |
| 35 to 64 Years | 0 (0.0%) | 0 (0.0%) |
| 65 to 74 Years | 0 (0.0%) | 2 (15.4%) |
| 75 Years and over | 5 (100.0%) | 0 (0.0%) |
Disability Class: Cognitive Difficulty
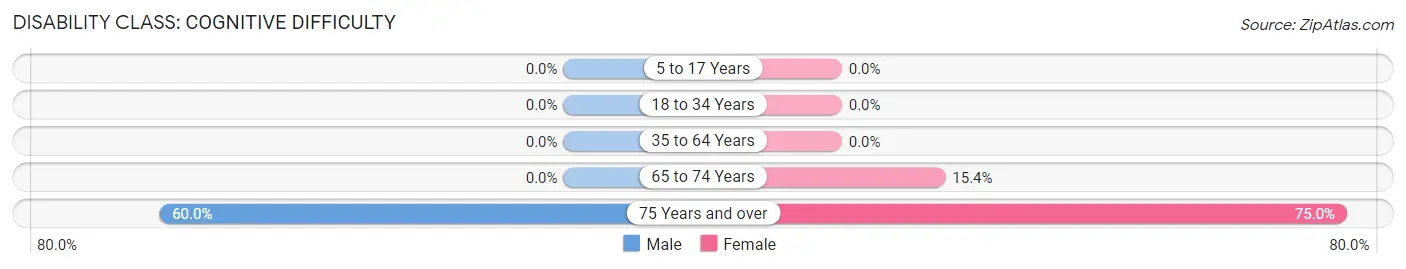
| Age Bracket | Male | Female |
| 5 to 17 Years | 0 (0.0%) | 0 (0.0%) |
| 18 to 34 Years | 0 (0.0%) | 0 (0.0%) |
| 35 to 64 Years | 0 (0.0%) | 0 (0.0%) |
| 65 to 74 Years | 0 (0.0%) | 2 (15.4%) |
| 75 Years and over | 3 (60.0%) | 3 (75.0%) |
Disability Class: Ambulatory Difficulty
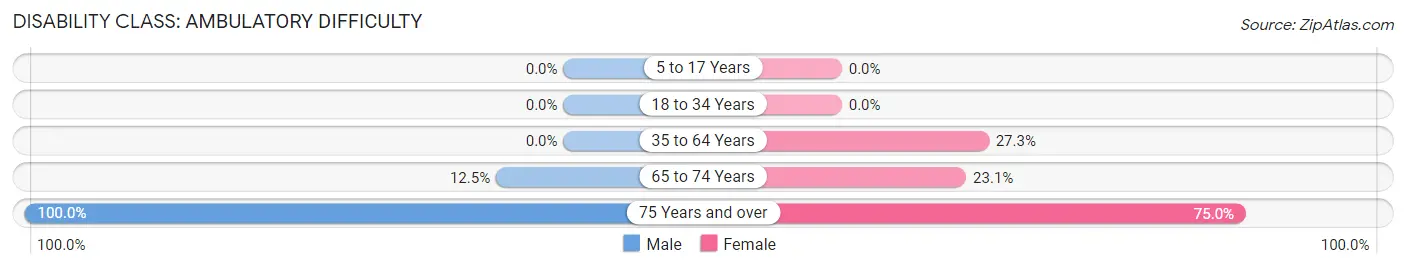
| Age Bracket | Male | Female |
| 5 to 17 Years | 0 (0.0%) | 0 (0.0%) |
| 18 to 34 Years | 0 (0.0%) | 0 (0.0%) |
| 35 to 64 Years | 0 (0.0%) | 12 (27.3%) |
| 65 to 74 Years | 1 (12.5%) | 3 (23.1%) |
| 75 Years and over | 5 (100.0%) | 3 (75.0%) |
Disability Class: Self-Care Difficulty
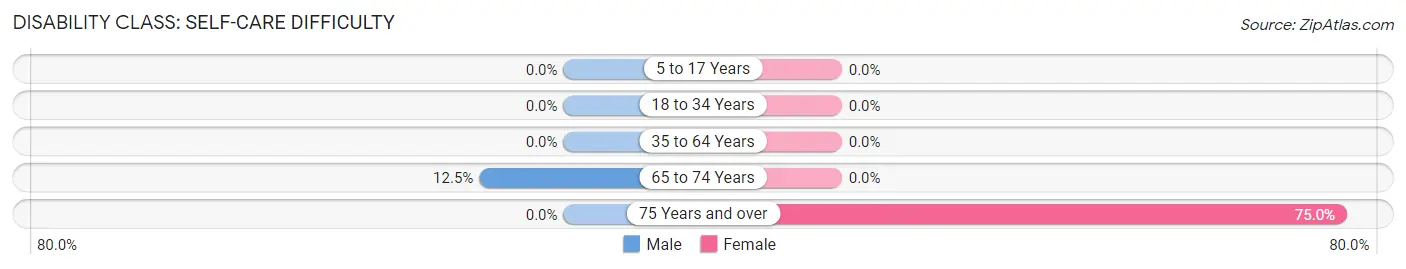
| Age Bracket | Male | Female |
| 5 to 17 Years | 0 (0.0%) | 0 (0.0%) |
| 18 to 34 Years | 0 (0.0%) | 0 (0.0%) |
| 35 to 64 Years | 0 (0.0%) | 0 (0.0%) |
| 65 to 74 Years | 1 (12.5%) | 0 (0.0%) |
| 75 Years and over | 0 (0.0%) | 3 (75.0%) |
Technology Access in Henrietta
Computing Device Access in Henrietta
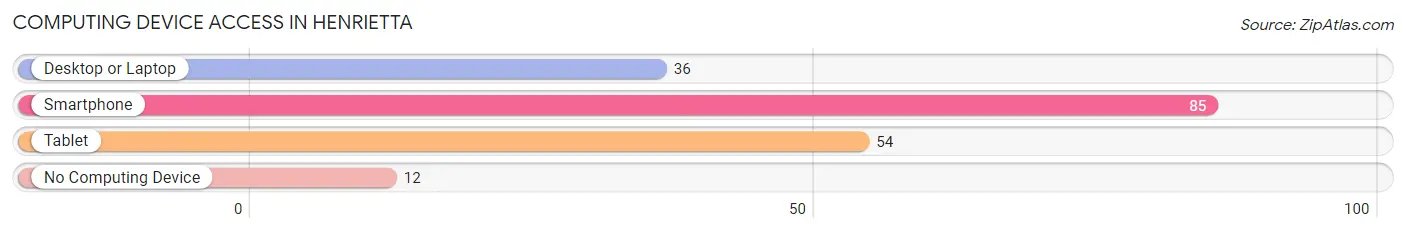
| Device Type | # Households | % Households |
| Desktop or Laptop | 36 | 34.3% |
| Smartphone | 85 | 80.9% |
| Tablet | 54 | 51.4% |
| No Computing Device | 12 | 11.4% |
| Total | 105 | 100.0% |
Internet Access in Henrietta
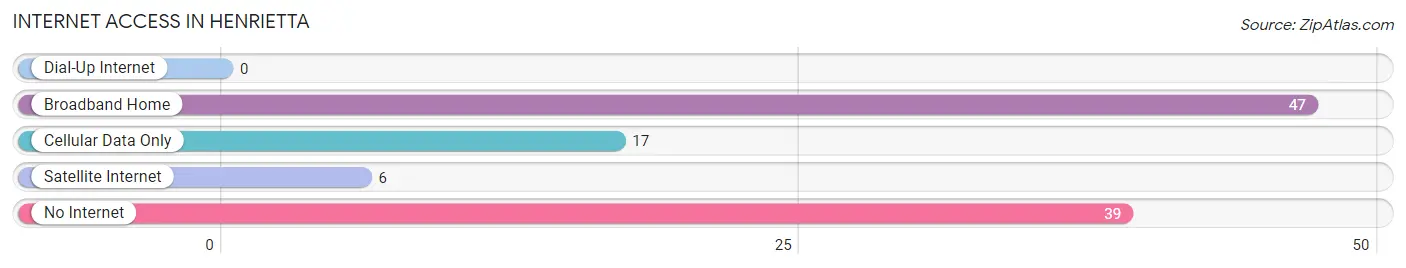
| Internet Type | # Households | % Households |
| Dial-Up Internet | 0 | 0.0% |
| Broadband Home | 47 | 44.8% |
| Cellular Data Only | 17 | 16.2% |
| Satellite Internet | 6 | 5.7% |
| No Internet | 39 | 37.1% |
| Total | 105 | 100.0% |
Henrietta Summary
Henrietta, Missouri is a small town located in the northwest corner of the state, in the Ozark Mountains. It is situated in the heart of the Ozark National Scenic Riverways, a protected area of rivers, streams, and forests. The town is home to a population of just over 500 people, and is known for its rural charm and natural beauty.
History
Henrietta was founded in 1883 by a group of settlers from the nearby town of Ozark. The town was named after Henrietta, the daughter of one of the settlers. The town was originally a farming community, and the settlers grew corn, wheat, and other crops. As the town grew, it became a center for logging and timber production. In the early 1900s, the town was home to several sawmills and lumber companies.
In the 1920s, the town began to experience a decline in population as many of the residents moved away to find work in larger cities. However, the town was able to remain afloat due to its proximity to the Ozark National Scenic Riverways. In the 1950s, the town began to experience a resurgence in population as people began to move back to the area to take advantage of the natural beauty and recreational opportunities.
Geography
Henrietta is located in the northwest corner of Missouri, in the Ozark Mountains. The town is situated in the heart of the Ozark National Scenic Riverways, a protected area of rivers, streams, and forests. The town is surrounded by rolling hills and lush forests, and is home to a variety of wildlife. The town is located near several popular recreational areas, including the Mark Twain National Forest, the Ozark National Scenic Riverways, and the Big Piney River.
Economy
Henrietta’s economy is largely based on tourism and recreation. The town is home to several popular tourist attractions, including the Ozark National Scenic Riverways, the Mark Twain National Forest, and the Big Piney River. The town is also home to several small businesses, including restaurants, shops, and lodging.
Demographics
As of the 2010 census, the population of Henrietta was 514. The town is predominantly white, with a small minority population. The median household income is $35,000, and the median age is 44. The town is home to a variety of religious denominations, including Baptist, Methodist, and Catholic. The town is also home to a variety of recreational activities, including fishing, hunting, and camping.
Common Questions
What is the Total Population of Henrietta?
Total Population of Henrietta is 295.
What is the Total Male Population of Henrietta?
Total Male Population of Henrietta is 173.
What is the Total Female Population of Henrietta?
Total Female Population of Henrietta is 122.
What is the Ratio of Males per 100 Females in Henrietta?
There are 141.80 Males per 100 Females in Henrietta.
What is the Ratio of Females per 100 Males in Henrietta?
There are 70.52 Females per 100 Males in Henrietta.
What is the Median Population Age in Henrietta?
Median Population Age in Henrietta is 31.8 Years.
What is the Average Family Size in Henrietta
Average Family Size in Henrietta is 3.3 People.
What is the Average Household Size in Henrietta
Average Household Size in Henrietta is 2.5 People.
What is Per Capita Income in Henrietta?
Per Capita income in Henrietta is $18,412.
What is the Median Family Income in Henrietta?
Median Family Income in Henrietta is $50,625.
What is the Median Household income in Henrietta?
Median Household Income in Henrietta is $43,750.
What is Inequality or Gini Index in Henrietta?
Inequality or Gini Index in Henrietta is 0.39.
How Large is the Labor Force in Henrietta?
There are 123 People in the Labor Forcein in Henrietta.
What is the Percentage of People in the Labor Force in Henrietta?
50.8% of People are in the Labor Force in Henrietta.
What is the Unemployment Rate in Henrietta?
Unemployment Rate in Henrietta is 6.6%.