Greenwood, MO Map & Demographics
Greenwood Map
Greenwood Overview
$43,074
PER CAPITA INCOME
$112,500
AVG FAMILY INCOME
$103,560
AVG HOUSEHOLD INCOME
15.9%
WAGE / INCOME GAP [ % ]
84.1¢/ $1
WAGE / INCOME GAP [ $ ]
0.29
INEQUALITY / GINI INDEX
6,038
TOTAL POPULATION
3,157
MALE POPULATION
2,881
FEMALE POPULATION
109.58
MALES / 100 FEMALES
91.26
FEMALES / 100 MALES
37.0
MEDIAN AGE
2.8
AVG FAMILY SIZE
2.8
AVG HOUSEHOLD SIZE
3,704
LABOR FORCE [ PEOPLE ]
76.6%
PERCENT IN LABOR FORCE
1.5%
UNEMPLOYMENT RATE
Greenwood Zip Codes
Greenwood Area Codes
Income in Greenwood
Income Overview in Greenwood
Per Capita Income in Greenwood is $43,074, while median incomes of families and households are $112,500 and $103,560 respectively.
| Characteristic | Number | Measure |
| Per Capita Income | 6,038 | $43,074 |
| Median Family Income | 1,952 | $112,500 |
| Mean Family Income | 1,952 | $121,948 |
| Median Household Income | 2,191 | $103,560 |
| Mean Household Income | 2,191 | $118,499 |
| Income Deficit | 1,952 | $0 |
| Wage / Income Gap (%) | 6,038 | 15.88% |
| Wage / Income Gap ($) | 6,038 | 84.12¢ per $1 |
| Gini / Inequality Index | 6,038 | 0.29 |
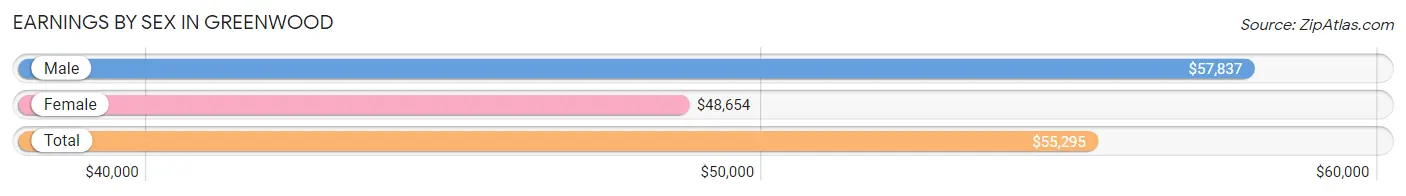
Earnings by Sex in Greenwood
Average Earnings in Greenwood are $55,295, $57,837 for men and $48,654 for women, a difference of 15.9%.
| Sex | Number | Average Earnings |
| Male | 2,177 (55.0%) | $57,837 |
| Female | 1,784 (45.0%) | $48,654 |
| Total | 3,961 (100.0%) | $55,295 |
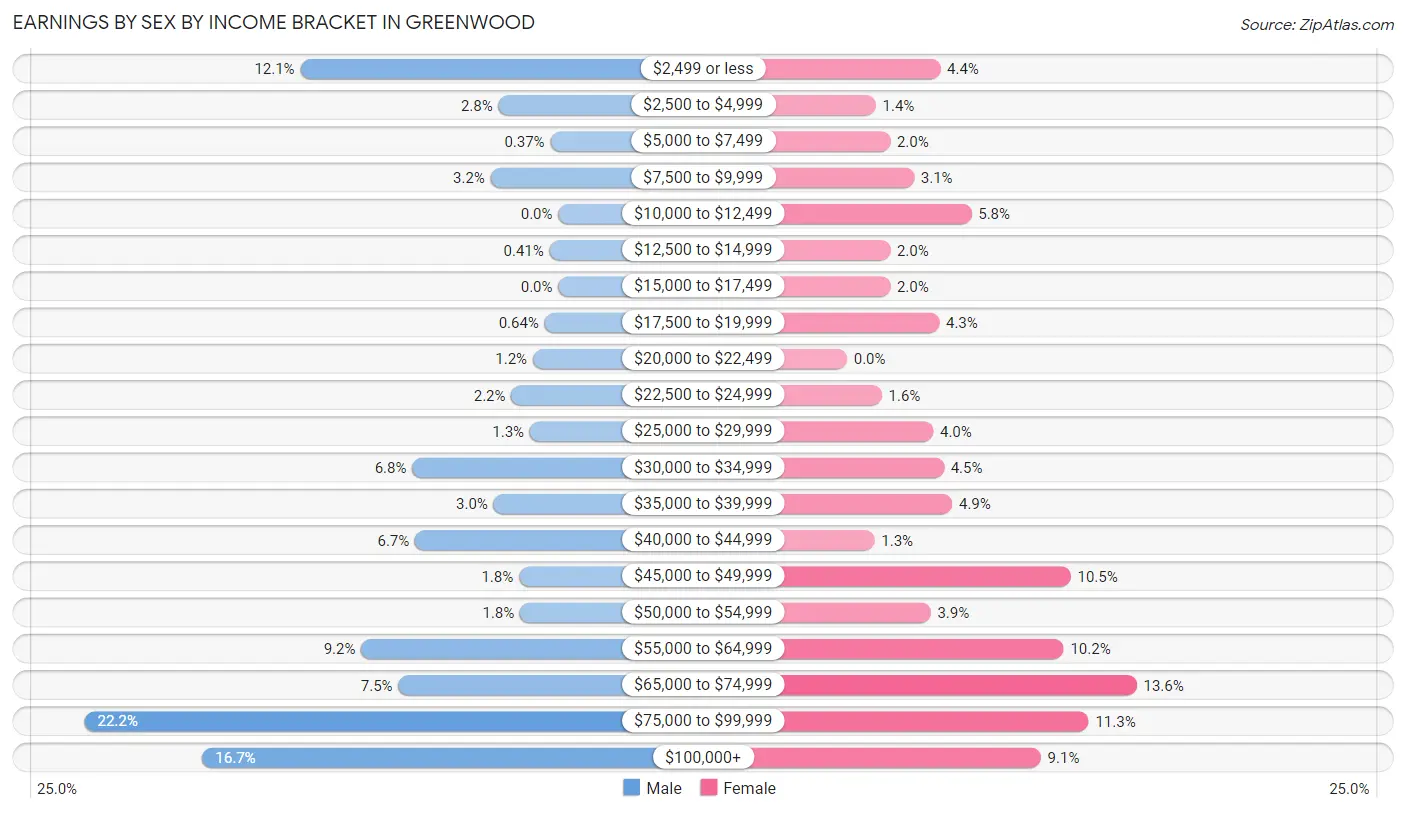
Earnings by Sex by Income Bracket in Greenwood
The most common earnings brackets in Greenwood are $75,000 to $99,999 for men (483 | 22.2%) and $65,000 to $74,999 for women (242 | 13.6%).
| Income | Male | Female |
| $2,499 or less | 263 (12.1%) | 78 (4.4%) |
| $2,500 to $4,999 | 61 (2.8%) | 24 (1.3%) |
| $5,000 to $7,499 | 8 (0.4%) | 36 (2.0%) |
| $7,500 to $9,999 | 69 (3.2%) | 56 (3.1%) |
| $10,000 to $12,499 | 0 (0.0%) | 104 (5.8%) |
| $12,500 to $14,999 | 9 (0.4%) | 36 (2.0%) |
| $15,000 to $17,499 | 0 (0.0%) | 36 (2.0%) |
| $17,500 to $19,999 | 14 (0.6%) | 77 (4.3%) |
| $20,000 to $22,499 | 26 (1.2%) | 0 (0.0%) |
| $22,500 to $24,999 | 48 (2.2%) | 29 (1.6%) |
| $25,000 to $29,999 | 29 (1.3%) | 72 (4.0%) |
| $30,000 to $34,999 | 149 (6.8%) | 81 (4.5%) |
| $35,000 to $39,999 | 66 (3.0%) | 88 (4.9%) |
| $40,000 to $44,999 | 146 (6.7%) | 23 (1.3%) |
| $45,000 to $49,999 | 40 (1.8%) | 187 (10.5%) |
| $50,000 to $54,999 | 39 (1.8%) | 70 (3.9%) |
| $55,000 to $64,999 | 201 (9.2%) | 181 (10.2%) |
| $65,000 to $74,999 | 163 (7.5%) | 242 (13.6%) |
| $75,000 to $99,999 | 483 (22.2%) | 202 (11.3%) |
| $100,000+ | 363 (16.7%) | 162 (9.1%) |
| Total | 2,177 (100.0%) | 1,784 (100.0%) |
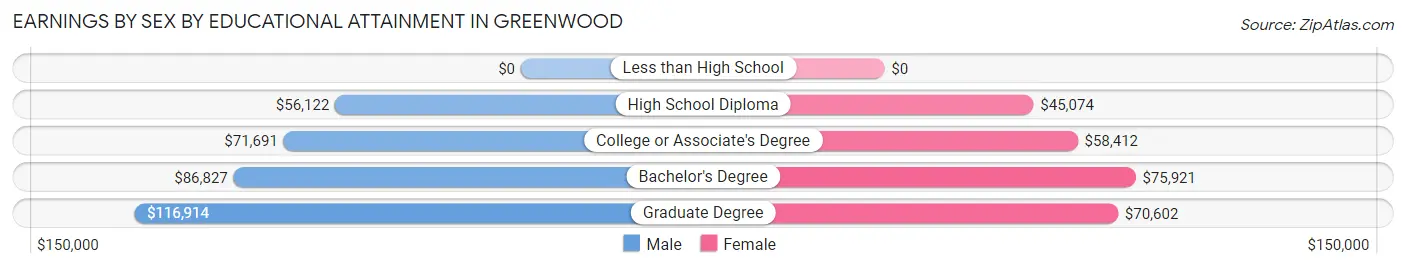
Earnings by Sex by Educational Attainment in Greenwood
Average earnings in Greenwood are $70,772 for men and $53,385 for women, a difference of 24.6%. Men with an educational attainment of graduate degree enjoy the highest average annual earnings of $116,914, while those with high school diploma education earn the least with $56,122. Women with an educational attainment of bachelor's degree earn the most with the average annual earnings of $75,921, while those with high school diploma education have the smallest earnings of $45,074.
| Educational Attainment | Male Income | Female Income |
| Less than High School | - | - |
| High School Diploma | $56,122 | $45,074 |
| College or Associate's Degree | $71,691 | $58,412 |
| Bachelor's Degree | $86,827 | $75,921 |
| Graduate Degree | $116,914 | $70,602 |
| Total | $70,772 | $53,385 |
Family Income in Greenwood
Family Income Brackets in Greenwood
According to the Greenwood family income data, there are 591 families falling into the $100,000 to $149,999 income range, which is the most common income bracket and makes up 30.3% of all families.
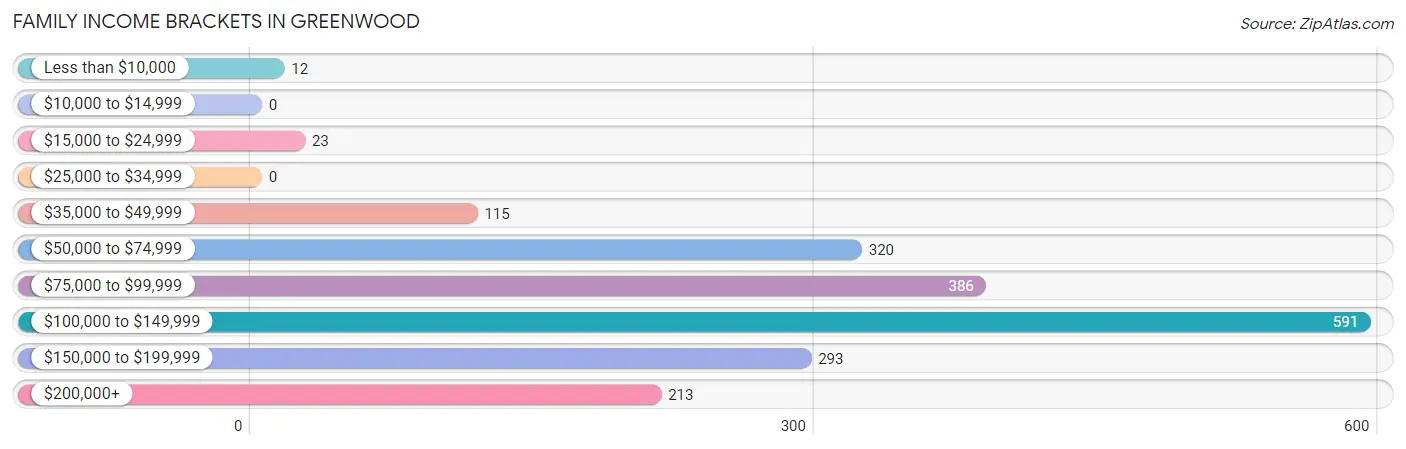
| Income Bracket | # Families | % Families |
| Less than $10,000 | 12 | 0.6% |
| $10,000 to $14,999 | 0 | 0.0% |
| $15,000 to $24,999 | 23 | 1.2% |
| $25,000 to $34,999 | 0 | 0.0% |
| $35,000 to $49,999 | 115 | 5.9% |
| $50,000 to $74,999 | 320 | 16.4% |
| $75,000 to $99,999 | 386 | 19.8% |
| $100,000 to $149,999 | 591 | 30.3% |
| $150,000 to $199,999 | 293 | 15.0% |
| $200,000+ | 213 | 10.9% |
Family Income by Famaliy Size in Greenwood
5-person families (190 | 9.7%) account for the highest median family income in Greenwood with $212,596 per family, while 2-person families (1,121 | 57.4%) have the highest median income of $45,977 per family member.
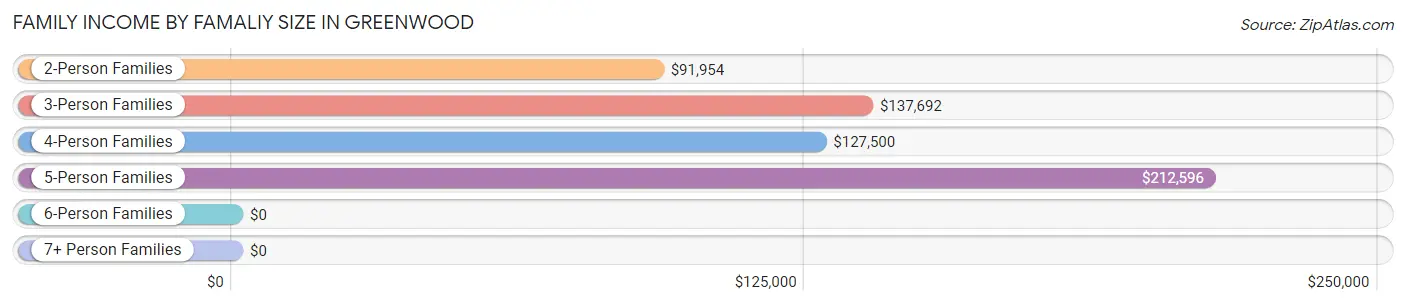
| Income Bracket | # Families | Median Income |
| 2-Person Families | 1,121 (57.4%) | $91,954 |
| 3-Person Families | 418 (21.4%) | $137,692 |
| 4-Person Families | 184 (9.4%) | $127,500 |
| 5-Person Families | 190 (9.7%) | $212,596 |
| 6-Person Families | 25 (1.3%) | $0 |
| 7+ Person Families | 14 (0.7%) | $0 |
| Total | 1,952 (100.0%) | $112,500 |
Family Income by Number of Earners in Greenwood
The median family income in Greenwood is $112,500, with families comprising 3+ earners (314) having the highest median family income of $147,027, while families with no earners (179) have the lowest median family income of $64,861, accounting for 16.1% and 9.2% of families, respectively.
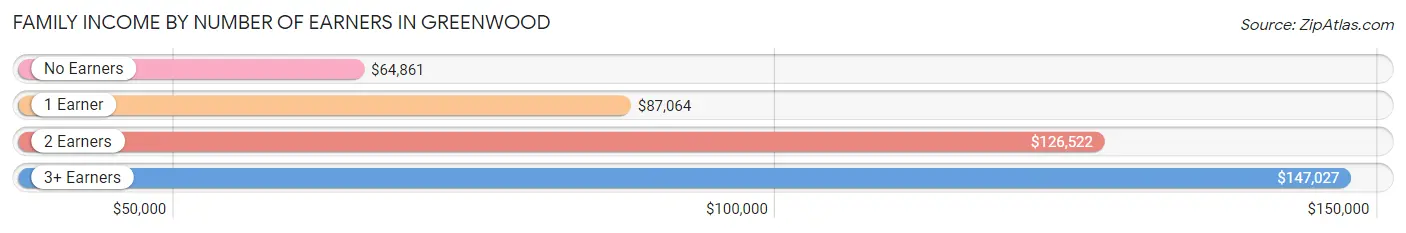
| Number of Earners | # Families | Median Income |
| No Earners | 179 (9.2%) | $64,861 |
| 1 Earner | 445 (22.8%) | $87,064 |
| 2 Earners | 1,014 (51.9%) | $126,522 |
| 3+ Earners | 314 (16.1%) | $147,027 |
| Total | 1,952 (100.0%) | $112,500 |
Household Income in Greenwood
Household Income Brackets in Greenwood
With 631 households falling in the category, the $100,000 to $149,999 income range is the most frequent in Greenwood, accounting for 28.8% of all households.
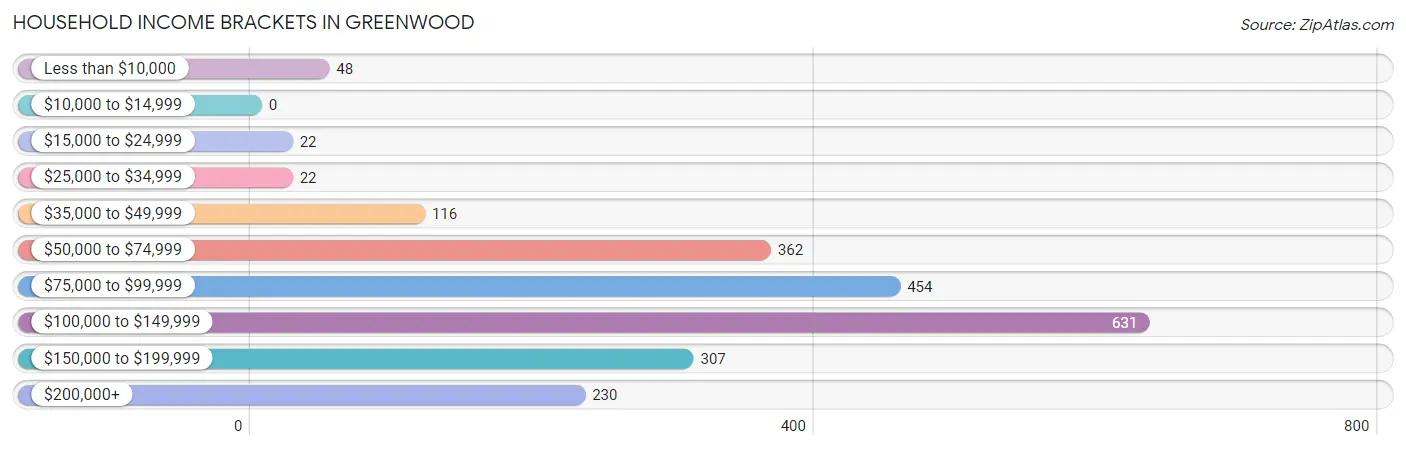
| Income Bracket | # Households | % Households |
| Less than $10,000 | 48 | 2.2% |
| $10,000 to $14,999 | 0 | 0.0% |
| $15,000 to $24,999 | 22 | 1.0% |
| $25,000 to $34,999 | 22 | 1.0% |
| $35,000 to $49,999 | 116 | 5.3% |
| $50,000 to $74,999 | 362 | 16.5% |
| $75,000 to $99,999 | 454 | 20.7% |
| $100,000 to $149,999 | 631 | 28.8% |
| $150,000 to $199,999 | 307 | 14.0% |
| $200,000+ | 230 | 10.5% |
Household Income by Householder Age in Greenwood
The median household income in Greenwood is $103,560, with the highest median household income of $113,538 found in the 25 to 44 years age bracket for the primary householder. A total of 888 households (40.5%) fall into this category. Meanwhile, the 15 to 24 years age bracket for the primary householder has the lowest median household income of $0, with 24 households (1.1%) in this group.
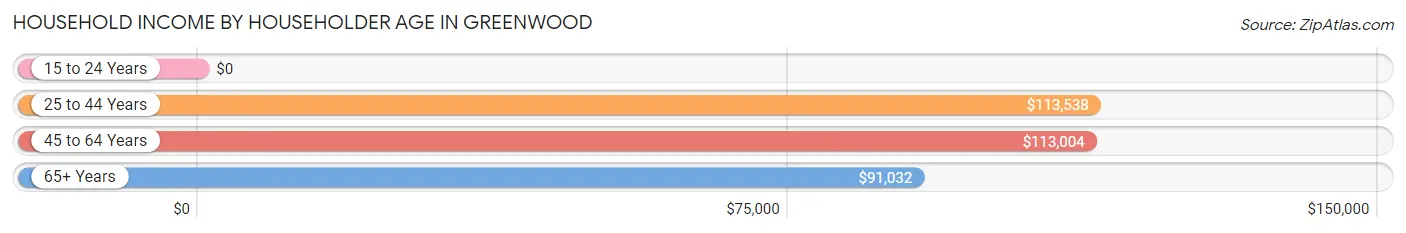
| Income Bracket | # Households | Median Income |
| 15 to 24 Years | 24 (1.1%) | $0 |
| 25 to 44 Years | 888 (40.5%) | $113,538 |
| 45 to 64 Years | 907 (41.4%) | $113,004 |
| 65+ Years | 372 (17.0%) | $91,032 |
| Total | 2,191 (100.0%) | $103,560 |
Poverty in Greenwood
Income Below Poverty by Sex and Age in Greenwood
With 2.9% poverty level for males and 4.1% for females among the residents of Greenwood, 35 to 44 year old males and 35 to 44 year old females are the most vulnerable to poverty, with 59 males (12.9%) and 86 females (16.7%) in their respective age groups living below the poverty level.
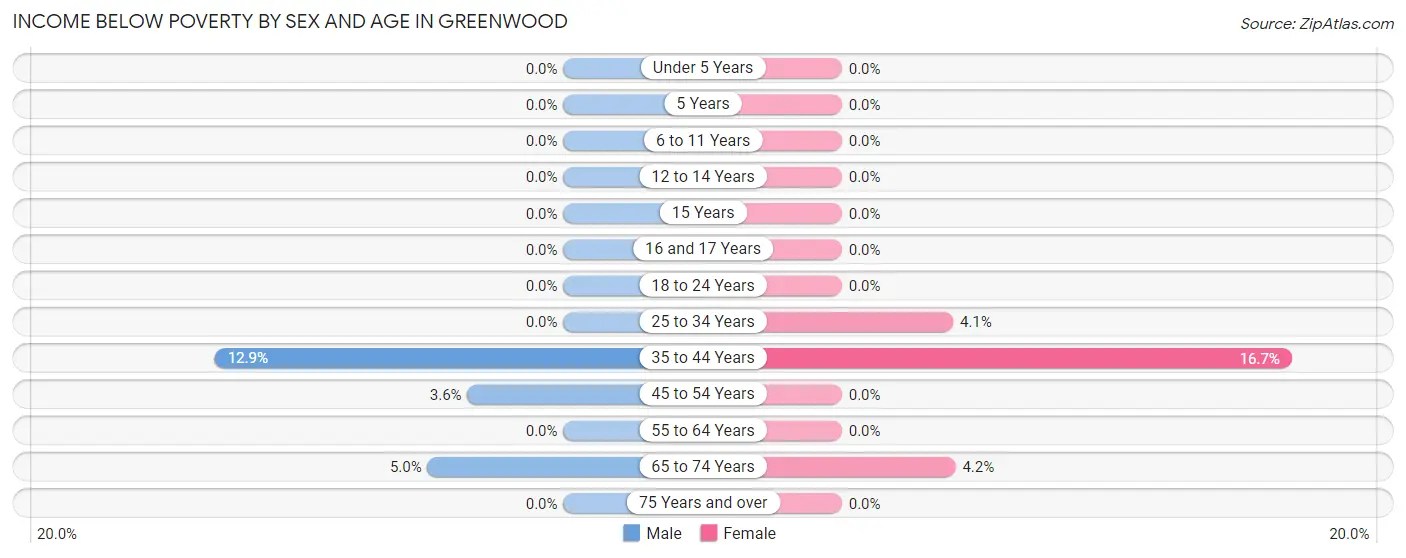
| Age Bracket | Male | Female |
| Under 5 Years | 0 (0.0%) | 0 (0.0%) |
| 5 Years | 0 (0.0%) | 0 (0.0%) |
| 6 to 11 Years | 0 (0.0%) | 0 (0.0%) |
| 12 to 14 Years | 0 (0.0%) | 0 (0.0%) |
| 15 Years | 0 (0.0%) | 0 (0.0%) |
| 16 and 17 Years | 0 (0.0%) | 0 (0.0%) |
| 18 to 24 Years | 0 (0.0%) | 0 (0.0%) |
| 25 to 34 Years | 0 (0.0%) | 17 (4.1%) |
| 35 to 44 Years | 59 (12.9%) | 86 (16.7%) |
| 45 to 54 Years | 20 (3.6%) | 0 (0.0%) |
| 55 to 64 Years | 0 (0.0%) | 0 (0.0%) |
| 65 to 74 Years | 13 (5.0%) | 14 (4.2%) |
| 75 Years and over | 0 (0.0%) | 0 (0.0%) |
| Total | 92 (2.9%) | 117 (4.1%) |
Income Above Poverty by Sex and Age in Greenwood
According to the poverty statistics in Greenwood, males aged under 5 years and females aged under 5 years are the age groups that are most secure financially, with 100.0% of males and 100.0% of females in these age groups living above the poverty line.
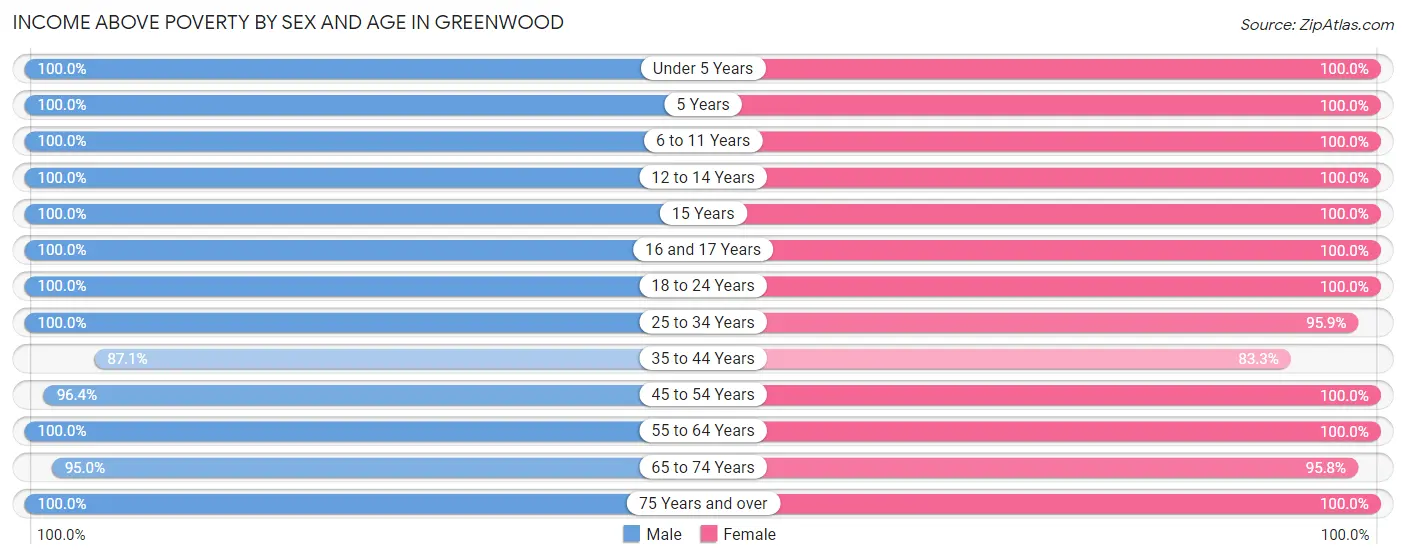
| Age Bracket | Male | Female |
| Under 5 Years | 285 (100.0%) | 105 (100.0%) |
| 5 Years | 21 (100.0%) | 69 (100.0%) |
| 6 to 11 Years | 214 (100.0%) | 237 (100.0%) |
| 12 to 14 Years | 128 (100.0%) | 77 (100.0%) |
| 15 Years | 59 (100.0%) | 8 (100.0%) |
| 16 and 17 Years | 137 (100.0%) | 84 (100.0%) |
| 18 to 24 Years | 206 (100.0%) | 196 (100.0%) |
| 25 to 34 Years | 421 (100.0%) | 395 (95.9%) |
| 35 to 44 Years | 397 (87.1%) | 429 (83.3%) |
| 45 to 54 Years | 542 (96.4%) | 662 (100.0%) |
| 55 to 64 Years | 326 (100.0%) | 142 (100.0%) |
| 65 to 74 Years | 245 (95.0%) | 318 (95.8%) |
| 75 Years and over | 84 (100.0%) | 42 (100.0%) |
| Total | 3,065 (97.1%) | 2,764 (95.9%) |
Income Below Poverty Among Married-Couple Families in Greenwood
The poverty statistics for married-couple families in Greenwood show that 0.7% or 11 of the total 1,525 families live below the poverty line. Families with no children have the highest poverty rate of 1.1%, comprising of 11 families. On the other hand, families with 1 or 2 children have the lowest poverty rate of 0.0%, which includes 0 families.
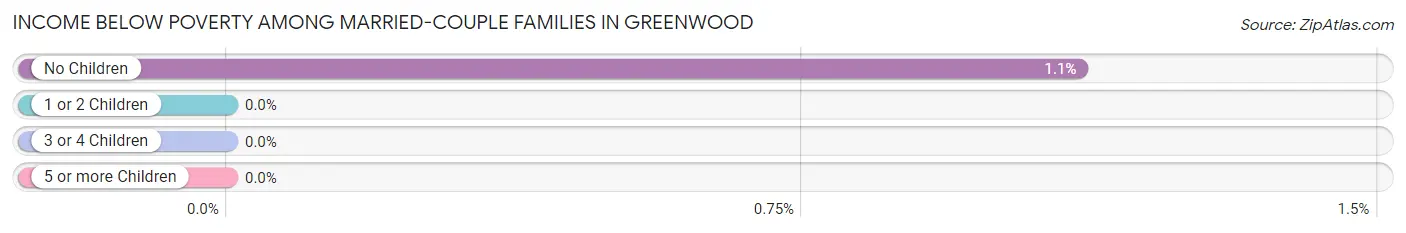
| Children | Above Poverty | Below Poverty |
| No Children | 978 (98.9%) | 11 (1.1%) |
| 1 or 2 Children | 371 (100.0%) | 0 (0.0%) |
| 3 or 4 Children | 165 (100.0%) | 0 (0.0%) |
| 5 or more Children | 0 (0.0%) | 0 (0.0%) |
| Total | 1,514 (99.3%) | 11 (0.7%) |
Income Below Poverty Among Single-Parent Households in Greenwood
| Children | Single Father | Single Mother |
| No Children | 0 (0.0%) | 0 (0.0%) |
| 1 or 2 Children | 0 (0.0%) | 0 (0.0%) |
| 3 or 4 Children | 0 (0.0%) | 0 (0.0%) |
| 5 or more Children | 0 (0.0%) | 0 (0.0%) |
| Total | 0 (0.0%) | 0 (0.0%) |
Income Below Poverty Among Married-Couple vs Single-Parent Households in Greenwood
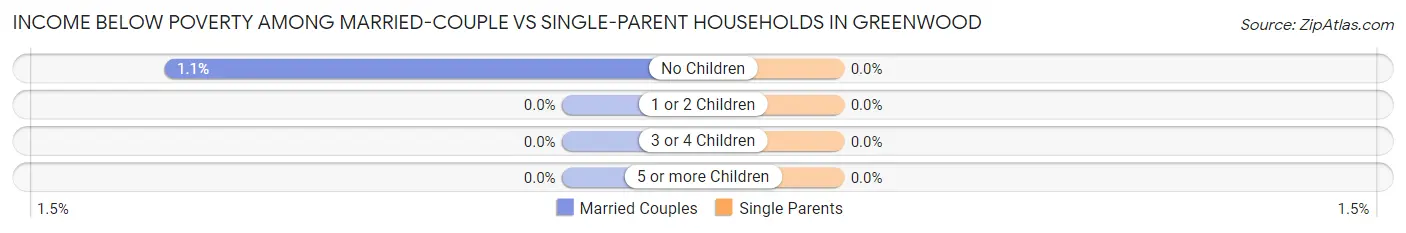
| Children | Married-Couple Families | Single-Parent Households |
| No Children | 11 (1.1%) | 0 (0.0%) |
| 1 or 2 Children | 0 (0.0%) | 0 (0.0%) |
| 3 or 4 Children | 0 (0.0%) | 0 (0.0%) |
| 5 or more Children | 0 (0.0%) | 0 (0.0%) |
| Total | 11 (0.7%) | 0 (0.0%) |
Race in Greenwood
The most populous races in Greenwood are White / Caucasian (5,254 | 87.0%), Two or more Races (395 | 6.5%), and Hispanic or Latino (261 | 4.3%).
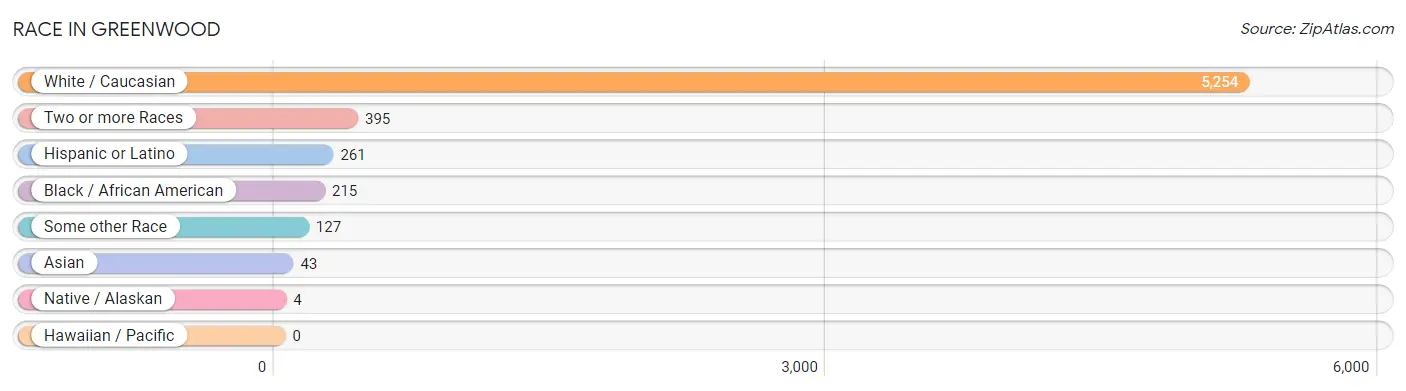
| Race | # Population | % Population |
| Asian | 43 | 0.7% |
| Black / African American | 215 | 3.6% |
| Hawaiian / Pacific | 0 | 0.0% |
| Hispanic or Latino | 261 | 4.3% |
| Native / Alaskan | 4 | 0.1% |
| White / Caucasian | 5,254 | 87.0% |
| Two or more Races | 395 | 6.5% |
| Some other Race | 127 | 2.1% |
| Total | 6,038 | 100.0% |
Ancestry in Greenwood
The most populous ancestries reported in Greenwood are German (1,414 | 23.4%), Irish (711 | 11.8%), English (579 | 9.6%), American (495 | 8.2%), and European (353 | 5.9%), together accounting for 58.8% of all Greenwood residents.
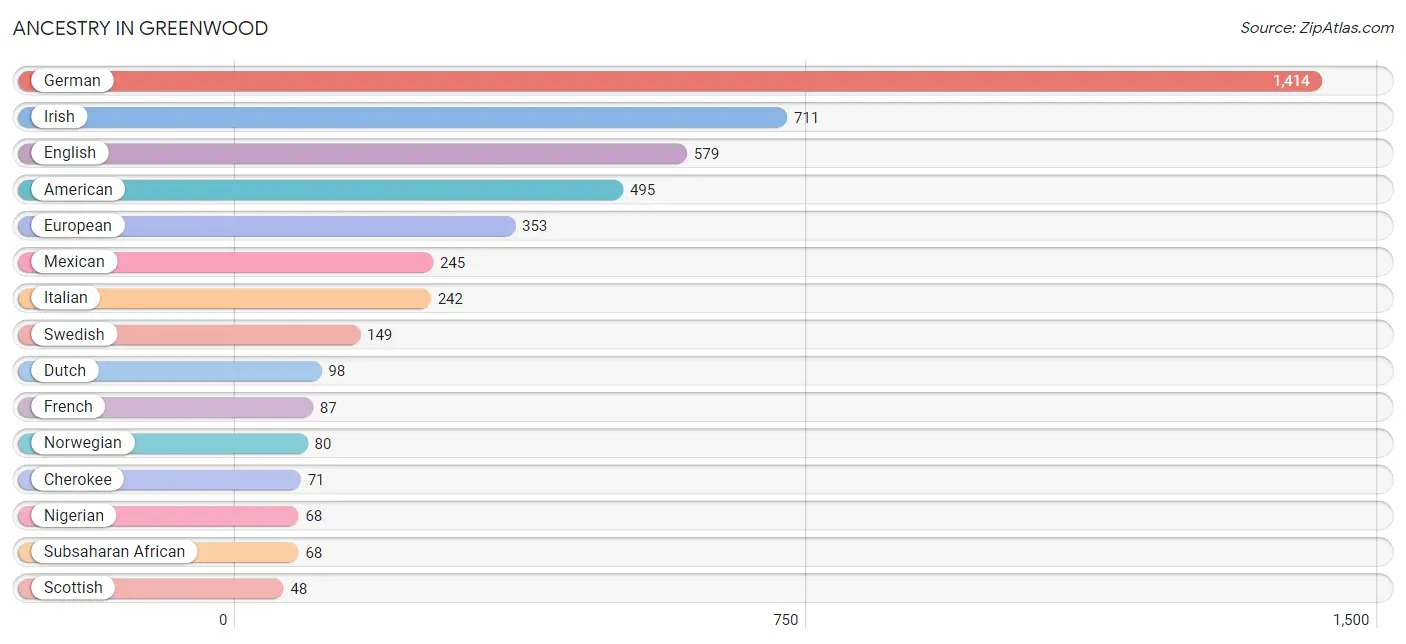
| Ancestry | # Population | % Population |
| American | 495 | 8.2% |
| Arab | 38 | 0.6% |
| Argentinean | 8 | 0.1% |
| Austrian | 15 | 0.3% |
| Belgian | 33 | 0.5% |
| British | 16 | 0.3% |
| Burmese | 23 | 0.4% |
| Central American | 8 | 0.1% |
| Cherokee | 71 | 1.2% |
| Czech | 16 | 0.3% |
| Czechoslovakian | 22 | 0.4% |
| Dutch | 98 | 1.6% |
| English | 579 | 9.6% |
| European | 353 | 5.9% |
| Finnish | 7 | 0.1% |
| French | 87 | 1.4% |
| French Canadian | 32 | 0.5% |
| German | 1,414 | 23.4% |
| Indian (Asian) | 15 | 0.3% |
| Irish | 711 | 11.8% |
| Italian | 242 | 4.0% |
| Lebanese | 38 | 0.6% |
| Luxembourger | 17 | 0.3% |
| Mexican | 245 | 4.1% |
| Nigerian | 68 | 1.1% |
| Northern European | 23 | 0.4% |
| Norwegian | 80 | 1.3% |
| Salvadoran | 8 | 0.1% |
| Scotch-Irish | 36 | 0.6% |
| Scottish | 48 | 0.8% |
| Sioux | 30 | 0.5% |
| South American | 8 | 0.1% |
| Sri Lankan | 5 | 0.1% |
| Subsaharan African | 68 | 1.1% |
| Swedish | 149 | 2.5% |
| Welsh | 8 | 0.1% | View All 36 Rows |
Immigrants in Greenwood
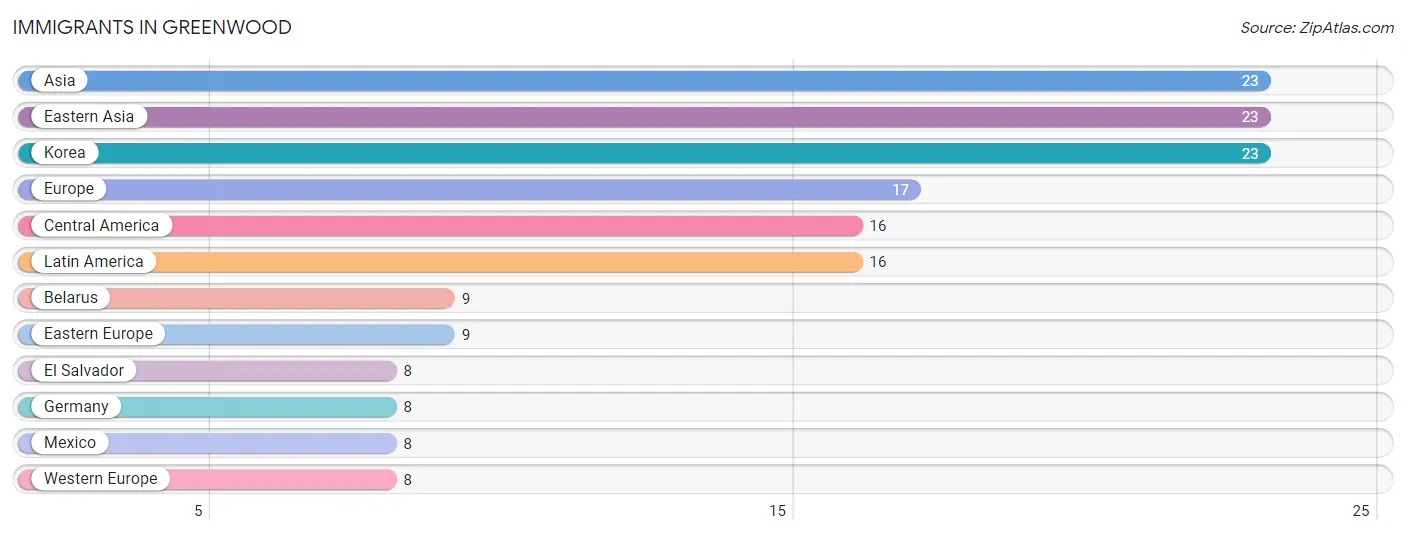
The most numerous immigrant groups reported in Greenwood came from Asia (23 | 0.4%), Eastern Asia (23 | 0.4%), Korea (23 | 0.4%), Europe (17 | 0.3%), and Central America (16 | 0.3%), together accounting for 1.7% of all Greenwood residents.
| Immigration Origin | # Population | % Population |
| Asia | 23 | 0.4% |
| Belarus | 9 | 0.2% |
| Central America | 16 | 0.3% |
| Eastern Asia | 23 | 0.4% |
| Eastern Europe | 9 | 0.2% |
| El Salvador | 8 | 0.1% |
| Europe | 17 | 0.3% |
| Germany | 8 | 0.1% |
| Korea | 23 | 0.4% |
| Latin America | 16 | 0.3% |
| Mexico | 8 | 0.1% |
| Western Europe | 8 | 0.1% | View All 12 Rows |
Sex and Age in Greenwood
Sex and Age in Greenwood
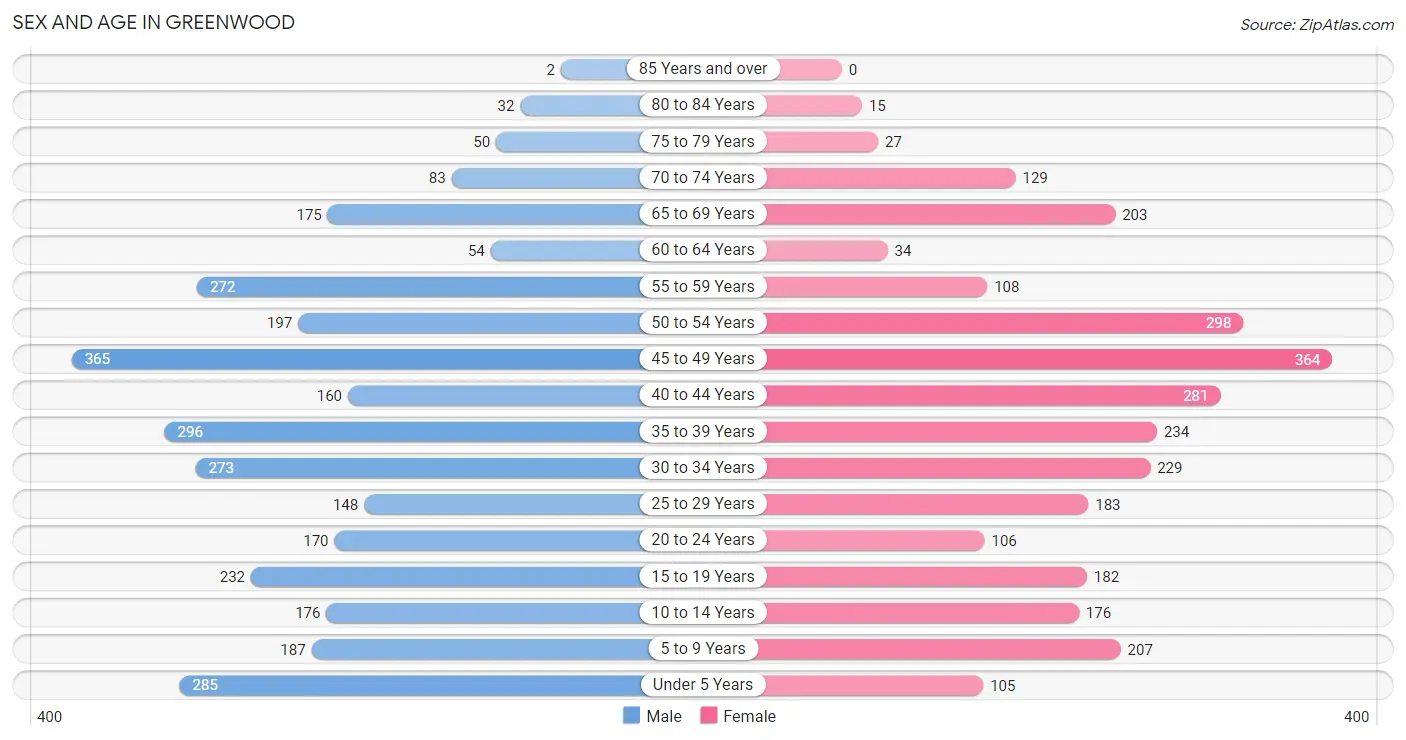
The most populous age groups in Greenwood are 45 to 49 Years (365 | 11.6%) for men and 45 to 49 Years (364 | 12.6%) for women.
| Age Bracket | Male | Female |
| Under 5 Years | 285 (9.0%) | 105 (3.6%) |
| 5 to 9 Years | 187 (5.9%) | 207 (7.2%) |
| 10 to 14 Years | 176 (5.6%) | 176 (6.1%) |
| 15 to 19 Years | 232 (7.3%) | 182 (6.3%) |
| 20 to 24 Years | 170 (5.4%) | 106 (3.7%) |
| 25 to 29 Years | 148 (4.7%) | 183 (6.4%) |
| 30 to 34 Years | 273 (8.6%) | 229 (8.0%) |
| 35 to 39 Years | 296 (9.4%) | 234 (8.1%) |
| 40 to 44 Years | 160 (5.1%) | 281 (9.8%) |
| 45 to 49 Years | 365 (11.6%) | 364 (12.6%) |
| 50 to 54 Years | 197 (6.2%) | 298 (10.3%) |
| 55 to 59 Years | 272 (8.6%) | 108 (3.7%) |
| 60 to 64 Years | 54 (1.7%) | 34 (1.2%) |
| 65 to 69 Years | 175 (5.5%) | 203 (7.0%) |
| 70 to 74 Years | 83 (2.6%) | 129 (4.5%) |
| 75 to 79 Years | 50 (1.6%) | 27 (0.9%) |
| 80 to 84 Years | 32 (1.0%) | 15 (0.5%) |
| 85 Years and over | 2 (0.1%) | 0 (0.0%) |
| Total | 3,157 (100.0%) | 2,881 (100.0%) |
Families and Households in Greenwood
Median Family Size in Greenwood
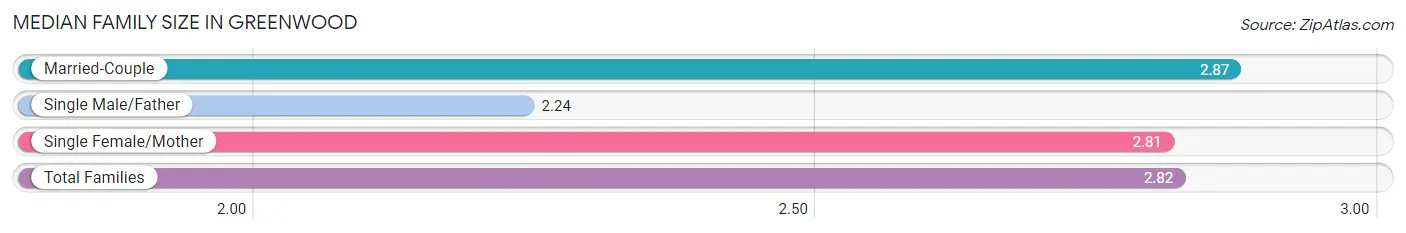
The median family size in Greenwood is 2.82 persons per family, with married-couple families (1,525 | 78.1%) accounting for the largest median family size of 2.87 persons per family. On the other hand, single male/father families (129 | 6.6%) represent the smallest median family size with 2.24 persons per family.
| Family Type | # Families | Family Size |
| Married-Couple | 1,525 (78.1%) | 2.87 |
| Single Male/Father | 129 (6.6%) | 2.24 |
| Single Female/Mother | 298 (15.3%) | 2.81 |
| Total Families | 1,952 (100.0%) | 2.82 |
Median Household Size in Greenwood
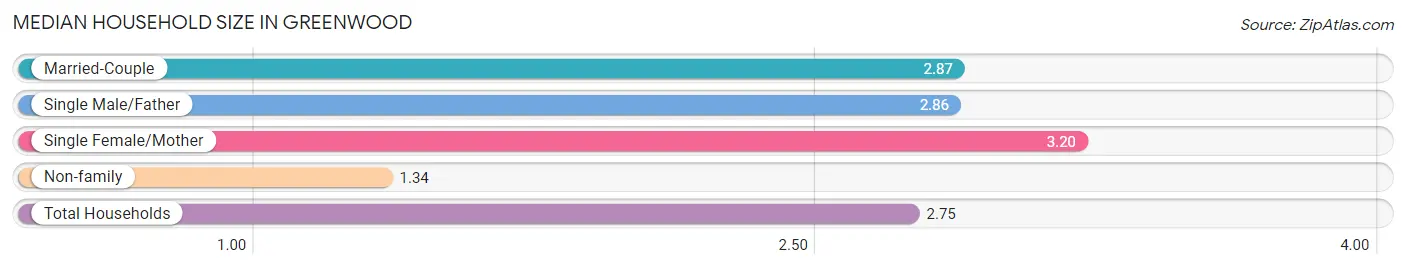
The median household size in Greenwood is 2.75 persons per household, with single female/mother households (298 | 13.6%) accounting for the largest median household size of 3.2 persons per household. non-family households (239 | 10.9%) represent the smallest median household size with 1.34 persons per household.
| Household Type | # Households | Household Size |
| Married-Couple | 1,525 (69.6%) | 2.87 |
| Single Male/Father | 129 (5.9%) | 2.86 |
| Single Female/Mother | 298 (13.6%) | 3.20 |
| Non-family | 239 (10.9%) | 1.34 |
| Total Households | 2,191 (100.0%) | 2.75 |
Household Size by Marriage Status in Greenwood
Out of a total of 2,191 households in Greenwood, 1,952 (89.1%) are family households, while 239 (10.9%) are nonfamily households. The most numerous type of family households are 2-person households, comprising 1,048, and the most common type of nonfamily households are 1-person households, comprising 158.
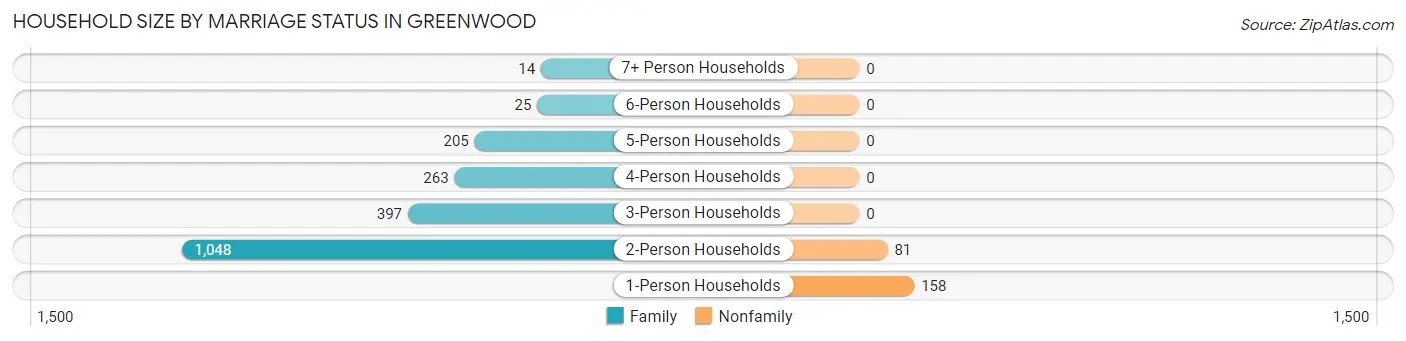
| Household Size | Family Households | Nonfamily Households |
| 1-Person Households | - | 158 (7.2%) |
| 2-Person Households | 1,048 (47.8%) | 81 (3.7%) |
| 3-Person Households | 397 (18.1%) | 0 (0.0%) |
| 4-Person Households | 263 (12.0%) | 0 (0.0%) |
| 5-Person Households | 205 (9.4%) | 0 (0.0%) |
| 6-Person Households | 25 (1.1%) | 0 (0.0%) |
| 7+ Person Households | 14 (0.6%) | 0 (0.0%) |
| Total | 1,952 (89.1%) | 239 (10.9%) |
Female Fertility in Greenwood
Fertility by Age in Greenwood
Average fertility rate in Greenwood is 38.0 births per 1,000 women. Women in the age bracket of 20 to 34 years have the highest fertility rate with 87.0 births per 1,000 women. Women in the age bracket of 20 to 34 years acount for 75.0% of all women with births.
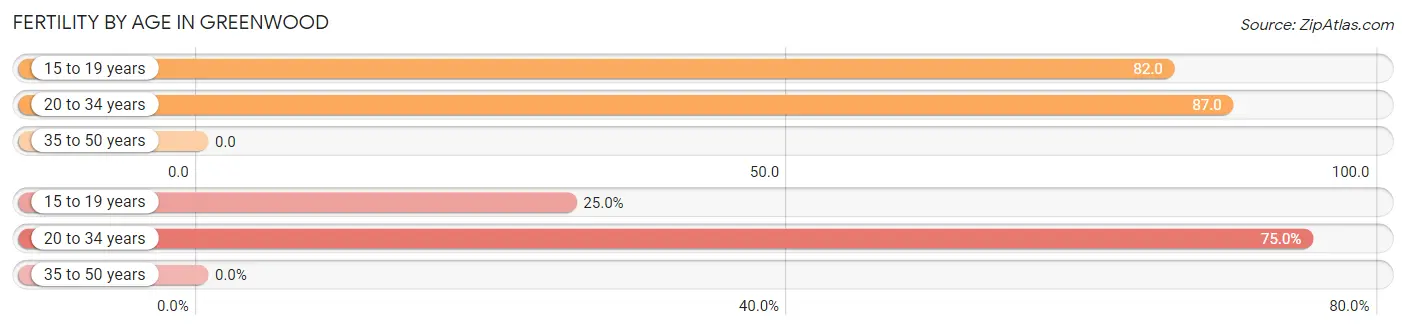
| Age Bracket | Women with Births | Births / 1,000 Women |
| 15 to 19 years | 15 (25.0%) | 82.0 |
| 20 to 34 years | 45 (75.0%) | 87.0 |
| 35 to 50 years | 0 (0.0%) | 0.0 |
| Total | 60 (100.0%) | 38.0 |
Fertility by Age by Marriage Status in Greenwood
75.0% of women with births (60) in Greenwood are married. The highest percentage of unmarried women with births falls into 15 to 19 years age bracket with 100.0% of them unmarried at the time of birth, while the lowest percentage of unmarried women with births belong to 20 to 34 years age bracket with 0.0% of them unmarried.
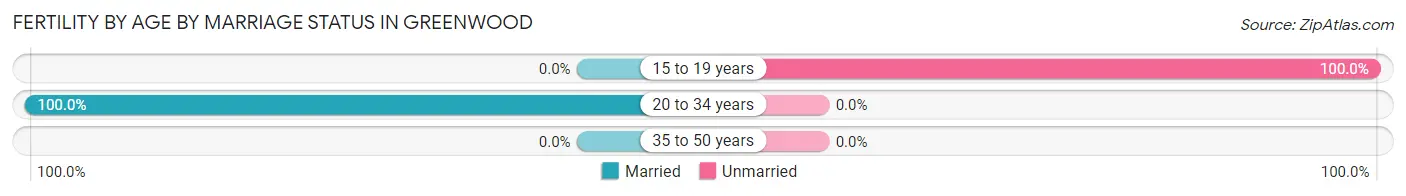
| Age Bracket | Married | Unmarried |
| 15 to 19 years | 0 (0.0%) | 15 (100.0%) |
| 20 to 34 years | 45 (100.0%) | 0 (0.0%) |
| 35 to 50 years | 0 (0.0%) | 0 (0.0%) |
| Total | 45 (75.0%) | 15 (25.0%) |
Fertility by Education in Greenwood
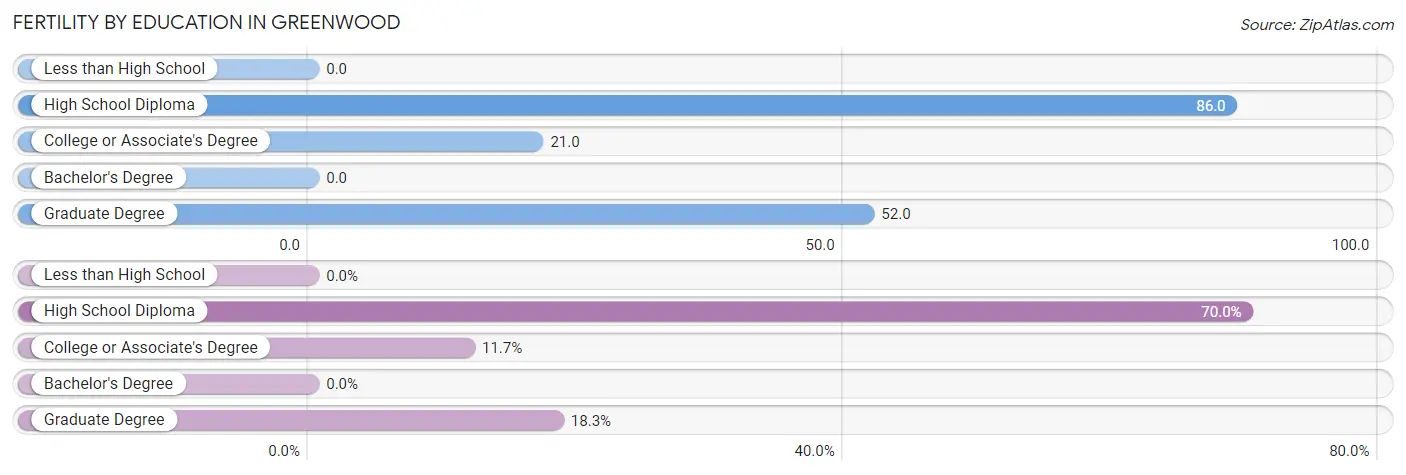
| Educational Attainment | Women with Births | Births / 1,000 Women |
| Less than High School | 0 (0.0%) | 0.0 |
| High School Diploma | 42 (70.0%) | 86.0 |
| College or Associate's Degree | 7 (11.7%) | 21.0 |
| Bachelor's Degree | 0 (0.0%) | 0.0 |
| Graduate Degree | 11 (18.3%) | 52.0 |
| Total | 60 (100.0%) | 38.0 |
Fertility by Education by Marriage Status in Greenwood
25.0% of women with births in Greenwood are unmarried. Women with the educational attainment of college or associate's degree are most likely to be married with 100.0% of them married at childbirth, while women with the educational attainment of high school diploma are least likely to be married with 35.7% of them unmarried at childbirth.
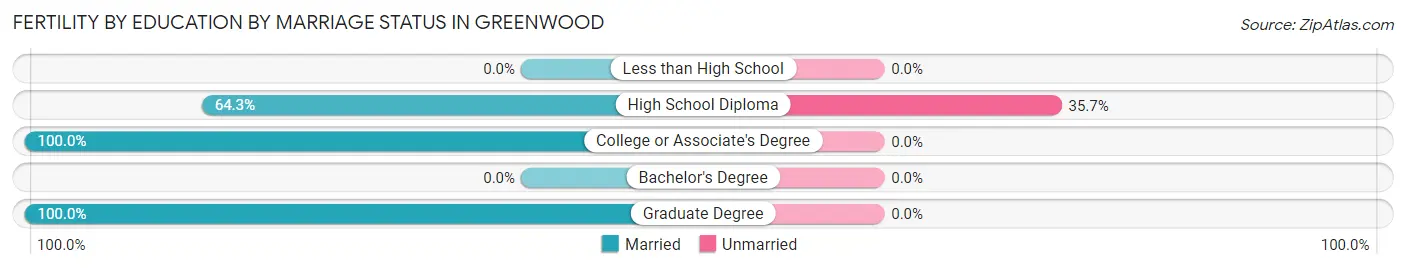
| Educational Attainment | Married | Unmarried |
| Less than High School | 0 (0.0%) | 0 (0.0%) |
| High School Diploma | 27 (64.3%) | 15 (35.7%) |
| College or Associate's Degree | 7 (100.0%) | 0 (0.0%) |
| Bachelor's Degree | 0 (0.0%) | 0 (0.0%) |
| Graduate Degree | 11 (100.0%) | 0 (0.0%) |
| Total | 45 (75.0%) | 15 (25.0%) |
Employment Characteristics in Greenwood
Employment by Class of Employer in Greenwood
Among the 3,582 employed individuals in Greenwood, private company employees (2,721 | 76.0%), local government employees (264 | 7.4%), and not-for-profit organizations (216 | 6.0%) make up the most common classes of employment.
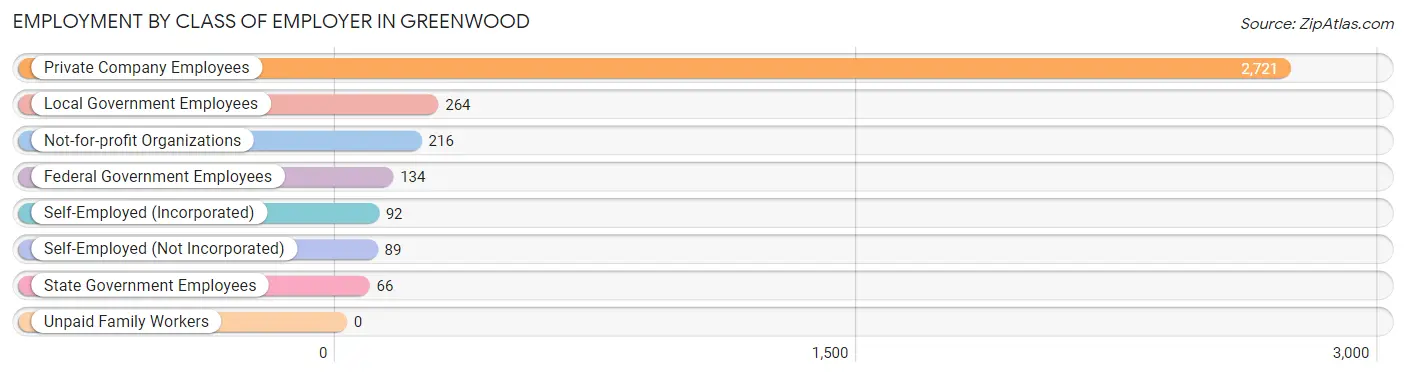
| Employer Class | # Employees | % Employees |
| Private Company Employees | 2,721 | 76.0% |
| Self-Employed (Incorporated) | 92 | 2.6% |
| Self-Employed (Not Incorporated) | 89 | 2.5% |
| Not-for-profit Organizations | 216 | 6.0% |
| Local Government Employees | 264 | 7.4% |
| State Government Employees | 66 | 1.8% |
| Federal Government Employees | 134 | 3.7% |
| Unpaid Family Workers | 0 | 0.0% |
| Total | 3,582 | 100.0% |
Employment Status by Age in Greenwood
According to the labor force statistics for Greenwood, out of the total population over 16 years of age (4,835), 76.6% or 3,704 individuals are in the labor force, with 1.5% or 56 of them unemployed. The age group with the highest labor force participation rate is 30 to 34 years, with 100.0% or 502 individuals in the labor force. Within the labor force, the 25 to 29 years age range has the highest percentage of unemployed individuals, with 15.5% or 46 of them being unemployed.
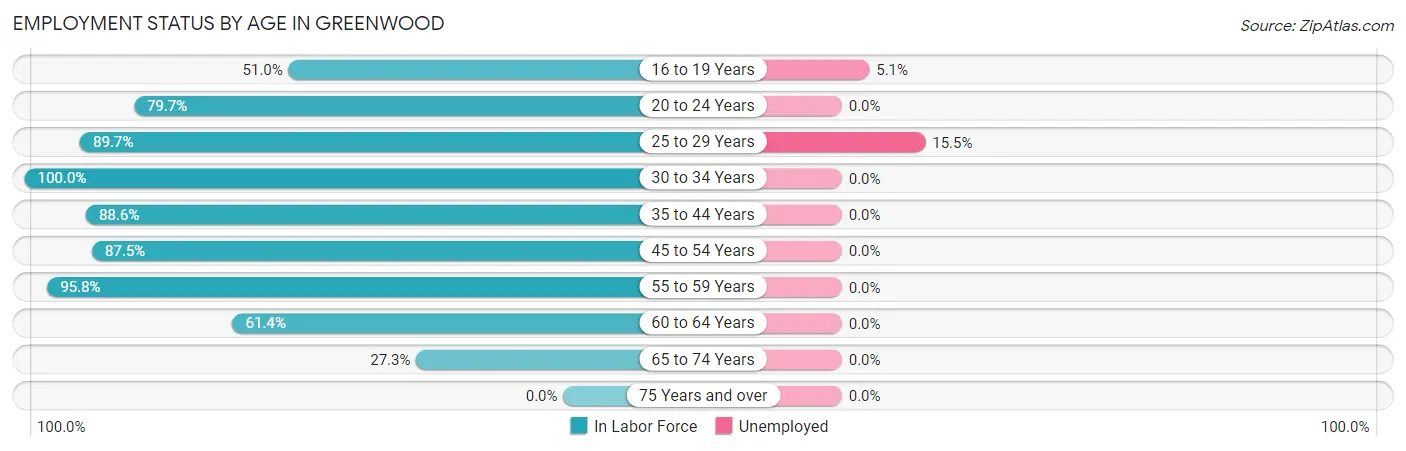
| Age Bracket | In Labor Force | Unemployed |
| 16 to 19 Years | 177 (51.0%) | 9 (5.1%) |
| 20 to 24 Years | 220 (79.7%) | 0 (0.0%) |
| 25 to 29 Years | 297 (89.7%) | 46 (15.5%) |
| 30 to 34 Years | 502 (100.0%) | 0 (0.0%) |
| 35 to 44 Years | 860 (88.6%) | 0 (0.0%) |
| 45 to 54 Years | 1,071 (87.5%) | 0 (0.0%) |
| 55 to 59 Years | 364 (95.8%) | 0 (0.0%) |
| 60 to 64 Years | 54 (61.4%) | 0 (0.0%) |
| 65 to 74 Years | 161 (27.3%) | 0 (0.0%) |
| 75 Years and over | 0 (0.0%) | 0 (0.0%) |
| Total | 3,704 (76.6%) | 56 (1.5%) |
Employment Status by Educational Attainment in Greenwood
According to labor force statistics for Greenwood, 90.0% of individuals (3,146) out of the total population between 25 and 64 years of age (3,496) are in the labor force, with 1.5% or 47 of them being unemployed. The group with the highest labor force participation rate are those with the educational attainment of bachelor's degree or higher, with 95.8% or 1,268 individuals in the labor force. Within the labor force, individuals with bachelor's degree or higher education have the highest percentage of unemployment, with 3.8% or 48 of them being unemployed.
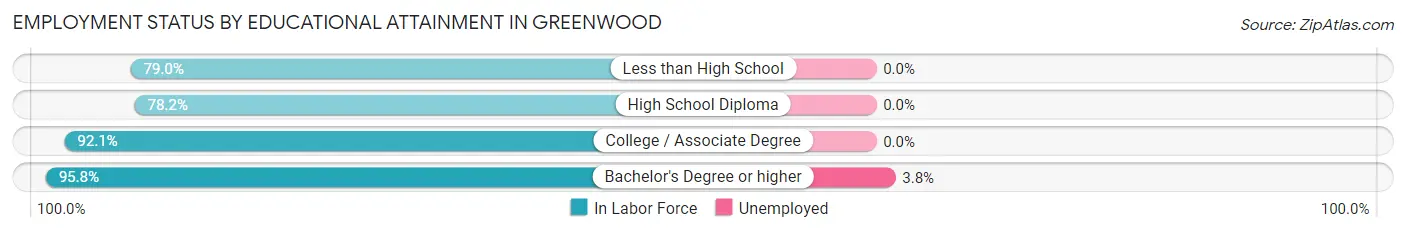
| Educational Attainment | In Labor Force | Unemployed |
| Less than High School | 113 (79.0%) | 0 (0.0%) |
| High School Diploma | 581 (78.2%) | 0 (0.0%) |
| College / Associate Degree | 1,184 (92.1%) | 0 (0.0%) |
| Bachelor's Degree or higher | 1,268 (95.8%) | 50 (3.8%) |
| Total | 3,146 (90.0%) | 52 (1.5%) |
Employment Occupations by Sex in Greenwood
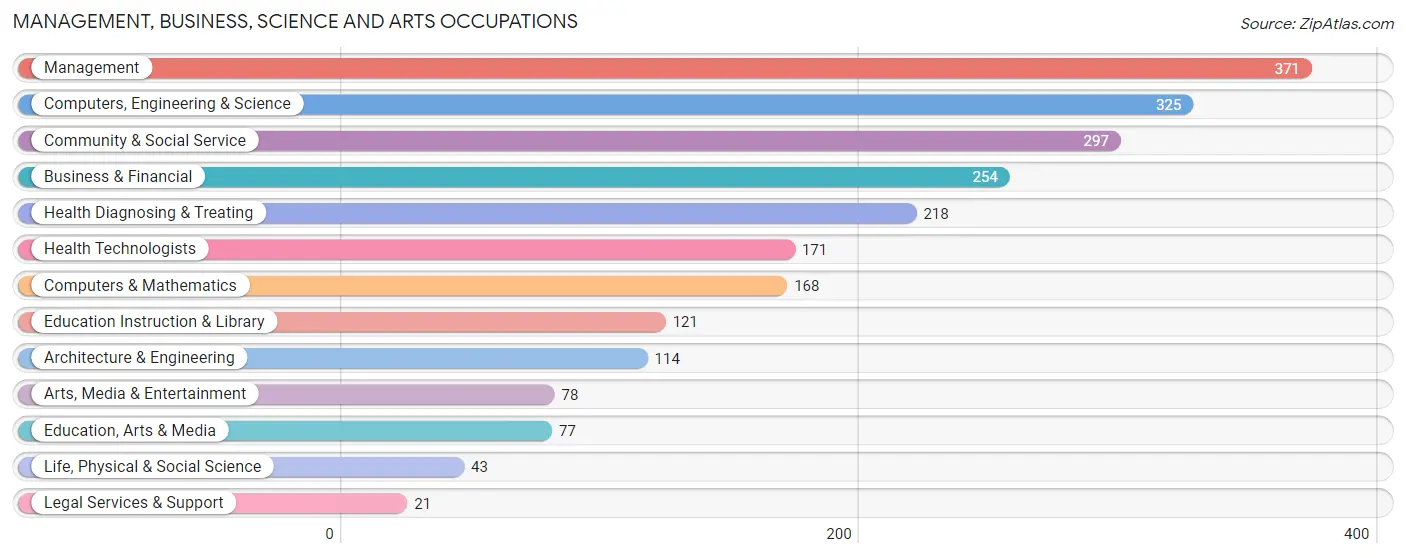
Management, Business, Science and Arts Occupations
The most common Management, Business, Science and Arts occupations in Greenwood are Management (371 | 10.3%), Computers, Engineering & Science (325 | 9.0%), Community & Social Service (297 | 8.3%), Business & Financial (254 | 7.1%), and Health Diagnosing & Treating (218 | 6.1%).
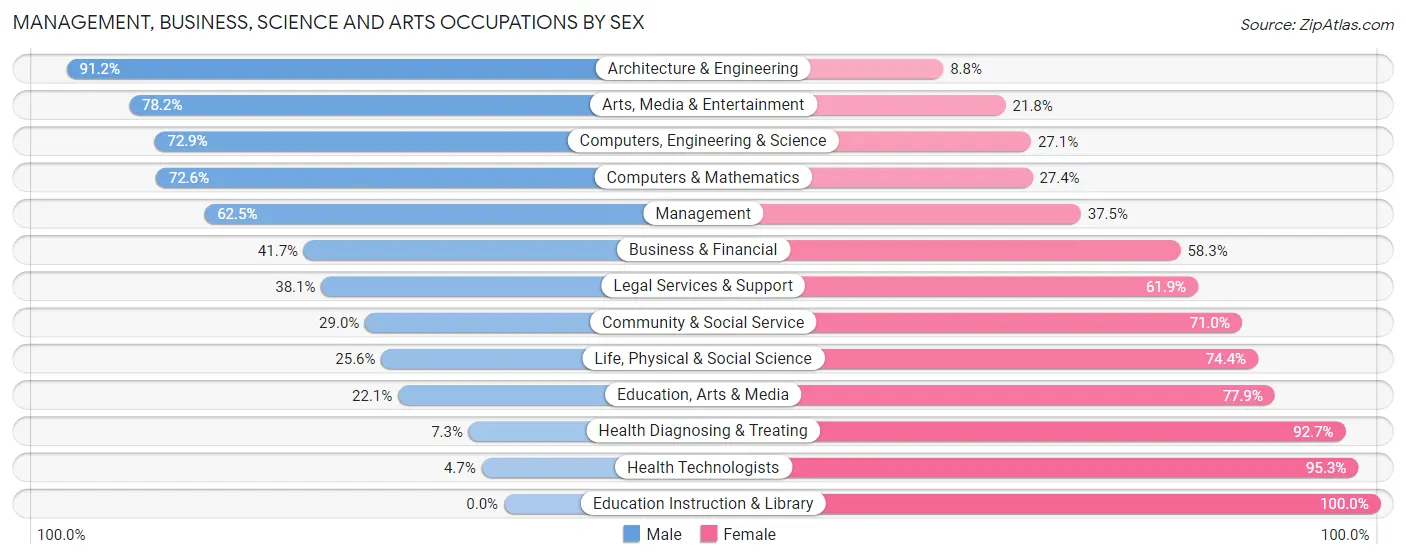
Management, Business, Science and Arts Occupations by Sex
Within the Management, Business, Science and Arts occupations in Greenwood, the most male-oriented occupations are Architecture & Engineering (91.2%), Arts, Media & Entertainment (78.2%), and Computers, Engineering & Science (72.9%), while the most female-oriented occupations are Education Instruction & Library (100.0%), Health Technologists (95.3%), and Health Diagnosing & Treating (92.7%).
| Occupation | Male | Female |
| Management | 232 (62.5%) | 139 (37.5%) |
| Business & Financial | 106 (41.7%) | 148 (58.3%) |
| Computers, Engineering & Science | 237 (72.9%) | 88 (27.1%) |
| Computers & Mathematics | 122 (72.6%) | 46 (27.4%) |
| Architecture & Engineering | 104 (91.2%) | 10 (8.8%) |
| Life, Physical & Social Science | 11 (25.6%) | 32 (74.4%) |
| Community & Social Service | 86 (29.0%) | 211 (71.0%) |
| Education, Arts & Media | 17 (22.1%) | 60 (77.9%) |
| Legal Services & Support | 8 (38.1%) | 13 (61.9%) |
| Education Instruction & Library | 0 (0.0%) | 121 (100.0%) |
| Arts, Media & Entertainment | 61 (78.2%) | 17 (21.8%) |
| Health Diagnosing & Treating | 16 (7.3%) | 202 (92.7%) |
| Health Technologists | 8 (4.7%) | 163 (95.3%) |
| Total (Category) | 677 (46.2%) | 788 (53.8%) |
| Total (Overall) | 1,982 (55.1%) | 1,616 (44.9%) |
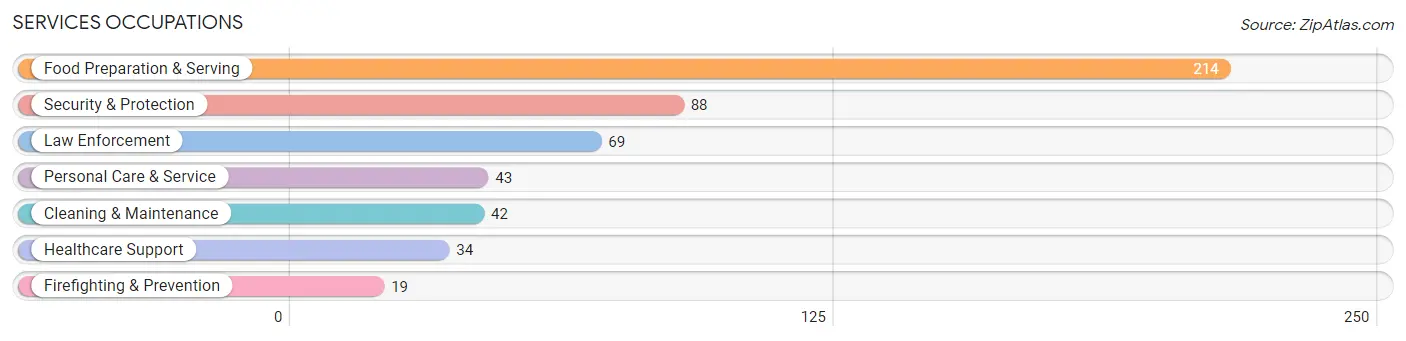
Services Occupations
The most common Services occupations in Greenwood are Food Preparation & Serving (214 | 5.9%), Security & Protection (88 | 2.5%), Law Enforcement (69 | 1.9%), Personal Care & Service (43 | 1.2%), and Cleaning & Maintenance (42 | 1.2%).
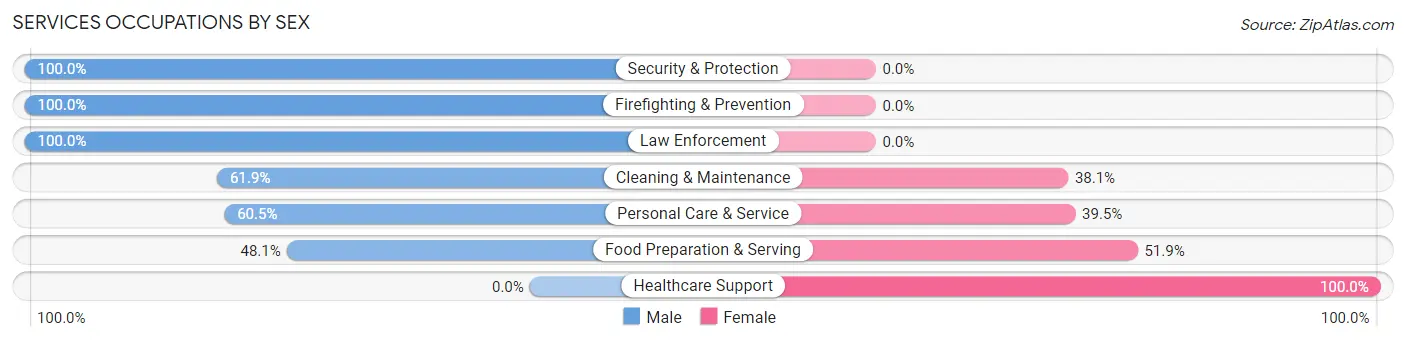
Services Occupations by Sex
Within the Services occupations in Greenwood, the most male-oriented occupations are Security & Protection (100.0%), Firefighting & Prevention (100.0%), and Law Enforcement (100.0%), while the most female-oriented occupations are Healthcare Support (100.0%), Food Preparation & Serving (51.9%), and Personal Care & Service (39.5%).
| Occupation | Male | Female |
| Healthcare Support | 0 (0.0%) | 34 (100.0%) |
| Security & Protection | 88 (100.0%) | 0 (0.0%) |
| Firefighting & Prevention | 19 (100.0%) | 0 (0.0%) |
| Law Enforcement | 69 (100.0%) | 0 (0.0%) |
| Food Preparation & Serving | 103 (48.1%) | 111 (51.9%) |
| Cleaning & Maintenance | 26 (61.9%) | 16 (38.1%) |
| Personal Care & Service | 26 (60.5%) | 17 (39.5%) |
| Total (Category) | 243 (57.7%) | 178 (42.3%) |
| Total (Overall) | 1,982 (55.1%) | 1,616 (44.9%) |
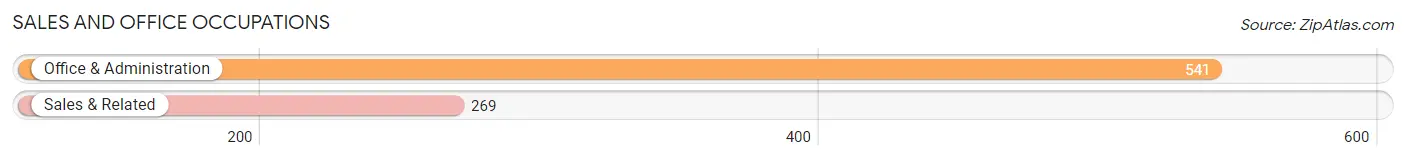
Sales and Office Occupations
The most common Sales and Office occupations in Greenwood are Office & Administration (541 | 15.0%), and Sales & Related (269 | 7.5%).
Sales and Office Occupations by Sex
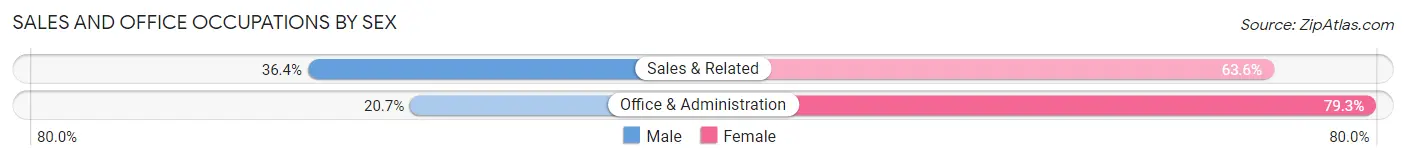
| Occupation | Male | Female |
| Sales & Related | 98 (36.4%) | 171 (63.6%) |
| Office & Administration | 112 (20.7%) | 429 (79.3%) |
| Total (Category) | 210 (25.9%) | 600 (74.1%) |
| Total (Overall) | 1,982 (55.1%) | 1,616 (44.9%) |
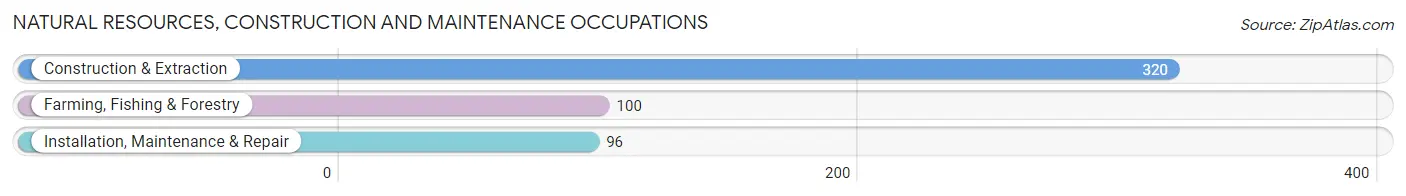
Natural Resources, Construction and Maintenance Occupations
The most common Natural Resources, Construction and Maintenance occupations in Greenwood are Construction & Extraction (320 | 8.9%), Farming, Fishing & Forestry (100 | 2.8%), and Installation, Maintenance & Repair (96 | 2.7%).
Natural Resources, Construction and Maintenance Occupations by Sex
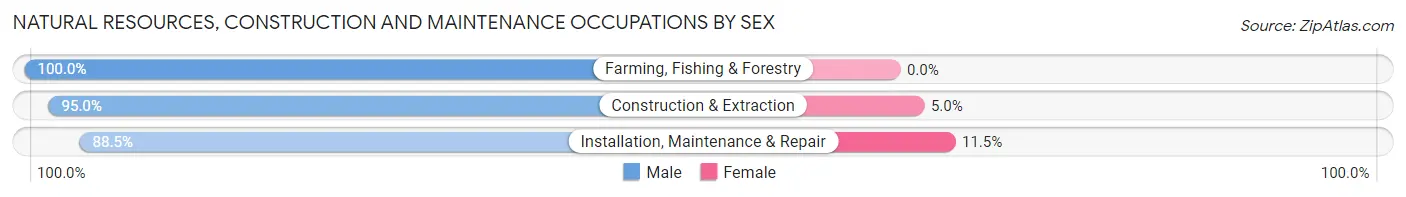
| Occupation | Male | Female |
| Farming, Fishing & Forestry | 100 (100.0%) | 0 (0.0%) |
| Construction & Extraction | 304 (95.0%) | 16 (5.0%) |
| Installation, Maintenance & Repair | 85 (88.5%) | 11 (11.5%) |
| Total (Category) | 489 (94.8%) | 27 (5.2%) |
| Total (Overall) | 1,982 (55.1%) | 1,616 (44.9%) |
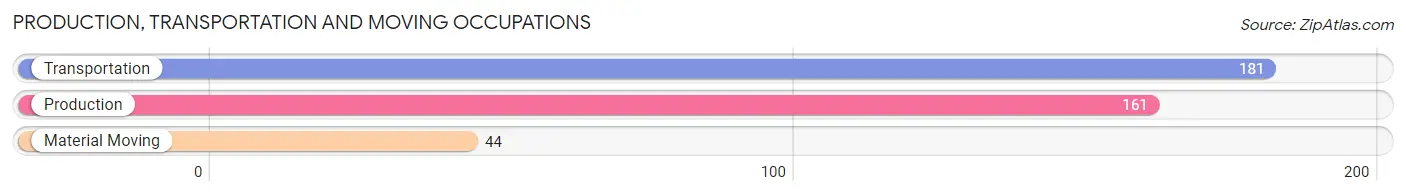
Production, Transportation and Moving Occupations
The most common Production, Transportation and Moving occupations in Greenwood are Transportation (181 | 5.0%), Production (161 | 4.5%), and Material Moving (44 | 1.2%).
Production, Transportation and Moving Occupations by Sex
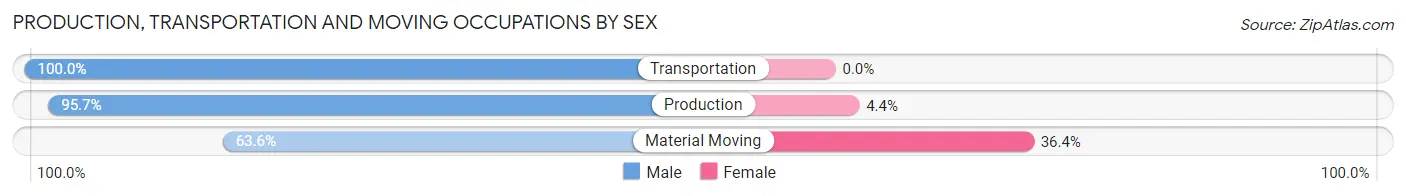
| Occupation | Male | Female |
| Production | 154 (95.7%) | 7 (4.3%) |
| Transportation | 181 (100.0%) | 0 (0.0%) |
| Material Moving | 28 (63.6%) | 16 (36.4%) |
| Total (Category) | 363 (94.0%) | 23 (6.0%) |
| Total (Overall) | 1,982 (55.1%) | 1,616 (44.9%) |
Employment Industries by Sex in Greenwood
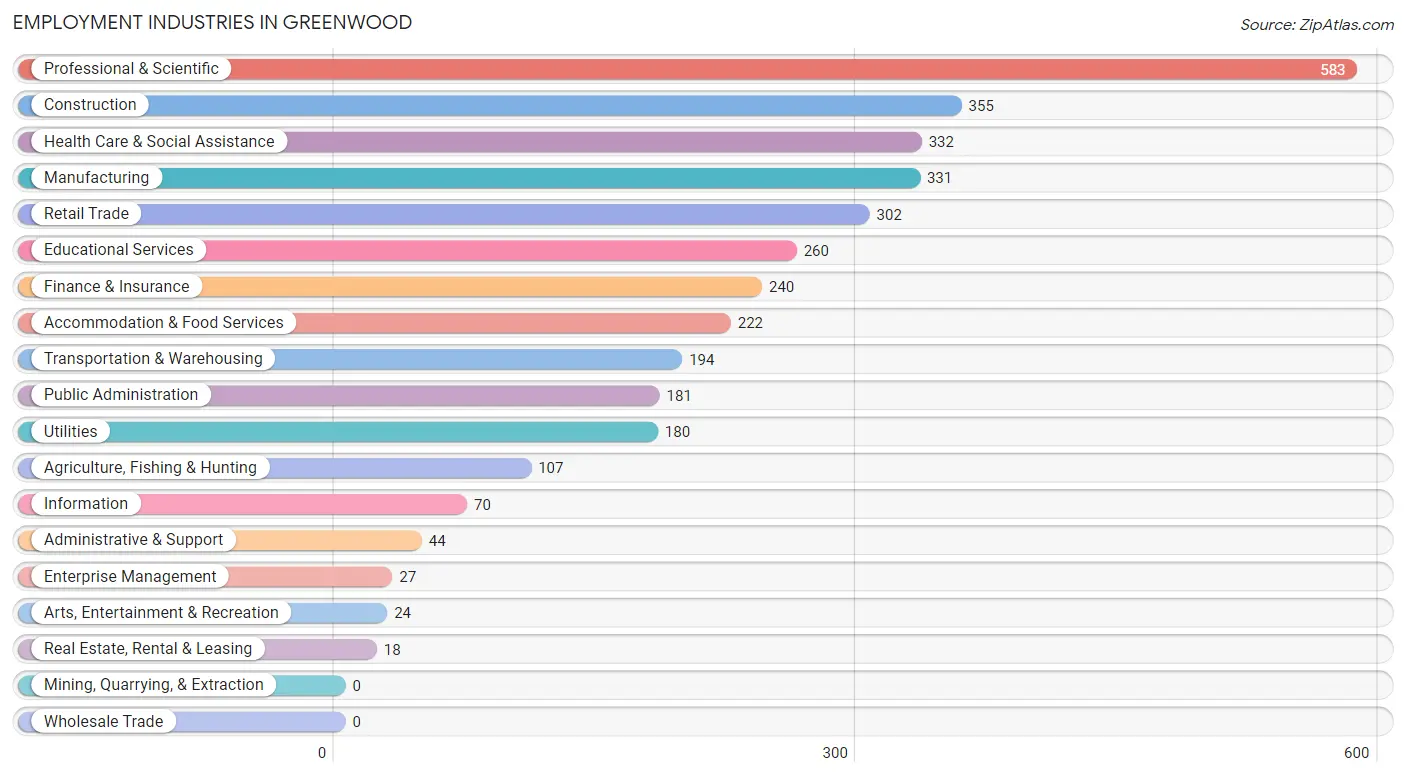
Employment Industries in Greenwood
The major employment industries in Greenwood include Professional & Scientific (583 | 16.2%), Construction (355 | 9.9%), Health Care & Social Assistance (332 | 9.2%), Manufacturing (331 | 9.2%), and Retail Trade (302 | 8.4%).
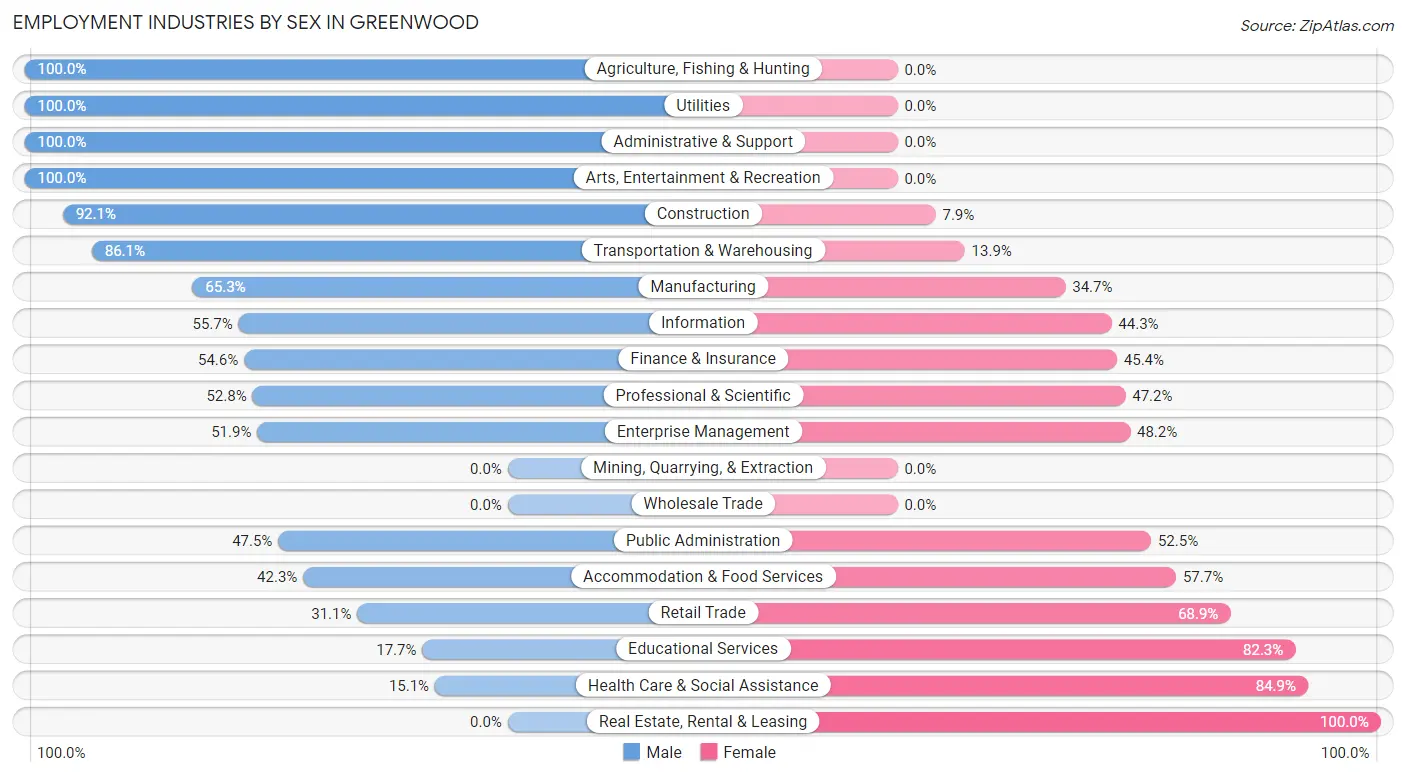
Employment Industries by Sex in Greenwood
The Greenwood industries that see more men than women are Agriculture, Fishing & Hunting (100.0%), Utilities (100.0%), and Administrative & Support (100.0%), whereas the industries that tend to have a higher number of women are Real Estate, Rental & Leasing (100.0%), Health Care & Social Assistance (84.9%), and Educational Services (82.3%).
| Industry | Male | Female |
| Agriculture, Fishing & Hunting | 107 (100.0%) | 0 (0.0%) |
| Mining, Quarrying, & Extraction | 0 (0.0%) | 0 (0.0%) |
| Construction | 327 (92.1%) | 28 (7.9%) |
| Manufacturing | 216 (65.3%) | 115 (34.7%) |
| Wholesale Trade | 0 (0.0%) | 0 (0.0%) |
| Retail Trade | 94 (31.1%) | 208 (68.9%) |
| Transportation & Warehousing | 167 (86.1%) | 27 (13.9%) |
| Utilities | 180 (100.0%) | 0 (0.0%) |
| Information | 39 (55.7%) | 31 (44.3%) |
| Finance & Insurance | 131 (54.6%) | 109 (45.4%) |
| Real Estate, Rental & Leasing | 0 (0.0%) | 18 (100.0%) |
| Professional & Scientific | 308 (52.8%) | 275 (47.2%) |
| Enterprise Management | 14 (51.8%) | 13 (48.1%) |
| Administrative & Support | 44 (100.0%) | 0 (0.0%) |
| Educational Services | 46 (17.7%) | 214 (82.3%) |
| Health Care & Social Assistance | 50 (15.1%) | 282 (84.9%) |
| Arts, Entertainment & Recreation | 24 (100.0%) | 0 (0.0%) |
| Accommodation & Food Services | 94 (42.3%) | 128 (57.7%) |
| Public Administration | 86 (47.5%) | 95 (52.5%) |
| Total | 1,982 (55.1%) | 1,616 (44.9%) |
Education in Greenwood
School Enrollment in Greenwood
The most common levels of schooling among the 1,398 students in Greenwood are high school (307 | 22.0%), elementary school (298 | 21.3%), and middle school (293 | 21.0%).
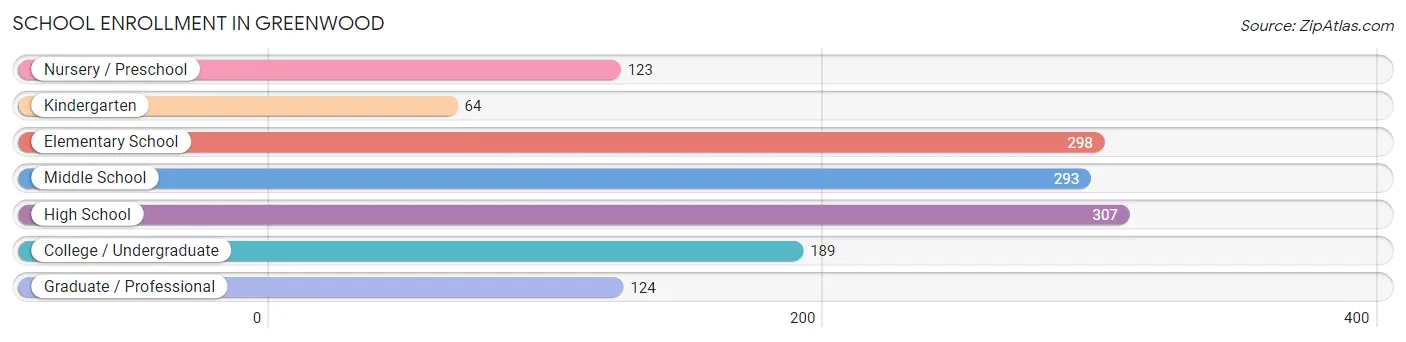
| School Level | # Students | % Students |
| Nursery / Preschool | 123 | 8.8% |
| Kindergarten | 64 | 4.6% |
| Elementary School | 298 | 21.3% |
| Middle School | 293 | 21.0% |
| High School | 307 | 22.0% |
| College / Undergraduate | 189 | 13.5% |
| Graduate / Professional | 124 | 8.9% |
| Total | 1,398 | 100.0% |
School Enrollment by Age by Funding Source in Greenwood
Out of a total of 1,398 students who are enrolled in schools in Greenwood, 179 (12.8%) attend a private institution, while the remaining 1,219 (87.2%) are enrolled in public schools. The age group of 5 to 9 year old has the highest likelihood of being enrolled in private schools, with 83 (22.9% in the age bracket) enrolled. Conversely, the age group of 3 to 4 year olds has the lowest likelihood of being enrolled in a private school, with 83 (100.0% in the age bracket) attending a public institution.
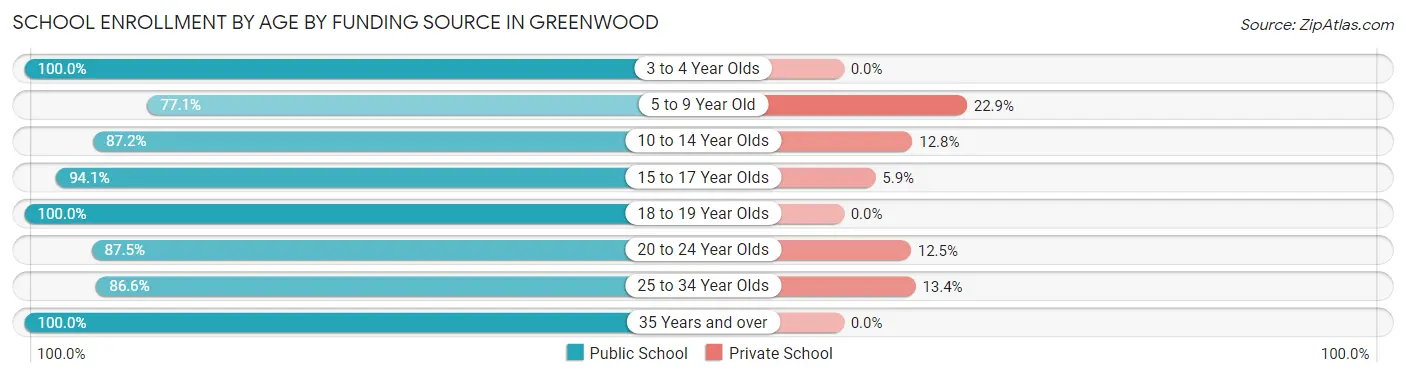
| Age Bracket | Public School | Private School |
| 3 to 4 Year Olds | 83 (100.0%) | 0 (0.0%) |
| 5 to 9 Year Old | 279 (77.1%) | 83 (22.9%) |
| 10 to 14 Year Olds | 307 (87.2%) | 45 (12.8%) |
| 15 to 17 Year Olds | 271 (94.1%) | 17 (5.9%) |
| 18 to 19 Year Olds | 29 (100.0%) | 0 (0.0%) |
| 20 to 24 Year Olds | 63 (87.5%) | 9 (12.5%) |
| 25 to 34 Year Olds | 162 (86.6%) | 25 (13.4%) |
| 35 Years and over | 25 (100.0%) | 0 (0.0%) |
| Total | 1,219 (87.2%) | 179 (12.8%) |
Educational Attainment by Field of Study in Greenwood
Business (355 | 24.2%), arts & humanities (250 | 17.0%), education (183 | 12.5%), science & technology (122 | 8.3%), and bio, nature & agricultural (111 | 7.6%) are the most common fields of study among 1,467 individuals in Greenwood who have obtained a bachelor's degree or higher.
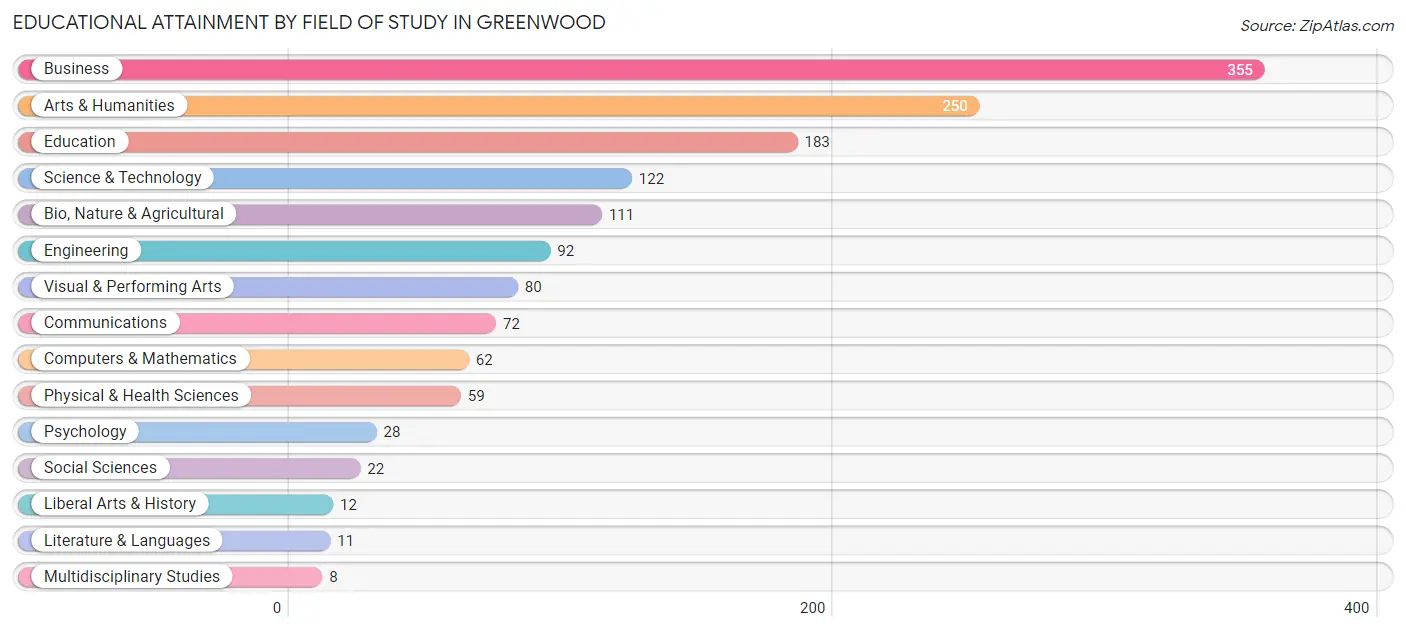
| Field of Study | # Graduates | % Graduates |
| Computers & Mathematics | 62 | 4.2% |
| Bio, Nature & Agricultural | 111 | 7.6% |
| Physical & Health Sciences | 59 | 4.0% |
| Psychology | 28 | 1.9% |
| Social Sciences | 22 | 1.5% |
| Engineering | 92 | 6.3% |
| Multidisciplinary Studies | 8 | 0.5% |
| Science & Technology | 122 | 8.3% |
| Business | 355 | 24.2% |
| Education | 183 | 12.5% |
| Literature & Languages | 11 | 0.7% |
| Liberal Arts & History | 12 | 0.8% |
| Visual & Performing Arts | 80 | 5.4% |
| Communications | 72 | 4.9% |
| Arts & Humanities | 250 | 17.0% |
| Total | 1,467 | 100.0% |
Transportation & Commute in Greenwood
Vehicle Availability by Sex in Greenwood
The most prevalent vehicle ownership categories in Greenwood are males with 2 vehicles (1,106, accounting for 55.8%) and females with 2 vehicles (887, making up 69.1%).
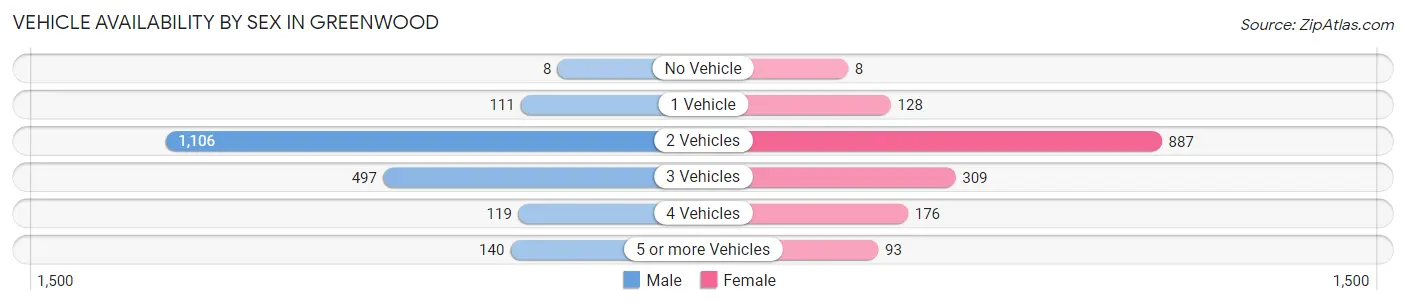
| Vehicles Available | Male | Female |
| No Vehicle | 8 (0.4%) | 8 (0.5%) |
| 1 Vehicle | 111 (5.6%) | 128 (8.0%) |
| 2 Vehicles | 1,106 (55.8%) | 887 (55.4%) |
| 3 Vehicles | 497 (25.1%) | 309 (19.3%) |
| 4 Vehicles | 119 (6.0%) | 176 (11.0%) |
| 5 or more Vehicles | 140 (7.1%) | 93 (5.8%) |
| Total | 1,981 (100.0%) | 1,601 (100.0%) |
Commute Time in Greenwood
The most frequently occuring commute durations in Greenwood are 30 to 34 minutes (535 commuters, 17.0%), 5 to 9 minutes (468 commuters, 14.9%), and 20 to 24 minutes (458 commuters, 14.5%).
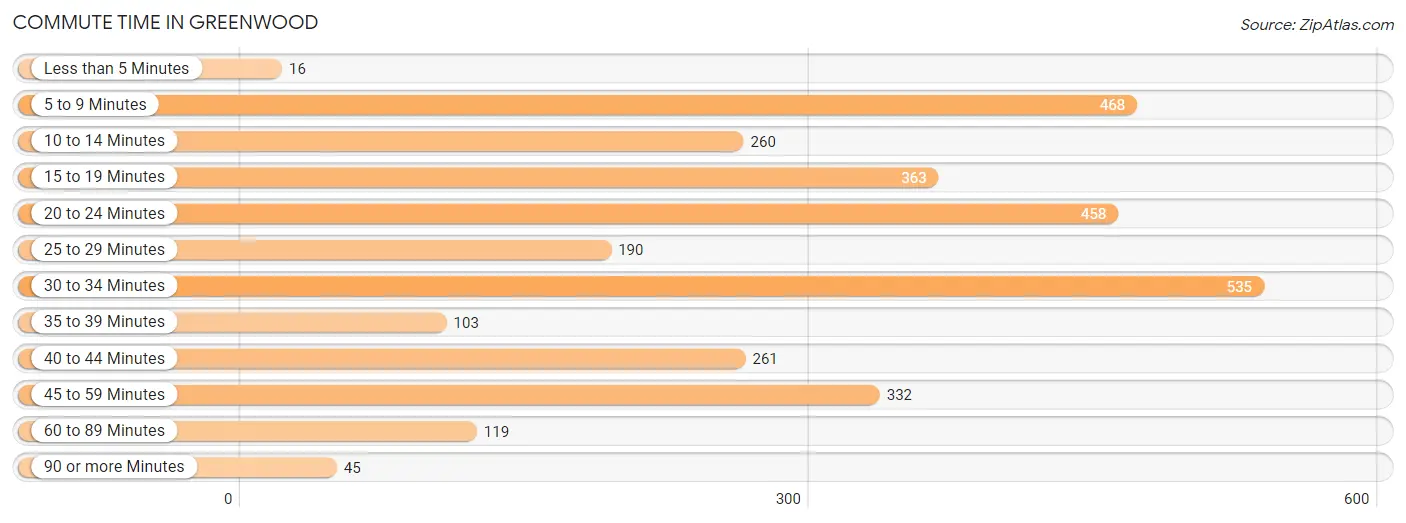
| Commute Time | # Commuters | % Commuters |
| Less than 5 Minutes | 16 | 0.5% |
| 5 to 9 Minutes | 468 | 14.9% |
| 10 to 14 Minutes | 260 | 8.3% |
| 15 to 19 Minutes | 363 | 11.5% |
| 20 to 24 Minutes | 458 | 14.5% |
| 25 to 29 Minutes | 190 | 6.0% |
| 30 to 34 Minutes | 535 | 17.0% |
| 35 to 39 Minutes | 103 | 3.3% |
| 40 to 44 Minutes | 261 | 8.3% |
| 45 to 59 Minutes | 332 | 10.5% |
| 60 to 89 Minutes | 119 | 3.8% |
| 90 or more Minutes | 45 | 1.4% |
Commute Time by Sex in Greenwood
The most common commute times in Greenwood are 5 to 9 minutes (338 commuters, 20.0%) for males and 30 to 34 minutes (312 commuters, 21.3%) for females.
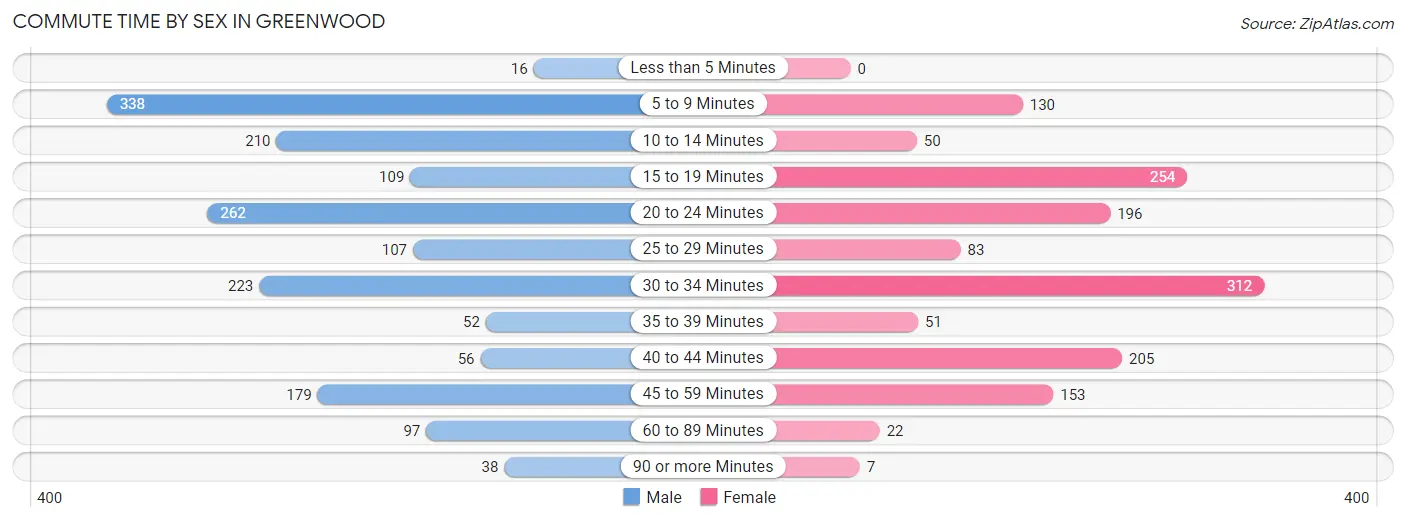
| Commute Time | Male | Female |
| Less than 5 Minutes | 16 (0.9%) | 0 (0.0%) |
| 5 to 9 Minutes | 338 (20.0%) | 130 (8.9%) |
| 10 to 14 Minutes | 210 (12.4%) | 50 (3.4%) |
| 15 to 19 Minutes | 109 (6.5%) | 254 (17.4%) |
| 20 to 24 Minutes | 262 (15.5%) | 196 (13.4%) |
| 25 to 29 Minutes | 107 (6.3%) | 83 (5.7%) |
| 30 to 34 Minutes | 223 (13.2%) | 312 (21.3%) |
| 35 to 39 Minutes | 52 (3.1%) | 51 (3.5%) |
| 40 to 44 Minutes | 56 (3.3%) | 205 (14.0%) |
| 45 to 59 Minutes | 179 (10.6%) | 153 (10.5%) |
| 60 to 89 Minutes | 97 (5.8%) | 22 (1.5%) |
| 90 or more Minutes | 38 (2.2%) | 7 (0.5%) |
Time of Departure to Work by Sex in Greenwood
The most frequent times of departure to work in Greenwood are 12:00 PM to 3:59 PM (351, 20.8%) for males and 7:00 AM to 7:29 AM (366, 25.0%) for females.
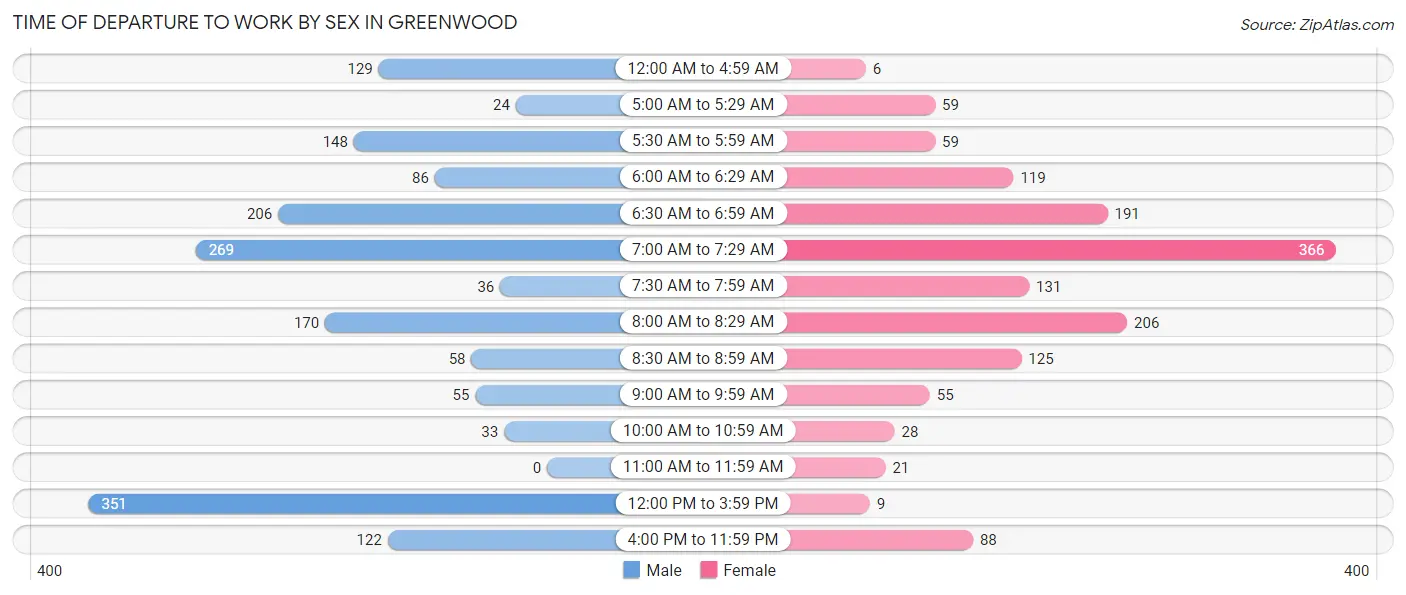
| Time of Departure | Male | Female |
| 12:00 AM to 4:59 AM | 129 (7.6%) | 6 (0.4%) |
| 5:00 AM to 5:29 AM | 24 (1.4%) | 59 (4.0%) |
| 5:30 AM to 5:59 AM | 148 (8.8%) | 59 (4.0%) |
| 6:00 AM to 6:29 AM | 86 (5.1%) | 119 (8.1%) |
| 6:30 AM to 6:59 AM | 206 (12.2%) | 191 (13.1%) |
| 7:00 AM to 7:29 AM | 269 (16.0%) | 366 (25.0%) |
| 7:30 AM to 7:59 AM | 36 (2.1%) | 131 (8.9%) |
| 8:00 AM to 8:29 AM | 170 (10.1%) | 206 (14.1%) |
| 8:30 AM to 8:59 AM | 58 (3.4%) | 125 (8.5%) |
| 9:00 AM to 9:59 AM | 55 (3.3%) | 55 (3.8%) |
| 10:00 AM to 10:59 AM | 33 (2.0%) | 28 (1.9%) |
| 11:00 AM to 11:59 AM | 0 (0.0%) | 21 (1.4%) |
| 12:00 PM to 3:59 PM | 351 (20.8%) | 9 (0.6%) |
| 4:00 PM to 11:59 PM | 122 (7.2%) | 88 (6.0%) |
| Total | 1,687 (100.0%) | 1,463 (100.0%) |
Housing Occupancy in Greenwood
Occupancy by Ownership in Greenwood
Of the total 2,191 dwellings in Greenwood, owner-occupied units account for 1,945 (88.8%), while renter-occupied units make up 246 (11.2%).
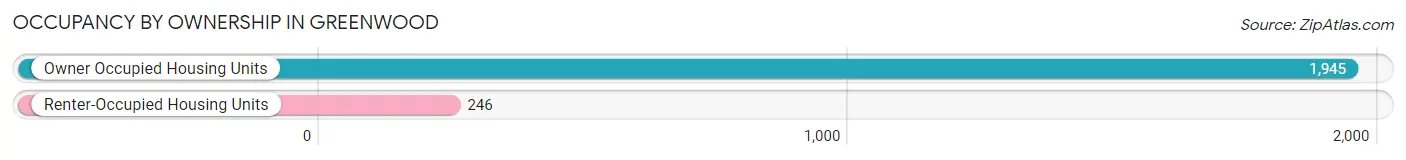
| Occupancy | # Housing Units | % Housing Units |
| Owner Occupied Housing Units | 1,945 | 88.8% |
| Renter-Occupied Housing Units | 246 | 11.2% |
| Total Occupied Housing Units | 2,191 | 100.0% |
Occupancy by Household Size in Greenwood
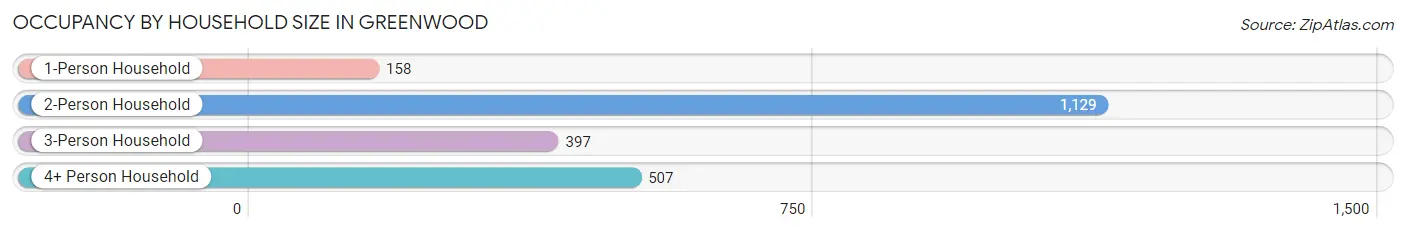
| Household Size | # Housing Units | % Housing Units |
| 1-Person Household | 158 | 7.2% |
| 2-Person Household | 1,129 | 51.5% |
| 3-Person Household | 397 | 18.1% |
| 4+ Person Household | 507 | 23.1% |
| Total Housing Units | 2,191 | 100.0% |
Occupancy by Ownership by Household Size in Greenwood
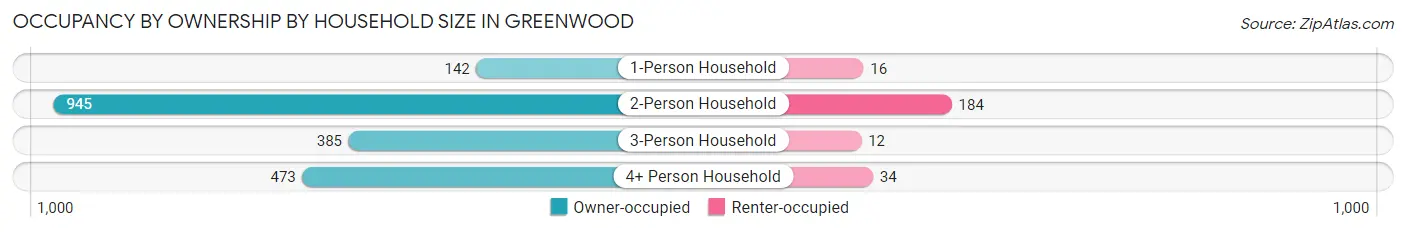
| Household Size | Owner-occupied | Renter-occupied |
| 1-Person Household | 142 (89.9%) | 16 (10.1%) |
| 2-Person Household | 945 (83.7%) | 184 (16.3%) |
| 3-Person Household | 385 (97.0%) | 12 (3.0%) |
| 4+ Person Household | 473 (93.3%) | 34 (6.7%) |
| Total Housing Units | 1,945 (88.8%) | 246 (11.2%) |
Occupancy by Educational Attainment in Greenwood
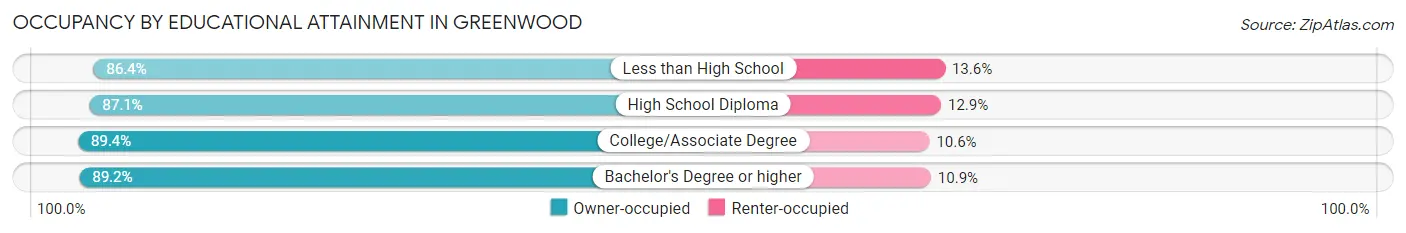
| Household Size | Owner-occupied | Renter-occupied |
| Less than High School | 76 (86.4%) | 12 (13.6%) |
| High School Diploma | 359 (87.1%) | 53 (12.9%) |
| College/Associate Degree | 762 (89.4%) | 90 (10.6%) |
| Bachelor's Degree or higher | 748 (89.1%) | 91 (10.8%) |
Occupancy by Age of Householder in Greenwood
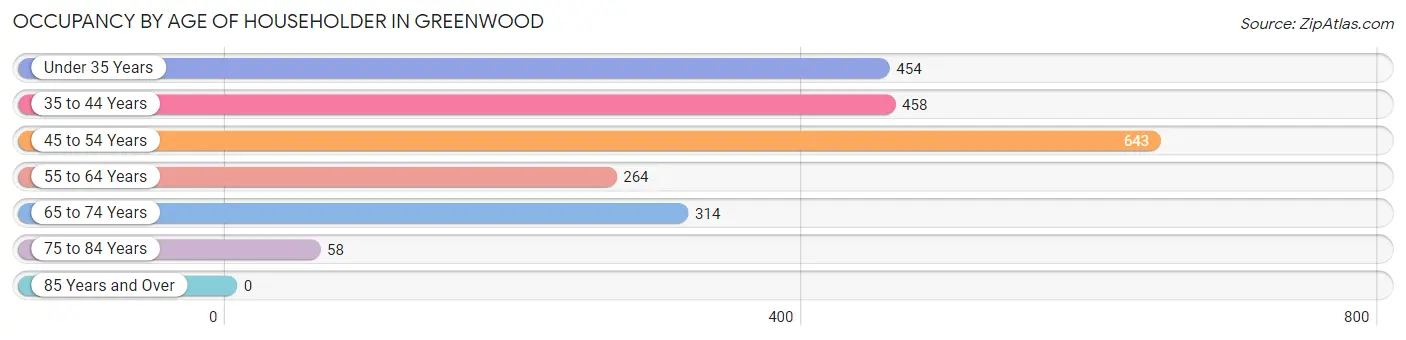
| Age Bracket | # Households | % Households |
| Under 35 Years | 454 | 20.7% |
| 35 to 44 Years | 458 | 20.9% |
| 45 to 54 Years | 643 | 29.3% |
| 55 to 64 Years | 264 | 12.0% |
| 65 to 74 Years | 314 | 14.3% |
| 75 to 84 Years | 58 | 2.6% |
| 85 Years and Over | 0 | 0.0% |
| Total | 2,191 | 100.0% |
Housing Finances in Greenwood
Median Income by Occupancy in Greenwood
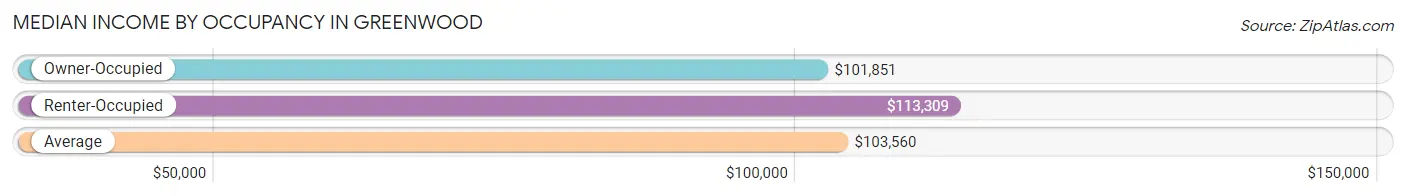
| Occupancy Type | # Households | Median Income |
| Owner-Occupied | 1,945 (88.8%) | $101,851 |
| Renter-Occupied | 246 (11.2%) | $113,309 |
| Average | 2,191 (100.0%) | $103,560 |
Occupancy by Householder Income Bracket in Greenwood
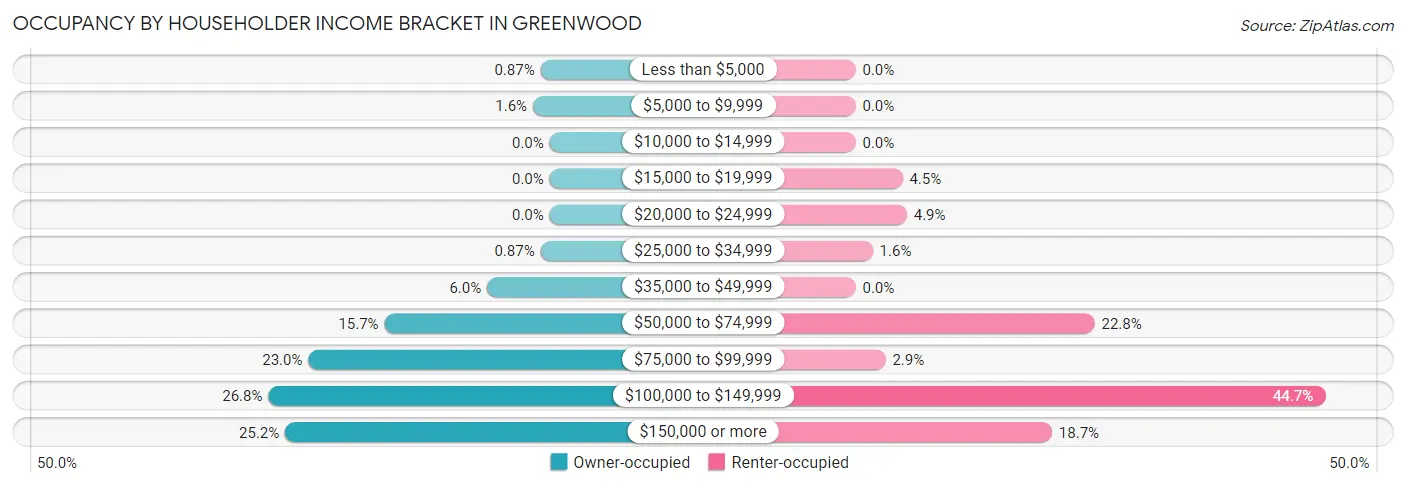
| Income Bracket | Owner-occupied | Renter-occupied |
| Less than $5,000 | 17 (0.9%) | 0 (0.0%) |
| $5,000 to $9,999 | 31 (1.6%) | 0 (0.0%) |
| $10,000 to $14,999 | 0 (0.0%) | 0 (0.0%) |
| $15,000 to $19,999 | 0 (0.0%) | 11 (4.5%) |
| $20,000 to $24,999 | 0 (0.0%) | 12 (4.9%) |
| $25,000 to $34,999 | 17 (0.9%) | 4 (1.6%) |
| $35,000 to $49,999 | 116 (6.0%) | 0 (0.0%) |
| $50,000 to $74,999 | 306 (15.7%) | 56 (22.8%) |
| $75,000 to $99,999 | 447 (23.0%) | 7 (2.9%) |
| $100,000 to $149,999 | 521 (26.8%) | 110 (44.7%) |
| $150,000 or more | 490 (25.2%) | 46 (18.7%) |
| Total | 1,945 (100.0%) | 246 (100.0%) |
Monthly Housing Cost Tiers in Greenwood
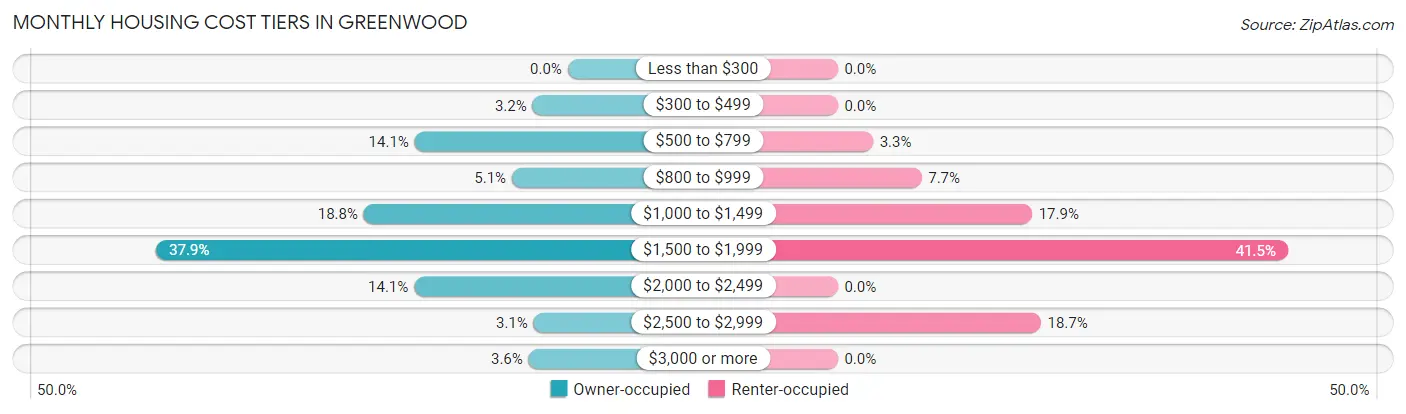
| Monthly Cost | Owner-occupied | Renter-occupied |
| Less than $300 | 0 (0.0%) | 0 (0.0%) |
| $300 to $499 | 63 (3.2%) | 0 (0.0%) |
| $500 to $799 | 274 (14.1%) | 8 (3.3%) |
| $800 to $999 | 100 (5.1%) | 19 (7.7%) |
| $1,000 to $1,499 | 365 (18.8%) | 44 (17.9%) |
| $1,500 to $1,999 | 737 (37.9%) | 102 (41.5%) |
| $2,000 to $2,499 | 275 (14.1%) | 0 (0.0%) |
| $2,500 to $2,999 | 61 (3.1%) | 46 (18.7%) |
| $3,000 or more | 70 (3.6%) | 0 (0.0%) |
| Total | 1,945 (100.0%) | 246 (100.0%) |
Physical Housing Characteristics in Greenwood
Housing Structures in Greenwood
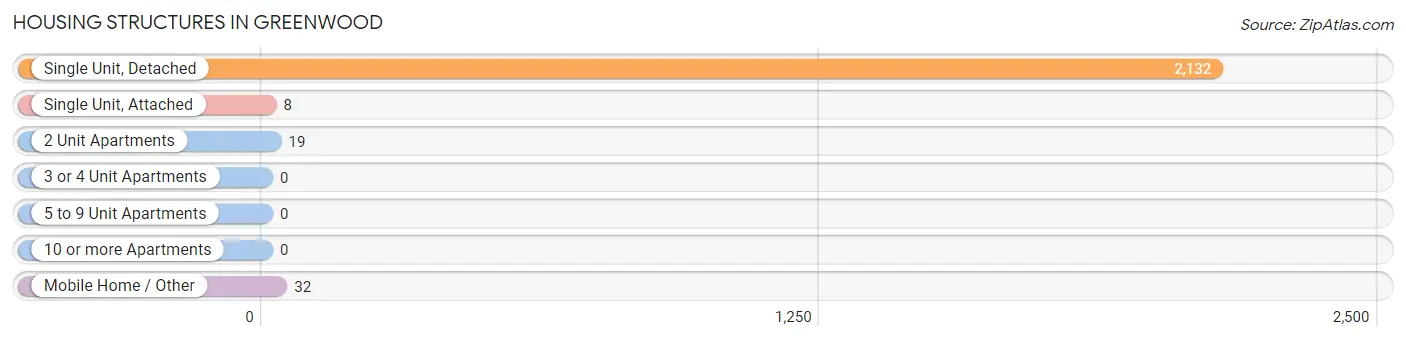
| Structure Type | # Housing Units | % Housing Units |
| Single Unit, Detached | 2,132 | 97.3% |
| Single Unit, Attached | 8 | 0.4% |
| 2 Unit Apartments | 19 | 0.9% |
| 3 or 4 Unit Apartments | 0 | 0.0% |
| 5 to 9 Unit Apartments | 0 | 0.0% |
| 10 or more Apartments | 0 | 0.0% |
| Mobile Home / Other | 32 | 1.5% |
| Total | 2,191 | 100.0% |
Housing Structures by Occupancy in Greenwood
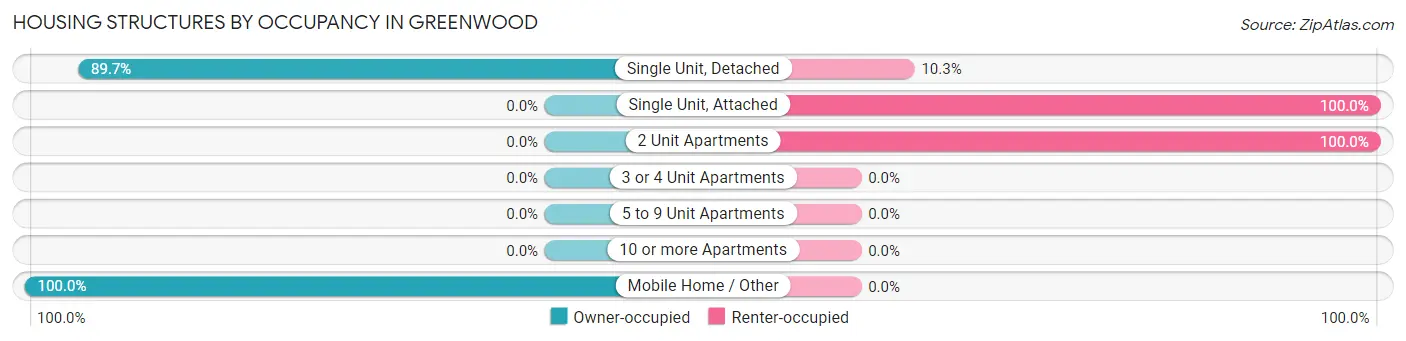
| Structure Type | Owner-occupied | Renter-occupied |
| Single Unit, Detached | 1,913 (89.7%) | 219 (10.3%) |
| Single Unit, Attached | 0 (0.0%) | 8 (100.0%) |
| 2 Unit Apartments | 0 (0.0%) | 19 (100.0%) |
| 3 or 4 Unit Apartments | 0 (0.0%) | 0 (0.0%) |
| 5 to 9 Unit Apartments | 0 (0.0%) | 0 (0.0%) |
| 10 or more Apartments | 0 (0.0%) | 0 (0.0%) |
| Mobile Home / Other | 32 (100.0%) | 0 (0.0%) |
| Total | 1,945 (88.8%) | 246 (11.2%) |
Housing Structures by Number of Rooms in Greenwood
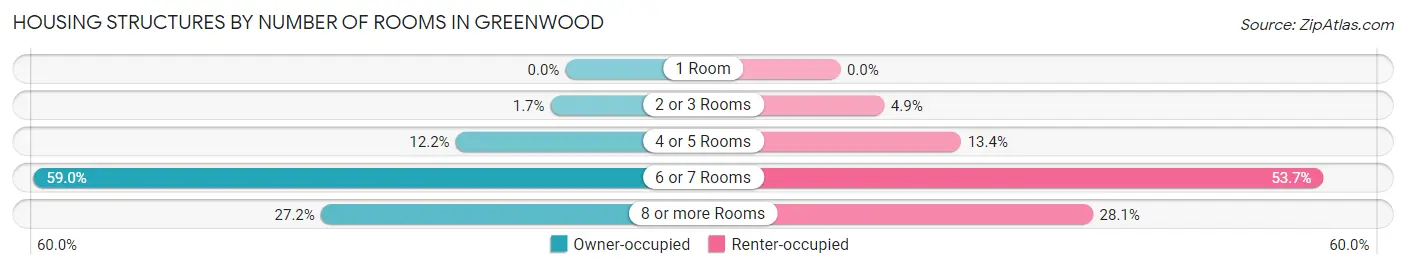
| Number of Rooms | Owner-occupied | Renter-occupied |
| 1 Room | 0 (0.0%) | 0 (0.0%) |
| 2 or 3 Rooms | 32 (1.7%) | 12 (4.9%) |
| 4 or 5 Rooms | 237 (12.2%) | 33 (13.4%) |
| 6 or 7 Rooms | 1,148 (59.0%) | 132 (53.7%) |
| 8 or more Rooms | 528 (27.2%) | 69 (28.1%) |
| Total | 1,945 (100.0%) | 246 (100.0%) |
Housing Structure by Heating Type in Greenwood
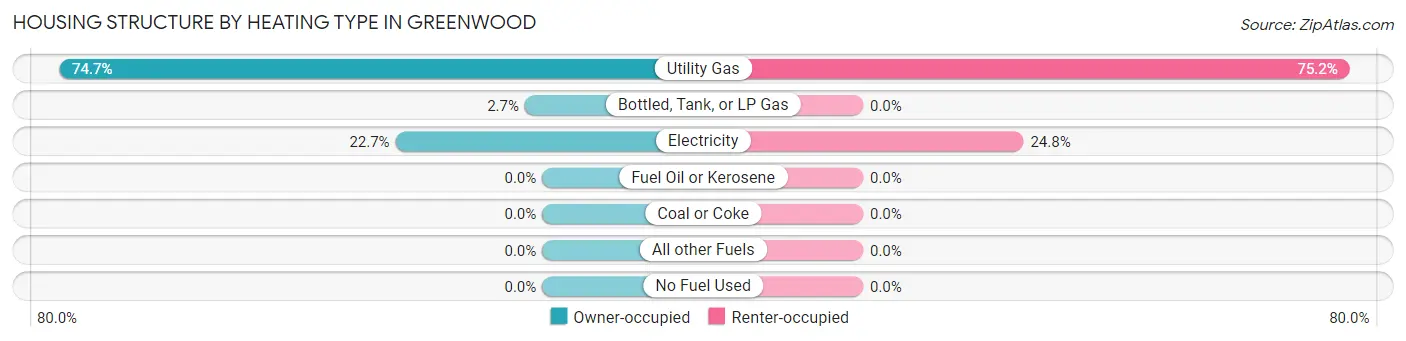
| Heating Type | Owner-occupied | Renter-occupied |
| Utility Gas | 1,452 (74.7%) | 185 (75.2%) |
| Bottled, Tank, or LP Gas | 52 (2.7%) | 0 (0.0%) |
| Electricity | 441 (22.7%) | 61 (24.8%) |
| Fuel Oil or Kerosene | 0 (0.0%) | 0 (0.0%) |
| Coal or Coke | 0 (0.0%) | 0 (0.0%) |
| All other Fuels | 0 (0.0%) | 0 (0.0%) |
| No Fuel Used | 0 (0.0%) | 0 (0.0%) |
| Total | 1,945 (100.0%) | 246 (100.0%) |
Household Vehicle Usage in Greenwood
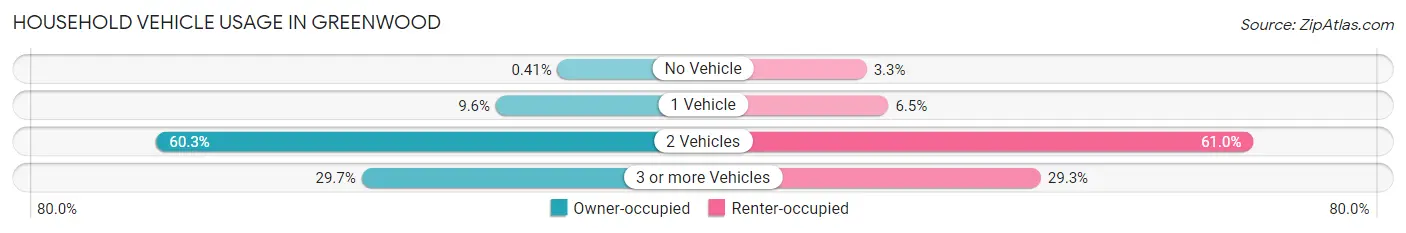
| Vehicles per Household | Owner-occupied | Renter-occupied |
| No Vehicle | 8 (0.4%) | 8 (3.3%) |
| 1 Vehicle | 187 (9.6%) | 16 (6.5%) |
| 2 Vehicles | 1,173 (60.3%) | 150 (61.0%) |
| 3 or more Vehicles | 577 (29.7%) | 72 (29.3%) |
| Total | 1,945 (100.0%) | 246 (100.0%) |
Real Estate & Mortgages in Greenwood
Real Estate and Mortgage Overview in Greenwood
| Characteristic | Without Mortgage | With Mortgage |
| Housing Units | 382 | 1,563 |
| Median Property Value | $234,600 | $250,100 |
| Median Household Income | $80,795 | $400 |
| Monthly Housing Costs | $577 | $70 |
| Real Estate Taxes | $2,805 | $38 |
Property Value by Mortgage Status in Greenwood
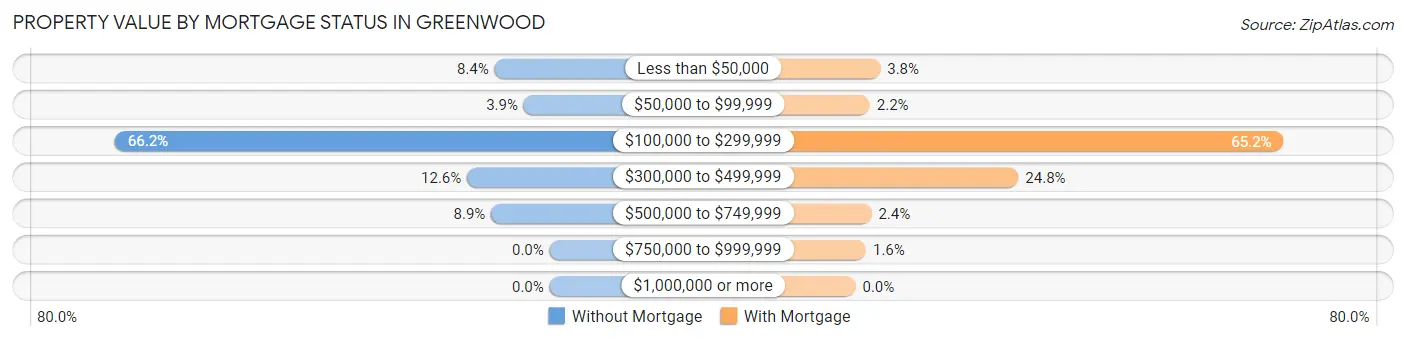
| Property Value | Without Mortgage | With Mortgage |
| Less than $50,000 | 32 (8.4%) | 59 (3.8%) |
| $50,000 to $99,999 | 15 (3.9%) | 34 (2.2%) |
| $100,000 to $299,999 | 253 (66.2%) | 1,019 (65.2%) |
| $300,000 to $499,999 | 48 (12.6%) | 388 (24.8%) |
| $500,000 to $749,999 | 34 (8.9%) | 38 (2.4%) |
| $750,000 to $999,999 | 0 (0.0%) | 25 (1.6%) |
| $1,000,000 or more | 0 (0.0%) | 0 (0.0%) |
| Total | 382 (100.0%) | 1,563 (100.0%) |
Household Income by Mortgage Status in Greenwood
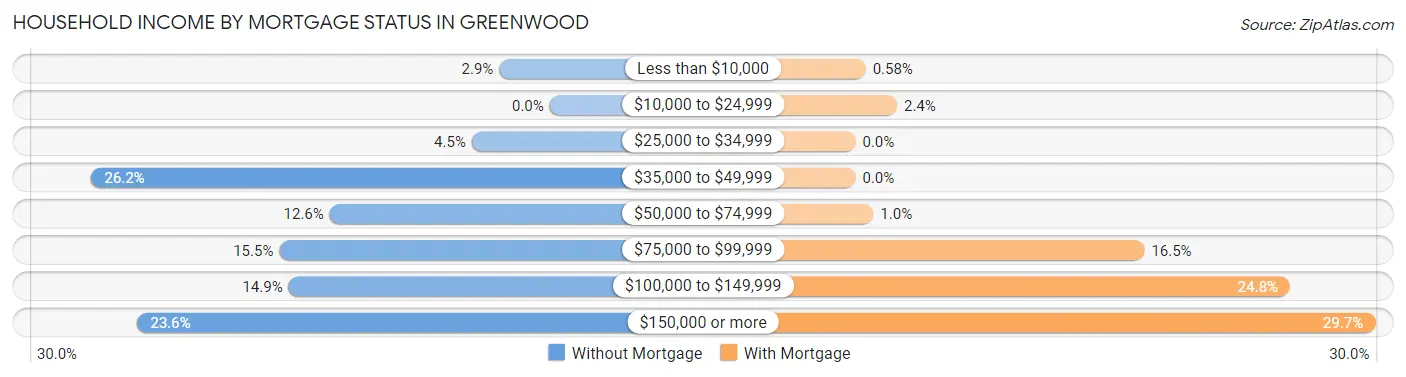
| Household Income | Without Mortgage | With Mortgage |
| Less than $10,000 | 11 (2.9%) | 9 (0.6%) |
| $10,000 to $24,999 | 0 (0.0%) | 37 (2.4%) |
| $25,000 to $34,999 | 17 (4.4%) | 0 (0.0%) |
| $35,000 to $49,999 | 100 (26.2%) | 0 (0.0%) |
| $50,000 to $74,999 | 48 (12.6%) | 16 (1.0%) |
| $75,000 to $99,999 | 59 (15.4%) | 258 (16.5%) |
| $100,000 to $149,999 | 57 (14.9%) | 388 (24.8%) |
| $150,000 or more | 90 (23.6%) | 464 (29.7%) |
| Total | 382 (100.0%) | 1,563 (100.0%) |
Property Value to Household Income Ratio in Greenwood
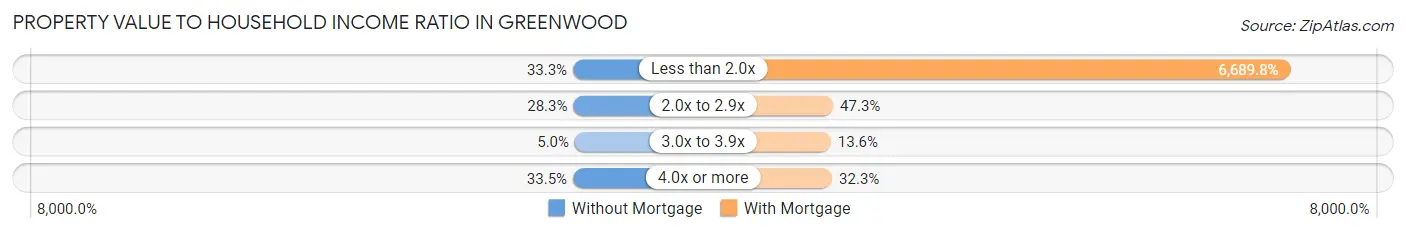
| Value-to-Income Ratio | Without Mortgage | With Mortgage |
| Less than 2.0x | 127 (33.3%) | 104,561 (6,689.8%) |
| 2.0x to 2.9x | 108 (28.3%) | 739 (47.3%) |
| 3.0x to 3.9x | 19 (5.0%) | 213 (13.6%) |
| 4.0x or more | 128 (33.5%) | 505 (32.3%) |
| Total | 382 (100.0%) | 1,563 (100.0%) |
Real Estate Taxes by Mortgage Status in Greenwood
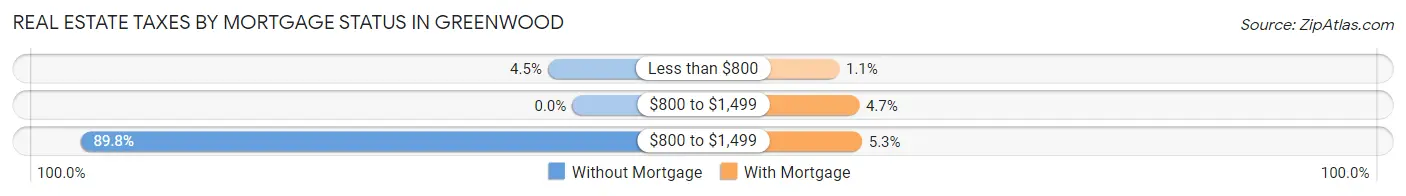
| Property Taxes | Without Mortgage | With Mortgage |
| Less than $800 | 17 (4.4%) | 17 (1.1%) |
| $800 to $1,499 | 0 (0.0%) | 74 (4.7%) |
| $800 to $1,499 | 343 (89.8%) | 82 (5.2%) |
| Total | 382 (100.0%) | 1,563 (100.0%) |
Health & Disability in Greenwood
Health Insurance Coverage by Age in Greenwood
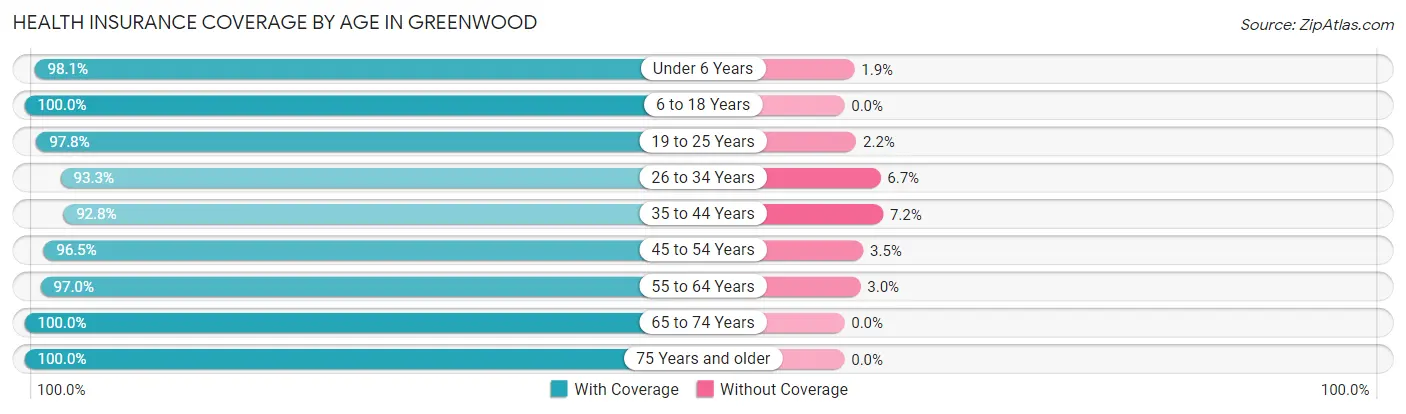
| Age Bracket | With Coverage | Without Coverage |
| Under 6 Years | 471 (98.1%) | 9 (1.9%) |
| 6 to 18 Years | 1,003 (100.0%) | 0 (0.0%) |
| 19 to 25 Years | 401 (97.8%) | 9 (2.2%) |
| 26 to 34 Years | 665 (93.3%) | 48 (6.7%) |
| 35 to 44 Years | 901 (92.8%) | 70 (7.2%) |
| 45 to 54 Years | 1,181 (96.5%) | 43 (3.5%) |
| 55 to 64 Years | 454 (97.0%) | 14 (3.0%) |
| 65 to 74 Years | 590 (100.0%) | 0 (0.0%) |
| 75 Years and older | 126 (100.0%) | 0 (0.0%) |
| Total | 5,792 (96.8%) | 193 (3.2%) |
Health Insurance Coverage by Citizenship Status in Greenwood
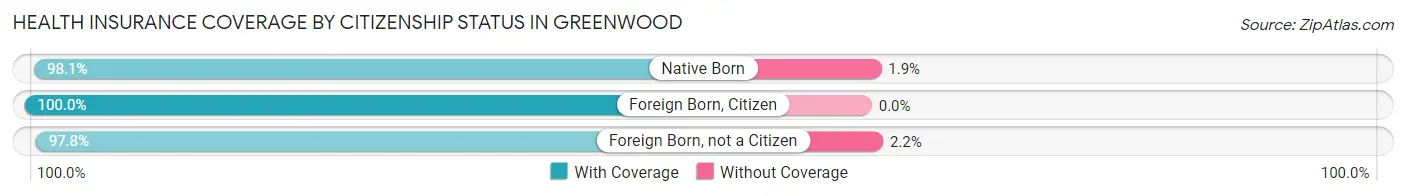
| Citizenship Status | With Coverage | Without Coverage |
| Native Born | 471 (98.1%) | 9 (1.9%) |
| Foreign Born, Citizen | 1,003 (100.0%) | 0 (0.0%) |
| Foreign Born, not a Citizen | 401 (97.8%) | 9 (2.2%) |
Health Insurance Coverage by Household Income in Greenwood
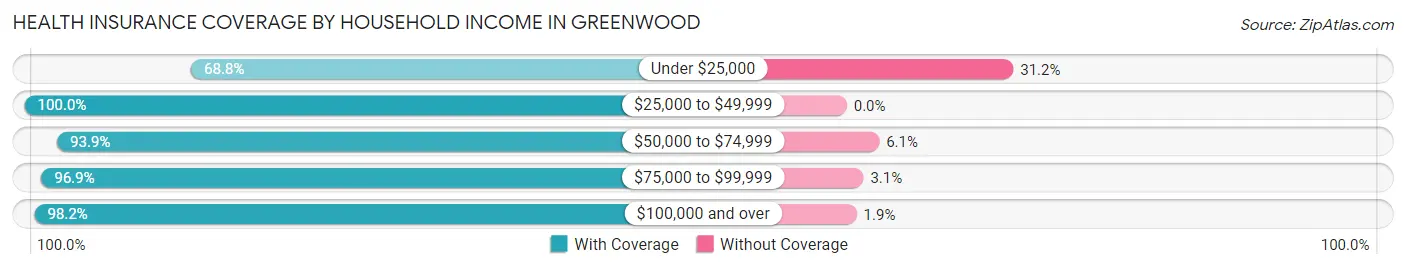
| Household Income | With Coverage | Without Coverage |
| Under $25,000 | 86 (68.8%) | 39 (31.2%) |
| $25,000 to $49,999 | 270 (100.0%) | 0 (0.0%) |
| $50,000 to $74,999 | 850 (93.9%) | 55 (6.1%) |
| $75,000 to $99,999 | 959 (96.9%) | 31 (3.1%) |
| $100,000 and over | 3,617 (98.2%) | 68 (1.8%) |
Public vs Private Health Insurance Coverage by Age in Greenwood
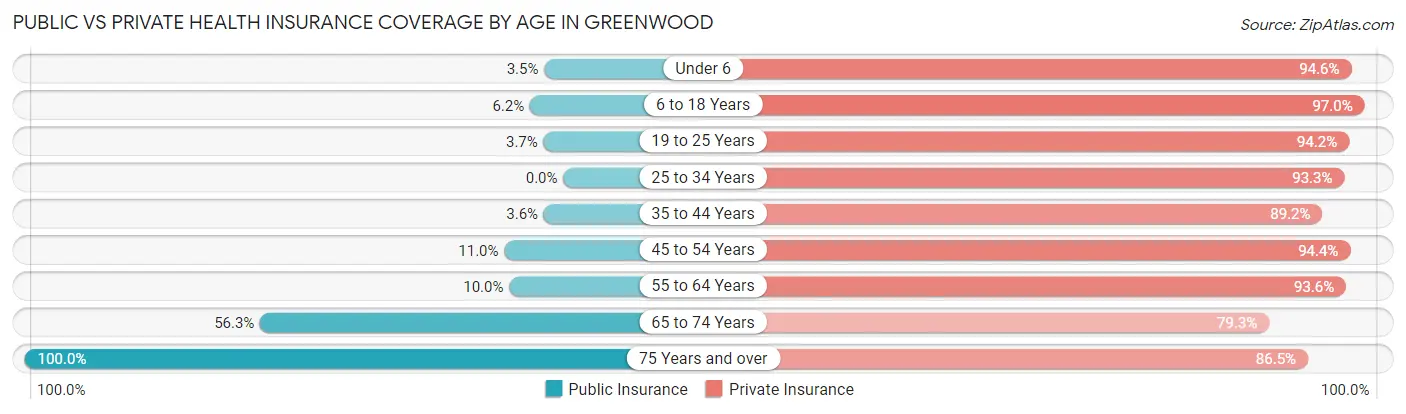
| Age Bracket | Public Insurance | Private Insurance |
| Under 6 | 17 (3.5%) | 454 (94.6%) |
| 6 to 18 Years | 62 (6.2%) | 973 (97.0%) |
| 19 to 25 Years | 15 (3.7%) | 386 (94.2%) |
| 25 to 34 Years | 0 (0.0%) | 665 (93.3%) |
| 35 to 44 Years | 35 (3.6%) | 866 (89.2%) |
| 45 to 54 Years | 134 (11.0%) | 1,155 (94.4%) |
| 55 to 64 Years | 47 (10.0%) | 438 (93.6%) |
| 65 to 74 Years | 332 (56.3%) | 468 (79.3%) |
| 75 Years and over | 126 (100.0%) | 109 (86.5%) |
| Total | 768 (12.8%) | 5,514 (92.1%) |
Disability Status by Sex by Age in Greenwood
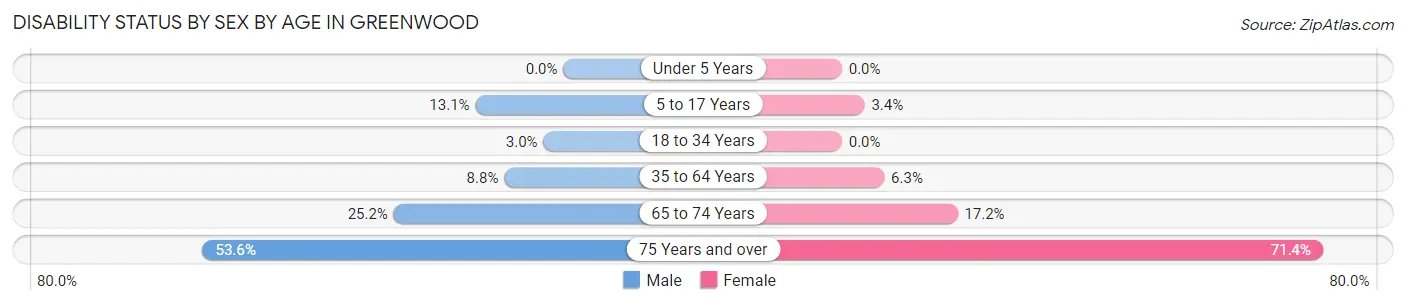
| Age Bracket | Male | Female |
| Under 5 Years | 0 (0.0%) | 0 (0.0%) |
| 5 to 17 Years | 73 (13.1%) | 16 (3.4%) |
| 18 to 34 Years | 17 (3.0%) | 0 (0.0%) |
| 35 to 64 Years | 118 (8.8%) | 83 (6.3%) |
| 65 to 74 Years | 65 (25.2%) | 57 (17.2%) |
| 75 Years and over | 45 (53.6%) | 30 (71.4%) |
Disability Class by Sex by Age in Greenwood
Disability Class: Hearing Difficulty
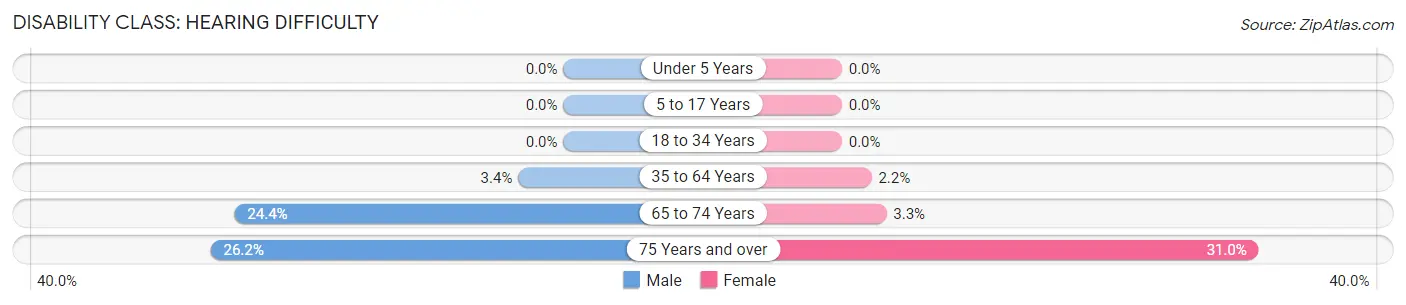
| Age Bracket | Male | Female |
| Under 5 Years | 0 (0.0%) | 0 (0.0%) |
| 5 to 17 Years | 0 (0.0%) | 0 (0.0%) |
| 18 to 34 Years | 0 (0.0%) | 0 (0.0%) |
| 35 to 64 Years | 45 (3.4%) | 29 (2.2%) |
| 65 to 74 Years | 63 (24.4%) | 11 (3.3%) |
| 75 Years and over | 22 (26.2%) | 13 (30.9%) |
Disability Class: Vision Difficulty
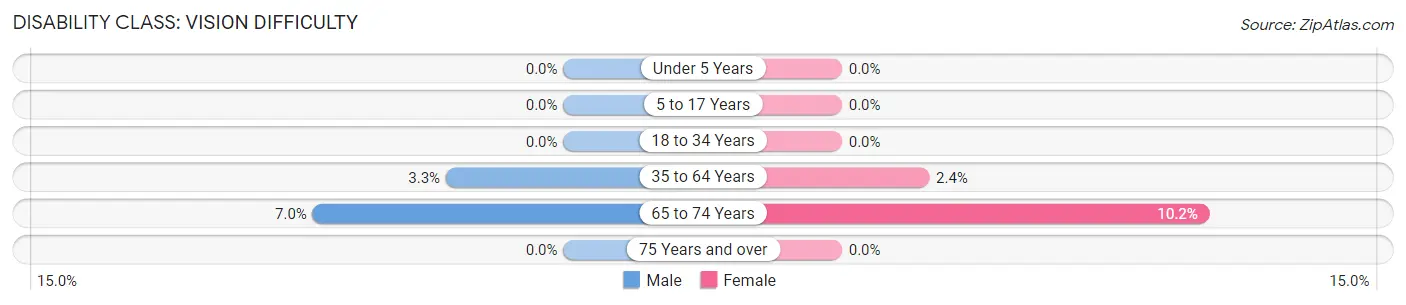
| Age Bracket | Male | Female |
| Under 5 Years | 0 (0.0%) | 0 (0.0%) |
| 5 to 17 Years | 0 (0.0%) | 0 (0.0%) |
| 18 to 34 Years | 0 (0.0%) | 0 (0.0%) |
| 35 to 64 Years | 44 (3.3%) | 32 (2.4%) |
| 65 to 74 Years | 18 (7.0%) | 34 (10.2%) |
| 75 Years and over | 0 (0.0%) | 0 (0.0%) |
Disability Class: Cognitive Difficulty
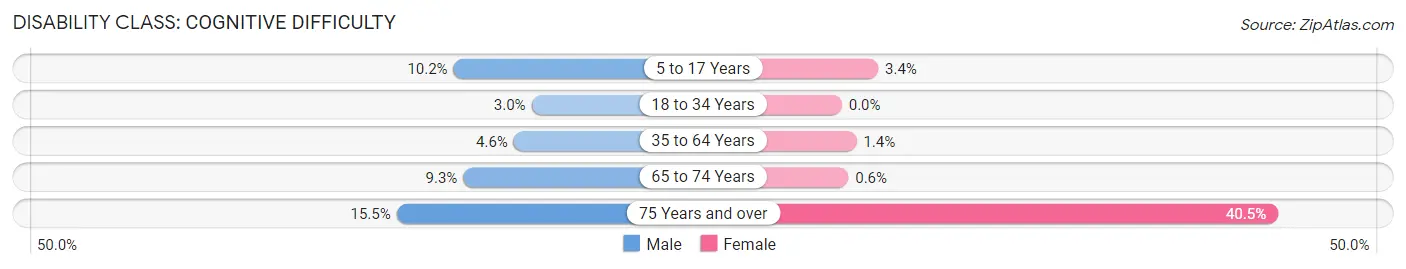
| Age Bracket | Male | Female |
| 5 to 17 Years | 57 (10.2%) | 16 (3.4%) |
| 18 to 34 Years | 17 (3.0%) | 0 (0.0%) |
| 35 to 64 Years | 62 (4.6%) | 18 (1.4%) |
| 65 to 74 Years | 24 (9.3%) | 2 (0.6%) |
| 75 Years and over | 13 (15.5%) | 17 (40.5%) |
Disability Class: Ambulatory Difficulty
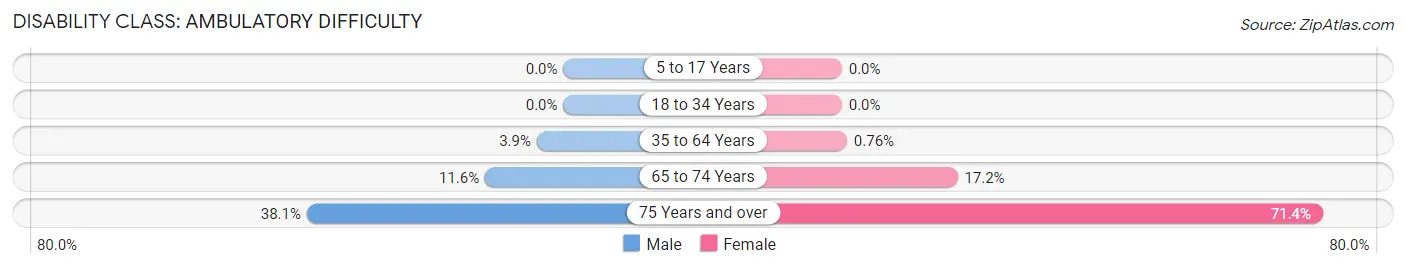
| Age Bracket | Male | Female |
| 5 to 17 Years | 0 (0.0%) | 0 (0.0%) |
| 18 to 34 Years | 0 (0.0%) | 0 (0.0%) |
| 35 to 64 Years | 53 (3.9%) | 10 (0.8%) |
| 65 to 74 Years | 30 (11.6%) | 57 (17.2%) |
| 75 Years and over | 32 (38.1%) | 30 (71.4%) |
Disability Class: Self-Care Difficulty
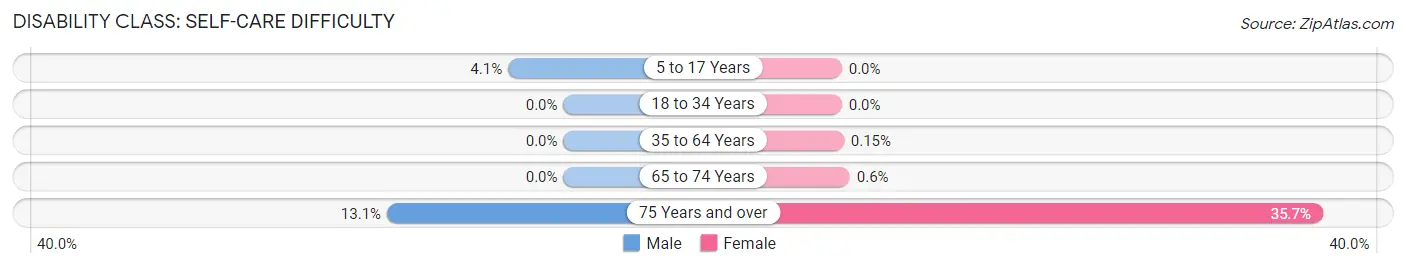
| Age Bracket | Male | Female |
| 5 to 17 Years | 23 (4.1%) | 0 (0.0%) |
| 18 to 34 Years | 0 (0.0%) | 0 (0.0%) |
| 35 to 64 Years | 0 (0.0%) | 2 (0.2%) |
| 65 to 74 Years | 0 (0.0%) | 2 (0.6%) |
| 75 Years and over | 11 (13.1%) | 15 (35.7%) |
Technology Access in Greenwood
Computing Device Access in Greenwood
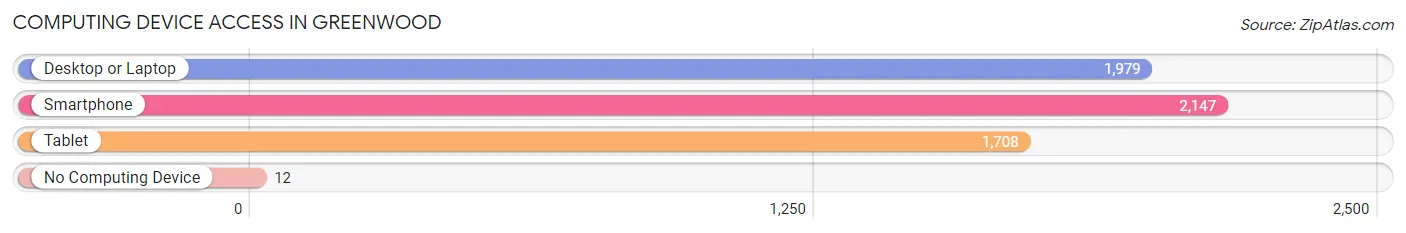
| Device Type | # Households | % Households |
| Desktop or Laptop | 1,979 | 90.3% |
| Smartphone | 2,147 | 98.0% |
| Tablet | 1,708 | 78.0% |
| No Computing Device | 12 | 0.5% |
| Total | 2,191 | 100.0% |
Internet Access in Greenwood
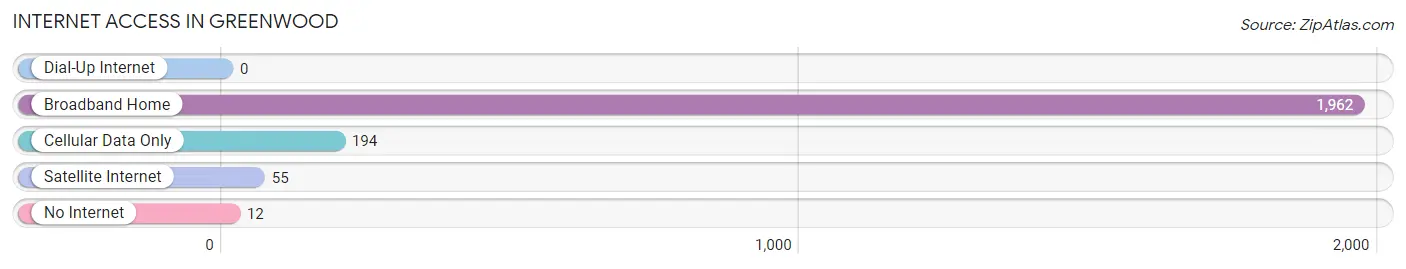
| Internet Type | # Households | % Households |
| Dial-Up Internet | 0 | 0.0% |
| Broadband Home | 1,962 | 89.5% |
| Cellular Data Only | 194 | 8.8% |
| Satellite Internet | 55 | 2.5% |
| No Internet | 12 | 0.5% |
| Total | 2,191 | 100.0% |
Greenwood Summary
Greenwood, Missouri is a small city located in Jackson County, Missouri, United States. It is part of the Kansas City metropolitan area and is located approximately 15 miles south of downtown Kansas City. The population of Greenwood was estimated to be 8,945 in 2019.
History
Greenwood was founded in 1857 by a group of settlers from Greenwood, Indiana. The town was originally named Greenwood Station, but the name was changed to Greenwood in 1858. The town was incorporated in 1871.
Greenwood was a small farming community until the early 1900s when it began to experience rapid growth due to the development of the Kansas City Southern Railway. The railway provided transportation for goods and people, and it allowed Greenwood to become a major shipping center for the surrounding area.
The town continued to grow throughout the 20th century, and by the 1970s, it had become a bedroom community for Kansas City. In the 1980s, Greenwood experienced a period of rapid growth due to the development of the nearby Kansas City International Airport.
Geography
Greenwood is located in Jackson County, Missouri, approximately 15 miles south of downtown Kansas City. The city is situated on the western edge of the Missouri River Valley, and it is bordered by the cities of Raytown and Grandview to the north, and by the cities of Lee's Summit and Independence to the south.
The city has a total area of 8.3 square miles, of which 8.2 square miles is land and 0.1 square miles is water. The terrain of Greenwood is mostly flat, with some rolling hills in the northern part of the city.
Economy
Greenwood is a bedroom community for Kansas City, and the majority of its residents commute to the city for work. The city's economy is largely based on retail and services, with a few manufacturing and industrial businesses located in the area.
The largest employers in Greenwood are Walmart, Target, and the Lee's Summit School District. Other major employers include the City of Greenwood, the Greenwood Police Department, and the Greenwood Fire Department.
Demographics
As of the 2019 census, the population of Greenwood was estimated to be 8,945. The racial makeup of the city was 79.2% White, 13.2% African American, 0.7% Native American, 1.7% Asian, 0.1% Pacific Islander, and 4.1% from other races. Hispanic or Latino of any race were 5.3% of the population.
The median household income in Greenwood was $60,945 in 2019, and the median family income was $68,945. The per capita income in Greenwood was $27,945. The poverty rate in Greenwood was 8.2%.
Conclusion
Greenwood, Missouri is a small city located in Jackson County, Missouri, United States. It is part of the Kansas City metropolitan area and is located approximately 15 miles south of downtown Kansas City. The population of Greenwood was estimated to be 8,945 in 2019. The city was founded in 1857 and has experienced rapid growth due to the development of the Kansas City Southern Railway and the Kansas City International Airport. The economy of Greenwood is largely based on retail and services, with a few manufacturing and industrial businesses located in the area. The population of Greenwood is mostly White, with a significant African American population. The median household income in Greenwood was $60,945 in 2019, and the poverty rate was 8.2%.
Common Questions
What is Per Capita Income in Greenwood?
Per Capita income in Greenwood is $43,074.
What is the Median Family Income in Greenwood?
Median Family Income in Greenwood is $112,500.
What is the Median Household income in Greenwood?
Median Household Income in Greenwood is $103,560.
What is Income or Wage Gap in Greenwood?
Income or Wage Gap in Greenwood is 15.9%.
Women in Greenwood earn 84.1 cents for every dollar earned by a man.
What is Inequality or Gini Index in Greenwood?
Inequality or Gini Index in Greenwood is 0.29.
What is the Total Population of Greenwood?
Total Population of Greenwood is 6,038.
What is the Total Male Population of Greenwood?
Total Male Population of Greenwood is 3,157.
What is the Total Female Population of Greenwood?
Total Female Population of Greenwood is 2,881.
What is the Ratio of Males per 100 Females in Greenwood?
There are 109.58 Males per 100 Females in Greenwood.
What is the Ratio of Females per 100 Males in Greenwood?
There are 91.26 Females per 100 Males in Greenwood.
What is the Median Population Age in Greenwood?
Median Population Age in Greenwood is 37.0 Years.
What is the Average Family Size in Greenwood
Average Family Size in Greenwood is 2.8 People.
What is the Average Household Size in Greenwood
Average Household Size in Greenwood is 2.8 People.
How Large is the Labor Force in Greenwood?
There are 3,704 People in the Labor Forcein in Greenwood.
What is the Percentage of People in the Labor Force in Greenwood?
76.6% of People are in the Labor Force in Greenwood.
What is the Unemployment Rate in Greenwood?
Unemployment Rate in Greenwood is 1.5%.