Granby, MO Map & Demographics
Granby Map
Granby Overview
$20,036
PER CAPITA INCOME
$47,841
AVG FAMILY INCOME
$34,934
AVG HOUSEHOLD INCOME
43.0%
WAGE / INCOME GAP [ % ]
57.0¢/ $1
WAGE / INCOME GAP [ $ ]
0.42
INEQUALITY / GINI INDEX
2,274
TOTAL POPULATION
1,165
MALE POPULATION
1,109
FEMALE POPULATION
105.05
MALES / 100 FEMALES
95.19
FEMALES / 100 MALES
38.4
MEDIAN AGE
3.1
AVG FAMILY SIZE
2.6
AVG HOUSEHOLD SIZE
1,074
LABOR FORCE [ PEOPLE ]
63.2%
PERCENT IN LABOR FORCE
14.5%
UNEMPLOYMENT RATE
Granby Zip Codes
Granby Area Codes
Income in Granby
Income Overview in Granby
Per Capita Income in Granby is $20,036, while median incomes of families and households are $47,841 and $34,934 respectively.
| Characteristic | Number | Measure |
| Per Capita Income | 2,274 | $20,036 |
| Median Family Income | 623 | $47,841 |
| Mean Family Income | 623 | $55,935 |
| Median Household Income | 837 | $34,934 |
| Mean Household Income | 837 | $49,402 |
| Income Deficit | 623 | $0 |
| Wage / Income Gap (%) | 2,274 | 42.98% |
| Wage / Income Gap ($) | 2,274 | 57.02¢ per $1 |
| Gini / Inequality Index | 2,274 | 0.42 |
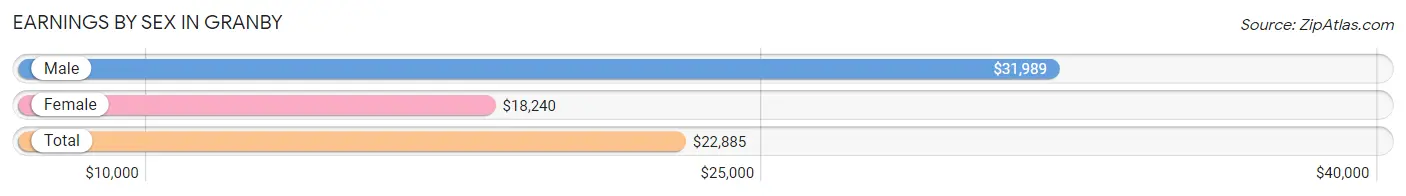
Earnings by Sex in Granby
Average Earnings in Granby are $22,885, $31,989 for men and $18,240 for women, a difference of 43.0%.
| Sex | Number | Average Earnings |
| Male | 605 (53.8%) | $31,989 |
| Female | 519 (46.2%) | $18,240 |
| Total | 1,124 (100.0%) | $22,885 |
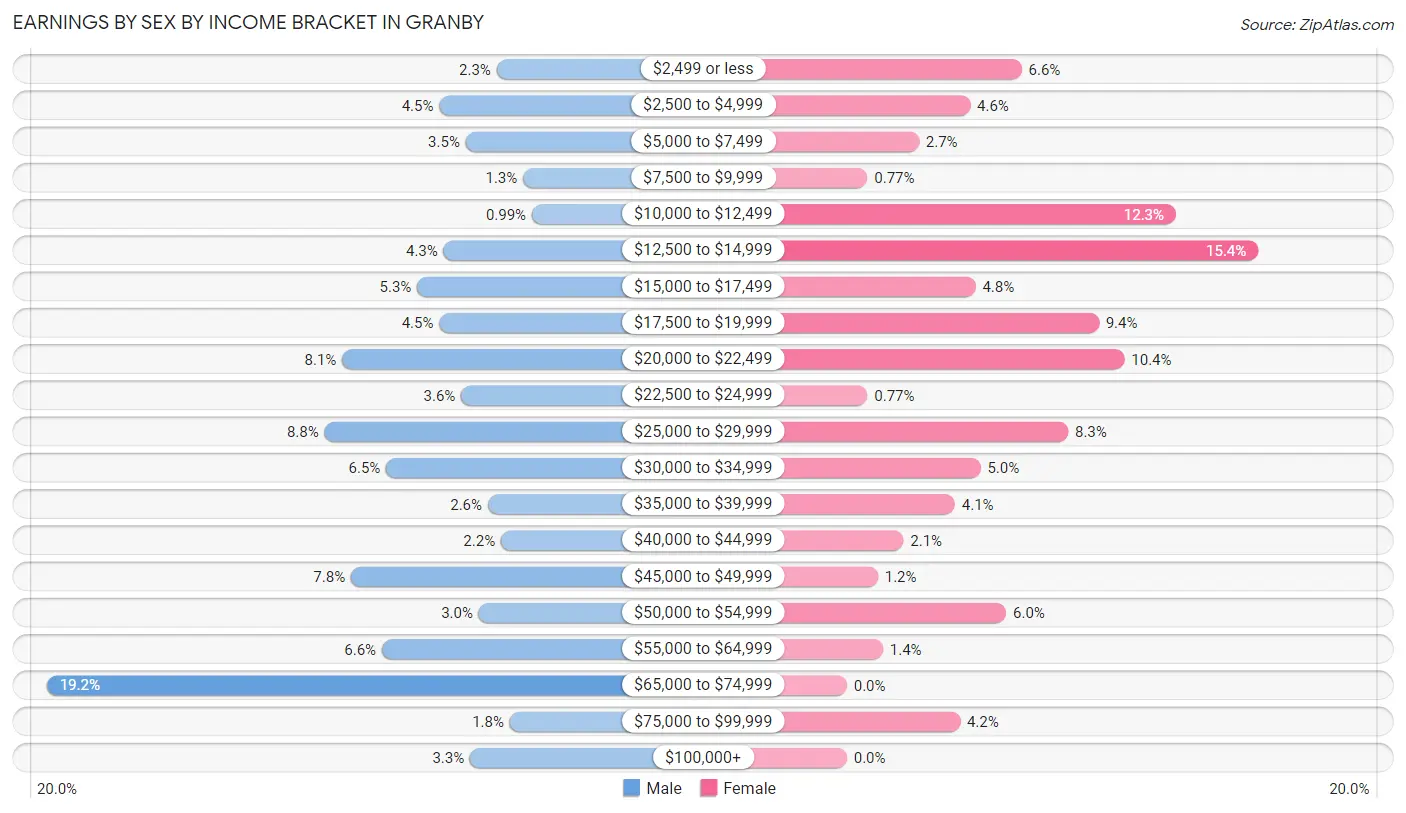
Earnings by Sex by Income Bracket in Granby
The most common earnings brackets in Granby are $65,000 to $74,999 for men (116 | 19.2%) and $12,500 to $14,999 for women (80 | 15.4%).
| Income | Male | Female |
| $2,499 or less | 14 (2.3%) | 34 (6.6%) |
| $2,500 to $4,999 | 27 (4.5%) | 24 (4.6%) |
| $5,000 to $7,499 | 21 (3.5%) | 14 (2.7%) |
| $7,500 to $9,999 | 8 (1.3%) | 4 (0.8%) |
| $10,000 to $12,499 | 6 (1.0%) | 64 (12.3%) |
| $12,500 to $14,999 | 26 (4.3%) | 80 (15.4%) |
| $15,000 to $17,499 | 32 (5.3%) | 25 (4.8%) |
| $17,500 to $19,999 | 27 (4.5%) | 49 (9.4%) |
| $20,000 to $22,499 | 49 (8.1%) | 54 (10.4%) |
| $22,500 to $24,999 | 22 (3.6%) | 4 (0.8%) |
| $25,000 to $29,999 | 53 (8.8%) | 43 (8.3%) |
| $30,000 to $34,999 | 39 (6.5%) | 26 (5.0%) |
| $35,000 to $39,999 | 16 (2.6%) | 21 (4.1%) |
| $40,000 to $44,999 | 13 (2.1%) | 11 (2.1%) |
| $45,000 to $49,999 | 47 (7.8%) | 6 (1.2%) |
| $50,000 to $54,999 | 18 (3.0%) | 31 (6.0%) |
| $55,000 to $64,999 | 40 (6.6%) | 7 (1.3%) |
| $65,000 to $74,999 | 116 (19.2%) | 0 (0.0%) |
| $75,000 to $99,999 | 11 (1.8%) | 22 (4.2%) |
| $100,000+ | 20 (3.3%) | 0 (0.0%) |
| Total | 605 (100.0%) | 519 (100.0%) |
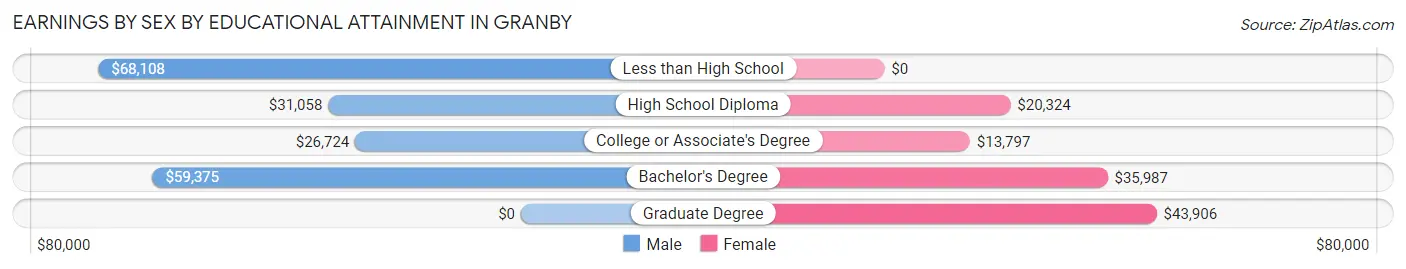
Earnings by Sex by Educational Attainment in Granby
Average earnings in Granby are $39,167 for men and $19,311 for women, a difference of 50.7%. Men with an educational attainment of less than high school enjoy the highest average annual earnings of $68,108, while those with college or associate's degree education earn the least with $26,724. Women with an educational attainment of graduate degree earn the most with the average annual earnings of $43,906, while those with college or associate's degree education have the smallest earnings of $13,797.
| Educational Attainment | Male Income | Female Income |
| Less than High School | $68,108 | $0 |
| High School Diploma | $31,058 | $20,324 |
| College or Associate's Degree | $26,724 | $13,797 |
| Bachelor's Degree | $59,375 | $35,987 |
| Graduate Degree | - | - |
| Total | $39,167 | $19,311 |
Family Income in Granby
Family Income Brackets in Granby
According to the Granby family income data, there are 124 families falling into the $75,000 to $99,999 income range, which is the most common income bracket and makes up 19.9% of all families. Conversely, the $150,000 to $199,999 income bracket is the least frequent group with only 6 families (1.0%) belonging to this category.
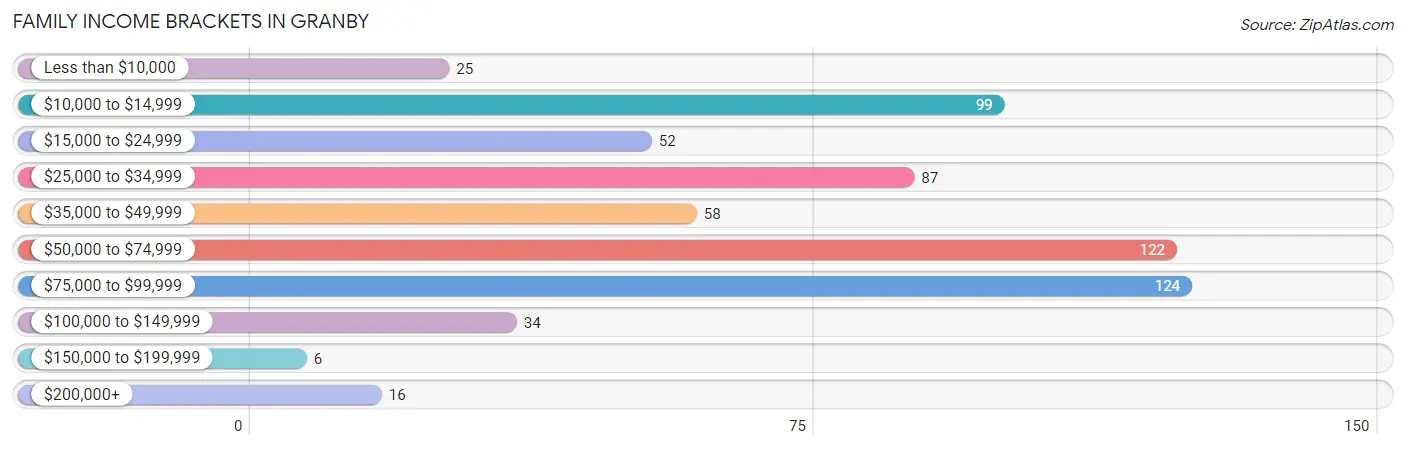
| Income Bracket | # Families | % Families |
| Less than $10,000 | 25 | 4.0% |
| $10,000 to $14,999 | 99 | 15.9% |
| $15,000 to $24,999 | 52 | 8.3% |
| $25,000 to $34,999 | 87 | 14.0% |
| $35,000 to $49,999 | 58 | 9.3% |
| $50,000 to $74,999 | 122 | 19.6% |
| $75,000 to $99,999 | 124 | 19.9% |
| $100,000 to $149,999 | 34 | 5.5% |
| $150,000 to $199,999 | 6 | 1.0% |
| $200,000+ | 16 | 2.6% |
Family Income by Famaliy Size in Granby
5-person families (39 | 6.3%) account for the highest median family income in Granby with $71,750 per family, while 2-person families (282 | 45.3%) have the highest median income of $24,643 per family member.
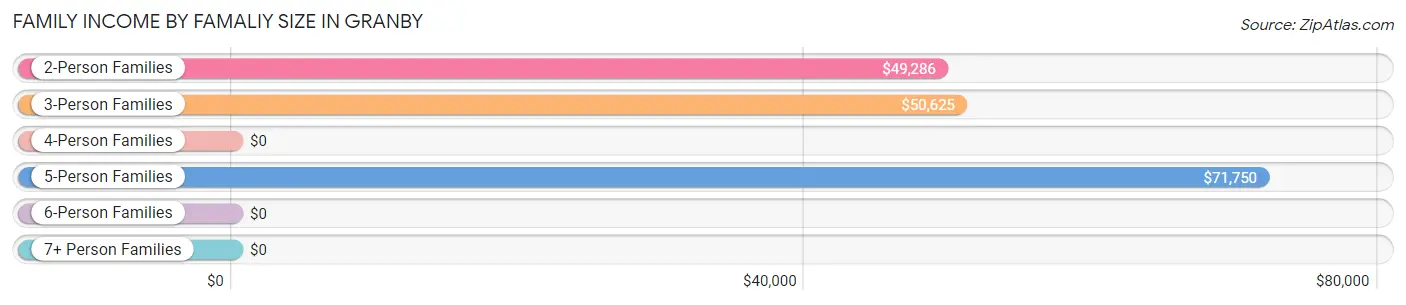
| Income Bracket | # Families | Median Income |
| 2-Person Families | 282 (45.3%) | $49,286 |
| 3-Person Families | 136 (21.8%) | $50,625 |
| 4-Person Families | 143 (23.0%) | $0 |
| 5-Person Families | 39 (6.3%) | $71,750 |
| 6-Person Families | 20 (3.2%) | $0 |
| 7+ Person Families | 3 (0.5%) | $0 |
| Total | 623 (100.0%) | $47,841 |
Family Income by Number of Earners in Granby
The median family income in Granby is $47,841, with families comprising 2 earners (213) having the highest median family income of $85,625, while families with 1 earner (286) have the lowest median family income of $25,700, accounting for 34.2% and 45.9% of families, respectively.
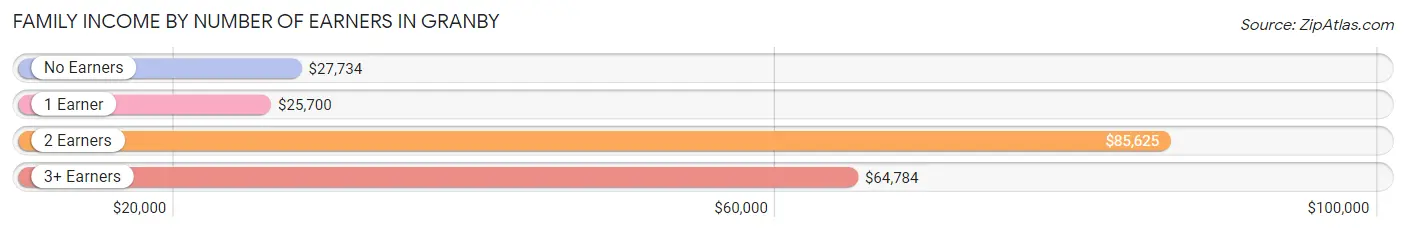
| Number of Earners | # Families | Median Income |
| No Earners | 65 (10.4%) | $27,734 |
| 1 Earner | 286 (45.9%) | $25,700 |
| 2 Earners | 213 (34.2%) | $85,625 |
| 3+ Earners | 59 (9.5%) | $64,784 |
| Total | 623 (100.0%) | $47,841 |
Household Income in Granby
Household Income Brackets in Granby
With 165 households falling in the category, the $25,000 to $34,999 income range is the most frequent in Granby, accounting for 19.7% of all households. In contrast, only 6 households (0.7%) fall into the $150,000 to $199,999 income bracket, making it the least populous group.
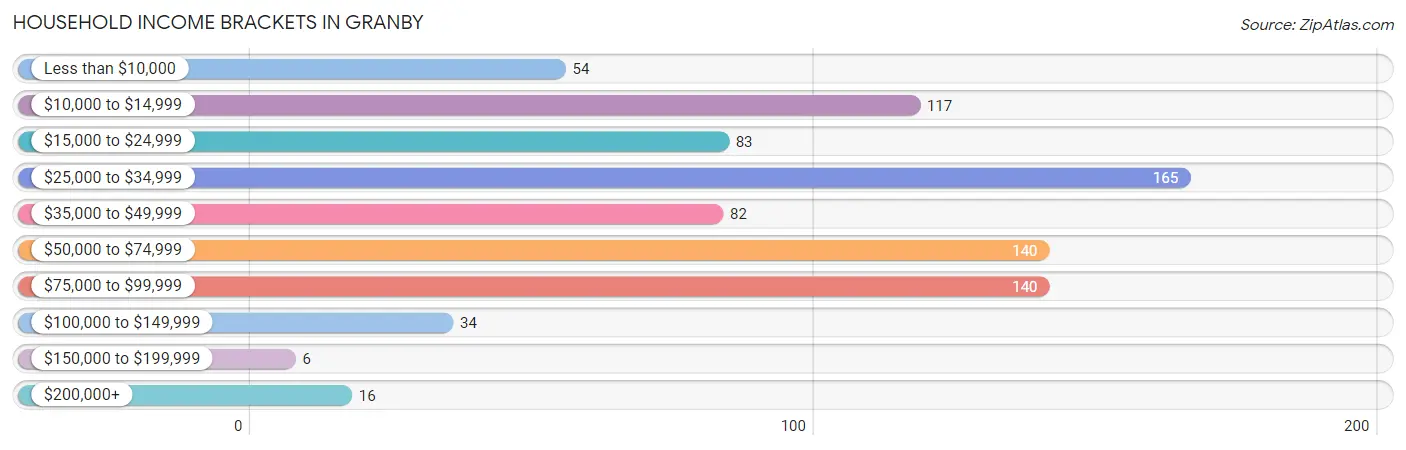
| Income Bracket | # Households | % Households |
| Less than $10,000 | 54 | 6.5% |
| $10,000 to $14,999 | 117 | 14.0% |
| $15,000 to $24,999 | 83 | 9.9% |
| $25,000 to $34,999 | 165 | 19.7% |
| $35,000 to $49,999 | 82 | 9.8% |
| $50,000 to $74,999 | 140 | 16.7% |
| $75,000 to $99,999 | 140 | 16.7% |
| $100,000 to $149,999 | 34 | 4.1% |
| $150,000 to $199,999 | 6 | 0.7% |
| $200,000+ | 16 | 1.9% |
Household Income by Householder Age in Granby
The median household income in Granby is $34,934, with the highest median household income of $48,125 found in the 45 to 64 years age bracket for the primary householder. A total of 280 households (33.5%) fall into this category. Meanwhile, the 15 to 24 years age bracket for the primary householder has the lowest median household income of $0, with 15 households (1.8%) in this group.
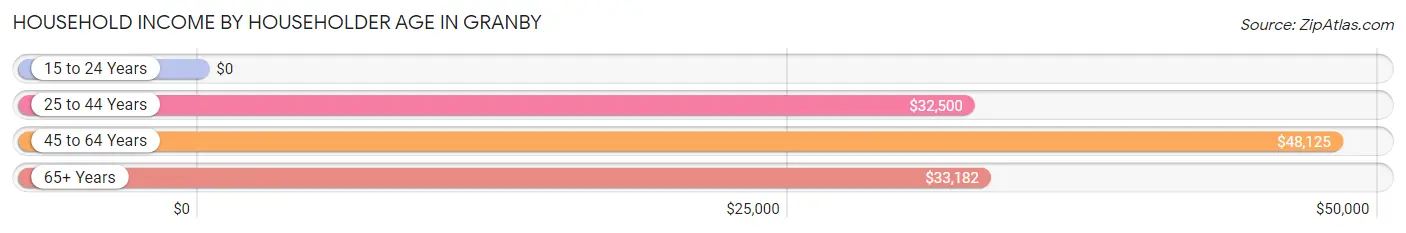
| Income Bracket | # Households | Median Income |
| 15 to 24 Years | 15 (1.8%) | $0 |
| 25 to 44 Years | 376 (44.9%) | $32,500 |
| 45 to 64 Years | 280 (33.5%) | $48,125 |
| 65+ Years | 166 (19.8%) | $33,182 |
| Total | 837 (100.0%) | $34,934 |
Poverty in Granby
Income Below Poverty by Sex and Age in Granby
With 29.6% poverty level for males and 31.6% for females among the residents of Granby, 5 year old males and 15 year old females are the most vulnerable to poverty, with 11 males (100.0%) and 50 females (76.9%) in their respective age groups living below the poverty level.
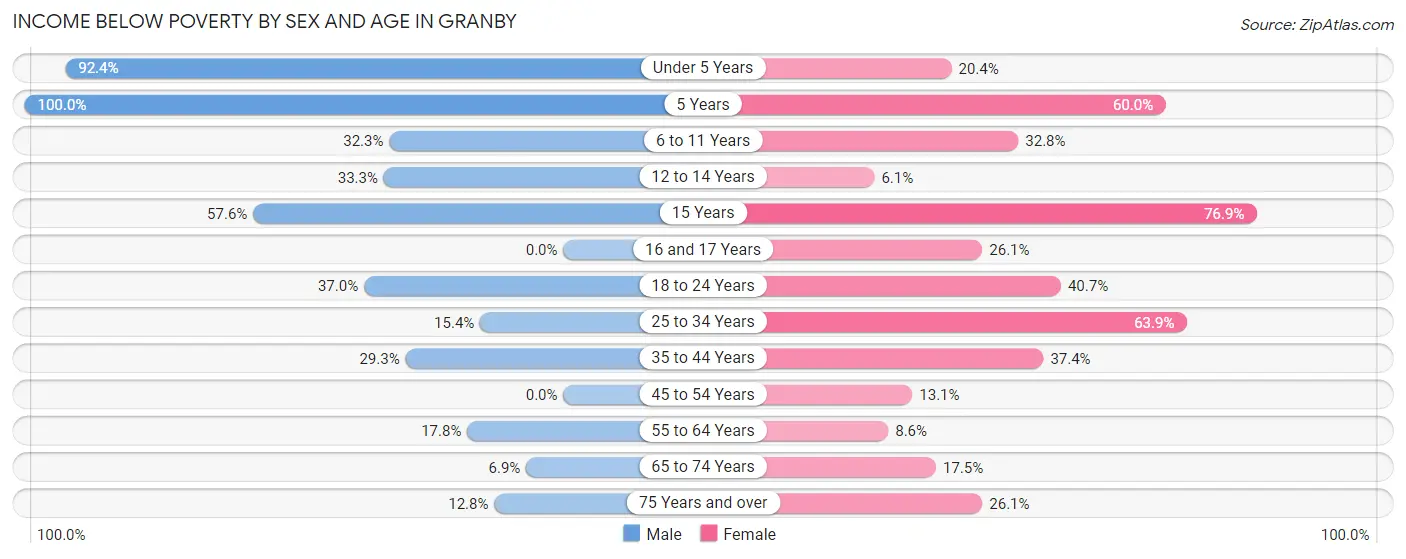
| Age Bracket | Male | Female |
| Under 5 Years | 110 (92.4%) | 11 (20.4%) |
| 5 Years | 11 (100.0%) | 6 (60.0%) |
| 6 to 11 Years | 21 (32.3%) | 39 (32.8%) |
| 12 to 14 Years | 15 (33.3%) | 2 (6.1%) |
| 15 Years | 19 (57.6%) | 50 (76.9%) |
| 16 and 17 Years | 0 (0.0%) | 6 (26.1%) |
| 18 to 24 Years | 37 (37.0%) | 24 (40.7%) |
| 25 to 34 Years | 23 (15.4%) | 78 (63.9%) |
| 35 to 44 Years | 46 (29.3%) | 64 (37.4%) |
| 45 to 54 Years | 0 (0.0%) | 19 (13.1%) |
| 55 to 64 Years | 43 (17.8%) | 12 (8.6%) |
| 65 to 74 Years | 6 (6.9%) | 14 (17.5%) |
| 75 Years and over | 5 (12.8%) | 12 (26.1%) |
| Total | 336 (29.6%) | 337 (31.6%) |
Income Above Poverty by Sex and Age in Granby
According to the poverty statistics in Granby, males aged 16 and 17 years and females aged 12 to 14 years are the age groups that are most secure financially, with 100.0% of males and 93.9% of females in these age groups living above the poverty line.
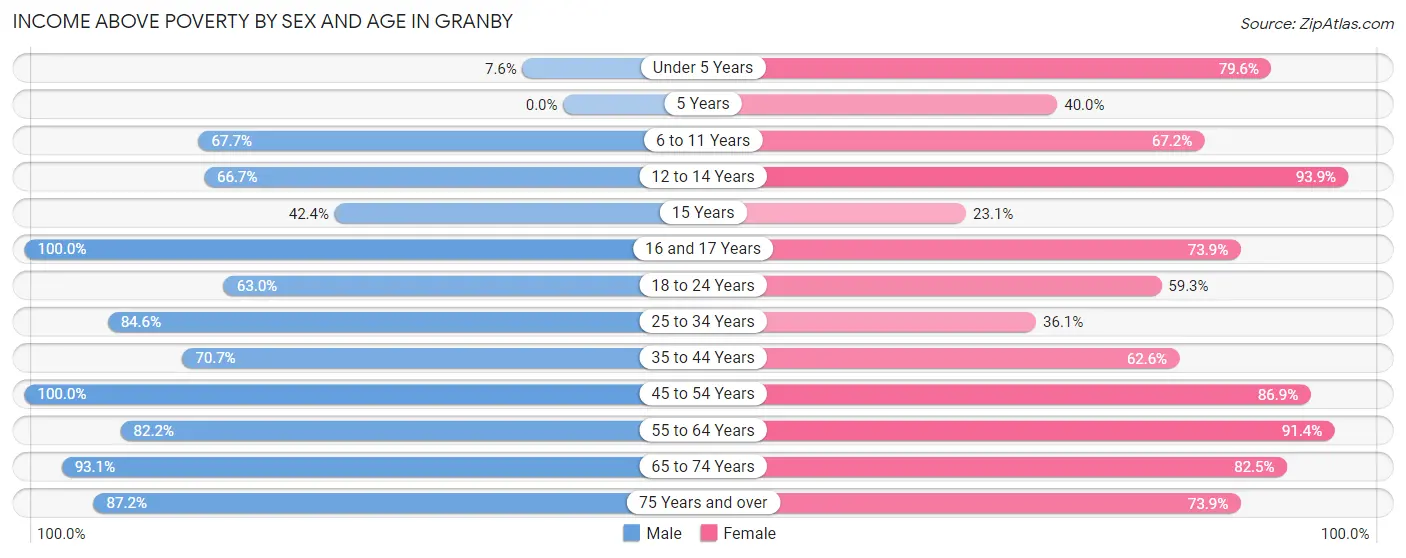
| Age Bracket | Male | Female |
| Under 5 Years | 9 (7.6%) | 43 (79.6%) |
| 5 Years | 0 (0.0%) | 4 (40.0%) |
| 6 to 11 Years | 44 (67.7%) | 80 (67.2%) |
| 12 to 14 Years | 30 (66.7%) | 31 (93.9%) |
| 15 Years | 14 (42.4%) | 15 (23.1%) |
| 16 and 17 Years | 20 (100.0%) | 17 (73.9%) |
| 18 to 24 Years | 63 (63.0%) | 35 (59.3%) |
| 25 to 34 Years | 126 (84.6%) | 44 (36.1%) |
| 35 to 44 Years | 111 (70.7%) | 107 (62.6%) |
| 45 to 54 Years | 70 (100.0%) | 126 (86.9%) |
| 55 to 64 Years | 198 (82.2%) | 127 (91.4%) |
| 65 to 74 Years | 81 (93.1%) | 66 (82.5%) |
| 75 Years and over | 34 (87.2%) | 34 (73.9%) |
| Total | 800 (70.4%) | 729 (68.4%) |
Income Below Poverty Among Married-Couple Families in Granby
The poverty statistics for married-couple families in Granby show that 20.8% or 97 of the total 467 families live below the poverty line. Families with 1 or 2 children have the highest poverty rate of 37.3%, comprising of 62 families. On the other hand, families with no children have the lowest poverty rate of 7.7%, which includes 20 families.
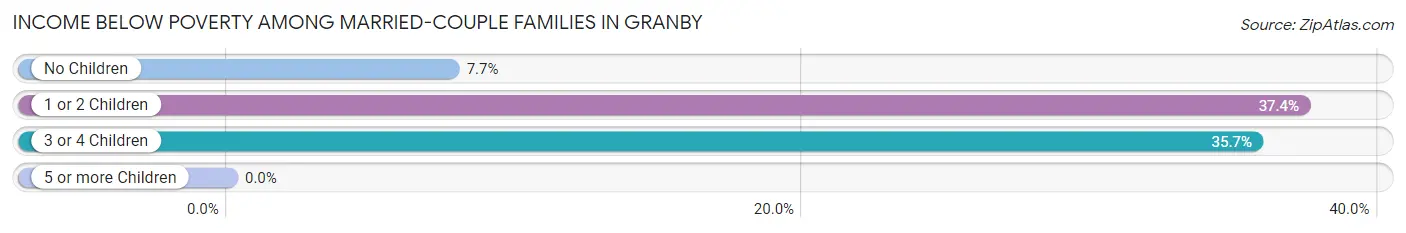
| Children | Above Poverty | Below Poverty |
| No Children | 239 (92.3%) | 20 (7.7%) |
| 1 or 2 Children | 104 (62.6%) | 62 (37.3%) |
| 3 or 4 Children | 27 (64.3%) | 15 (35.7%) |
| 5 or more Children | 0 (0.0%) | 0 (0.0%) |
| Total | 370 (79.2%) | 97 (20.8%) |
Income Below Poverty Among Single-Parent Households in Granby
According to the poverty data in Granby, 24.2% or 8 single-father households and 72.4% or 89 single-mother households are living below the poverty line. Among single-father households, those with 3 or 4 children have the highest poverty rate, with 8 households (100.0%) experiencing poverty. Likewise, among single-mother households, those with 1 or 2 children have the highest poverty rate, with 79 households (92.9%) falling below the poverty line.
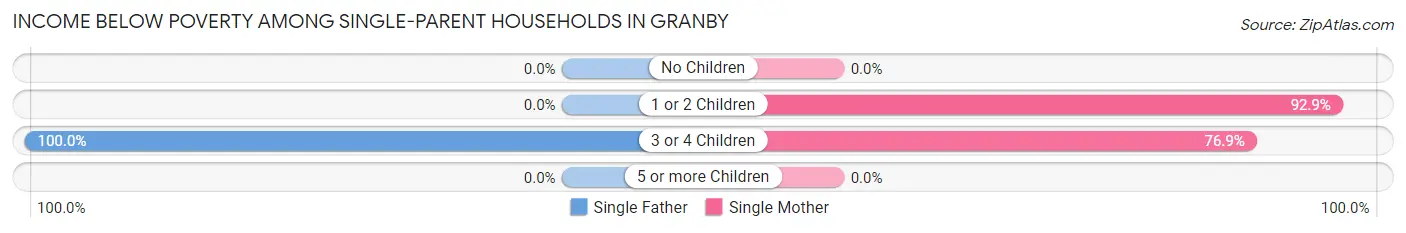
| Children | Single Father | Single Mother |
| No Children | 0 (0.0%) | 0 (0.0%) |
| 1 or 2 Children | 0 (0.0%) | 79 (92.9%) |
| 3 or 4 Children | 8 (100.0%) | 10 (76.9%) |
| 5 or more Children | 0 (0.0%) | 0 (0.0%) |
| Total | 8 (24.2%) | 89 (72.4%) |
Income Below Poverty Among Married-Couple vs Single-Parent Households in Granby
The poverty data for Granby shows that 97 of the married-couple family households (20.8%) and 97 of the single-parent households (62.2%) are living below the poverty level. Within the married-couple family households, those with 1 or 2 children have the highest poverty rate, with 62 households (37.3%) falling below the poverty line. Among the single-parent households, those with 3 or 4 children have the highest poverty rate, with 18 household (85.7%) living below poverty.
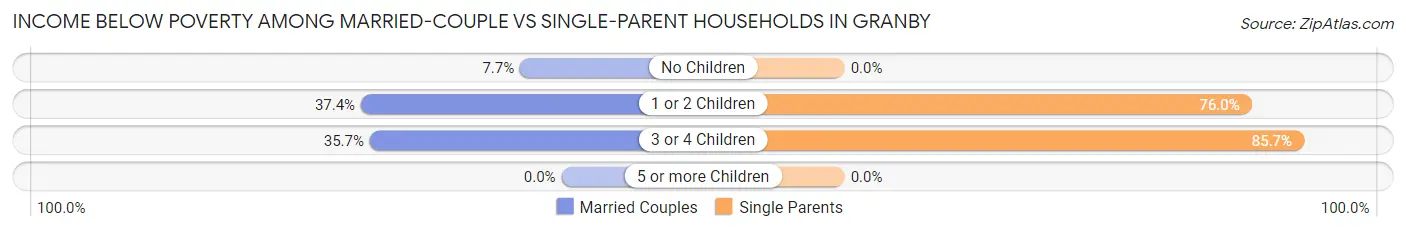
| Children | Married-Couple Families | Single-Parent Households |
| No Children | 20 (7.7%) | 0 (0.0%) |
| 1 or 2 Children | 62 (37.3%) | 79 (76.0%) |
| 3 or 4 Children | 15 (35.7%) | 18 (85.7%) |
| 5 or more Children | 0 (0.0%) | 0 (0.0%) |
| Total | 97 (20.8%) | 97 (62.2%) |
Race in Granby
The most populous races in Granby are White / Caucasian (1,911 | 84.0%), Two or more Races (293 | 12.9%), and Native / Alaskan (41 | 1.8%).
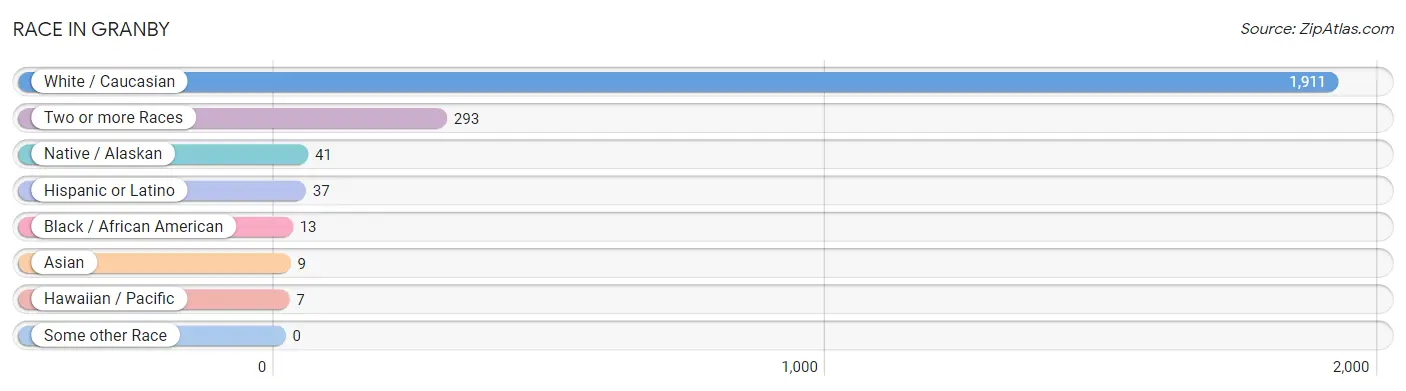
| Race | # Population | % Population |
| Asian | 9 | 0.4% |
| Black / African American | 13 | 0.6% |
| Hawaiian / Pacific | 7 | 0.3% |
| Hispanic or Latino | 37 | 1.6% |
| Native / Alaskan | 41 | 1.8% |
| White / Caucasian | 1,911 | 84.0% |
| Two or more Races | 293 | 12.9% |
| Some other Race | 0 | 0.0% |
| Total | 2,274 | 100.0% |
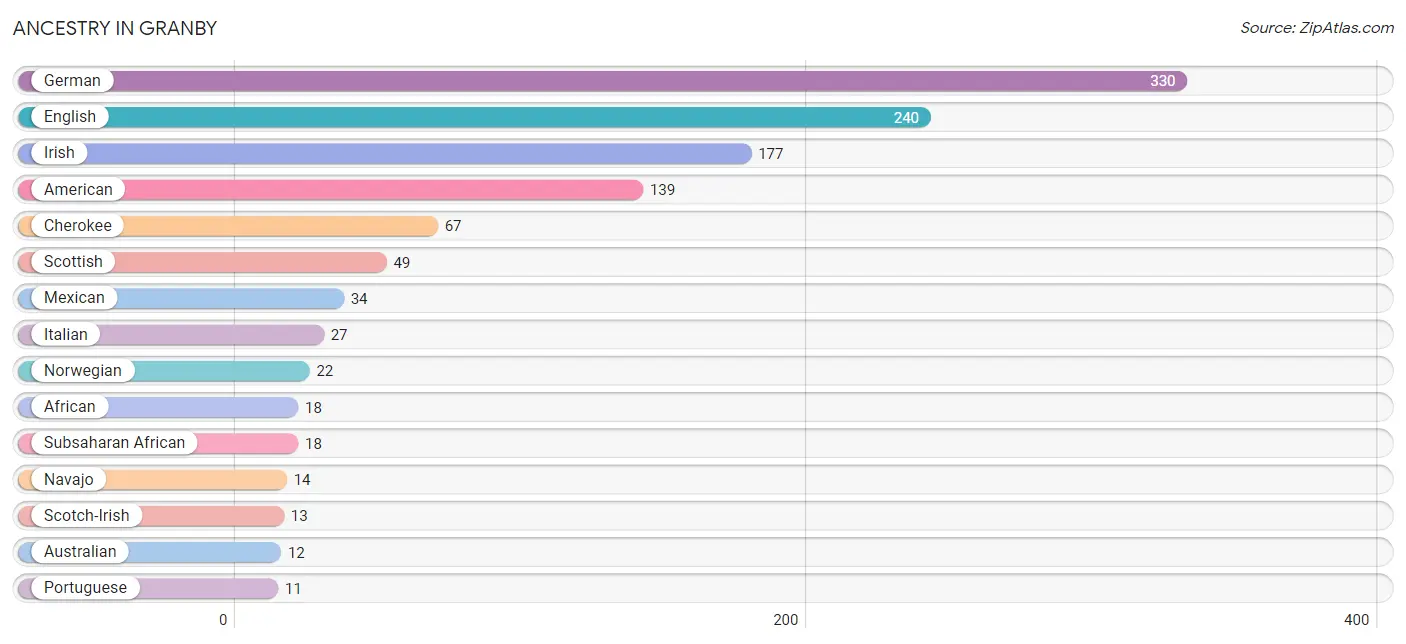
Ancestry in Granby
The most populous ancestries reported in Granby are German (330 | 14.5%), English (240 | 10.5%), Irish (177 | 7.8%), American (139 | 6.1%), and Cherokee (67 | 2.9%), together accounting for 41.9% of all Granby residents.
| Ancestry | # Population | % Population |
| African | 18 | 0.8% |
| American | 139 | 6.1% |
| Australian | 12 | 0.5% |
| Canadian | 5 | 0.2% |
| Central American | 3 | 0.1% |
| Cherokee | 67 | 2.9% |
| Czech | 6 | 0.3% |
| Dutch | 9 | 0.4% |
| English | 240 | 10.5% |
| European | 6 | 0.3% |
| French | 4 | 0.2% |
| German | 330 | 14.5% |
| Irish | 177 | 7.8% |
| Iroquois | 9 | 0.4% |
| Italian | 27 | 1.2% |
| Korean | 9 | 0.4% |
| Mexican | 34 | 1.5% |
| Navajo | 14 | 0.6% |
| Norwegian | 22 | 1.0% |
| Polish | 8 | 0.4% |
| Portuguese | 11 | 0.5% |
| Salvadoran | 3 | 0.1% |
| Scotch-Irish | 13 | 0.6% |
| Scottish | 49 | 2.1% |
| Slovak | 4 | 0.2% |
| Subsaharan African | 18 | 0.8% |
| Swedish | 7 | 0.3% |
| Welsh | 4 | 0.2% | View All 28 Rows |
Immigrants in Granby
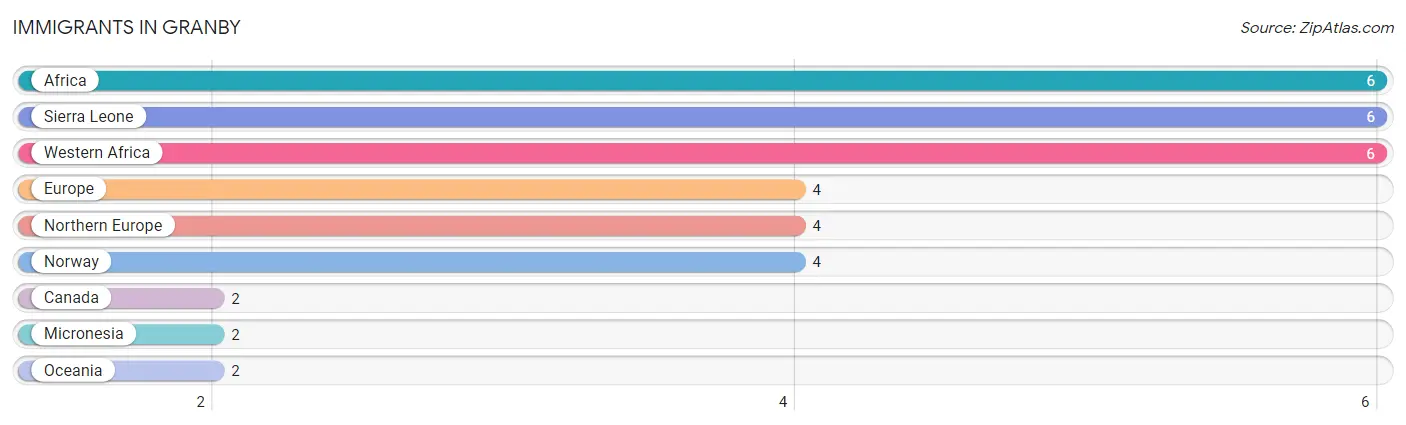
The most numerous immigrant groups reported in Granby came from Africa (6 | 0.3%), Sierra Leone (6 | 0.3%), Western Africa (6 | 0.3%), Europe (4 | 0.2%), and Northern Europe (4 | 0.2%), together accounting for 1.1% of all Granby residents.
| Immigration Origin | # Population | % Population |
| Africa | 6 | 0.3% |
| Canada | 2 | 0.1% |
| Europe | 4 | 0.2% |
| Micronesia | 2 | 0.1% |
| Northern Europe | 4 | 0.2% |
| Norway | 4 | 0.2% |
| Oceania | 2 | 0.1% |
| Sierra Leone | 6 | 0.3% |
| Western Africa | 6 | 0.3% | View All 9 Rows |
Sex and Age in Granby
Sex and Age in Granby
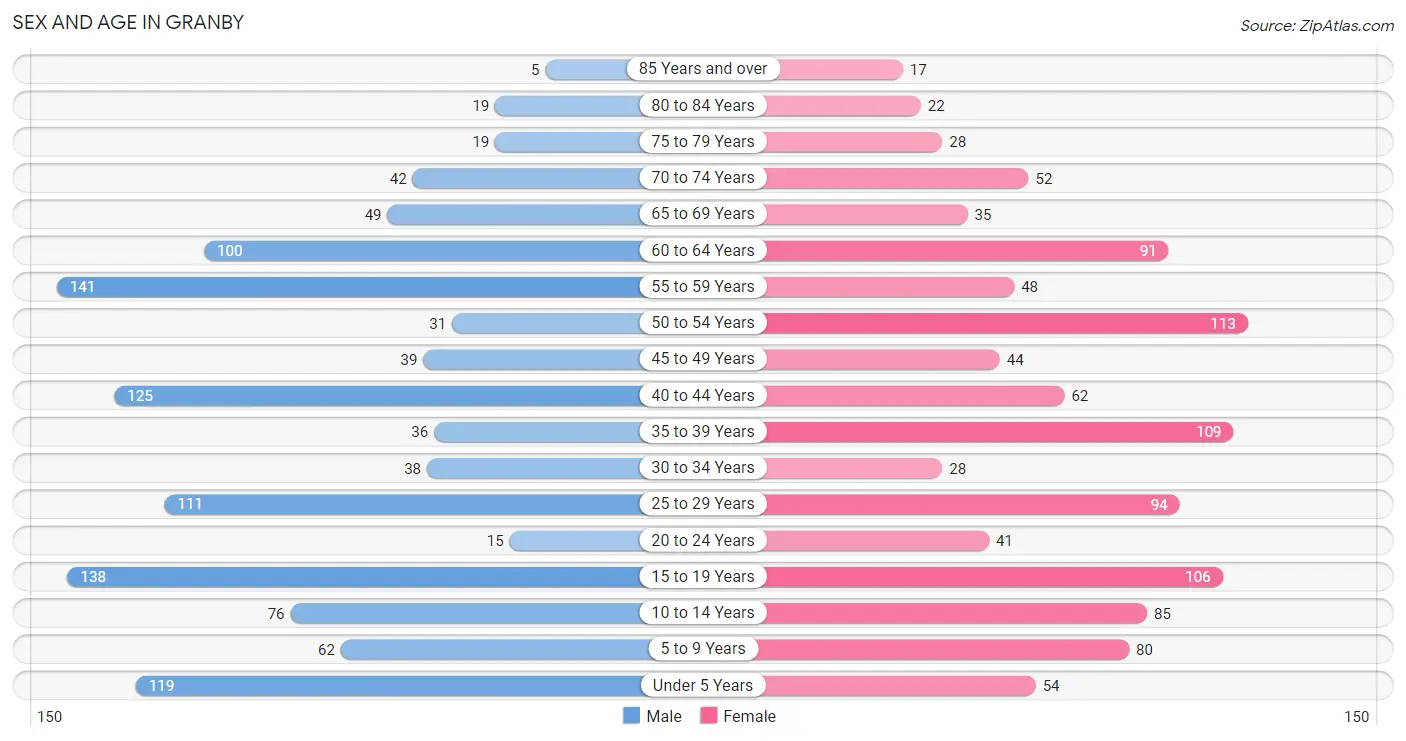
The most populous age groups in Granby are 55 to 59 Years (141 | 12.1%) for men and 50 to 54 Years (113 | 10.2%) for women.
| Age Bracket | Male | Female |
| Under 5 Years | 119 (10.2%) | 54 (4.9%) |
| 5 to 9 Years | 62 (5.3%) | 80 (7.2%) |
| 10 to 14 Years | 76 (6.5%) | 85 (7.7%) |
| 15 to 19 Years | 138 (11.8%) | 106 (9.6%) |
| 20 to 24 Years | 15 (1.3%) | 41 (3.7%) |
| 25 to 29 Years | 111 (9.5%) | 94 (8.5%) |
| 30 to 34 Years | 38 (3.3%) | 28 (2.5%) |
| 35 to 39 Years | 36 (3.1%) | 109 (9.8%) |
| 40 to 44 Years | 125 (10.7%) | 62 (5.6%) |
| 45 to 49 Years | 39 (3.4%) | 44 (4.0%) |
| 50 to 54 Years | 31 (2.7%) | 113 (10.2%) |
| 55 to 59 Years | 141 (12.1%) | 48 (4.3%) |
| 60 to 64 Years | 100 (8.6%) | 91 (8.2%) |
| 65 to 69 Years | 49 (4.2%) | 35 (3.2%) |
| 70 to 74 Years | 42 (3.6%) | 52 (4.7%) |
| 75 to 79 Years | 19 (1.6%) | 28 (2.5%) |
| 80 to 84 Years | 19 (1.6%) | 22 (2.0%) |
| 85 Years and over | 5 (0.4%) | 17 (1.5%) |
| Total | 1,165 (100.0%) | 1,109 (100.0%) |
Families and Households in Granby
Median Family Size in Granby
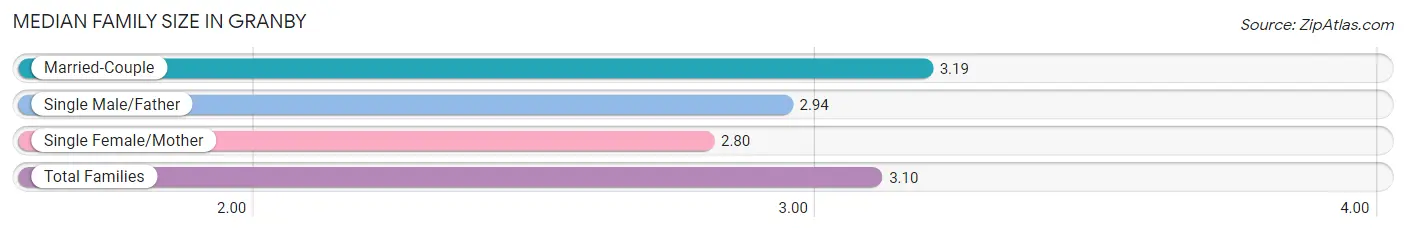
The median family size in Granby is 3.10 persons per family, with married-couple families (467 | 75.0%) accounting for the largest median family size of 3.19 persons per family. On the other hand, single female/mother families (123 | 19.7%) represent the smallest median family size with 2.80 persons per family.
| Family Type | # Families | Family Size |
| Married-Couple | 467 (75.0%) | 3.19 |
| Single Male/Father | 33 (5.3%) | 2.94 |
| Single Female/Mother | 123 (19.7%) | 2.80 |
| Total Families | 623 (100.0%) | 3.10 |
Median Household Size in Granby
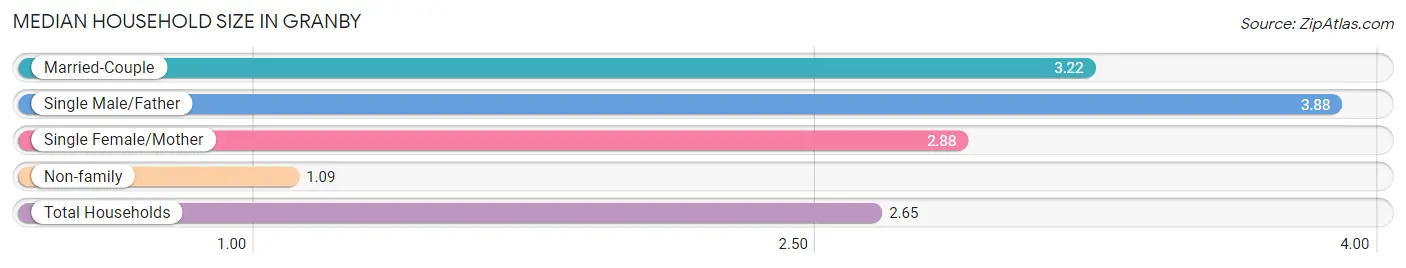
The median household size in Granby is 2.65 persons per household, with single male/father households (33 | 3.9%) accounting for the largest median household size of 3.88 persons per household. non-family households (214 | 25.6%) represent the smallest median household size with 1.09 persons per household.
| Household Type | # Households | Household Size |
| Married-Couple | 467 (55.8%) | 3.22 |
| Single Male/Father | 33 (3.9%) | 3.88 |
| Single Female/Mother | 123 (14.7%) | 2.88 |
| Non-family | 214 (25.6%) | 1.09 |
| Total Households | 837 (100.0%) | 2.65 |
Household Size by Marriage Status in Granby
Out of a total of 837 households in Granby, 623 (74.4%) are family households, while 214 (25.6%) are nonfamily households. The most numerous type of family households are 2-person households, comprising 264, and the most common type of nonfamily households are 1-person households, comprising 185.
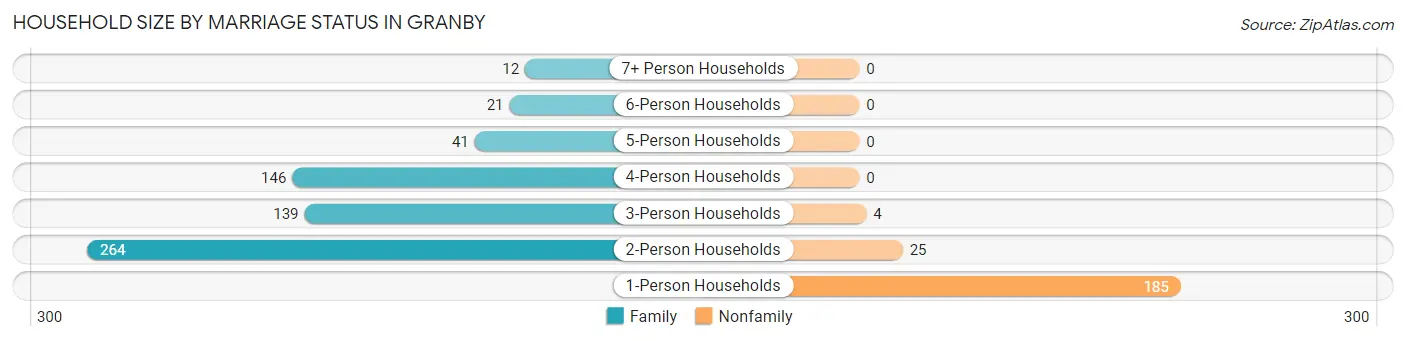
| Household Size | Family Households | Nonfamily Households |
| 1-Person Households | - | 185 (22.1%) |
| 2-Person Households | 264 (31.5%) | 25 (3.0%) |
| 3-Person Households | 139 (16.6%) | 4 (0.5%) |
| 4-Person Households | 146 (17.4%) | 0 (0.0%) |
| 5-Person Households | 41 (4.9%) | 0 (0.0%) |
| 6-Person Households | 21 (2.5%) | 0 (0.0%) |
| 7+ Person Households | 12 (1.4%) | 0 (0.0%) |
| Total | 623 (74.4%) | 214 (25.6%) |
Female Fertility in Granby
Fertility by Age in Granby
Average fertility rate in Granby is 73.0 births per 1,000 women. Women in the age bracket of 20 to 34 years have the highest fertility rate with 141.0 births per 1,000 women. Women in the age bracket of 20 to 34 years acount for 63.9% of all women with births.
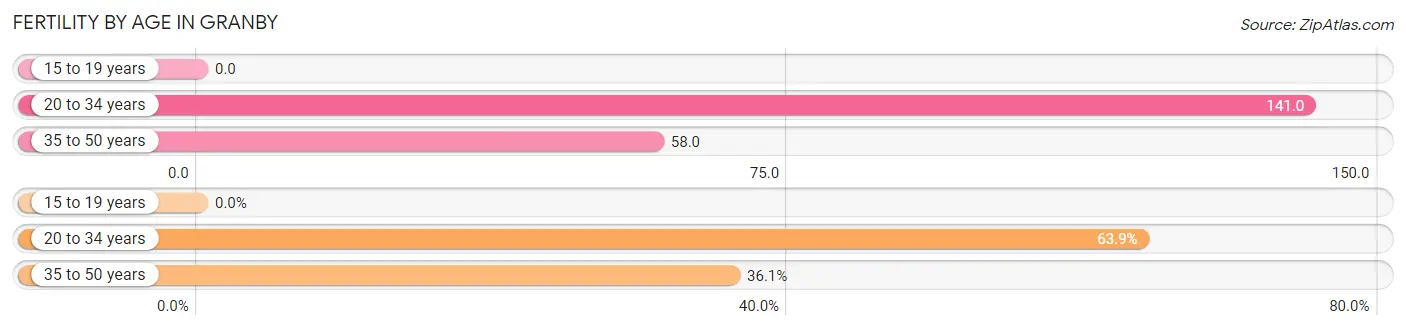
| Age Bracket | Women with Births | Births / 1,000 Women |
| 15 to 19 years | 0 (0.0%) | 0.0 |
| 20 to 34 years | 23 (63.9%) | 141.0 |
| 35 to 50 years | 13 (36.1%) | 58.0 |
| Total | 36 (100.0%) | 73.0 |
Fertility by Age by Marriage Status in Granby
50.0% of women with births (36) in Granby are married. The highest percentage of unmarried women with births falls into 35 to 50 years age bracket with 69.2% of them unmarried at the time of birth, while the lowest percentage of unmarried women with births belong to 20 to 34 years age bracket with 39.1% of them unmarried.
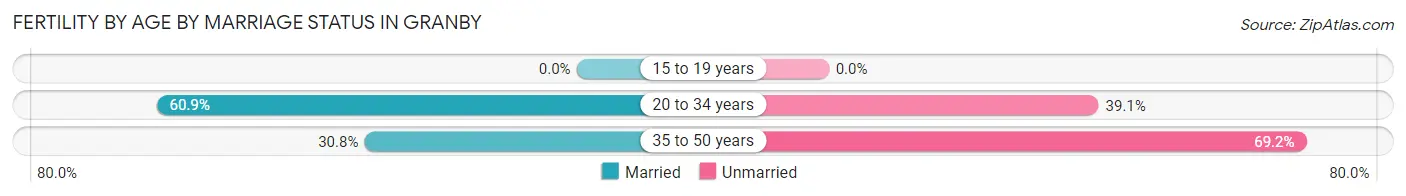
| Age Bracket | Married | Unmarried |
| 15 to 19 years | 0 (0.0%) | 0 (0.0%) |
| 20 to 34 years | 14 (60.9%) | 9 (39.1%) |
| 35 to 50 years | 4 (30.8%) | 9 (69.2%) |
| Total | 18 (50.0%) | 18 (50.0%) |
Fertility by Education in Granby
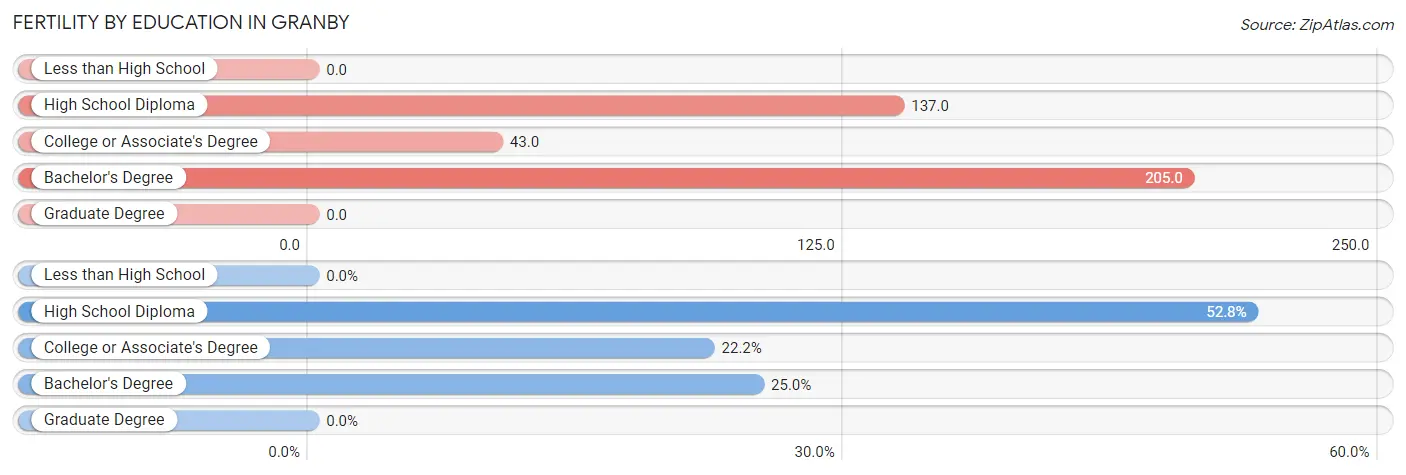
| Educational Attainment | Women with Births | Births / 1,000 Women |
| Less than High School | 0 (0.0%) | 0.0 |
| High School Diploma | 19 (52.8%) | 137.0 |
| College or Associate's Degree | 8 (22.2%) | 43.0 |
| Bachelor's Degree | 9 (25.0%) | 205.0 |
| Graduate Degree | 0 (0.0%) | 0.0 |
| Total | 36 (100.0%) | 73.0 |
Fertility by Education by Marriage Status in Granby
50.0% of women with births in Granby are unmarried. Women with the educational attainment of college or associate's degree are most likely to be married with 100.0% of them married at childbirth, while women with the educational attainment of bachelor's degree are least likely to be married with 100.0% of them unmarried at childbirth.
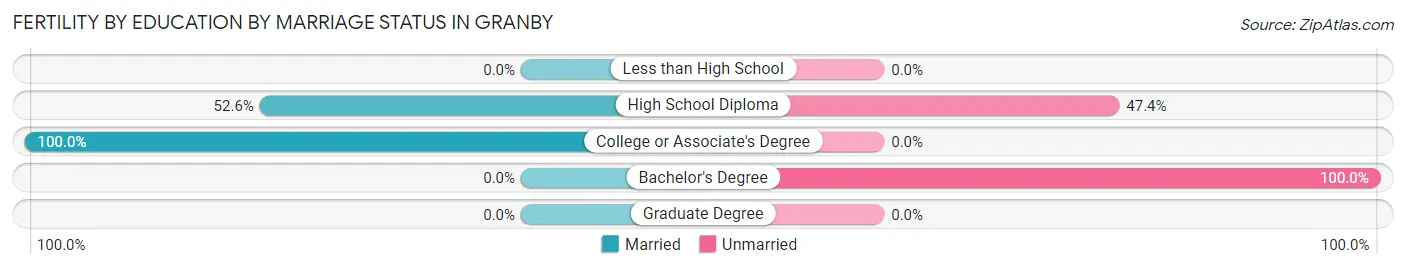
| Educational Attainment | Married | Unmarried |
| Less than High School | 0 (0.0%) | 0 (0.0%) |
| High School Diploma | 10 (52.6%) | 9 (47.4%) |
| College or Associate's Degree | 8 (100.0%) | 0 (0.0%) |
| Bachelor's Degree | 0 (0.0%) | 9 (100.0%) |
| Graduate Degree | 0 (0.0%) | 0 (0.0%) |
| Total | 18 (50.0%) | 18 (50.0%) |
Employment Characteristics in Granby
Employment by Class of Employer in Granby
Among the 915 employed individuals in Granby, private company employees (722 | 78.9%), not-for-profit organizations (54 | 5.9%), and local government employees (40 | 4.4%) make up the most common classes of employment.
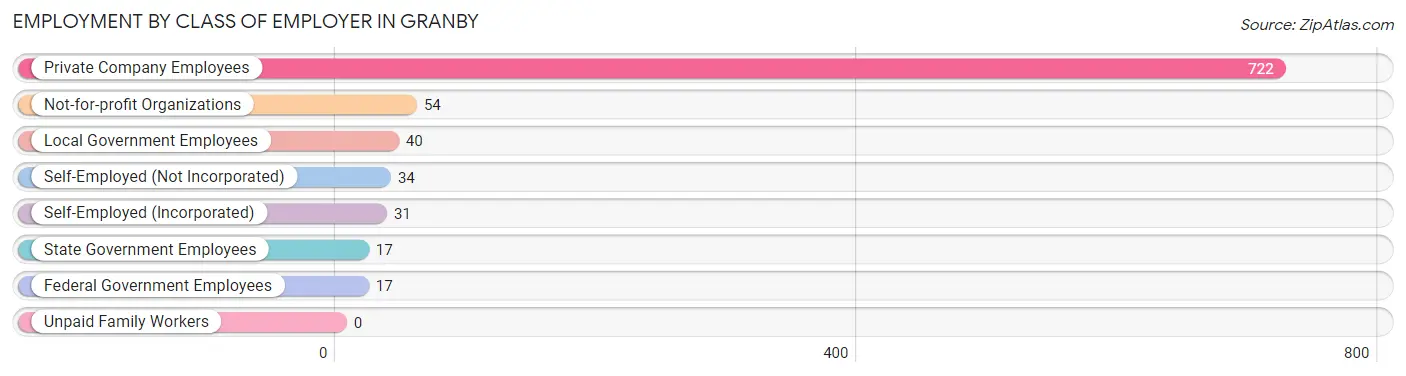
| Employer Class | # Employees | % Employees |
| Private Company Employees | 722 | 78.9% |
| Self-Employed (Incorporated) | 31 | 3.4% |
| Self-Employed (Not Incorporated) | 34 | 3.7% |
| Not-for-profit Organizations | 54 | 5.9% |
| Local Government Employees | 40 | 4.4% |
| State Government Employees | 17 | 1.9% |
| Federal Government Employees | 17 | 1.9% |
| Unpaid Family Workers | 0 | 0.0% |
| Total | 915 | 100.0% |
Employment Status by Age in Granby
According to the labor force statistics for Granby, out of the total population over 16 years of age (1,700), 63.2% or 1,074 individuals are in the labor force, with 14.5% or 156 of them unemployed. The age group with the highest labor force participation rate is 25 to 29 years, with 88.8% or 182 individuals in the labor force. Within the labor force, the 16 to 19 years age range has the highest percentage of unemployed individuals, with 39.6% or 38 of them being unemployed.
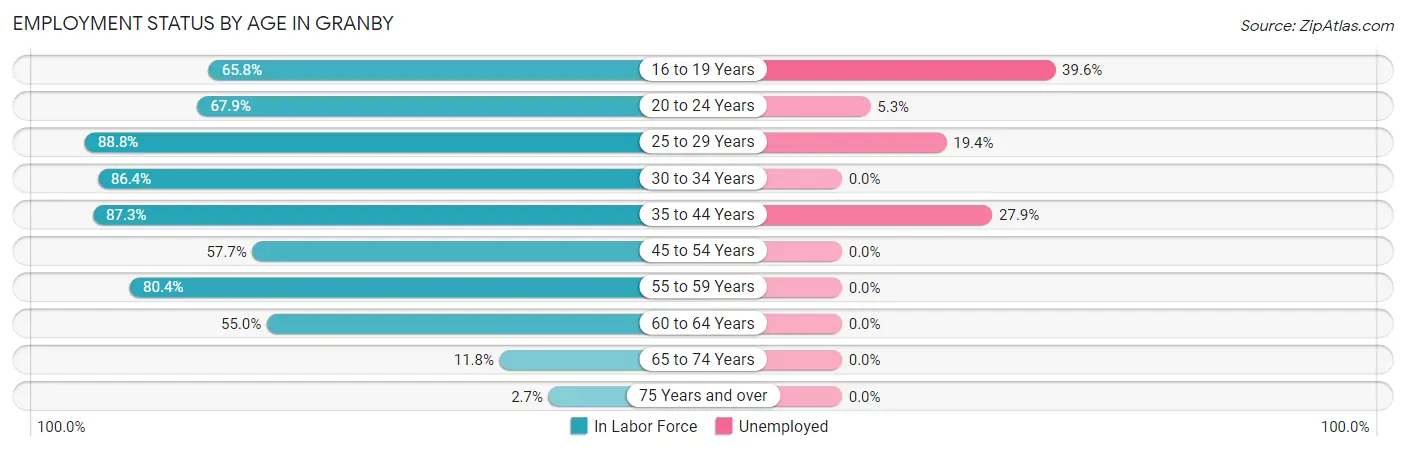
| Age Bracket | In Labor Force | Unemployed |
| 16 to 19 Years | 96 (65.8%) | 38 (39.6%) |
| 20 to 24 Years | 38 (67.9%) | 2 (5.3%) |
| 25 to 29 Years | 182 (88.8%) | 35 (19.4%) |
| 30 to 34 Years | 57 (86.4%) | 0 (0.0%) |
| 35 to 44 Years | 290 (87.3%) | 81 (27.9%) |
| 45 to 54 Years | 131 (57.7%) | 0 (0.0%) |
| 55 to 59 Years | 152 (80.4%) | 0 (0.0%) |
| 60 to 64 Years | 105 (55.0%) | 0 (0.0%) |
| 65 to 74 Years | 21 (11.8%) | 0 (0.0%) |
| 75 Years and over | 3 (2.7%) | 0 (0.0%) |
| Total | 1,074 (63.2%) | 156 (14.5%) |
Employment Status by Educational Attainment in Granby
According to labor force statistics for Granby, 75.8% of individuals (917) out of the total population between 25 and 64 years of age (1,210) are in the labor force, with 12.6% or 116 of them being unemployed. The group with the highest labor force participation rate are those with the educational attainment of college / associate degree, with 82.2% or 296 individuals in the labor force. Within the labor force, individuals with less than high school education have the highest percentage of unemployment, with 16.4% or 24 of them being unemployed.
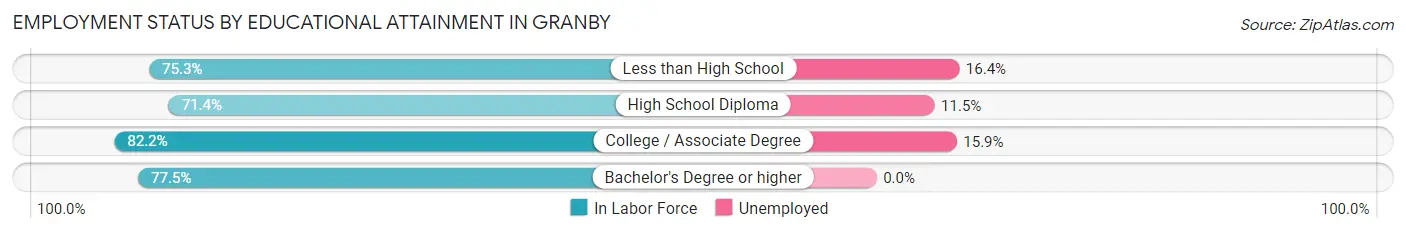
| Educational Attainment | In Labor Force | Unemployed |
| Less than High School | 146 (75.3%) | 32 (16.4%) |
| High School Diploma | 389 (71.4%) | 63 (11.5%) |
| College / Associate Degree | 296 (82.2%) | 57 (15.9%) |
| Bachelor's Degree or higher | 86 (77.5%) | 0 (0.0%) |
| Total | 917 (75.8%) | 152 (12.6%) |
Employment Occupations by Sex in Granby
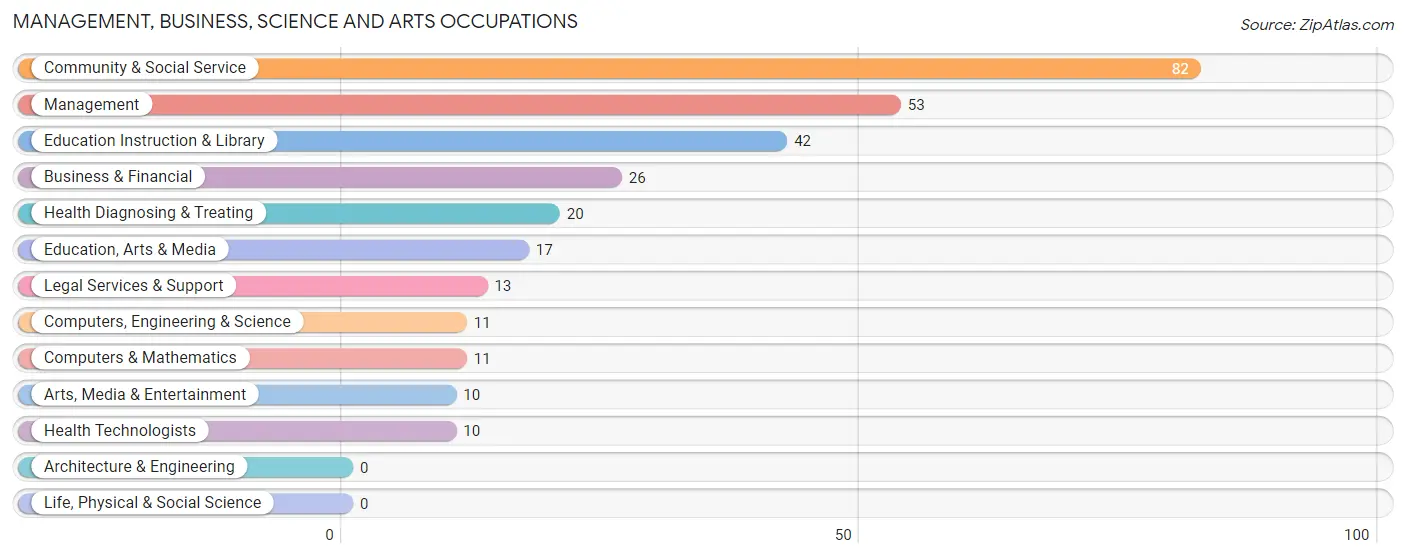
Management, Business, Science and Arts Occupations
The most common Management, Business, Science and Arts occupations in Granby are Community & Social Service (82 | 9.0%), Management (53 | 5.8%), Education Instruction & Library (42 | 4.6%), Business & Financial (26 | 2.9%), and Health Diagnosing & Treating (20 | 2.2%).
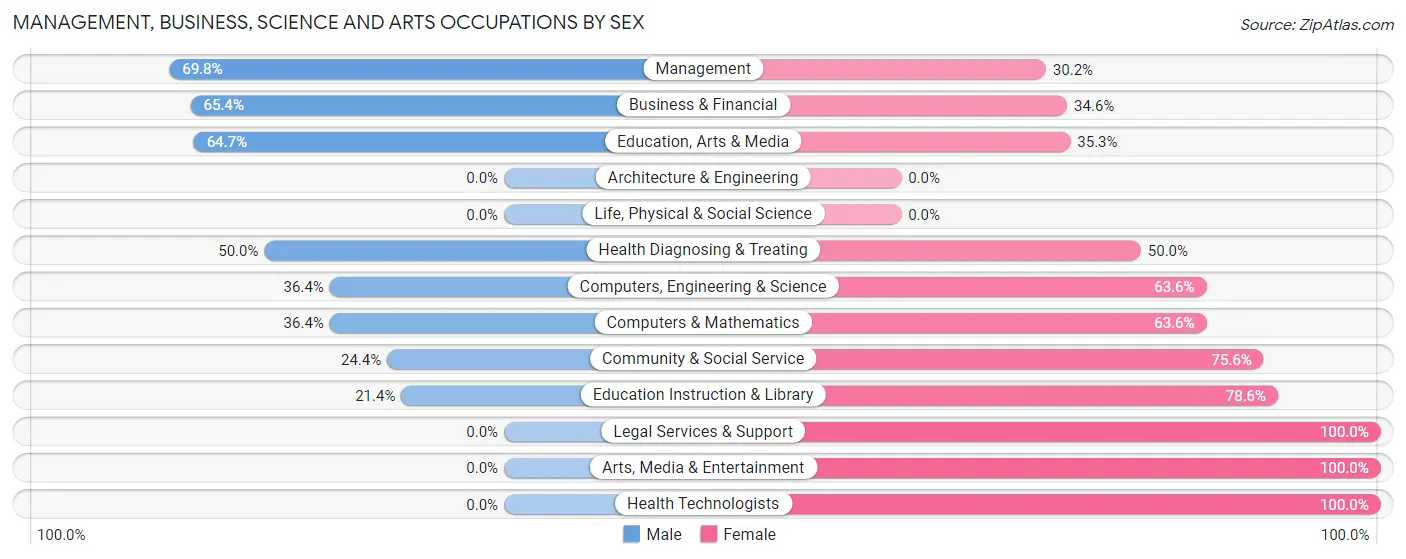
Management, Business, Science and Arts Occupations by Sex
Within the Management, Business, Science and Arts occupations in Granby, the most male-oriented occupations are Management (69.8%), Business & Financial (65.4%), and Education, Arts & Media (64.7%), while the most female-oriented occupations are Legal Services & Support (100.0%), Arts, Media & Entertainment (100.0%), and Health Technologists (100.0%).
| Occupation | Male | Female |
| Management | 37 (69.8%) | 16 (30.2%) |
| Business & Financial | 17 (65.4%) | 9 (34.6%) |
| Computers, Engineering & Science | 4 (36.4%) | 7 (63.6%) |
| Computers & Mathematics | 4 (36.4%) | 7 (63.6%) |
| Architecture & Engineering | 0 (0.0%) | 0 (0.0%) |
| Life, Physical & Social Science | 0 (0.0%) | 0 (0.0%) |
| Community & Social Service | 20 (24.4%) | 62 (75.6%) |
| Education, Arts & Media | 11 (64.7%) | 6 (35.3%) |
| Legal Services & Support | 0 (0.0%) | 13 (100.0%) |
| Education Instruction & Library | 9 (21.4%) | 33 (78.6%) |
| Arts, Media & Entertainment | 0 (0.0%) | 10 (100.0%) |
| Health Diagnosing & Treating | 10 (50.0%) | 10 (50.0%) |
| Health Technologists | 0 (0.0%) | 10 (100.0%) |
| Total (Category) | 88 (45.8%) | 104 (54.2%) |
| Total (Overall) | 524 (57.4%) | 389 (42.6%) |
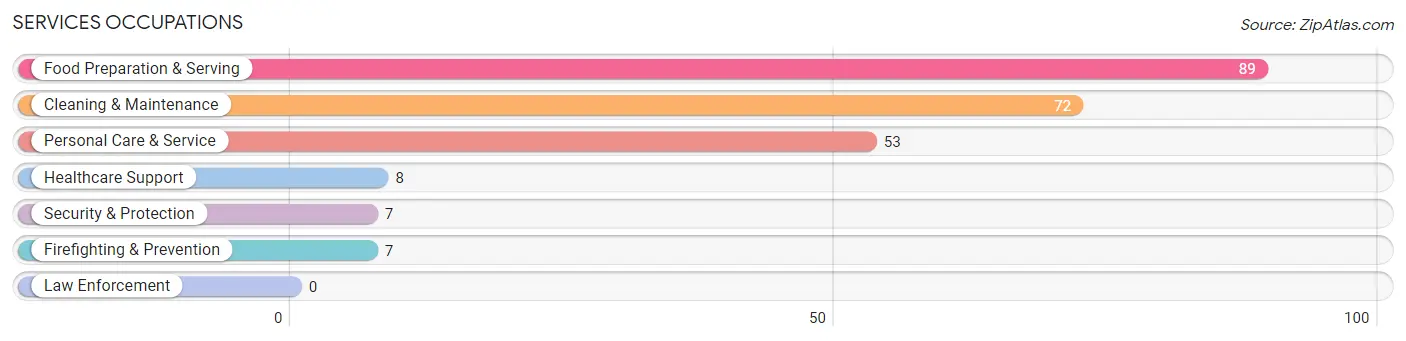
Services Occupations
The most common Services occupations in Granby are Food Preparation & Serving (89 | 9.8%), Cleaning & Maintenance (72 | 7.9%), Personal Care & Service (53 | 5.8%), Healthcare Support (8 | 0.9%), and Security & Protection (7 | 0.8%).
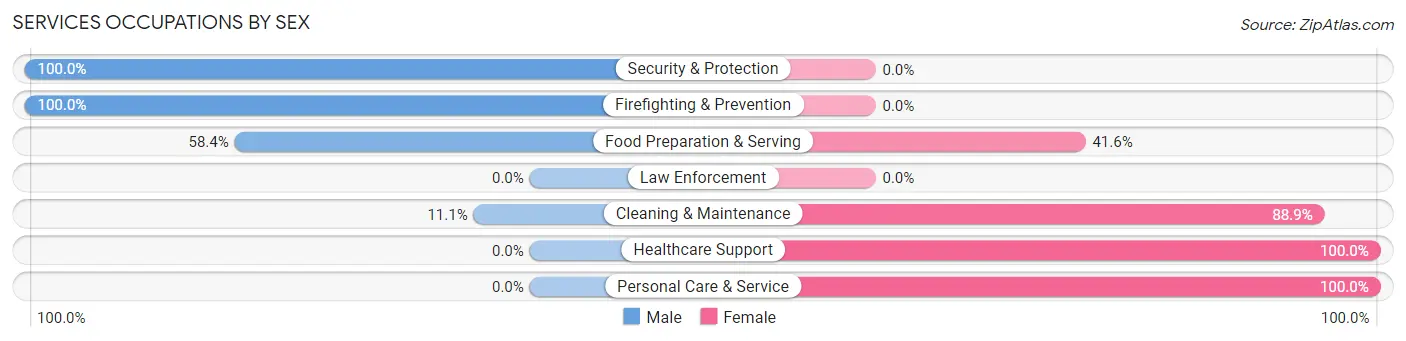
Services Occupations by Sex
Within the Services occupations in Granby, the most male-oriented occupations are Security & Protection (100.0%), Firefighting & Prevention (100.0%), and Food Preparation & Serving (58.4%), while the most female-oriented occupations are Healthcare Support (100.0%), Personal Care & Service (100.0%), and Cleaning & Maintenance (88.9%).
| Occupation | Male | Female |
| Healthcare Support | 0 (0.0%) | 8 (100.0%) |
| Security & Protection | 7 (100.0%) | 0 (0.0%) |
| Firefighting & Prevention | 7 (100.0%) | 0 (0.0%) |
| Law Enforcement | 0 (0.0%) | 0 (0.0%) |
| Food Preparation & Serving | 52 (58.4%) | 37 (41.6%) |
| Cleaning & Maintenance | 8 (11.1%) | 64 (88.9%) |
| Personal Care & Service | 0 (0.0%) | 53 (100.0%) |
| Total (Category) | 67 (29.3%) | 162 (70.7%) |
| Total (Overall) | 524 (57.4%) | 389 (42.6%) |
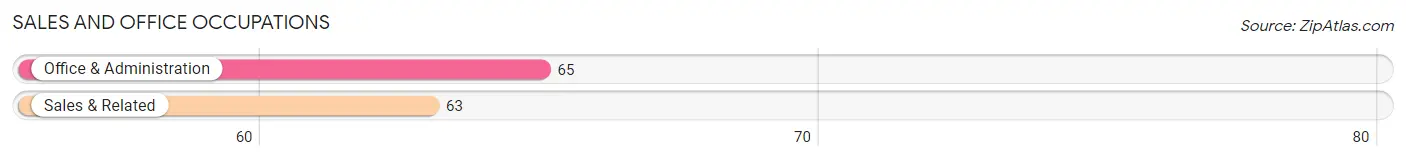
Sales and Office Occupations
The most common Sales and Office occupations in Granby are Office & Administration (65 | 7.1%), and Sales & Related (63 | 6.9%).
Sales and Office Occupations by Sex
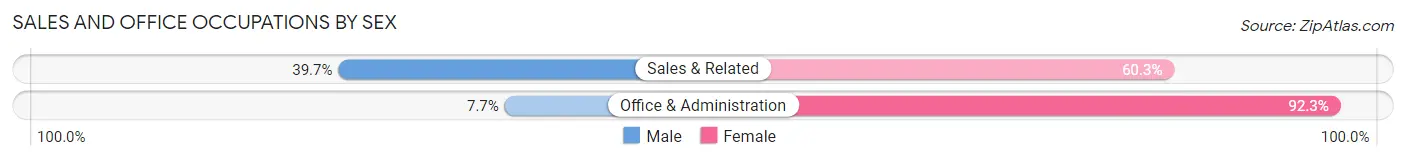
| Occupation | Male | Female |
| Sales & Related | 25 (39.7%) | 38 (60.3%) |
| Office & Administration | 5 (7.7%) | 60 (92.3%) |
| Total (Category) | 30 (23.4%) | 98 (76.6%) |
| Total (Overall) | 524 (57.4%) | 389 (42.6%) |
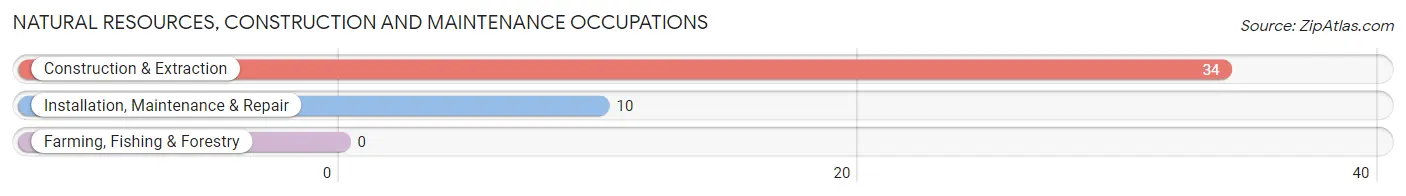
Natural Resources, Construction and Maintenance Occupations
The most common Natural Resources, Construction and Maintenance occupations in Granby are Construction & Extraction (34 | 3.7%), and Installation, Maintenance & Repair (10 | 1.1%).
Natural Resources, Construction and Maintenance Occupations by Sex
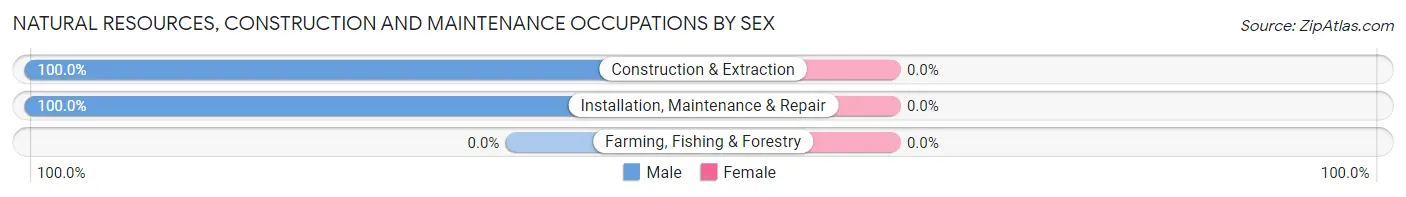
| Occupation | Male | Female |
| Farming, Fishing & Forestry | 0 (0.0%) | 0 (0.0%) |
| Construction & Extraction | 34 (100.0%) | 0 (0.0%) |
| Installation, Maintenance & Repair | 10 (100.0%) | 0 (0.0%) |
| Total (Category) | 44 (100.0%) | 0 (0.0%) |
| Total (Overall) | 524 (57.4%) | 389 (42.6%) |
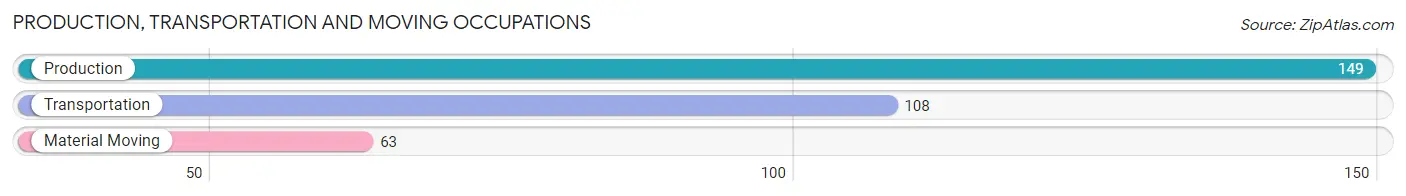
Production, Transportation and Moving Occupations
The most common Production, Transportation and Moving occupations in Granby are Production (149 | 16.3%), Transportation (108 | 11.8%), and Material Moving (63 | 6.9%).
Production, Transportation and Moving Occupations by Sex
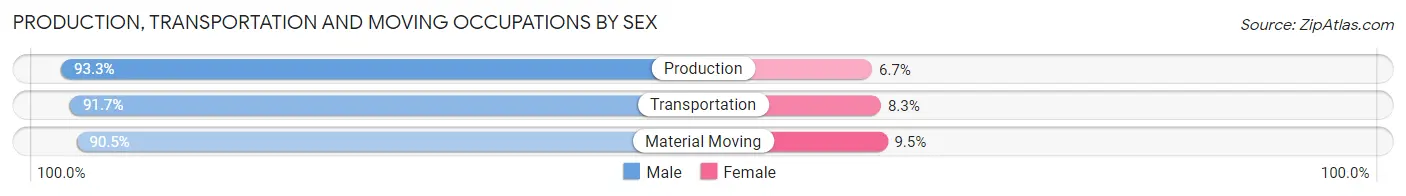
| Occupation | Male | Female |
| Production | 139 (93.3%) | 10 (6.7%) |
| Transportation | 99 (91.7%) | 9 (8.3%) |
| Material Moving | 57 (90.5%) | 6 (9.5%) |
| Total (Category) | 295 (92.2%) | 25 (7.8%) |
| Total (Overall) | 524 (57.4%) | 389 (42.6%) |
Employment Industries by Sex in Granby
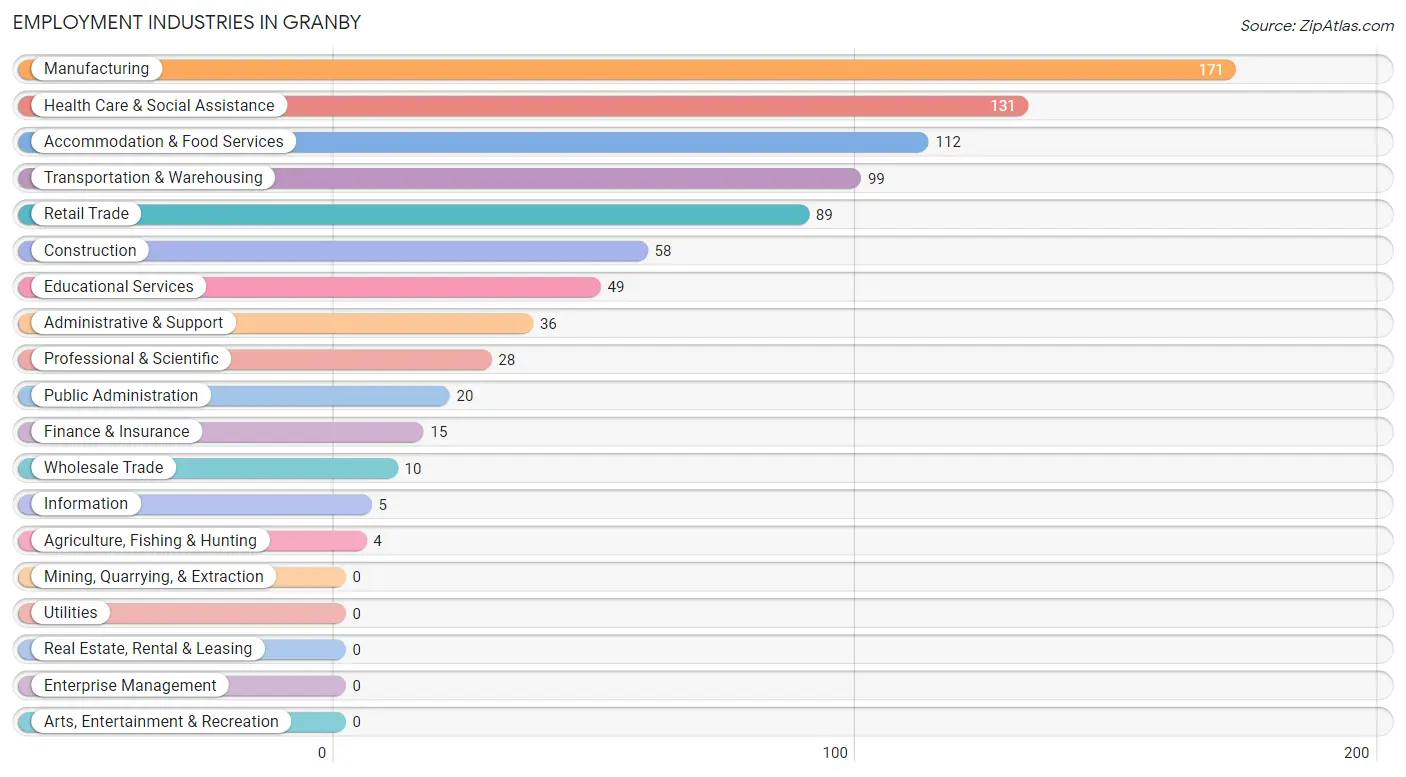
Employment Industries in Granby
The major employment industries in Granby include Manufacturing (171 | 18.7%), Health Care & Social Assistance (131 | 14.3%), Accommodation & Food Services (112 | 12.3%), Transportation & Warehousing (99 | 10.8%), and Retail Trade (89 | 9.8%).
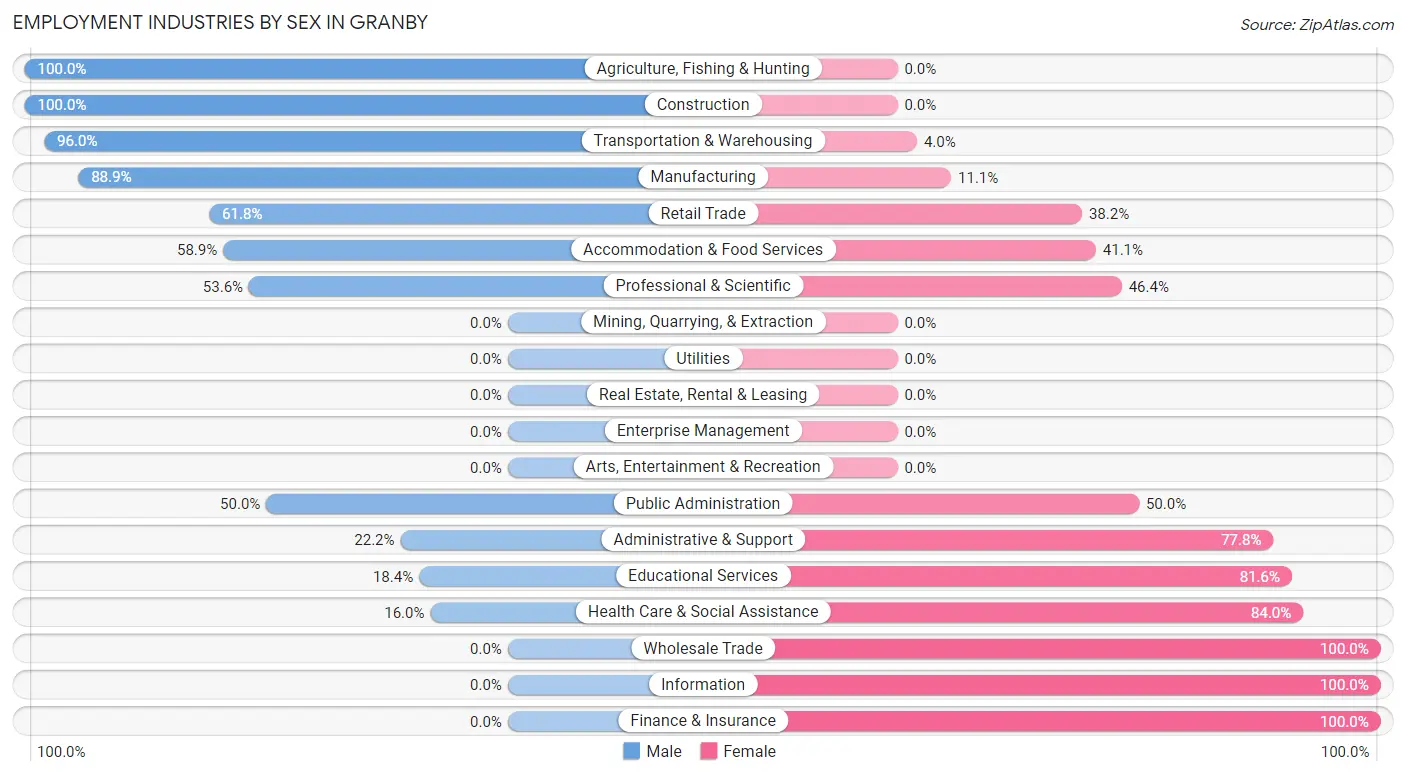
Employment Industries by Sex in Granby
The Granby industries that see more men than women are Agriculture, Fishing & Hunting (100.0%), Construction (100.0%), and Transportation & Warehousing (96.0%), whereas the industries that tend to have a higher number of women are Wholesale Trade (100.0%), Information (100.0%), and Finance & Insurance (100.0%).
| Industry | Male | Female |
| Agriculture, Fishing & Hunting | 4 (100.0%) | 0 (0.0%) |
| Mining, Quarrying, & Extraction | 0 (0.0%) | 0 (0.0%) |
| Construction | 58 (100.0%) | 0 (0.0%) |
| Manufacturing | 152 (88.9%) | 19 (11.1%) |
| Wholesale Trade | 0 (0.0%) | 10 (100.0%) |
| Retail Trade | 55 (61.8%) | 34 (38.2%) |
| Transportation & Warehousing | 95 (96.0%) | 4 (4.0%) |
| Utilities | 0 (0.0%) | 0 (0.0%) |
| Information | 0 (0.0%) | 5 (100.0%) |
| Finance & Insurance | 0 (0.0%) | 15 (100.0%) |
| Real Estate, Rental & Leasing | 0 (0.0%) | 0 (0.0%) |
| Professional & Scientific | 15 (53.6%) | 13 (46.4%) |
| Enterprise Management | 0 (0.0%) | 0 (0.0%) |
| Administrative & Support | 8 (22.2%) | 28 (77.8%) |
| Educational Services | 9 (18.4%) | 40 (81.6%) |
| Health Care & Social Assistance | 21 (16.0%) | 110 (84.0%) |
| Arts, Entertainment & Recreation | 0 (0.0%) | 0 (0.0%) |
| Accommodation & Food Services | 66 (58.9%) | 46 (41.1%) |
| Public Administration | 10 (50.0%) | 10 (50.0%) |
| Total | 524 (57.4%) | 389 (42.6%) |
Education in Granby
School Enrollment in Granby
The most common levels of schooling among the 518 students in Granby are high school (157 | 30.3%), elementary school (147 | 28.4%), and middle school (109 | 21.0%).
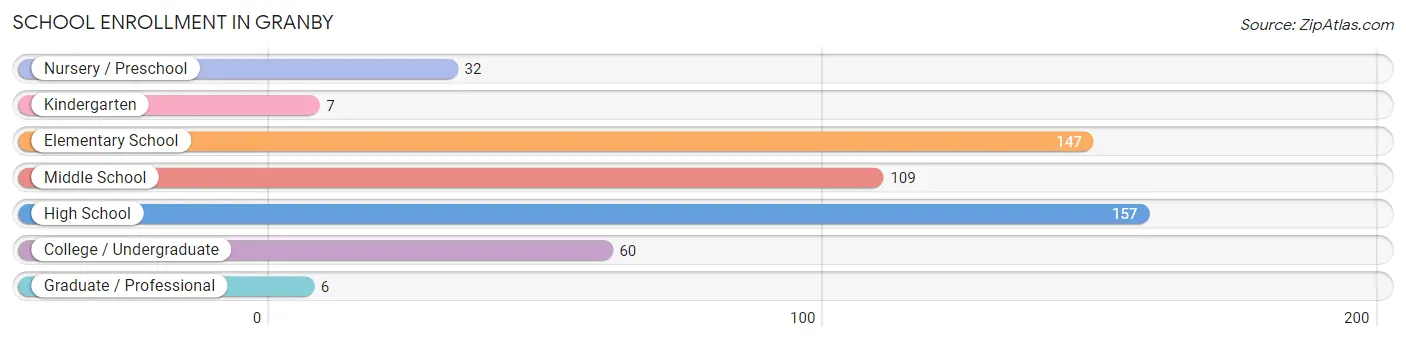
| School Level | # Students | % Students |
| Nursery / Preschool | 32 | 6.2% |
| Kindergarten | 7 | 1.3% |
| Elementary School | 147 | 28.4% |
| Middle School | 109 | 21.0% |
| High School | 157 | 30.3% |
| College / Undergraduate | 60 | 11.6% |
| Graduate / Professional | 6 | 1.2% |
| Total | 518 | 100.0% |
School Enrollment by Age by Funding Source in Granby
Out of a total of 518 students who are enrolled in schools in Granby, 112 (21.6%) attend a private institution, while the remaining 406 (78.4%) are enrolled in public schools. The age group of 3 to 4 year olds has the highest likelihood of being enrolled in private schools, with 18 (69.2% in the age bracket) enrolled. Conversely, the age group of 20 to 24 year olds has the lowest likelihood of being enrolled in a private school, with 12 (100.0% in the age bracket) attending a public institution.
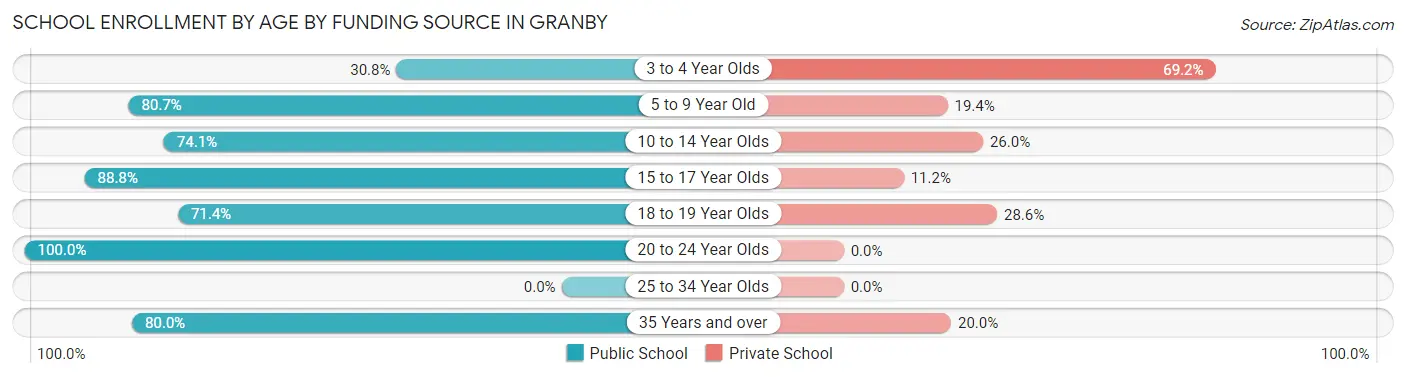
| Age Bracket | Public School | Private School |
| 3 to 4 Year Olds | 8 (30.8%) | 18 (69.2%) |
| 5 to 9 Year Old | 100 (80.6%) | 24 (19.4%) |
| 10 to 14 Year Olds | 117 (74.1%) | 41 (26.0%) |
| 15 to 17 Year Olds | 119 (88.8%) | 15 (11.2%) |
| 18 to 19 Year Olds | 10 (71.4%) | 4 (28.6%) |
| 20 to 24 Year Olds | 12 (100.0%) | 0 (0.0%) |
| 25 to 34 Year Olds | 0 (0.0%) | 0 (0.0%) |
| 35 Years and over | 40 (80.0%) | 10 (20.0%) |
| Total | 406 (78.4%) | 112 (21.6%) |
Educational Attainment by Field of Study in Granby
Education (23 | 16.7%), psychology (20 | 14.5%), science & technology (19 | 13.8%), business (18 | 13.0%), and arts & humanities (18 | 13.0%) are the most common fields of study among 138 individuals in Granby who have obtained a bachelor's degree or higher.
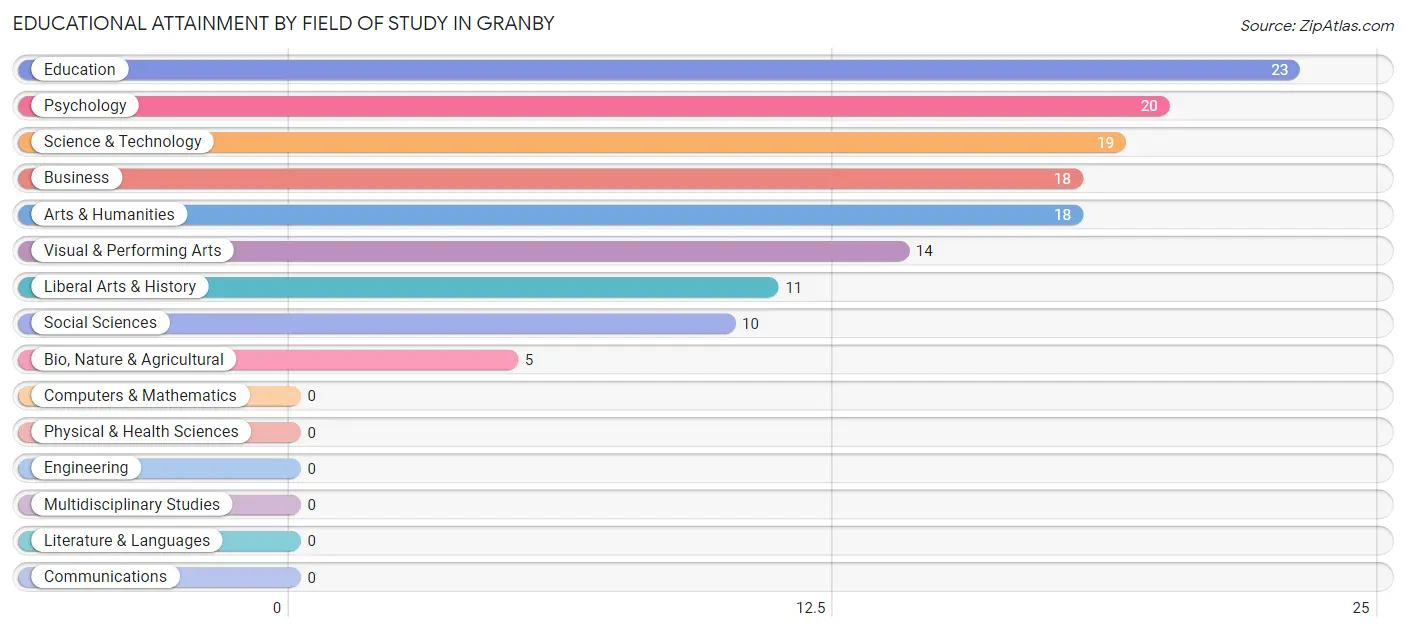
| Field of Study | # Graduates | % Graduates |
| Computers & Mathematics | 0 | 0.0% |
| Bio, Nature & Agricultural | 5 | 3.6% |
| Physical & Health Sciences | 0 | 0.0% |
| Psychology | 20 | 14.5% |
| Social Sciences | 10 | 7.2% |
| Engineering | 0 | 0.0% |
| Multidisciplinary Studies | 0 | 0.0% |
| Science & Technology | 19 | 13.8% |
| Business | 18 | 13.0% |
| Education | 23 | 16.7% |
| Literature & Languages | 0 | 0.0% |
| Liberal Arts & History | 11 | 8.0% |
| Visual & Performing Arts | 14 | 10.1% |
| Communications | 0 | 0.0% |
| Arts & Humanities | 18 | 13.0% |
| Total | 138 | 100.0% |
Transportation & Commute in Granby
Vehicle Availability by Sex in Granby
The most prevalent vehicle ownership categories in Granby are males with 2 vehicles (306, accounting for 58.2%) and females with 2 vehicles (185, making up 78.7%).
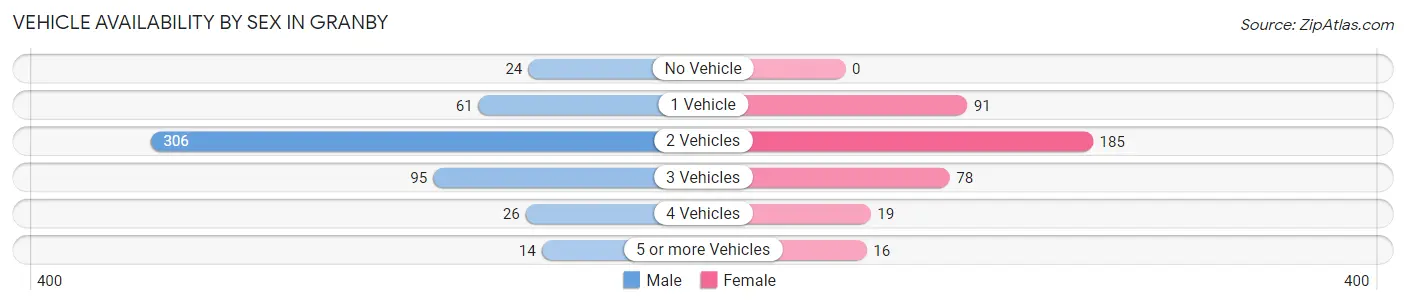
| Vehicles Available | Male | Female |
| No Vehicle | 24 (4.6%) | 0 (0.0%) |
| 1 Vehicle | 61 (11.6%) | 91 (23.4%) |
| 2 Vehicles | 306 (58.2%) | 185 (47.6%) |
| 3 Vehicles | 95 (18.1%) | 78 (20.1%) |
| 4 Vehicles | 26 (4.9%) | 19 (4.9%) |
| 5 or more Vehicles | 14 (2.7%) | 16 (4.1%) |
| Total | 526 (100.0%) | 389 (100.0%) |
Commute Time in Granby
The most frequently occuring commute durations in Granby are 15 to 19 minutes (244 commuters, 27.2%), less than 5 minutes (126 commuters, 14.0%), and 20 to 24 minutes (119 commuters, 13.3%).
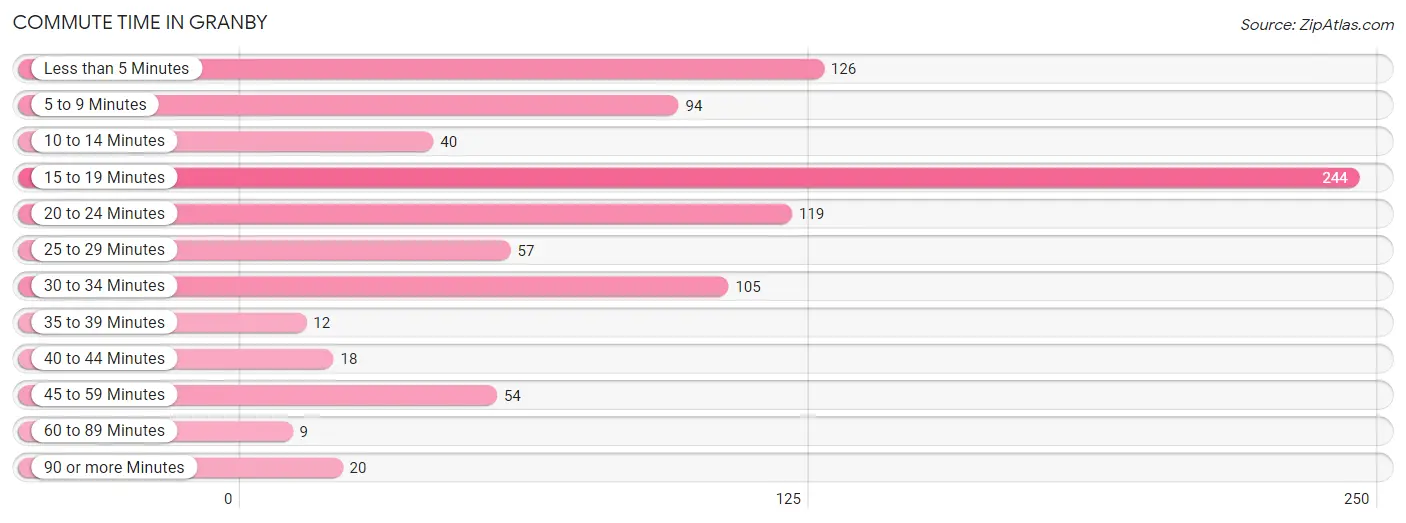
| Commute Time | # Commuters | % Commuters |
| Less than 5 Minutes | 126 | 14.0% |
| 5 to 9 Minutes | 94 | 10.5% |
| 10 to 14 Minutes | 40 | 4.4% |
| 15 to 19 Minutes | 244 | 27.2% |
| 20 to 24 Minutes | 119 | 13.3% |
| 25 to 29 Minutes | 57 | 6.4% |
| 30 to 34 Minutes | 105 | 11.7% |
| 35 to 39 Minutes | 12 | 1.3% |
| 40 to 44 Minutes | 18 | 2.0% |
| 45 to 59 Minutes | 54 | 6.0% |
| 60 to 89 Minutes | 9 | 1.0% |
| 90 or more Minutes | 20 | 2.2% |
Commute Time by Sex in Granby
The most common commute times in Granby are 15 to 19 minutes (164 commuters, 31.4%) for males and 15 to 19 minutes (80 commuters, 21.3%) for females.
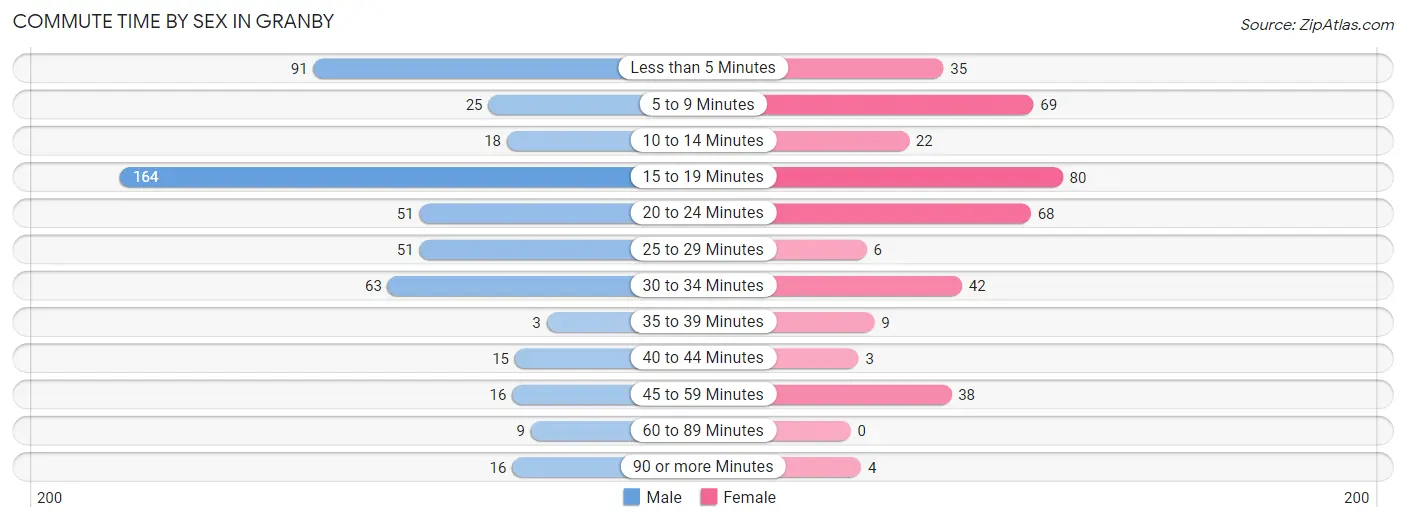
| Commute Time | Male | Female |
| Less than 5 Minutes | 91 (17.4%) | 35 (9.3%) |
| 5 to 9 Minutes | 25 (4.8%) | 69 (18.3%) |
| 10 to 14 Minutes | 18 (3.5%) | 22 (5.9%) |
| 15 to 19 Minutes | 164 (31.4%) | 80 (21.3%) |
| 20 to 24 Minutes | 51 (9.8%) | 68 (18.1%) |
| 25 to 29 Minutes | 51 (9.8%) | 6 (1.6%) |
| 30 to 34 Minutes | 63 (12.1%) | 42 (11.2%) |
| 35 to 39 Minutes | 3 (0.6%) | 9 (2.4%) |
| 40 to 44 Minutes | 15 (2.9%) | 3 (0.8%) |
| 45 to 59 Minutes | 16 (3.1%) | 38 (10.1%) |
| 60 to 89 Minutes | 9 (1.7%) | 0 (0.0%) |
| 90 or more Minutes | 16 (3.1%) | 4 (1.1%) |
Time of Departure to Work by Sex in Granby
The most frequent times of departure to work in Granby are 12:00 AM to 4:59 AM (163, 31.2%) for males and 6:30 AM to 6:59 AM (77, 20.5%) for females.
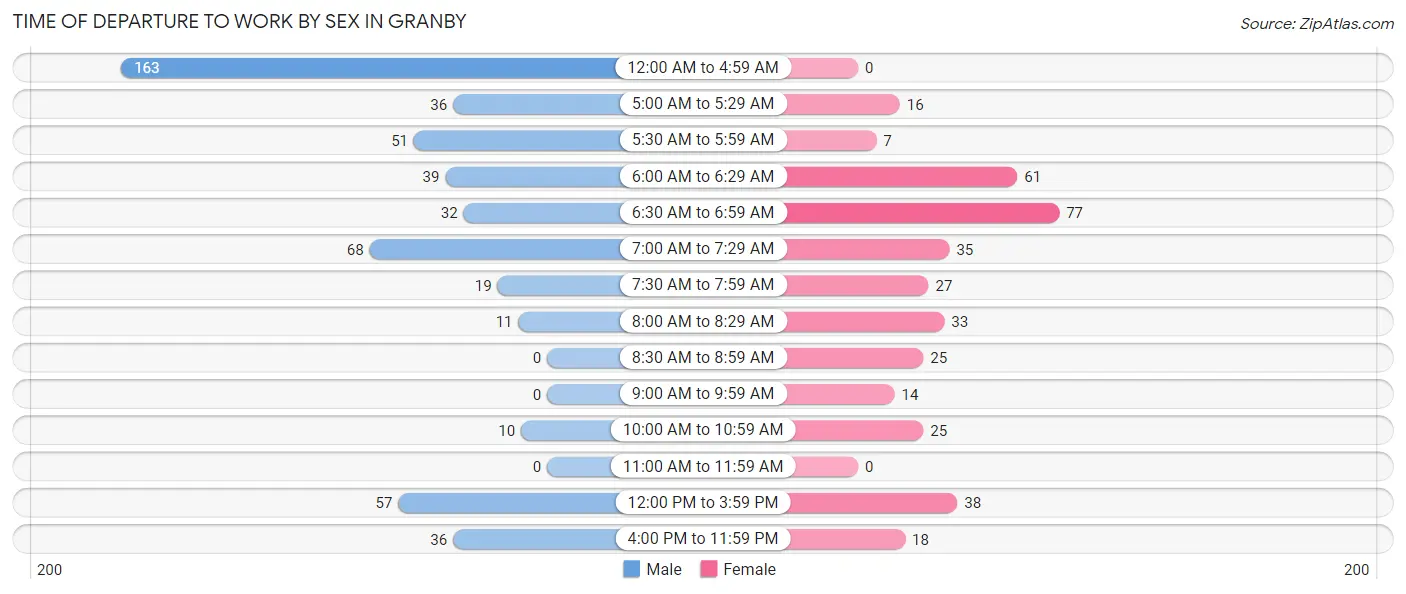
| Time of Departure | Male | Female |
| 12:00 AM to 4:59 AM | 163 (31.2%) | 0 (0.0%) |
| 5:00 AM to 5:29 AM | 36 (6.9%) | 16 (4.3%) |
| 5:30 AM to 5:59 AM | 51 (9.8%) | 7 (1.9%) |
| 6:00 AM to 6:29 AM | 39 (7.5%) | 61 (16.2%) |
| 6:30 AM to 6:59 AM | 32 (6.1%) | 77 (20.5%) |
| 7:00 AM to 7:29 AM | 68 (13.0%) | 35 (9.3%) |
| 7:30 AM to 7:59 AM | 19 (3.6%) | 27 (7.2%) |
| 8:00 AM to 8:29 AM | 11 (2.1%) | 33 (8.8%) |
| 8:30 AM to 8:59 AM | 0 (0.0%) | 25 (6.7%) |
| 9:00 AM to 9:59 AM | 0 (0.0%) | 14 (3.7%) |
| 10:00 AM to 10:59 AM | 10 (1.9%) | 25 (6.7%) |
| 11:00 AM to 11:59 AM | 0 (0.0%) | 0 (0.0%) |
| 12:00 PM to 3:59 PM | 57 (10.9%) | 38 (10.1%) |
| 4:00 PM to 11:59 PM | 36 (6.9%) | 18 (4.8%) |
| Total | 522 (100.0%) | 376 (100.0%) |
Housing Occupancy in Granby
Occupancy by Ownership in Granby
Of the total 837 dwellings in Granby, owner-occupied units account for 557 (66.5%), while renter-occupied units make up 280 (33.5%).
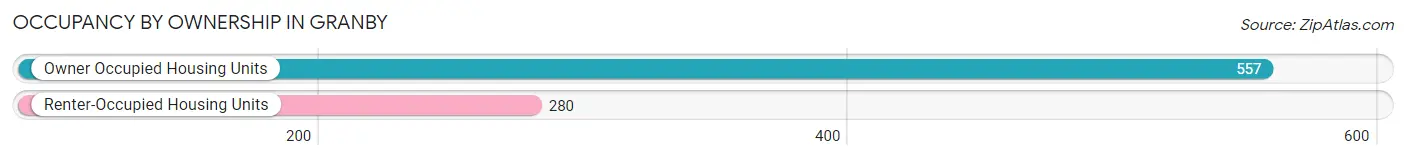
| Occupancy | # Housing Units | % Housing Units |
| Owner Occupied Housing Units | 557 | 66.5% |
| Renter-Occupied Housing Units | 280 | 33.5% |
| Total Occupied Housing Units | 837 | 100.0% |
Occupancy by Household Size in Granby
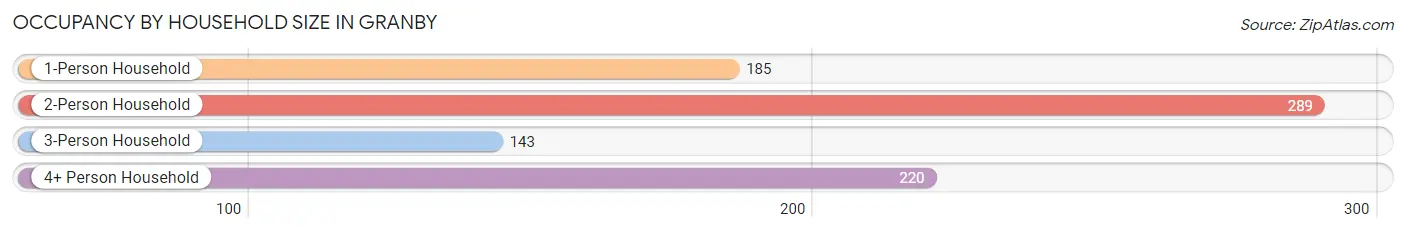
| Household Size | # Housing Units | % Housing Units |
| 1-Person Household | 185 | 22.1% |
| 2-Person Household | 289 | 34.5% |
| 3-Person Household | 143 | 17.1% |
| 4+ Person Household | 220 | 26.3% |
| Total Housing Units | 837 | 100.0% |
Occupancy by Ownership by Household Size in Granby
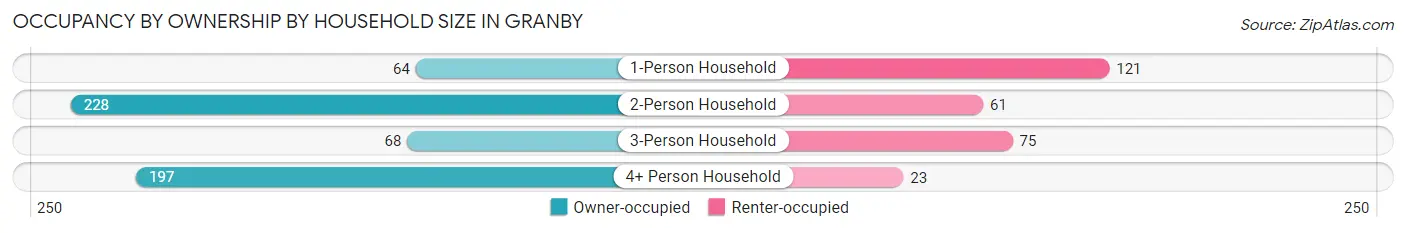
| Household Size | Owner-occupied | Renter-occupied |
| 1-Person Household | 64 (34.6%) | 121 (65.4%) |
| 2-Person Household | 228 (78.9%) | 61 (21.1%) |
| 3-Person Household | 68 (47.5%) | 75 (52.4%) |
| 4+ Person Household | 197 (89.5%) | 23 (10.4%) |
| Total Housing Units | 557 (66.5%) | 280 (33.5%) |
Occupancy by Educational Attainment in Granby
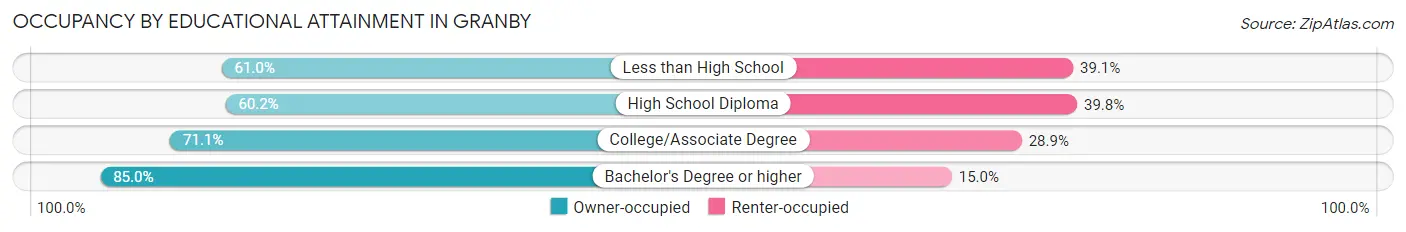
| Household Size | Owner-occupied | Renter-occupied |
| Less than High School | 64 (61.0%) | 41 (39.1%) |
| High School Diploma | 213 (60.2%) | 141 (39.8%) |
| College/Associate Degree | 212 (71.1%) | 86 (28.9%) |
| Bachelor's Degree or higher | 68 (85.0%) | 12 (15.0%) |
Occupancy by Age of Householder in Granby
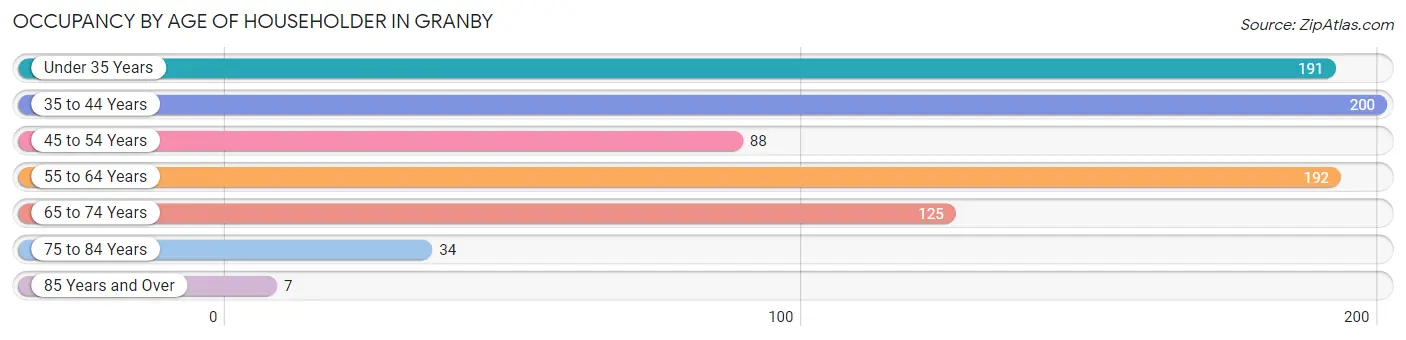
| Age Bracket | # Households | % Households |
| Under 35 Years | 191 | 22.8% |
| 35 to 44 Years | 200 | 23.9% |
| 45 to 54 Years | 88 | 10.5% |
| 55 to 64 Years | 192 | 22.9% |
| 65 to 74 Years | 125 | 14.9% |
| 75 to 84 Years | 34 | 4.1% |
| 85 Years and Over | 7 | 0.8% |
| Total | 837 | 100.0% |
Housing Finances in Granby
Median Income by Occupancy in Granby
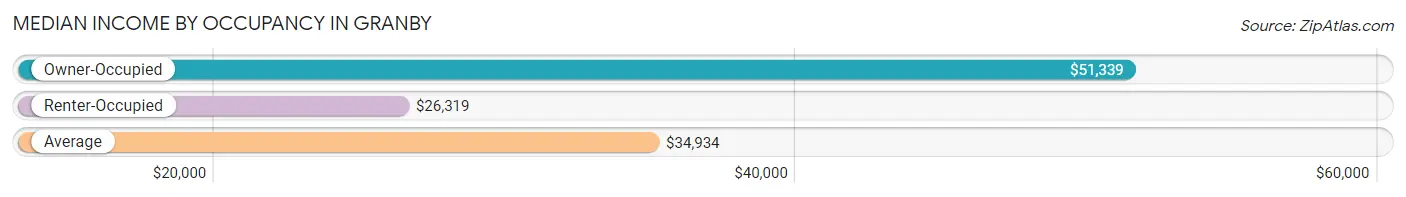
| Occupancy Type | # Households | Median Income |
| Owner-Occupied | 557 (66.5%) | $51,339 |
| Renter-Occupied | 280 (33.5%) | $26,319 |
| Average | 837 (100.0%) | $34,934 |
Occupancy by Householder Income Bracket in Granby
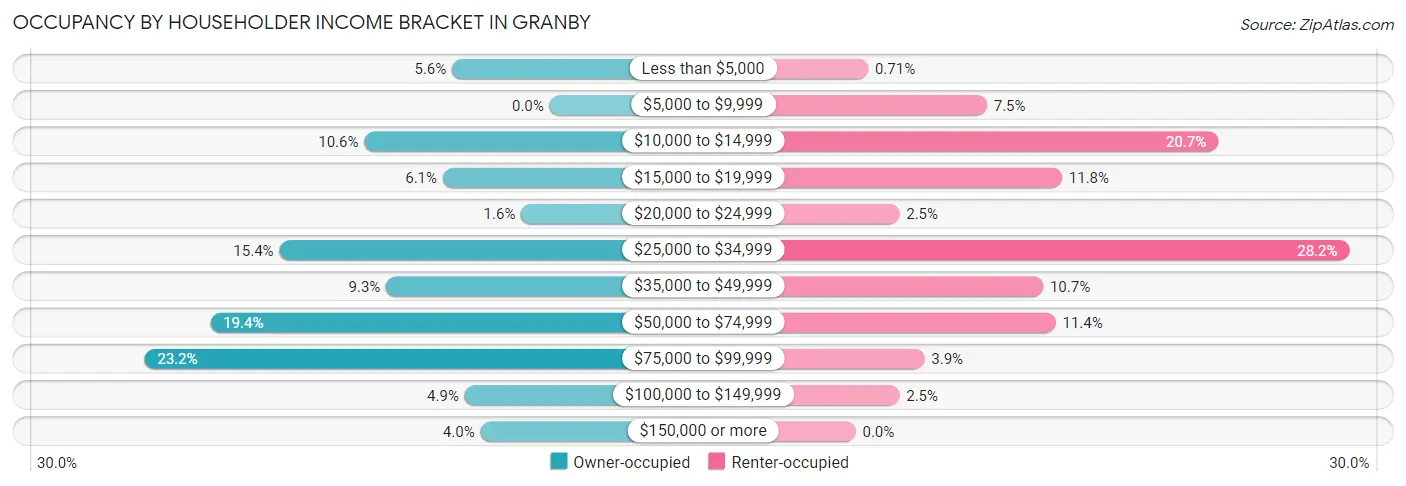
| Income Bracket | Owner-occupied | Renter-occupied |
| Less than $5,000 | 31 (5.6%) | 2 (0.7%) |
| $5,000 to $9,999 | 0 (0.0%) | 21 (7.5%) |
| $10,000 to $14,999 | 59 (10.6%) | 58 (20.7%) |
| $15,000 to $19,999 | 34 (6.1%) | 33 (11.8%) |
| $20,000 to $24,999 | 9 (1.6%) | 7 (2.5%) |
| $25,000 to $34,999 | 86 (15.4%) | 79 (28.2%) |
| $35,000 to $49,999 | 52 (9.3%) | 30 (10.7%) |
| $50,000 to $74,999 | 108 (19.4%) | 32 (11.4%) |
| $75,000 to $99,999 | 129 (23.2%) | 11 (3.9%) |
| $100,000 to $149,999 | 27 (4.9%) | 7 (2.5%) |
| $150,000 or more | 22 (4.0%) | 0 (0.0%) |
| Total | 557 (100.0%) | 280 (100.0%) |
Monthly Housing Cost Tiers in Granby
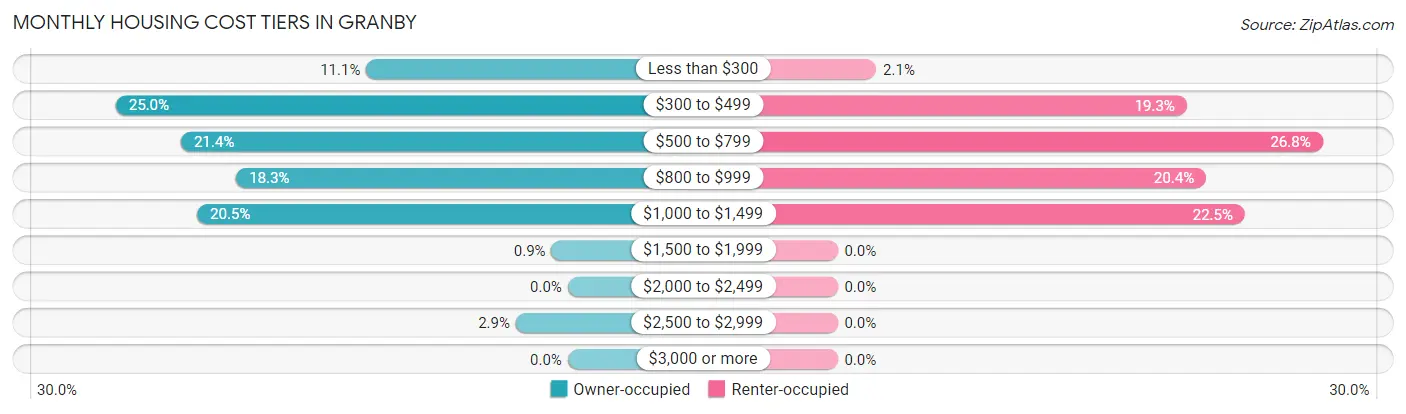
| Monthly Cost | Owner-occupied | Renter-occupied |
| Less than $300 | 62 (11.1%) | 6 (2.1%) |
| $300 to $499 | 139 (25.0%) | 54 (19.3%) |
| $500 to $799 | 119 (21.4%) | 75 (26.8%) |
| $800 to $999 | 102 (18.3%) | 57 (20.4%) |
| $1,000 to $1,499 | 114 (20.5%) | 63 (22.5%) |
| $1,500 to $1,999 | 5 (0.9%) | 0 (0.0%) |
| $2,000 to $2,499 | 0 (0.0%) | 0 (0.0%) |
| $2,500 to $2,999 | 16 (2.9%) | 0 (0.0%) |
| $3,000 or more | 0 (0.0%) | 0 (0.0%) |
| Total | 557 (100.0%) | 280 (100.0%) |
Physical Housing Characteristics in Granby
Housing Structures in Granby
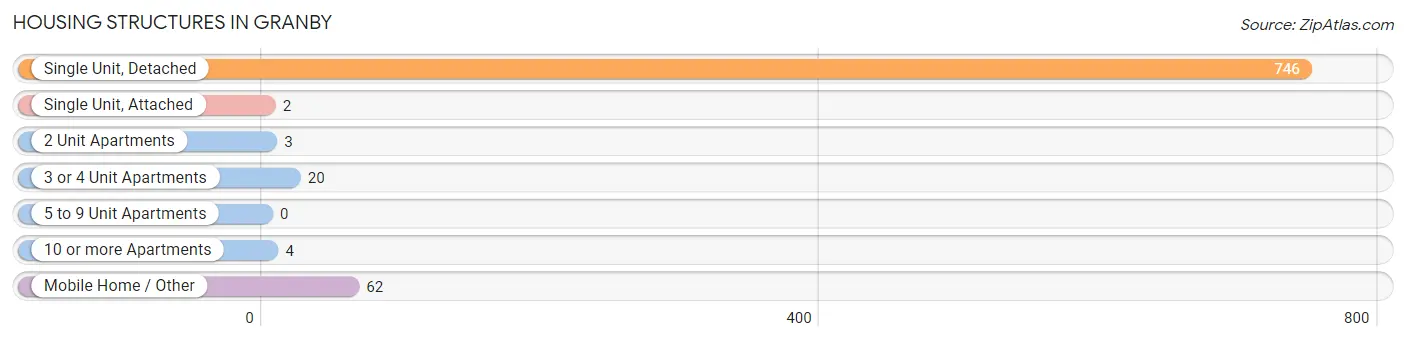
| Structure Type | # Housing Units | % Housing Units |
| Single Unit, Detached | 746 | 89.1% |
| Single Unit, Attached | 2 | 0.2% |
| 2 Unit Apartments | 3 | 0.4% |
| 3 or 4 Unit Apartments | 20 | 2.4% |
| 5 to 9 Unit Apartments | 0 | 0.0% |
| 10 or more Apartments | 4 | 0.5% |
| Mobile Home / Other | 62 | 7.4% |
| Total | 837 | 100.0% |
Housing Structures by Occupancy in Granby
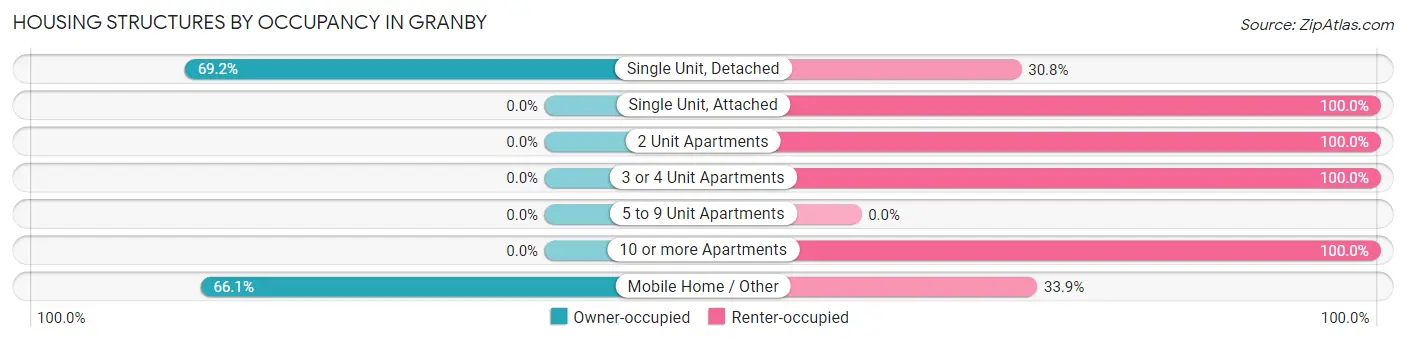
| Structure Type | Owner-occupied | Renter-occupied |
| Single Unit, Detached | 516 (69.2%) | 230 (30.8%) |
| Single Unit, Attached | 0 (0.0%) | 2 (100.0%) |
| 2 Unit Apartments | 0 (0.0%) | 3 (100.0%) |
| 3 or 4 Unit Apartments | 0 (0.0%) | 20 (100.0%) |
| 5 to 9 Unit Apartments | 0 (0.0%) | 0 (0.0%) |
| 10 or more Apartments | 0 (0.0%) | 4 (100.0%) |
| Mobile Home / Other | 41 (66.1%) | 21 (33.9%) |
| Total | 557 (66.5%) | 280 (33.5%) |
Housing Structures by Number of Rooms in Granby
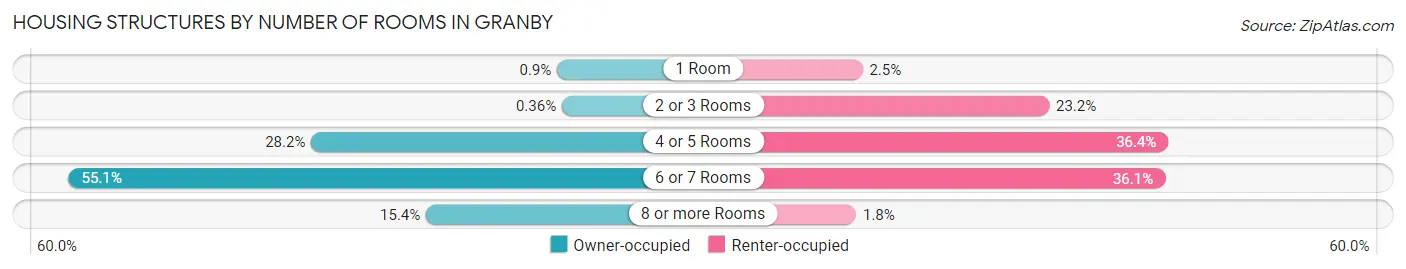
| Number of Rooms | Owner-occupied | Renter-occupied |
| 1 Room | 5 (0.9%) | 7 (2.5%) |
| 2 or 3 Rooms | 2 (0.4%) | 65 (23.2%) |
| 4 or 5 Rooms | 157 (28.2%) | 102 (36.4%) |
| 6 or 7 Rooms | 307 (55.1%) | 101 (36.1%) |
| 8 or more Rooms | 86 (15.4%) | 5 (1.8%) |
| Total | 557 (100.0%) | 280 (100.0%) |
Housing Structure by Heating Type in Granby
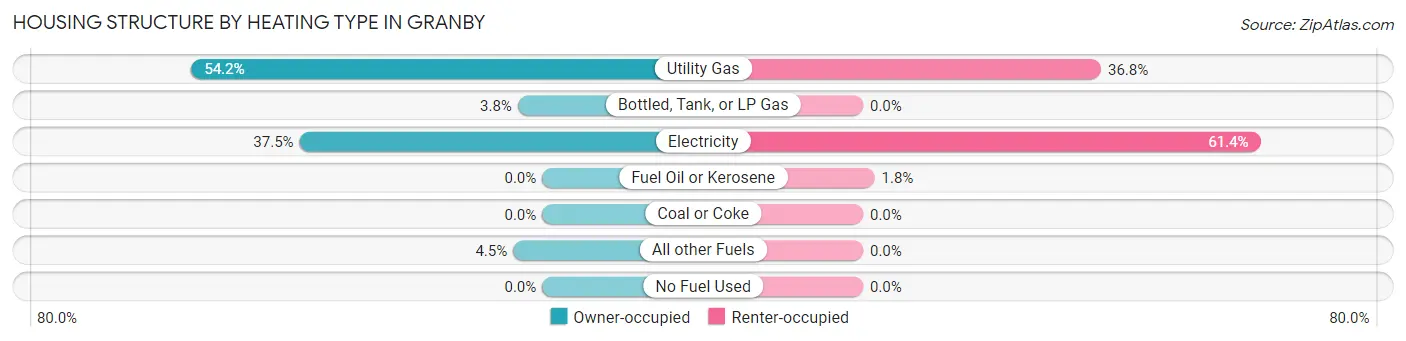
| Heating Type | Owner-occupied | Renter-occupied |
| Utility Gas | 302 (54.2%) | 103 (36.8%) |
| Bottled, Tank, or LP Gas | 21 (3.8%) | 0 (0.0%) |
| Electricity | 209 (37.5%) | 172 (61.4%) |
| Fuel Oil or Kerosene | 0 (0.0%) | 5 (1.8%) |
| Coal or Coke | 0 (0.0%) | 0 (0.0%) |
| All other Fuels | 25 (4.5%) | 0 (0.0%) |
| No Fuel Used | 0 (0.0%) | 0 (0.0%) |
| Total | 557 (100.0%) | 280 (100.0%) |
Household Vehicle Usage in Granby
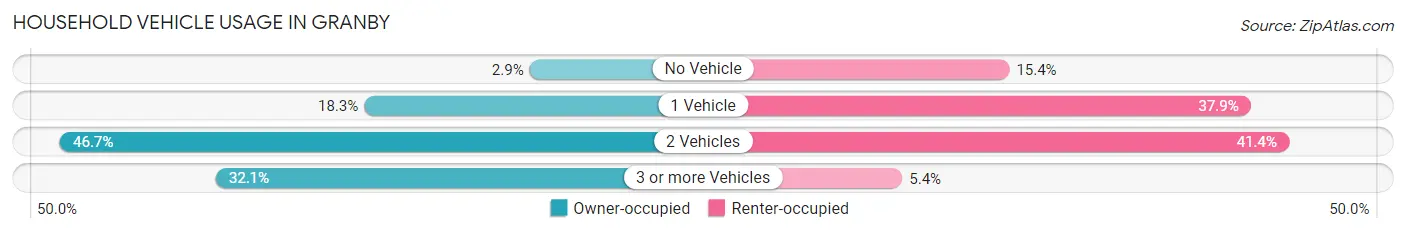
| Vehicles per Household | Owner-occupied | Renter-occupied |
| No Vehicle | 16 (2.9%) | 43 (15.4%) |
| 1 Vehicle | 102 (18.3%) | 106 (37.9%) |
| 2 Vehicles | 260 (46.7%) | 116 (41.4%) |
| 3 or more Vehicles | 179 (32.1%) | 15 (5.4%) |
| Total | 557 (100.0%) | 280 (100.0%) |
Real Estate & Mortgages in Granby
Real Estate and Mortgage Overview in Granby
| Characteristic | Without Mortgage | With Mortgage |
| Housing Units | 258 | 299 |
| Median Property Value | - | - |
| Median Household Income | $36,563 | $22 |
| Monthly Housing Costs | $428 | $0 |
| Real Estate Taxes | $382 | $8 |
Property Value by Mortgage Status in Granby
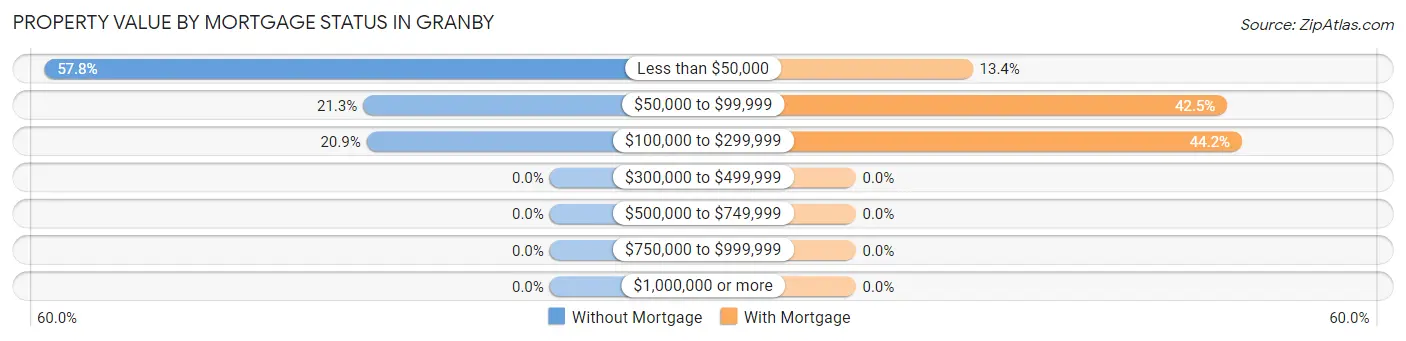
| Property Value | Without Mortgage | With Mortgage |
| Less than $50,000 | 149 (57.8%) | 40 (13.4%) |
| $50,000 to $99,999 | 55 (21.3%) | 127 (42.5%) |
| $100,000 to $299,999 | 54 (20.9%) | 132 (44.2%) |
| $300,000 to $499,999 | 0 (0.0%) | 0 (0.0%) |
| $500,000 to $749,999 | 0 (0.0%) | 0 (0.0%) |
| $750,000 to $999,999 | 0 (0.0%) | 0 (0.0%) |
| $1,000,000 or more | 0 (0.0%) | 0 (0.0%) |
| Total | 258 (100.0%) | 299 (100.0%) |
Household Income by Mortgage Status in Granby
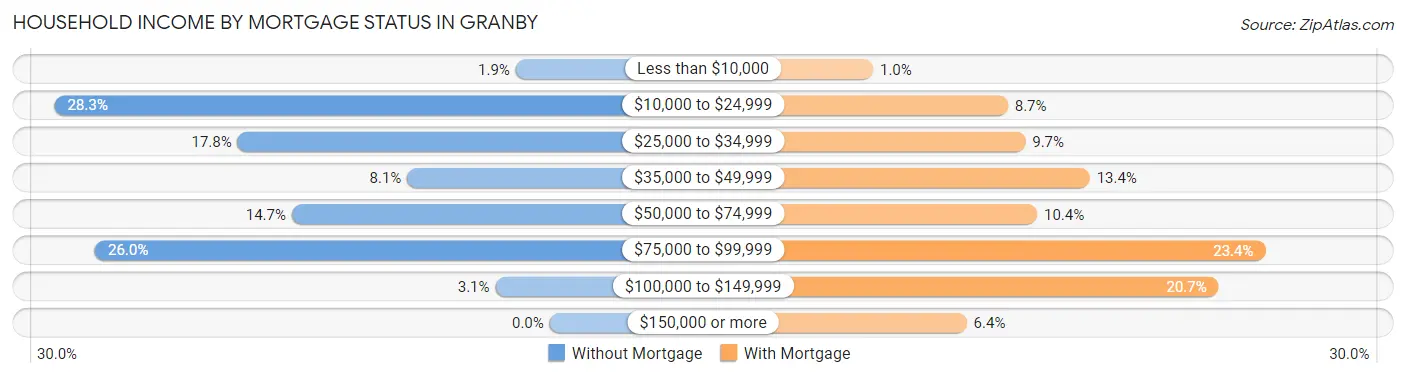
| Household Income | Without Mortgage | With Mortgage |
| Less than $10,000 | 5 (1.9%) | 3 (1.0%) |
| $10,000 to $24,999 | 73 (28.3%) | 26 (8.7%) |
| $25,000 to $34,999 | 46 (17.8%) | 29 (9.7%) |
| $35,000 to $49,999 | 21 (8.1%) | 40 (13.4%) |
| $50,000 to $74,999 | 38 (14.7%) | 31 (10.4%) |
| $75,000 to $99,999 | 67 (26.0%) | 70 (23.4%) |
| $100,000 to $149,999 | 8 (3.1%) | 62 (20.7%) |
| $150,000 or more | 0 (0.0%) | 19 (6.4%) |
| Total | 258 (100.0%) | 299 (100.0%) |
Property Value to Household Income Ratio in Granby
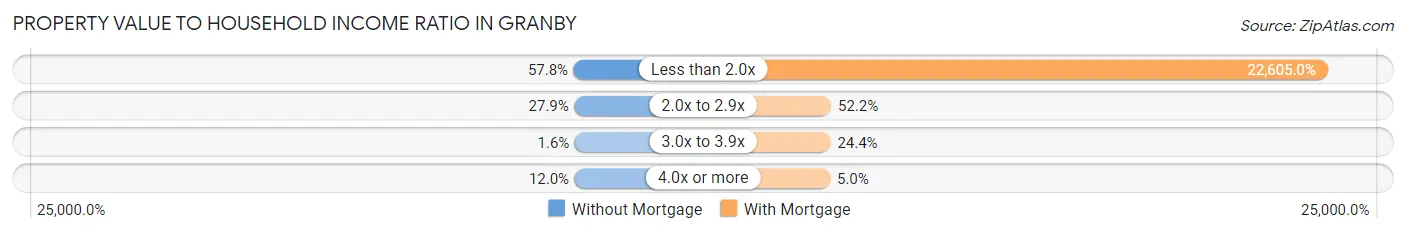
| Value-to-Income Ratio | Without Mortgage | With Mortgage |
| Less than 2.0x | 149 (57.8%) | 67,589 (22,605.0%) |
| 2.0x to 2.9x | 72 (27.9%) | 156 (52.2%) |
| 3.0x to 3.9x | 4 (1.5%) | 73 (24.4%) |
| 4.0x or more | 31 (12.0%) | 15 (5.0%) |
| Total | 258 (100.0%) | 299 (100.0%) |
Real Estate Taxes by Mortgage Status in Granby
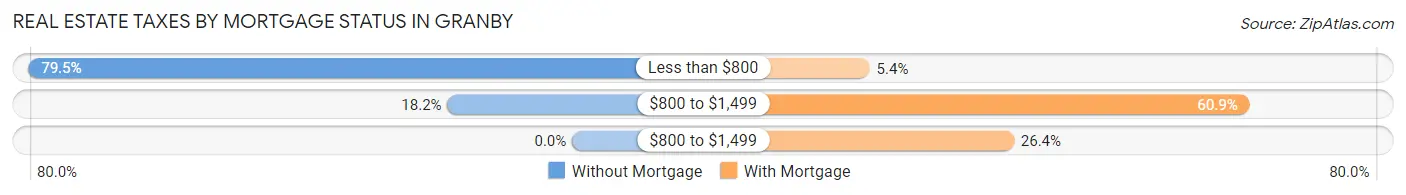
| Property Taxes | Without Mortgage | With Mortgage |
| Less than $800 | 205 (79.5%) | 16 (5.3%) |
| $800 to $1,499 | 47 (18.2%) | 182 (60.9%) |
| $800 to $1,499 | 0 (0.0%) | 79 (26.4%) |
| Total | 258 (100.0%) | 299 (100.0%) |
Health & Disability in Granby
Health Insurance Coverage by Age in Granby
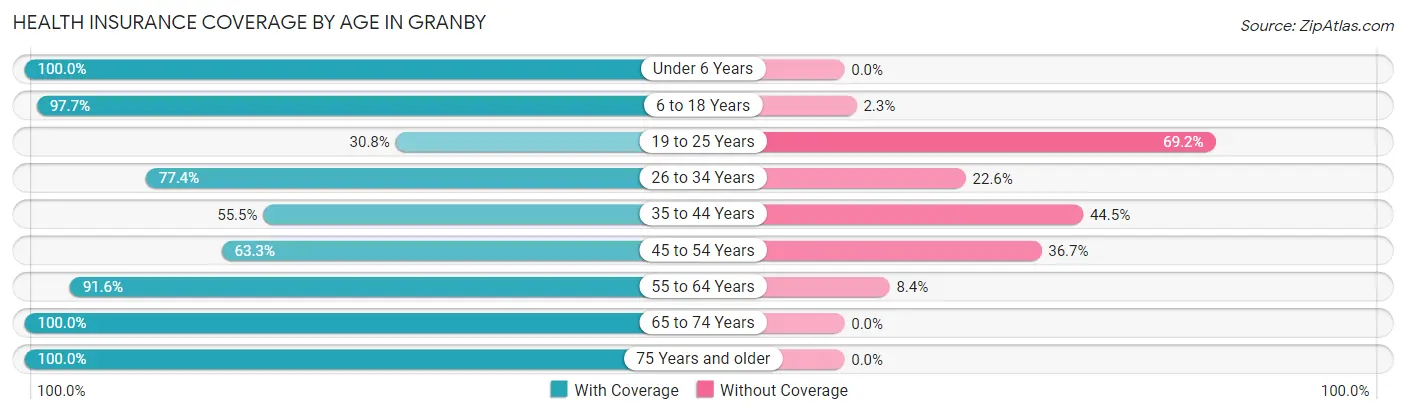
| Age Bracket | With Coverage | Without Coverage |
| Under 6 Years | 194 (100.0%) | 0 (0.0%) |
| 6 to 18 Years | 430 (97.7%) | 10 (2.3%) |
| 19 to 25 Years | 57 (30.8%) | 128 (69.2%) |
| 26 to 34 Years | 171 (77.4%) | 50 (22.6%) |
| 35 to 44 Years | 182 (55.5%) | 146 (44.5%) |
| 45 to 54 Years | 136 (63.3%) | 79 (36.7%) |
| 55 to 64 Years | 348 (91.6%) | 32 (8.4%) |
| 65 to 74 Years | 167 (100.0%) | 0 (0.0%) |
| 75 Years and older | 85 (100.0%) | 0 (0.0%) |
| Total | 1,770 (79.9%) | 445 (20.1%) |
Health Insurance Coverage by Citizenship Status in Granby
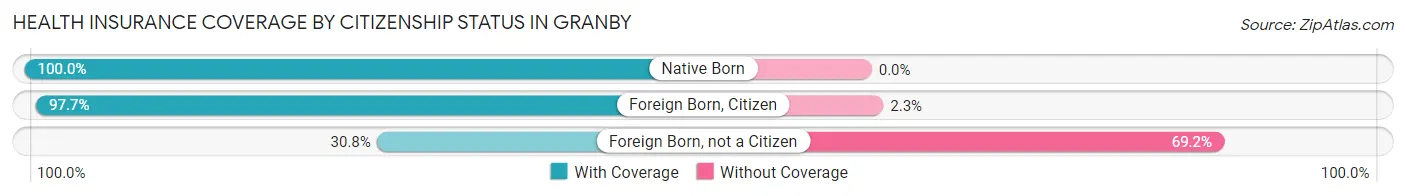
| Citizenship Status | With Coverage | Without Coverage |
| Native Born | 194 (100.0%) | 0 (0.0%) |
| Foreign Born, Citizen | 430 (97.7%) | 10 (2.3%) |
| Foreign Born, not a Citizen | 57 (30.8%) | 128 (69.2%) |
Health Insurance Coverage by Household Income in Granby
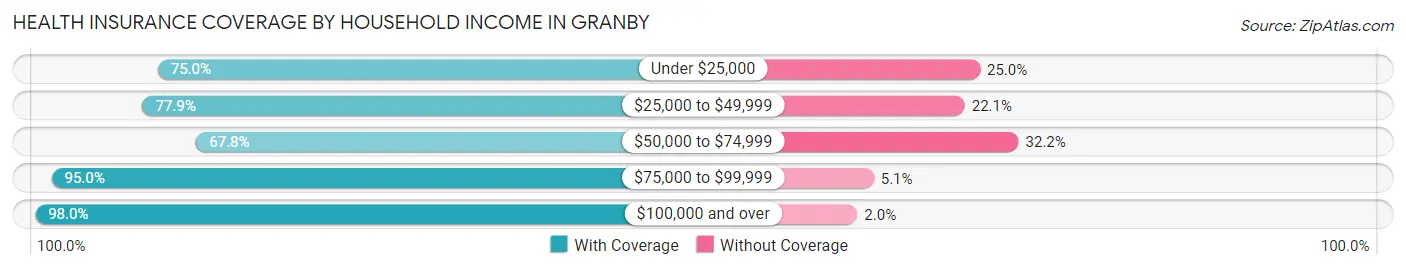
| Household Income | With Coverage | Without Coverage |
| Under $25,000 | 445 (75.0%) | 148 (25.0%) |
| $25,000 to $49,999 | 398 (77.9%) | 113 (22.1%) |
| $50,000 to $74,999 | 335 (67.8%) | 159 (32.2%) |
| $75,000 to $99,999 | 395 (95.0%) | 21 (5.1%) |
| $100,000 and over | 197 (98.0%) | 4 (2.0%) |
Public vs Private Health Insurance Coverage by Age in Granby
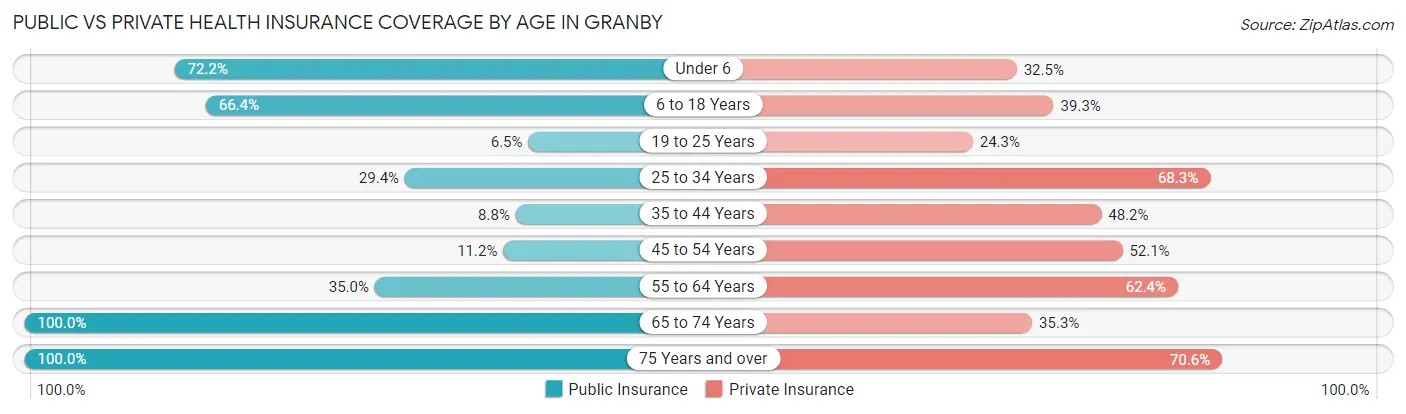
| Age Bracket | Public Insurance | Private Insurance |
| Under 6 | 140 (72.2%) | 63 (32.5%) |
| 6 to 18 Years | 292 (66.4%) | 173 (39.3%) |
| 19 to 25 Years | 12 (6.5%) | 45 (24.3%) |
| 25 to 34 Years | 65 (29.4%) | 151 (68.3%) |
| 35 to 44 Years | 29 (8.8%) | 158 (48.2%) |
| 45 to 54 Years | 24 (11.2%) | 112 (52.1%) |
| 55 to 64 Years | 133 (35.0%) | 237 (62.4%) |
| 65 to 74 Years | 167 (100.0%) | 59 (35.3%) |
| 75 Years and over | 85 (100.0%) | 60 (70.6%) |
| Total | 947 (42.7%) | 1,058 (47.8%) |
Disability Status by Sex by Age in Granby
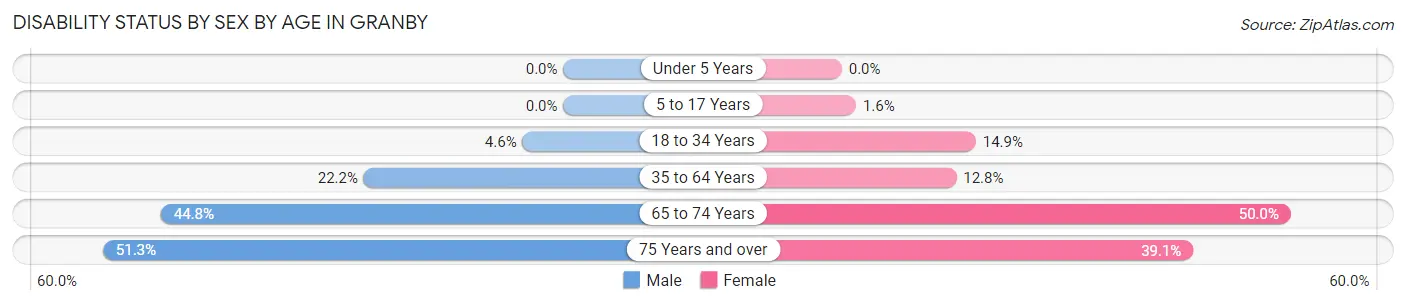
| Age Bracket | Male | Female |
| Under 5 Years | 0 (0.0%) | 0 (0.0%) |
| 5 to 17 Years | 0 (0.0%) | 4 (1.6%) |
| 18 to 34 Years | 11 (4.5%) | 27 (14.9%) |
| 35 to 64 Years | 104 (22.2%) | 58 (12.8%) |
| 65 to 74 Years | 39 (44.8%) | 40 (50.0%) |
| 75 Years and over | 20 (51.3%) | 18 (39.1%) |
Disability Class by Sex by Age in Granby
Disability Class: Hearing Difficulty
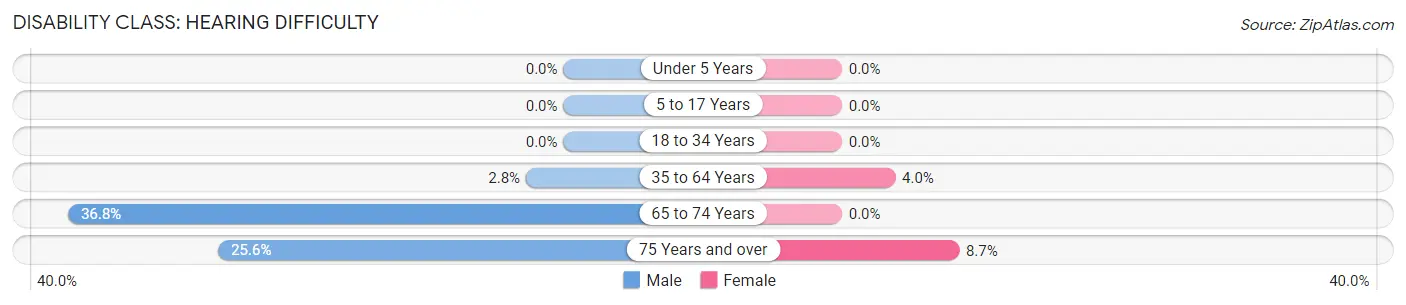
| Age Bracket | Male | Female |
| Under 5 Years | 0 (0.0%) | 0 (0.0%) |
| 5 to 17 Years | 0 (0.0%) | 0 (0.0%) |
| 18 to 34 Years | 0 (0.0%) | 0 (0.0%) |
| 35 to 64 Years | 13 (2.8%) | 18 (4.0%) |
| 65 to 74 Years | 32 (36.8%) | 0 (0.0%) |
| 75 Years and over | 10 (25.6%) | 4 (8.7%) |
Disability Class: Vision Difficulty
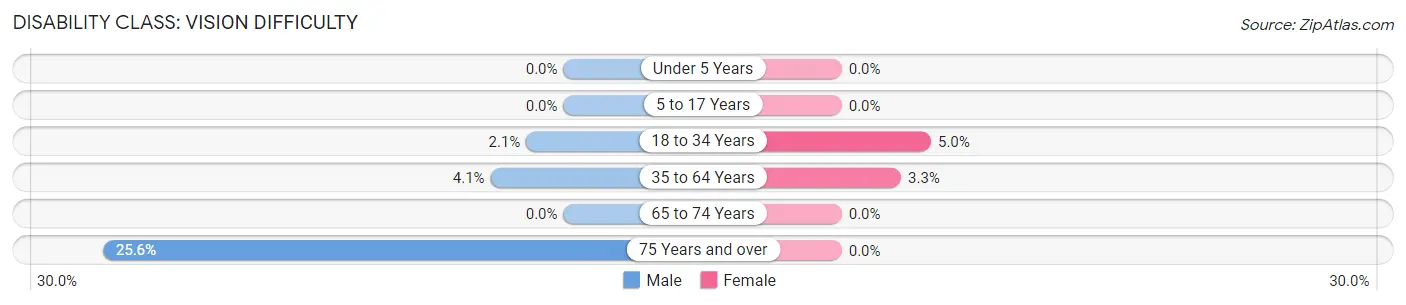
| Age Bracket | Male | Female |
| Under 5 Years | 0 (0.0%) | 0 (0.0%) |
| 5 to 17 Years | 0 (0.0%) | 0 (0.0%) |
| 18 to 34 Years | 5 (2.1%) | 9 (5.0%) |
| 35 to 64 Years | 19 (4.1%) | 15 (3.3%) |
| 65 to 74 Years | 0 (0.0%) | 0 (0.0%) |
| 75 Years and over | 10 (25.6%) | 0 (0.0%) |
Disability Class: Cognitive Difficulty
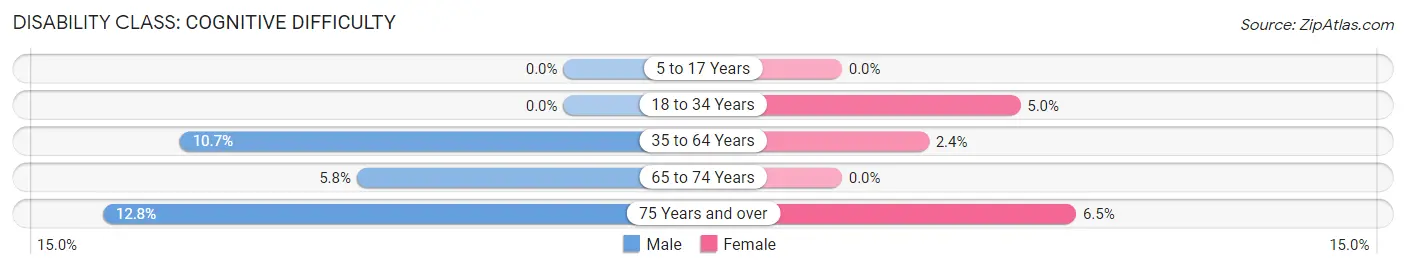
| Age Bracket | Male | Female |
| 5 to 17 Years | 0 (0.0%) | 0 (0.0%) |
| 18 to 34 Years | 0 (0.0%) | 9 (5.0%) |
| 35 to 64 Years | 50 (10.7%) | 11 (2.4%) |
| 65 to 74 Years | 5 (5.8%) | 0 (0.0%) |
| 75 Years and over | 5 (12.8%) | 3 (6.5%) |
Disability Class: Ambulatory Difficulty
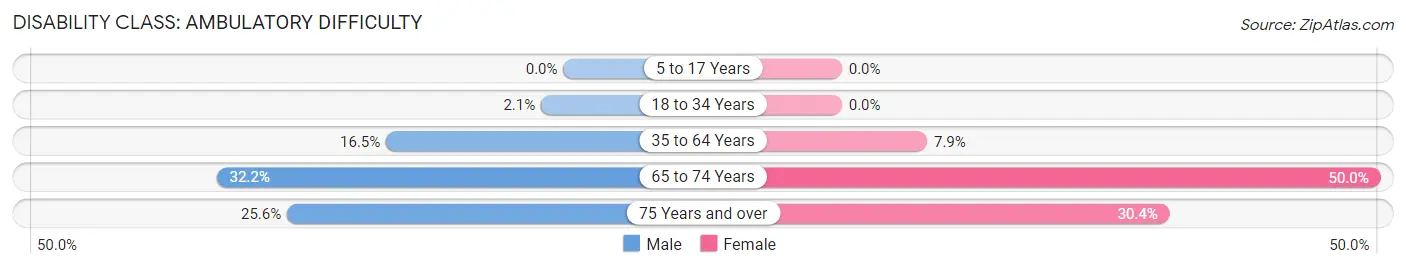
| Age Bracket | Male | Female |
| 5 to 17 Years | 0 (0.0%) | 0 (0.0%) |
| 18 to 34 Years | 5 (2.1%) | 0 (0.0%) |
| 35 to 64 Years | 77 (16.5%) | 36 (7.9%) |
| 65 to 74 Years | 28 (32.2%) | 40 (50.0%) |
| 75 Years and over | 10 (25.6%) | 14 (30.4%) |
Disability Class: Self-Care Difficulty
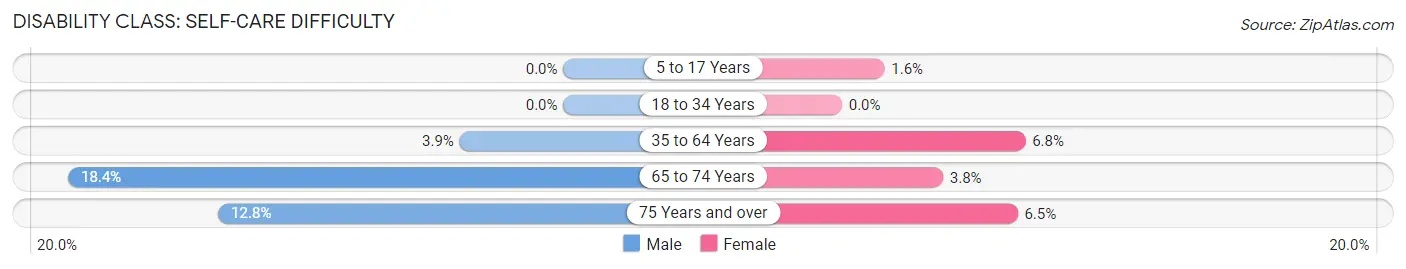
| Age Bracket | Male | Female |
| 5 to 17 Years | 0 (0.0%) | 4 (1.6%) |
| 18 to 34 Years | 0 (0.0%) | 0 (0.0%) |
| 35 to 64 Years | 18 (3.8%) | 31 (6.8%) |
| 65 to 74 Years | 16 (18.4%) | 3 (3.7%) |
| 75 Years and over | 5 (12.8%) | 3 (6.5%) |
Technology Access in Granby
Computing Device Access in Granby
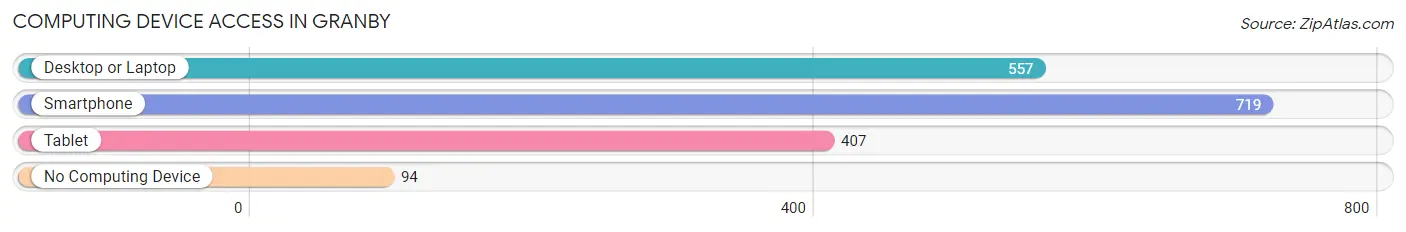
| Device Type | # Households | % Households |
| Desktop or Laptop | 557 | 66.5% |
| Smartphone | 719 | 85.9% |
| Tablet | 407 | 48.6% |
| No Computing Device | 94 | 11.2% |
| Total | 837 | 100.0% |
Internet Access in Granby
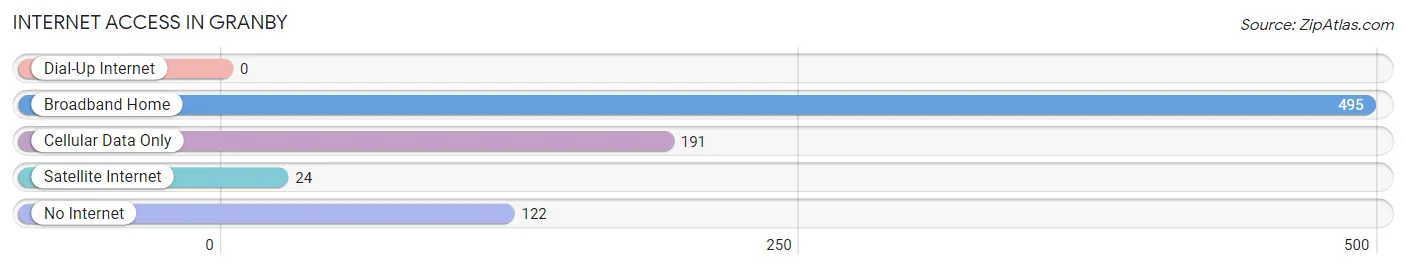
| Internet Type | # Households | % Households |
| Dial-Up Internet | 0 | 0.0% |
| Broadband Home | 495 | 59.1% |
| Cellular Data Only | 191 | 22.8% |
| Satellite Internet | 24 | 2.9% |
| No Internet | 122 | 14.6% |
| Total | 837 | 100.0% |
Granby Summary
Granby, Missouri is a small city located in Newton County in the southwestern corner of the state. It is situated on the banks of the Elk River, and is surrounded by rolling hills and wooded areas. The city has a population of approximately 2,500 people, and is the county seat of Newton County.
History
Granby was founded in 1883 by a group of settlers from the nearby town of Neosho. The town was named after Granby, Massachusetts, the hometown of one of the settlers. The town was incorporated in 1887, and the first post office was established in 1888.
Granby was a thriving agricultural community in the late 19th and early 20th centuries. The town was home to several large farms, and the local economy was largely based on the production of corn, wheat, and other crops. The town also had several small businesses, including a general store, a blacksmith shop, and a hotel.
In the early 20th century, Granby began to experience a decline in population as many of the town’s residents moved away to larger cities in search of better economic opportunities. The Great Depression of the 1930s further exacerbated the town’s economic woes, and by the 1940s the population had dropped to just over 1,000 people.
Geography
Granby is located in the southwestern corner of Missouri, in Newton County. The city is situated on the banks of the Elk River, and is surrounded by rolling hills and wooded areas. The city is located approximately 30 miles south of Joplin, Missouri, and is approximately 90 miles north of Tulsa, Oklahoma.
The climate in Granby is generally mild, with hot summers and cold winters. The average annual temperature is around 60 degrees Fahrenheit, and the average annual precipitation is around 40 inches.
Economy
Granby’s economy is largely based on agriculture and tourism. The town is home to several large farms, and the local economy is largely based on the production of corn, wheat, and other crops. The town also has several small businesses, including a general store, a blacksmith shop, and a hotel.
Granby is also a popular tourist destination, and the town is home to several attractions, including the Granby Museum, the Granby Zoo, and the Granby Historical Society. The town also hosts several annual festivals, including the Granby Fall Festival and the Granby Summer Festival.
Demographics
As of the 2010 census, Granby had a population of 2,500 people. The racial makeup of the town was 95.2% White, 0.8% African American, 0.4% Native American, 0.4% Asian, 0.2% Pacific Islander, and 2.8% from other races. The median household income was $31,250, and the median family income was $37,500.
Granby is a small town with a rich history and a vibrant economy. The town is home to several large farms, and the local economy is largely based on the production of corn, wheat, and other crops. The town also has several small businesses, and is a popular tourist destination. Granby is a great place to live, work, and visit.
Common Questions
What is Per Capita Income in Granby?
Per Capita income in Granby is $20,036.
What is the Median Family Income in Granby?
Median Family Income in Granby is $47,841.
What is the Median Household income in Granby?
Median Household Income in Granby is $34,934.
What is Income or Wage Gap in Granby?
Income or Wage Gap in Granby is 43.0%.
Women in Granby earn 57.0 cents for every dollar earned by a man.
What is Inequality or Gini Index in Granby?
Inequality or Gini Index in Granby is 0.42.
What is the Total Population of Granby?
Total Population of Granby is 2,274.
What is the Total Male Population of Granby?
Total Male Population of Granby is 1,165.
What is the Total Female Population of Granby?
Total Female Population of Granby is 1,109.
What is the Ratio of Males per 100 Females in Granby?
There are 105.05 Males per 100 Females in Granby.
What is the Ratio of Females per 100 Males in Granby?
There are 95.19 Females per 100 Males in Granby.
What is the Median Population Age in Granby?
Median Population Age in Granby is 38.4 Years.
What is the Average Family Size in Granby
Average Family Size in Granby is 3.1 People.
What is the Average Household Size in Granby
Average Household Size in Granby is 2.6 People.
How Large is the Labor Force in Granby?
There are 1,074 People in the Labor Forcein in Granby.
What is the Percentage of People in the Labor Force in Granby?
63.2% of People are in the Labor Force in Granby.
What is the Unemployment Rate in Granby?
Unemployment Rate in Granby is 14.5%.