Garden City, MO Map & Demographics
Garden City Map
Garden City Overview
$28,504
PER CAPITA INCOME
$67,500
AVG FAMILY INCOME
$62,539
AVG HOUSEHOLD INCOME
21.3%
WAGE / INCOME GAP [ % ]
78.7¢/ $1
WAGE / INCOME GAP [ $ ]
0.35
INEQUALITY / GINI INDEX
1,711
TOTAL POPULATION
865
MALE POPULATION
846
FEMALE POPULATION
102.25
MALES / 100 FEMALES
97.80
FEMALES / 100 MALES
33.9
MEDIAN AGE
3.1
AVG FAMILY SIZE
2.6
AVG HOUSEHOLD SIZE
902
LABOR FORCE [ PEOPLE ]
71.2%
PERCENT IN LABOR FORCE
3.5%
UNEMPLOYMENT RATE
Garden City Zip Codes
Garden City Area Codes
Income in Garden City
Income Overview in Garden City
Per Capita Income in Garden City is $28,504, while median incomes of families and households are $67,500 and $62,539 respectively.
| Characteristic | Number | Measure |
| Per Capita Income | 1,711 | $28,504 |
| Median Family Income | 448 | $67,500 |
| Mean Family Income | 448 | $81,739 |
| Median Household Income | 665 | $62,539 |
| Mean Household Income | 665 | $71,421 |
| Income Deficit | 448 | $0 |
| Wage / Income Gap (%) | 1,711 | 21.25% |
| Wage / Income Gap ($) | 1,711 | 78.75¢ per $1 |
| Gini / Inequality Index | 1,711 | 0.35 |
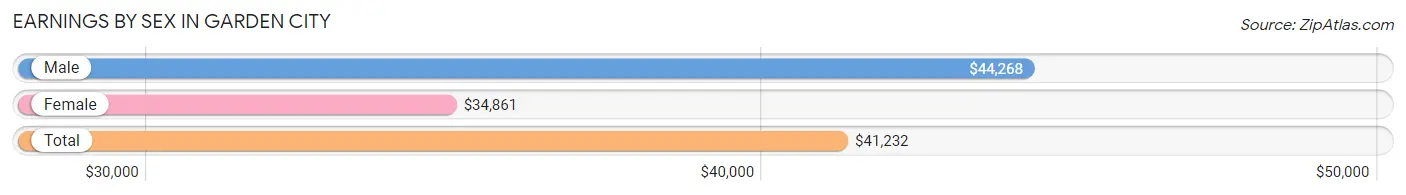
Earnings by Sex in Garden City
Average Earnings in Garden City are $41,232, $44,268 for men and $34,861 for women, a difference of 21.2%.
| Sex | Number | Average Earnings |
| Male | 498 (53.8%) | $44,268 |
| Female | 428 (46.2%) | $34,861 |
| Total | 926 (100.0%) | $41,232 |
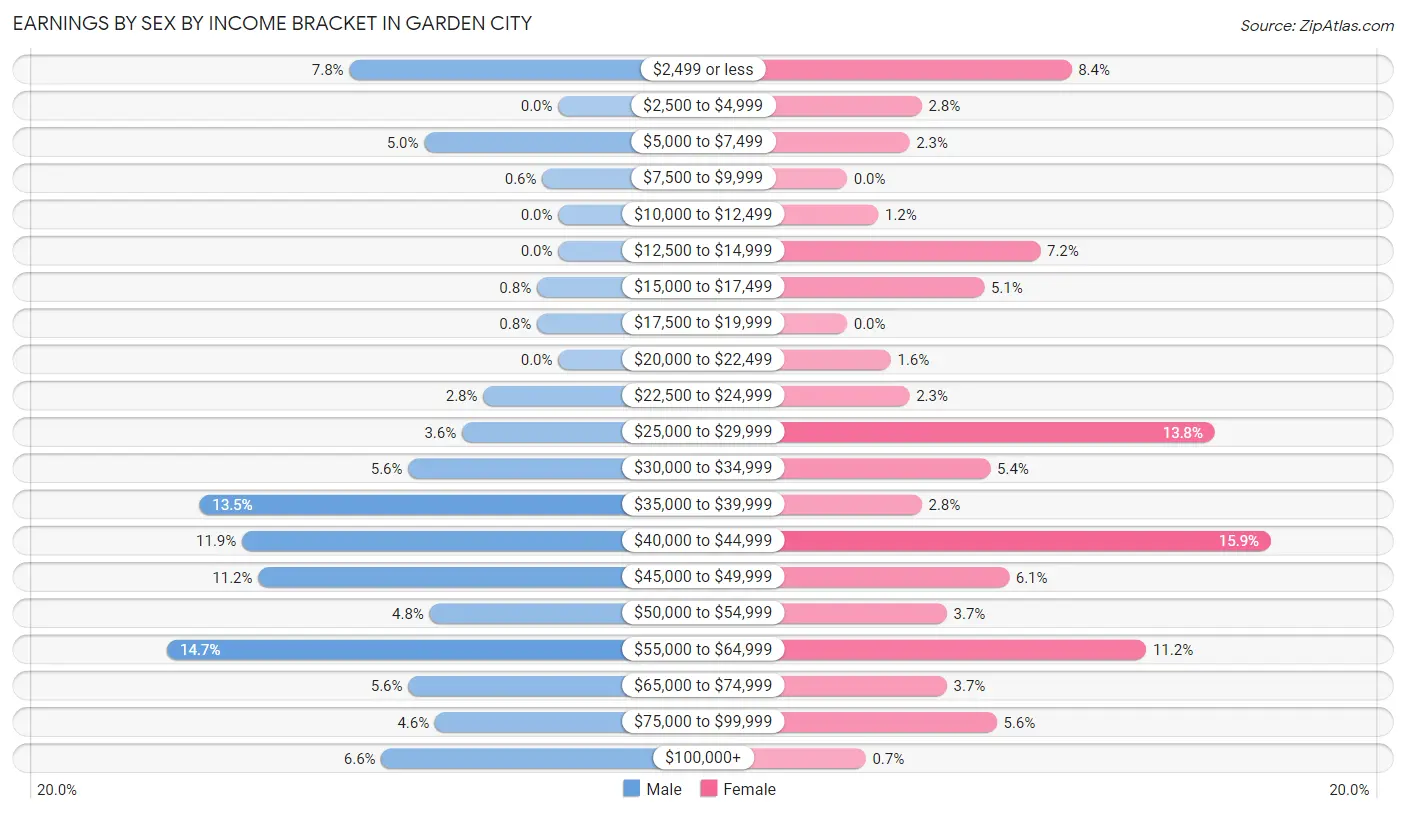
Earnings by Sex by Income Bracket in Garden City
The most common earnings brackets in Garden City are $55,000 to $64,999 for men (73 | 14.7%) and $40,000 to $44,999 for women (68 | 15.9%).
| Income | Male | Female |
| $2,499 or less | 39 (7.8%) | 36 (8.4%) |
| $2,500 to $4,999 | 0 (0.0%) | 12 (2.8%) |
| $5,000 to $7,499 | 25 (5.0%) | 10 (2.3%) |
| $7,500 to $9,999 | 3 (0.6%) | 0 (0.0%) |
| $10,000 to $12,499 | 0 (0.0%) | 5 (1.2%) |
| $12,500 to $14,999 | 0 (0.0%) | 31 (7.2%) |
| $15,000 to $17,499 | 4 (0.8%) | 22 (5.1%) |
| $17,500 to $19,999 | 4 (0.8%) | 0 (0.0%) |
| $20,000 to $22,499 | 0 (0.0%) | 7 (1.6%) |
| $22,500 to $24,999 | 14 (2.8%) | 10 (2.3%) |
| $25,000 to $29,999 | 18 (3.6%) | 59 (13.8%) |
| $30,000 to $34,999 | 28 (5.6%) | 23 (5.4%) |
| $35,000 to $39,999 | 67 (13.5%) | 12 (2.8%) |
| $40,000 to $44,999 | 59 (11.8%) | 68 (15.9%) |
| $45,000 to $49,999 | 56 (11.2%) | 26 (6.1%) |
| $50,000 to $54,999 | 24 (4.8%) | 16 (3.7%) |
| $55,000 to $64,999 | 73 (14.7%) | 48 (11.2%) |
| $65,000 to $74,999 | 28 (5.6%) | 16 (3.7%) |
| $75,000 to $99,999 | 23 (4.6%) | 24 (5.6%) |
| $100,000+ | 33 (6.6%) | 3 (0.7%) |
| Total | 498 (100.0%) | 428 (100.0%) |
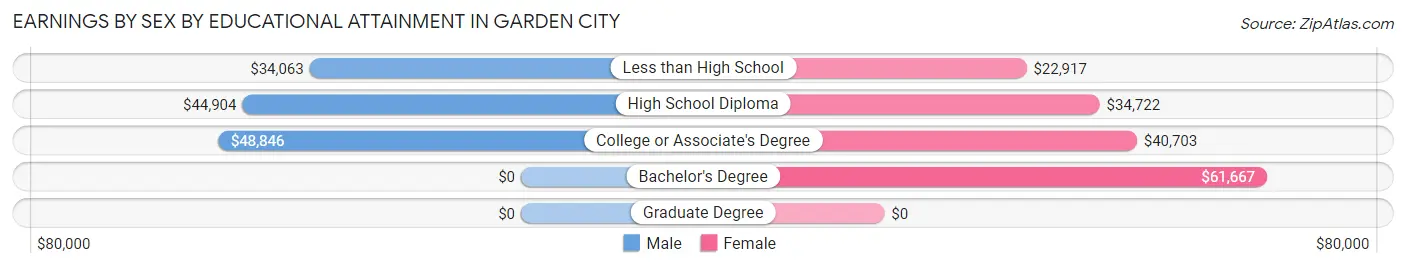
Earnings by Sex by Educational Attainment in Garden City
Average earnings in Garden City are $45,234 for men and $40,784 for women, a difference of 9.8%. Men with an educational attainment of college or associate's degree enjoy the highest average annual earnings of $48,846, while those with less than high school education earn the least with $34,063. Women with an educational attainment of bachelor's degree earn the most with the average annual earnings of $61,667, while those with less than high school education have the smallest earnings of $22,917.
| Educational Attainment | Male Income | Female Income |
| Less than High School | $34,063 | $22,917 |
| High School Diploma | $44,904 | $34,722 |
| College or Associate's Degree | $48,846 | $40,703 |
| Bachelor's Degree | - | - |
| Graduate Degree | - | - |
| Total | $45,234 | $40,784 |
Family Income in Garden City
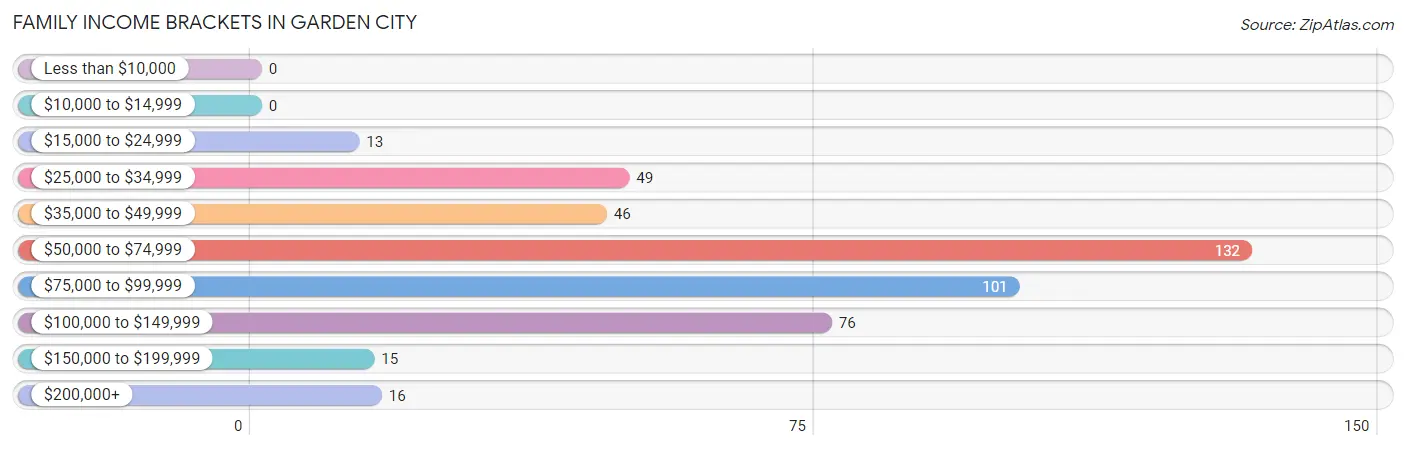
Family Income Brackets in Garden City
According to the Garden City family income data, there are 132 families falling into the $50,000 to $74,999 income range, which is the most common income bracket and makes up 29.5% of all families.
| Income Bracket | # Families | % Families |
| Less than $10,000 | 0 | 0.0% |
| $10,000 to $14,999 | 0 | 0.0% |
| $15,000 to $24,999 | 13 | 2.9% |
| $25,000 to $34,999 | 49 | 10.9% |
| $35,000 to $49,999 | 46 | 10.3% |
| $50,000 to $74,999 | 132 | 29.5% |
| $75,000 to $99,999 | 101 | 22.5% |
| $100,000 to $149,999 | 76 | 17.0% |
| $150,000 to $199,999 | 15 | 3.3% |
| $200,000+ | 16 | 3.6% |
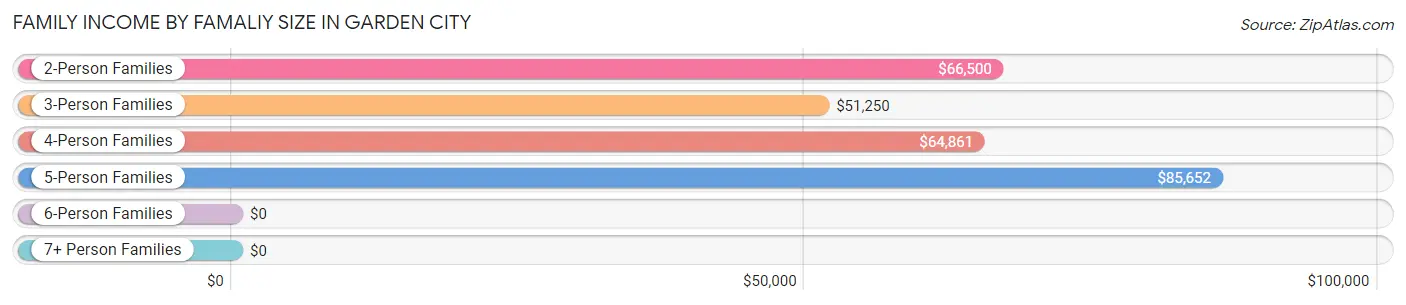
Family Income by Famaliy Size in Garden City
5-person families (42 | 9.4%) account for the highest median family income in Garden City with $85,652 per family, while 2-person families (224 | 50.0%) have the highest median income of $33,250 per family member.
| Income Bracket | # Families | Median Income |
| 2-Person Families | 224 (50.0%) | $66,500 |
| 3-Person Families | 90 (20.1%) | $51,250 |
| 4-Person Families | 75 (16.7%) | $64,861 |
| 5-Person Families | 42 (9.4%) | $85,652 |
| 6-Person Families | 4 (0.9%) | $0 |
| 7+ Person Families | 13 (2.9%) | $0 |
| Total | 448 (100.0%) | $67,500 |
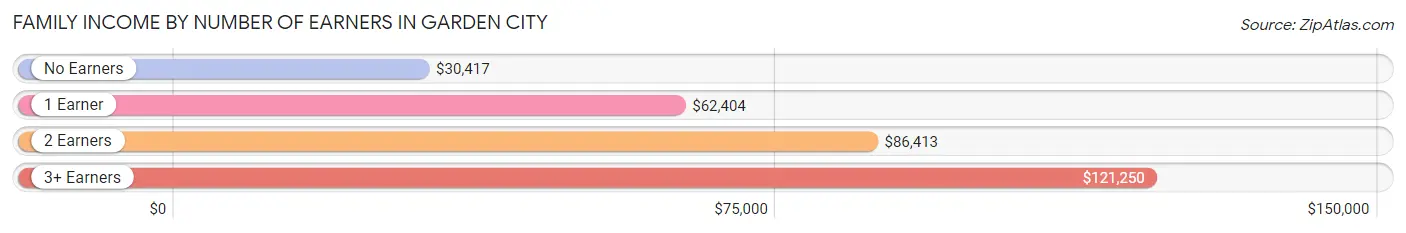
Family Income by Number of Earners in Garden City
The median family income in Garden City is $67,500, with families comprising 3+ earners (46) having the highest median family income of $121,250, while families with no earners (47) have the lowest median family income of $30,417, accounting for 10.3% and 10.5% of families, respectively.
| Number of Earners | # Families | Median Income |
| No Earners | 47 (10.5%) | $30,417 |
| 1 Earner | 153 (34.2%) | $62,404 |
| 2 Earners | 202 (45.1%) | $86,413 |
| 3+ Earners | 46 (10.3%) | $121,250 |
| Total | 448 (100.0%) | $67,500 |
Household Income in Garden City
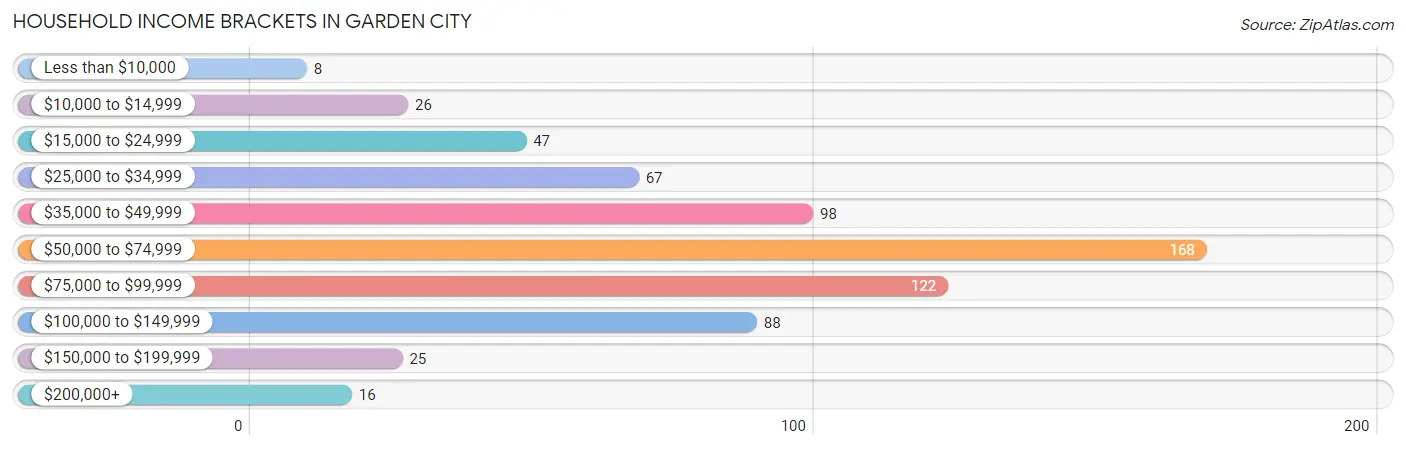
Household Income Brackets in Garden City
With 168 households falling in the category, the $50,000 to $74,999 income range is the most frequent in Garden City, accounting for 25.3% of all households. In contrast, only 8 households (1.2%) fall into the less than $10,000 income bracket, making it the least populous group.
| Income Bracket | # Households | % Households |
| Less than $10,000 | 8 | 1.2% |
| $10,000 to $14,999 | 26 | 3.9% |
| $15,000 to $24,999 | 47 | 7.1% |
| $25,000 to $34,999 | 67 | 10.1% |
| $35,000 to $49,999 | 98 | 14.7% |
| $50,000 to $74,999 | 168 | 25.3% |
| $75,000 to $99,999 | 122 | 18.3% |
| $100,000 to $149,999 | 88 | 13.2% |
| $150,000 to $199,999 | 25 | 3.8% |
| $200,000+ | 16 | 2.4% |
Household Income by Householder Age in Garden City
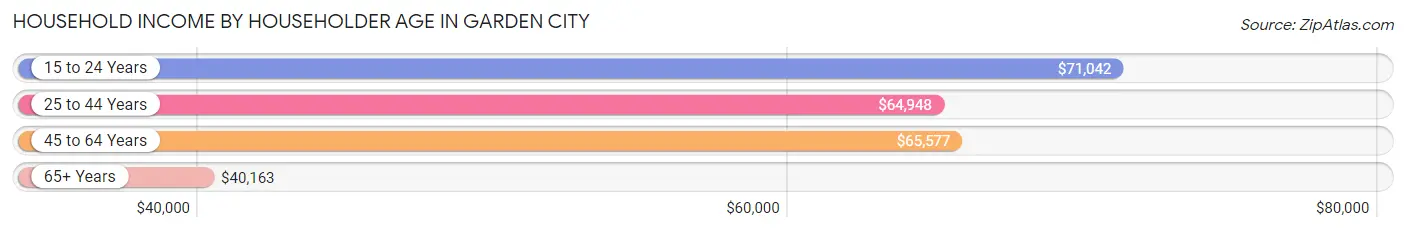
The median household income in Garden City is $62,539, with the highest median household income of $71,042 found in the 15 to 24 years age bracket for the primary householder. A total of 23 households (3.5%) fall into this category. Meanwhile, the 65+ years age bracket for the primary householder has the lowest median household income of $40,163, with 183 households (27.5%) in this group.
| Income Bracket | # Households | Median Income |
| 15 to 24 Years | 23 (3.5%) | $71,042 |
| 25 to 44 Years | 229 (34.4%) | $64,948 |
| 45 to 64 Years | 230 (34.6%) | $65,577 |
| 65+ Years | 183 (27.5%) | $40,163 |
| Total | 665 (100.0%) | $62,539 |
Poverty in Garden City
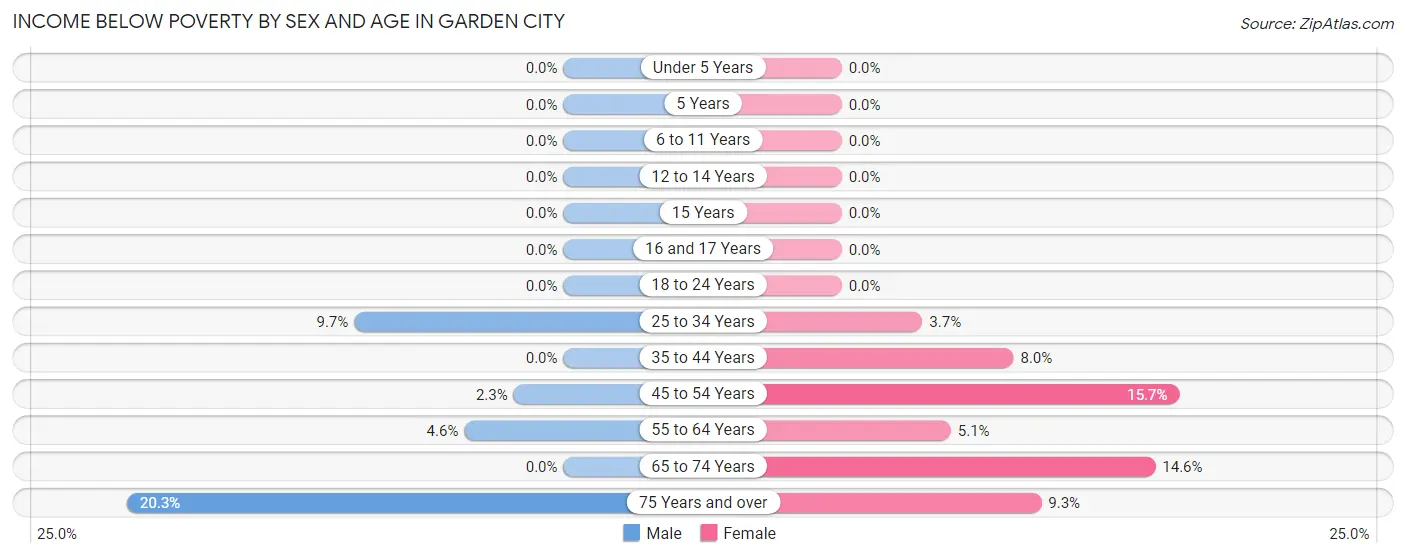
Income Below Poverty by Sex and Age in Garden City
With 4.6% poverty level for males and 5.3% for females among the residents of Garden City, 75 year old and over males and 45 to 54 year old females are the most vulnerable to poverty, with 16 males (20.3%) and 13 females (15.7%) in their respective age groups living below the poverty level.
| Age Bracket | Male | Female |
| Under 5 Years | 0 (0.0%) | 0 (0.0%) |
| 5 Years | 0 (0.0%) | 0 (0.0%) |
| 6 to 11 Years | 0 (0.0%) | 0 (0.0%) |
| 12 to 14 Years | 0 (0.0%) | 0 (0.0%) |
| 15 Years | 0 (0.0%) | 0 (0.0%) |
| 16 and 17 Years | 0 (0.0%) | 0 (0.0%) |
| 18 to 24 Years | 0 (0.0%) | 0 (0.0%) |
| 25 to 34 Years | 17 (9.7%) | 4 (3.7%) |
| 35 to 44 Years | 0 (0.0%) | 11 (8.0%) |
| 45 to 54 Years | 3 (2.3%) | 13 (15.7%) |
| 55 to 64 Years | 4 (4.6%) | 4 (5.1%) |
| 65 to 74 Years | 0 (0.0%) | 8 (14.5%) |
| 75 Years and over | 16 (20.3%) | 5 (9.3%) |
| Total | 40 (4.6%) | 45 (5.3%) |
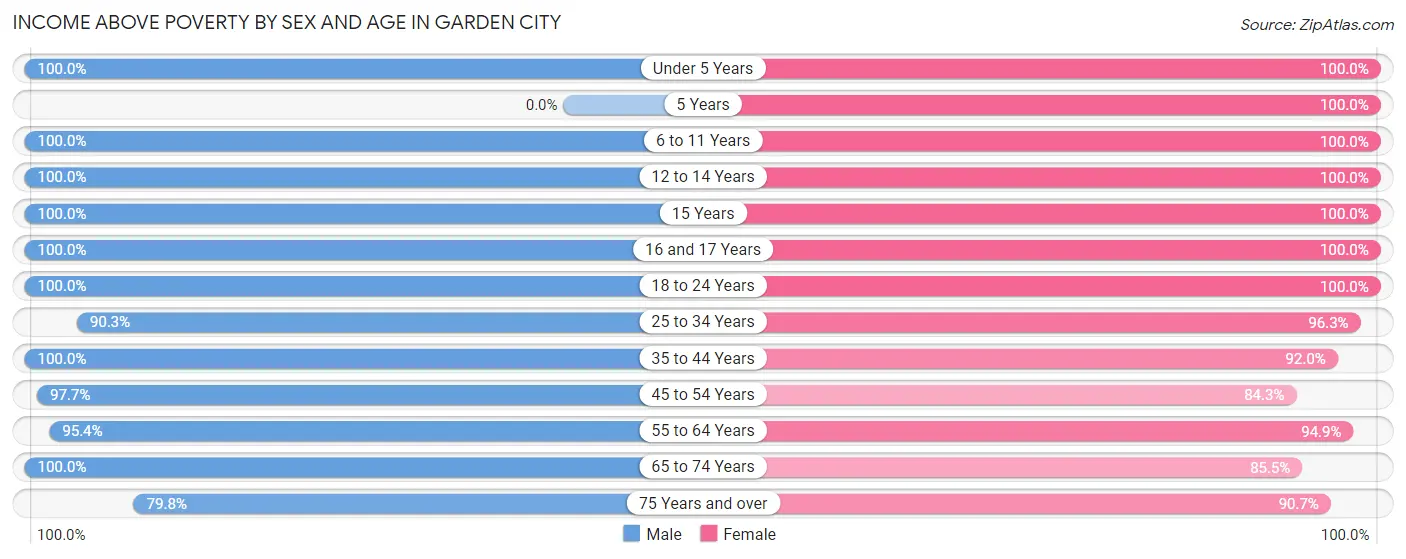
Income Above Poverty by Sex and Age in Garden City
According to the poverty statistics in Garden City, males aged under 5 years and females aged under 5 years are the age groups that are most secure financially, with 100.0% of males and 100.0% of females in these age groups living above the poverty line.
| Age Bracket | Male | Female |
| Under 5 Years | 58 (100.0%) | 33 (100.0%) |
| 5 Years | 0 (0.0%) | 26 (100.0%) |
| 6 to 11 Years | 59 (100.0%) | 154 (100.0%) |
| 12 to 14 Years | 51 (100.0%) | 34 (100.0%) |
| 15 Years | 16 (100.0%) | 7 (100.0%) |
| 16 and 17 Years | 29 (100.0%) | 9 (100.0%) |
| 18 to 24 Years | 38 (100.0%) | 65 (100.0%) |
| 25 to 34 Years | 158 (90.3%) | 103 (96.3%) |
| 35 to 44 Years | 68 (100.0%) | 127 (92.0%) |
| 45 to 54 Years | 127 (97.7%) | 70 (84.3%) |
| 55 to 64 Years | 83 (95.4%) | 75 (94.9%) |
| 65 to 74 Years | 71 (100.0%) | 47 (85.5%) |
| 75 Years and over | 63 (79.7%) | 49 (90.7%) |
| Total | 821 (95.4%) | 799 (94.7%) |
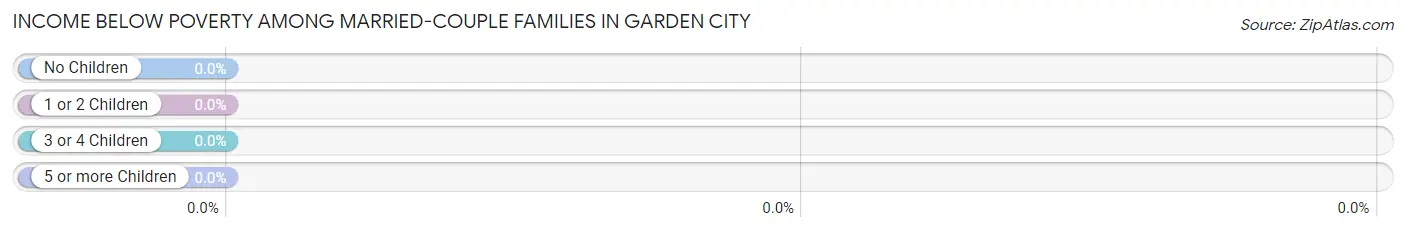
Income Below Poverty Among Married-Couple Families in Garden City
| Children | Above Poverty | Below Poverty |
| No Children | 178 (100.0%) | 0 (0.0%) |
| 1 or 2 Children | 103 (100.0%) | 0 (0.0%) |
| 3 or 4 Children | 38 (100.0%) | 0 (0.0%) |
| 5 or more Children | 13 (100.0%) | 0 (0.0%) |
| Total | 332 (100.0%) | 0 (0.0%) |
Income Below Poverty Among Single-Parent Households in Garden City
| Children | Single Father | Single Mother |
| No Children | 0 (0.0%) | 0 (0.0%) |
| 1 or 2 Children | 0 (0.0%) | 0 (0.0%) |
| 3 or 4 Children | 0 (0.0%) | 0 (0.0%) |
| 5 or more Children | 0 (0.0%) | 0 (0.0%) |
| Total | 0 (0.0%) | 0 (0.0%) |
Income Below Poverty Among Married-Couple vs Single-Parent Households in Garden City
| Children | Married-Couple Families | Single-Parent Households |
| No Children | 0 (0.0%) | 0 (0.0%) |
| 1 or 2 Children | 0 (0.0%) | 0 (0.0%) |
| 3 or 4 Children | 0 (0.0%) | 0 (0.0%) |
| 5 or more Children | 0 (0.0%) | 0 (0.0%) |
| Total | 0 (0.0%) | 0 (0.0%) |
Race in Garden City
The most populous races in Garden City are White / Caucasian (1,539 | 89.9%), Two or more Races (127 | 7.4%), and Hispanic or Latino (70 | 4.1%).
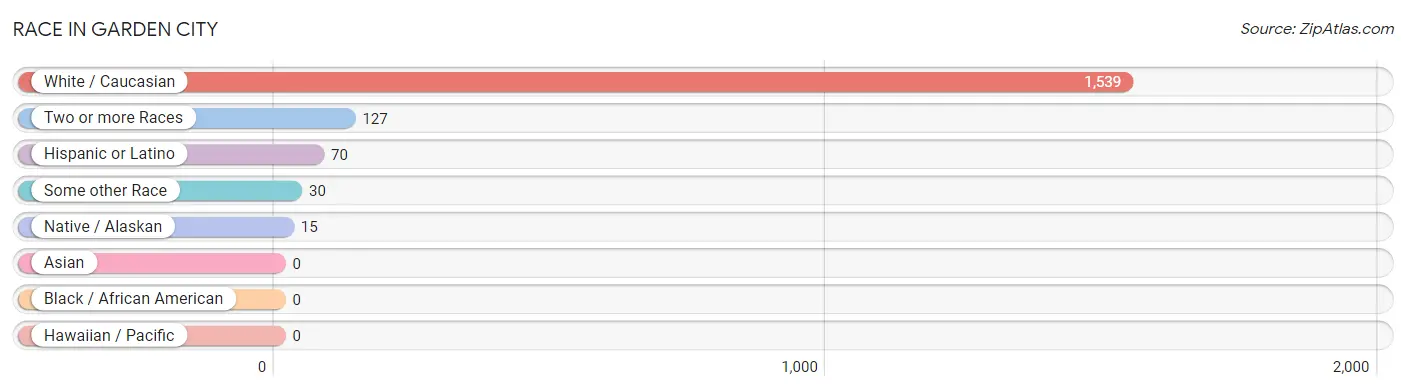
| Race | # Population | % Population |
| Asian | 0 | 0.0% |
| Black / African American | 0 | 0.0% |
| Hawaiian / Pacific | 0 | 0.0% |
| Hispanic or Latino | 70 | 4.1% |
| Native / Alaskan | 15 | 0.9% |
| White / Caucasian | 1,539 | 89.9% |
| Two or more Races | 127 | 7.4% |
| Some other Race | 30 | 1.8% |
| Total | 1,711 | 100.0% |
Ancestry in Garden City
The most populous ancestries reported in Garden City are German (322 | 18.8%), American (183 | 10.7%), Irish (153 | 8.9%), English (126 | 7.4%), and Mexican (59 | 3.5%), together accounting for 49.3% of all Garden City residents.
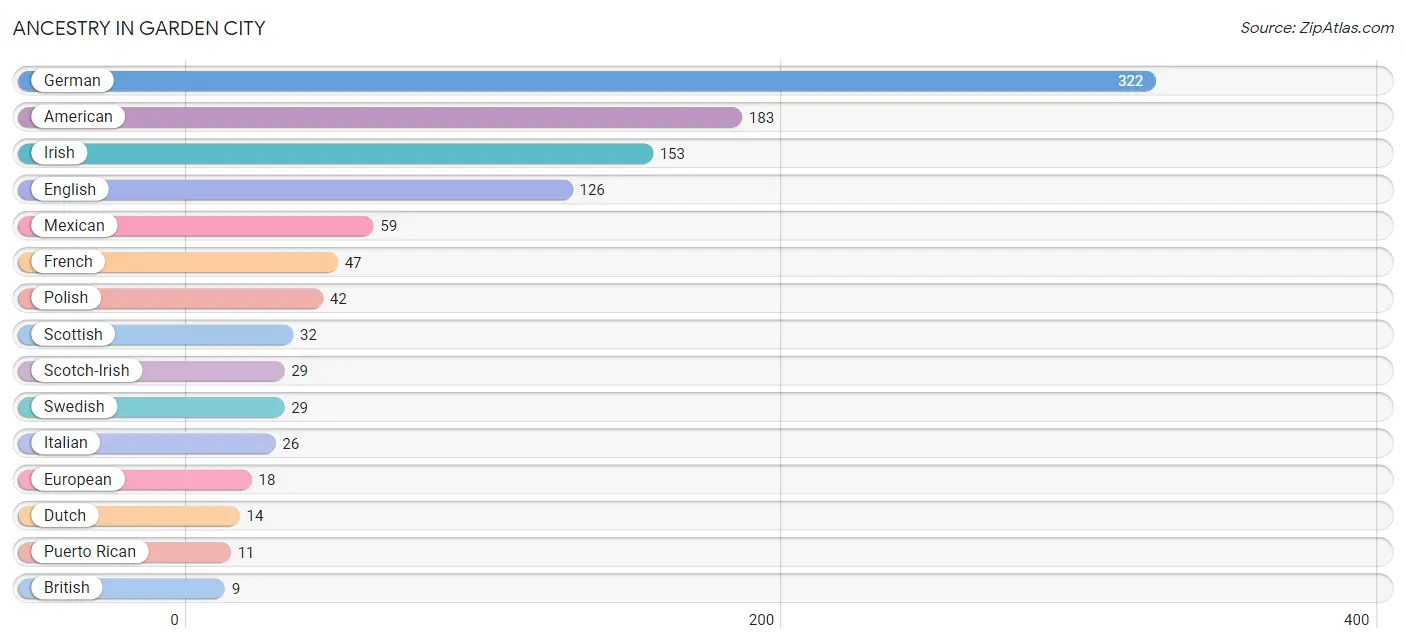
| Ancestry | # Population | % Population |
| American | 183 | 10.7% |
| Apache | 7 | 0.4% |
| British | 9 | 0.5% |
| Cherokee | 1 | 0.1% |
| Czech | 9 | 0.5% |
| Danish | 2 | 0.1% |
| Dutch | 14 | 0.8% |
| English | 126 | 7.4% |
| European | 18 | 1.1% |
| French | 47 | 2.8% |
| German | 322 | 18.8% |
| Irish | 153 | 8.9% |
| Italian | 26 | 1.5% |
| Mexican | 59 | 3.5% |
| Mexican American Indian | 4 | 0.2% |
| Northern European | 4 | 0.2% |
| Norwegian | 7 | 0.4% |
| Polish | 42 | 2.5% |
| Portuguese | 4 | 0.2% |
| Puerto Rican | 11 | 0.6% |
| Scandinavian | 3 | 0.2% |
| Scotch-Irish | 29 | 1.7% |
| Scottish | 32 | 1.9% |
| Swedish | 29 | 1.7% |
| Swiss | 3 | 0.2% |
| Welsh | 5 | 0.3% | View All 26 Rows |
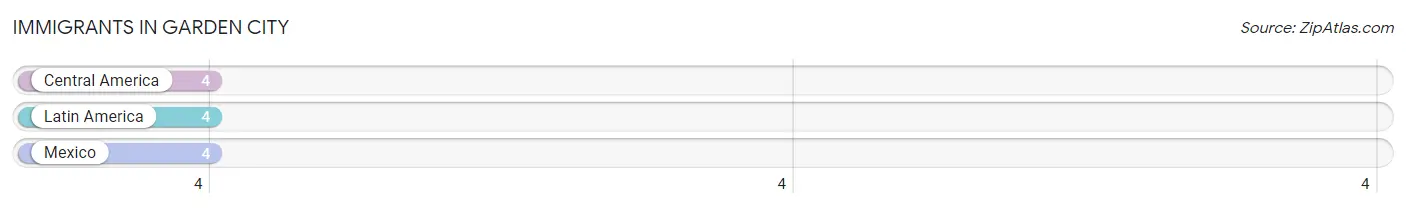
Immigrants in Garden City
The most numerous immigrant groups reported in Garden City came from Central America (4 | 0.2%), Latin America (4 | 0.2%), and Mexico (4 | 0.2%), together accounting for 0.7% of all Garden City residents.
| Immigration Origin | # Population | % Population |
| Central America | 4 | 0.2% |
| Latin America | 4 | 0.2% |
| Mexico | 4 | 0.2% | View All 3 Rows |
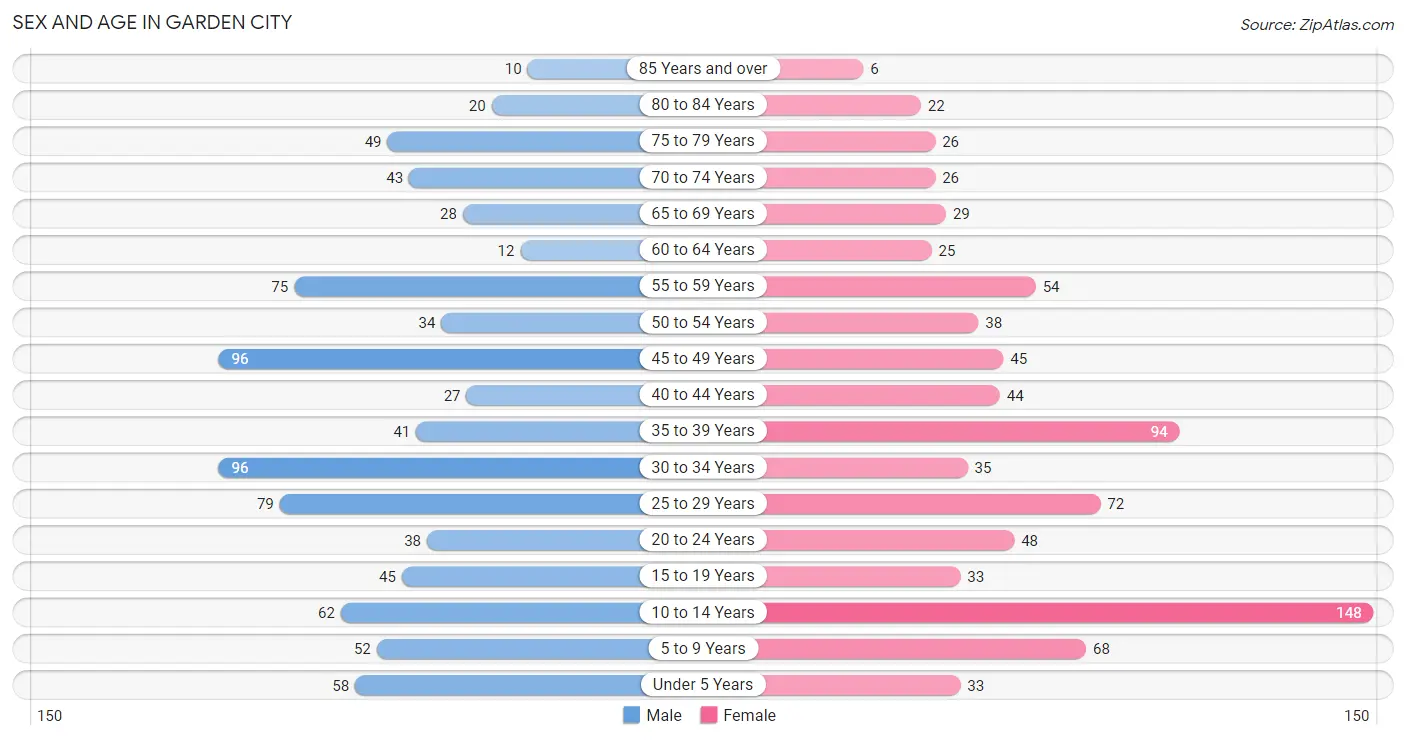
Sex and Age in Garden City
Sex and Age in Garden City
The most populous age groups in Garden City are 30 to 34 Years (96 | 11.1%) for men and 10 to 14 Years (148 | 17.5%) for women.
| Age Bracket | Male | Female |
| Under 5 Years | 58 (6.7%) | 33 (3.9%) |
| 5 to 9 Years | 52 (6.0%) | 68 (8.0%) |
| 10 to 14 Years | 62 (7.2%) | 148 (17.5%) |
| 15 to 19 Years | 45 (5.2%) | 33 (3.9%) |
| 20 to 24 Years | 38 (4.4%) | 48 (5.7%) |
| 25 to 29 Years | 79 (9.1%) | 72 (8.5%) |
| 30 to 34 Years | 96 (11.1%) | 35 (4.1%) |
| 35 to 39 Years | 41 (4.7%) | 94 (11.1%) |
| 40 to 44 Years | 27 (3.1%) | 44 (5.2%) |
| 45 to 49 Years | 96 (11.1%) | 45 (5.3%) |
| 50 to 54 Years | 34 (3.9%) | 38 (4.5%) |
| 55 to 59 Years | 75 (8.7%) | 54 (6.4%) |
| 60 to 64 Years | 12 (1.4%) | 25 (3.0%) |
| 65 to 69 Years | 28 (3.2%) | 29 (3.4%) |
| 70 to 74 Years | 43 (5.0%) | 26 (3.1%) |
| 75 to 79 Years | 49 (5.7%) | 26 (3.1%) |
| 80 to 84 Years | 20 (2.3%) | 22 (2.6%) |
| 85 Years and over | 10 (1.2%) | 6 (0.7%) |
| Total | 865 (100.0%) | 846 (100.0%) |
Families and Households in Garden City
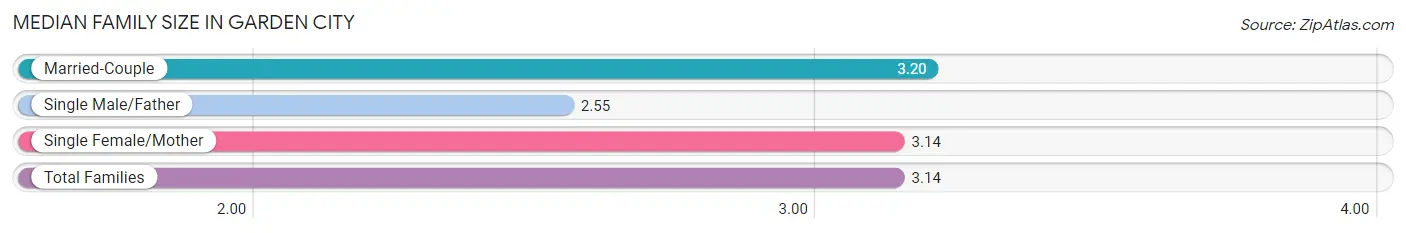
Median Family Size in Garden City
The median family size in Garden City is 3.14 persons per family, with married-couple families (332 | 74.1%) accounting for the largest median family size of 3.2 persons per family. On the other hand, single male/father families (40 | 8.9%) represent the smallest median family size with 2.55 persons per family.
| Family Type | # Families | Family Size |
| Married-Couple | 332 (74.1%) | 3.20 |
| Single Male/Father | 40 (8.9%) | 2.55 |
| Single Female/Mother | 76 (17.0%) | 3.14 |
| Total Families | 448 (100.0%) | 3.14 |
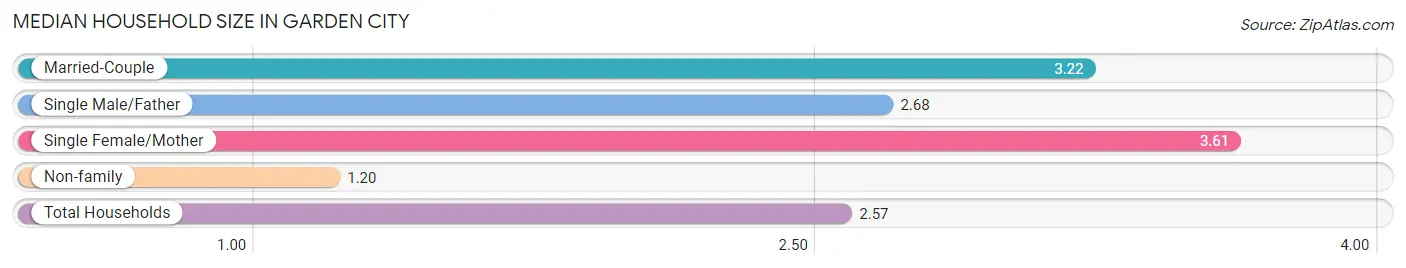
Median Household Size in Garden City
The median household size in Garden City is 2.57 persons per household, with single female/mother households (76 | 11.4%) accounting for the largest median household size of 3.61 persons per household. non-family households (217 | 32.6%) represent the smallest median household size with 1.20 persons per household.
| Household Type | # Households | Household Size |
| Married-Couple | 332 (49.9%) | 3.22 |
| Single Male/Father | 40 (6.0%) | 2.68 |
| Single Female/Mother | 76 (11.4%) | 3.61 |
| Non-family | 217 (32.6%) | 1.20 |
| Total Households | 665 (100.0%) | 2.57 |
Household Size by Marriage Status in Garden City
Out of a total of 665 households in Garden City, 448 (67.4%) are family households, while 217 (32.6%) are nonfamily households. The most numerous type of family households are 2-person households, comprising 217, and the most common type of nonfamily households are 1-person households, comprising 182.
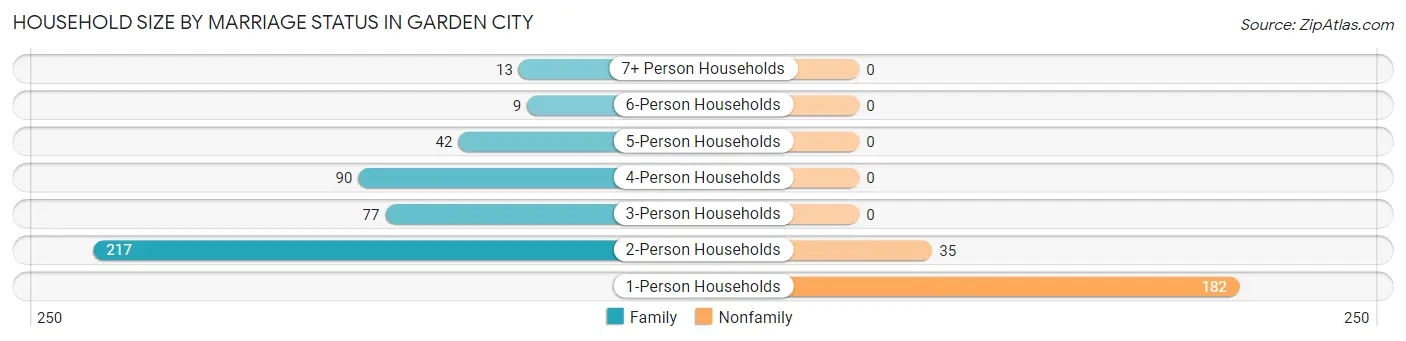
| Household Size | Family Households | Nonfamily Households |
| 1-Person Households | - | 182 (27.4%) |
| 2-Person Households | 217 (32.6%) | 35 (5.3%) |
| 3-Person Households | 77 (11.6%) | 0 (0.0%) |
| 4-Person Households | 90 (13.5%) | 0 (0.0%) |
| 5-Person Households | 42 (6.3%) | 0 (0.0%) |
| 6-Person Households | 9 (1.3%) | 0 (0.0%) |
| 7+ Person Households | 13 (1.9%) | 0 (0.0%) |
| Total | 448 (67.4%) | 217 (32.6%) |
Female Fertility in Garden City
Fertility by Age in Garden City
Average fertility rate in Garden City is 46.0 births per 1,000 women. Women in the age bracket of 20 to 34 years have the highest fertility rate with 90.0 births per 1,000 women. Women in the age bracket of 20 to 34 years acount for 82.4% of all women with births.
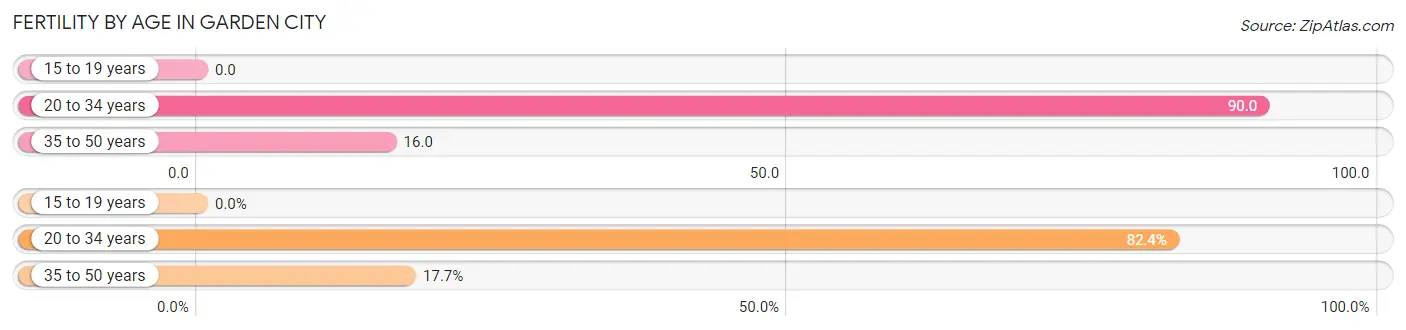
| Age Bracket | Women with Births | Births / 1,000 Women |
| 15 to 19 years | 0 (0.0%) | 0.0 |
| 20 to 34 years | 14 (82.4%) | 90.0 |
| 35 to 50 years | 3 (17.6%) | 16.0 |
| Total | 17 (100.0%) | 46.0 |
Fertility by Age by Marriage Status in Garden City
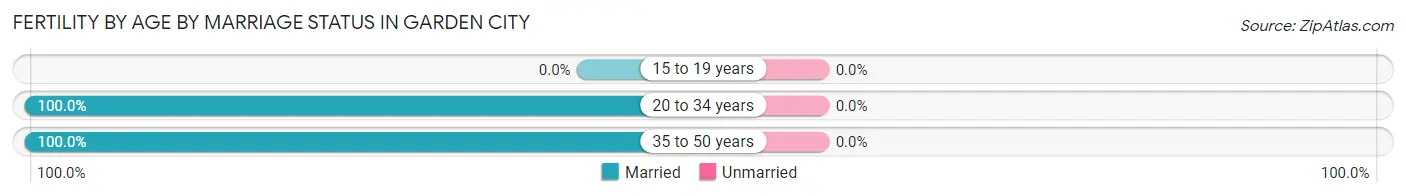
| Age Bracket | Married | Unmarried |
| 15 to 19 years | 0 (0.0%) | 0 (0.0%) |
| 20 to 34 years | 14 (100.0%) | 0 (0.0%) |
| 35 to 50 years | 3 (100.0%) | 0 (0.0%) |
| Total | 17 (100.0%) | 0 (0.0%) |
Fertility by Education in Garden City
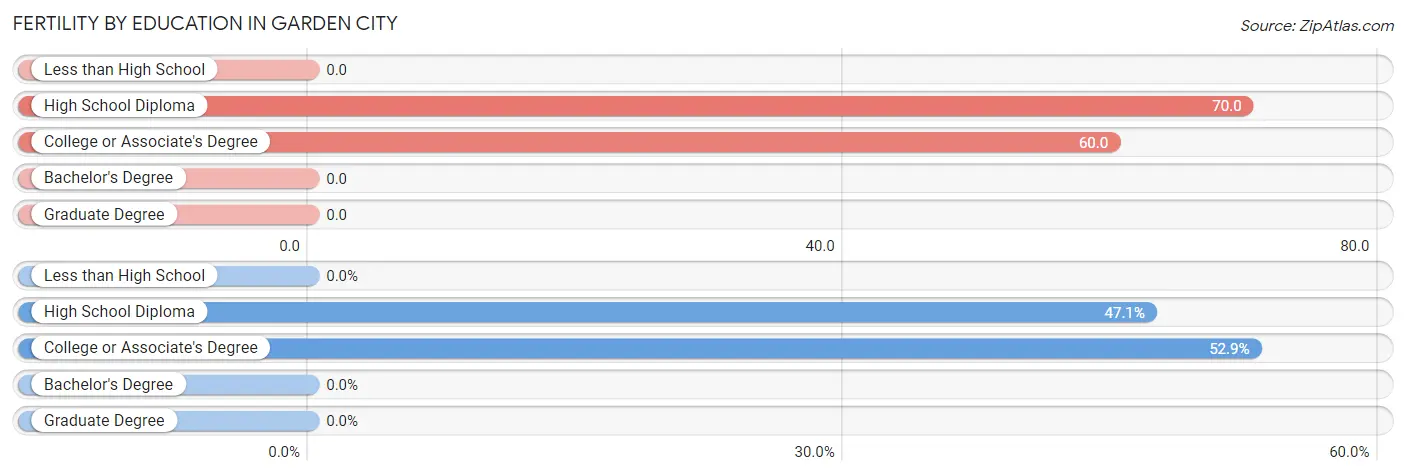
| Educational Attainment | Women with Births | Births / 1,000 Women |
| Less than High School | 0 (0.0%) | 0.0 |
| High School Diploma | 8 (47.1%) | 70.0 |
| College or Associate's Degree | 9 (52.9%) | 60.0 |
| Bachelor's Degree | 0 (0.0%) | 0.0 |
| Graduate Degree | 0 (0.0%) | 0.0 |
| Total | 17 (100.0%) | 46.0 |
Fertility by Education by Marriage Status in Garden City
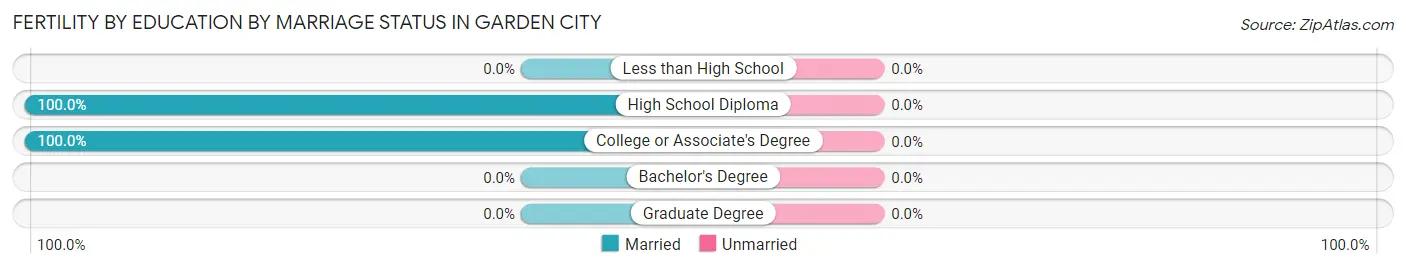
| Educational Attainment | Married | Unmarried |
| Less than High School | 0 (0.0%) | 0 (0.0%) |
| High School Diploma | 8 (100.0%) | 0 (0.0%) |
| College or Associate's Degree | 9 (100.0%) | 0 (0.0%) |
| Bachelor's Degree | 0 (0.0%) | 0 (0.0%) |
| Graduate Degree | 0 (0.0%) | 0 (0.0%) |
| Total | 17 (100.0%) | 0 (0.0%) |
Employment Characteristics in Garden City
Employment by Class of Employer in Garden City
Among the 861 employed individuals in Garden City, private company employees (655 | 76.1%), self-employed (not incorporated) (63 | 7.3%), and local government employees (45 | 5.2%) make up the most common classes of employment.
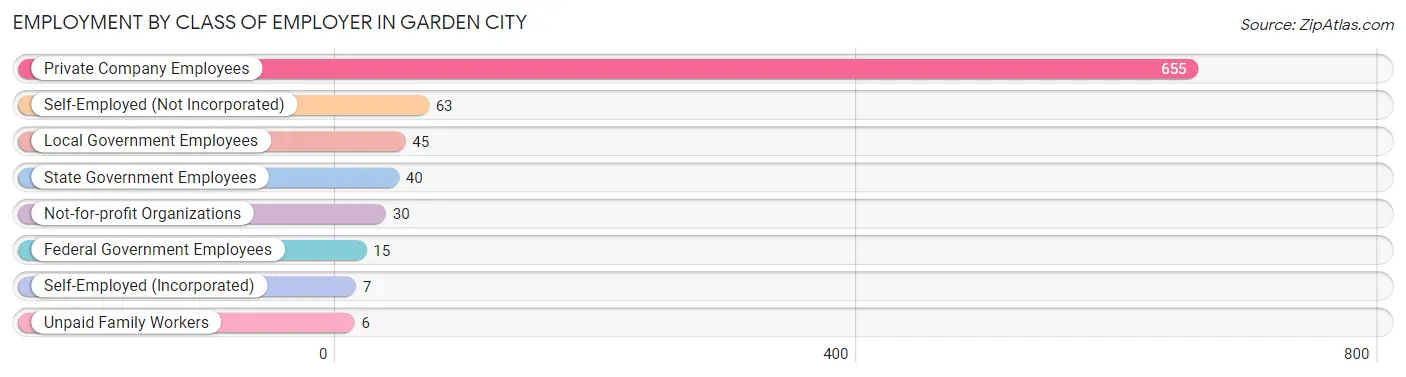
| Employer Class | # Employees | % Employees |
| Private Company Employees | 655 | 76.1% |
| Self-Employed (Incorporated) | 7 | 0.8% |
| Self-Employed (Not Incorporated) | 63 | 7.3% |
| Not-for-profit Organizations | 30 | 3.5% |
| Local Government Employees | 45 | 5.2% |
| State Government Employees | 40 | 4.6% |
| Federal Government Employees | 15 | 1.7% |
| Unpaid Family Workers | 6 | 0.7% |
| Total | 861 | 100.0% |
Employment Status by Age in Garden City
According to the labor force statistics for Garden City, out of the total population over 16 years of age (1,267), 71.2% or 902 individuals are in the labor force, with 3.5% or 32 of them unemployed. The age group with the highest labor force participation rate is 35 to 44 years, with 100.0% or 206 individuals in the labor force. Within the labor force, the 45 to 54 years age range has the highest percentage of unemployed individuals, with 14.0% or 28 of them being unemployed.
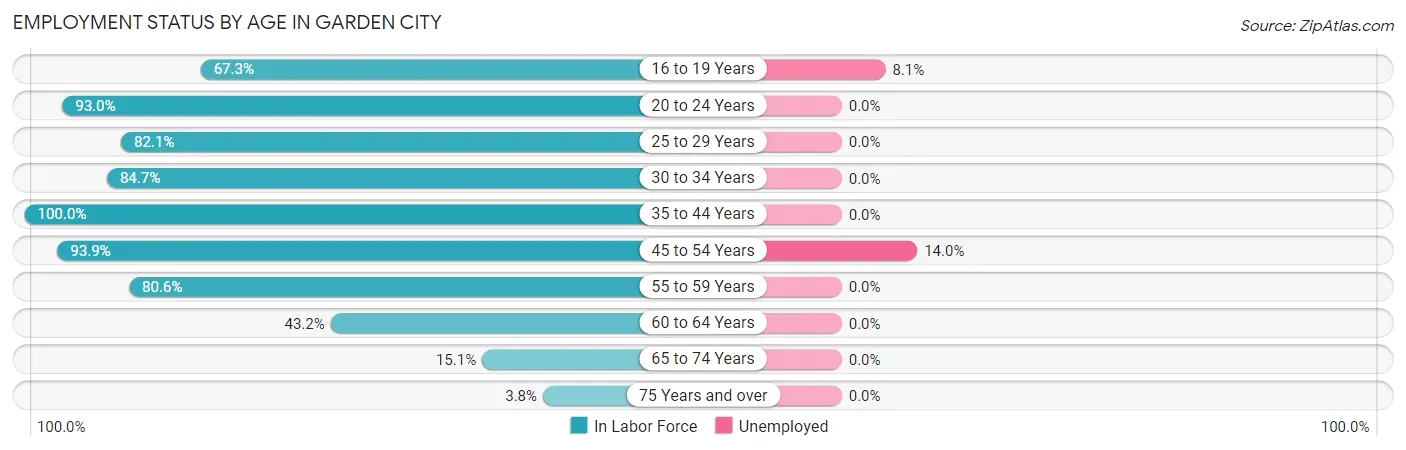
| Age Bracket | In Labor Force | Unemployed |
| 16 to 19 Years | 37 (67.3%) | 3 (8.1%) |
| 20 to 24 Years | 80 (93.0%) | 0 (0.0%) |
| 25 to 29 Years | 124 (82.1%) | 0 (0.0%) |
| 30 to 34 Years | 111 (84.7%) | 0 (0.0%) |
| 35 to 44 Years | 206 (100.0%) | 0 (0.0%) |
| 45 to 54 Years | 200 (93.9%) | 28 (14.0%) |
| 55 to 59 Years | 104 (80.6%) | 0 (0.0%) |
| 60 to 64 Years | 16 (43.2%) | 0 (0.0%) |
| 65 to 74 Years | 19 (15.1%) | 0 (0.0%) |
| 75 Years and over | 5 (3.8%) | 0 (0.0%) |
| Total | 902 (71.2%) | 32 (3.5%) |
Employment Status by Educational Attainment in Garden City
According to labor force statistics for Garden City, 87.8% of individuals (761) out of the total population between 25 and 64 years of age (867) are in the labor force, with 3.7% or 28 of them being unemployed. The group with the highest labor force participation rate are those with the educational attainment of bachelor's degree or higher, with 100.0% or 76 individuals in the labor force. Within the labor force, individuals with less than high school education have the highest percentage of unemployment, with 15.9% or 7 of them being unemployed.
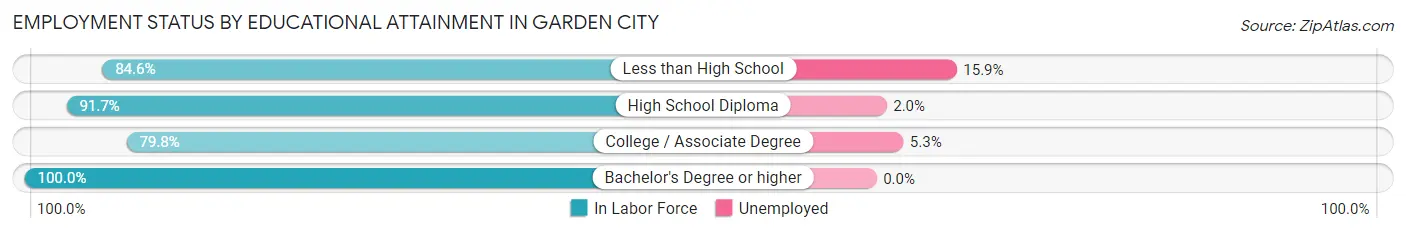
| Educational Attainment | In Labor Force | Unemployed |
| Less than High School | 44 (84.6%) | 8 (15.9%) |
| High School Diploma | 396 (91.7%) | 9 (2.0%) |
| College / Associate Degree | 245 (79.8%) | 16 (5.3%) |
| Bachelor's Degree or higher | 76 (100.0%) | 0 (0.0%) |
| Total | 761 (87.8%) | 32 (3.7%) |
Employment Occupations by Sex in Garden City
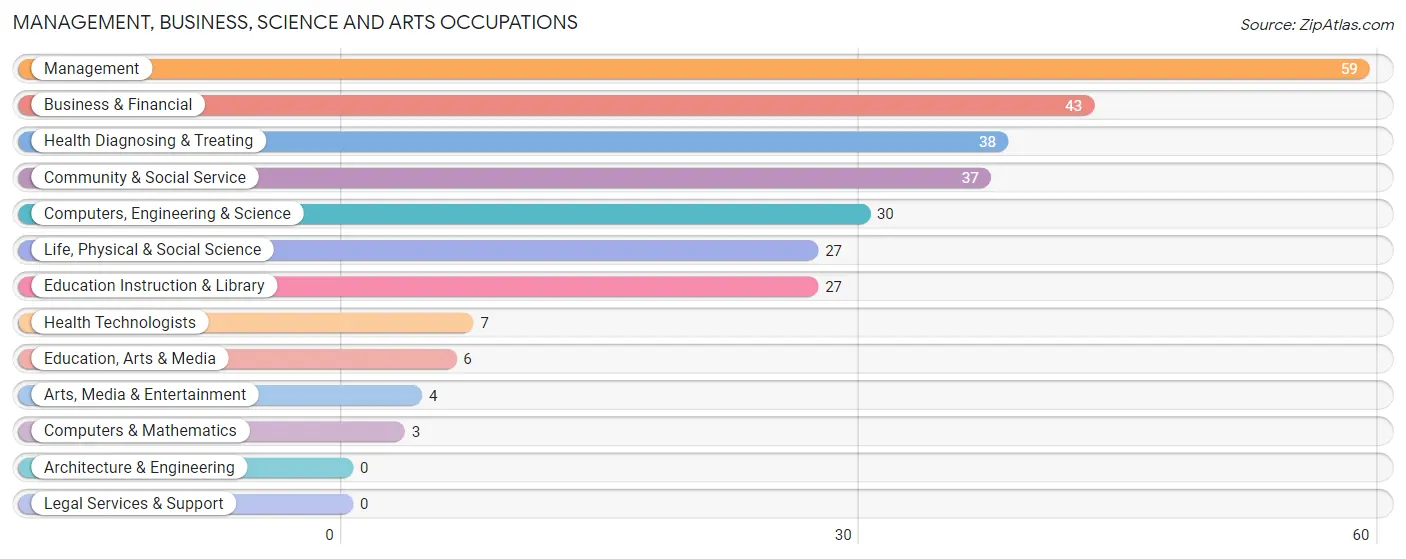
Management, Business, Science and Arts Occupations
The most common Management, Business, Science and Arts occupations in Garden City are Management (59 | 6.8%), Business & Financial (43 | 5.0%), Health Diagnosing & Treating (38 | 4.4%), Community & Social Service (37 | 4.3%), and Computers, Engineering & Science (30 | 3.5%).
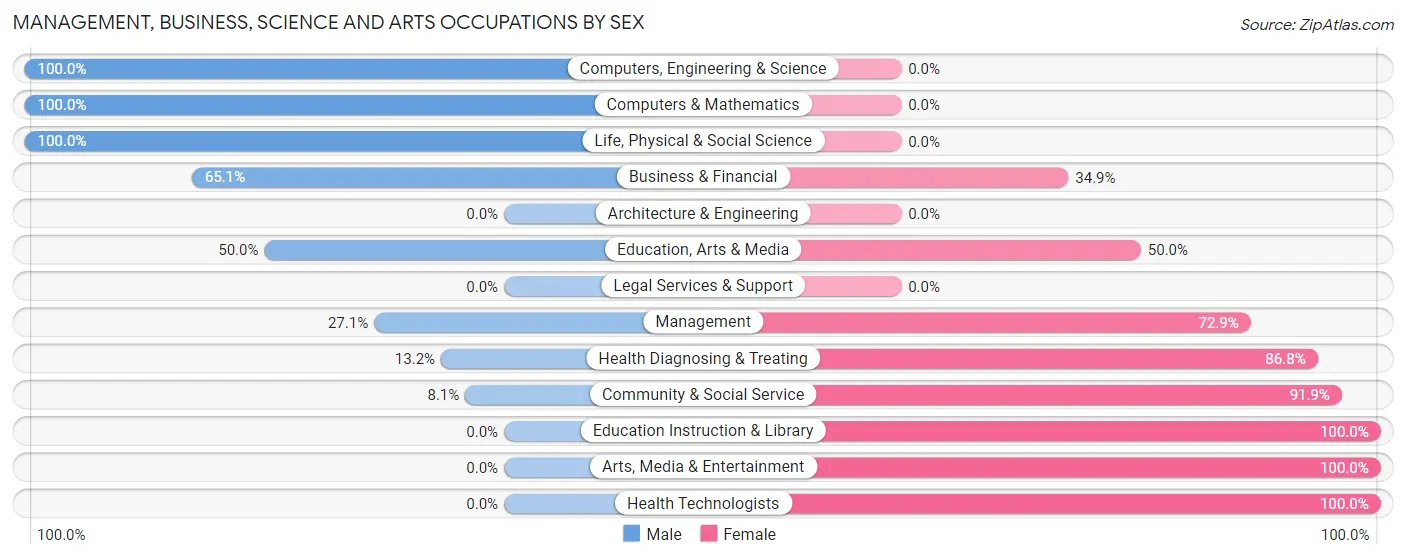
Management, Business, Science and Arts Occupations by Sex
Within the Management, Business, Science and Arts occupations in Garden City, the most male-oriented occupations are Computers, Engineering & Science (100.0%), Computers & Mathematics (100.0%), and Life, Physical & Social Science (100.0%), while the most female-oriented occupations are Education Instruction & Library (100.0%), Arts, Media & Entertainment (100.0%), and Health Technologists (100.0%).
| Occupation | Male | Female |
| Management | 16 (27.1%) | 43 (72.9%) |
| Business & Financial | 28 (65.1%) | 15 (34.9%) |
| Computers, Engineering & Science | 30 (100.0%) | 0 (0.0%) |
| Computers & Mathematics | 3 (100.0%) | 0 (0.0%) |
| Architecture & Engineering | 0 (0.0%) | 0 (0.0%) |
| Life, Physical & Social Science | 27 (100.0%) | 0 (0.0%) |
| Community & Social Service | 3 (8.1%) | 34 (91.9%) |
| Education, Arts & Media | 3 (50.0%) | 3 (50.0%) |
| Legal Services & Support | 0 (0.0%) | 0 (0.0%) |
| Education Instruction & Library | 0 (0.0%) | 27 (100.0%) |
| Arts, Media & Entertainment | 0 (0.0%) | 4 (100.0%) |
| Health Diagnosing & Treating | 5 (13.2%) | 33 (86.8%) |
| Health Technologists | 0 (0.0%) | 7 (100.0%) |
| Total (Category) | 82 (39.6%) | 125 (60.4%) |
| Total (Overall) | 469 (54.1%) | 398 (45.9%) |
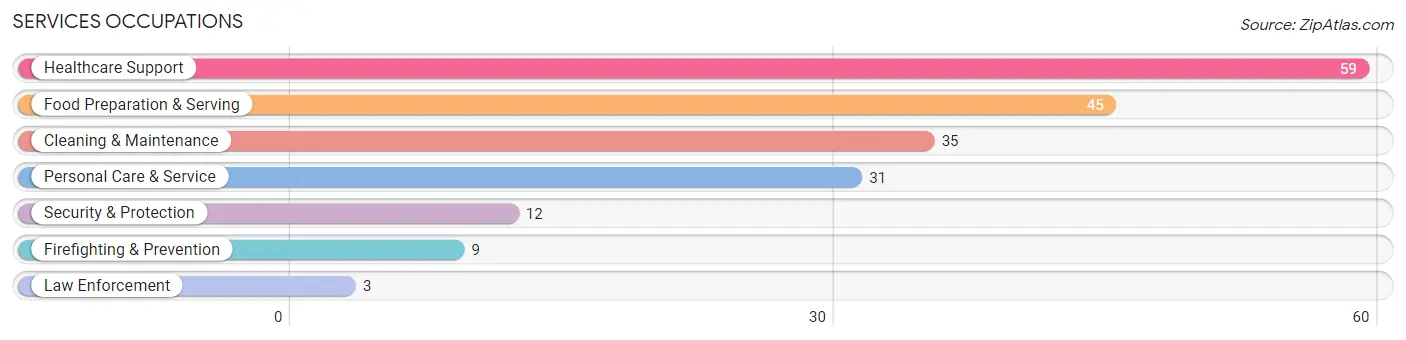
Services Occupations
The most common Services occupations in Garden City are Healthcare Support (59 | 6.8%), Food Preparation & Serving (45 | 5.2%), Cleaning & Maintenance (35 | 4.0%), Personal Care & Service (31 | 3.6%), and Security & Protection (12 | 1.4%).
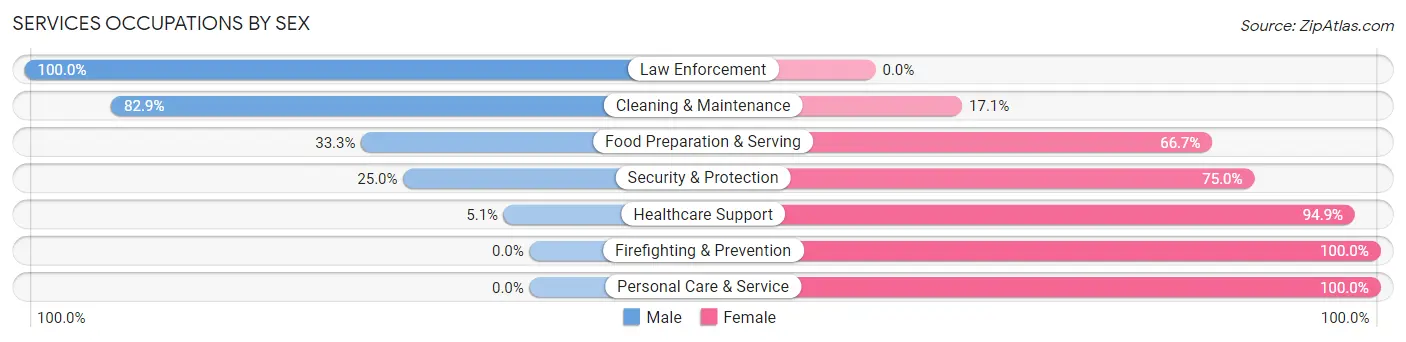
Services Occupations by Sex
Within the Services occupations in Garden City, the most male-oriented occupations are Law Enforcement (100.0%), Cleaning & Maintenance (82.9%), and Food Preparation & Serving (33.3%), while the most female-oriented occupations are Firefighting & Prevention (100.0%), Personal Care & Service (100.0%), and Healthcare Support (94.9%).
| Occupation | Male | Female |
| Healthcare Support | 3 (5.1%) | 56 (94.9%) |
| Security & Protection | 3 (25.0%) | 9 (75.0%) |
| Firefighting & Prevention | 0 (0.0%) | 9 (100.0%) |
| Law Enforcement | 3 (100.0%) | 0 (0.0%) |
| Food Preparation & Serving | 15 (33.3%) | 30 (66.7%) |
| Cleaning & Maintenance | 29 (82.9%) | 6 (17.1%) |
| Personal Care & Service | 0 (0.0%) | 31 (100.0%) |
| Total (Category) | 50 (27.5%) | 132 (72.5%) |
| Total (Overall) | 469 (54.1%) | 398 (45.9%) |
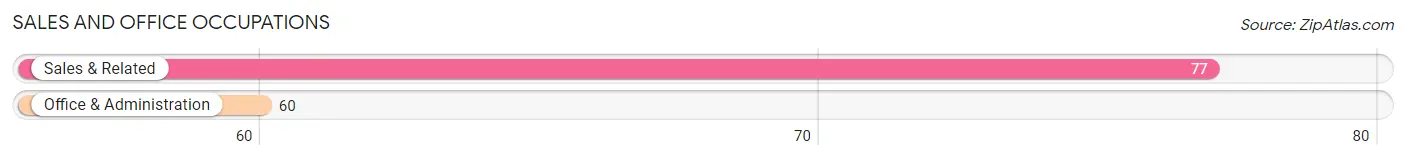
Sales and Office Occupations
The most common Sales and Office occupations in Garden City are Sales & Related (77 | 8.9%), and Office & Administration (60 | 6.9%).
Sales and Office Occupations by Sex
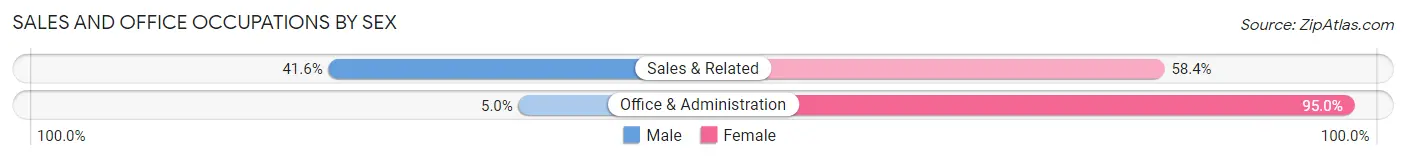
| Occupation | Male | Female |
| Sales & Related | 32 (41.6%) | 45 (58.4%) |
| Office & Administration | 3 (5.0%) | 57 (95.0%) |
| Total (Category) | 35 (25.6%) | 102 (74.5%) |
| Total (Overall) | 469 (54.1%) | 398 (45.9%) |
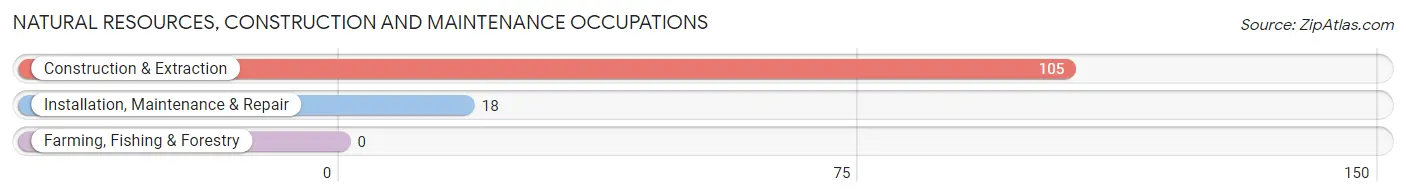
Natural Resources, Construction and Maintenance Occupations
The most common Natural Resources, Construction and Maintenance occupations in Garden City are Construction & Extraction (105 | 12.1%), and Installation, Maintenance & Repair (18 | 2.1%).
Natural Resources, Construction and Maintenance Occupations by Sex
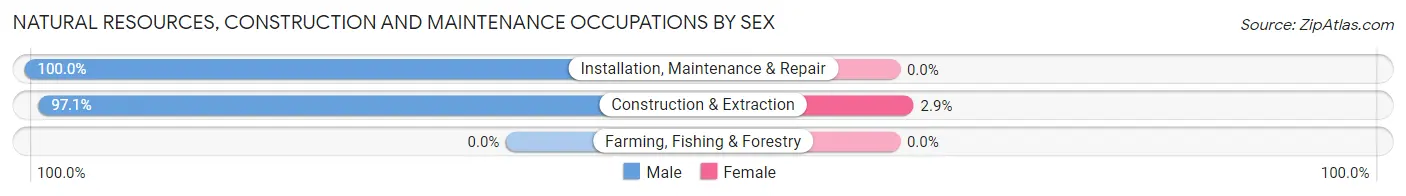
| Occupation | Male | Female |
| Farming, Fishing & Forestry | 0 (0.0%) | 0 (0.0%) |
| Construction & Extraction | 102 (97.1%) | 3 (2.9%) |
| Installation, Maintenance & Repair | 18 (100.0%) | 0 (0.0%) |
| Total (Category) | 120 (97.6%) | 3 (2.4%) |
| Total (Overall) | 469 (54.1%) | 398 (45.9%) |
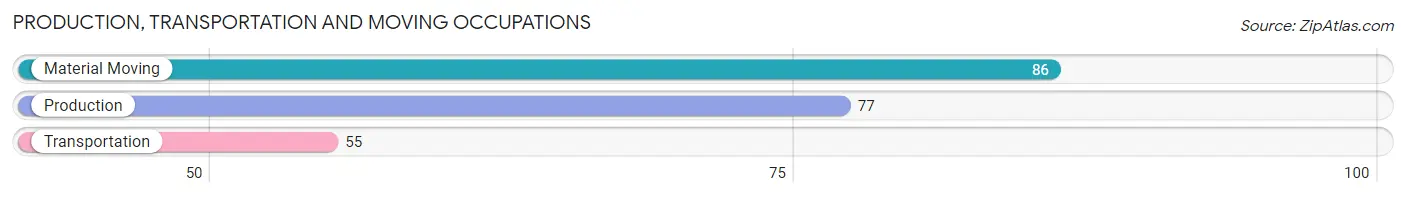
Production, Transportation and Moving Occupations
The most common Production, Transportation and Moving occupations in Garden City are Material Moving (86 | 9.9%), Production (77 | 8.9%), and Transportation (55 | 6.3%).
Production, Transportation and Moving Occupations by Sex
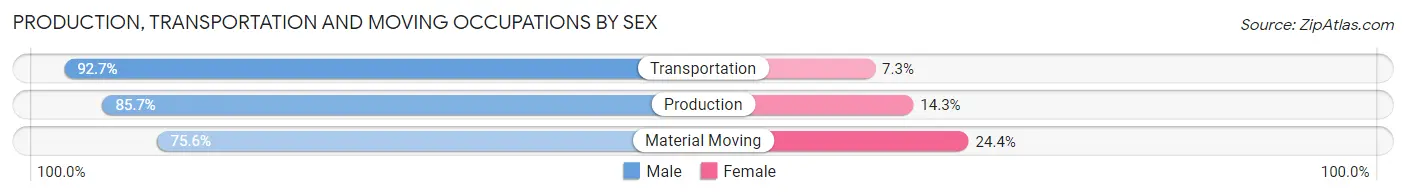
| Occupation | Male | Female |
| Production | 66 (85.7%) | 11 (14.3%) |
| Transportation | 51 (92.7%) | 4 (7.3%) |
| Material Moving | 65 (75.6%) | 21 (24.4%) |
| Total (Category) | 182 (83.5%) | 36 (16.5%) |
| Total (Overall) | 469 (54.1%) | 398 (45.9%) |
Employment Industries by Sex in Garden City
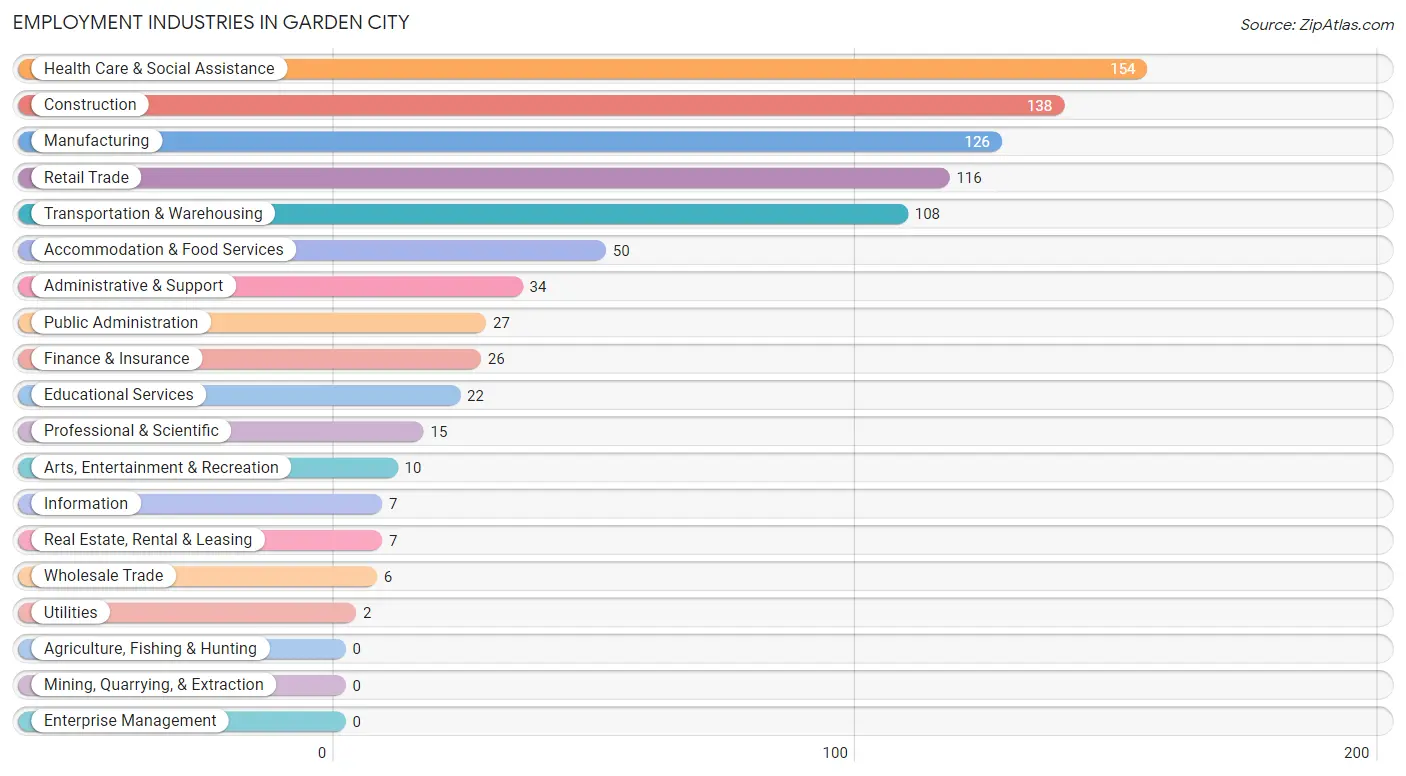
Employment Industries in Garden City
The major employment industries in Garden City include Health Care & Social Assistance (154 | 17.8%), Construction (138 | 15.9%), Manufacturing (126 | 14.5%), Retail Trade (116 | 13.4%), and Transportation & Warehousing (108 | 12.5%).
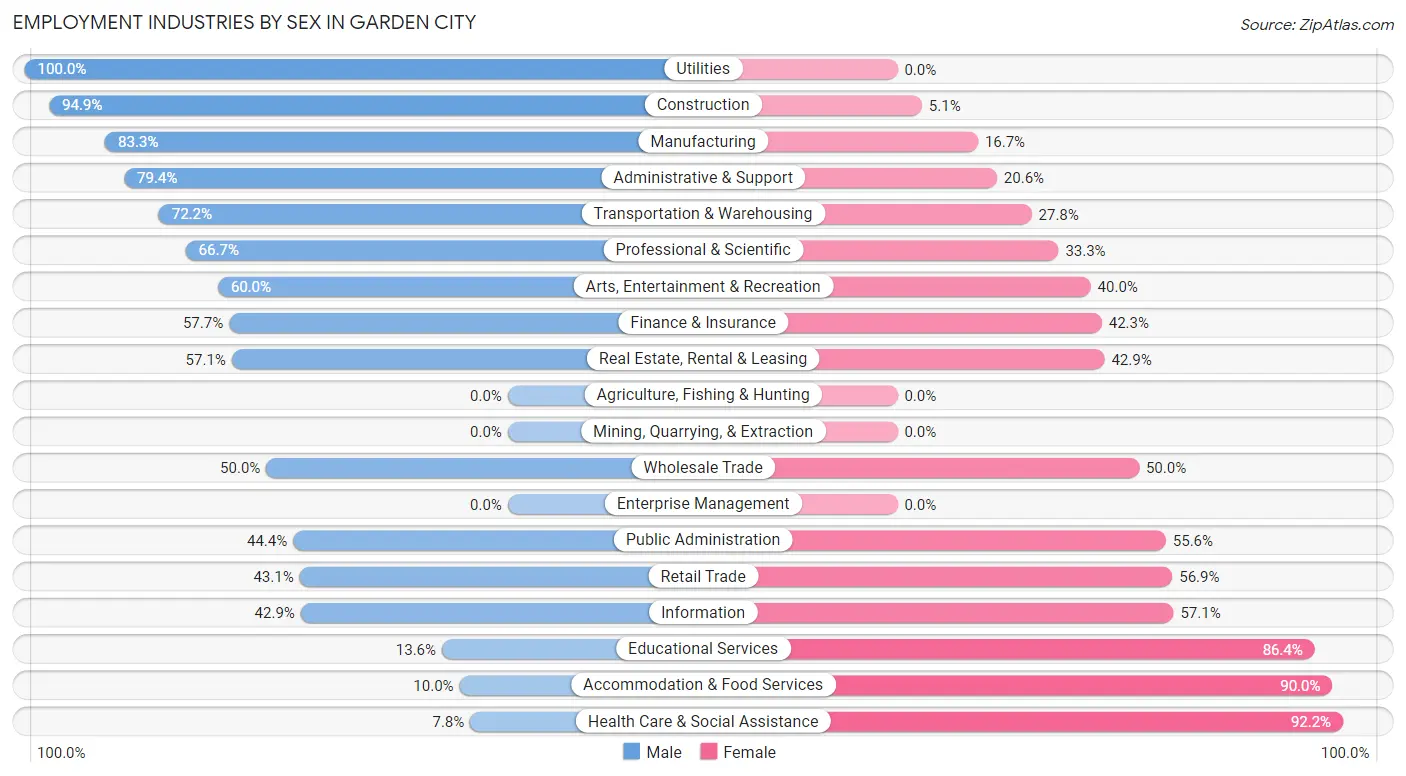
Employment Industries by Sex in Garden City
The Garden City industries that see more men than women are Utilities (100.0%), Construction (94.9%), and Manufacturing (83.3%), whereas the industries that tend to have a higher number of women are Health Care & Social Assistance (92.2%), Accommodation & Food Services (90.0%), and Educational Services (86.4%).
| Industry | Male | Female |
| Agriculture, Fishing & Hunting | 0 (0.0%) | 0 (0.0%) |
| Mining, Quarrying, & Extraction | 0 (0.0%) | 0 (0.0%) |
| Construction | 131 (94.9%) | 7 (5.1%) |
| Manufacturing | 105 (83.3%) | 21 (16.7%) |
| Wholesale Trade | 3 (50.0%) | 3 (50.0%) |
| Retail Trade | 50 (43.1%) | 66 (56.9%) |
| Transportation & Warehousing | 78 (72.2%) | 30 (27.8%) |
| Utilities | 2 (100.0%) | 0 (0.0%) |
| Information | 3 (42.9%) | 4 (57.1%) |
| Finance & Insurance | 15 (57.7%) | 11 (42.3%) |
| Real Estate, Rental & Leasing | 4 (57.1%) | 3 (42.9%) |
| Professional & Scientific | 10 (66.7%) | 5 (33.3%) |
| Enterprise Management | 0 (0.0%) | 0 (0.0%) |
| Administrative & Support | 27 (79.4%) | 7 (20.6%) |
| Educational Services | 3 (13.6%) | 19 (86.4%) |
| Health Care & Social Assistance | 12 (7.8%) | 142 (92.2%) |
| Arts, Entertainment & Recreation | 6 (60.0%) | 4 (40.0%) |
| Accommodation & Food Services | 5 (10.0%) | 45 (90.0%) |
| Public Administration | 12 (44.4%) | 15 (55.6%) |
| Total | 469 (54.1%) | 398 (45.9%) |
Education in Garden City
School Enrollment in Garden City
The most common levels of schooling among the 428 students in Garden City are middle school (179 | 41.8%), elementary school (107 | 25.0%), and high school (71 | 16.6%).
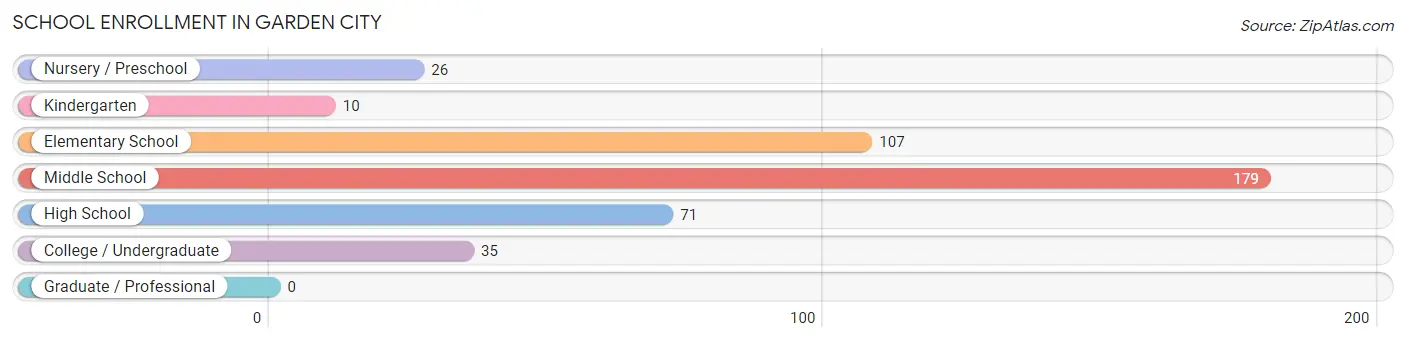
| School Level | # Students | % Students |
| Nursery / Preschool | 26 | 6.1% |
| Kindergarten | 10 | 2.3% |
| Elementary School | 107 | 25.0% |
| Middle School | 179 | 41.8% |
| High School | 71 | 16.6% |
| College / Undergraduate | 35 | 8.2% |
| Graduate / Professional | 0 | 0.0% |
| Total | 428 | 100.0% |
School Enrollment by Age by Funding Source in Garden City
Out of a total of 428 students who are enrolled in schools in Garden City, 3 (0.7%) attend a private institution, while the remaining 425 (99.3%) are enrolled in public schools. The age group of 20 to 24 year olds has the highest likelihood of being enrolled in private schools, with 3 (16.7% in the age bracket) enrolled. Conversely, the age group of 5 to 9 year old has the lowest likelihood of being enrolled in a private school, with 116 (100.0% in the age bracket) attending a public institution.
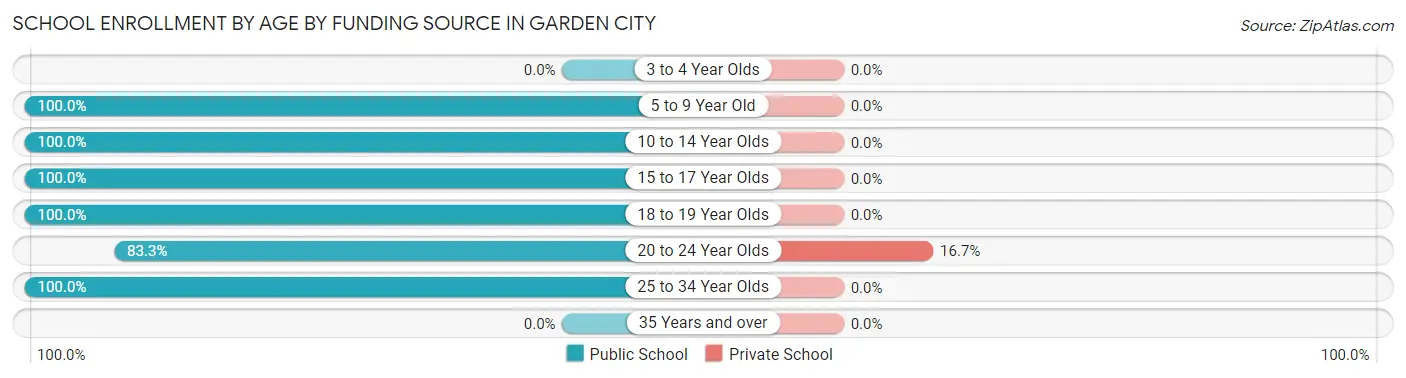
| Age Bracket | Public School | Private School |
| 3 to 4 Year Olds | 0 (0.0%) | 0 (0.0%) |
| 5 to 9 Year Old | 116 (100.0%) | 0 (0.0%) |
| 10 to 14 Year Olds | 206 (100.0%) | 0 (0.0%) |
| 15 to 17 Year Olds | 61 (100.0%) | 0 (0.0%) |
| 18 to 19 Year Olds | 10 (100.0%) | 0 (0.0%) |
| 20 to 24 Year Olds | 15 (83.3%) | 3 (16.7%) |
| 25 to 34 Year Olds | 17 (100.0%) | 0 (0.0%) |
| 35 Years and over | 0 (0.0%) | 0 (0.0%) |
| Total | 425 (99.3%) | 3 (0.7%) |
Educational Attainment by Field of Study in Garden City
Business (30 | 32.3%), science & technology (17 | 18.3%), education (15 | 16.1%), visual & performing arts (9 | 9.7%), and psychology (8 | 8.6%) are the most common fields of study among 93 individuals in Garden City who have obtained a bachelor's degree or higher.
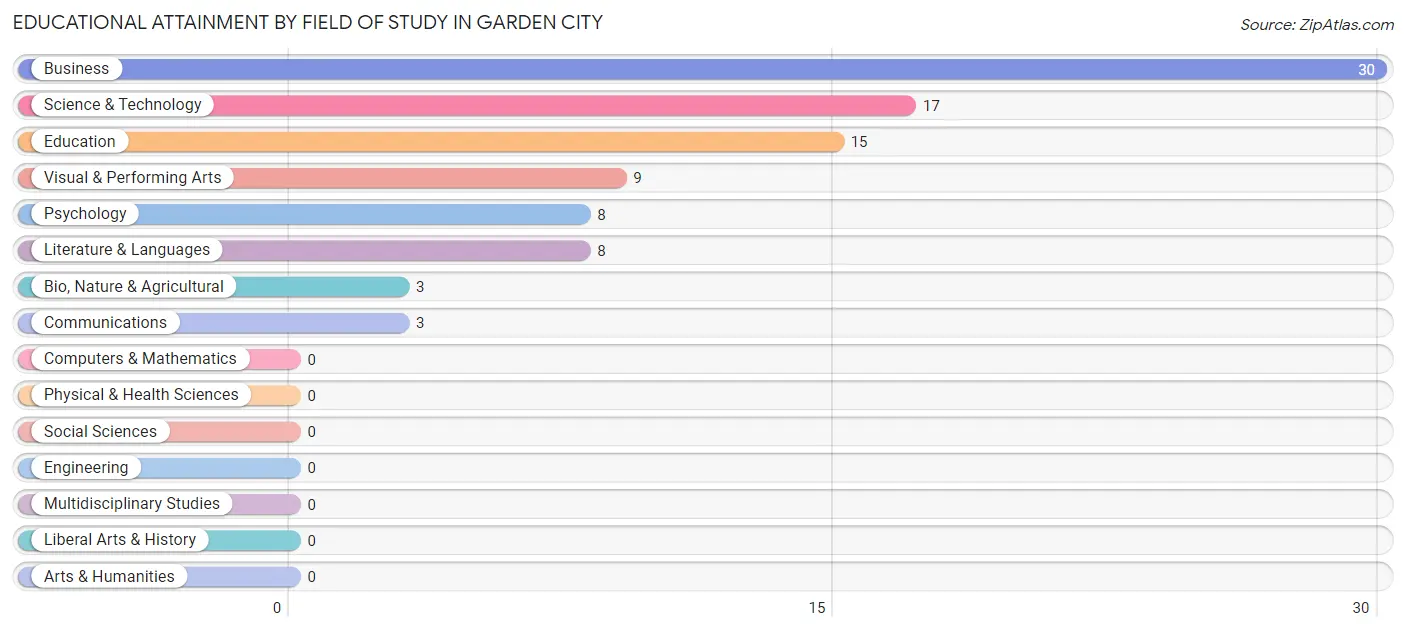
| Field of Study | # Graduates | % Graduates |
| Computers & Mathematics | 0 | 0.0% |
| Bio, Nature & Agricultural | 3 | 3.2% |
| Physical & Health Sciences | 0 | 0.0% |
| Psychology | 8 | 8.6% |
| Social Sciences | 0 | 0.0% |
| Engineering | 0 | 0.0% |
| Multidisciplinary Studies | 0 | 0.0% |
| Science & Technology | 17 | 18.3% |
| Business | 30 | 32.3% |
| Education | 15 | 16.1% |
| Literature & Languages | 8 | 8.6% |
| Liberal Arts & History | 0 | 0.0% |
| Visual & Performing Arts | 9 | 9.7% |
| Communications | 3 | 3.2% |
| Arts & Humanities | 0 | 0.0% |
| Total | 93 | 100.0% |
Transportation & Commute in Garden City
Vehicle Availability by Sex in Garden City
The most prevalent vehicle ownership categories in Garden City are males with 2 vehicles (185, accounting for 39.5%) and females with 2 vehicles (135, making up 47.2%).
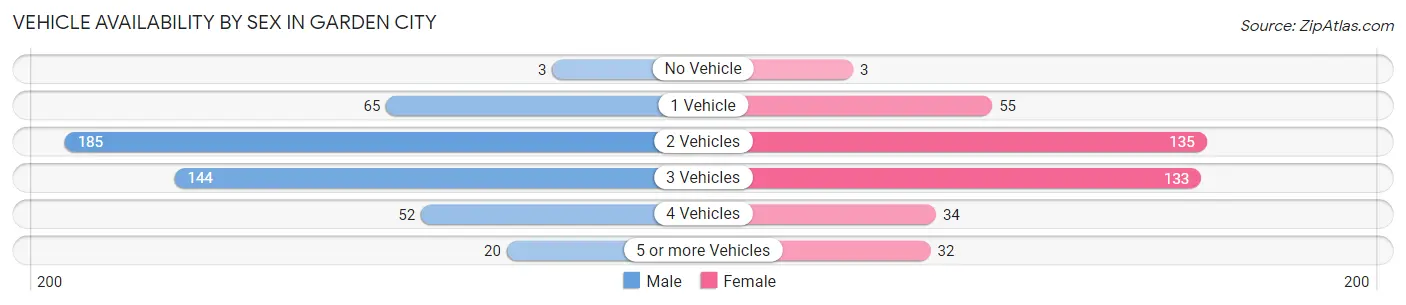
| Vehicles Available | Male | Female |
| No Vehicle | 3 (0.6%) | 3 (0.8%) |
| 1 Vehicle | 65 (13.9%) | 55 (14.0%) |
| 2 Vehicles | 185 (39.5%) | 135 (34.4%) |
| 3 Vehicles | 144 (30.7%) | 133 (33.9%) |
| 4 Vehicles | 52 (11.1%) | 34 (8.7%) |
| 5 or more Vehicles | 20 (4.3%) | 32 (8.2%) |
| Total | 469 (100.0%) | 392 (100.0%) |
Commute Time in Garden City
The most frequently occuring commute durations in Garden City are 15 to 19 minutes (196 commuters, 23.2%), 20 to 24 minutes (125 commuters, 14.8%), and 45 to 59 minutes (114 commuters, 13.5%).
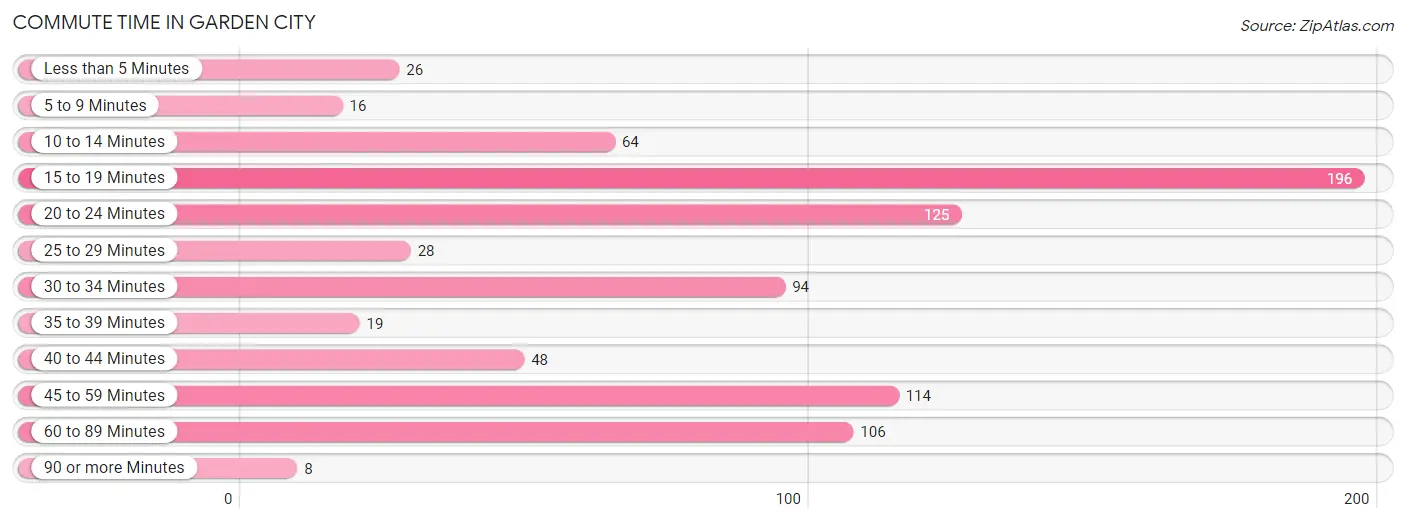
| Commute Time | # Commuters | % Commuters |
| Less than 5 Minutes | 26 | 3.1% |
| 5 to 9 Minutes | 16 | 1.9% |
| 10 to 14 Minutes | 64 | 7.6% |
| 15 to 19 Minutes | 196 | 23.2% |
| 20 to 24 Minutes | 125 | 14.8% |
| 25 to 29 Minutes | 28 | 3.3% |
| 30 to 34 Minutes | 94 | 11.1% |
| 35 to 39 Minutes | 19 | 2.2% |
| 40 to 44 Minutes | 48 | 5.7% |
| 45 to 59 Minutes | 114 | 13.5% |
| 60 to 89 Minutes | 106 | 12.6% |
| 90 or more Minutes | 8 | 0.9% |
Commute Time by Sex in Garden City
The most common commute times in Garden City are 15 to 19 minutes (135 commuters, 29.0%) for males and 20 to 24 minutes (102 commuters, 26.9%) for females.
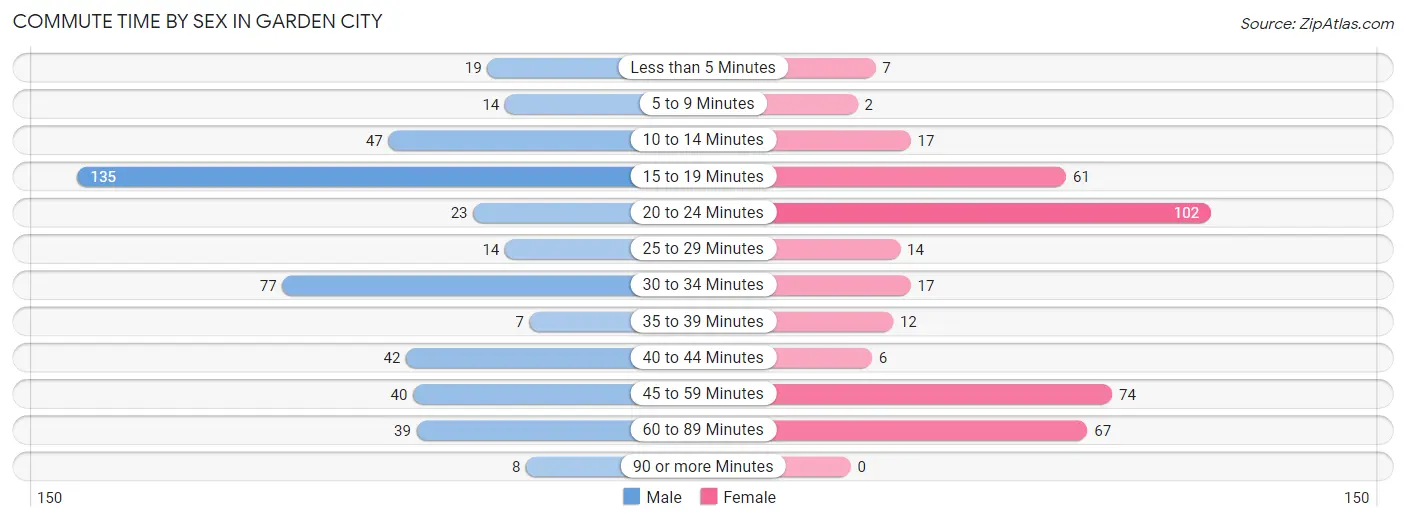
| Commute Time | Male | Female |
| Less than 5 Minutes | 19 (4.1%) | 7 (1.8%) |
| 5 to 9 Minutes | 14 (3.0%) | 2 (0.5%) |
| 10 to 14 Minutes | 47 (10.1%) | 17 (4.5%) |
| 15 to 19 Minutes | 135 (29.0%) | 61 (16.1%) |
| 20 to 24 Minutes | 23 (5.0%) | 102 (26.9%) |
| 25 to 29 Minutes | 14 (3.0%) | 14 (3.7%) |
| 30 to 34 Minutes | 77 (16.6%) | 17 (4.5%) |
| 35 to 39 Minutes | 7 (1.5%) | 12 (3.2%) |
| 40 to 44 Minutes | 42 (9.0%) | 6 (1.6%) |
| 45 to 59 Minutes | 40 (8.6%) | 74 (19.5%) |
| 60 to 89 Minutes | 39 (8.4%) | 67 (17.7%) |
| 90 or more Minutes | 8 (1.7%) | 0 (0.0%) |
Time of Departure to Work by Sex in Garden City
The most frequent times of departure to work in Garden City are 12:00 AM to 4:59 AM (88, 18.9%) for males and 4:00 PM to 11:59 PM (71, 18.7%) for females.
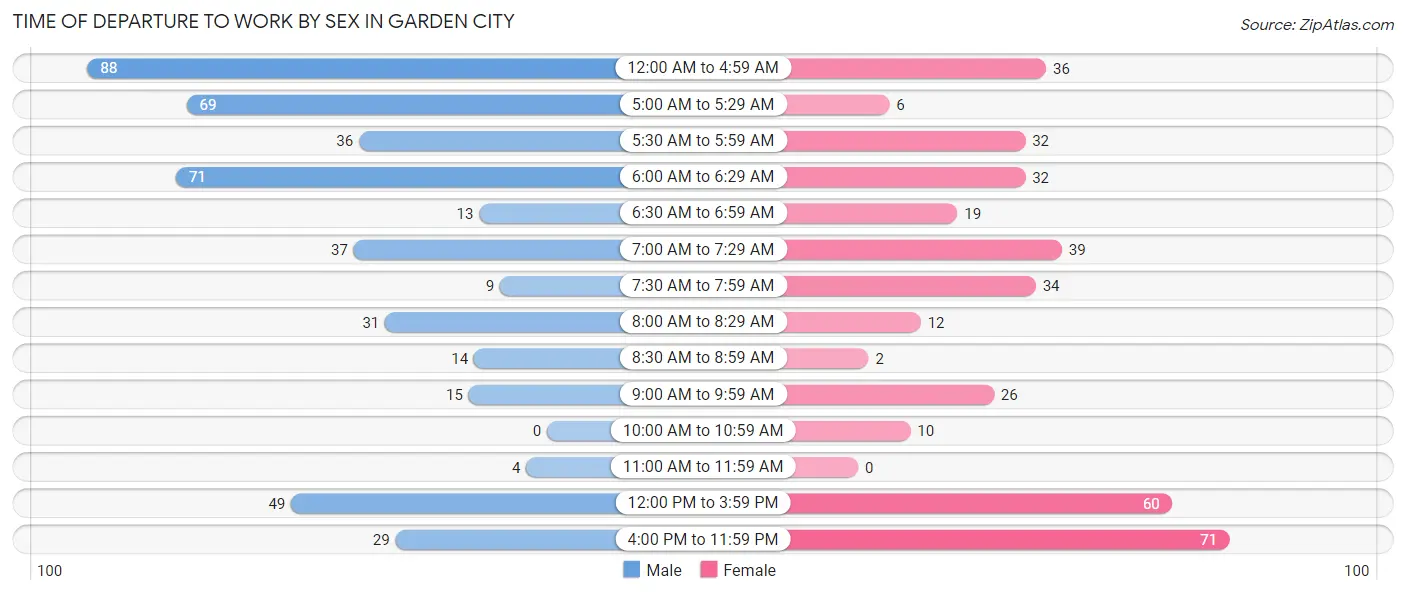
| Time of Departure | Male | Female |
| 12:00 AM to 4:59 AM | 88 (18.9%) | 36 (9.5%) |
| 5:00 AM to 5:29 AM | 69 (14.8%) | 6 (1.6%) |
| 5:30 AM to 5:59 AM | 36 (7.7%) | 32 (8.4%) |
| 6:00 AM to 6:29 AM | 71 (15.3%) | 32 (8.4%) |
| 6:30 AM to 6:59 AM | 13 (2.8%) | 19 (5.0%) |
| 7:00 AM to 7:29 AM | 37 (8.0%) | 39 (10.3%) |
| 7:30 AM to 7:59 AM | 9 (1.9%) | 34 (9.0%) |
| 8:00 AM to 8:29 AM | 31 (6.7%) | 12 (3.2%) |
| 8:30 AM to 8:59 AM | 14 (3.0%) | 2 (0.5%) |
| 9:00 AM to 9:59 AM | 15 (3.2%) | 26 (6.9%) |
| 10:00 AM to 10:59 AM | 0 (0.0%) | 10 (2.6%) |
| 11:00 AM to 11:59 AM | 4 (0.9%) | 0 (0.0%) |
| 12:00 PM to 3:59 PM | 49 (10.5%) | 60 (15.8%) |
| 4:00 PM to 11:59 PM | 29 (6.2%) | 71 (18.7%) |
| Total | 465 (100.0%) | 379 (100.0%) |
Housing Occupancy in Garden City
Occupancy by Ownership in Garden City
Of the total 665 dwellings in Garden City, owner-occupied units account for 421 (63.3%), while renter-occupied units make up 244 (36.7%).
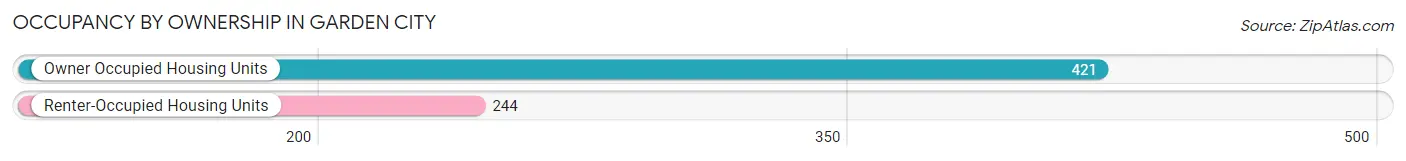
| Occupancy | # Housing Units | % Housing Units |
| Owner Occupied Housing Units | 421 | 63.3% |
| Renter-Occupied Housing Units | 244 | 36.7% |
| Total Occupied Housing Units | 665 | 100.0% |
Occupancy by Household Size in Garden City
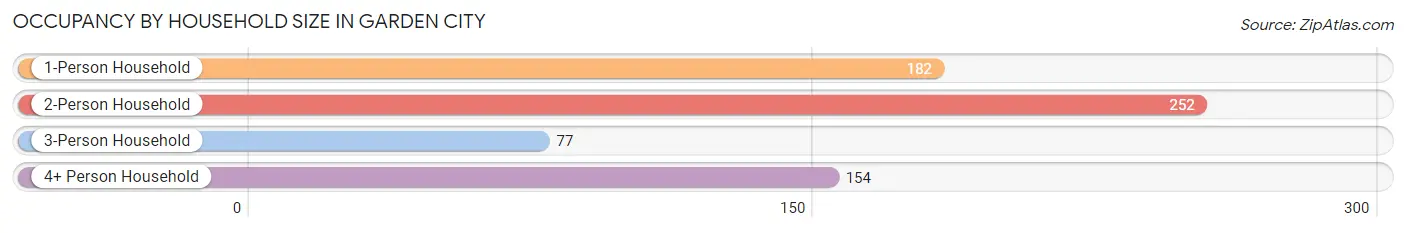
| Household Size | # Housing Units | % Housing Units |
| 1-Person Household | 182 | 27.4% |
| 2-Person Household | 252 | 37.9% |
| 3-Person Household | 77 | 11.6% |
| 4+ Person Household | 154 | 23.2% |
| Total Housing Units | 665 | 100.0% |
Occupancy by Ownership by Household Size in Garden City
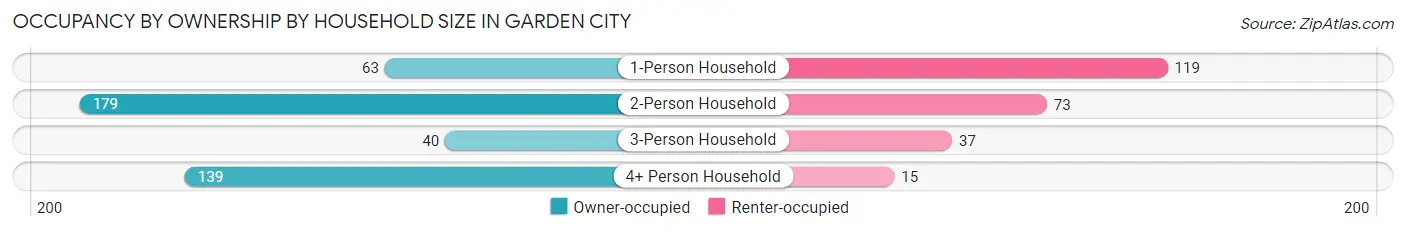
| Household Size | Owner-occupied | Renter-occupied |
| 1-Person Household | 63 (34.6%) | 119 (65.4%) |
| 2-Person Household | 179 (71.0%) | 73 (29.0%) |
| 3-Person Household | 40 (51.9%) | 37 (48.0%) |
| 4+ Person Household | 139 (90.3%) | 15 (9.7%) |
| Total Housing Units | 421 (63.3%) | 244 (36.7%) |
Occupancy by Educational Attainment in Garden City
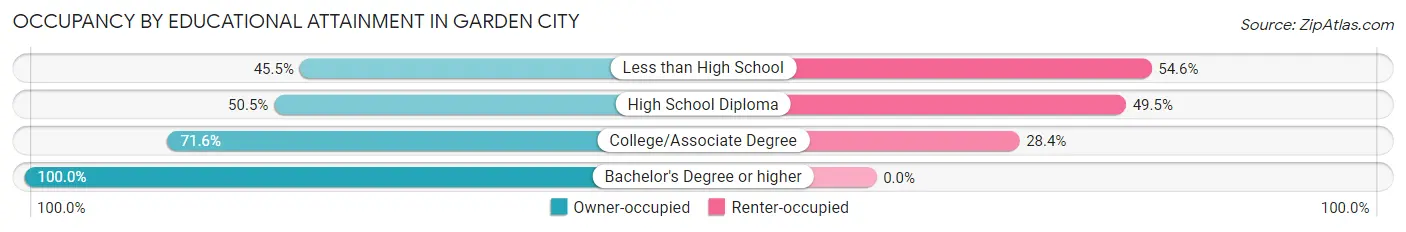
| Household Size | Owner-occupied | Renter-occupied |
| Less than High School | 20 (45.5%) | 24 (54.5%) |
| High School Diploma | 145 (50.5%) | 142 (49.5%) |
| College/Associate Degree | 197 (71.6%) | 78 (28.4%) |
| Bachelor's Degree or higher | 59 (100.0%) | 0 (0.0%) |
Occupancy by Age of Householder in Garden City
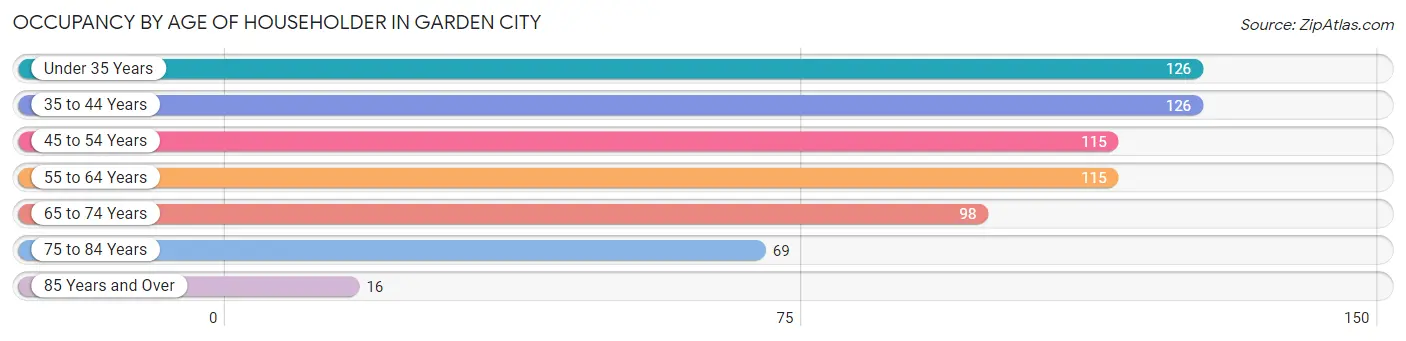
| Age Bracket | # Households | % Households |
| Under 35 Years | 126 | 19.0% |
| 35 to 44 Years | 126 | 19.0% |
| 45 to 54 Years | 115 | 17.3% |
| 55 to 64 Years | 115 | 17.3% |
| 65 to 74 Years | 98 | 14.7% |
| 75 to 84 Years | 69 | 10.4% |
| 85 Years and Over | 16 | 2.4% |
| Total | 665 | 100.0% |
Housing Finances in Garden City
Median Income by Occupancy in Garden City
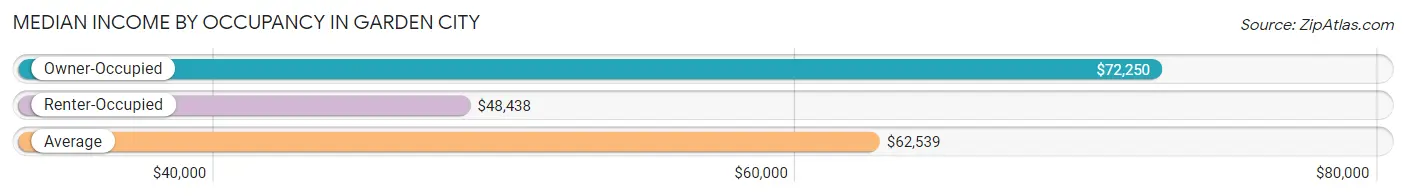
| Occupancy Type | # Households | Median Income |
| Owner-Occupied | 421 (63.3%) | $72,250 |
| Renter-Occupied | 244 (36.7%) | $48,438 |
| Average | 665 (100.0%) | $62,539 |
Occupancy by Householder Income Bracket in Garden City
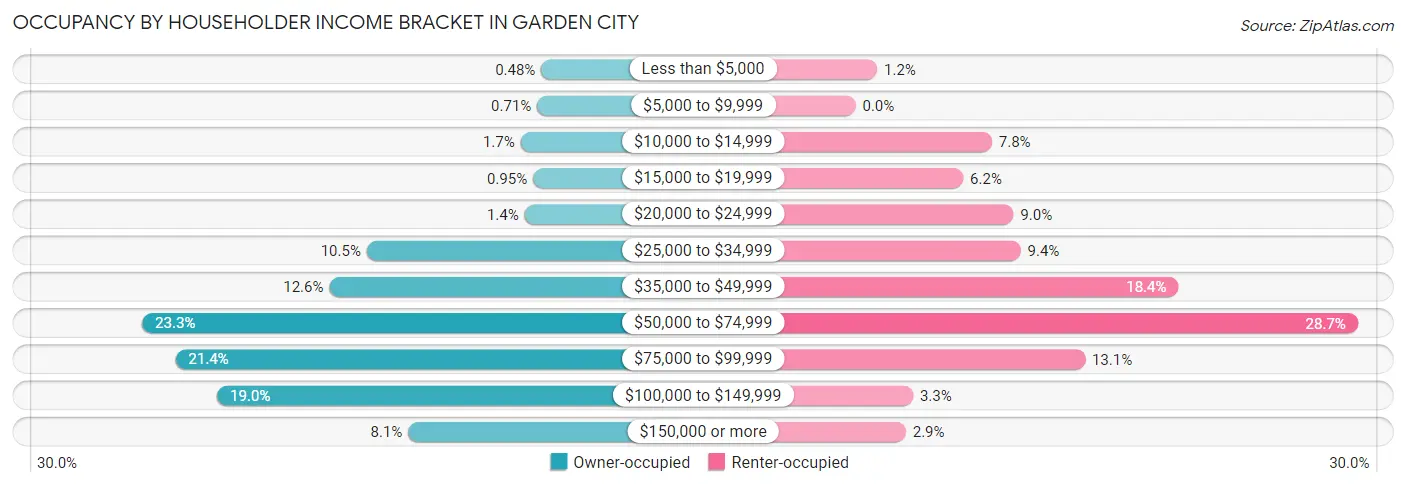
| Income Bracket | Owner-occupied | Renter-occupied |
| Less than $5,000 | 2 (0.5%) | 3 (1.2%) |
| $5,000 to $9,999 | 3 (0.7%) | 0 (0.0%) |
| $10,000 to $14,999 | 7 (1.7%) | 19 (7.8%) |
| $15,000 to $19,999 | 4 (0.9%) | 15 (6.1%) |
| $20,000 to $24,999 | 6 (1.4%) | 22 (9.0%) |
| $25,000 to $34,999 | 44 (10.4%) | 23 (9.4%) |
| $35,000 to $49,999 | 53 (12.6%) | 45 (18.4%) |
| $50,000 to $74,999 | 98 (23.3%) | 70 (28.7%) |
| $75,000 to $99,999 | 90 (21.4%) | 32 (13.1%) |
| $100,000 to $149,999 | 80 (19.0%) | 8 (3.3%) |
| $150,000 or more | 34 (8.1%) | 7 (2.9%) |
| Total | 421 (100.0%) | 244 (100.0%) |
Monthly Housing Cost Tiers in Garden City
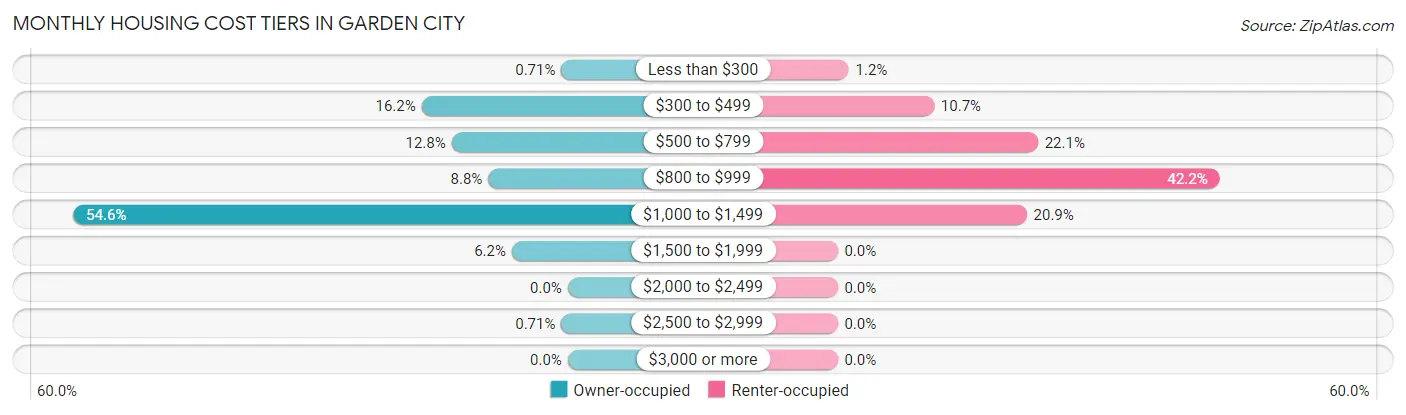
| Monthly Cost | Owner-occupied | Renter-occupied |
| Less than $300 | 3 (0.7%) | 3 (1.2%) |
| $300 to $499 | 68 (16.2%) | 26 (10.7%) |
| $500 to $799 | 54 (12.8%) | 54 (22.1%) |
| $800 to $999 | 37 (8.8%) | 103 (42.2%) |
| $1,000 to $1,499 | 230 (54.6%) | 51 (20.9%) |
| $1,500 to $1,999 | 26 (6.2%) | 0 (0.0%) |
| $2,000 to $2,499 | 0 (0.0%) | 0 (0.0%) |
| $2,500 to $2,999 | 3 (0.7%) | 0 (0.0%) |
| $3,000 or more | 0 (0.0%) | 0 (0.0%) |
| Total | 421 (100.0%) | 244 (100.0%) |
Physical Housing Characteristics in Garden City
Housing Structures in Garden City
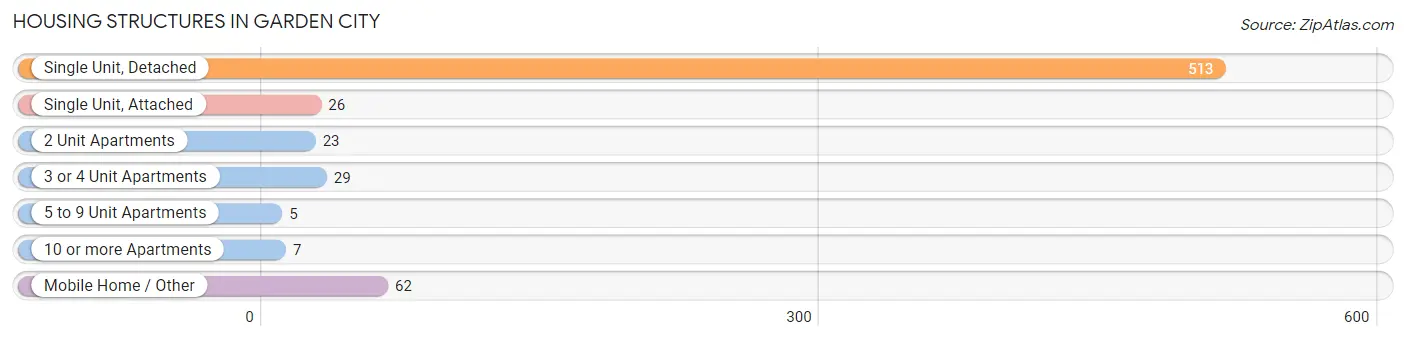
| Structure Type | # Housing Units | % Housing Units |
| Single Unit, Detached | 513 | 77.1% |
| Single Unit, Attached | 26 | 3.9% |
| 2 Unit Apartments | 23 | 3.5% |
| 3 or 4 Unit Apartments | 29 | 4.4% |
| 5 to 9 Unit Apartments | 5 | 0.7% |
| 10 or more Apartments | 7 | 1.1% |
| Mobile Home / Other | 62 | 9.3% |
| Total | 665 | 100.0% |
Housing Structures by Occupancy in Garden City
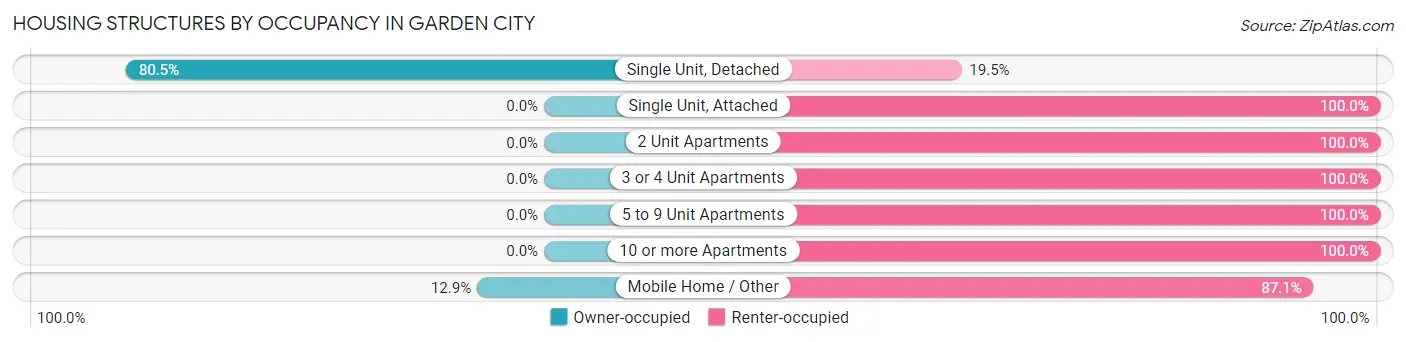
| Structure Type | Owner-occupied | Renter-occupied |
| Single Unit, Detached | 413 (80.5%) | 100 (19.5%) |
| Single Unit, Attached | 0 (0.0%) | 26 (100.0%) |
| 2 Unit Apartments | 0 (0.0%) | 23 (100.0%) |
| 3 or 4 Unit Apartments | 0 (0.0%) | 29 (100.0%) |
| 5 to 9 Unit Apartments | 0 (0.0%) | 5 (100.0%) |
| 10 or more Apartments | 0 (0.0%) | 7 (100.0%) |
| Mobile Home / Other | 8 (12.9%) | 54 (87.1%) |
| Total | 421 (63.3%) | 244 (36.7%) |
Housing Structures by Number of Rooms in Garden City
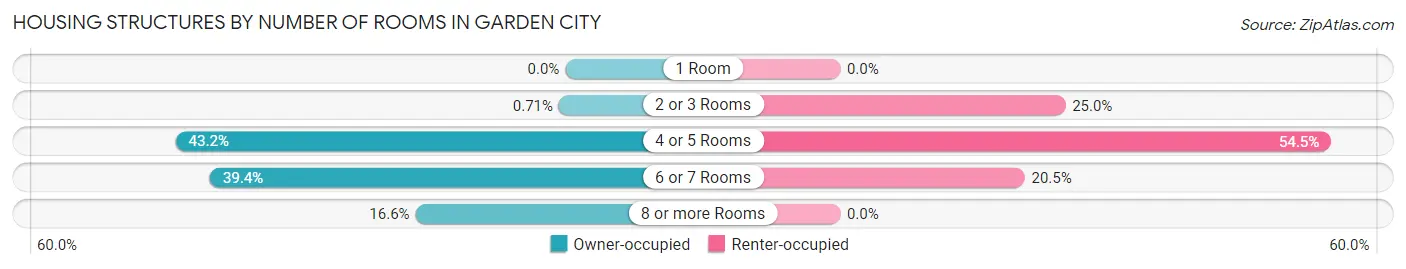
| Number of Rooms | Owner-occupied | Renter-occupied |
| 1 Room | 0 (0.0%) | 0 (0.0%) |
| 2 or 3 Rooms | 3 (0.7%) | 61 (25.0%) |
| 4 or 5 Rooms | 182 (43.2%) | 133 (54.5%) |
| 6 or 7 Rooms | 166 (39.4%) | 50 (20.5%) |
| 8 or more Rooms | 70 (16.6%) | 0 (0.0%) |
| Total | 421 (100.0%) | 244 (100.0%) |
Housing Structure by Heating Type in Garden City
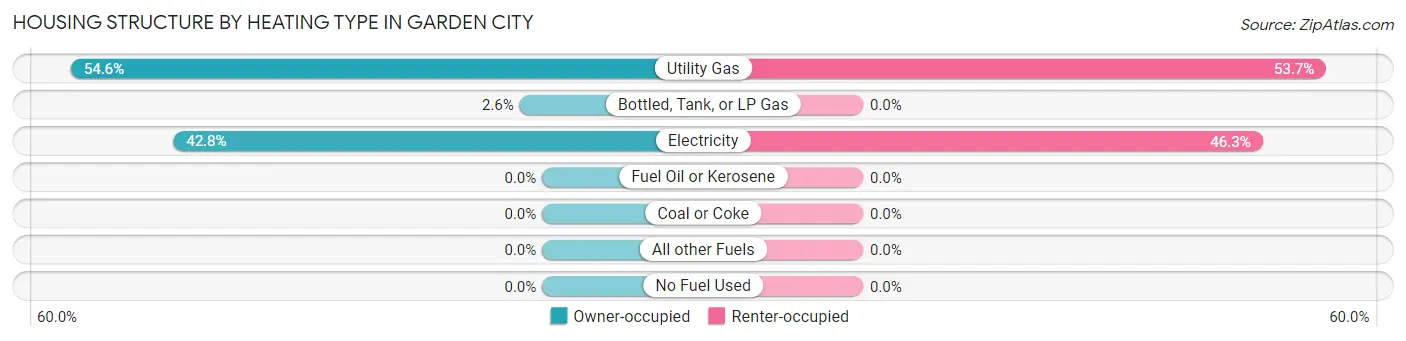
| Heating Type | Owner-occupied | Renter-occupied |
| Utility Gas | 230 (54.6%) | 131 (53.7%) |
| Bottled, Tank, or LP Gas | 11 (2.6%) | 0 (0.0%) |
| Electricity | 180 (42.8%) | 113 (46.3%) |
| Fuel Oil or Kerosene | 0 (0.0%) | 0 (0.0%) |
| Coal or Coke | 0 (0.0%) | 0 (0.0%) |
| All other Fuels | 0 (0.0%) | 0 (0.0%) |
| No Fuel Used | 0 (0.0%) | 0 (0.0%) |
| Total | 421 (100.0%) | 244 (100.0%) |
Household Vehicle Usage in Garden City
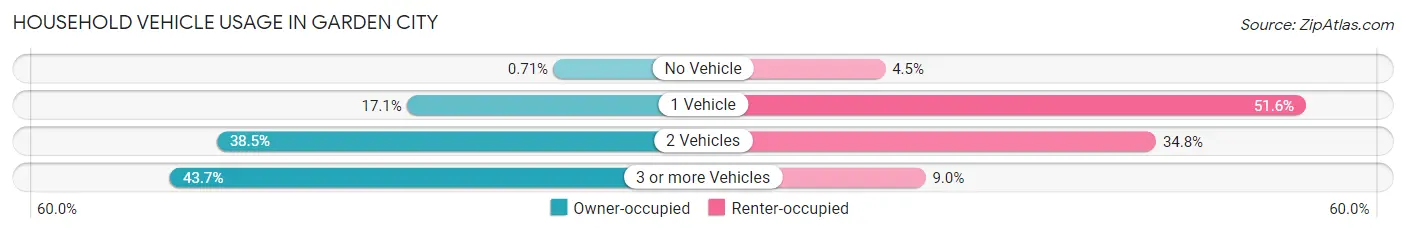
| Vehicles per Household | Owner-occupied | Renter-occupied |
| No Vehicle | 3 (0.7%) | 11 (4.5%) |
| 1 Vehicle | 72 (17.1%) | 126 (51.6%) |
| 2 Vehicles | 162 (38.5%) | 85 (34.8%) |
| 3 or more Vehicles | 184 (43.7%) | 22 (9.0%) |
| Total | 421 (100.0%) | 244 (100.0%) |
Real Estate & Mortgages in Garden City
Real Estate and Mortgage Overview in Garden City
| Characteristic | Without Mortgage | With Mortgage |
| Housing Units | 99 | 322 |
| Median Property Value | $106,300 | $154,200 |
| Median Household Income | $43,438 | $28 |
| Monthly Housing Costs | $456 | $0 |
| Real Estate Taxes | $1,264 | $2 |
Property Value by Mortgage Status in Garden City
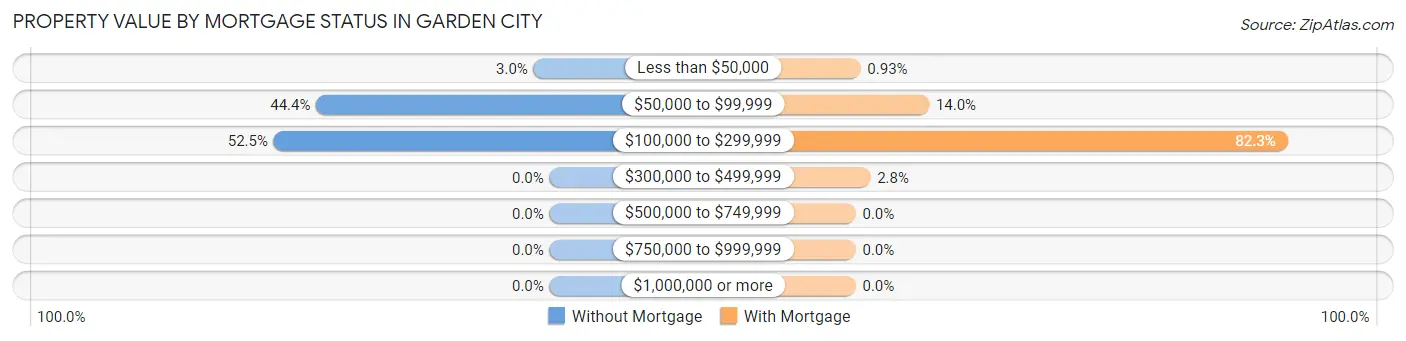
| Property Value | Without Mortgage | With Mortgage |
| Less than $50,000 | 3 (3.0%) | 3 (0.9%) |
| $50,000 to $99,999 | 44 (44.4%) | 45 (14.0%) |
| $100,000 to $299,999 | 52 (52.5%) | 265 (82.3%) |
| $300,000 to $499,999 | 0 (0.0%) | 9 (2.8%) |
| $500,000 to $749,999 | 0 (0.0%) | 0 (0.0%) |
| $750,000 to $999,999 | 0 (0.0%) | 0 (0.0%) |
| $1,000,000 or more | 0 (0.0%) | 0 (0.0%) |
| Total | 99 (100.0%) | 322 (100.0%) |
Household Income by Mortgage Status in Garden City
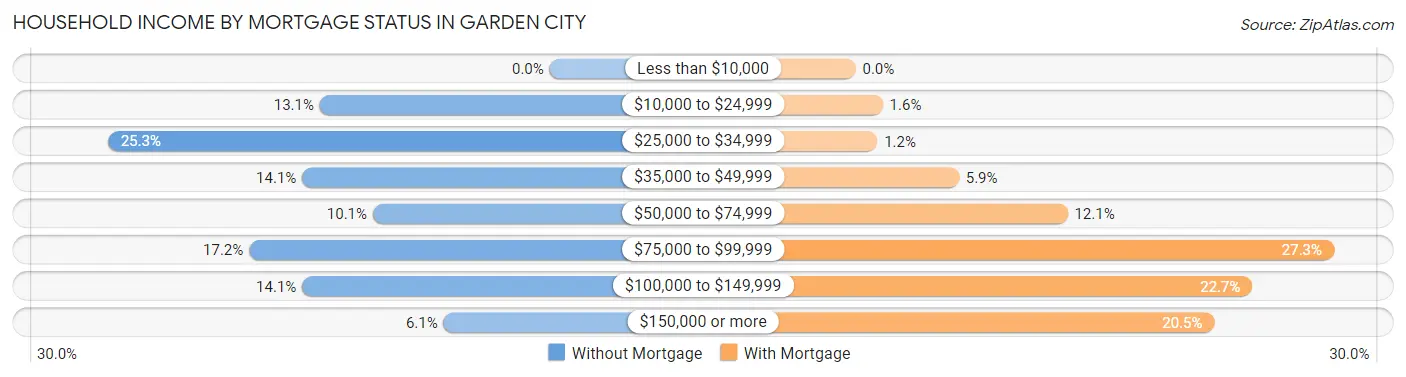
| Household Income | Without Mortgage | With Mortgage |
| Less than $10,000 | 0 (0.0%) | 0 (0.0%) |
| $10,000 to $24,999 | 13 (13.1%) | 5 (1.5%) |
| $25,000 to $34,999 | 25 (25.3%) | 4 (1.2%) |
| $35,000 to $49,999 | 14 (14.1%) | 19 (5.9%) |
| $50,000 to $74,999 | 10 (10.1%) | 39 (12.1%) |
| $75,000 to $99,999 | 17 (17.2%) | 88 (27.3%) |
| $100,000 to $149,999 | 14 (14.1%) | 73 (22.7%) |
| $150,000 or more | 6 (6.1%) | 66 (20.5%) |
| Total | 99 (100.0%) | 322 (100.0%) |
Property Value to Household Income Ratio in Garden City
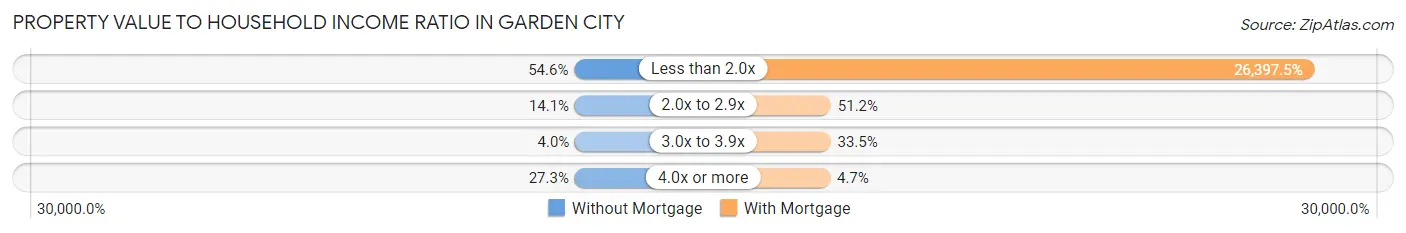
| Value-to-Income Ratio | Without Mortgage | With Mortgage |
| Less than 2.0x | 54 (54.5%) | 85,000 (26,397.5%) |
| 2.0x to 2.9x | 14 (14.1%) | 165 (51.2%) |
| 3.0x to 3.9x | 4 (4.0%) | 108 (33.5%) |
| 4.0x or more | 27 (27.3%) | 15 (4.7%) |
| Total | 99 (100.0%) | 322 (100.0%) |
Real Estate Taxes by Mortgage Status in Garden City
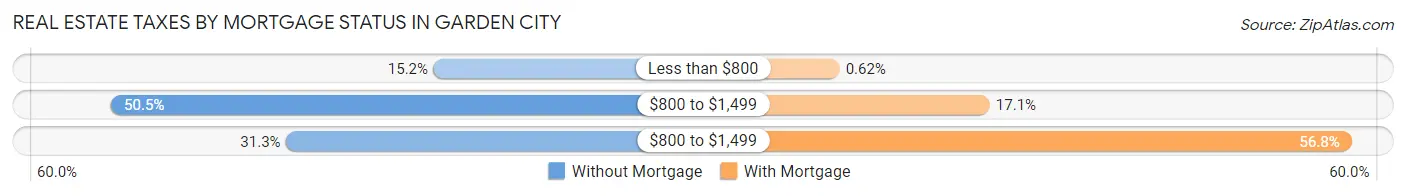
| Property Taxes | Without Mortgage | With Mortgage |
| Less than $800 | 15 (15.1%) | 2 (0.6%) |
| $800 to $1,499 | 50 (50.5%) | 55 (17.1%) |
| $800 to $1,499 | 31 (31.3%) | 183 (56.8%) |
| Total | 99 (100.0%) | 322 (100.0%) |
Health & Disability in Garden City
Health Insurance Coverage by Age in Garden City
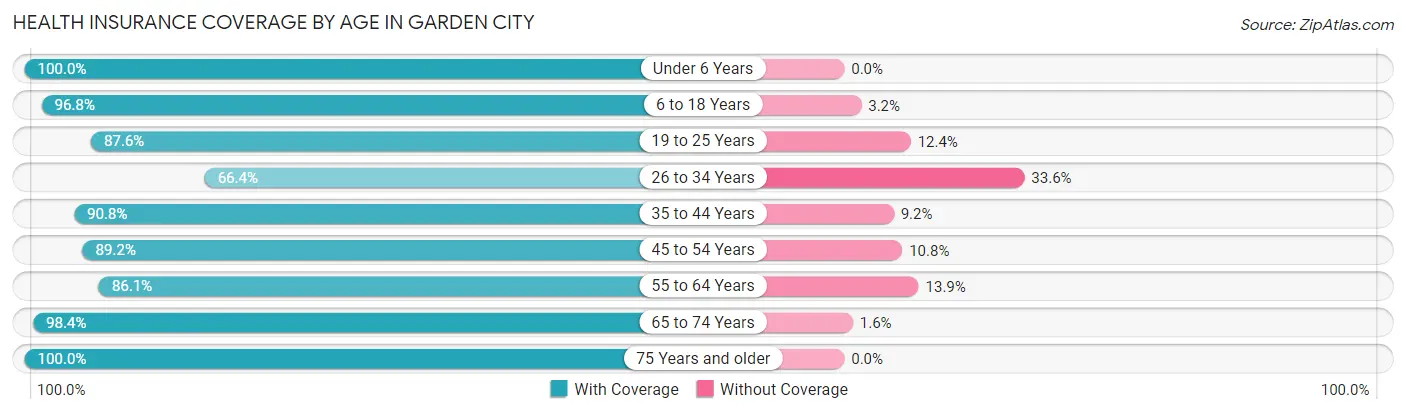
| Age Bracket | With Coverage | Without Coverage |
| Under 6 Years | 117 (100.0%) | 0 (0.0%) |
| 6 to 18 Years | 367 (96.8%) | 12 (3.2%) |
| 19 to 25 Years | 92 (87.6%) | 13 (12.4%) |
| 26 to 34 Years | 174 (66.4%) | 88 (33.6%) |
| 35 to 44 Years | 187 (90.8%) | 19 (9.2%) |
| 45 to 54 Years | 190 (89.2%) | 23 (10.8%) |
| 55 to 64 Years | 143 (86.1%) | 23 (13.9%) |
| 65 to 74 Years | 124 (98.4%) | 2 (1.6%) |
| 75 Years and older | 133 (100.0%) | 0 (0.0%) |
| Total | 1,527 (89.5%) | 180 (10.5%) |
Health Insurance Coverage by Citizenship Status in Garden City
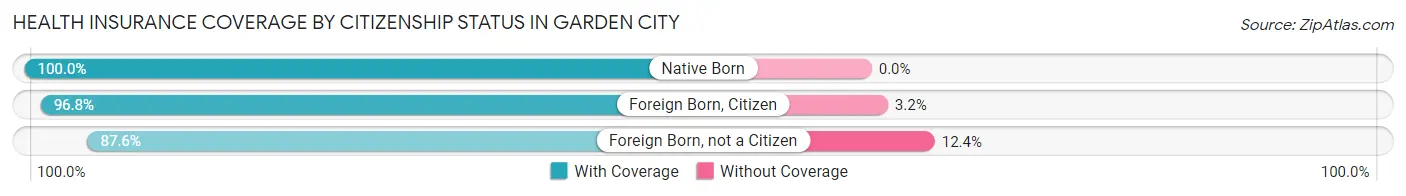
| Citizenship Status | With Coverage | Without Coverage |
| Native Born | 117 (100.0%) | 0 (0.0%) |
| Foreign Born, Citizen | 367 (96.8%) | 12 (3.2%) |
| Foreign Born, not a Citizen | 92 (87.6%) | 13 (12.4%) |
Health Insurance Coverage by Household Income in Garden City
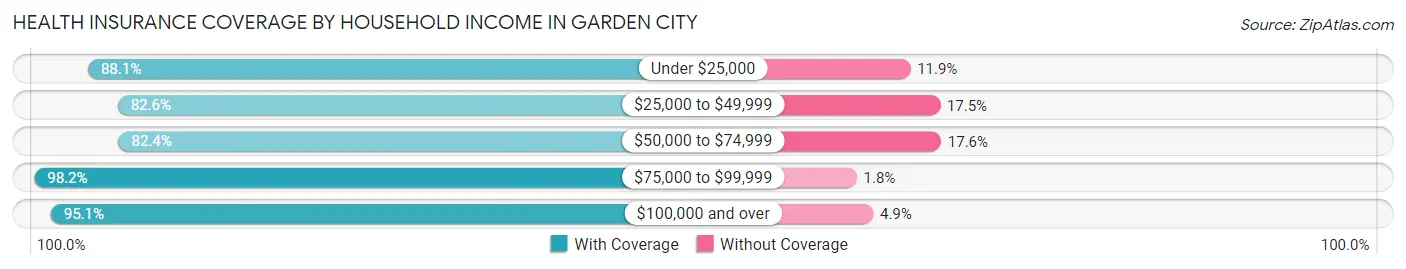
| Household Income | With Coverage | Without Coverage |
| Under $25,000 | 89 (88.1%) | 12 (11.9%) |
| $25,000 to $49,999 | 298 (82.6%) | 63 (17.4%) |
| $50,000 to $74,999 | 360 (82.4%) | 77 (17.6%) |
| $75,000 to $99,999 | 374 (98.2%) | 7 (1.8%) |
| $100,000 and over | 406 (95.1%) | 21 (4.9%) |
Public vs Private Health Insurance Coverage by Age in Garden City
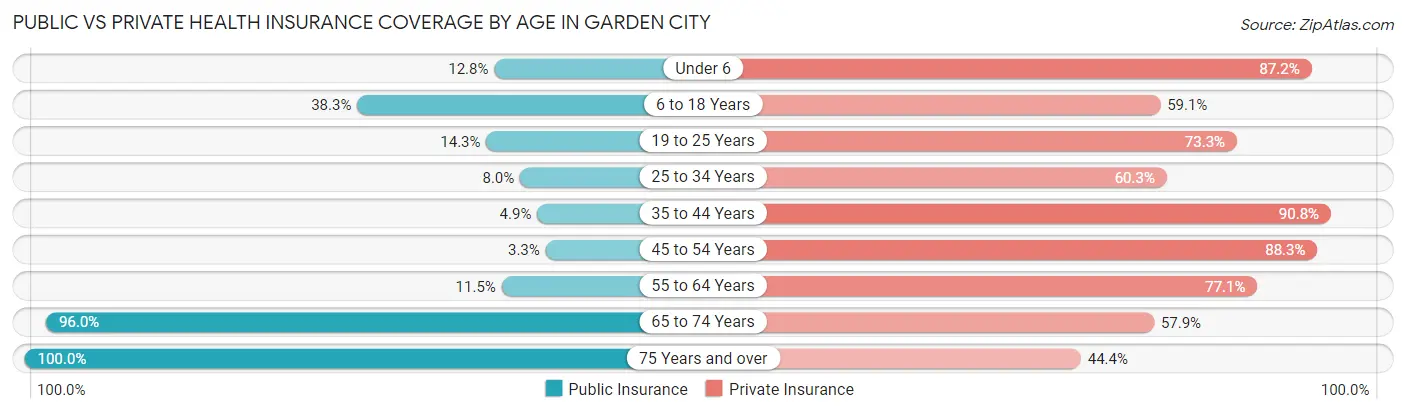
| Age Bracket | Public Insurance | Private Insurance |
| Under 6 | 15 (12.8%) | 102 (87.2%) |
| 6 to 18 Years | 145 (38.3%) | 224 (59.1%) |
| 19 to 25 Years | 15 (14.3%) | 77 (73.3%) |
| 25 to 34 Years | 21 (8.0%) | 158 (60.3%) |
| 35 to 44 Years | 10 (4.9%) | 187 (90.8%) |
| 45 to 54 Years | 7 (3.3%) | 188 (88.3%) |
| 55 to 64 Years | 19 (11.5%) | 128 (77.1%) |
| 65 to 74 Years | 121 (96.0%) | 73 (57.9%) |
| 75 Years and over | 133 (100.0%) | 59 (44.4%) |
| Total | 486 (28.5%) | 1,196 (70.1%) |
Disability Status by Sex by Age in Garden City
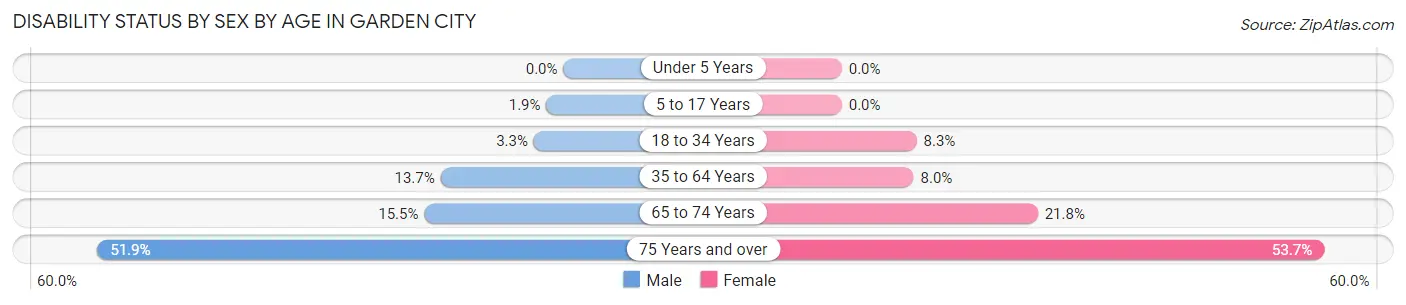
| Age Bracket | Male | Female |
| Under 5 Years | 0 (0.0%) | 0 (0.0%) |
| 5 to 17 Years | 3 (1.9%) | 0 (0.0%) |
| 18 to 34 Years | 7 (3.3%) | 14 (8.3%) |
| 35 to 64 Years | 39 (13.7%) | 24 (8.0%) |
| 65 to 74 Years | 11 (15.5%) | 12 (21.8%) |
| 75 Years and over | 41 (51.9%) | 29 (53.7%) |
Disability Class by Sex by Age in Garden City
Disability Class: Hearing Difficulty
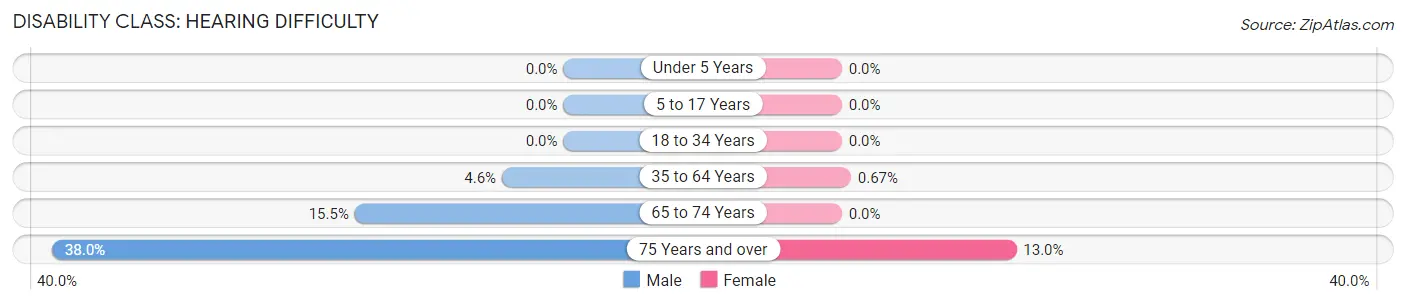
| Age Bracket | Male | Female |
| Under 5 Years | 0 (0.0%) | 0 (0.0%) |
| 5 to 17 Years | 0 (0.0%) | 0 (0.0%) |
| 18 to 34 Years | 0 (0.0%) | 0 (0.0%) |
| 35 to 64 Years | 13 (4.6%) | 2 (0.7%) |
| 65 to 74 Years | 11 (15.5%) | 0 (0.0%) |
| 75 Years and over | 30 (38.0%) | 7 (13.0%) |
Disability Class: Vision Difficulty
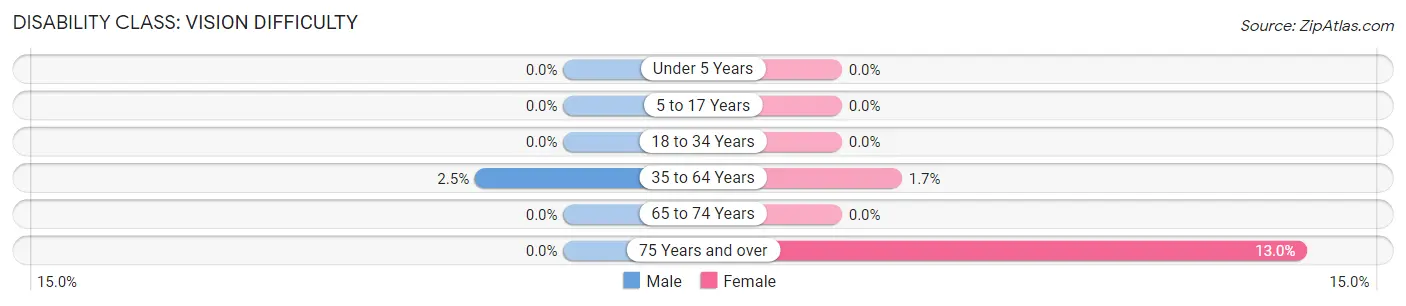
| Age Bracket | Male | Female |
| Under 5 Years | 0 (0.0%) | 0 (0.0%) |
| 5 to 17 Years | 0 (0.0%) | 0 (0.0%) |
| 18 to 34 Years | 0 (0.0%) | 0 (0.0%) |
| 35 to 64 Years | 7 (2.5%) | 5 (1.7%) |
| 65 to 74 Years | 0 (0.0%) | 0 (0.0%) |
| 75 Years and over | 0 (0.0%) | 7 (13.0%) |
Disability Class: Cognitive Difficulty
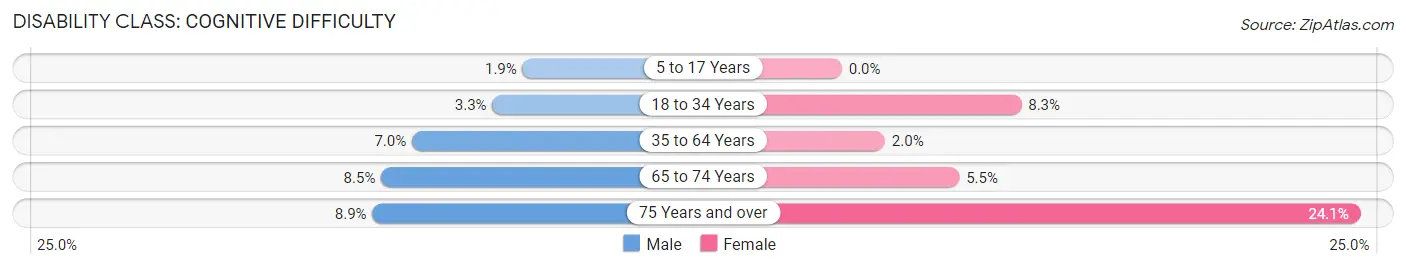
| Age Bracket | Male | Female |
| 5 to 17 Years | 3 (1.9%) | 0 (0.0%) |
| 18 to 34 Years | 7 (3.3%) | 14 (8.3%) |
| 35 to 64 Years | 20 (7.0%) | 6 (2.0%) |
| 65 to 74 Years | 6 (8.5%) | 3 (5.4%) |
| 75 Years and over | 7 (8.9%) | 13 (24.1%) |
Disability Class: Ambulatory Difficulty
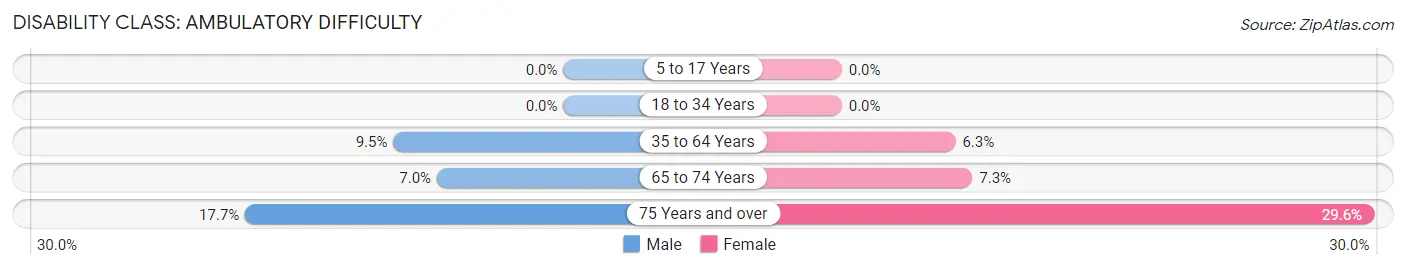
| Age Bracket | Male | Female |
| 5 to 17 Years | 0 (0.0%) | 0 (0.0%) |
| 18 to 34 Years | 0 (0.0%) | 0 (0.0%) |
| 35 to 64 Years | 27 (9.5%) | 19 (6.3%) |
| 65 to 74 Years | 5 (7.0%) | 4 (7.3%) |
| 75 Years and over | 14 (17.7%) | 16 (29.6%) |
Disability Class: Self-Care Difficulty
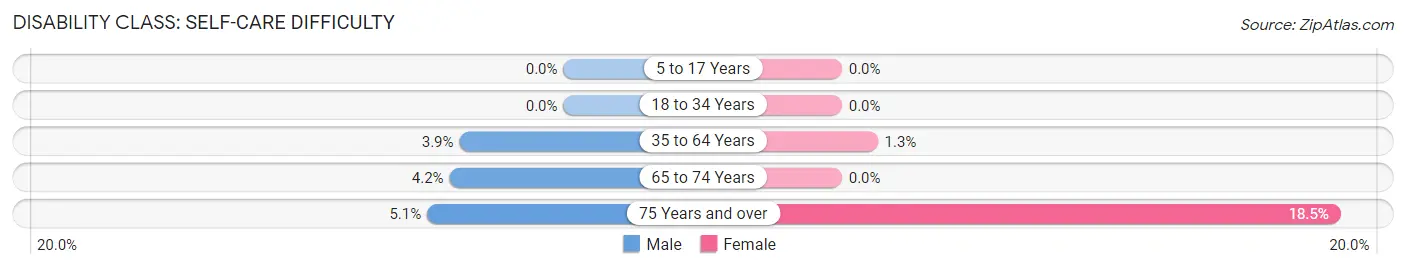
| Age Bracket | Male | Female |
| 5 to 17 Years | 0 (0.0%) | 0 (0.0%) |
| 18 to 34 Years | 0 (0.0%) | 0 (0.0%) |
| 35 to 64 Years | 11 (3.9%) | 4 (1.3%) |
| 65 to 74 Years | 3 (4.2%) | 0 (0.0%) |
| 75 Years and over | 4 (5.1%) | 10 (18.5%) |
Technology Access in Garden City
Computing Device Access in Garden City
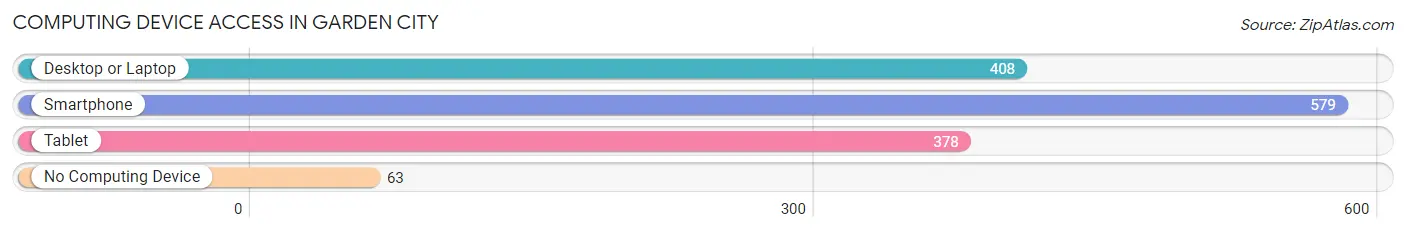
| Device Type | # Households | % Households |
| Desktop or Laptop | 408 | 61.4% |
| Smartphone | 579 | 87.1% |
| Tablet | 378 | 56.8% |
| No Computing Device | 63 | 9.5% |
| Total | 665 | 100.0% |
Internet Access in Garden City
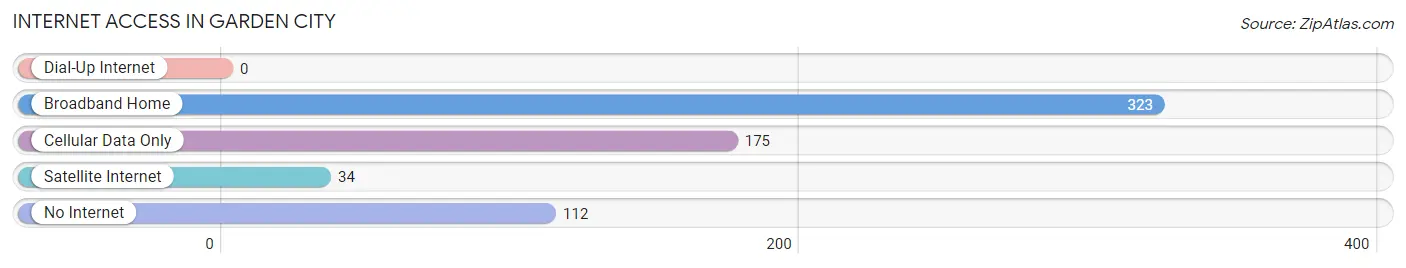
| Internet Type | # Households | % Households |
| Dial-Up Internet | 0 | 0.0% |
| Broadband Home | 323 | 48.6% |
| Cellular Data Only | 175 | 26.3% |
| Satellite Internet | 34 | 5.1% |
| No Internet | 112 | 16.8% |
| Total | 665 | 100.0% |
Garden City Summary
Garden City is a small city located in the southwestern corner of Missouri, in the United States. It is situated in the Ozark Mountains, and is part of the Springfield Metropolitan Statistical Area. The city has a population of approximately 1,400 people, and is the county seat of Barton County.
History
Garden City was founded in 1883 by a group of settlers from the nearby town of Lamar. The settlers chose the name Garden City because of the abundance of wildflowers in the area. The city was incorporated in 1887, and the first post office was established in 1888.
Garden City was a small farming community for much of its history. The town was home to a variety of businesses, including a flour mill, a creamery, a blacksmith shop, and a general store. The town also had a school, a church, and a newspaper.
In the early 20th century, Garden City began to experience a period of growth. The town was connected to the railroad in 1911, and the population began to increase. The town also experienced a period of industrial growth, with the establishment of a brick factory and a canning factory.
Geography
Garden City is located in the southwestern corner of Missouri, in the Ozark Mountains. The city is situated at an elevation of 1,000 feet above sea level. The city is located approximately 30 miles south of Springfield, and is part of the Springfield Metropolitan Statistical Area.
The city is located in a valley, surrounded by hills and mountains. The city is situated on the banks of the James River, which flows through the city. The city is also located near several lakes, including Stockton Lake, Table Rock Lake, and Bull Shoals Lake.
Economy
Garden City is a small, rural community, and the economy is largely based on agriculture. The city is home to several farms, which produce a variety of crops, including corn, soybeans, wheat, and hay. The city is also home to several small businesses, including a grocery store, a hardware store, and a restaurant.
The city is also home to a variety of manufacturing businesses, including a brick factory, a canning factory, and a furniture factory. The city is also home to a variety of service businesses, including a bank, a post office, and a newspaper.
Demographics
Garden City has a population of approximately 1,400 people. The population is predominantly white, with a small minority of African Americans. The median household income is $35,000, and the median home value is $90,000. The city has a low unemployment rate, and the poverty rate is below the national average.
Conclusion
Garden City is a small city located in the southwestern corner of Missouri, in the United States. The city has a population of approximately 1,400 people, and is the county seat of Barton County. The city has a long history, and was founded in 1883 by a group of settlers from the nearby town of Lamar. The city is situated in the Ozark Mountains, and is part of the Springfield Metropolitan Statistical Area. The economy of Garden City is largely based on agriculture, and the city is home to several small businesses. The population of Garden City is predominantly white, with a small minority of African Americans. The median household income is $35,000, and the median home value is $90,000.
Common Questions
What is Per Capita Income in Garden City?
Per Capita income in Garden City is $28,504.
What is the Median Family Income in Garden City?
Median Family Income in Garden City is $67,500.
What is the Median Household income in Garden City?
Median Household Income in Garden City is $62,539.
What is Income or Wage Gap in Garden City?
Income or Wage Gap in Garden City is 21.3%.
Women in Garden City earn 78.7 cents for every dollar earned by a man.
What is Inequality or Gini Index in Garden City?
Inequality or Gini Index in Garden City is 0.35.
What is the Total Population of Garden City?
Total Population of Garden City is 1,711.
What is the Total Male Population of Garden City?
Total Male Population of Garden City is 865.
What is the Total Female Population of Garden City?
Total Female Population of Garden City is 846.
What is the Ratio of Males per 100 Females in Garden City?
There are 102.25 Males per 100 Females in Garden City.
What is the Ratio of Females per 100 Males in Garden City?
There are 97.80 Females per 100 Males in Garden City.
What is the Median Population Age in Garden City?
Median Population Age in Garden City is 33.9 Years.
What is the Average Family Size in Garden City
Average Family Size in Garden City is 3.1 People.
What is the Average Household Size in Garden City
Average Household Size in Garden City is 2.6 People.
How Large is the Labor Force in Garden City?
There are 902 People in the Labor Forcein in Garden City.
What is the Percentage of People in the Labor Force in Garden City?
71.2% of People are in the Labor Force in Garden City.
What is the Unemployment Rate in Garden City?
Unemployment Rate in Garden City is 3.5%.