Galena, MO Map & Demographics
Galena Map
Galena Overview
$14,048
PER CAPITA INCOME
$31,591
AVG FAMILY INCOME
$29,833
AVG HOUSEHOLD INCOME
0.5%
WAGE / INCOME GAP [ % ]
99.5¢/ $1
WAGE / INCOME GAP [ $ ]
0.45
INEQUALITY / GINI INDEX
584
TOTAL POPULATION
280
MALE POPULATION
304
FEMALE POPULATION
92.11
MALES / 100 FEMALES
108.57
FEMALES / 100 MALES
36.8
MEDIAN AGE
3.8
AVG FAMILY SIZE
3.1
AVG HOUSEHOLD SIZE
156
LABOR FORCE [ PEOPLE ]
37.2%
PERCENT IN LABOR FORCE
5.1%
UNEMPLOYMENT RATE
Galena Zip Codes
Galena Area Codes
Income in Galena
Income Overview in Galena
Per Capita Income in Galena is $14,048, while median incomes of families and households are $31,591 and $29,833 respectively.
| Characteristic | Number | Measure |
| Per Capita Income | 584 | $14,048 |
| Median Family Income | 128 | $31,591 |
| Mean Family Income | 128 | $45,667 |
| Median Household Income | 186 | $29,833 |
| Mean Household Income | 186 | $44,513 |
| Income Deficit | 128 | $0 |
| Wage / Income Gap (%) | 584 | 0.46% |
| Wage / Income Gap ($) | 584 | 99.54¢ per $1 |
| Gini / Inequality Index | 584 | 0.45 |
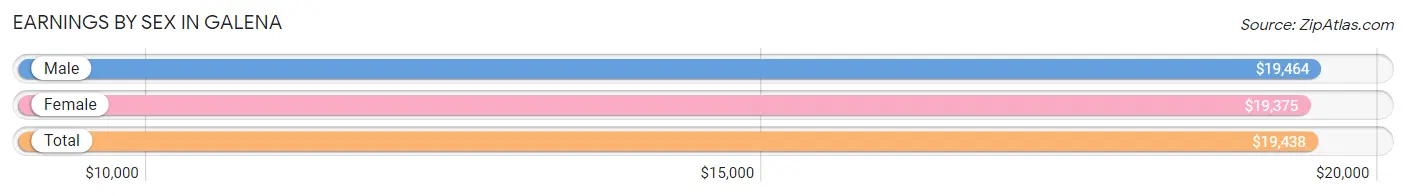
Earnings by Sex in Galena
Average Earnings in Galena are $19,438, $19,464 for men and $19,375 for women, a difference of 0.5%.
| Sex | Number | Average Earnings |
| Male | 80 (46.2%) | $19,464 |
| Female | 93 (53.8%) | $19,375 |
| Total | 173 (100.0%) | $19,438 |
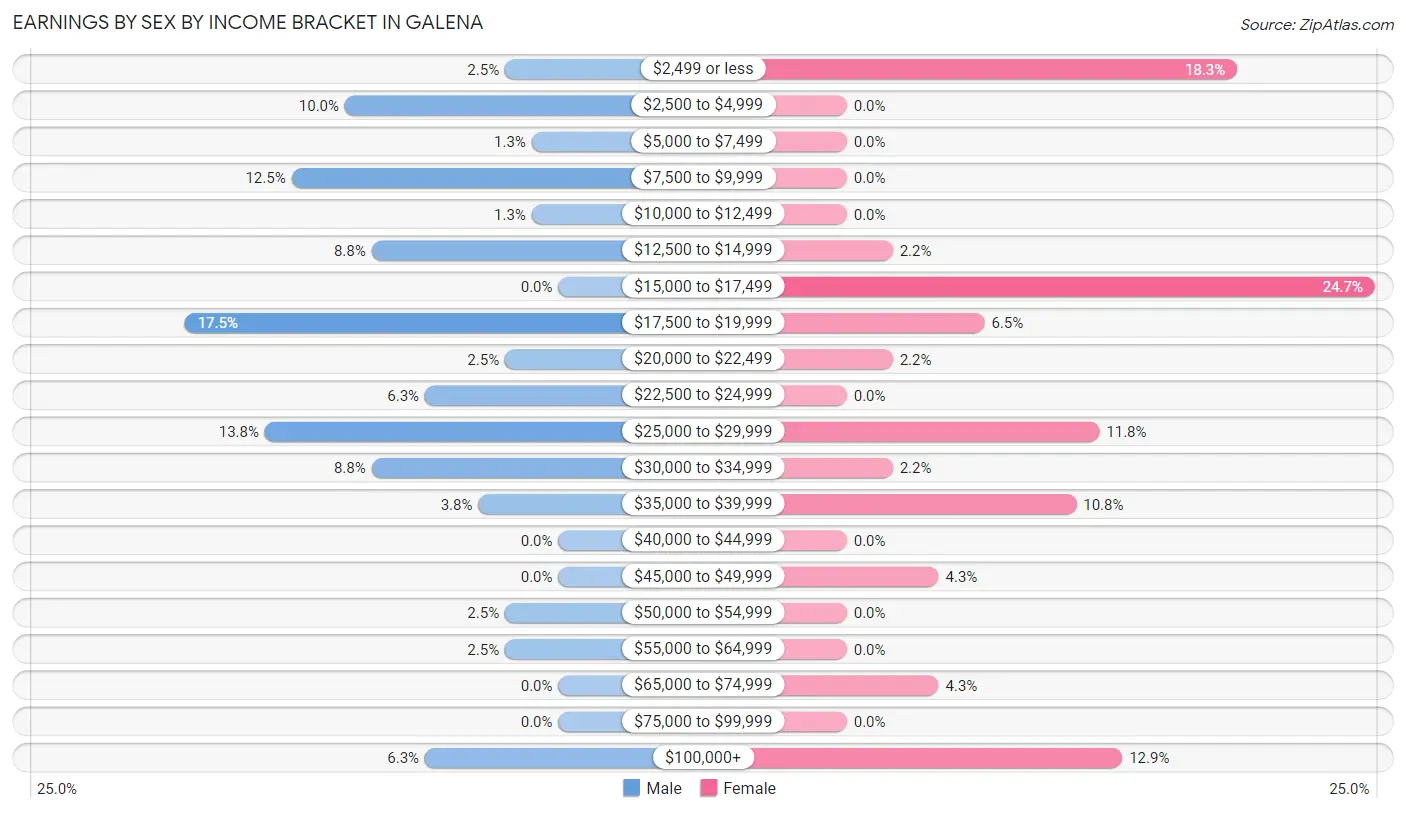
Earnings by Sex by Income Bracket in Galena
The most common earnings brackets in Galena are $17,500 to $19,999 for men (14 | 17.5%) and $15,000 to $17,499 for women (23 | 24.7%).
| Income | Male | Female |
| $2,499 or less | 2 (2.5%) | 17 (18.3%) |
| $2,500 to $4,999 | 8 (10.0%) | 0 (0.0%) |
| $5,000 to $7,499 | 1 (1.3%) | 0 (0.0%) |
| $7,500 to $9,999 | 10 (12.5%) | 0 (0.0%) |
| $10,000 to $12,499 | 1 (1.3%) | 0 (0.0%) |
| $12,500 to $14,999 | 7 (8.7%) | 2 (2.1%) |
| $15,000 to $17,499 | 0 (0.0%) | 23 (24.7%) |
| $17,500 to $19,999 | 14 (17.5%) | 6 (6.5%) |
| $20,000 to $22,499 | 2 (2.5%) | 2 (2.1%) |
| $22,500 to $24,999 | 5 (6.2%) | 0 (0.0%) |
| $25,000 to $29,999 | 11 (13.8%) | 11 (11.8%) |
| $30,000 to $34,999 | 7 (8.7%) | 2 (2.1%) |
| $35,000 to $39,999 | 3 (3.7%) | 10 (10.7%) |
| $40,000 to $44,999 | 0 (0.0%) | 0 (0.0%) |
| $45,000 to $49,999 | 0 (0.0%) | 4 (4.3%) |
| $50,000 to $54,999 | 2 (2.5%) | 0 (0.0%) |
| $55,000 to $64,999 | 2 (2.5%) | 0 (0.0%) |
| $65,000 to $74,999 | 0 (0.0%) | 4 (4.3%) |
| $75,000 to $99,999 | 0 (0.0%) | 0 (0.0%) |
| $100,000+ | 5 (6.2%) | 12 (12.9%) |
| Total | 80 (100.0%) | 93 (100.0%) |
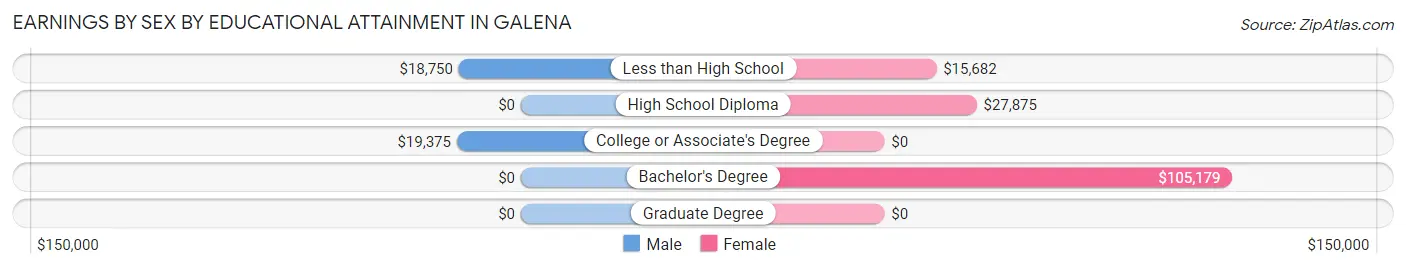
Earnings by Sex by Educational Attainment in Galena
Average earnings in Galena are $22,500 for men and $23,750 for women, a difference of 5.3%. Men with an educational attainment of college or associate's degree enjoy the highest average annual earnings of $19,375, while those with less than high school education earn the least with $18,750. Women with an educational attainment of bachelor's degree earn the most with the average annual earnings of $105,179, while those with less than high school education have the smallest earnings of $15,682.
| Educational Attainment | Male Income | Female Income |
| Less than High School | $18,750 | $15,682 |
| High School Diploma | - | - |
| College or Associate's Degree | $19,375 | $0 |
| Bachelor's Degree | - | - |
| Graduate Degree | - | - |
| Total | $22,500 | $23,750 |
Family Income in Galena
Family Income Brackets in Galena
According to the Galena family income data, there are 37 families falling into the $35,000 to $49,999 income range, which is the most common income bracket and makes up 28.9% of all families.
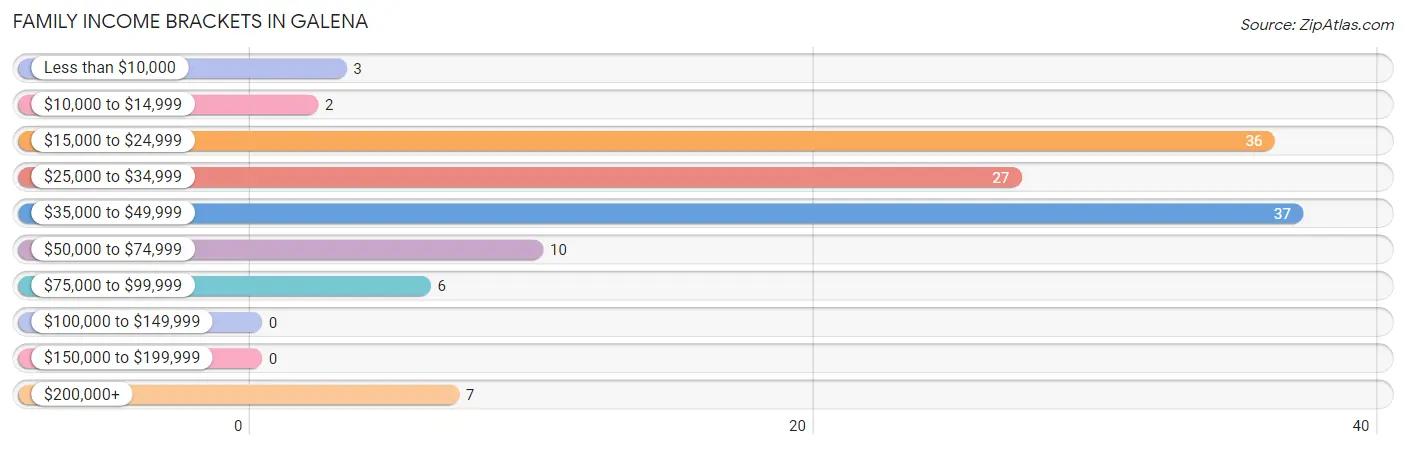
| Income Bracket | # Families | % Families |
| Less than $10,000 | 3 | 2.3% |
| $10,000 to $14,999 | 2 | 1.6% |
| $15,000 to $24,999 | 36 | 28.1% |
| $25,000 to $34,999 | 27 | 21.1% |
| $35,000 to $49,999 | 37 | 28.9% |
| $50,000 to $74,999 | 10 | 7.8% |
| $75,000 to $99,999 | 6 | 4.7% |
| $100,000 to $149,999 | 0 | 0.0% |
| $150,000 to $199,999 | 0 | 0.0% |
| $200,000+ | 7 | 5.5% |
Family Income by Famaliy Size in Galena
4-person families (10 | 7.8%) account for the highest median family income in Galena with $49,583 per family, while 3-person families (47 | 36.7%) have the highest median income of $13,828 per family member.
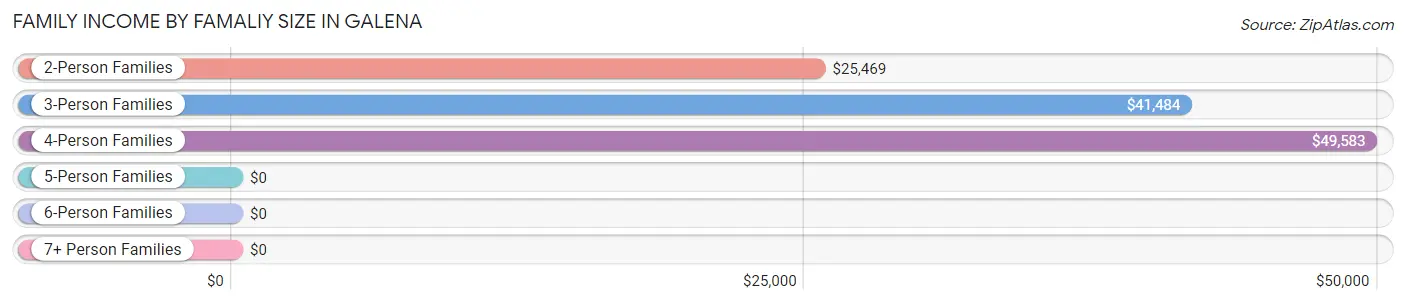
| Income Bracket | # Families | Median Income |
| 2-Person Families | 37 (28.9%) | $25,469 |
| 3-Person Families | 47 (36.7%) | $41,484 |
| 4-Person Families | 10 (7.8%) | $49,583 |
| 5-Person Families | 7 (5.5%) | $0 |
| 6-Person Families | 10 (7.8%) | $0 |
| 7+ Person Families | 17 (13.3%) | $0 |
| Total | 128 (100.0%) | $31,591 |
Family Income by Number of Earners in Galena
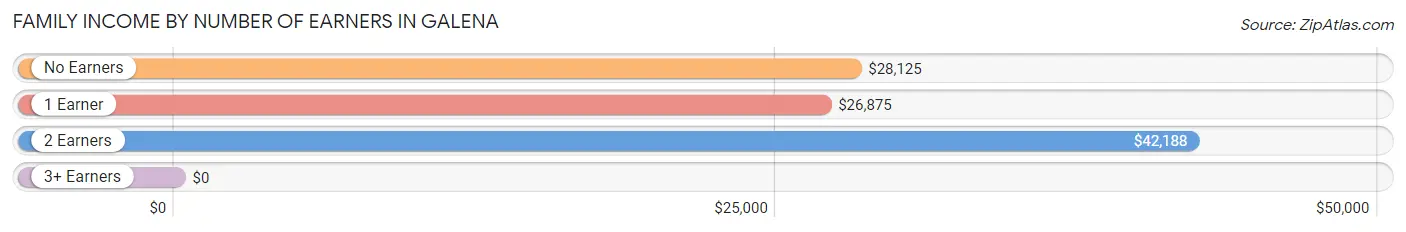
| Number of Earners | # Families | Median Income |
| No Earners | 34 (26.6%) | $28,125 |
| 1 Earner | 53 (41.4%) | $26,875 |
| 2 Earners | 39 (30.5%) | $42,188 |
| 3+ Earners | 2 (1.6%) | $0 |
| Total | 128 (100.0%) | $31,591 |
Household Income in Galena
Household Income Brackets in Galena
With 53 households falling in the category, the $15,000 to $24,999 income range is the most frequent in Galena, accounting for 28.5% of all households.
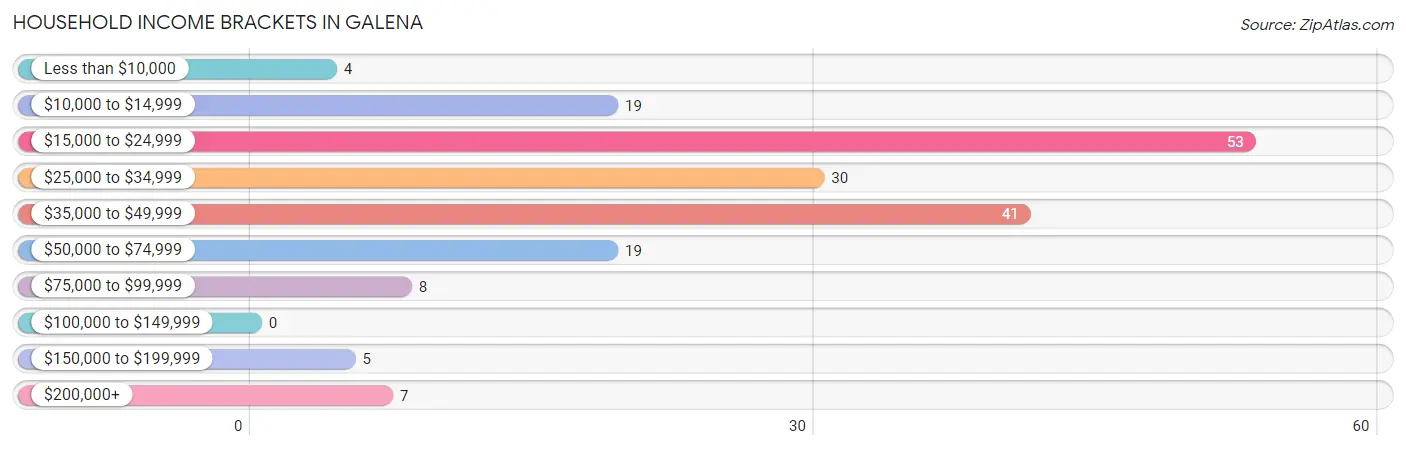
| Income Bracket | # Households | % Households |
| Less than $10,000 | 4 | 2.2% |
| $10,000 to $14,999 | 19 | 10.2% |
| $15,000 to $24,999 | 53 | 28.5% |
| $25,000 to $34,999 | 30 | 16.1% |
| $35,000 to $49,999 | 41 | 22.0% |
| $50,000 to $74,999 | 19 | 10.2% |
| $75,000 to $99,999 | 8 | 4.3% |
| $100,000 to $149,999 | 0 | 0.0% |
| $150,000 to $199,999 | 5 | 2.7% |
| $200,000+ | 7 | 3.8% |
Household Income by Householder Age in Galena
The median household income in Galena is $29,833, with the highest median household income of $41,000 found in the 45 to 64 years age bracket for the primary householder. A total of 64 households (34.4%) fall into this category. Meanwhile, the 15 to 24 years age bracket for the primary householder has the lowest median household income of $0, with 1 households (0.5%) in this group.
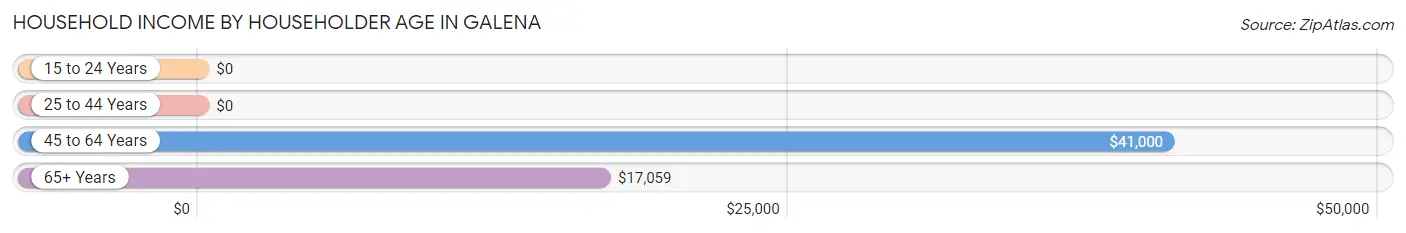
| Income Bracket | # Households | Median Income |
| 15 to 24 Years | 1 (0.5%) | $0 |
| 25 to 44 Years | 61 (32.8%) | $0 |
| 45 to 64 Years | 64 (34.4%) | $41,000 |
| 65+ Years | 60 (32.3%) | $17,059 |
| Total | 186 (100.0%) | $29,833 |
Poverty in Galena
Income Below Poverty by Sex and Age in Galena
With 37.7% poverty level for males and 41.8% for females among the residents of Galena, 18 to 24 year old males and 16 and 17 year old females are the most vulnerable to poverty, with 6 males (100.0%) and 9 females (100.0%) in their respective age groups living below the poverty level.
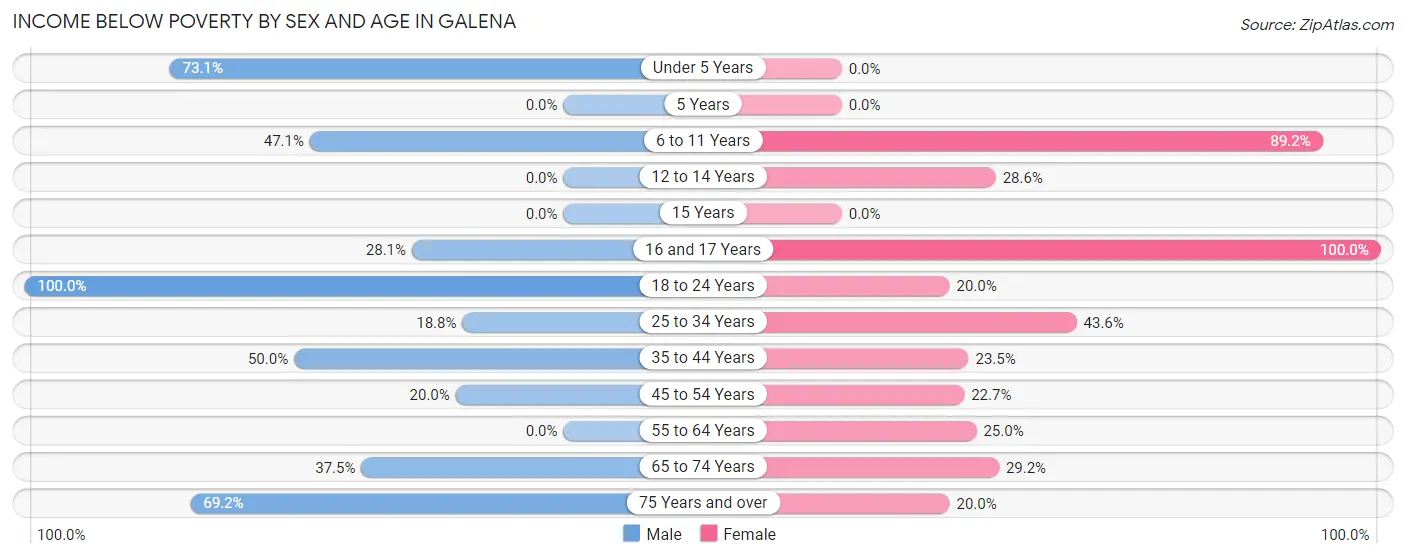
| Age Bracket | Male | Female |
| Under 5 Years | 19 (73.1%) | 0 (0.0%) |
| 5 Years | 0 (0.0%) | 0 (0.0%) |
| 6 to 11 Years | 24 (47.1%) | 58 (89.2%) |
| 12 to 14 Years | 0 (0.0%) | 2 (28.6%) |
| 15 Years | 0 (0.0%) | 0 (0.0%) |
| 16 and 17 Years | 9 (28.1%) | 9 (100.0%) |
| 18 to 24 Years | 6 (100.0%) | 1 (20.0%) |
| 25 to 34 Years | 3 (18.8%) | 17 (43.6%) |
| 35 to 44 Years | 16 (50.0%) | 12 (23.5%) |
| 45 to 54 Years | 5 (20.0%) | 5 (22.7%) |
| 55 to 64 Years | 0 (0.0%) | 9 (25.0%) |
| 65 to 74 Years | 9 (37.5%) | 7 (29.2%) |
| 75 Years and over | 9 (69.2%) | 7 (20.0%) |
| Total | 100 (37.7%) | 127 (41.8%) |
Income Above Poverty by Sex and Age in Galena
According to the poverty statistics in Galena, males aged 12 to 14 years and females aged under 5 years are the age groups that are most secure financially, with 100.0% of males and 100.0% of females in these age groups living above the poverty line.
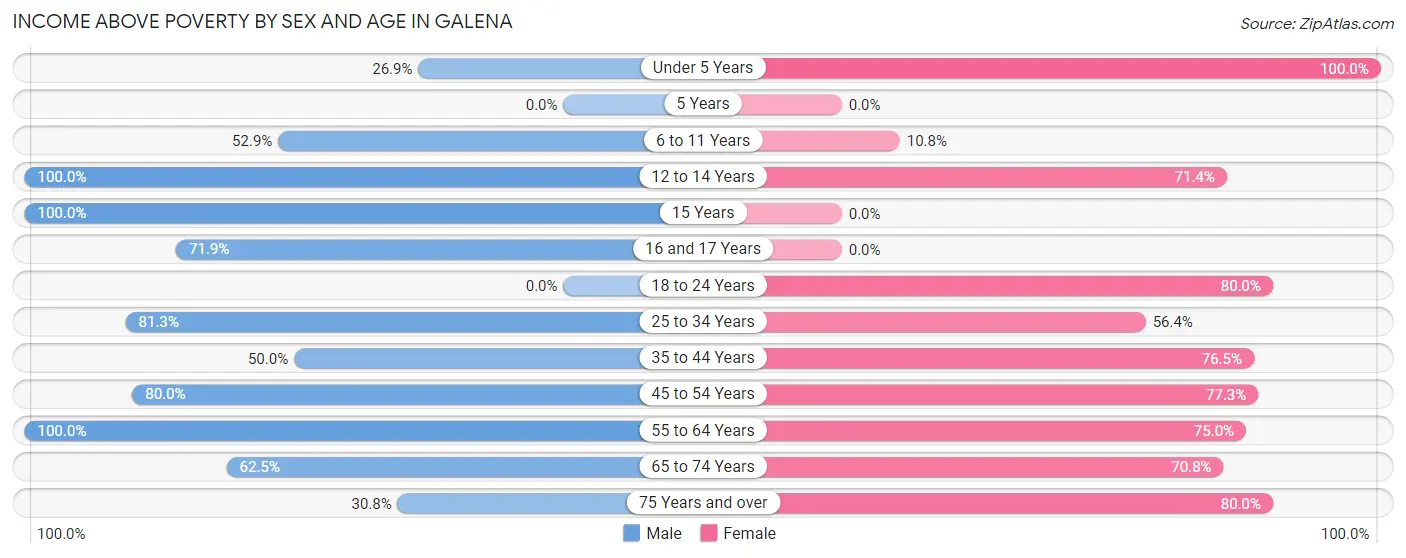
| Age Bracket | Male | Female |
| Under 5 Years | 7 (26.9%) | 11 (100.0%) |
| 5 Years | 0 (0.0%) | 0 (0.0%) |
| 6 to 11 Years | 27 (52.9%) | 7 (10.8%) |
| 12 to 14 Years | 3 (100.0%) | 5 (71.4%) |
| 15 Years | 2 (100.0%) | 0 (0.0%) |
| 16 and 17 Years | 23 (71.9%) | 0 (0.0%) |
| 18 to 24 Years | 0 (0.0%) | 4 (80.0%) |
| 25 to 34 Years | 13 (81.2%) | 22 (56.4%) |
| 35 to 44 Years | 16 (50.0%) | 39 (76.5%) |
| 45 to 54 Years | 20 (80.0%) | 17 (77.3%) |
| 55 to 64 Years | 35 (100.0%) | 27 (75.0%) |
| 65 to 74 Years | 15 (62.5%) | 17 (70.8%) |
| 75 Years and over | 4 (30.8%) | 28 (80.0%) |
| Total | 165 (62.3%) | 177 (58.2%) |
Income Below Poverty Among Married-Couple Families in Galena
The poverty statistics for married-couple families in Galena show that 28.7% or 23 of the total 80 families live below the poverty line. Families with 5 or more children have the highest poverty rate of 100.0%, comprising of 17 families. On the other hand, families with 3 or 4 children have the lowest poverty rate of 0.0%, which includes 0 families.
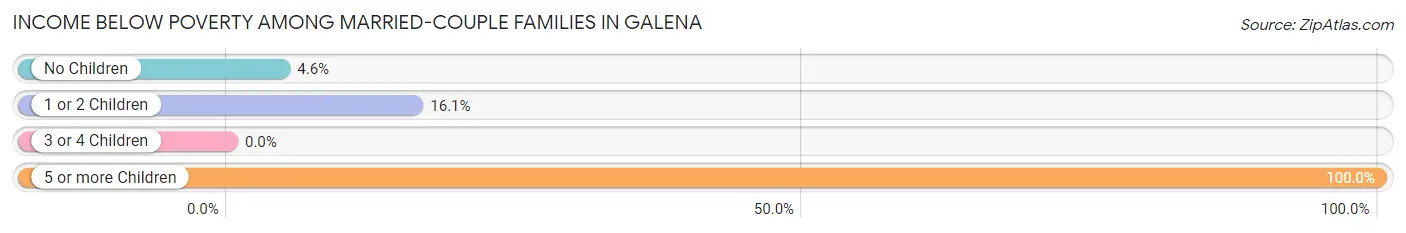
| Children | Above Poverty | Below Poverty |
| No Children | 21 (95.5%) | 1 (4.5%) |
| 1 or 2 Children | 26 (83.9%) | 5 (16.1%) |
| 3 or 4 Children | 10 (100.0%) | 0 (0.0%) |
| 5 or more Children | 0 (0.0%) | 17 (100.0%) |
| Total | 57 (71.3%) | 23 (28.7%) |
Income Below Poverty Among Single-Parent Households in Galena
According to the poverty data in Galena, 23.1% or 3 single-father households and 42.9% or 15 single-mother households are living below the poverty line. Among single-father households, those with 5 or more children have the highest poverty rate, with 2 households (100.0%) experiencing poverty. Likewise, among single-mother households, those with no children have the highest poverty rate, with 5 households (71.4%) falling below the poverty line.
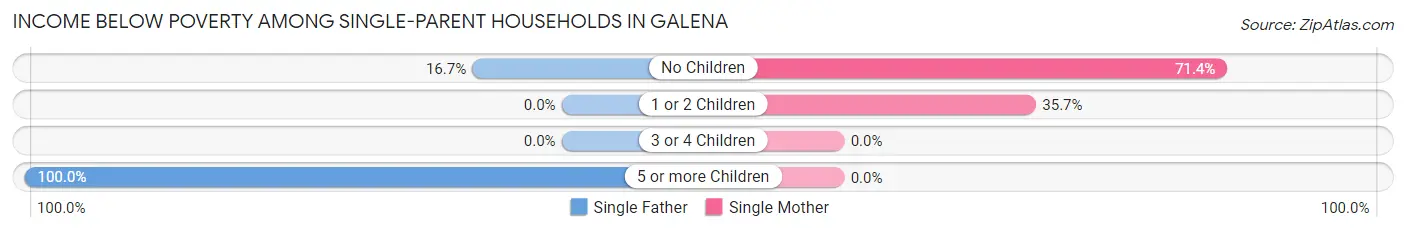
| Children | Single Father | Single Mother |
| No Children | 1 (16.7%) | 5 (71.4%) |
| 1 or 2 Children | 0 (0.0%) | 10 (35.7%) |
| 3 or 4 Children | 0 (0.0%) | 0 (0.0%) |
| 5 or more Children | 2 (100.0%) | 0 (0.0%) |
| Total | 3 (23.1%) | 15 (42.9%) |
Income Below Poverty Among Married-Couple vs Single-Parent Households in Galena
The poverty data for Galena shows that 23 of the married-couple family households (28.7%) and 18 of the single-parent households (37.5%) are living below the poverty level. Within the married-couple family households, those with 5 or more children have the highest poverty rate, with 17 households (100.0%) falling below the poverty line. Among the single-parent households, those with 5 or more children have the highest poverty rate, with 2 household (100.0%) living below poverty.
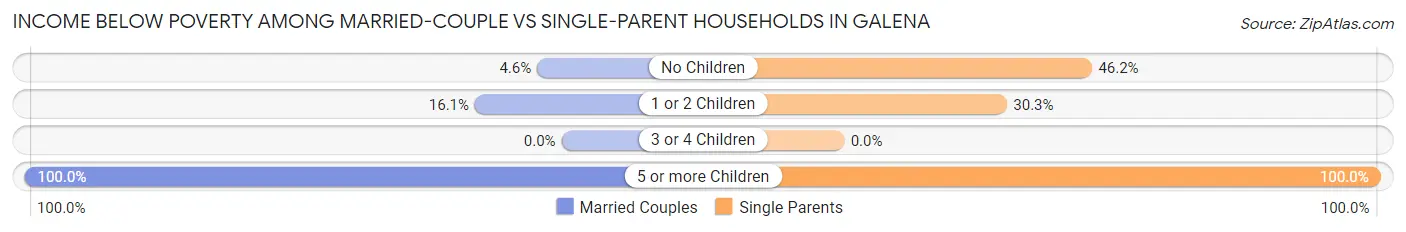
| Children | Married-Couple Families | Single-Parent Households |
| No Children | 1 (4.5%) | 6 (46.2%) |
| 1 or 2 Children | 5 (16.1%) | 10 (30.3%) |
| 3 or 4 Children | 0 (0.0%) | 0 (0.0%) |
| 5 or more Children | 17 (100.0%) | 2 (100.0%) |
| Total | 23 (28.7%) | 18 (37.5%) |
Race in Galena
The most populous races in Galena are White / Caucasian (575 | 98.5%), Hispanic or Latino (17 | 2.9%), and Black / African American (8 | 1.4%).
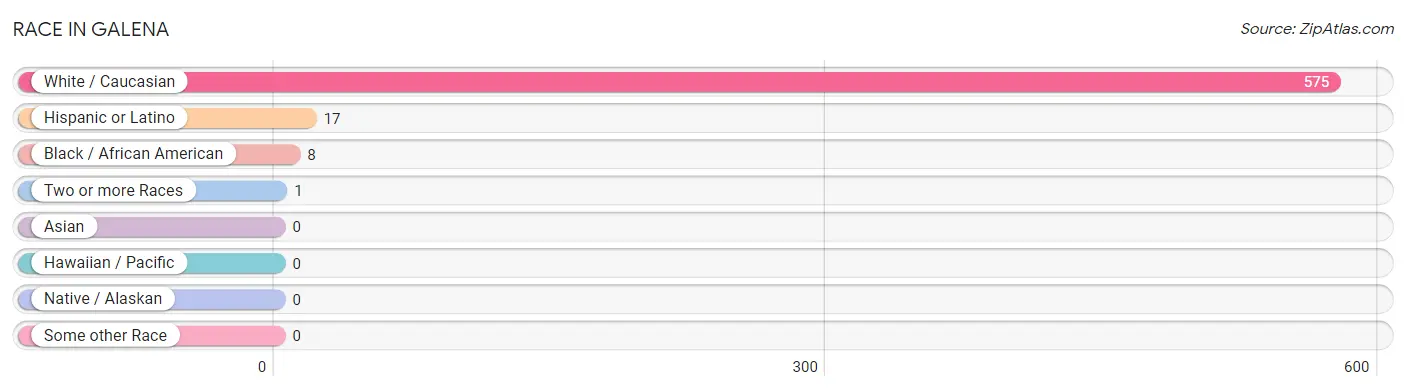
| Race | # Population | % Population |
| Asian | 0 | 0.0% |
| Black / African American | 8 | 1.4% |
| Hawaiian / Pacific | 0 | 0.0% |
| Hispanic or Latino | 17 | 2.9% |
| Native / Alaskan | 0 | 0.0% |
| White / Caucasian | 575 | 98.5% |
| Two or more Races | 1 | 0.2% |
| Some other Race | 0 | 0.0% |
| Total | 584 | 100.0% |
Ancestry in Galena
The most populous ancestries reported in Galena are German (122 | 20.9%), Norwegian (105 | 18.0%), Irish (104 | 17.8%), Swedish (97 | 16.6%), and English (91 | 15.6%), together accounting for 88.9% of all Galena residents.
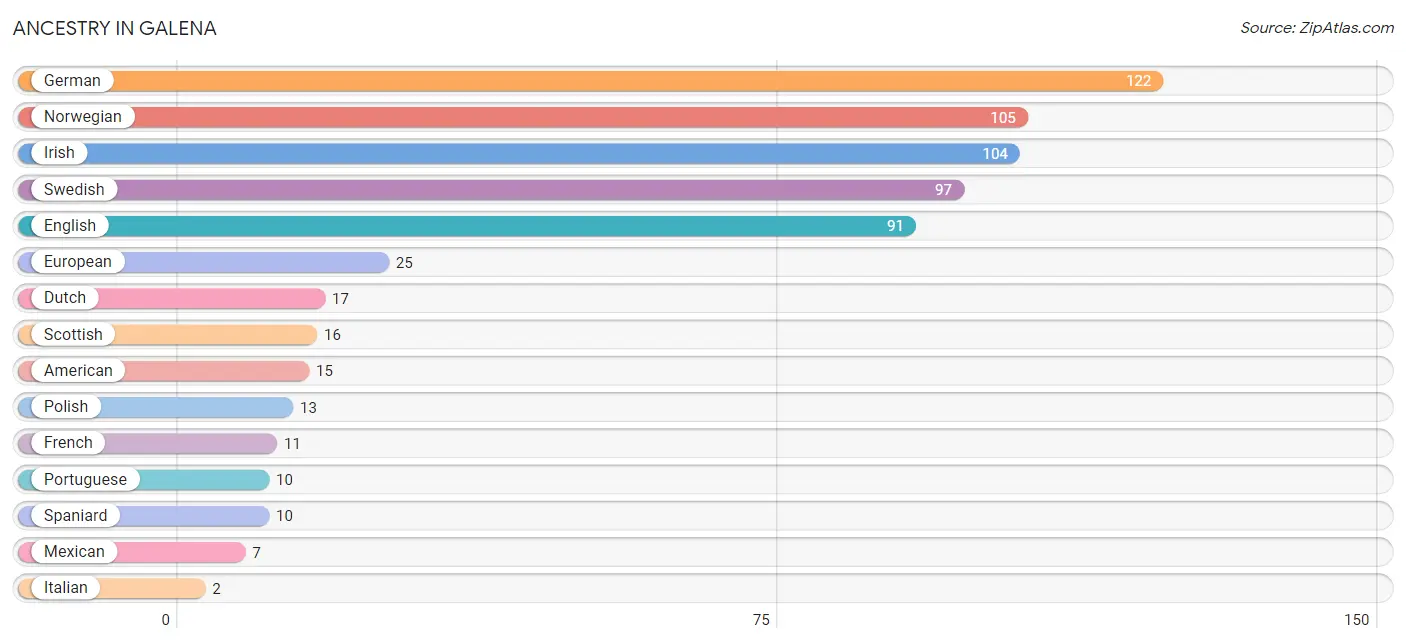
| Ancestry | # Population | % Population |
| American | 15 | 2.6% |
| Dutch | 17 | 2.9% |
| English | 91 | 15.6% |
| European | 25 | 4.3% |
| French | 11 | 1.9% |
| German | 122 | 20.9% |
| Irish | 104 | 17.8% |
| Italian | 2 | 0.3% |
| Mexican | 7 | 1.2% |
| Norwegian | 105 | 18.0% |
| Polish | 13 | 2.2% |
| Portuguese | 10 | 1.7% |
| Scottish | 16 | 2.7% |
| Spaniard | 10 | 1.7% |
| Swedish | 97 | 16.6% |
| Swiss | 2 | 0.3% | View All 16 Rows |
Immigrants in Galena

| Immigration Origin | # Population | % Population | View All 0 Rows |
Sex and Age in Galena
Sex and Age in Galena
The most populous age groups in Galena are 15 to 19 Years (48 | 17.1%) for men and 10 to 14 Years (39 | 12.8%) for women.
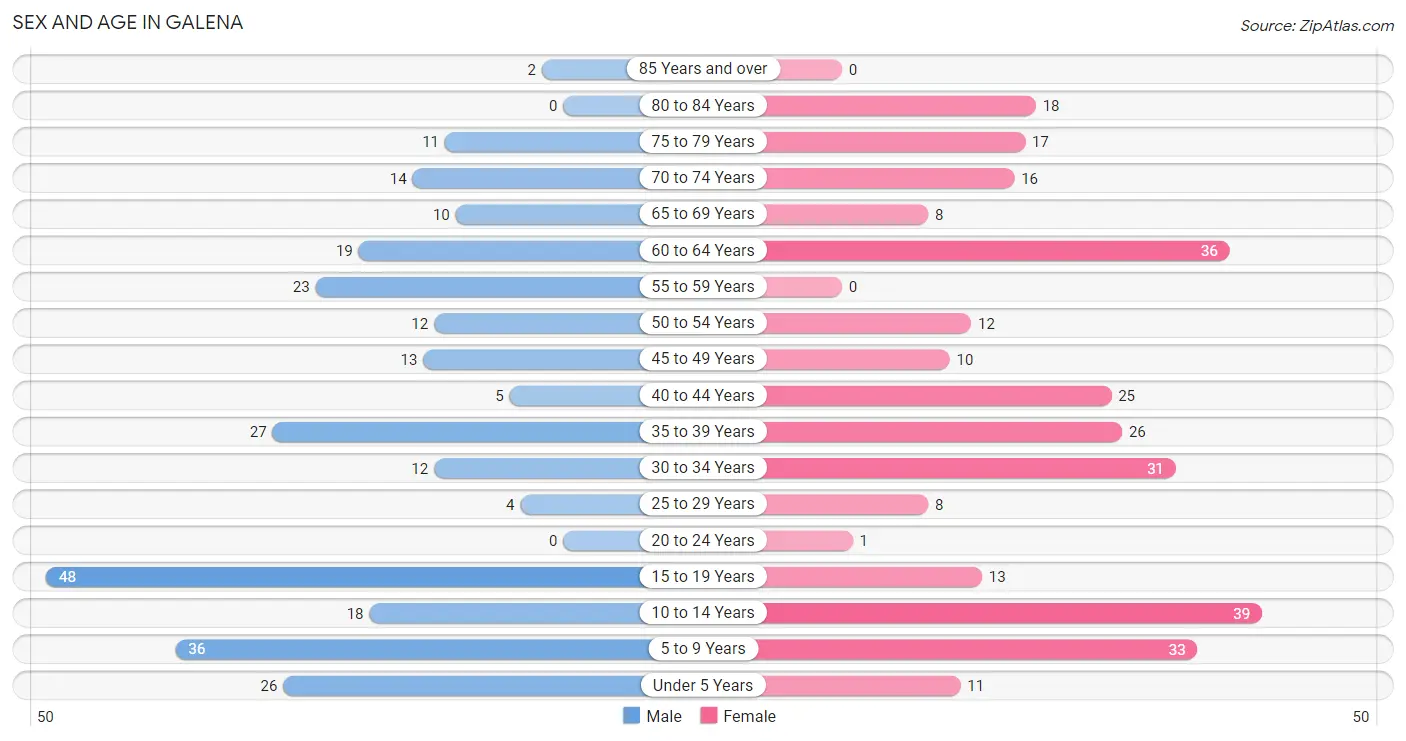
| Age Bracket | Male | Female |
| Under 5 Years | 26 (9.3%) | 11 (3.6%) |
| 5 to 9 Years | 36 (12.9%) | 33 (10.9%) |
| 10 to 14 Years | 18 (6.4%) | 39 (12.8%) |
| 15 to 19 Years | 48 (17.1%) | 13 (4.3%) |
| 20 to 24 Years | 0 (0.0%) | 1 (0.3%) |
| 25 to 29 Years | 4 (1.4%) | 8 (2.6%) |
| 30 to 34 Years | 12 (4.3%) | 31 (10.2%) |
| 35 to 39 Years | 27 (9.6%) | 26 (8.6%) |
| 40 to 44 Years | 5 (1.8%) | 25 (8.2%) |
| 45 to 49 Years | 13 (4.6%) | 10 (3.3%) |
| 50 to 54 Years | 12 (4.3%) | 12 (4.0%) |
| 55 to 59 Years | 23 (8.2%) | 0 (0.0%) |
| 60 to 64 Years | 19 (6.8%) | 36 (11.8%) |
| 65 to 69 Years | 10 (3.6%) | 8 (2.6%) |
| 70 to 74 Years | 14 (5.0%) | 16 (5.3%) |
| 75 to 79 Years | 11 (3.9%) | 17 (5.6%) |
| 80 to 84 Years | 0 (0.0%) | 18 (5.9%) |
| 85 Years and over | 2 (0.7%) | 0 (0.0%) |
| Total | 280 (100.0%) | 304 (100.0%) |
Families and Households in Galena
Median Family Size in Galena
The median family size in Galena is 3.84 persons per family, with married-couple families (80 | 62.5%) accounting for the largest median family size of 4.06 persons per family. On the other hand, single female/mother families (35 | 27.3%) represent the smallest median family size with 3.34 persons per family.
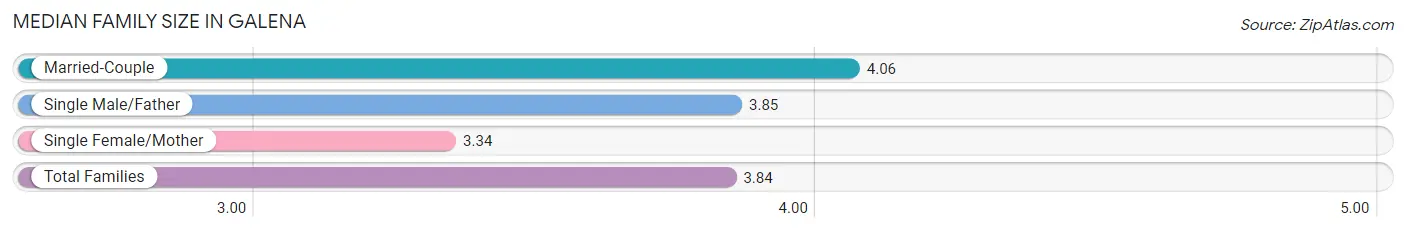
| Family Type | # Families | Family Size |
| Married-Couple | 80 (62.5%) | 4.06 |
| Single Male/Father | 13 (10.2%) | 3.85 |
| Single Female/Mother | 35 (27.3%) | 3.34 |
| Total Families | 128 (100.0%) | 3.84 |
Median Household Size in Galena
The median household size in Galena is 3.06 persons per household, with single male/father households (13 | 7.0%) accounting for the largest median household size of 5 persons per household. non-family households (58 | 31.2%) represent the smallest median household size with 1.03 persons per household.
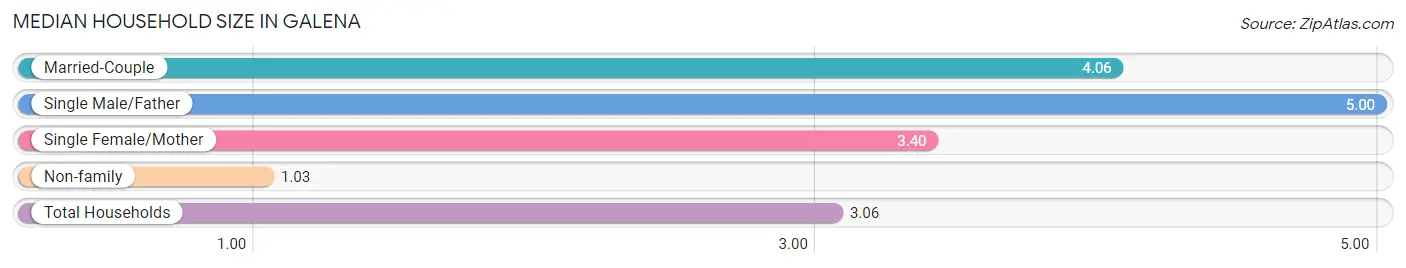
| Household Type | # Households | Household Size |
| Married-Couple | 80 (43.0%) | 4.06 |
| Single Male/Father | 13 (7.0%) | 5.00 |
| Single Female/Mother | 35 (18.8%) | 3.40 |
| Non-family | 58 (31.2%) | 1.03 |
| Total Households | 186 (100.0%) | 3.06 |
Household Size by Marriage Status in Galena
Out of a total of 186 households in Galena, 128 (68.8%) are family households, while 58 (31.2%) are nonfamily households. The most numerous type of family households are 3-person households, comprising 54, and the most common type of nonfamily households are 1-person households, comprising 56.
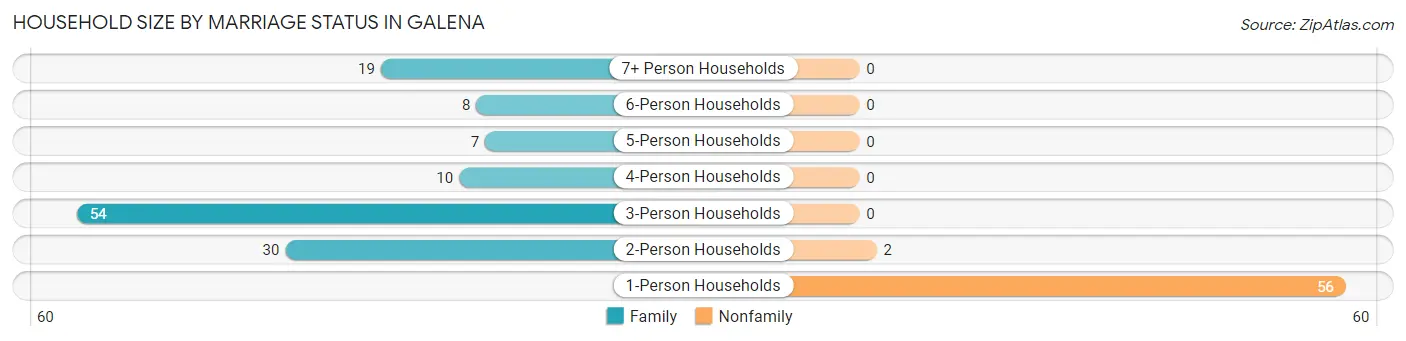
| Household Size | Family Households | Nonfamily Households |
| 1-Person Households | - | 56 (30.1%) |
| 2-Person Households | 30 (16.1%) | 2 (1.1%) |
| 3-Person Households | 54 (29.0%) | 0 (0.0%) |
| 4-Person Households | 10 (5.4%) | 0 (0.0%) |
| 5-Person Households | 7 (3.8%) | 0 (0.0%) |
| 6-Person Households | 8 (4.3%) | 0 (0.0%) |
| 7+ Person Households | 19 (10.2%) | 0 (0.0%) |
| Total | 128 (68.8%) | 58 (31.2%) |
Female Fertility in Galena
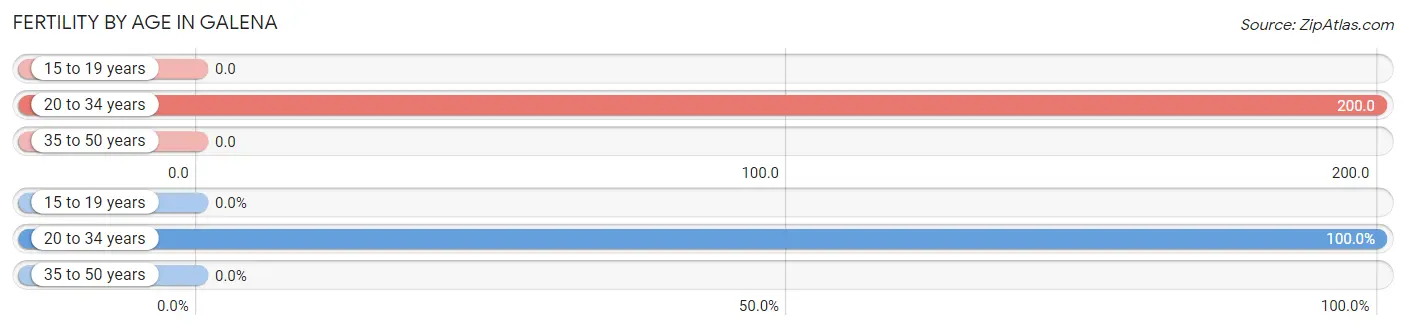
Fertility by Age in Galena
Average fertility rate in Galena is 69.0 births per 1,000 women. Women in the age bracket of 20 to 34 years have the highest fertility rate with 200.0 births per 1,000 women. Women in the age bracket of 20 to 34 years acount for 100.0% of all women with births.
| Age Bracket | Women with Births | Births / 1,000 Women |
| 15 to 19 years | 0 (0.0%) | 0.0 |
| 20 to 34 years | 8 (100.0%) | 200.0 |
| 35 to 50 years | 0 (0.0%) | 0.0 |
| Total | 8 (100.0%) | 69.0 |
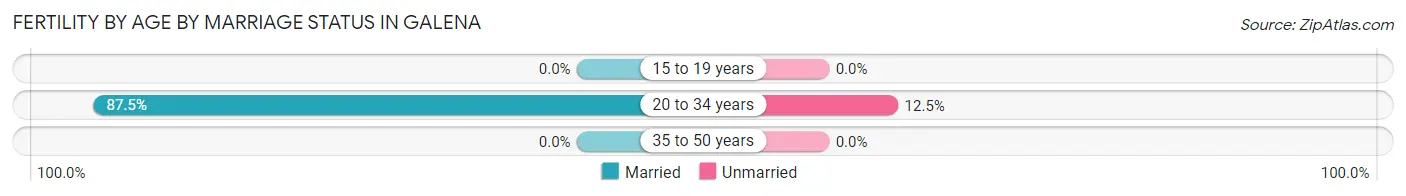
Fertility by Age by Marriage Status in Galena
87.5% of women with births (8) in Galena are married. The highest percentage of unmarried women with births falls into 20 to 34 years age bracket with 12.5% of them unmarried at the time of birth, while the lowest percentage of unmarried women with births belong to 20 to 34 years age bracket with 12.5% of them unmarried.
| Age Bracket | Married | Unmarried |
| 15 to 19 years | 0 (0.0%) | 0 (0.0%) |
| 20 to 34 years | 7 (87.5%) | 1 (12.5%) |
| 35 to 50 years | 0 (0.0%) | 0 (0.0%) |
| Total | 7 (87.5%) | 1 (12.5%) |
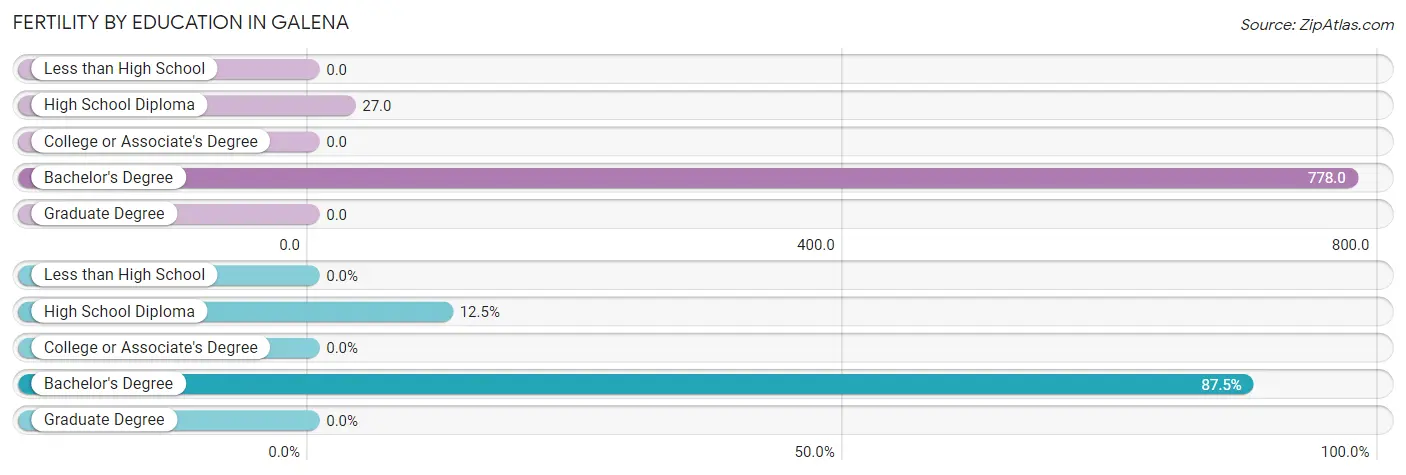
Fertility by Education in Galena
| Educational Attainment | Women with Births | Births / 1,000 Women |
| Less than High School | 0 (0.0%) | 0.0 |
| High School Diploma | 1 (12.5%) | 27.0 |
| College or Associate's Degree | 0 (0.0%) | 0.0 |
| Bachelor's Degree | 7 (87.5%) | 778.0 |
| Graduate Degree | 0 (0.0%) | 0.0 |
| Total | 8 (100.0%) | 69.0 |
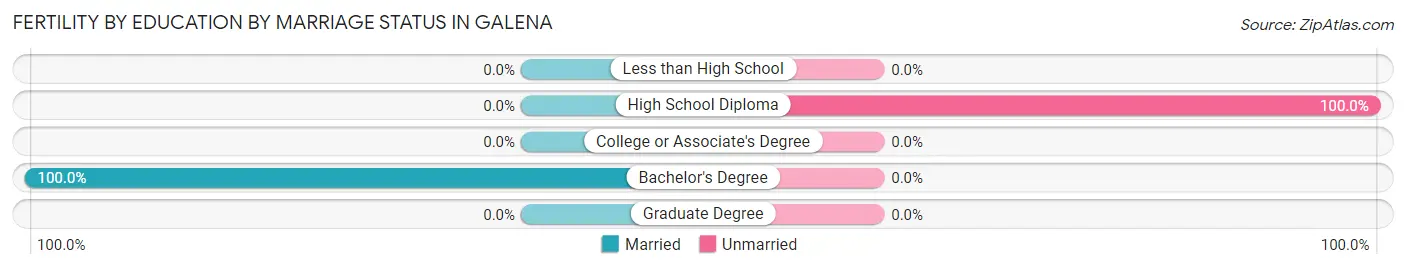
Fertility by Education by Marriage Status in Galena
12.5% of women with births in Galena are unmarried. Women with the educational attainment of bachelor's degree are most likely to be married with 100.0% of them married at childbirth, while women with the educational attainment of high school diploma are least likely to be married with 100.0% of them unmarried at childbirth.
| Educational Attainment | Married | Unmarried |
| Less than High School | 0 (0.0%) | 0 (0.0%) |
| High School Diploma | 0 (0.0%) | 1 (100.0%) |
| College or Associate's Degree | 0 (0.0%) | 0 (0.0%) |
| Bachelor's Degree | 7 (100.0%) | 0 (0.0%) |
| Graduate Degree | 0 (0.0%) | 0 (0.0%) |
| Total | 7 (87.5%) | 1 (12.5%) |
Employment Characteristics in Galena
Employment by Class of Employer in Galena
Among the 146 employed individuals in Galena, private company employees (95 | 65.1%), self-employed (not incorporated) (34 | 23.3%), and self-employed (incorporated) (7 | 4.8%) make up the most common classes of employment.
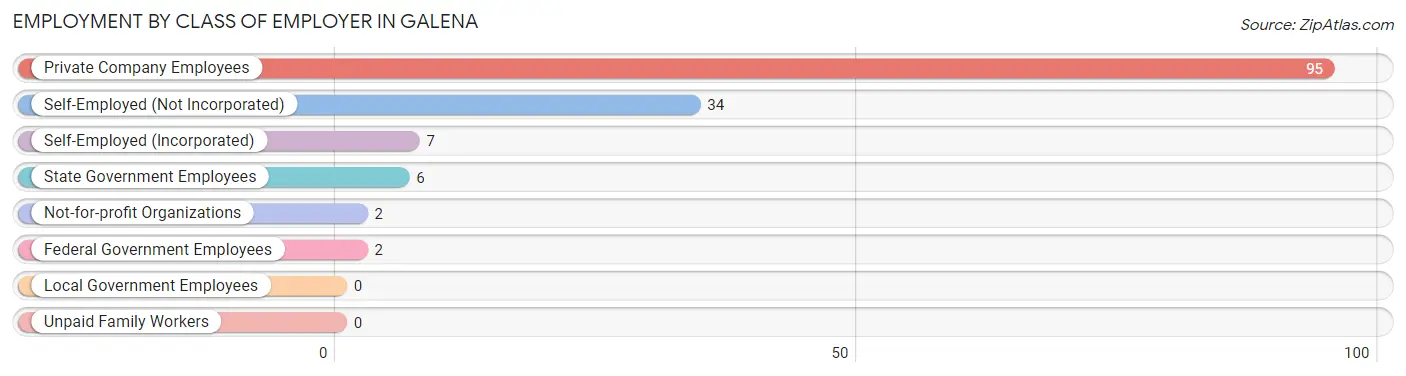
| Employer Class | # Employees | % Employees |
| Private Company Employees | 95 | 65.1% |
| Self-Employed (Incorporated) | 7 | 4.8% |
| Self-Employed (Not Incorporated) | 34 | 23.3% |
| Not-for-profit Organizations | 2 | 1.4% |
| Local Government Employees | 0 | 0.0% |
| State Government Employees | 6 | 4.1% |
| Federal Government Employees | 2 | 1.4% |
| Unpaid Family Workers | 0 | 0.0% |
| Total | 146 | 100.0% |
Employment Status by Age in Galena
According to the labor force statistics for Galena, out of the total population over 16 years of age (419), 37.2% or 156 individuals are in the labor force, with 5.1% or 8 of them unemployed. The age group with the highest labor force participation rate is 25 to 29 years, with 83.3% or 10 individuals in the labor force. Within the labor force, the 30 to 34 years age range has the highest percentage of unemployed individuals, with 17.6% or 3 of them being unemployed.
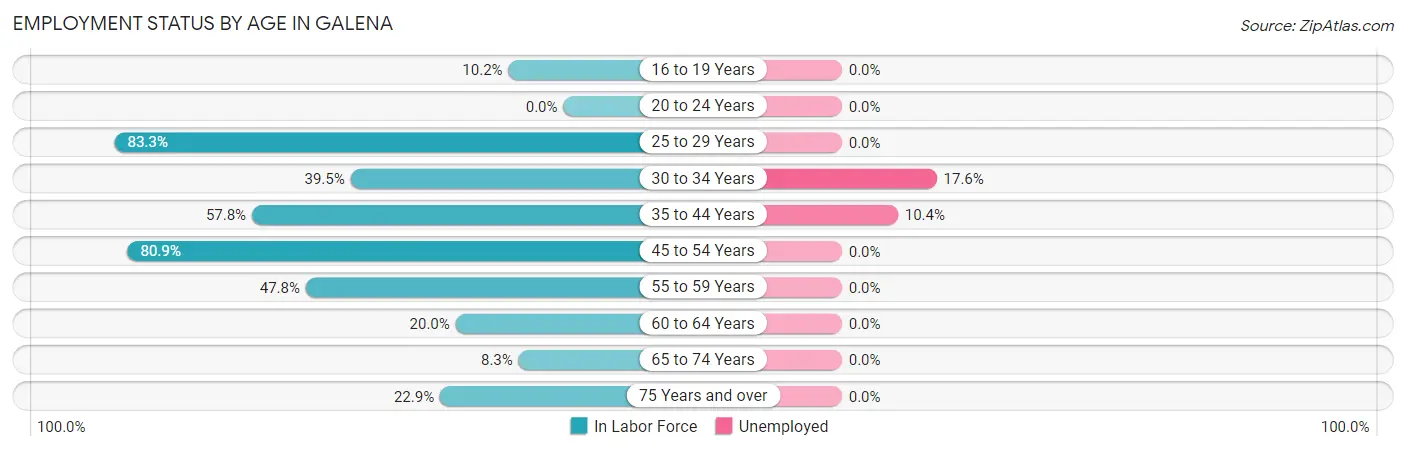
| Age Bracket | In Labor Force | Unemployed |
| 16 to 19 Years | 6 (10.2%) | 0 (0.0%) |
| 20 to 24 Years | 0 (0.0%) | 0 (0.0%) |
| 25 to 29 Years | 10 (83.3%) | 0 (0.0%) |
| 30 to 34 Years | 17 (39.5%) | 3 (17.6%) |
| 35 to 44 Years | 48 (57.8%) | 5 (10.4%) |
| 45 to 54 Years | 38 (80.9%) | 0 (0.0%) |
| 55 to 59 Years | 11 (47.8%) | 0 (0.0%) |
| 60 to 64 Years | 11 (20.0%) | 0 (0.0%) |
| 65 to 74 Years | 4 (8.3%) | 0 (0.0%) |
| 75 Years and over | 11 (22.9%) | 0 (0.0%) |
| Total | 156 (37.2%) | 8 (5.1%) |
Employment Status by Educational Attainment in Galena
According to labor force statistics for Galena, 51.3% of individuals (135) out of the total population between 25 and 64 years of age (263) are in the labor force, with 5.9% or 8 of them being unemployed. The group with the highest labor force participation rate are those with the educational attainment of high school diploma, with 62.5% or 50 individuals in the labor force. Within the labor force, individuals with less than high school education have the highest percentage of unemployment, with 26.3% or 5 of them being unemployed.
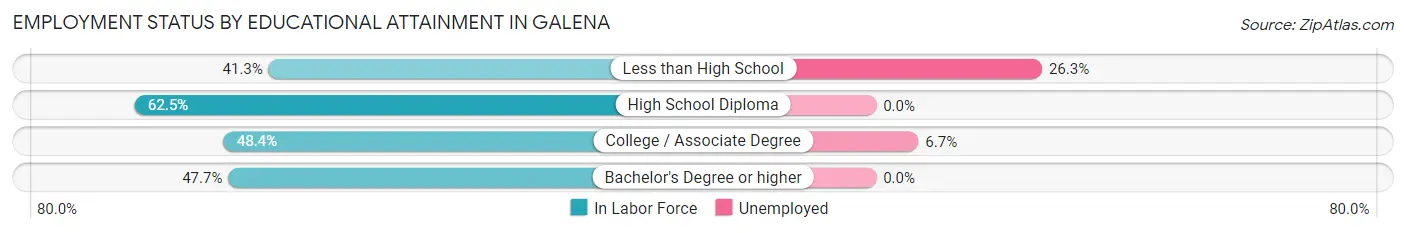
| Educational Attainment | In Labor Force | Unemployed |
| Less than High School | 19 (41.3%) | 12 (26.3%) |
| High School Diploma | 50 (62.5%) | 0 (0.0%) |
| College / Associate Degree | 45 (48.4%) | 6 (6.7%) |
| Bachelor's Degree or higher | 21 (47.7%) | 0 (0.0%) |
| Total | 135 (51.3%) | 16 (5.9%) |
Employment Occupations by Sex in Galena
Management, Business, Science and Arts Occupations
The most common Management, Business, Science and Arts occupations in Galena are Community & Social Service (6 | 4.1%), Management (5 | 3.4%), Computers, Engineering & Science (5 | 3.4%), Architecture & Engineering (5 | 3.4%), and Education Instruction & Library (4 | 2.7%).
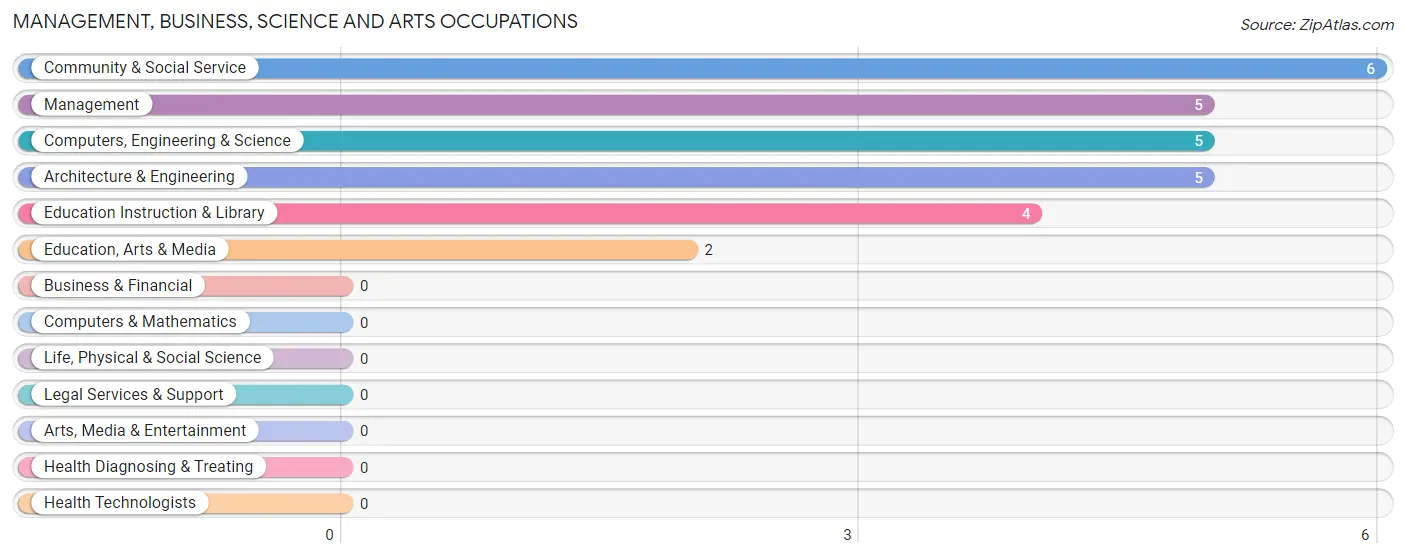
Management, Business, Science and Arts Occupations by Sex
Within the Management, Business, Science and Arts occupations in Galena, the most male-oriented occupations are Computers, Engineering & Science (100.0%), Architecture & Engineering (100.0%), and Education, Arts & Media (100.0%), while the most female-oriented occupations are Management (100.0%), Education Instruction & Library (100.0%), and Community & Social Service (66.7%).
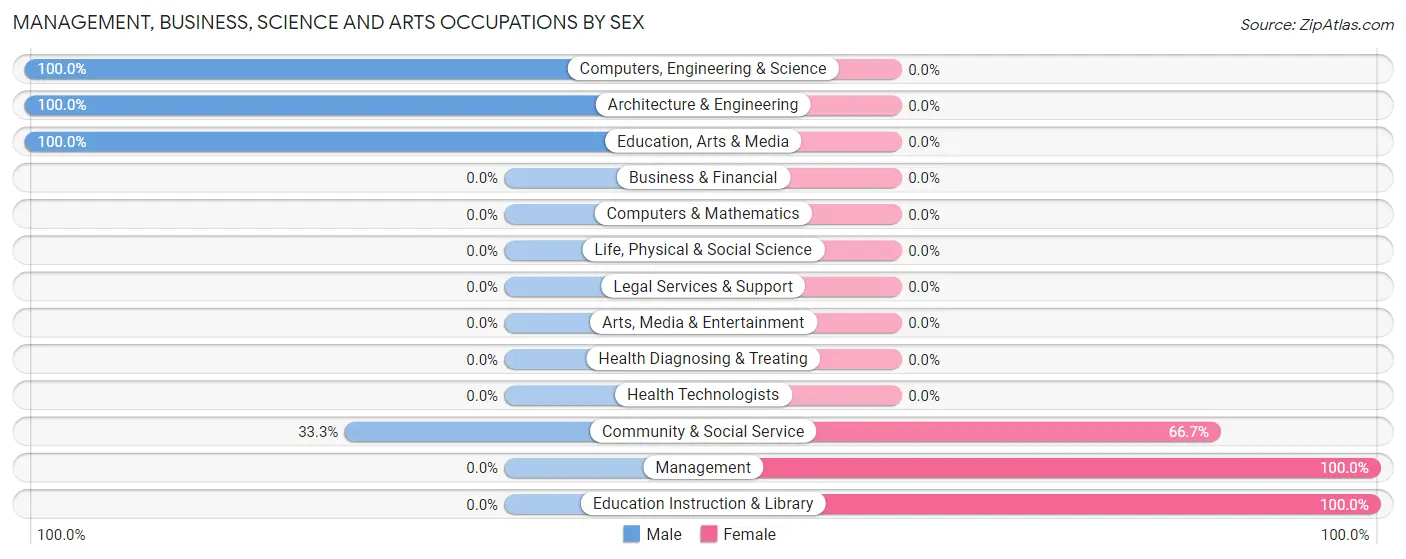
| Occupation | Male | Female |
| Management | 0 (0.0%) | 5 (100.0%) |
| Business & Financial | 0 (0.0%) | 0 (0.0%) |
| Computers, Engineering & Science | 5 (100.0%) | 0 (0.0%) |
| Computers & Mathematics | 0 (0.0%) | 0 (0.0%) |
| Architecture & Engineering | 5 (100.0%) | 0 (0.0%) |
| Life, Physical & Social Science | 0 (0.0%) | 0 (0.0%) |
| Community & Social Service | 2 (33.3%) | 4 (66.7%) |
| Education, Arts & Media | 2 (100.0%) | 0 (0.0%) |
| Legal Services & Support | 0 (0.0%) | 0 (0.0%) |
| Education Instruction & Library | 0 (0.0%) | 4 (100.0%) |
| Arts, Media & Entertainment | 0 (0.0%) | 0 (0.0%) |
| Health Diagnosing & Treating | 0 (0.0%) | 0 (0.0%) |
| Health Technologists | 0 (0.0%) | 0 (0.0%) |
| Total (Category) | 7 (43.8%) | 9 (56.2%) |
| Total (Overall) | 69 (46.6%) | 79 (53.4%) |
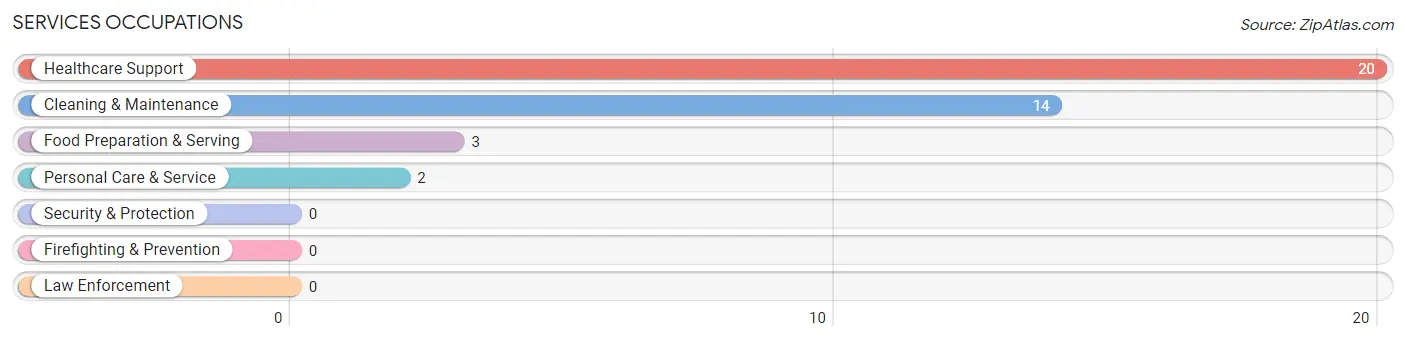
Services Occupations
The most common Services occupations in Galena are Healthcare Support (20 | 13.5%), Cleaning & Maintenance (14 | 9.5%), Food Preparation & Serving (3 | 2.0%), and Personal Care & Service (2 | 1.3%).
Services Occupations by Sex
Within the Services occupations in Galena, the most male-oriented occupations are Food Preparation & Serving (100.0%), Personal Care & Service (100.0%), and Cleaning & Maintenance (50.0%), while the most female-oriented occupations are Healthcare Support (95.0%), and Cleaning & Maintenance (50.0%).
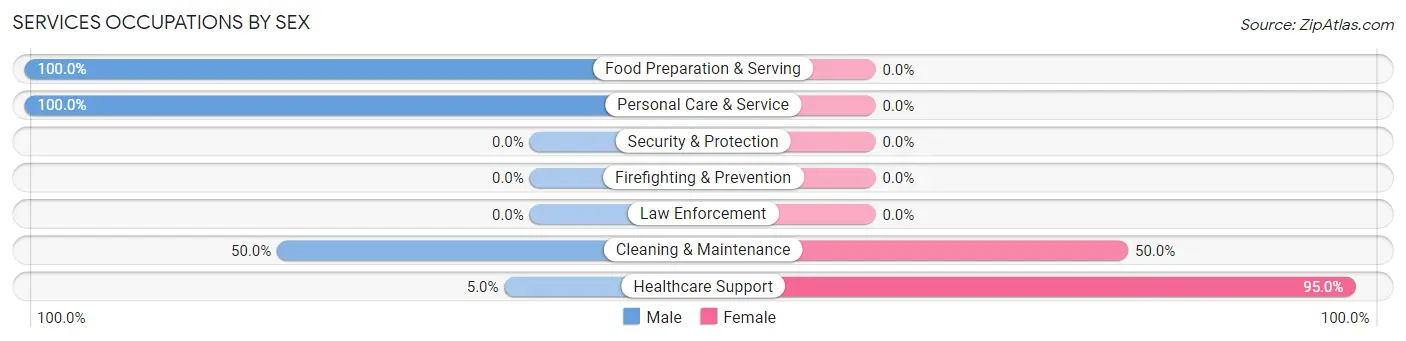
| Occupation | Male | Female |
| Healthcare Support | 1 (5.0%) | 19 (95.0%) |
| Security & Protection | 0 (0.0%) | 0 (0.0%) |
| Firefighting & Prevention | 0 (0.0%) | 0 (0.0%) |
| Law Enforcement | 0 (0.0%) | 0 (0.0%) |
| Food Preparation & Serving | 3 (100.0%) | 0 (0.0%) |
| Cleaning & Maintenance | 7 (50.0%) | 7 (50.0%) |
| Personal Care & Service | 2 (100.0%) | 0 (0.0%) |
| Total (Category) | 13 (33.3%) | 26 (66.7%) |
| Total (Overall) | 69 (46.6%) | 79 (53.4%) |
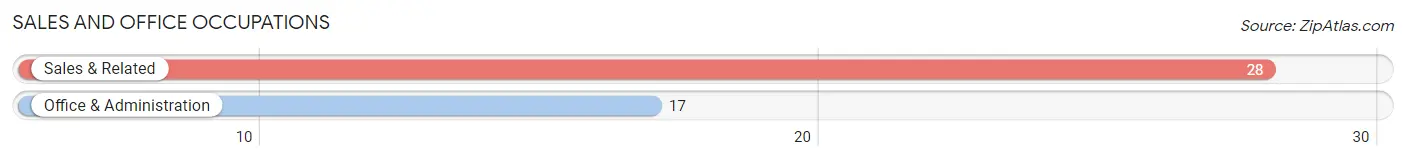
Sales and Office Occupations
The most common Sales and Office occupations in Galena are Sales & Related (28 | 18.9%), and Office & Administration (17 | 11.5%).
Sales and Office Occupations by Sex

| Occupation | Male | Female |
| Sales & Related | 7 (25.0%) | 21 (75.0%) |
| Office & Administration | 0 (0.0%) | 17 (100.0%) |
| Total (Category) | 7 (15.6%) | 38 (84.4%) |
| Total (Overall) | 69 (46.6%) | 79 (53.4%) |
Natural Resources, Construction and Maintenance Occupations
The most common Natural Resources, Construction and Maintenance occupations in Galena are Installation, Maintenance & Repair (14 | 9.5%), Construction & Extraction (13 | 8.8%), and Farming, Fishing & Forestry (2 | 1.3%).
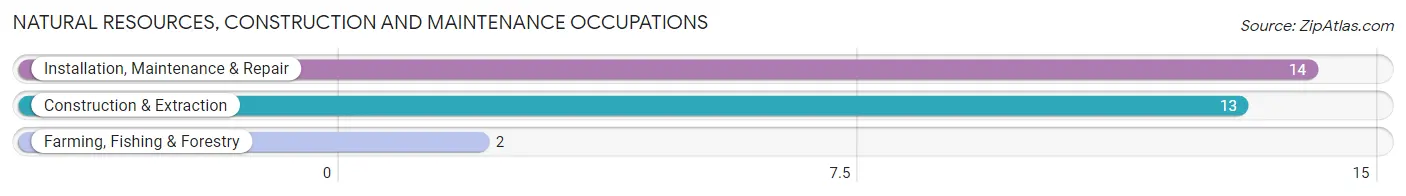
Natural Resources, Construction and Maintenance Occupations by Sex
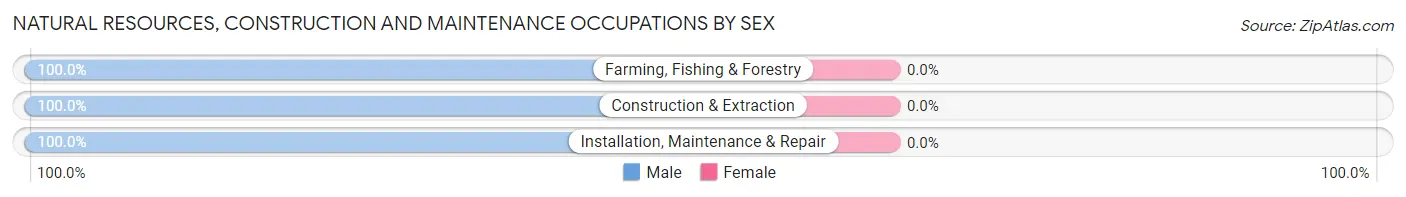
| Occupation | Male | Female |
| Farming, Fishing & Forestry | 2 (100.0%) | 0 (0.0%) |
| Construction & Extraction | 13 (100.0%) | 0 (0.0%) |
| Installation, Maintenance & Repair | 14 (100.0%) | 0 (0.0%) |
| Total (Category) | 29 (100.0%) | 0 (0.0%) |
| Total (Overall) | 69 (46.6%) | 79 (53.4%) |
Production, Transportation and Moving Occupations
The most common Production, Transportation and Moving occupations in Galena are Production (13 | 8.8%), and Material Moving (6 | 4.1%).
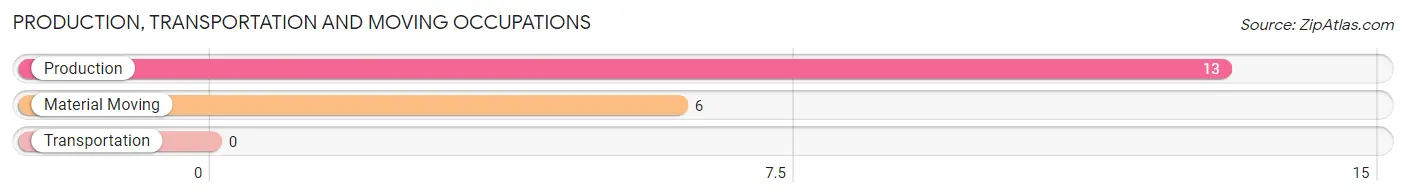
Production, Transportation and Moving Occupations by Sex
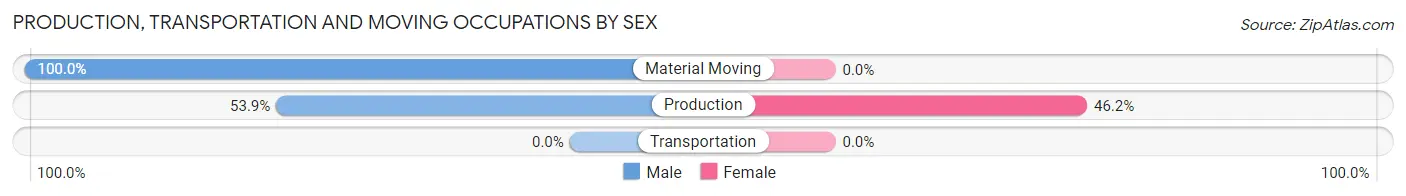
| Occupation | Male | Female |
| Production | 7 (53.8%) | 6 (46.2%) |
| Transportation | 0 (0.0%) | 0 (0.0%) |
| Material Moving | 6 (100.0%) | 0 (0.0%) |
| Total (Category) | 13 (68.4%) | 6 (31.6%) |
| Total (Overall) | 69 (46.6%) | 79 (53.4%) |
Employment Industries by Sex in Galena
Employment Industries in Galena
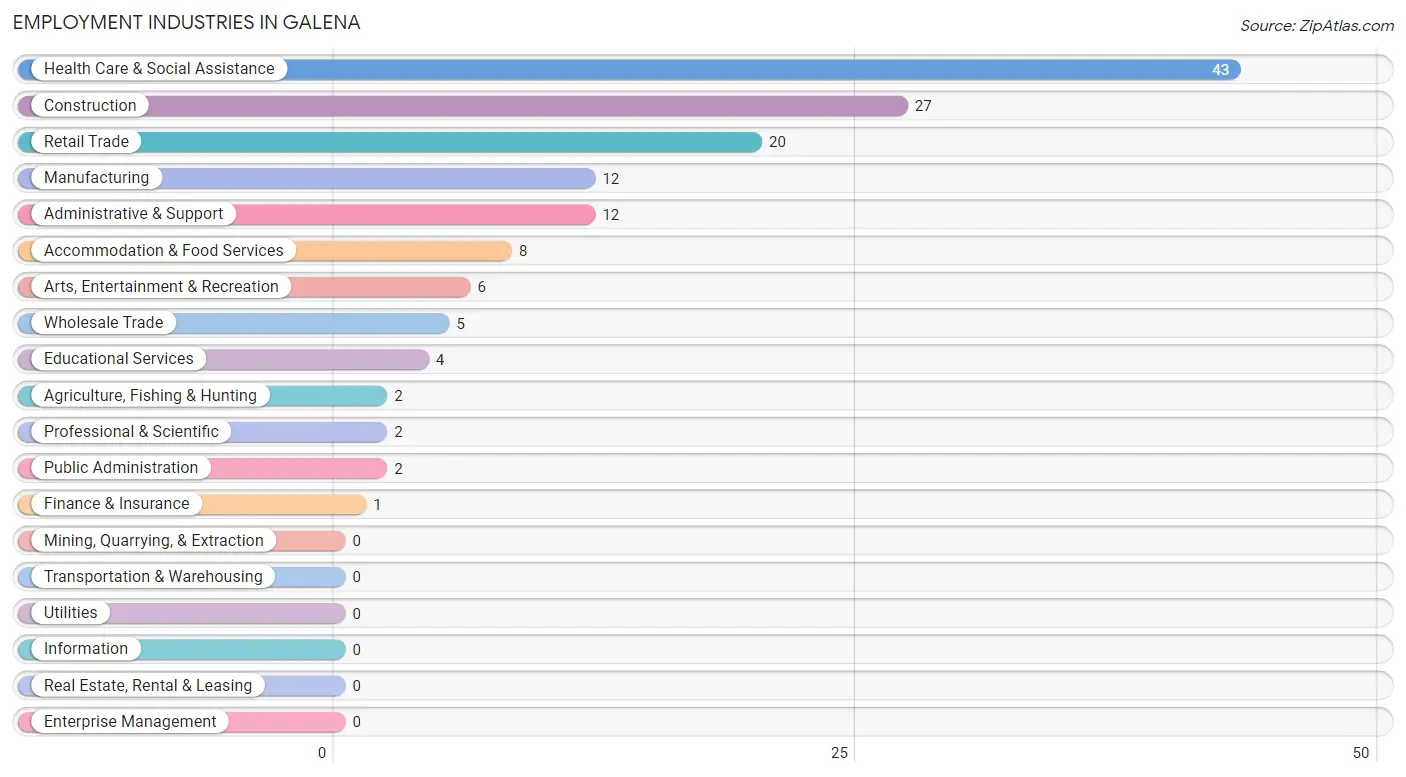
The major employment industries in Galena include Health Care & Social Assistance (43 | 29.0%), Construction (27 | 18.2%), Retail Trade (20 | 13.5%), Manufacturing (12 | 8.1%), and Administrative & Support (12 | 8.1%).
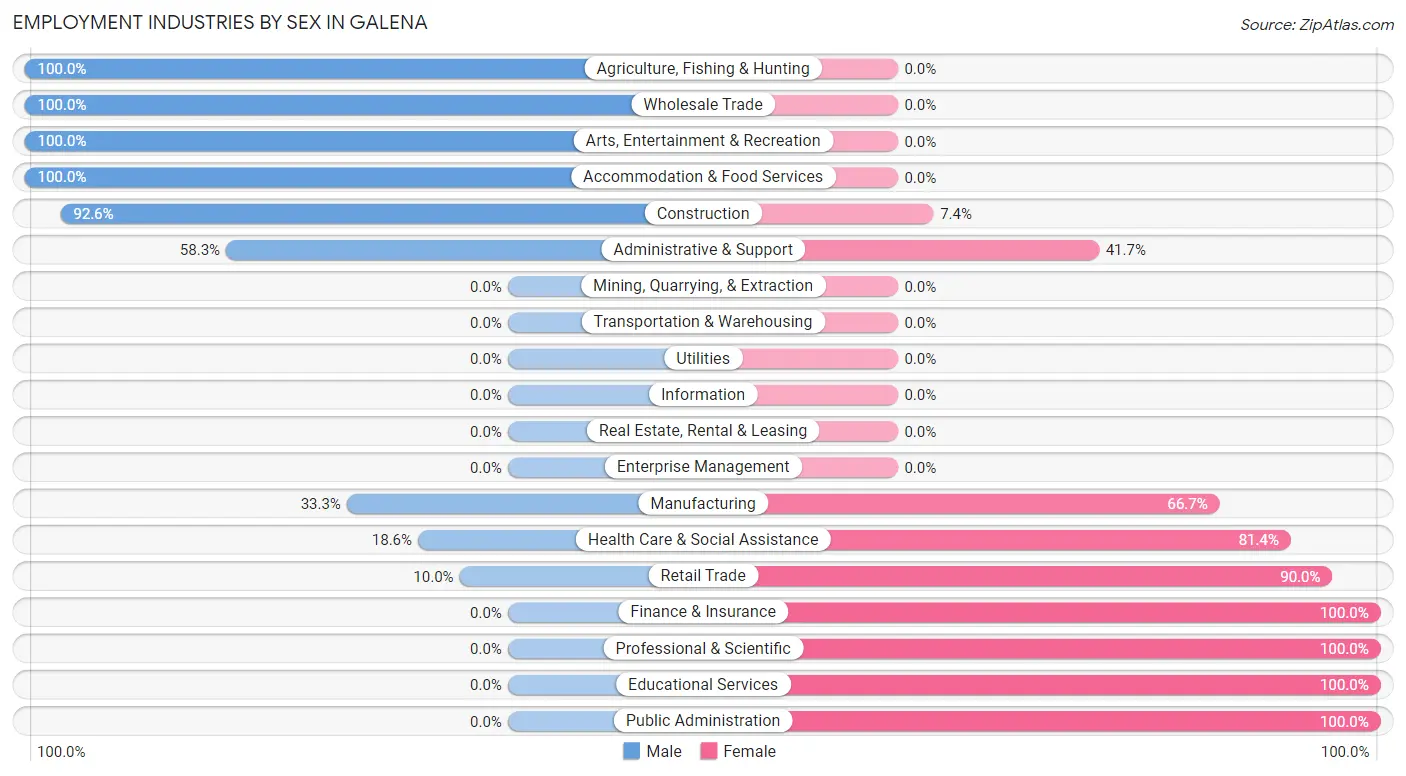
Employment Industries by Sex in Galena
The Galena industries that see more men than women are Agriculture, Fishing & Hunting (100.0%), Wholesale Trade (100.0%), and Arts, Entertainment & Recreation (100.0%), whereas the industries that tend to have a higher number of women are Finance & Insurance (100.0%), Professional & Scientific (100.0%), and Educational Services (100.0%).
| Industry | Male | Female |
| Agriculture, Fishing & Hunting | 2 (100.0%) | 0 (0.0%) |
| Mining, Quarrying, & Extraction | 0 (0.0%) | 0 (0.0%) |
| Construction | 25 (92.6%) | 2 (7.4%) |
| Manufacturing | 4 (33.3%) | 8 (66.7%) |
| Wholesale Trade | 5 (100.0%) | 0 (0.0%) |
| Retail Trade | 2 (10.0%) | 18 (90.0%) |
| Transportation & Warehousing | 0 (0.0%) | 0 (0.0%) |
| Utilities | 0 (0.0%) | 0 (0.0%) |
| Information | 0 (0.0%) | 0 (0.0%) |
| Finance & Insurance | 0 (0.0%) | 1 (100.0%) |
| Real Estate, Rental & Leasing | 0 (0.0%) | 0 (0.0%) |
| Professional & Scientific | 0 (0.0%) | 2 (100.0%) |
| Enterprise Management | 0 (0.0%) | 0 (0.0%) |
| Administrative & Support | 7 (58.3%) | 5 (41.7%) |
| Educational Services | 0 (0.0%) | 4 (100.0%) |
| Health Care & Social Assistance | 8 (18.6%) | 35 (81.4%) |
| Arts, Entertainment & Recreation | 6 (100.0%) | 0 (0.0%) |
| Accommodation & Food Services | 8 (100.0%) | 0 (0.0%) |
| Public Administration | 0 (0.0%) | 2 (100.0%) |
| Total | 69 (46.6%) | 79 (53.4%) |
Education in Galena
School Enrollment in Galena
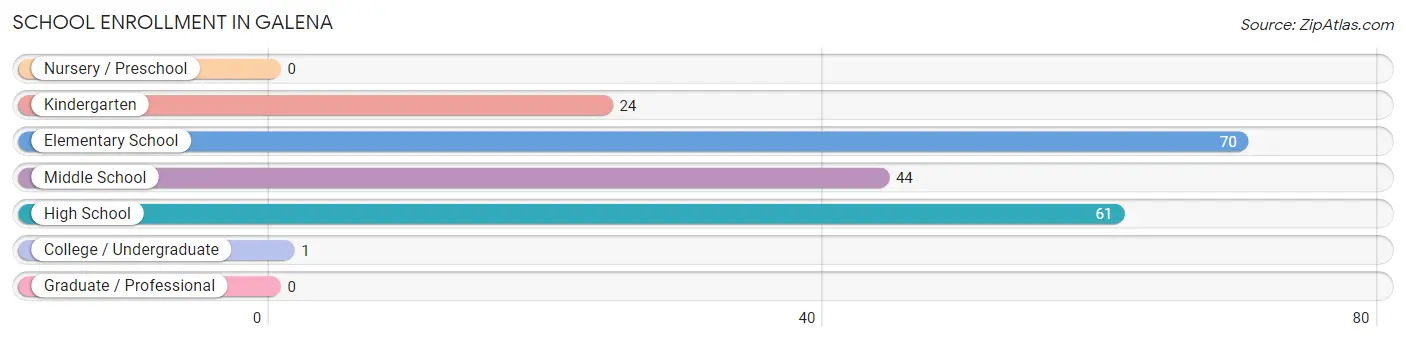
The most common levels of schooling among the 200 students in Galena are elementary school (70 | 35.0%), high school (61 | 30.5%), and middle school (44 | 22.0%).
| School Level | # Students | % Students |
| Nursery / Preschool | 0 | 0.0% |
| Kindergarten | 24 | 12.0% |
| Elementary School | 70 | 35.0% |
| Middle School | 44 | 22.0% |
| High School | 61 | 30.5% |
| College / Undergraduate | 1 | 0.5% |
| Graduate / Professional | 0 | 0.0% |
| Total | 200 | 100.0% |
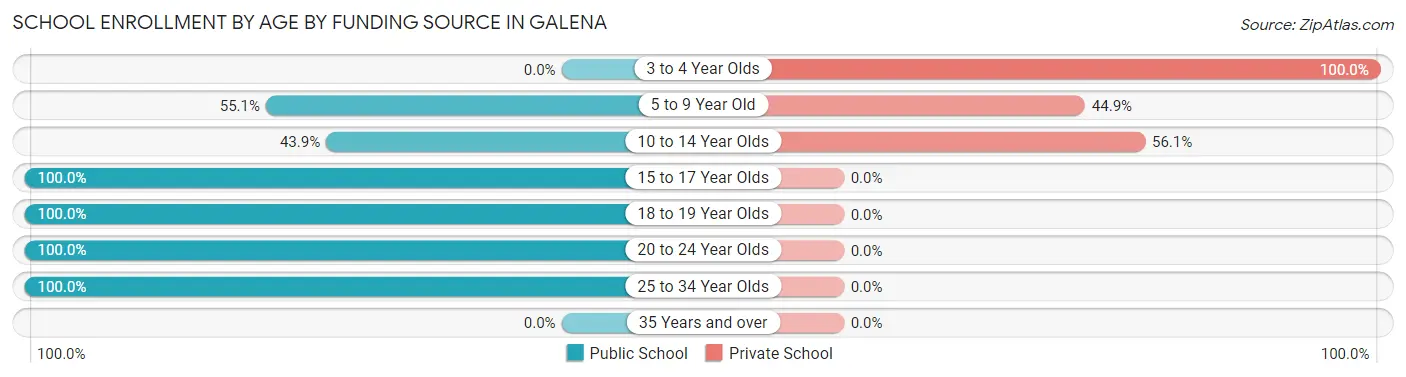
School Enrollment by Age by Funding Source in Galena
Out of a total of 200 students who are enrolled in schools in Galena, 80 (40.0%) attend a private institution, while the remaining 120 (60.0%) are enrolled in public schools. The age group of 3 to 4 year olds has the highest likelihood of being enrolled in private schools, with 17 (100.0% in the age bracket) enrolled. Conversely, the age group of 15 to 17 year olds has the lowest likelihood of being enrolled in a private school, with 43 (100.0% in the age bracket) attending a public institution.
| Age Bracket | Public School | Private School |
| 3 to 4 Year Olds | 0 (0.0%) | 17 (100.0%) |
| 5 to 9 Year Old | 38 (55.1%) | 31 (44.9%) |
| 10 to 14 Year Olds | 25 (43.9%) | 32 (56.1%) |
| 15 to 17 Year Olds | 43 (100.0%) | 0 (0.0%) |
| 18 to 19 Year Olds | 10 (100.0%) | 0 (0.0%) |
| 20 to 24 Year Olds | 1 (100.0%) | 0 (0.0%) |
| 25 to 34 Year Olds | 3 (100.0%) | 0 (0.0%) |
| 35 Years and over | 0 (0.0%) | 0 (0.0%) |
| Total | 120 (60.0%) | 80 (40.0%) |
Educational Attainment by Field of Study in Galena
Psychology (19 | 35.2%), physical & health sciences (12 | 22.2%), bio, nature & agricultural (9 | 16.7%), social sciences (7 | 13.0%), and liberal arts & history (5 | 9.3%) are the most common fields of study among 54 individuals in Galena who have obtained a bachelor's degree or higher.
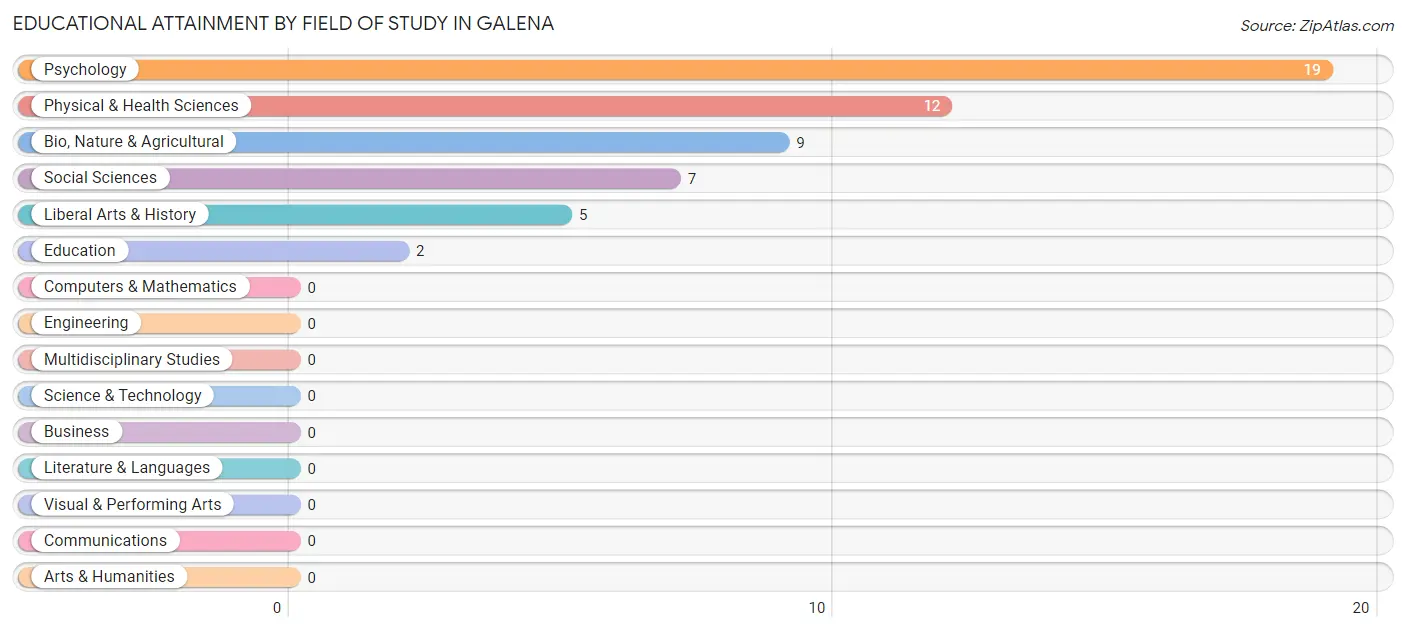
| Field of Study | # Graduates | % Graduates |
| Computers & Mathematics | 0 | 0.0% |
| Bio, Nature & Agricultural | 9 | 16.7% |
| Physical & Health Sciences | 12 | 22.2% |
| Psychology | 19 | 35.2% |
| Social Sciences | 7 | 13.0% |
| Engineering | 0 | 0.0% |
| Multidisciplinary Studies | 0 | 0.0% |
| Science & Technology | 0 | 0.0% |
| Business | 0 | 0.0% |
| Education | 2 | 3.7% |
| Literature & Languages | 0 | 0.0% |
| Liberal Arts & History | 5 | 9.3% |
| Visual & Performing Arts | 0 | 0.0% |
| Communications | 0 | 0.0% |
| Arts & Humanities | 0 | 0.0% |
| Total | 54 | 100.0% |
Transportation & Commute in Galena
Vehicle Availability by Sex in Galena
The most prevalent vehicle ownership categories in Galena are males with 2 vehicles (29, accounting for 43.3%) and females with 2 vehicles (36, making up 36.7%).
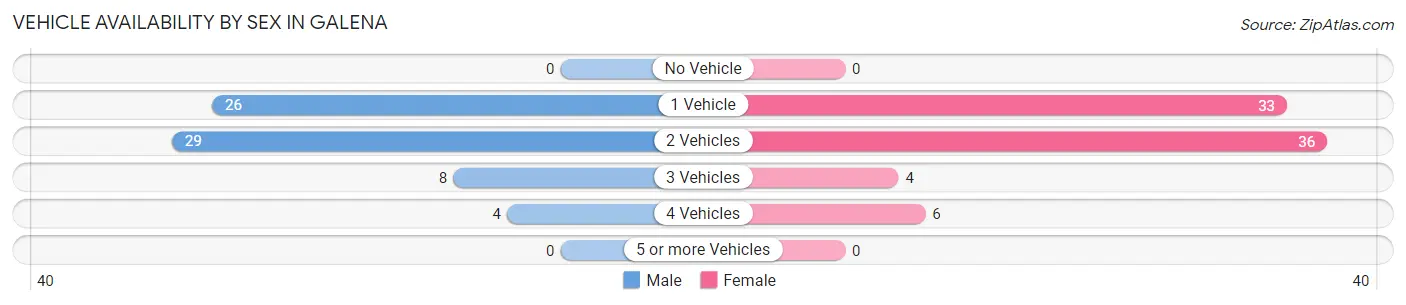
| Vehicles Available | Male | Female |
| No Vehicle | 0 (0.0%) | 0 (0.0%) |
| 1 Vehicle | 26 (38.8%) | 33 (41.8%) |
| 2 Vehicles | 29 (43.3%) | 36 (45.6%) |
| 3 Vehicles | 8 (11.9%) | 4 (5.1%) |
| 4 Vehicles | 4 (6.0%) | 6 (7.6%) |
| 5 or more Vehicles | 0 (0.0%) | 0 (0.0%) |
| Total | 67 (100.0%) | 79 (100.0%) |
Commute Time in Galena
The most frequently occuring commute durations in Galena are 45 to 59 minutes (33 commuters, 24.1%), less than 5 minutes (31 commuters, 22.6%), and 15 to 19 minutes (17 commuters, 12.4%).
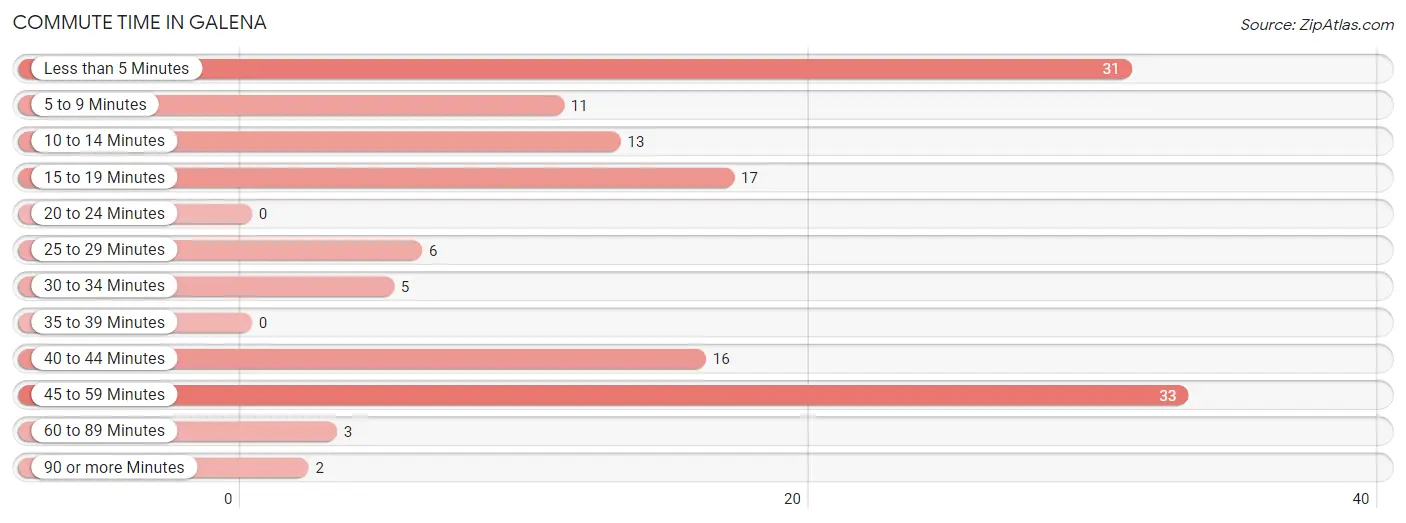
| Commute Time | # Commuters | % Commuters |
| Less than 5 Minutes | 31 | 22.6% |
| 5 to 9 Minutes | 11 | 8.0% |
| 10 to 14 Minutes | 13 | 9.5% |
| 15 to 19 Minutes | 17 | 12.4% |
| 20 to 24 Minutes | 0 | 0.0% |
| 25 to 29 Minutes | 6 | 4.4% |
| 30 to 34 Minutes | 5 | 3.6% |
| 35 to 39 Minutes | 0 | 0.0% |
| 40 to 44 Minutes | 16 | 11.7% |
| 45 to 59 Minutes | 33 | 24.1% |
| 60 to 89 Minutes | 3 | 2.2% |
| 90 or more Minutes | 2 | 1.5% |
Commute Time by Sex in Galena
The most common commute times in Galena are 40 to 44 minutes (16 commuters, 24.6%) for males and less than 5 minutes (22 commuters, 30.6%) for females.
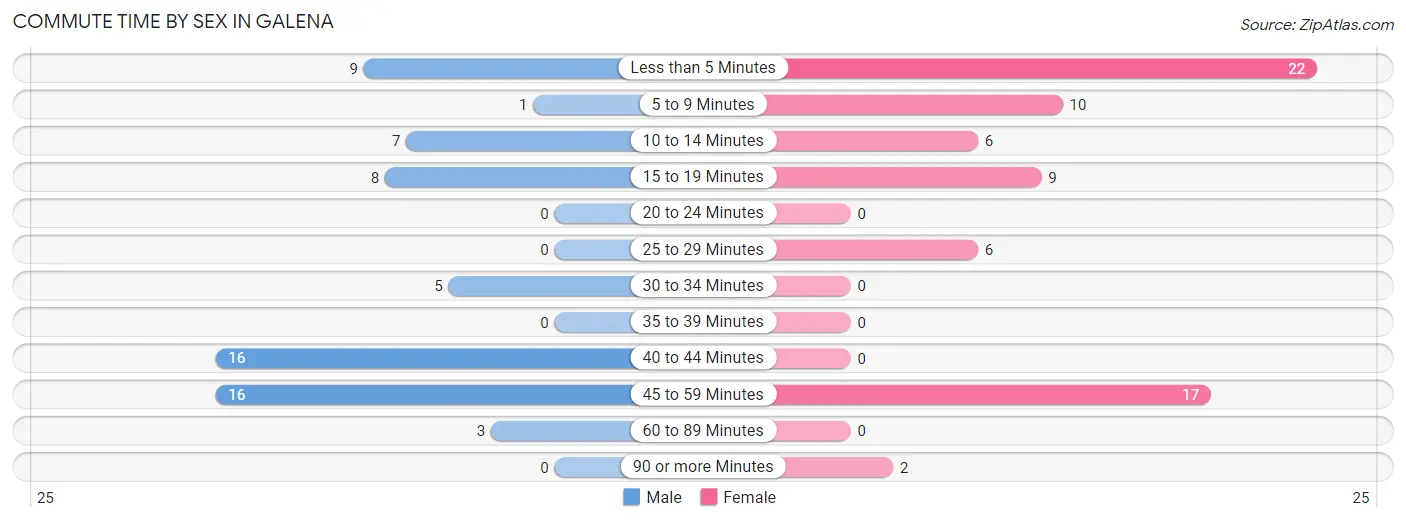
| Commute Time | Male | Female |
| Less than 5 Minutes | 9 (13.9%) | 22 (30.6%) |
| 5 to 9 Minutes | 1 (1.5%) | 10 (13.9%) |
| 10 to 14 Minutes | 7 (10.8%) | 6 (8.3%) |
| 15 to 19 Minutes | 8 (12.3%) | 9 (12.5%) |
| 20 to 24 Minutes | 0 (0.0%) | 0 (0.0%) |
| 25 to 29 Minutes | 0 (0.0%) | 6 (8.3%) |
| 30 to 34 Minutes | 5 (7.7%) | 0 (0.0%) |
| 35 to 39 Minutes | 0 (0.0%) | 0 (0.0%) |
| 40 to 44 Minutes | 16 (24.6%) | 0 (0.0%) |
| 45 to 59 Minutes | 16 (24.6%) | 17 (23.6%) |
| 60 to 89 Minutes | 3 (4.6%) | 0 (0.0%) |
| 90 or more Minutes | 0 (0.0%) | 2 (2.8%) |
Time of Departure to Work by Sex in Galena
The most frequent times of departure to work in Galena are 8:30 AM to 8:59 AM (26, 40.0%) for males and 5:00 AM to 5:29 AM (23, 31.9%) for females.
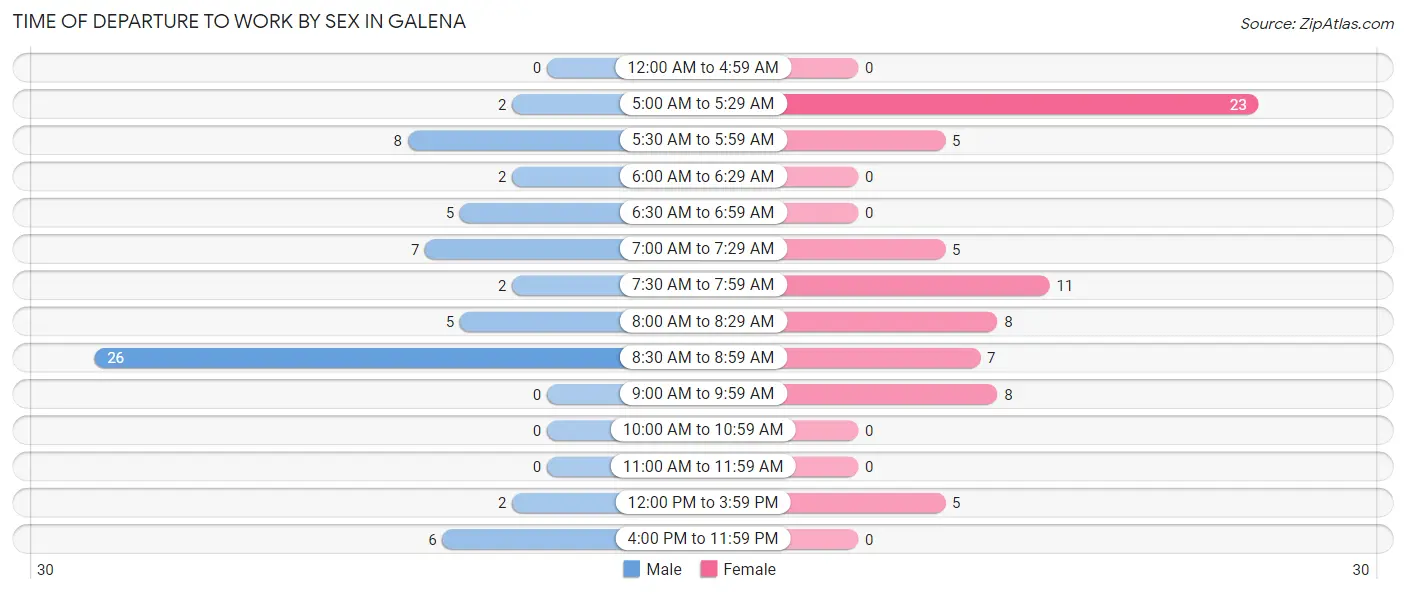
| Time of Departure | Male | Female |
| 12:00 AM to 4:59 AM | 0 (0.0%) | 0 (0.0%) |
| 5:00 AM to 5:29 AM | 2 (3.1%) | 23 (31.9%) |
| 5:30 AM to 5:59 AM | 8 (12.3%) | 5 (6.9%) |
| 6:00 AM to 6:29 AM | 2 (3.1%) | 0 (0.0%) |
| 6:30 AM to 6:59 AM | 5 (7.7%) | 0 (0.0%) |
| 7:00 AM to 7:29 AM | 7 (10.8%) | 5 (6.9%) |
| 7:30 AM to 7:59 AM | 2 (3.1%) | 11 (15.3%) |
| 8:00 AM to 8:29 AM | 5 (7.7%) | 8 (11.1%) |
| 8:30 AM to 8:59 AM | 26 (40.0%) | 7 (9.7%) |
| 9:00 AM to 9:59 AM | 0 (0.0%) | 8 (11.1%) |
| 10:00 AM to 10:59 AM | 0 (0.0%) | 0 (0.0%) |
| 11:00 AM to 11:59 AM | 0 (0.0%) | 0 (0.0%) |
| 12:00 PM to 3:59 PM | 2 (3.1%) | 5 (6.9%) |
| 4:00 PM to 11:59 PM | 6 (9.2%) | 0 (0.0%) |
| Total | 65 (100.0%) | 72 (100.0%) |
Housing Occupancy in Galena
Occupancy by Ownership in Galena
Of the total 186 dwellings in Galena, owner-occupied units account for 130 (69.9%), while renter-occupied units make up 56 (30.1%).
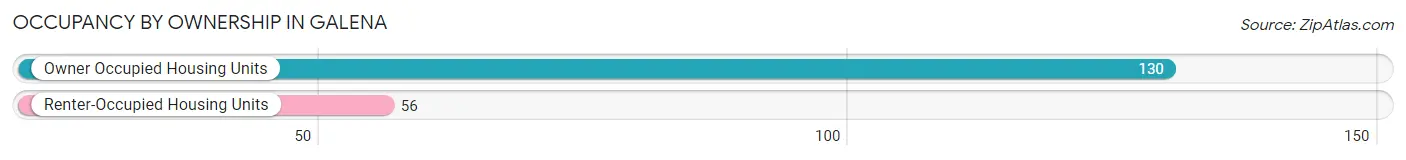
| Occupancy | # Housing Units | % Housing Units |
| Owner Occupied Housing Units | 130 | 69.9% |
| Renter-Occupied Housing Units | 56 | 30.1% |
| Total Occupied Housing Units | 186 | 100.0% |
Occupancy by Household Size in Galena
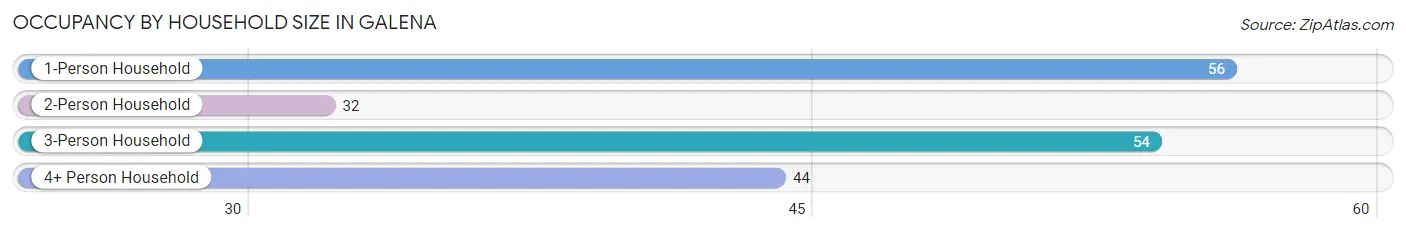
| Household Size | # Housing Units | % Housing Units |
| 1-Person Household | 56 | 30.1% |
| 2-Person Household | 32 | 17.2% |
| 3-Person Household | 54 | 29.0% |
| 4+ Person Household | 44 | 23.7% |
| Total Housing Units | 186 | 100.0% |
Occupancy by Ownership by Household Size in Galena
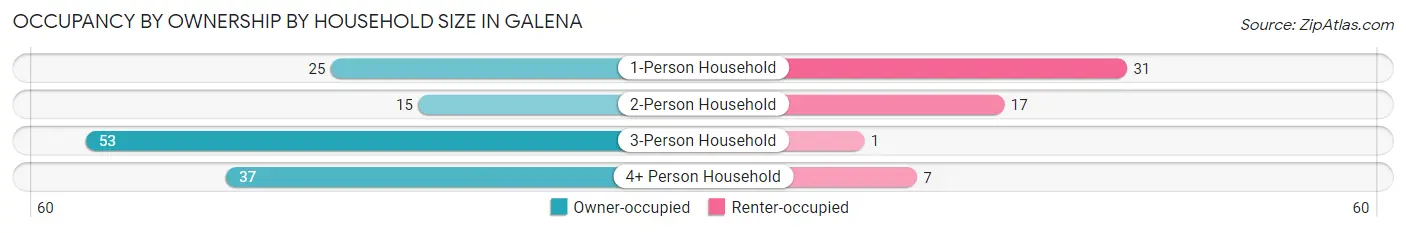
| Household Size | Owner-occupied | Renter-occupied |
| 1-Person Household | 25 (44.6%) | 31 (55.4%) |
| 2-Person Household | 15 (46.9%) | 17 (53.1%) |
| 3-Person Household | 53 (98.2%) | 1 (1.8%) |
| 4+ Person Household | 37 (84.1%) | 7 (15.9%) |
| Total Housing Units | 130 (69.9%) | 56 (30.1%) |
Occupancy by Educational Attainment in Galena
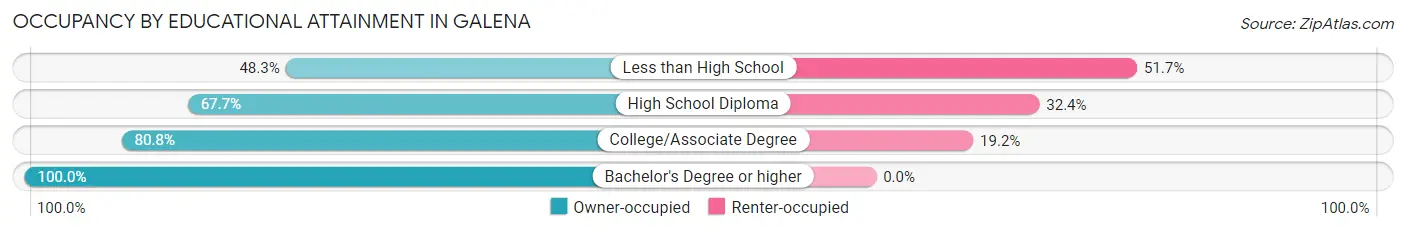
| Household Size | Owner-occupied | Renter-occupied |
| Less than High School | 28 (48.3%) | 30 (51.7%) |
| High School Diploma | 23 (67.6%) | 11 (32.4%) |
| College/Associate Degree | 63 (80.8%) | 15 (19.2%) |
| Bachelor's Degree or higher | 16 (100.0%) | 0 (0.0%) |
Occupancy by Age of Householder in Galena
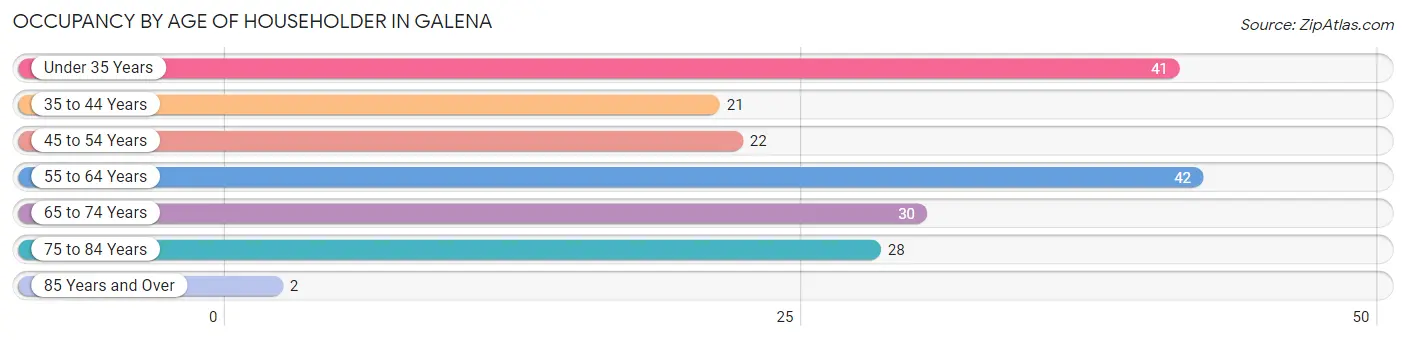
| Age Bracket | # Households | % Households |
| Under 35 Years | 41 | 22.0% |
| 35 to 44 Years | 21 | 11.3% |
| 45 to 54 Years | 22 | 11.8% |
| 55 to 64 Years | 42 | 22.6% |
| 65 to 74 Years | 30 | 16.1% |
| 75 to 84 Years | 28 | 15.0% |
| 85 Years and Over | 2 | 1.1% |
| Total | 186 | 100.0% |
Housing Finances in Galena
Median Income by Occupancy in Galena
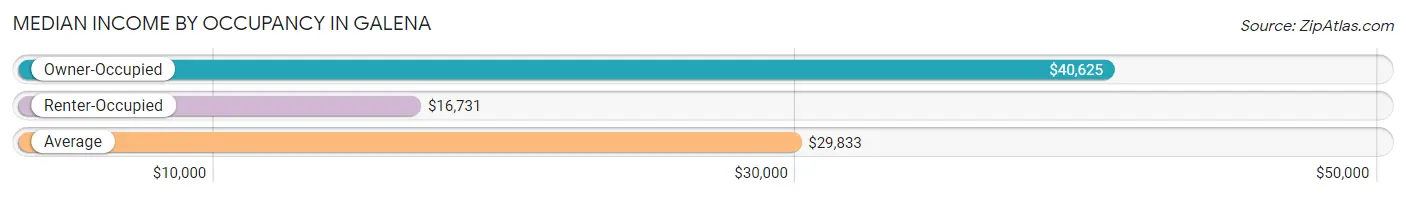
| Occupancy Type | # Households | Median Income |
| Owner-Occupied | 130 (69.9%) | $40,625 |
| Renter-Occupied | 56 (30.1%) | $16,731 |
| Average | 186 (100.0%) | $29,833 |
Occupancy by Householder Income Bracket in Galena
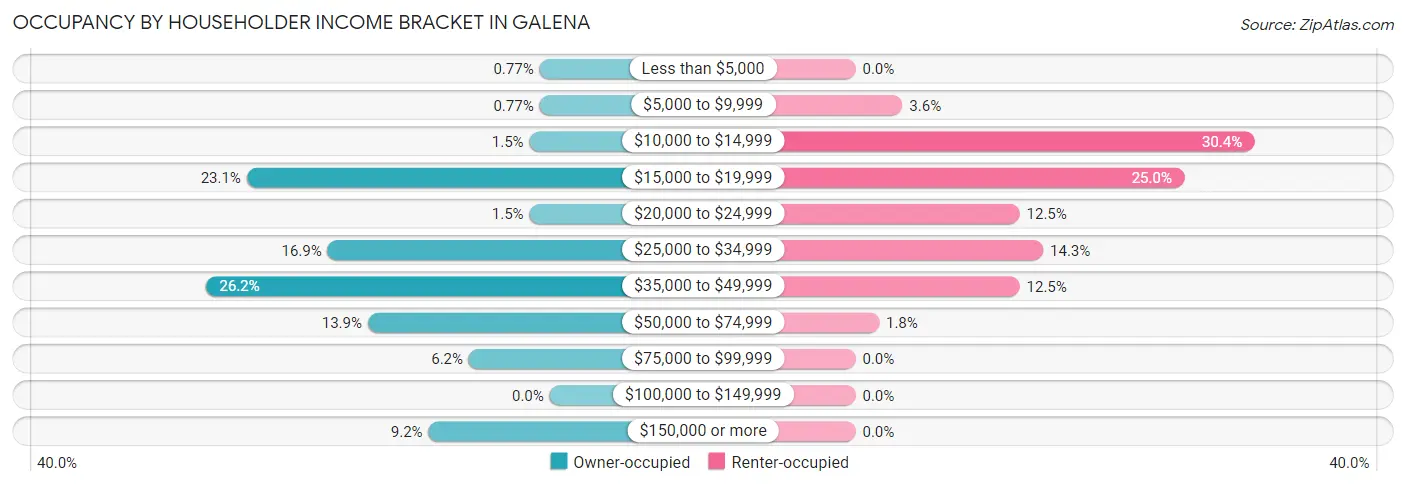
| Income Bracket | Owner-occupied | Renter-occupied |
| Less than $5,000 | 1 (0.8%) | 0 (0.0%) |
| $5,000 to $9,999 | 1 (0.8%) | 2 (3.6%) |
| $10,000 to $14,999 | 2 (1.5%) | 17 (30.4%) |
| $15,000 to $19,999 | 30 (23.1%) | 14 (25.0%) |
| $20,000 to $24,999 | 2 (1.5%) | 7 (12.5%) |
| $25,000 to $34,999 | 22 (16.9%) | 8 (14.3%) |
| $35,000 to $49,999 | 34 (26.2%) | 7 (12.5%) |
| $50,000 to $74,999 | 18 (13.9%) | 1 (1.8%) |
| $75,000 to $99,999 | 8 (6.1%) | 0 (0.0%) |
| $100,000 to $149,999 | 0 (0.0%) | 0 (0.0%) |
| $150,000 or more | 12 (9.2%) | 0 (0.0%) |
| Total | 130 (100.0%) | 56 (100.0%) |
Monthly Housing Cost Tiers in Galena
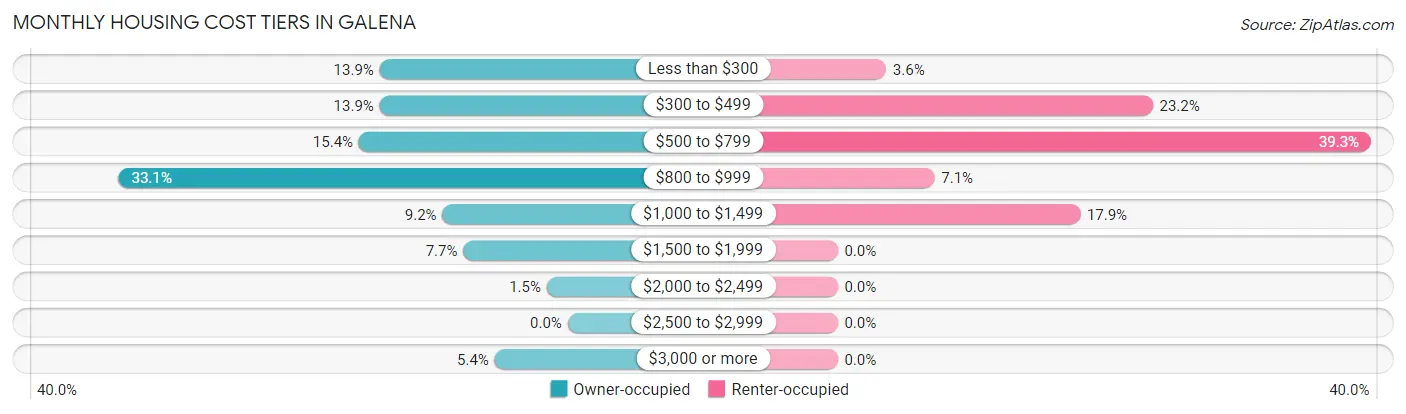
| Monthly Cost | Owner-occupied | Renter-occupied |
| Less than $300 | 18 (13.9%) | 2 (3.6%) |
| $300 to $499 | 18 (13.9%) | 13 (23.2%) |
| $500 to $799 | 20 (15.4%) | 22 (39.3%) |
| $800 to $999 | 43 (33.1%) | 4 (7.1%) |
| $1,000 to $1,499 | 12 (9.2%) | 10 (17.9%) |
| $1,500 to $1,999 | 10 (7.7%) | 0 (0.0%) |
| $2,000 to $2,499 | 2 (1.5%) | 0 (0.0%) |
| $2,500 to $2,999 | 0 (0.0%) | 0 (0.0%) |
| $3,000 or more | 7 (5.4%) | 0 (0.0%) |
| Total | 130 (100.0%) | 56 (100.0%) |
Physical Housing Characteristics in Galena
Housing Structures in Galena
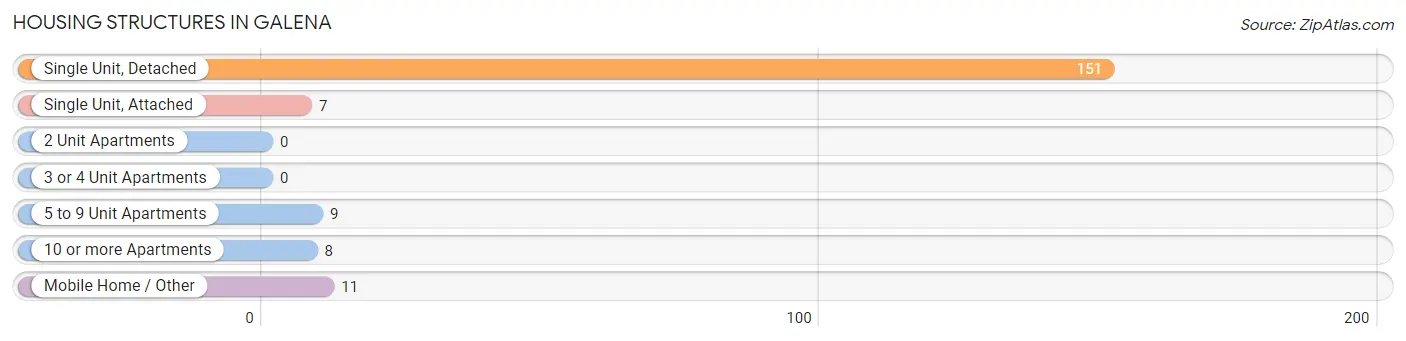
| Structure Type | # Housing Units | % Housing Units |
| Single Unit, Detached | 151 | 81.2% |
| Single Unit, Attached | 7 | 3.8% |
| 2 Unit Apartments | 0 | 0.0% |
| 3 or 4 Unit Apartments | 0 | 0.0% |
| 5 to 9 Unit Apartments | 9 | 4.8% |
| 10 or more Apartments | 8 | 4.3% |
| Mobile Home / Other | 11 | 5.9% |
| Total | 186 | 100.0% |
Housing Structures by Occupancy in Galena
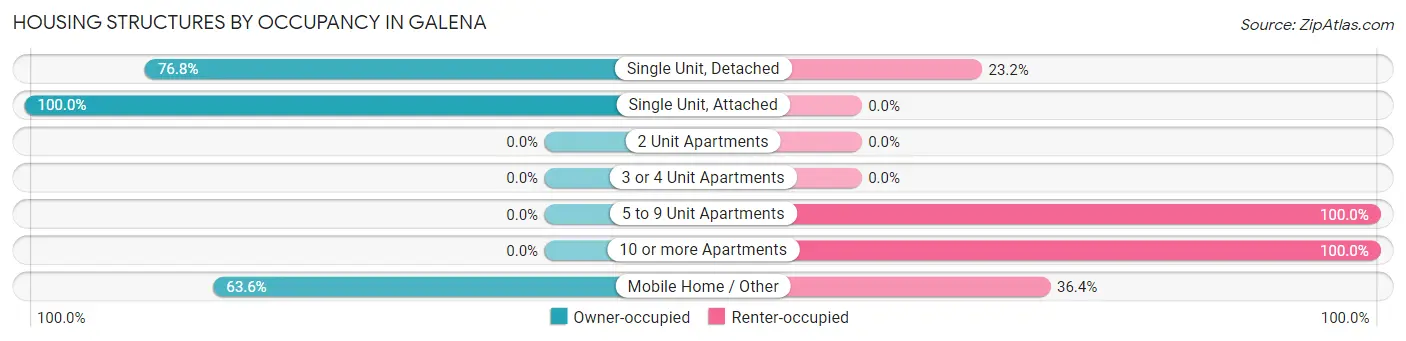
| Structure Type | Owner-occupied | Renter-occupied |
| Single Unit, Detached | 116 (76.8%) | 35 (23.2%) |
| Single Unit, Attached | 7 (100.0%) | 0 (0.0%) |
| 2 Unit Apartments | 0 (0.0%) | 0 (0.0%) |
| 3 or 4 Unit Apartments | 0 (0.0%) | 0 (0.0%) |
| 5 to 9 Unit Apartments | 0 (0.0%) | 9 (100.0%) |
| 10 or more Apartments | 0 (0.0%) | 8 (100.0%) |
| Mobile Home / Other | 7 (63.6%) | 4 (36.4%) |
| Total | 130 (69.9%) | 56 (30.1%) |
Housing Structures by Number of Rooms in Galena
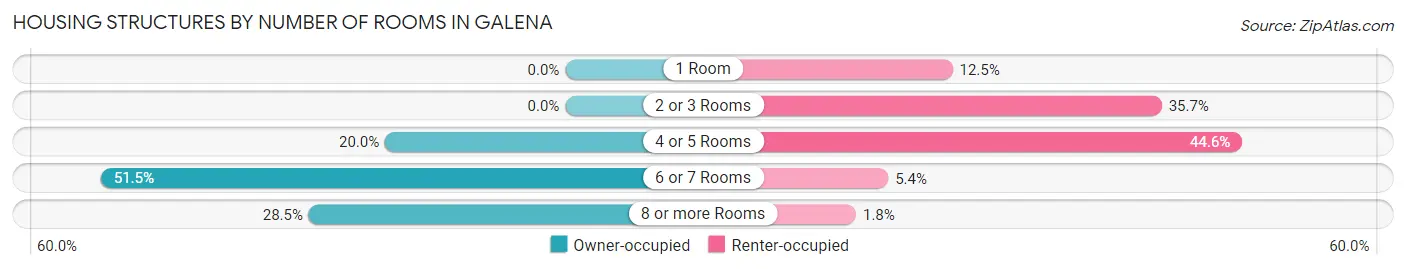
| Number of Rooms | Owner-occupied | Renter-occupied |
| 1 Room | 0 (0.0%) | 7 (12.5%) |
| 2 or 3 Rooms | 0 (0.0%) | 20 (35.7%) |
| 4 or 5 Rooms | 26 (20.0%) | 25 (44.6%) |
| 6 or 7 Rooms | 67 (51.5%) | 3 (5.4%) |
| 8 or more Rooms | 37 (28.5%) | 1 (1.8%) |
| Total | 130 (100.0%) | 56 (100.0%) |
Housing Structure by Heating Type in Galena
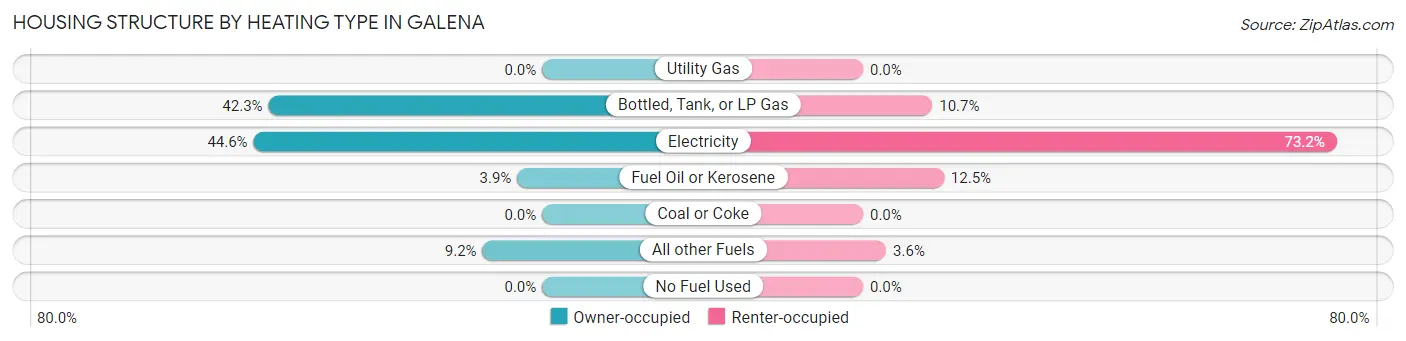
| Heating Type | Owner-occupied | Renter-occupied |
| Utility Gas | 0 (0.0%) | 0 (0.0%) |
| Bottled, Tank, or LP Gas | 55 (42.3%) | 6 (10.7%) |
| Electricity | 58 (44.6%) | 41 (73.2%) |
| Fuel Oil or Kerosene | 5 (3.8%) | 7 (12.5%) |
| Coal or Coke | 0 (0.0%) | 0 (0.0%) |
| All other Fuels | 12 (9.2%) | 2 (3.6%) |
| No Fuel Used | 0 (0.0%) | 0 (0.0%) |
| Total | 130 (100.0%) | 56 (100.0%) |
Household Vehicle Usage in Galena
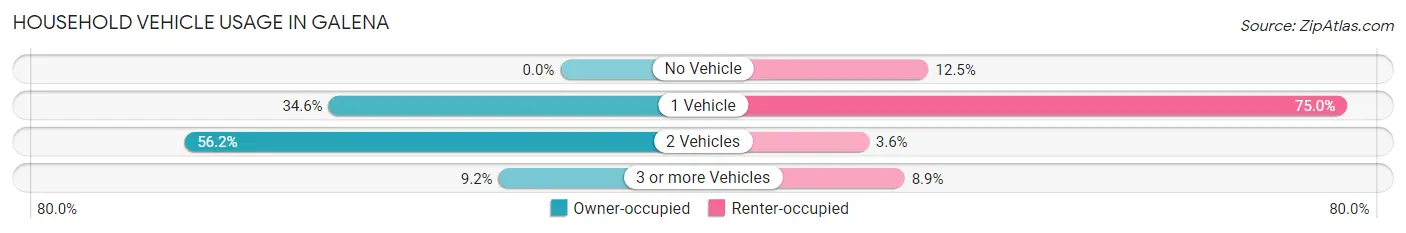
| Vehicles per Household | Owner-occupied | Renter-occupied |
| No Vehicle | 0 (0.0%) | 7 (12.5%) |
| 1 Vehicle | 45 (34.6%) | 42 (75.0%) |
| 2 Vehicles | 73 (56.1%) | 2 (3.6%) |
| 3 or more Vehicles | 12 (9.2%) | 5 (8.9%) |
| Total | 130 (100.0%) | 56 (100.0%) |
Real Estate & Mortgages in Galena
Real Estate and Mortgage Overview in Galena
| Characteristic | Without Mortgage | With Mortgage |
| Housing Units | 54 | 76 |
| Median Property Value | $100,000 | $105,000 |
| Median Household Income | $41,364 | $7 |
| Monthly Housing Costs | $400 | $7 |
| Real Estate Taxes | $387 | $0 |
Property Value by Mortgage Status in Galena
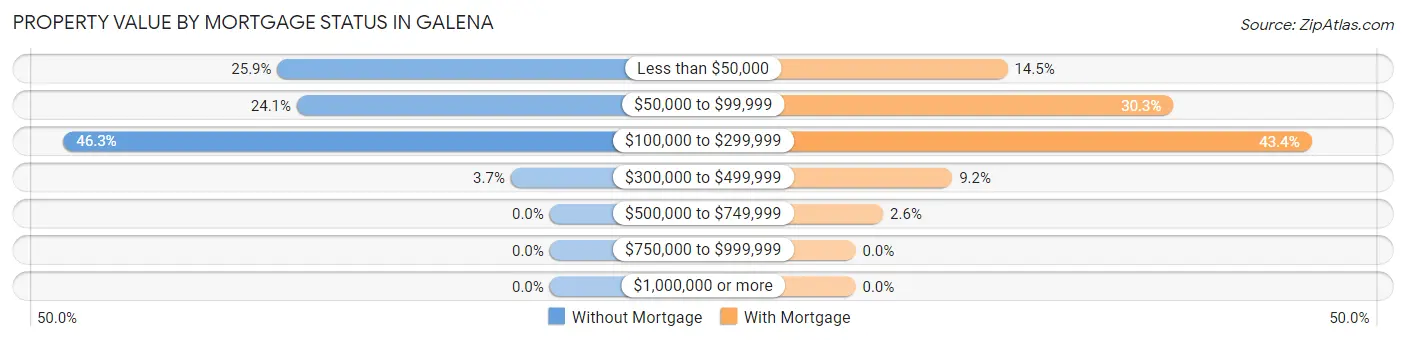
| Property Value | Without Mortgage | With Mortgage |
| Less than $50,000 | 14 (25.9%) | 11 (14.5%) |
| $50,000 to $99,999 | 13 (24.1%) | 23 (30.3%) |
| $100,000 to $299,999 | 25 (46.3%) | 33 (43.4%) |
| $300,000 to $499,999 | 2 (3.7%) | 7 (9.2%) |
| $500,000 to $749,999 | 0 (0.0%) | 2 (2.6%) |
| $750,000 to $999,999 | 0 (0.0%) | 0 (0.0%) |
| $1,000,000 or more | 0 (0.0%) | 0 (0.0%) |
| Total | 54 (100.0%) | 76 (100.0%) |
Household Income by Mortgage Status in Galena
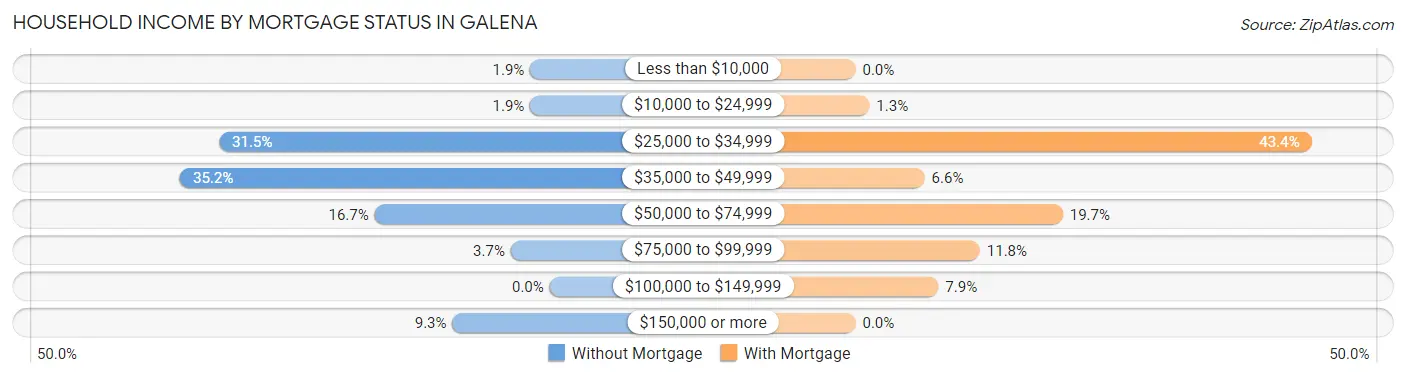
| Household Income | Without Mortgage | With Mortgage |
| Less than $10,000 | 1 (1.8%) | 0 (0.0%) |
| $10,000 to $24,999 | 1 (1.8%) | 1 (1.3%) |
| $25,000 to $34,999 | 17 (31.5%) | 33 (43.4%) |
| $35,000 to $49,999 | 19 (35.2%) | 5 (6.6%) |
| $50,000 to $74,999 | 9 (16.7%) | 15 (19.7%) |
| $75,000 to $99,999 | 2 (3.7%) | 9 (11.8%) |
| $100,000 to $149,999 | 0 (0.0%) | 6 (7.9%) |
| $150,000 or more | 5 (9.3%) | 0 (0.0%) |
| Total | 54 (100.0%) | 76 (100.0%) |
Property Value to Household Income Ratio in Galena
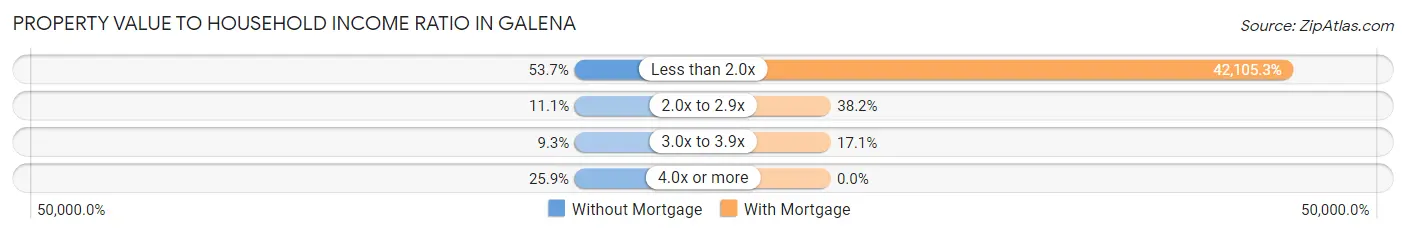
| Value-to-Income Ratio | Without Mortgage | With Mortgage |
| Less than 2.0x | 29 (53.7%) | 32,000 (42,105.3%) |
| 2.0x to 2.9x | 6 (11.1%) | 29 (38.2%) |
| 3.0x to 3.9x | 5 (9.3%) | 13 (17.1%) |
| 4.0x or more | 14 (25.9%) | 0 (0.0%) |
| Total | 54 (100.0%) | 76 (100.0%) |
Real Estate Taxes by Mortgage Status in Galena
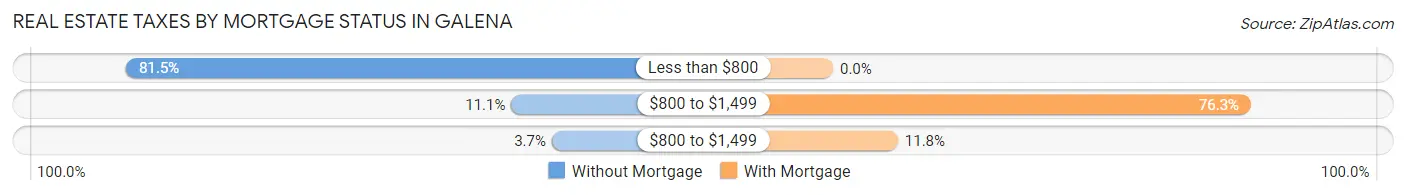
| Property Taxes | Without Mortgage | With Mortgage |
| Less than $800 | 44 (81.5%) | 0 (0.0%) |
| $800 to $1,499 | 6 (11.1%) | 58 (76.3%) |
| $800 to $1,499 | 2 (3.7%) | 9 (11.8%) |
| Total | 54 (100.0%) | 76 (100.0%) |
Health & Disability in Galena
Health Insurance Coverage by Age in Galena
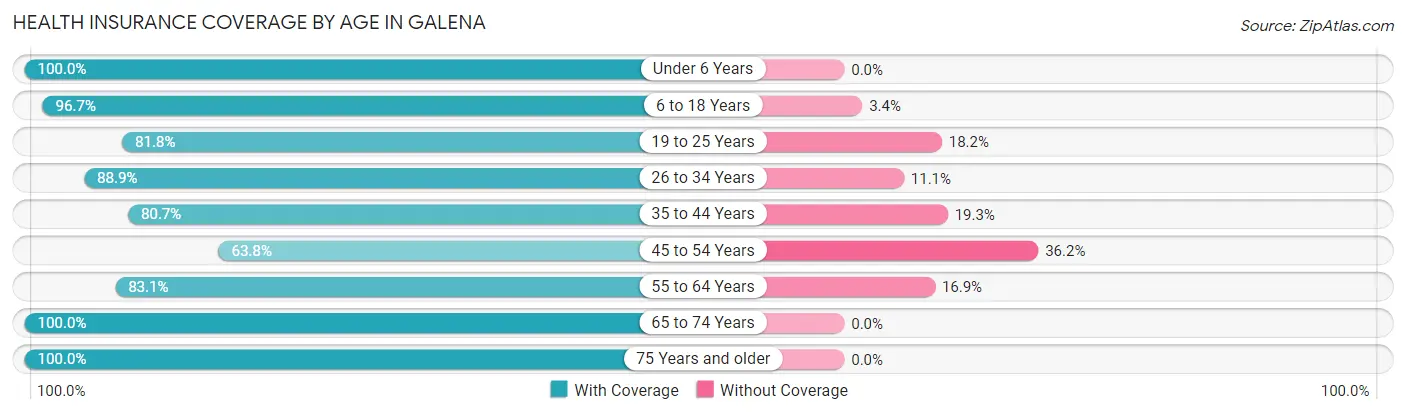
| Age Bracket | With Coverage | Without Coverage |
| Under 6 Years | 37 (100.0%) | 0 (0.0%) |
| 6 to 18 Years | 173 (96.7%) | 6 (3.4%) |
| 19 to 25 Years | 9 (81.8%) | 2 (18.2%) |
| 26 to 34 Years | 40 (88.9%) | 5 (11.1%) |
| 35 to 44 Years | 67 (80.7%) | 16 (19.3%) |
| 45 to 54 Years | 30 (63.8%) | 17 (36.2%) |
| 55 to 64 Years | 59 (83.1%) | 12 (16.9%) |
| 65 to 74 Years | 48 (100.0%) | 0 (0.0%) |
| 75 Years and older | 48 (100.0%) | 0 (0.0%) |
| Total | 511 (89.8%) | 58 (10.2%) |
Health Insurance Coverage by Citizenship Status in Galena
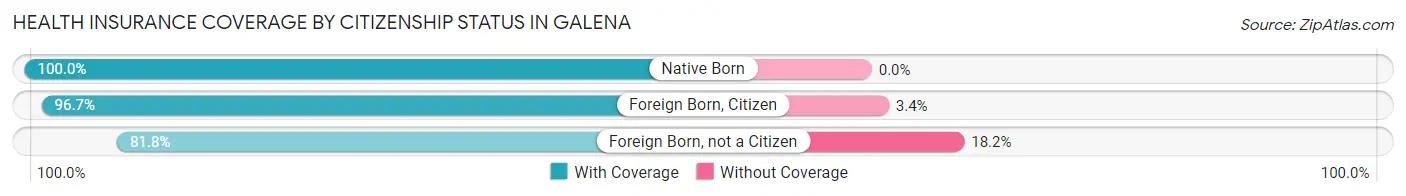
| Citizenship Status | With Coverage | Without Coverage |
| Native Born | 37 (100.0%) | 0 (0.0%) |
| Foreign Born, Citizen | 173 (96.7%) | 6 (3.4%) |
| Foreign Born, not a Citizen | 9 (81.8%) | 2 (18.2%) |
Health Insurance Coverage by Household Income in Galena
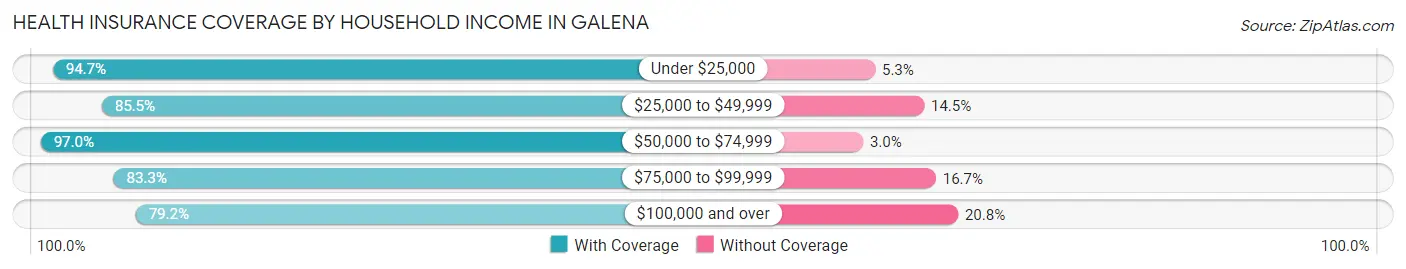
| Household Income | With Coverage | Without Coverage |
| Under $25,000 | 197 (94.7%) | 11 (5.3%) |
| $25,000 to $49,999 | 201 (85.5%) | 34 (14.5%) |
| $50,000 to $74,999 | 64 (97.0%) | 2 (3.0%) |
| $75,000 to $99,999 | 30 (83.3%) | 6 (16.7%) |
| $100,000 and over | 19 (79.2%) | 5 (20.8%) |
Public vs Private Health Insurance Coverage by Age in Galena
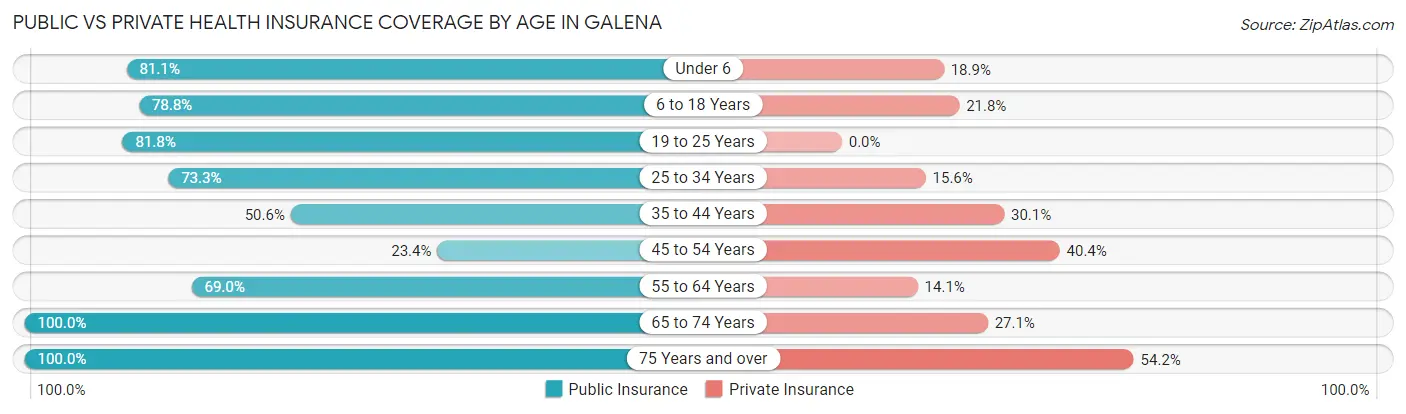
| Age Bracket | Public Insurance | Private Insurance |
| Under 6 | 30 (81.1%) | 7 (18.9%) |
| 6 to 18 Years | 141 (78.8%) | 39 (21.8%) |
| 19 to 25 Years | 9 (81.8%) | 0 (0.0%) |
| 25 to 34 Years | 33 (73.3%) | 7 (15.6%) |
| 35 to 44 Years | 42 (50.6%) | 25 (30.1%) |
| 45 to 54 Years | 11 (23.4%) | 19 (40.4%) |
| 55 to 64 Years | 49 (69.0%) | 10 (14.1%) |
| 65 to 74 Years | 48 (100.0%) | 13 (27.1%) |
| 75 Years and over | 48 (100.0%) | 26 (54.2%) |
| Total | 411 (72.2%) | 146 (25.7%) |
Disability Status by Sex by Age in Galena
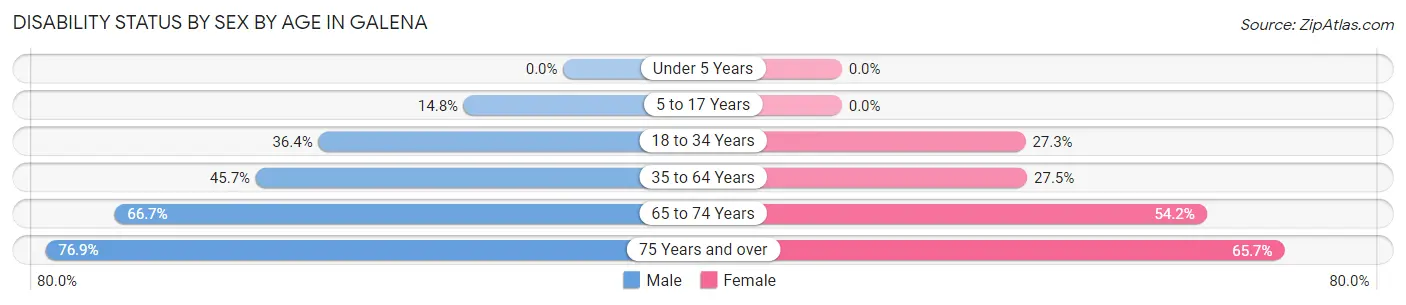
| Age Bracket | Male | Female |
| Under 5 Years | 0 (0.0%) | 0 (0.0%) |
| 5 to 17 Years | 13 (14.8%) | 0 (0.0%) |
| 18 to 34 Years | 8 (36.4%) | 12 (27.3%) |
| 35 to 64 Years | 42 (45.7%) | 30 (27.5%) |
| 65 to 74 Years | 16 (66.7%) | 13 (54.2%) |
| 75 Years and over | 10 (76.9%) | 23 (65.7%) |
Disability Class by Sex by Age in Galena
Disability Class: Hearing Difficulty
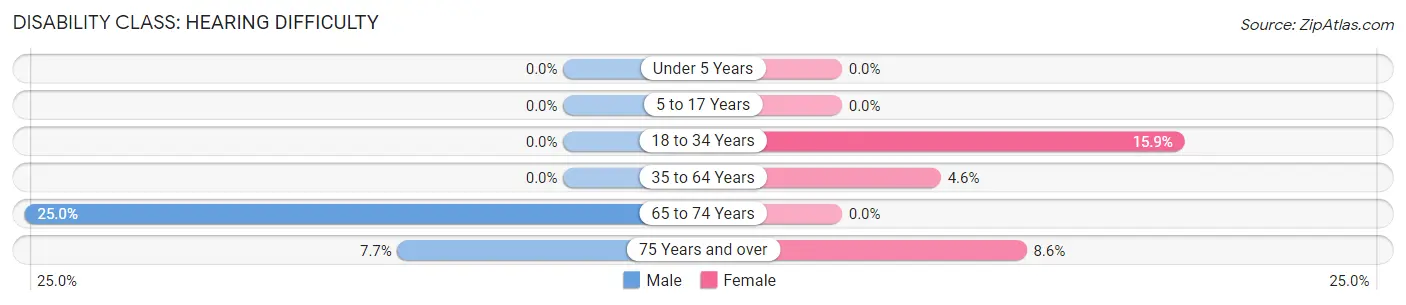
| Age Bracket | Male | Female |
| Under 5 Years | 0 (0.0%) | 0 (0.0%) |
| 5 to 17 Years | 0 (0.0%) | 0 (0.0%) |
| 18 to 34 Years | 0 (0.0%) | 7 (15.9%) |
| 35 to 64 Years | 0 (0.0%) | 5 (4.6%) |
| 65 to 74 Years | 6 (25.0%) | 0 (0.0%) |
| 75 Years and over | 1 (7.7%) | 3 (8.6%) |
Disability Class: Vision Difficulty
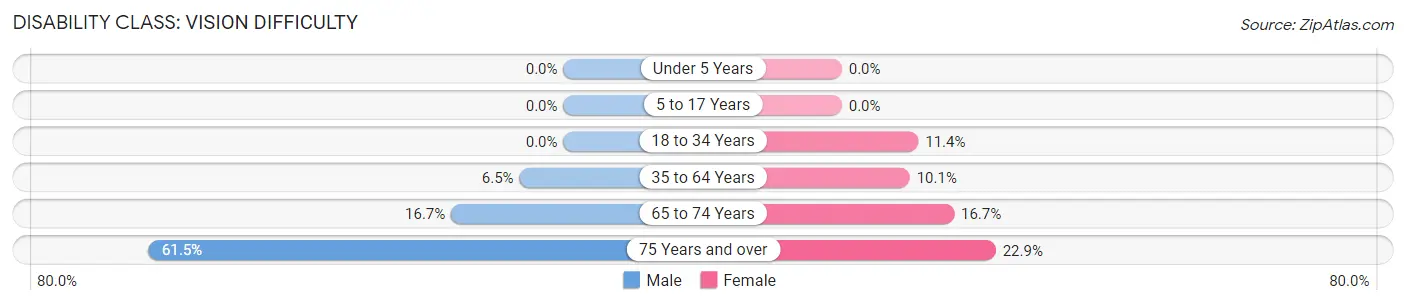
| Age Bracket | Male | Female |
| Under 5 Years | 0 (0.0%) | 0 (0.0%) |
| 5 to 17 Years | 0 (0.0%) | 0 (0.0%) |
| 18 to 34 Years | 0 (0.0%) | 5 (11.4%) |
| 35 to 64 Years | 6 (6.5%) | 11 (10.1%) |
| 65 to 74 Years | 4 (16.7%) | 4 (16.7%) |
| 75 Years and over | 8 (61.5%) | 8 (22.9%) |
Disability Class: Cognitive Difficulty
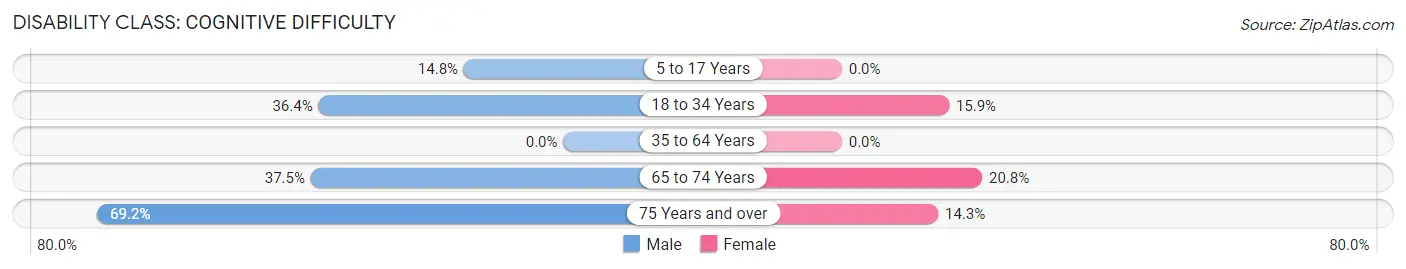
| Age Bracket | Male | Female |
| 5 to 17 Years | 13 (14.8%) | 0 (0.0%) |
| 18 to 34 Years | 8 (36.4%) | 7 (15.9%) |
| 35 to 64 Years | 0 (0.0%) | 0 (0.0%) |
| 65 to 74 Years | 9 (37.5%) | 5 (20.8%) |
| 75 Years and over | 9 (69.2%) | 5 (14.3%) |
Disability Class: Ambulatory Difficulty
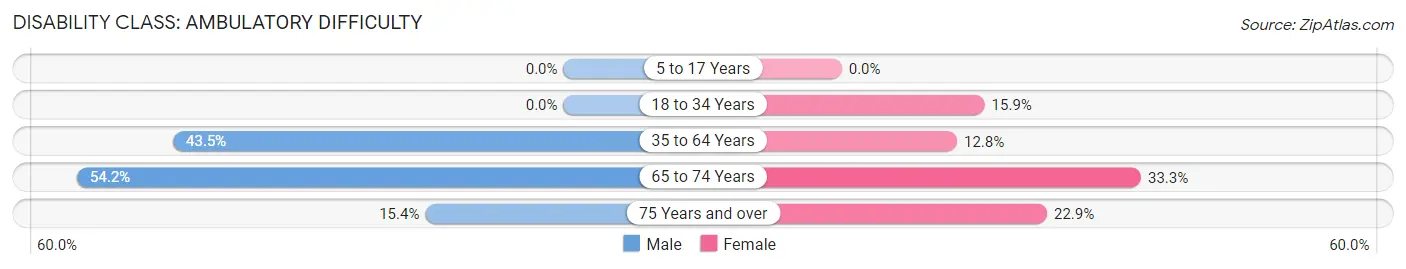
| Age Bracket | Male | Female |
| 5 to 17 Years | 0 (0.0%) | 0 (0.0%) |
| 18 to 34 Years | 0 (0.0%) | 7 (15.9%) |
| 35 to 64 Years | 40 (43.5%) | 14 (12.8%) |
| 65 to 74 Years | 13 (54.2%) | 8 (33.3%) |
| 75 Years and over | 2 (15.4%) | 8 (22.9%) |
Disability Class: Self-Care Difficulty
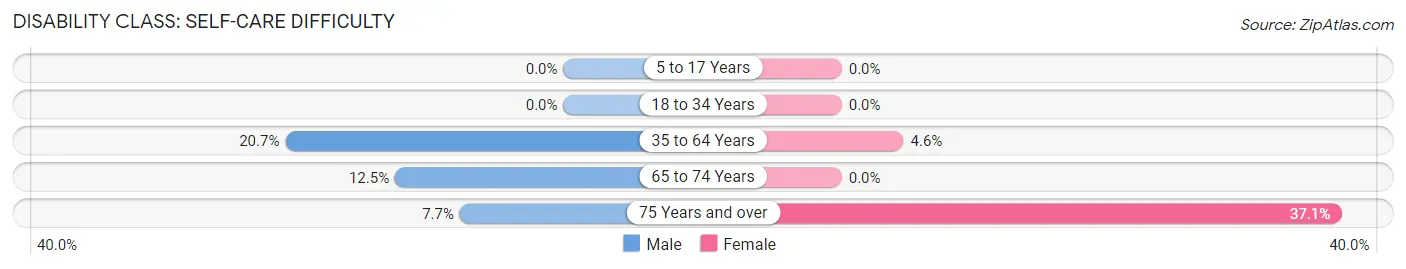
| Age Bracket | Male | Female |
| 5 to 17 Years | 0 (0.0%) | 0 (0.0%) |
| 18 to 34 Years | 0 (0.0%) | 0 (0.0%) |
| 35 to 64 Years | 19 (20.6%) | 5 (4.6%) |
| 65 to 74 Years | 3 (12.5%) | 0 (0.0%) |
| 75 Years and over | 1 (7.7%) | 13 (37.1%) |
Technology Access in Galena
Computing Device Access in Galena
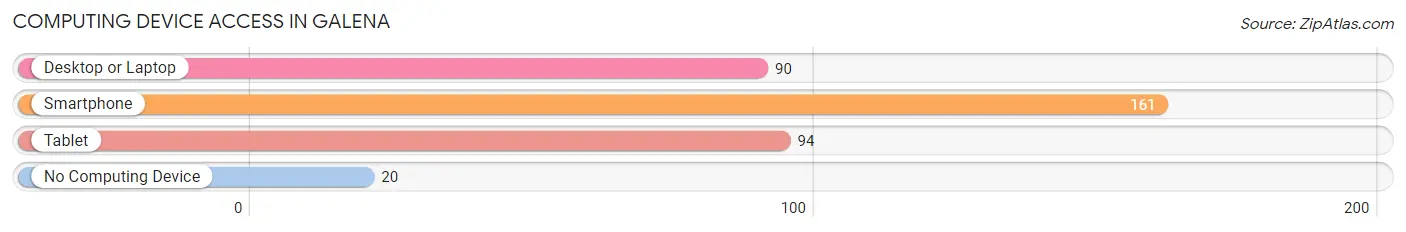
| Device Type | # Households | % Households |
| Desktop or Laptop | 90 | 48.4% |
| Smartphone | 161 | 86.6% |
| Tablet | 94 | 50.5% |
| No Computing Device | 20 | 10.7% |
| Total | 186 | 100.0% |
Internet Access in Galena
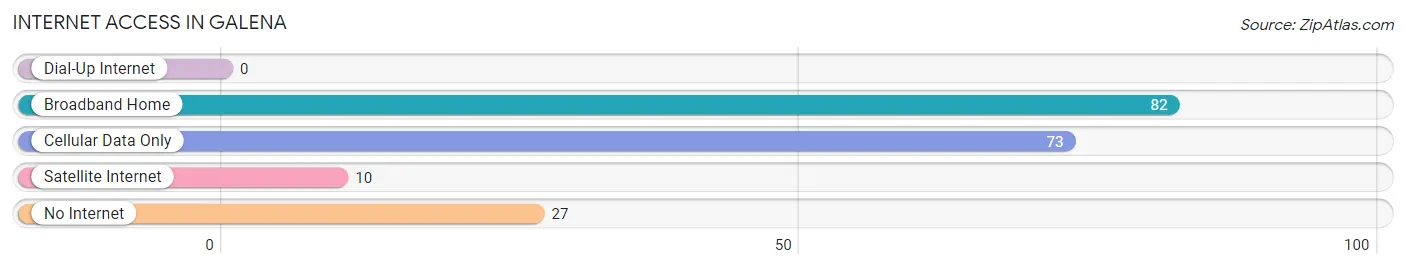
| Internet Type | # Households | % Households |
| Dial-Up Internet | 0 | 0.0% |
| Broadband Home | 82 | 44.1% |
| Cellular Data Only | 73 | 39.3% |
| Satellite Internet | 10 | 5.4% |
| No Internet | 27 | 14.5% |
| Total | 186 | 100.0% |
Galena Summary
Galena, Missouri is a small city located in the Ozark Mountains of southwest Missouri. It is situated in the heart of Stone County, and is the county seat. The city is located on the banks of the James River, and is surrounded by rolling hills and lush forests. The population of Galena was 1,845 in the 2010 census, making it the second-largest city in Stone County.
History
The area that is now Galena was first settled in the early 1800s by settlers from the Ozark region of Arkansas. The first settlers were mostly farmers and ranchers, and the area was known as “The Settlement”. In 1845, the town was officially incorporated as Galena, named after the lead ore that was mined in the area.
The town grew slowly, but steadily, and by the late 1800s, it had become a bustling center of commerce and industry. The town was home to several sawmills, gristmills, and a lead smelter. The lead smelter was the largest employer in the area, and it provided jobs for many of the town’s residents.
In the early 1900s, the town began to decline as the lead industry began to decline. The town’s population began to dwindle, and by the 1950s, the town was nearly abandoned. In the late 1960s, the town began to experience a resurgence as people began to move back to the area. The town was revitalized, and today it is a thriving community with a vibrant economy.
Geography
Galena is located in the Ozark Mountains of southwest Missouri. It is situated in the heart of Stone County, and is the county seat. The city is located on the banks of the James River, and is surrounded by rolling hills and lush forests. The city is located at an elevation of 890 feet above sea level.
The climate in Galena is mild and temperate. Summers are hot and humid, with temperatures reaching into the 90s. Winters are cold and wet, with temperatures dropping into the 20s. The average annual precipitation is around 40 inches.
Economy
The economy of Galena is largely based on tourism and agriculture. The town is home to several tourist attractions, including the Ozark National Scenic Riverways, the James River, and the Galena Historic District. The town is also home to several wineries, and is a popular destination for wine tasting.
Agriculture is also an important part of the local economy. The area is home to several farms, and the town is known for its production of beef, pork, and poultry. The town is also home to several small businesses, including restaurants, shops, and other services.
Demographics
As of the 2010 census, the population of Galena was 1,845. The racial makeup of the town was 95.3% White, 0.7% African American, 0.3% Native American, 0.2% Asian, 0.1% Pacific Islander, and 3.4% from other races. The median household income was $35,938, and the median family income was $41,250. The per capita income was $17,845.
Galena is a small town with a rich history and a vibrant economy. It is a popular destination for tourists, and is home to several wineries and other attractions. The town is also home to several small businesses, and is a great place to live and work.
Common Questions
What is Per Capita Income in Galena?
Per Capita income in Galena is $14,048.
What is the Median Family Income in Galena?
Median Family Income in Galena is $31,591.
What is the Median Household income in Galena?
Median Household Income in Galena is $29,833.
What is Income or Wage Gap in Galena?
Income or Wage Gap in Galena is 0.5%.
Women in Galena earn 99.5 cents for every dollar earned by a man.
What is Inequality or Gini Index in Galena?
Inequality or Gini Index in Galena is 0.45.
What is the Total Population of Galena?
Total Population of Galena is 584.
What is the Total Male Population of Galena?
Total Male Population of Galena is 280.
What is the Total Female Population of Galena?
Total Female Population of Galena is 304.
What is the Ratio of Males per 100 Females in Galena?
There are 92.11 Males per 100 Females in Galena.
What is the Ratio of Females per 100 Males in Galena?
There are 108.57 Females per 100 Males in Galena.
What is the Median Population Age in Galena?
Median Population Age in Galena is 36.8 Years.
What is the Average Family Size in Galena
Average Family Size in Galena is 3.8 People.
What is the Average Household Size in Galena
Average Household Size in Galena is 3.1 People.
How Large is the Labor Force in Galena?
There are 156 People in the Labor Forcein in Galena.
What is the Percentage of People in the Labor Force in Galena?
37.2% of People are in the Labor Force in Galena.
What is the Unemployment Rate in Galena?
Unemployment Rate in Galena is 5.1%.