Forsyth, MO Map & Demographics
Forsyth Map
Forsyth Overview
$28,578
PER CAPITA INCOME
$72,813
AVG FAMILY INCOME
$42,083
AVG HOUSEHOLD INCOME
25.6%
WAGE / INCOME GAP [ % ]
74.4¢/ $1
WAGE / INCOME GAP [ $ ]
$6,565
FAMILY INCOME DEFICIT
0.42
INEQUALITY / GINI INDEX
2,731
TOTAL POPULATION
1,409
MALE POPULATION
1,322
FEMALE POPULATION
106.58
MALES / 100 FEMALES
93.83
FEMALES / 100 MALES
58.5
MEDIAN AGE
2.5
AVG FAMILY SIZE
1.9
AVG HOUSEHOLD SIZE
942
LABOR FORCE [ PEOPLE ]
38.6%
PERCENT IN LABOR FORCE
3.0%
UNEMPLOYMENT RATE
Forsyth Zip Codes
Forsyth Area Codes
Income in Forsyth
Income Overview in Forsyth
Per Capita Income in Forsyth is $28,578, while median incomes of families and households are $72,813 and $42,083 respectively.
| Characteristic | Number | Measure |
| Per Capita Income | 2,731 | $28,578 |
| Median Family Income | 702 | $72,813 |
| Mean Family Income | 702 | $79,013 |
| Median Household Income | 1,308 | $42,083 |
| Mean Household Income | 1,308 | $58,391 |
| Income Deficit | 702 | $6,565 |
| Wage / Income Gap (%) | 2,731 | 25.55% |
| Wage / Income Gap ($) | 2,731 | 74.45¢ per $1 |
| Gini / Inequality Index | 2,731 | 0.42 |
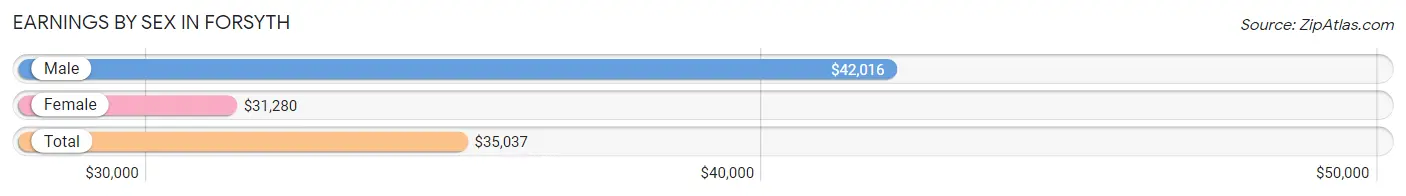
Earnings by Sex in Forsyth
Average Earnings in Forsyth are $35,037, $42,016 for men and $31,280 for women, a difference of 25.6%.
| Sex | Number | Average Earnings |
| Male | 502 (48.5%) | $42,016 |
| Female | 533 (51.5%) | $31,280 |
| Total | 1,035 (100.0%) | $35,037 |
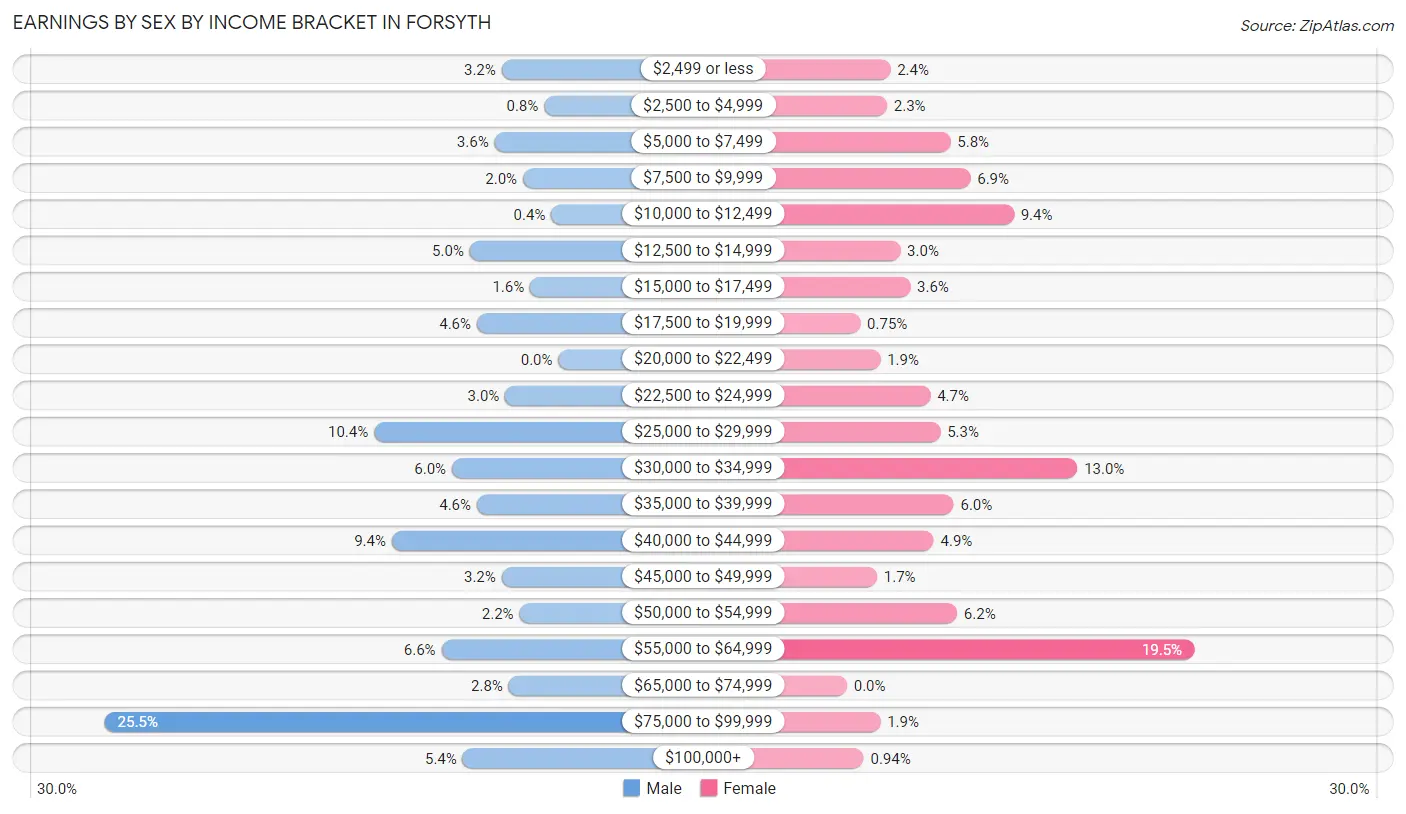
Earnings by Sex by Income Bracket in Forsyth
The most common earnings brackets in Forsyth are $75,000 to $99,999 for men (128 | 25.5%) and $55,000 to $64,999 for women (104 | 19.5%).
| Income | Male | Female |
| $2,499 or less | 16 (3.2%) | 13 (2.4%) |
| $2,500 to $4,999 | 4 (0.8%) | 12 (2.2%) |
| $5,000 to $7,499 | 18 (3.6%) | 31 (5.8%) |
| $7,500 to $9,999 | 10 (2.0%) | 37 (6.9%) |
| $10,000 to $12,499 | 2 (0.4%) | 50 (9.4%) |
| $12,500 to $14,999 | 25 (5.0%) | 16 (3.0%) |
| $15,000 to $17,499 | 8 (1.6%) | 19 (3.6%) |
| $17,500 to $19,999 | 23 (4.6%) | 4 (0.7%) |
| $20,000 to $22,499 | 0 (0.0%) | 10 (1.9%) |
| $22,500 to $24,999 | 15 (3.0%) | 25 (4.7%) |
| $25,000 to $29,999 | 52 (10.4%) | 28 (5.2%) |
| $30,000 to $34,999 | 30 (6.0%) | 69 (13.0%) |
| $35,000 to $39,999 | 23 (4.6%) | 32 (6.0%) |
| $40,000 to $44,999 | 47 (9.4%) | 26 (4.9%) |
| $45,000 to $49,999 | 16 (3.2%) | 9 (1.7%) |
| $50,000 to $54,999 | 11 (2.2%) | 33 (6.2%) |
| $55,000 to $64,999 | 33 (6.6%) | 104 (19.5%) |
| $65,000 to $74,999 | 14 (2.8%) | 0 (0.0%) |
| $75,000 to $99,999 | 128 (25.5%) | 10 (1.9%) |
| $100,000+ | 27 (5.4%) | 5 (0.9%) |
| Total | 502 (100.0%) | 533 (100.0%) |
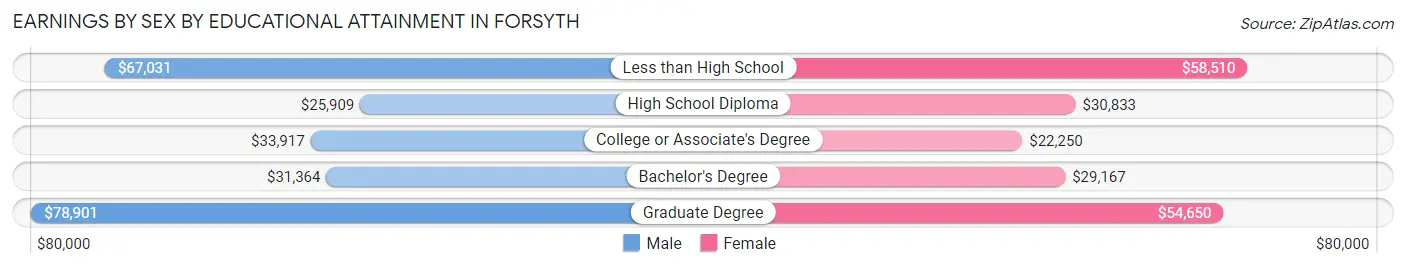
Earnings by Sex by Educational Attainment in Forsyth
Average earnings in Forsyth are $44,922 for men and $32,440 for women, a difference of 27.8%. Men with an educational attainment of graduate degree enjoy the highest average annual earnings of $78,901, while those with high school diploma education earn the least with $25,909. Women with an educational attainment of less than high school earn the most with the average annual earnings of $58,510, while those with college or associate's degree education have the smallest earnings of $22,250.
| Educational Attainment | Male Income | Female Income |
| Less than High School | $67,031 | $58,510 |
| High School Diploma | $25,909 | $30,833 |
| College or Associate's Degree | $33,917 | $22,250 |
| Bachelor's Degree | $31,364 | $29,167 |
| Graduate Degree | $78,901 | $54,650 |
| Total | $44,922 | $32,440 |
Family Income in Forsyth
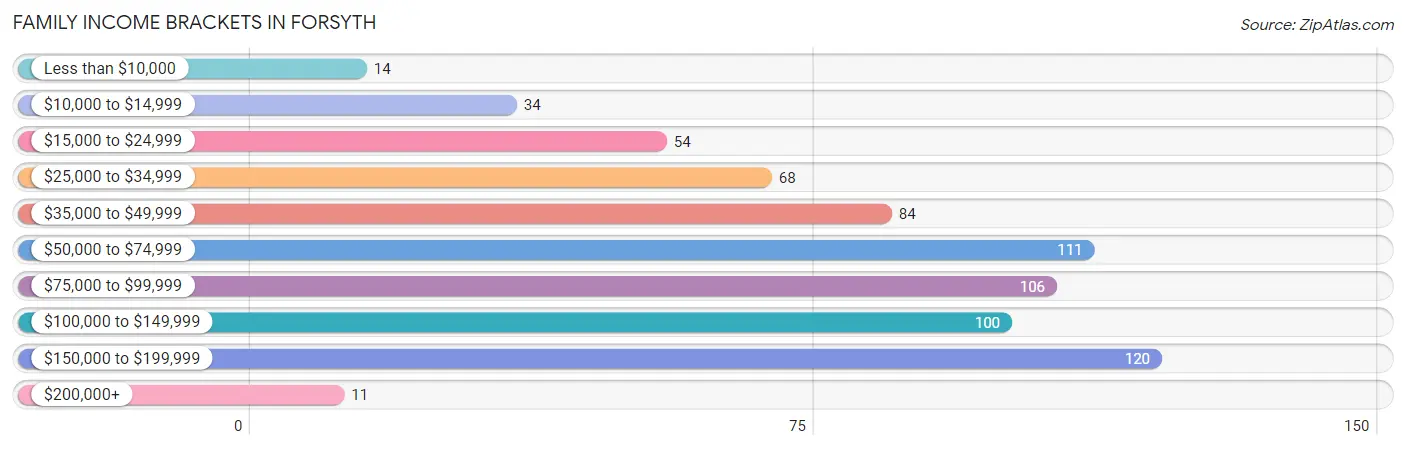
Family Income Brackets in Forsyth
According to the Forsyth family income data, there are 120 families falling into the $150,000 to $199,999 income range, which is the most common income bracket and makes up 17.1% of all families. Conversely, the $200,000+ income bracket is the least frequent group with only 11 families (1.6%) belonging to this category.
| Income Bracket | # Families | % Families |
| Less than $10,000 | 14 | 2.0% |
| $10,000 to $14,999 | 34 | 4.8% |
| $15,000 to $24,999 | 54 | 7.7% |
| $25,000 to $34,999 | 68 | 9.7% |
| $35,000 to $49,999 | 84 | 12.0% |
| $50,000 to $74,999 | 111 | 15.8% |
| $75,000 to $99,999 | 106 | 15.1% |
| $100,000 to $149,999 | 100 | 14.2% |
| $150,000 to $199,999 | 120 | 17.1% |
| $200,000+ | 11 | 1.6% |
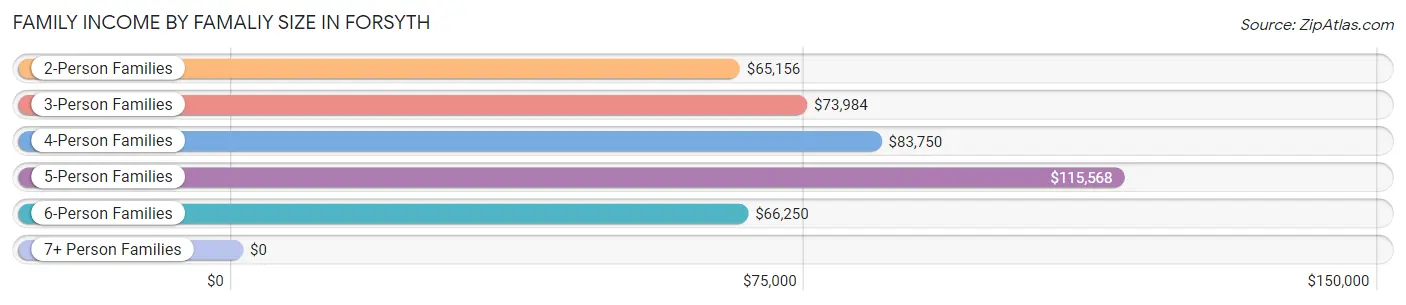
Family Income by Famaliy Size in Forsyth
5-person families (17 | 2.4%) account for the highest median family income in Forsyth with $115,568 per family, while 2-person families (539 | 76.8%) have the highest median income of $32,578 per family member.
| Income Bracket | # Families | Median Income |
| 2-Person Families | 539 (76.8%) | $65,156 |
| 3-Person Families | 69 (9.8%) | $73,984 |
| 4-Person Families | 64 (9.1%) | $83,750 |
| 5-Person Families | 17 (2.4%) | $115,568 |
| 6-Person Families | 12 (1.7%) | $66,250 |
| 7+ Person Families | 1 (0.1%) | $0 |
| Total | 702 (100.0%) | $72,813 |
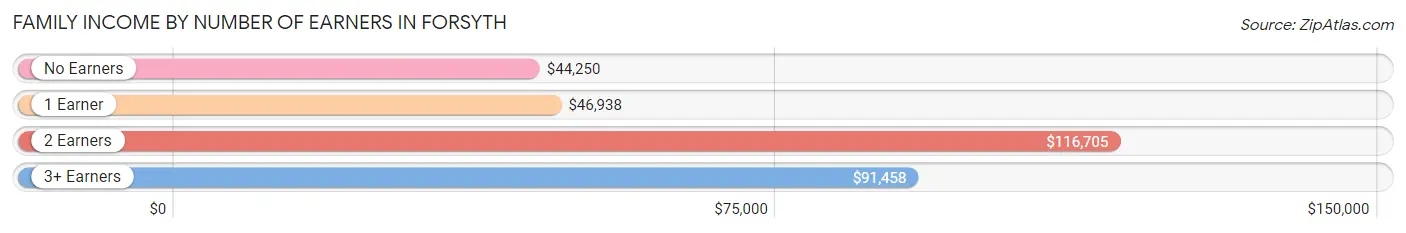
Family Income by Number of Earners in Forsyth
The median family income in Forsyth is $72,813, with families comprising 2 earners (269) having the highest median family income of $116,705, while families with no earners (251) have the lowest median family income of $44,250, accounting for 38.3% and 35.7% of families, respectively.
| Number of Earners | # Families | Median Income |
| No Earners | 251 (35.7%) | $44,250 |
| 1 Earner | 157 (22.4%) | $46,938 |
| 2 Earners | 269 (38.3%) | $116,705 |
| 3+ Earners | 25 (3.6%) | $91,458 |
| Total | 702 (100.0%) | $72,813 |
Household Income in Forsyth
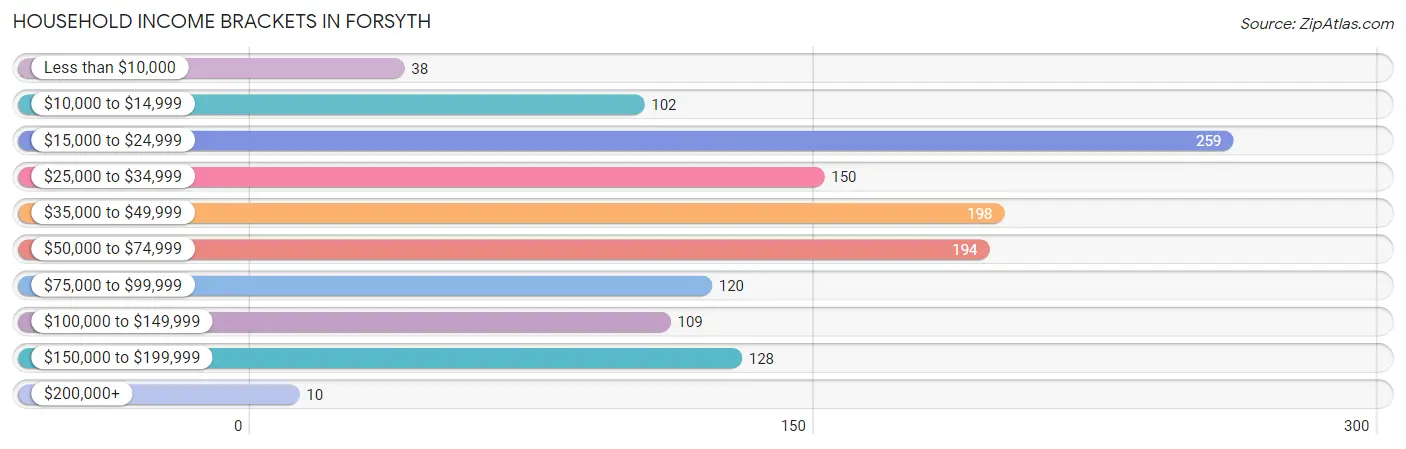
Household Income Brackets in Forsyth
With 259 households falling in the category, the $15,000 to $24,999 income range is the most frequent in Forsyth, accounting for 19.8% of all households. In contrast, only 10 households (0.8%) fall into the $200,000+ income bracket, making it the least populous group.
| Income Bracket | # Households | % Households |
| Less than $10,000 | 38 | 2.9% |
| $10,000 to $14,999 | 102 | 7.8% |
| $15,000 to $24,999 | 259 | 19.8% |
| $25,000 to $34,999 | 150 | 11.5% |
| $35,000 to $49,999 | 198 | 15.1% |
| $50,000 to $74,999 | 194 | 14.8% |
| $75,000 to $99,999 | 120 | 9.2% |
| $100,000 to $149,999 | 109 | 8.3% |
| $150,000 to $199,999 | 128 | 9.8% |
| $200,000+ | 10 | 0.8% |
Household Income by Householder Age in Forsyth
The median household income in Forsyth is $42,083, with the highest median household income of $71,058 found in the 25 to 44 years age bracket for the primary householder. A total of 157 households (12.0%) fall into this category. Meanwhile, the 15 to 24 years age bracket for the primary householder has the lowest median household income of $0, with 15 households (1.1%) in this group.
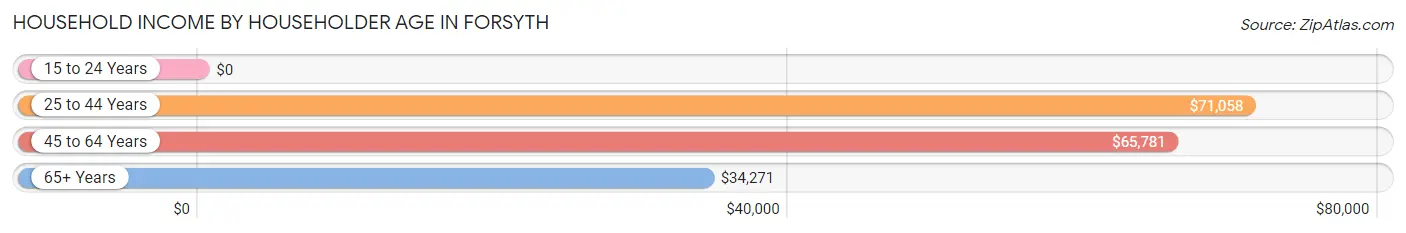
| Income Bracket | # Households | Median Income |
| 15 to 24 Years | 15 (1.1%) | $0 |
| 25 to 44 Years | 157 (12.0%) | $71,058 |
| 45 to 64 Years | 401 (30.7%) | $65,781 |
| 65+ Years | 735 (56.2%) | $34,271 |
| Total | 1,308 (100.0%) | $42,083 |
Poverty in Forsyth
Income Below Poverty by Sex and Age in Forsyth
With 13.4% poverty level for males and 15.6% for females among the residents of Forsyth, under 5 year old males and under 5 year old females are the most vulnerable to poverty, with 11 males (57.9%) and 11 females (42.3%) in their respective age groups living below the poverty level.
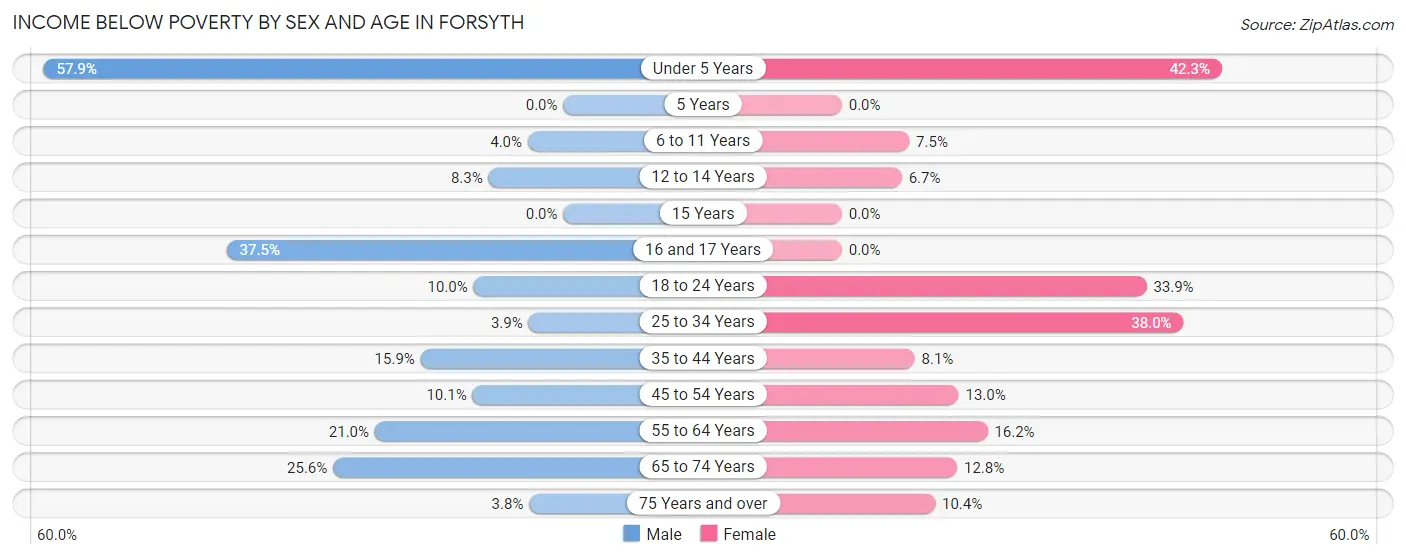
| Age Bracket | Male | Female |
| Under 5 Years | 11 (57.9%) | 11 (42.3%) |
| 5 Years | 0 (0.0%) | 0 (0.0%) |
| 6 to 11 Years | 3 (4.0%) | 3 (7.5%) |
| 12 to 14 Years | 3 (8.3%) | 2 (6.7%) |
| 15 Years | 0 (0.0%) | 0 (0.0%) |
| 16 and 17 Years | 9 (37.5%) | 0 (0.0%) |
| 18 to 24 Years | 4 (10.0%) | 19 (33.9%) |
| 25 to 34 Years | 4 (3.9%) | 35 (38.0%) |
| 35 to 44 Years | 17 (15.9%) | 9 (8.1%) |
| 45 to 54 Years | 17 (10.1%) | 13 (13.0%) |
| 55 to 64 Years | 38 (21.0%) | 42 (16.2%) |
| 65 to 74 Years | 50 (25.6%) | 42 (12.8%) |
| 75 Years and over | 10 (3.8%) | 22 (10.4%) |
| Total | 166 (13.4%) | 198 (15.6%) |
Income Above Poverty by Sex and Age in Forsyth
According to the poverty statistics in Forsyth, males aged 5 years and females aged 15 years are the age groups that are most secure financially, with 100.0% of males and 100.0% of females in these age groups living above the poverty line.
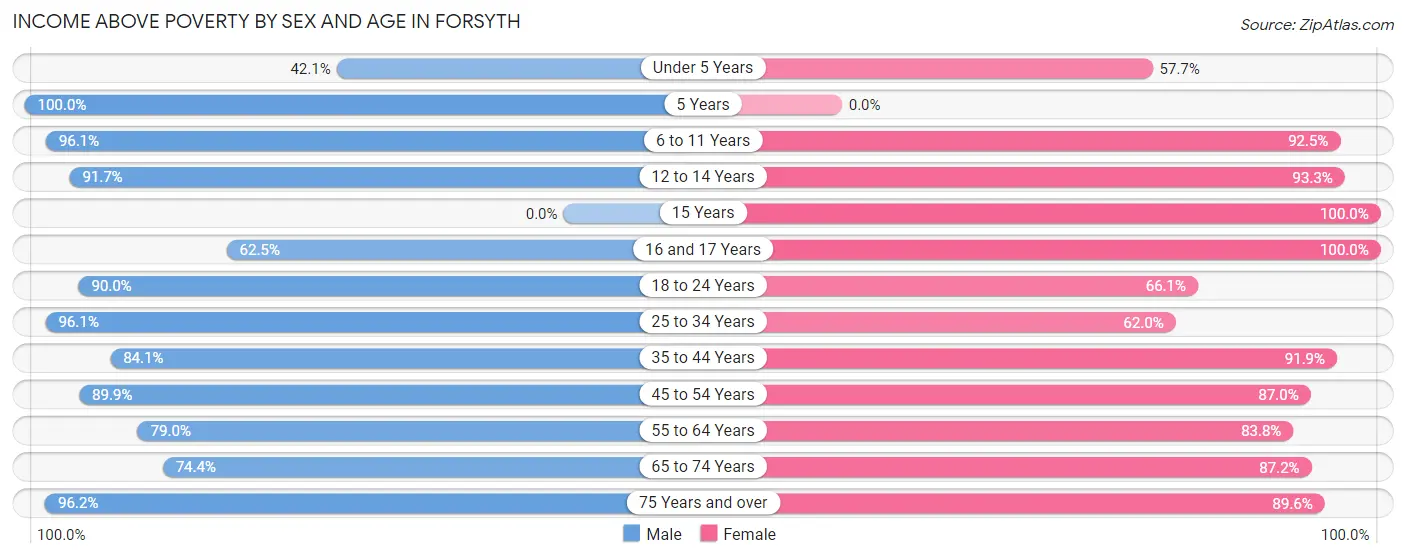
| Age Bracket | Male | Female |
| Under 5 Years | 8 (42.1%) | 15 (57.7%) |
| 5 Years | 24 (100.0%) | 0 (0.0%) |
| 6 to 11 Years | 73 (96.1%) | 37 (92.5%) |
| 12 to 14 Years | 33 (91.7%) | 28 (93.3%) |
| 15 Years | 0 (0.0%) | 8 (100.0%) |
| 16 and 17 Years | 15 (62.5%) | 7 (100.0%) |
| 18 to 24 Years | 36 (90.0%) | 37 (66.1%) |
| 25 to 34 Years | 99 (96.1%) | 57 (62.0%) |
| 35 to 44 Years | 90 (84.1%) | 102 (91.9%) |
| 45 to 54 Years | 151 (89.9%) | 87 (87.0%) |
| 55 to 64 Years | 143 (79.0%) | 217 (83.8%) |
| 65 to 74 Years | 145 (74.4%) | 285 (87.2%) |
| 75 Years and over | 253 (96.2%) | 190 (89.6%) |
| Total | 1,070 (86.6%) | 1,070 (84.4%) |
Income Below Poverty Among Married-Couple Families in Forsyth
The poverty statistics for married-couple families in Forsyth show that 7.8% or 44 of the total 564 families live below the poverty line. Families with 5 or more children have the highest poverty rate of 100.0%, comprising of 1 families. On the other hand, families with 1 or 2 children have the lowest poverty rate of 0.0%, which includes 0 families.
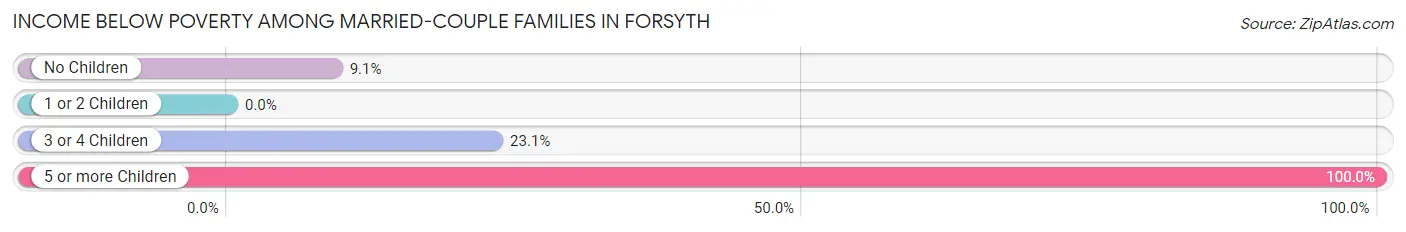
| Children | Above Poverty | Below Poverty |
| No Children | 399 (90.9%) | 40 (9.1%) |
| 1 or 2 Children | 111 (100.0%) | 0 (0.0%) |
| 3 or 4 Children | 10 (76.9%) | 3 (23.1%) |
| 5 or more Children | 0 (0.0%) | 1 (100.0%) |
| Total | 520 (92.2%) | 44 (7.8%) |
Income Below Poverty Among Single-Parent Households in Forsyth
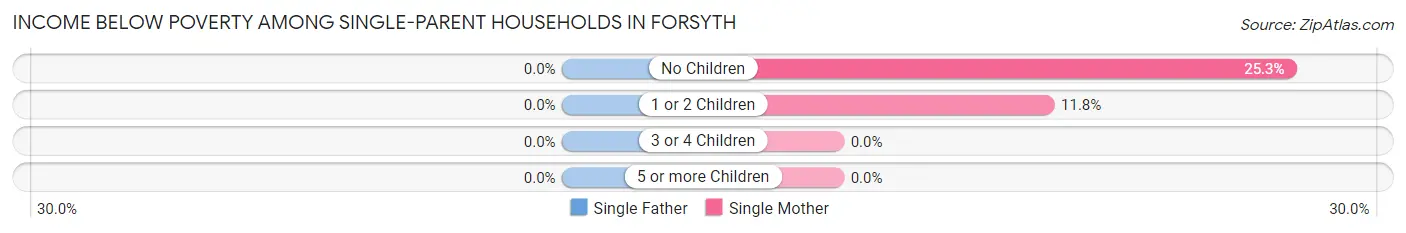
| Children | Single Father | Single Mother |
| No Children | 0 (0.0%) | 22 (25.3%) |
| 1 or 2 Children | 0 (0.0%) | 2 (11.8%) |
| 3 or 4 Children | 0 (0.0%) | 0 (0.0%) |
| 5 or more Children | 0 (0.0%) | 0 (0.0%) |
| Total | 0 (0.0%) | 24 (23.1%) |
Income Below Poverty Among Married-Couple vs Single-Parent Households in Forsyth
The poverty data for Forsyth shows that 44 of the married-couple family households (7.8%) and 24 of the single-parent households (17.4%) are living below the poverty level. Within the married-couple family households, those with 5 or more children have the highest poverty rate, with 1 households (100.0%) falling below the poverty line. Among the single-parent households, those with no children have the highest poverty rate, with 22 household (21.8%) living below poverty.
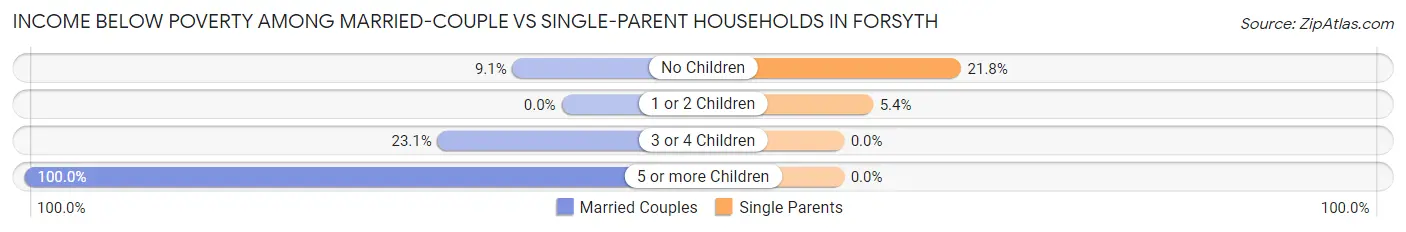
| Children | Married-Couple Families | Single-Parent Households |
| No Children | 40 (9.1%) | 22 (21.8%) |
| 1 or 2 Children | 0 (0.0%) | 2 (5.4%) |
| 3 or 4 Children | 3 (23.1%) | 0 (0.0%) |
| 5 or more Children | 1 (100.0%) | 0 (0.0%) |
| Total | 44 (7.8%) | 24 (17.4%) |
Race in Forsyth
The most populous races in Forsyth are White / Caucasian (2,547 | 93.3%), Two or more Races (102 | 3.7%), and Black / African American (55 | 2.0%).
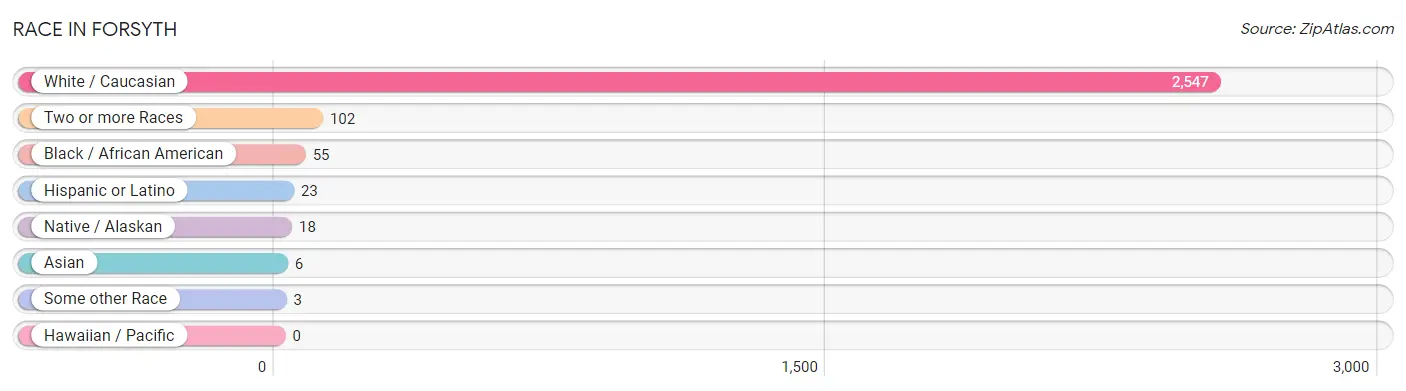
| Race | # Population | % Population |
| Asian | 6 | 0.2% |
| Black / African American | 55 | 2.0% |
| Hawaiian / Pacific | 0 | 0.0% |
| Hispanic or Latino | 23 | 0.8% |
| Native / Alaskan | 18 | 0.7% |
| White / Caucasian | 2,547 | 93.3% |
| Two or more Races | 102 | 3.7% |
| Some other Race | 3 | 0.1% |
| Total | 2,731 | 100.0% |
Ancestry in Forsyth
The most populous ancestries reported in Forsyth are German (529 | 19.4%), Irish (444 | 16.3%), English (422 | 15.4%), American (135 | 4.9%), and French (135 | 4.9%), together accounting for 61.0% of all Forsyth residents.
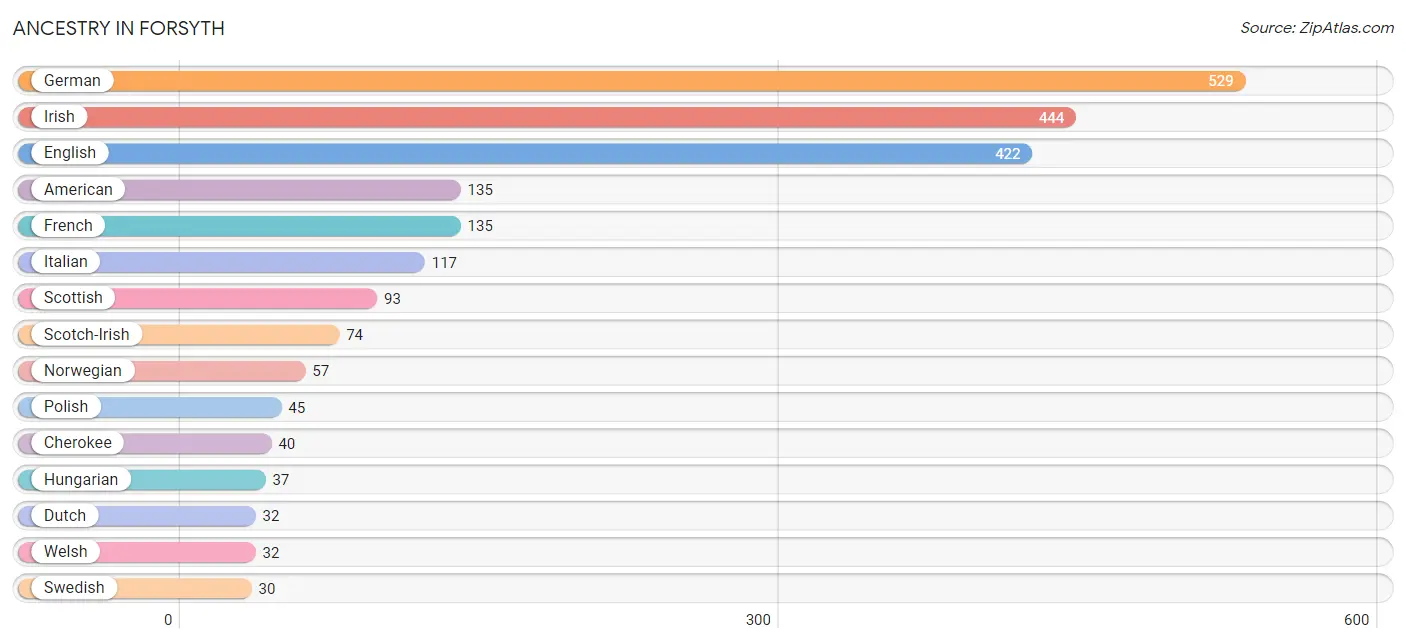
| Ancestry | # Population | % Population |
| African | 9 | 0.3% |
| American | 135 | 4.9% |
| Austrian | 6 | 0.2% |
| Blackfeet | 9 | 0.3% |
| British | 11 | 0.4% |
| Burmese | 15 | 0.5% |
| Cherokee | 40 | 1.5% |
| Czech | 15 | 0.5% |
| Danish | 15 | 0.5% |
| Dutch | 32 | 1.2% |
| Eastern European | 4 | 0.2% |
| English | 422 | 15.4% |
| European | 20 | 0.7% |
| French | 135 | 4.9% |
| French Canadian | 16 | 0.6% |
| German | 529 | 19.4% |
| Greek | 5 | 0.2% |
| Hungarian | 37 | 1.3% |
| Irish | 444 | 16.3% |
| Italian | 117 | 4.3% |
| Mexican | 20 | 0.7% |
| Mexican American Indian | 18 | 0.7% |
| Norwegian | 57 | 2.1% |
| Polish | 45 | 1.7% |
| Russian | 29 | 1.1% |
| Scandinavian | 6 | 0.2% |
| Scotch-Irish | 74 | 2.7% |
| Scottish | 93 | 3.4% |
| Sioux | 7 | 0.3% |
| Spaniard | 3 | 0.1% |
| Sri Lankan | 6 | 0.2% |
| Subsaharan African | 9 | 0.3% |
| Swedish | 30 | 1.1% |
| Ukrainian | 25 | 0.9% |
| Welsh | 32 | 1.2% | View All 35 Rows |
Immigrants in Forsyth
The most numerous immigrant groups reported in Forsyth came from Asia (6 | 0.2%), South Eastern Asia (6 | 0.2%), Vietnam (6 | 0.2%), Central America (3 | 0.1%), and Latin America (3 | 0.1%), together accounting for 0.9% of all Forsyth residents.
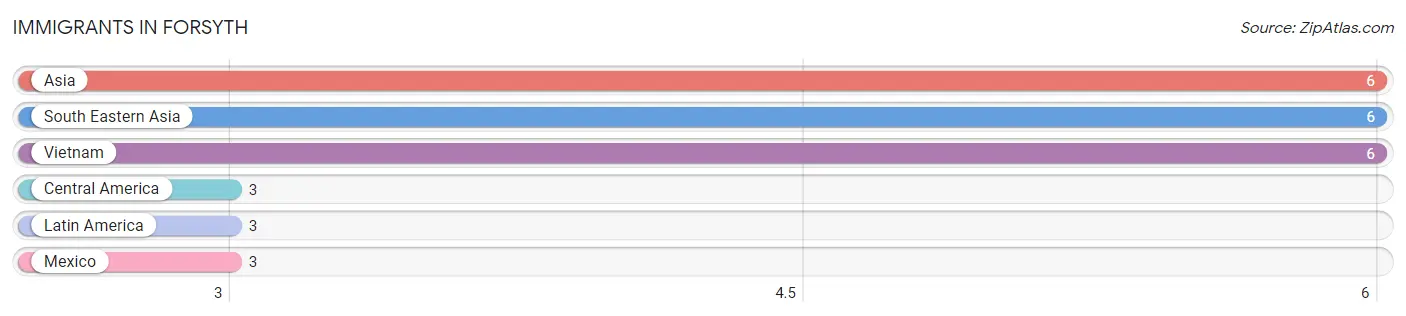
| Immigration Origin | # Population | % Population |
| Asia | 6 | 0.2% |
| Central America | 3 | 0.1% |
| Latin America | 3 | 0.1% |
| Mexico | 3 | 0.1% |
| South Eastern Asia | 6 | 0.2% |
| Vietnam | 6 | 0.2% | View All 6 Rows |
Sex and Age in Forsyth
Sex and Age in Forsyth
The most populous age groups in Forsyth are 85 Years and over (154 | 10.9%) for men and 70 to 74 Years (200 | 15.1%) for women.
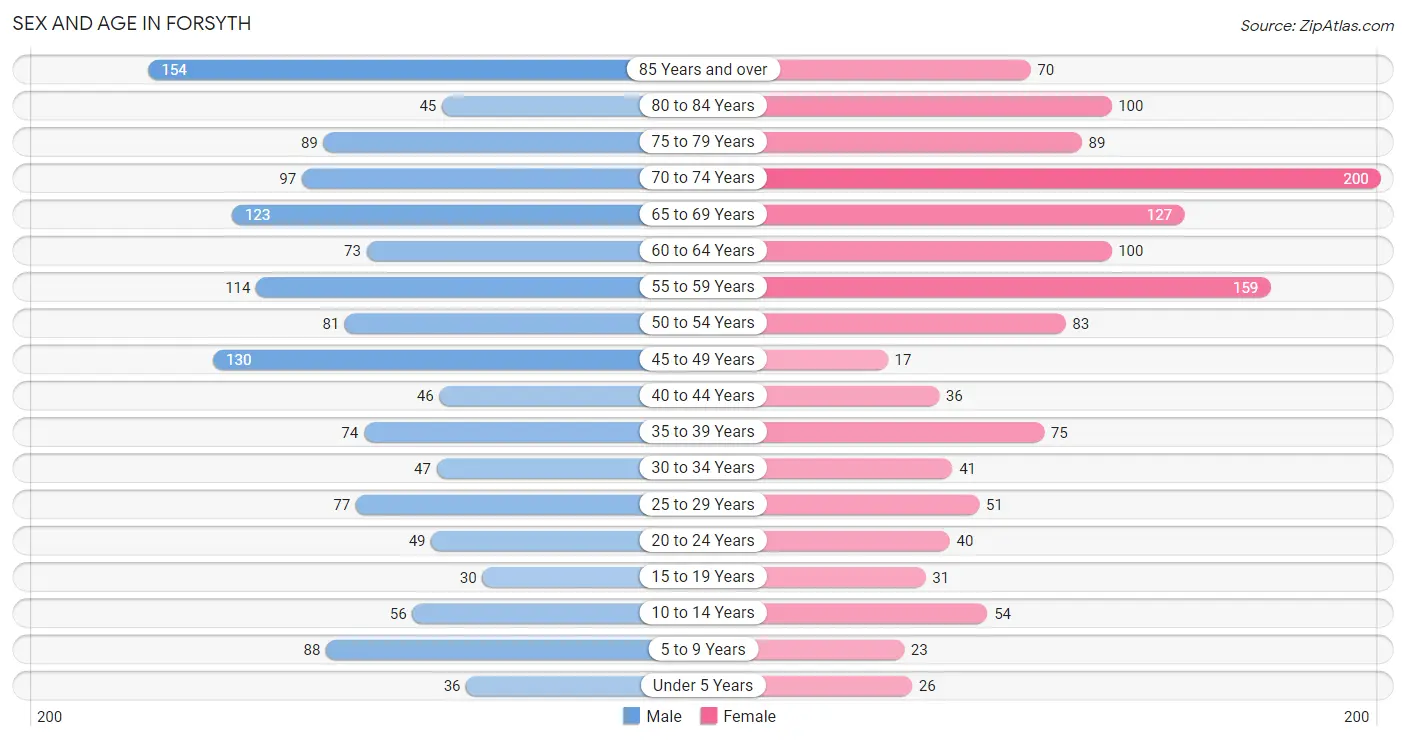
| Age Bracket | Male | Female |
| Under 5 Years | 36 (2.6%) | 26 (2.0%) |
| 5 to 9 Years | 88 (6.2%) | 23 (1.7%) |
| 10 to 14 Years | 56 (4.0%) | 54 (4.1%) |
| 15 to 19 Years | 30 (2.1%) | 31 (2.3%) |
| 20 to 24 Years | 49 (3.5%) | 40 (3.0%) |
| 25 to 29 Years | 77 (5.5%) | 51 (3.9%) |
| 30 to 34 Years | 47 (3.3%) | 41 (3.1%) |
| 35 to 39 Years | 74 (5.2%) | 75 (5.7%) |
| 40 to 44 Years | 46 (3.3%) | 36 (2.7%) |
| 45 to 49 Years | 130 (9.2%) | 17 (1.3%) |
| 50 to 54 Years | 81 (5.8%) | 83 (6.3%) |
| 55 to 59 Years | 114 (8.1%) | 159 (12.0%) |
| 60 to 64 Years | 73 (5.2%) | 100 (7.6%) |
| 65 to 69 Years | 123 (8.7%) | 127 (9.6%) |
| 70 to 74 Years | 97 (6.9%) | 200 (15.1%) |
| 75 to 79 Years | 89 (6.3%) | 89 (6.7%) |
| 80 to 84 Years | 45 (3.2%) | 100 (7.6%) |
| 85 Years and over | 154 (10.9%) | 70 (5.3%) |
| Total | 1,409 (100.0%) | 1,322 (100.0%) |
Families and Households in Forsyth
Median Family Size in Forsyth
The median family size in Forsyth is 2.51 persons per family, with single male/father families (34 | 4.8%) accounting for the largest median family size of 2.97 persons per family. On the other hand, married-couple families (564 | 80.3%) represent the smallest median family size with 2.39 persons per family.
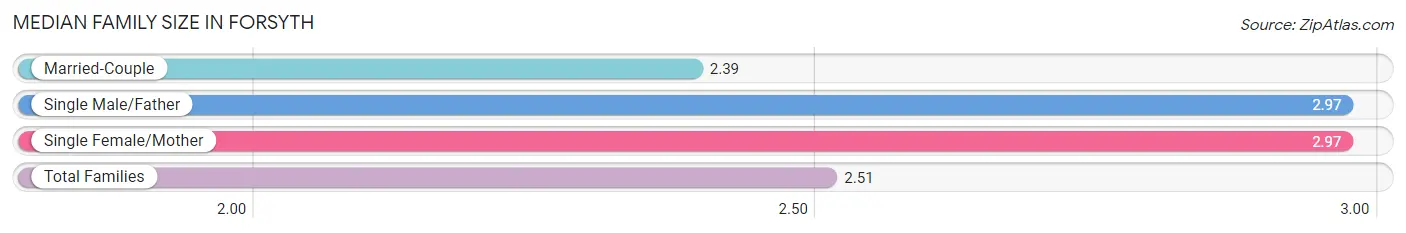
| Family Type | # Families | Family Size |
| Married-Couple | 564 (80.3%) | 2.39 |
| Single Male/Father | 34 (4.8%) | 2.97 |
| Single Female/Mother | 104 (14.8%) | 2.97 |
| Total Families | 702 (100.0%) | 2.51 |
Median Household Size in Forsyth
The median household size in Forsyth is 1.92 persons per household, with single female/mother households (104 | 8.0%) accounting for the largest median household size of 3.39 persons per household. non-family households (606 | 46.3%) represent the smallest median household size with 1.08 persons per household.
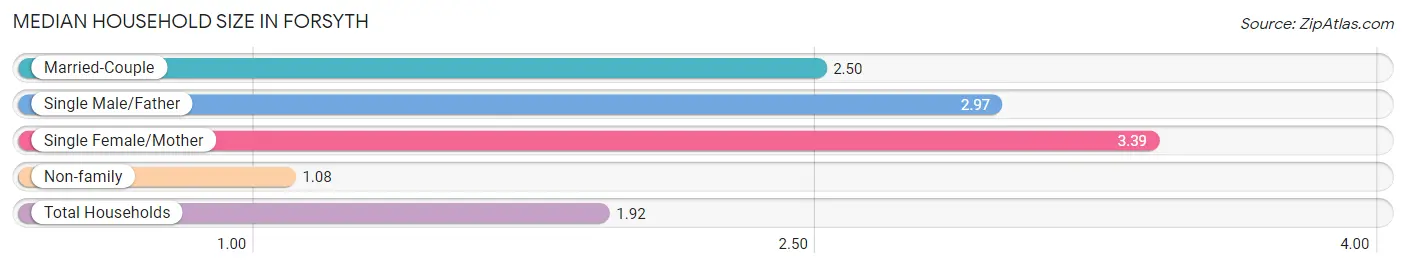
| Household Type | # Households | Household Size |
| Married-Couple | 564 (43.1%) | 2.50 |
| Single Male/Father | 34 (2.6%) | 2.97 |
| Single Female/Mother | 104 (8.0%) | 3.39 |
| Non-family | 606 (46.3%) | 1.08 |
| Total Households | 1,308 (100.0%) | 1.92 |
Household Size by Marriage Status in Forsyth
Out of a total of 1,308 households in Forsyth, 702 (53.7%) are family households, while 606 (46.3%) are nonfamily households. The most numerous type of family households are 2-person households, comprising 523, and the most common type of nonfamily households are 1-person households, comprising 567.
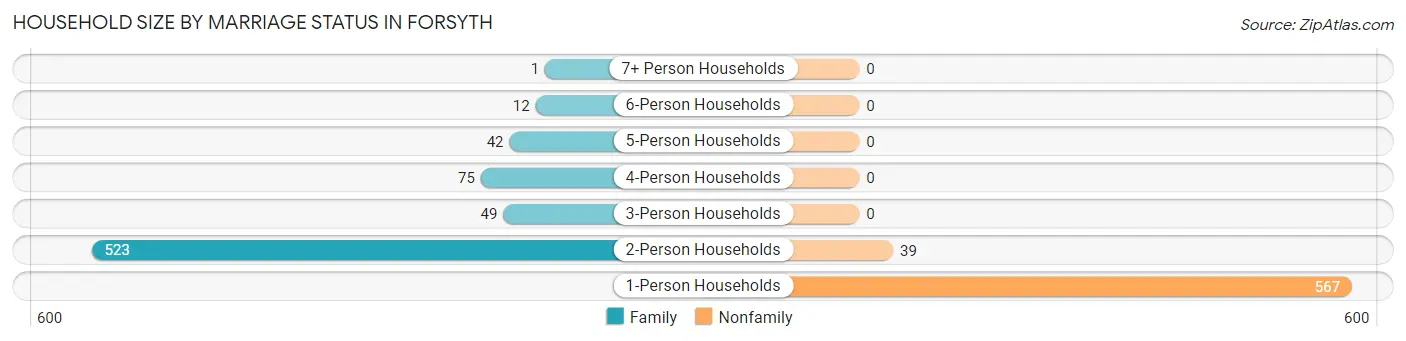
| Household Size | Family Households | Nonfamily Households |
| 1-Person Households | - | 567 (43.3%) |
| 2-Person Households | 523 (40.0%) | 39 (3.0%) |
| 3-Person Households | 49 (3.7%) | 0 (0.0%) |
| 4-Person Households | 75 (5.7%) | 0 (0.0%) |
| 5-Person Households | 42 (3.2%) | 0 (0.0%) |
| 6-Person Households | 12 (0.9%) | 0 (0.0%) |
| 7+ Person Households | 1 (0.1%) | 0 (0.0%) |
| Total | 702 (53.7%) | 606 (46.3%) |
Female Fertility in Forsyth
Fertility by Age in Forsyth
Average fertility rate in Forsyth is 61.0 births per 1,000 women. Women in the age bracket of 20 to 34 years have the highest fertility rate with 129.0 births per 1,000 women. Women in the age bracket of 20 to 34 years acount for 80.9% of all women with births.
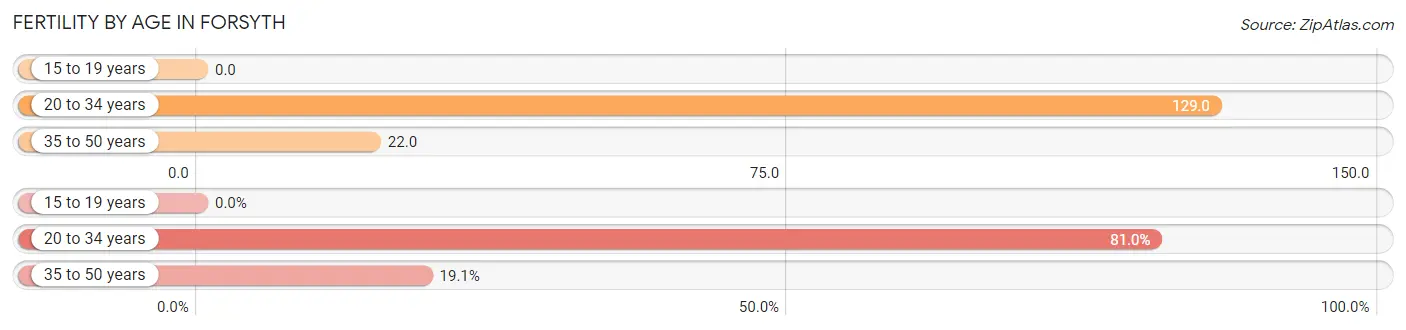
| Age Bracket | Women with Births | Births / 1,000 Women |
| 15 to 19 years | 0 (0.0%) | 0.0 |
| 20 to 34 years | 17 (80.9%) | 129.0 |
| 35 to 50 years | 4 (19.1%) | 22.0 |
| Total | 21 (100.0%) | 61.0 |
Fertility by Age by Marriage Status in Forsyth
71.4% of women with births (21) in Forsyth are married. The highest percentage of unmarried women with births falls into 20 to 34 years age bracket with 35.3% of them unmarried at the time of birth, while the lowest percentage of unmarried women with births belong to 35 to 50 years age bracket with 0.0% of them unmarried.
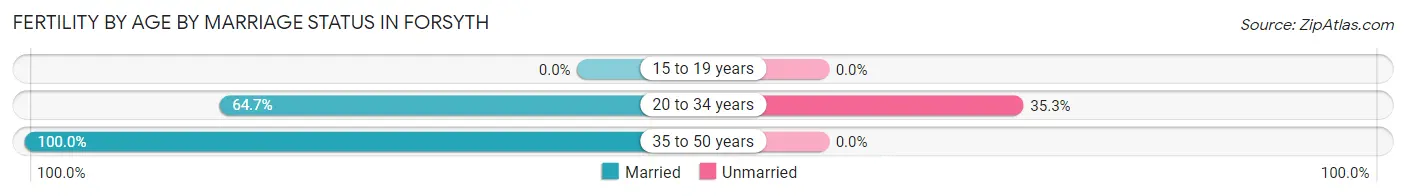
| Age Bracket | Married | Unmarried |
| 15 to 19 years | 0 (0.0%) | 0 (0.0%) |
| 20 to 34 years | 11 (64.7%) | 6 (35.3%) |
| 35 to 50 years | 4 (100.0%) | 0 (0.0%) |
| Total | 15 (71.4%) | 6 (28.6%) |
Fertility by Education in Forsyth
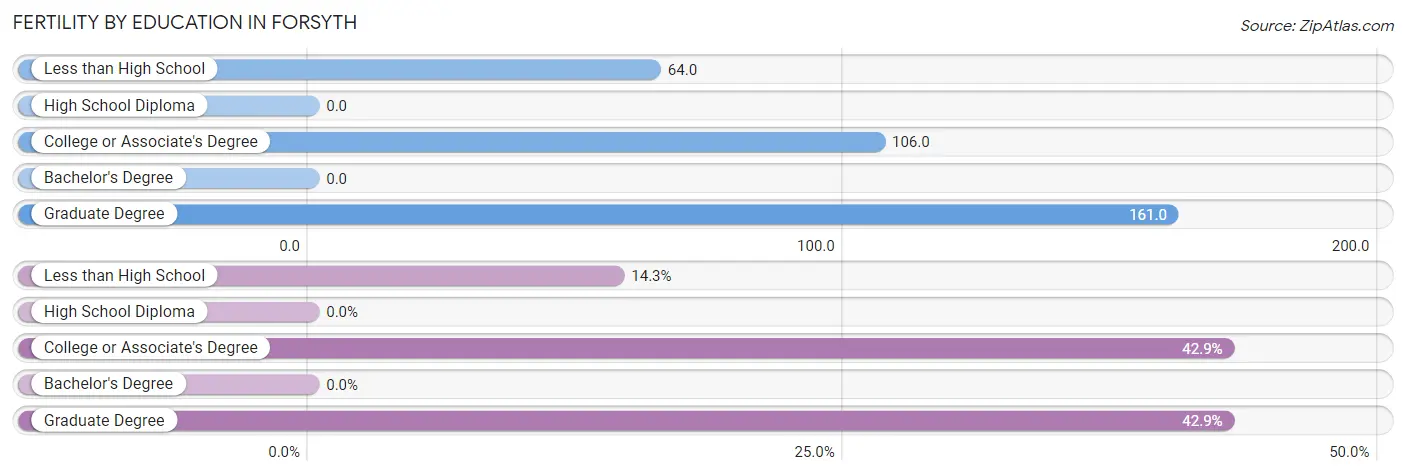
| Educational Attainment | Women with Births | Births / 1,000 Women |
| Less than High School | 3 (14.3%) | 64.0 |
| High School Diploma | 0 (0.0%) | 0.0 |
| College or Associate's Degree | 9 (42.9%) | 106.0 |
| Bachelor's Degree | 0 (0.0%) | 0.0 |
| Graduate Degree | 9 (42.9%) | 161.0 |
| Total | 21 (100.0%) | 61.0 |
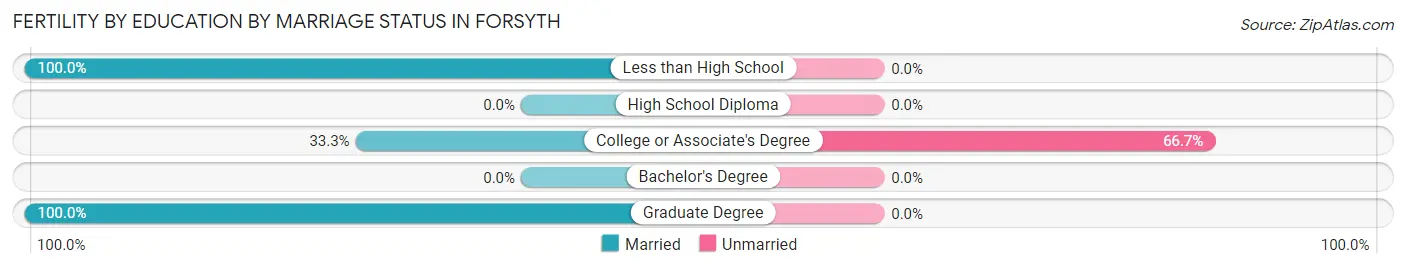
Fertility by Education by Marriage Status in Forsyth
28.6% of women with births in Forsyth are unmarried. Women with the educational attainment of less than high school are most likely to be married with 100.0% of them married at childbirth, while women with the educational attainment of college or associate's degree are least likely to be married with 66.7% of them unmarried at childbirth.
| Educational Attainment | Married | Unmarried |
| Less than High School | 3 (100.0%) | 0 (0.0%) |
| High School Diploma | 0 (0.0%) | 0 (0.0%) |
| College or Associate's Degree | 3 (33.3%) | 6 (66.7%) |
| Bachelor's Degree | 0 (0.0%) | 0 (0.0%) |
| Graduate Degree | 9 (100.0%) | 0 (0.0%) |
| Total | 15 (71.4%) | 6 (28.6%) |
Employment Characteristics in Forsyth
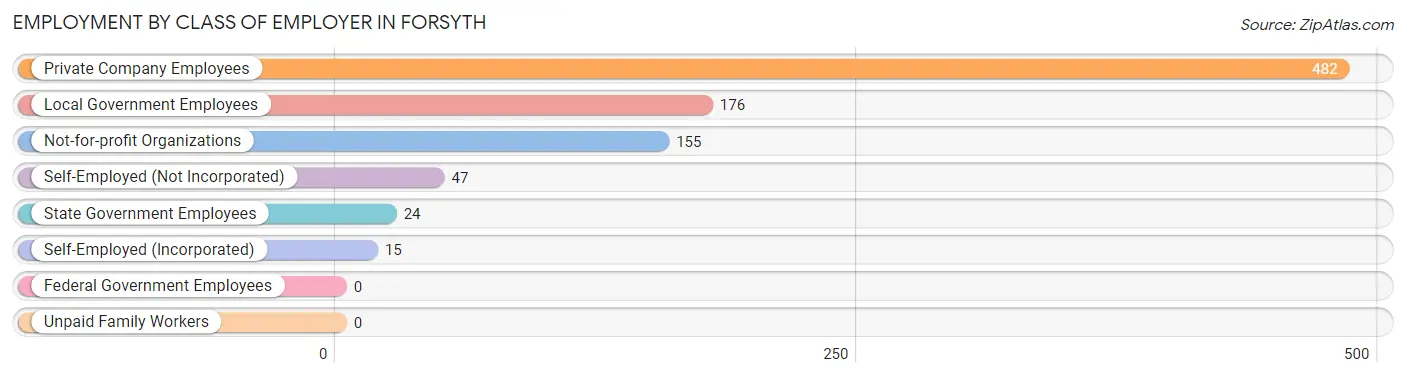
Employment by Class of Employer in Forsyth
Among the 899 employed individuals in Forsyth, private company employees (482 | 53.6%), local government employees (176 | 19.6%), and not-for-profit organizations (155 | 17.2%) make up the most common classes of employment.
| Employer Class | # Employees | % Employees |
| Private Company Employees | 482 | 53.6% |
| Self-Employed (Incorporated) | 15 | 1.7% |
| Self-Employed (Not Incorporated) | 47 | 5.2% |
| Not-for-profit Organizations | 155 | 17.2% |
| Local Government Employees | 176 | 19.6% |
| State Government Employees | 24 | 2.7% |
| Federal Government Employees | 0 | 0.0% |
| Unpaid Family Workers | 0 | 0.0% |
| Total | 899 | 100.0% |
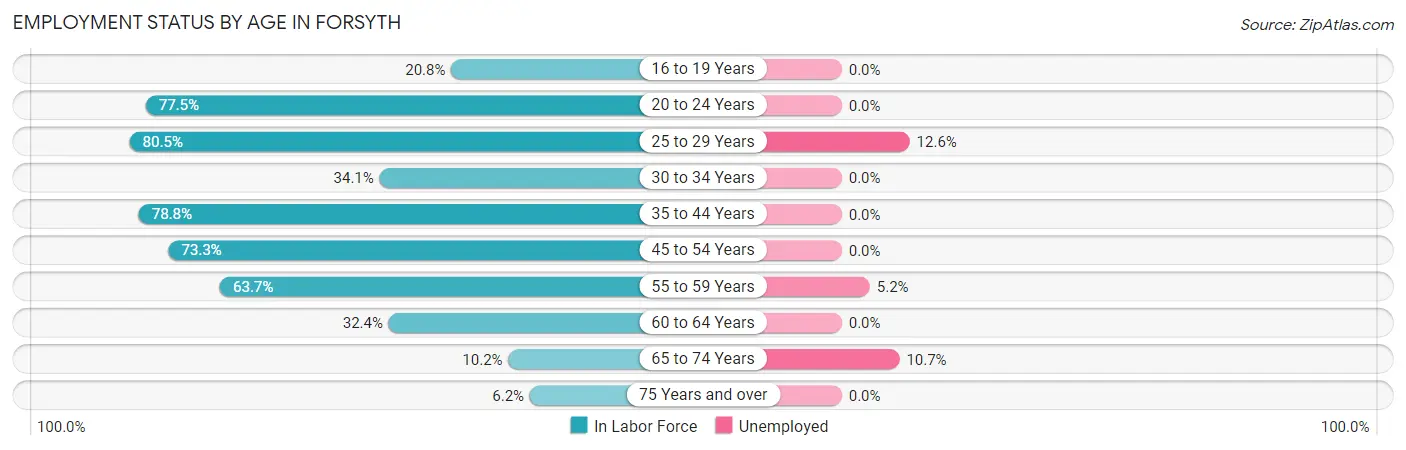
Employment Status by Age in Forsyth
According to the labor force statistics for Forsyth, out of the total population over 16 years of age (2,440), 38.6% or 942 individuals are in the labor force, with 3.0% or 28 of them unemployed. The age group with the highest labor force participation rate is 25 to 29 years, with 80.5% or 103 individuals in the labor force. Within the labor force, the 25 to 29 years age range has the highest percentage of unemployed individuals, with 12.6% or 13 of them being unemployed.
| Age Bracket | In Labor Force | Unemployed |
| 16 to 19 Years | 11 (20.8%) | 0 (0.0%) |
| 20 to 24 Years | 69 (77.5%) | 0 (0.0%) |
| 25 to 29 Years | 103 (80.5%) | 13 (12.6%) |
| 30 to 34 Years | 30 (34.1%) | 0 (0.0%) |
| 35 to 44 Years | 182 (78.8%) | 0 (0.0%) |
| 45 to 54 Years | 228 (73.3%) | 0 (0.0%) |
| 55 to 59 Years | 174 (63.7%) | 9 (5.2%) |
| 60 to 64 Years | 56 (32.4%) | 0 (0.0%) |
| 65 to 74 Years | 56 (10.2%) | 6 (10.7%) |
| 75 Years and over | 34 (6.2%) | 0 (0.0%) |
| Total | 942 (38.6%) | 28 (3.0%) |
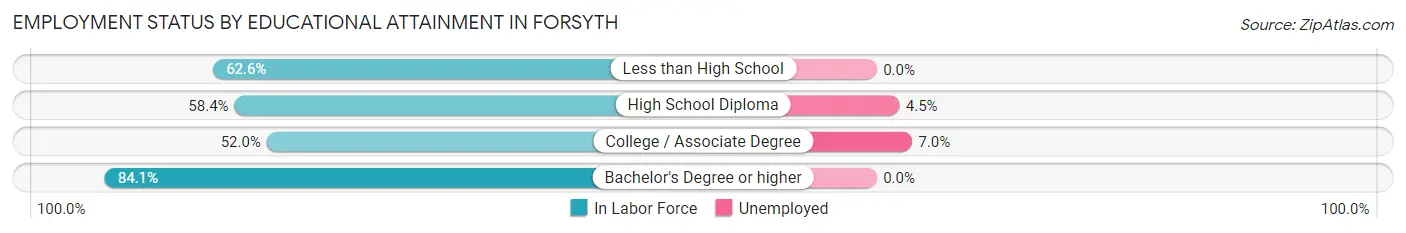
Employment Status by Educational Attainment in Forsyth
According to labor force statistics for Forsyth, 64.2% of individuals (773) out of the total population between 25 and 64 years of age (1,204) are in the labor force, with 2.8% or 22 of them being unemployed. The group with the highest labor force participation rate are those with the educational attainment of bachelor's degree or higher, with 84.1% or 280 individuals in the labor force. Within the labor force, individuals with college / associate degree education have the highest percentage of unemployment, with 7.0% or 13 of them being unemployed.
| Educational Attainment | In Labor Force | Unemployed |
| Less than High School | 107 (62.6%) | 0 (0.0%) |
| High School Diploma | 201 (58.4%) | 15 (4.5%) |
| College / Associate Degree | 185 (52.0%) | 25 (7.0%) |
| Bachelor's Degree or higher | 280 (84.1%) | 0 (0.0%) |
| Total | 773 (64.2%) | 34 (2.8%) |
Employment Occupations by Sex in Forsyth
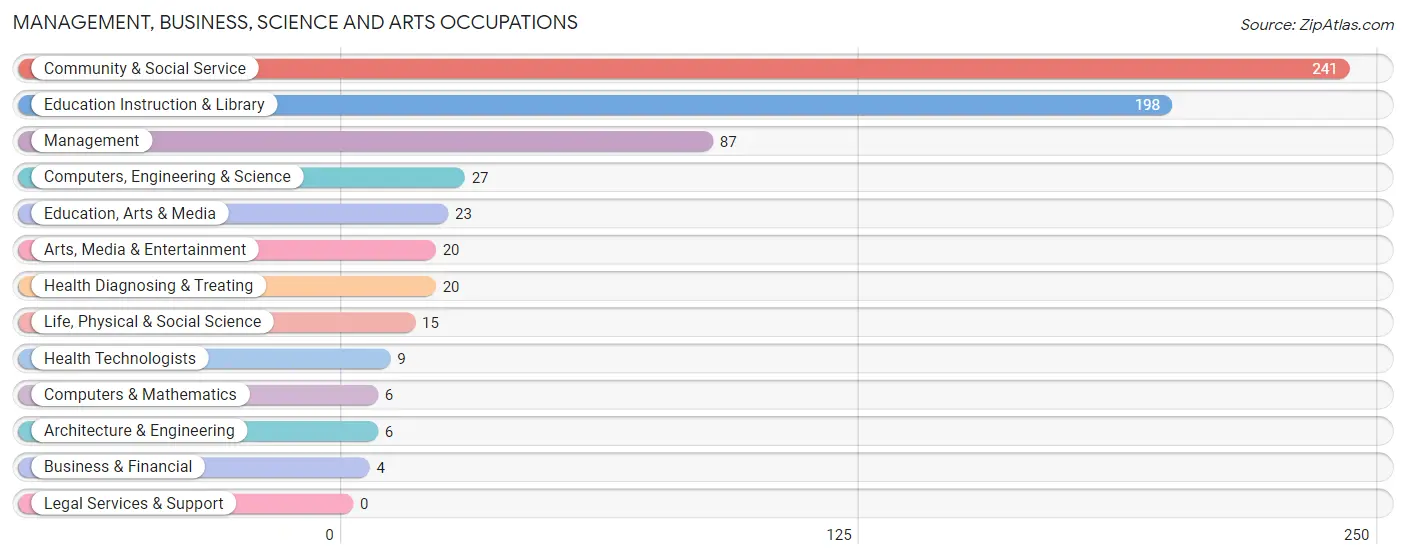
Management, Business, Science and Arts Occupations
The most common Management, Business, Science and Arts occupations in Forsyth are Community & Social Service (241 | 26.3%), Education Instruction & Library (198 | 21.6%), Management (87 | 9.5%), Computers, Engineering & Science (27 | 2.9%), and Education, Arts & Media (23 | 2.5%).
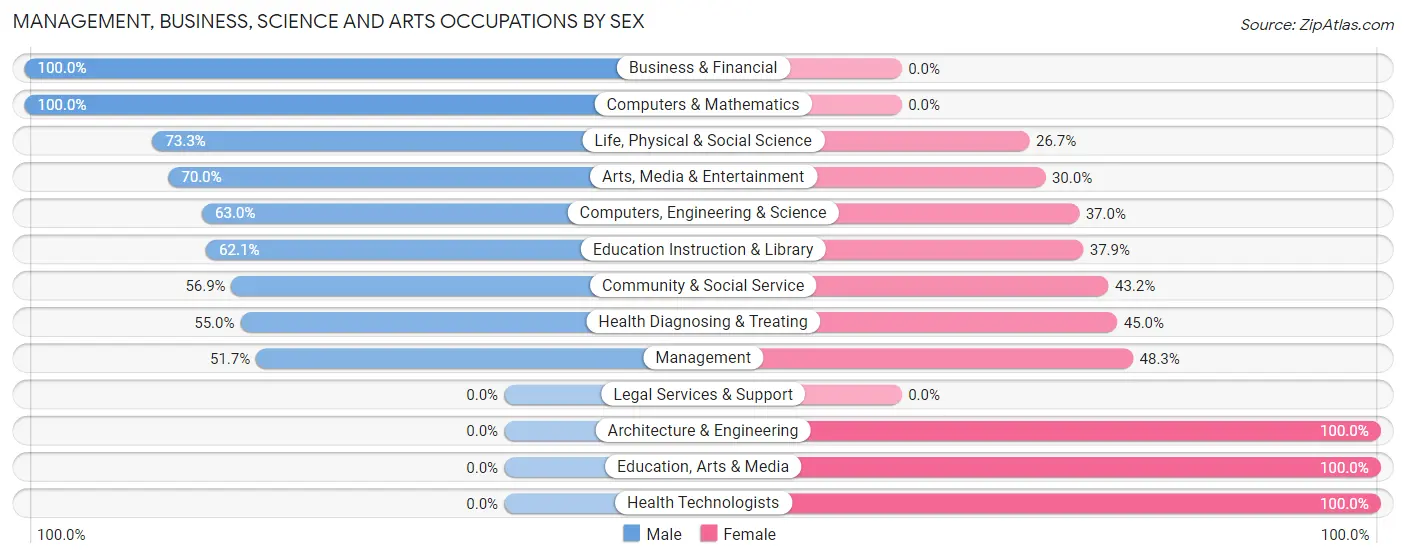
Management, Business, Science and Arts Occupations by Sex
Within the Management, Business, Science and Arts occupations in Forsyth, the most male-oriented occupations are Business & Financial (100.0%), Computers & Mathematics (100.0%), and Life, Physical & Social Science (73.3%), while the most female-oriented occupations are Architecture & Engineering (100.0%), Education, Arts & Media (100.0%), and Health Technologists (100.0%).
| Occupation | Male | Female |
| Management | 45 (51.7%) | 42 (48.3%) |
| Business & Financial | 4 (100.0%) | 0 (0.0%) |
| Computers, Engineering & Science | 17 (63.0%) | 10 (37.0%) |
| Computers & Mathematics | 6 (100.0%) | 0 (0.0%) |
| Architecture & Engineering | 0 (0.0%) | 6 (100.0%) |
| Life, Physical & Social Science | 11 (73.3%) | 4 (26.7%) |
| Community & Social Service | 137 (56.9%) | 104 (43.1%) |
| Education, Arts & Media | 0 (0.0%) | 23 (100.0%) |
| Legal Services & Support | 0 (0.0%) | 0 (0.0%) |
| Education Instruction & Library | 123 (62.1%) | 75 (37.9%) |
| Arts, Media & Entertainment | 14 (70.0%) | 6 (30.0%) |
| Health Diagnosing & Treating | 11 (55.0%) | 9 (45.0%) |
| Health Technologists | 0 (0.0%) | 9 (100.0%) |
| Total (Category) | 214 (56.5%) | 165 (43.5%) |
| Total (Overall) | 462 (50.5%) | 453 (49.5%) |
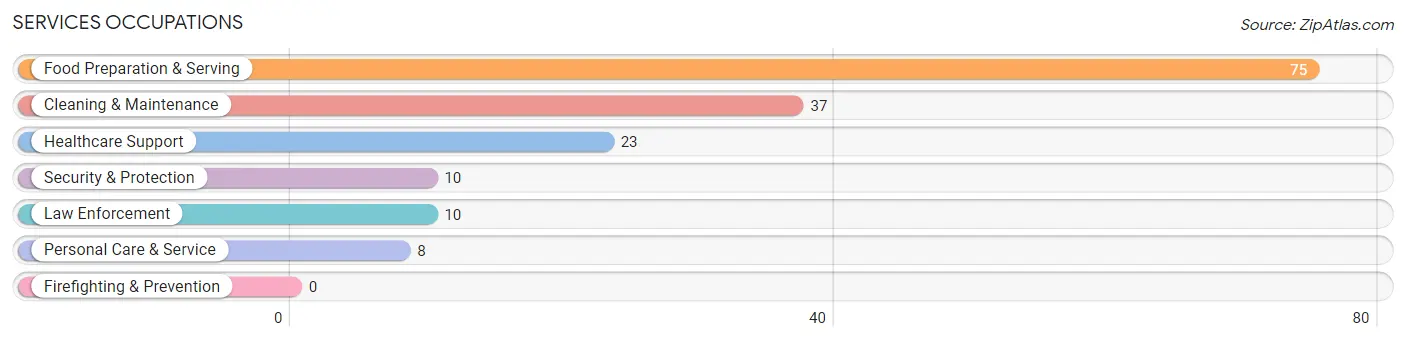
Services Occupations
The most common Services occupations in Forsyth are Food Preparation & Serving (75 | 8.2%), Cleaning & Maintenance (37 | 4.0%), Healthcare Support (23 | 2.5%), Security & Protection (10 | 1.1%), and Law Enforcement (10 | 1.1%).
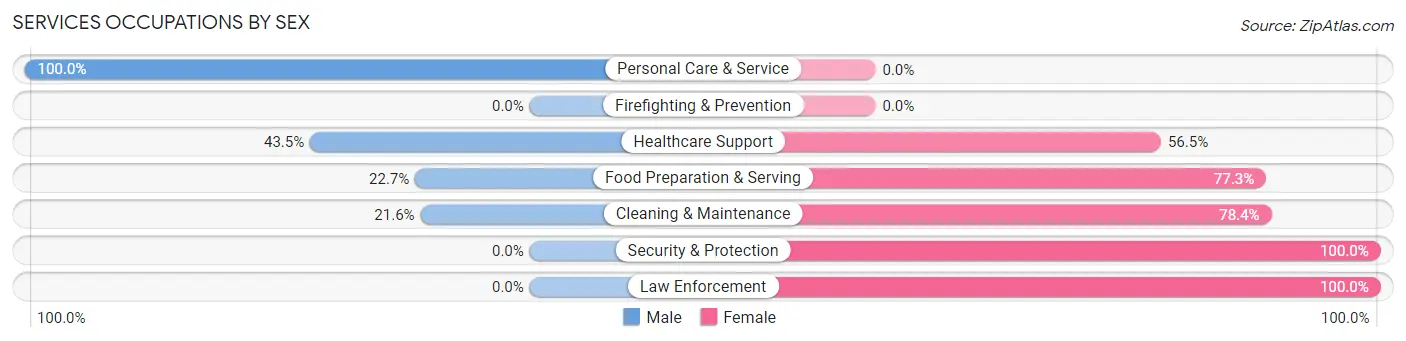
Services Occupations by Sex
Within the Services occupations in Forsyth, the most male-oriented occupations are Personal Care & Service (100.0%), Healthcare Support (43.5%), and Food Preparation & Serving (22.7%), while the most female-oriented occupations are Security & Protection (100.0%), Law Enforcement (100.0%), and Cleaning & Maintenance (78.4%).
| Occupation | Male | Female |
| Healthcare Support | 10 (43.5%) | 13 (56.5%) |
| Security & Protection | 0 (0.0%) | 10 (100.0%) |
| Firefighting & Prevention | 0 (0.0%) | 0 (0.0%) |
| Law Enforcement | 0 (0.0%) | 10 (100.0%) |
| Food Preparation & Serving | 17 (22.7%) | 58 (77.3%) |
| Cleaning & Maintenance | 8 (21.6%) | 29 (78.4%) |
| Personal Care & Service | 8 (100.0%) | 0 (0.0%) |
| Total (Category) | 43 (28.1%) | 110 (71.9%) |
| Total (Overall) | 462 (50.5%) | 453 (49.5%) |
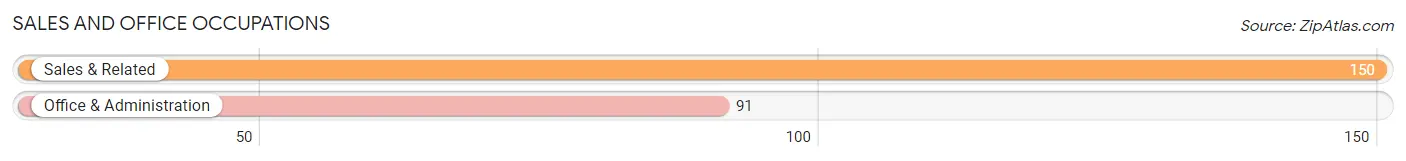
Sales and Office Occupations
The most common Sales and Office occupations in Forsyth are Sales & Related (150 | 16.4%), and Office & Administration (91 | 10.0%).
Sales and Office Occupations by Sex
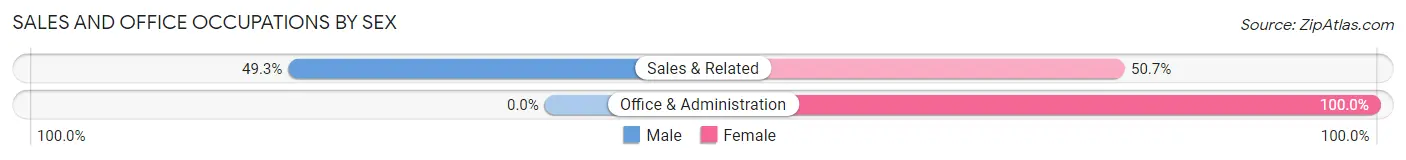
| Occupation | Male | Female |
| Sales & Related | 74 (49.3%) | 76 (50.7%) |
| Office & Administration | 0 (0.0%) | 91 (100.0%) |
| Total (Category) | 74 (30.7%) | 167 (69.3%) |
| Total (Overall) | 462 (50.5%) | 453 (49.5%) |
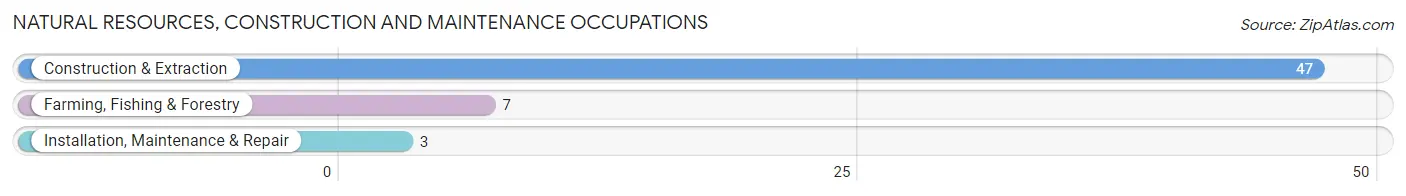
Natural Resources, Construction and Maintenance Occupations
The most common Natural Resources, Construction and Maintenance occupations in Forsyth are Construction & Extraction (47 | 5.1%), Farming, Fishing & Forestry (7 | 0.8%), and Installation, Maintenance & Repair (3 | 0.3%).
Natural Resources, Construction and Maintenance Occupations by Sex
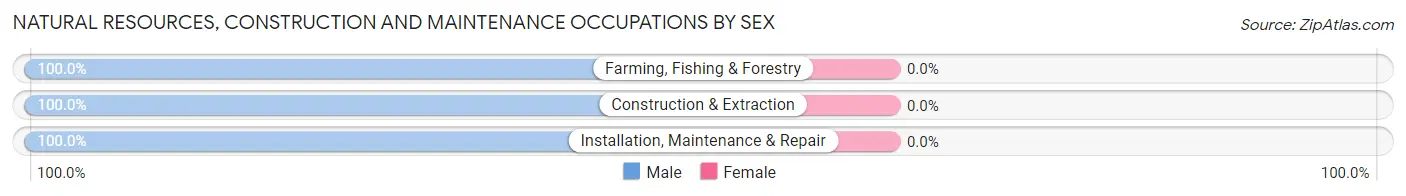
| Occupation | Male | Female |
| Farming, Fishing & Forestry | 7 (100.0%) | 0 (0.0%) |
| Construction & Extraction | 47 (100.0%) | 0 (0.0%) |
| Installation, Maintenance & Repair | 3 (100.0%) | 0 (0.0%) |
| Total (Category) | 57 (100.0%) | 0 (0.0%) |
| Total (Overall) | 462 (50.5%) | 453 (49.5%) |
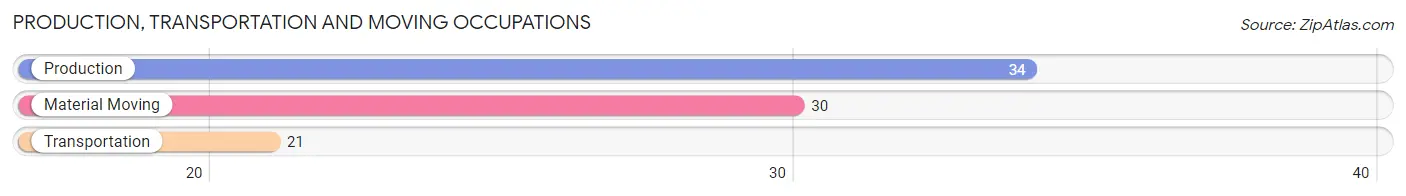
Production, Transportation and Moving Occupations
The most common Production, Transportation and Moving occupations in Forsyth are Production (34 | 3.7%), Material Moving (30 | 3.3%), and Transportation (21 | 2.3%).
Production, Transportation and Moving Occupations by Sex
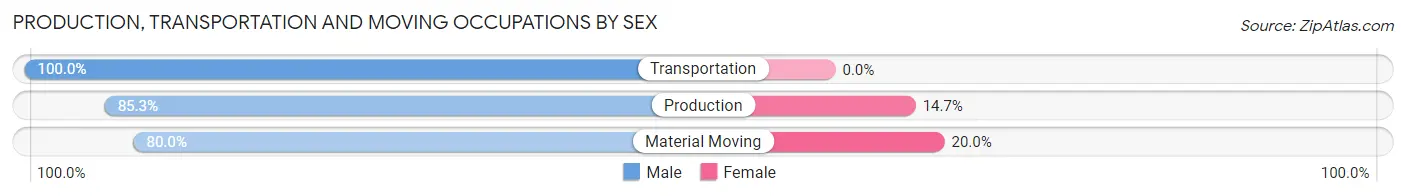
| Occupation | Male | Female |
| Production | 29 (85.3%) | 5 (14.7%) |
| Transportation | 21 (100.0%) | 0 (0.0%) |
| Material Moving | 24 (80.0%) | 6 (20.0%) |
| Total (Category) | 74 (87.1%) | 11 (12.9%) |
| Total (Overall) | 462 (50.5%) | 453 (49.5%) |
Employment Industries by Sex in Forsyth
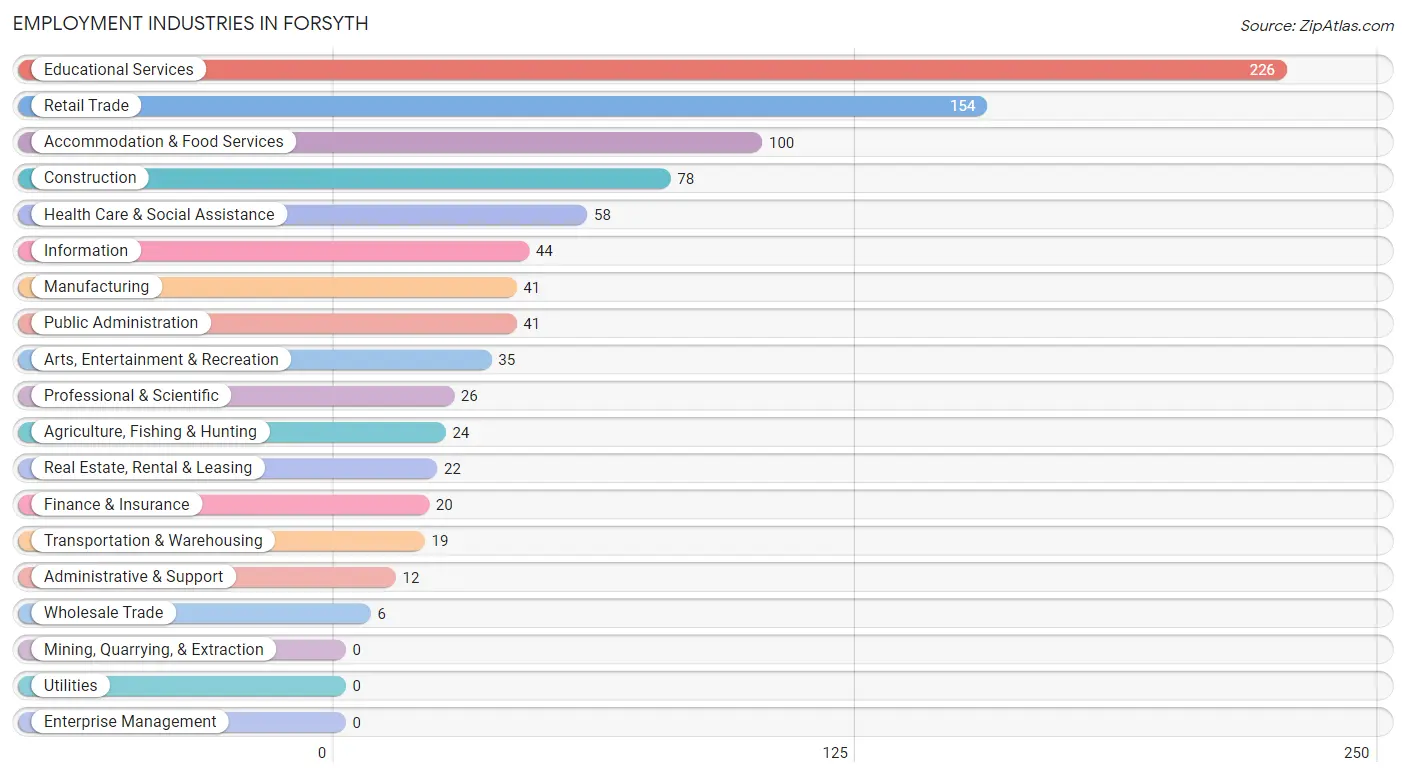
Employment Industries in Forsyth
The major employment industries in Forsyth include Educational Services (226 | 24.7%), Retail Trade (154 | 16.8%), Accommodation & Food Services (100 | 10.9%), Construction (78 | 8.5%), and Health Care & Social Assistance (58 | 6.3%).
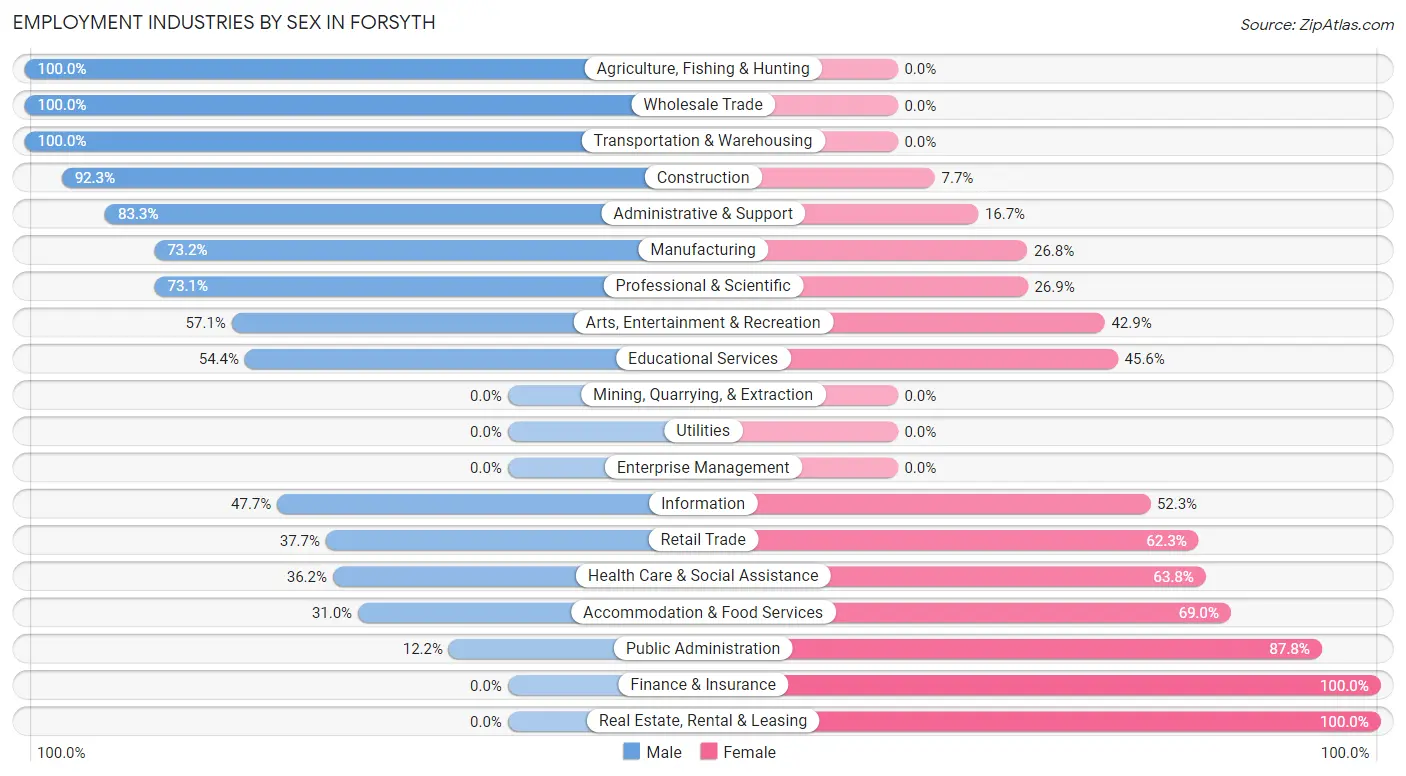
Employment Industries by Sex in Forsyth
The Forsyth industries that see more men than women are Agriculture, Fishing & Hunting (100.0%), Wholesale Trade (100.0%), and Transportation & Warehousing (100.0%), whereas the industries that tend to have a higher number of women are Finance & Insurance (100.0%), Real Estate, Rental & Leasing (100.0%), and Public Administration (87.8%).
| Industry | Male | Female |
| Agriculture, Fishing & Hunting | 24 (100.0%) | 0 (0.0%) |
| Mining, Quarrying, & Extraction | 0 (0.0%) | 0 (0.0%) |
| Construction | 72 (92.3%) | 6 (7.7%) |
| Manufacturing | 30 (73.2%) | 11 (26.8%) |
| Wholesale Trade | 6 (100.0%) | 0 (0.0%) |
| Retail Trade | 58 (37.7%) | 96 (62.3%) |
| Transportation & Warehousing | 19 (100.0%) | 0 (0.0%) |
| Utilities | 0 (0.0%) | 0 (0.0%) |
| Information | 21 (47.7%) | 23 (52.3%) |
| Finance & Insurance | 0 (0.0%) | 20 (100.0%) |
| Real Estate, Rental & Leasing | 0 (0.0%) | 22 (100.0%) |
| Professional & Scientific | 19 (73.1%) | 7 (26.9%) |
| Enterprise Management | 0 (0.0%) | 0 (0.0%) |
| Administrative & Support | 10 (83.3%) | 2 (16.7%) |
| Educational Services | 123 (54.4%) | 103 (45.6%) |
| Health Care & Social Assistance | 21 (36.2%) | 37 (63.8%) |
| Arts, Entertainment & Recreation | 20 (57.1%) | 15 (42.9%) |
| Accommodation & Food Services | 31 (31.0%) | 69 (69.0%) |
| Public Administration | 5 (12.2%) | 36 (87.8%) |
| Total | 462 (50.5%) | 453 (49.5%) |
Education in Forsyth
School Enrollment in Forsyth
The most common levels of schooling among the 312 students in Forsyth are elementary school (102 | 32.7%), middle school (80 | 25.6%), and college / undergraduate (56 | 17.9%).
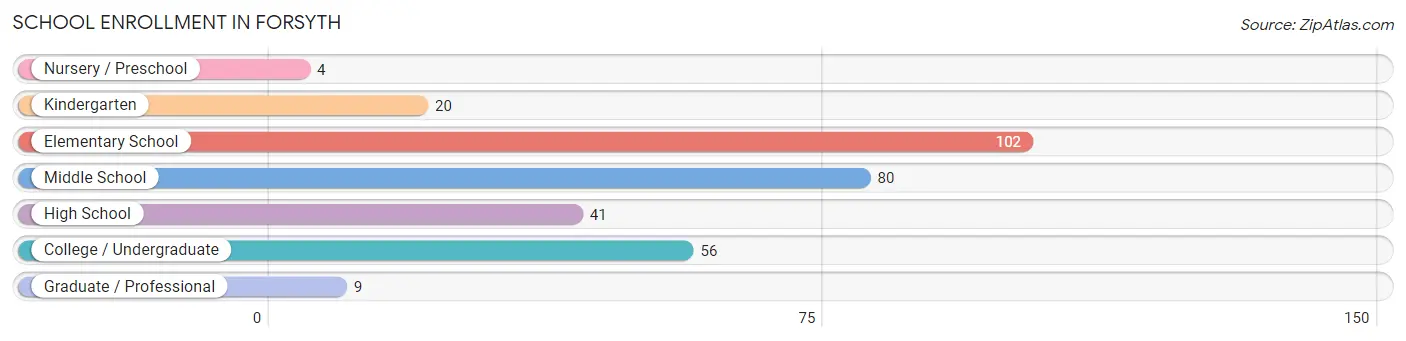
| School Level | # Students | % Students |
| Nursery / Preschool | 4 | 1.3% |
| Kindergarten | 20 | 6.4% |
| Elementary School | 102 | 32.7% |
| Middle School | 80 | 25.6% |
| High School | 41 | 13.1% |
| College / Undergraduate | 56 | 17.9% |
| Graduate / Professional | 9 | 2.9% |
| Total | 312 | 100.0% |
School Enrollment by Age by Funding Source in Forsyth
Out of a total of 312 students who are enrolled in schools in Forsyth, 67 (21.5%) attend a private institution, while the remaining 245 (78.5%) are enrolled in public schools. The age group of 10 to 14 year olds has the highest likelihood of being enrolled in private schools, with 34 (33.0% in the age bracket) enrolled. Conversely, the age group of 3 to 4 year olds has the lowest likelihood of being enrolled in a private school, with 4 (100.0% in the age bracket) attending a public institution.
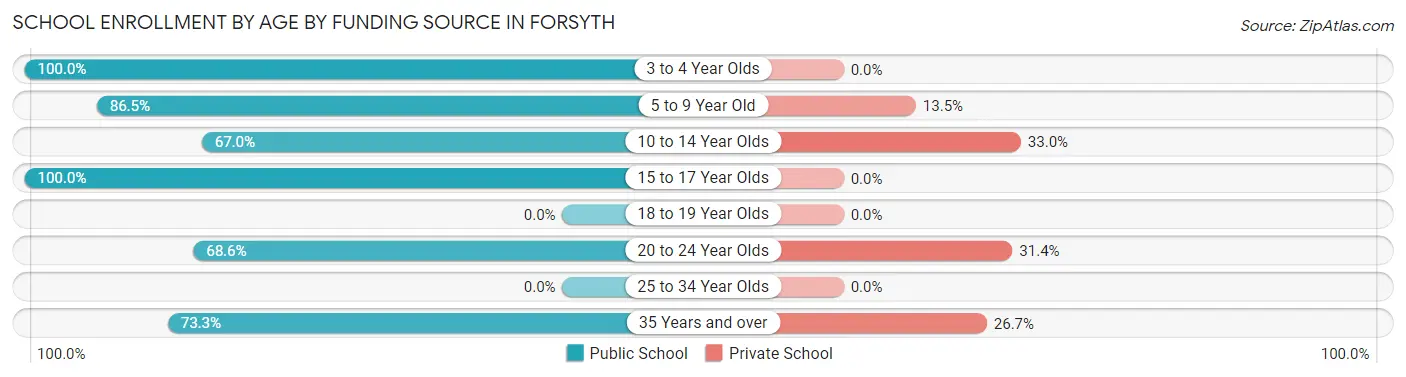
| Age Bracket | Public School | Private School |
| 3 to 4 Year Olds | 4 (100.0%) | 0 (0.0%) |
| 5 to 9 Year Old | 90 (86.5%) | 14 (13.5%) |
| 10 to 14 Year Olds | 69 (67.0%) | 34 (33.0%) |
| 15 to 17 Year Olds | 36 (100.0%) | 0 (0.0%) |
| 18 to 19 Year Olds | 0 (0.0%) | 0 (0.0%) |
| 20 to 24 Year Olds | 24 (68.6%) | 11 (31.4%) |
| 25 to 34 Year Olds | 0 (0.0%) | 0 (0.0%) |
| 35 Years and over | 22 (73.3%) | 8 (26.7%) |
| Total | 245 (78.5%) | 67 (21.5%) |
Educational Attainment by Field of Study in Forsyth
Education (276 | 45.6%), business (88 | 14.5%), arts & humanities (44 | 7.3%), computers & mathematics (43 | 7.1%), and psychology (36 | 5.9%) are the most common fields of study among 605 individuals in Forsyth who have obtained a bachelor's degree or higher.
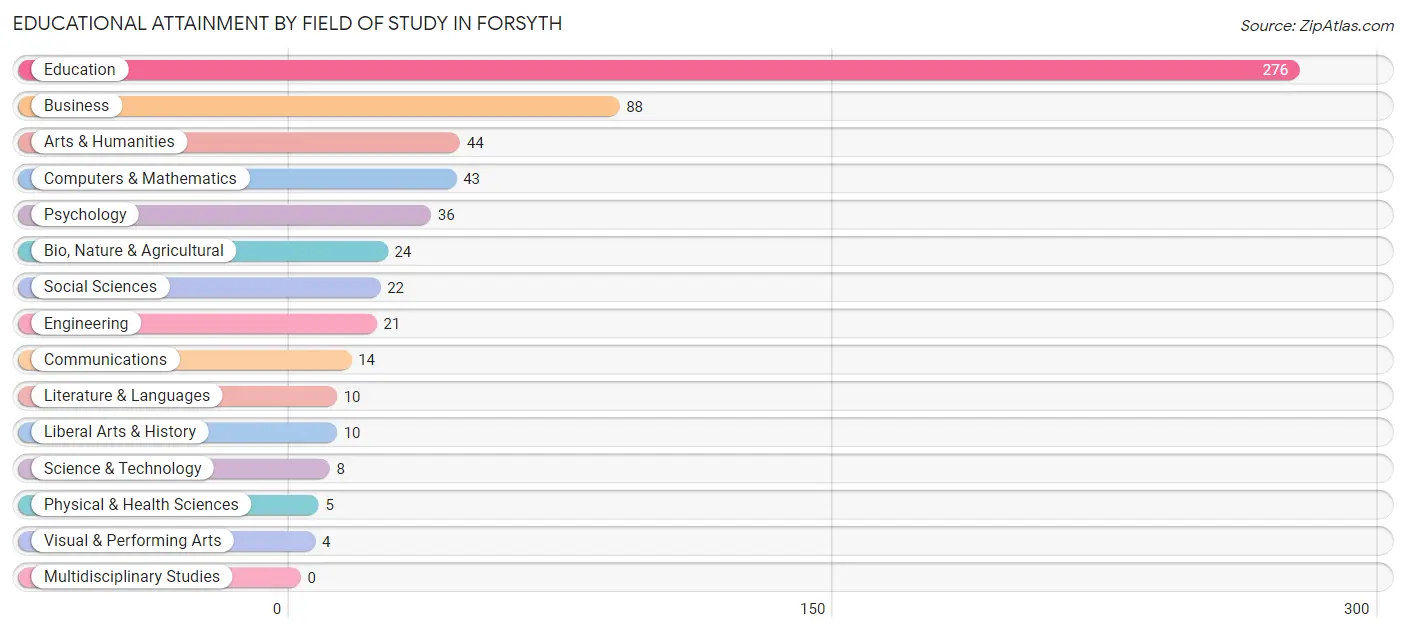
| Field of Study | # Graduates | % Graduates |
| Computers & Mathematics | 43 | 7.1% |
| Bio, Nature & Agricultural | 24 | 4.0% |
| Physical & Health Sciences | 5 | 0.8% |
| Psychology | 36 | 5.9% |
| Social Sciences | 22 | 3.6% |
| Engineering | 21 | 3.5% |
| Multidisciplinary Studies | 0 | 0.0% |
| Science & Technology | 8 | 1.3% |
| Business | 88 | 14.5% |
| Education | 276 | 45.6% |
| Literature & Languages | 10 | 1.7% |
| Liberal Arts & History | 10 | 1.7% |
| Visual & Performing Arts | 4 | 0.7% |
| Communications | 14 | 2.3% |
| Arts & Humanities | 44 | 7.3% |
| Total | 605 | 100.0% |
Transportation & Commute in Forsyth
Vehicle Availability by Sex in Forsyth
The most prevalent vehicle ownership categories in Forsyth are males with 2 vehicles (301, accounting for 66.6%) and females with 2 vehicles (257, making up 67.3%).
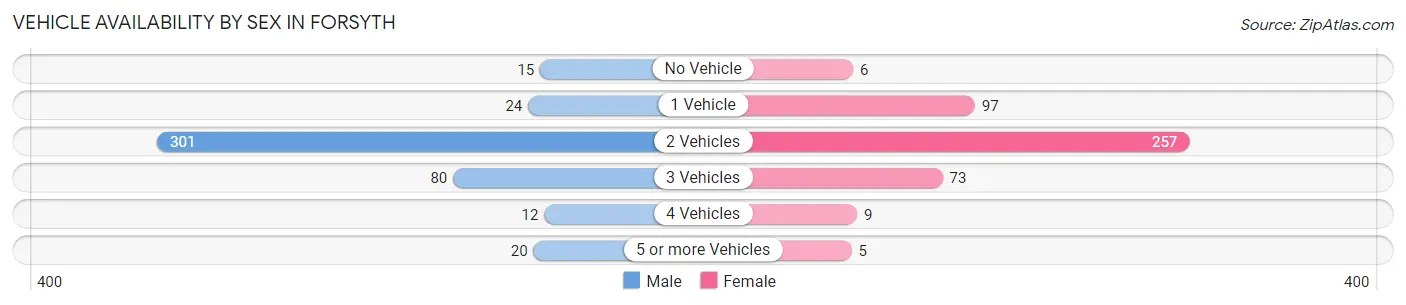
| Vehicles Available | Male | Female |
| No Vehicle | 15 (3.3%) | 6 (1.3%) |
| 1 Vehicle | 24 (5.3%) | 97 (21.7%) |
| 2 Vehicles | 301 (66.6%) | 257 (57.5%) |
| 3 Vehicles | 80 (17.7%) | 73 (16.3%) |
| 4 Vehicles | 12 (2.6%) | 9 (2.0%) |
| 5 or more Vehicles | 20 (4.4%) | 5 (1.1%) |
| Total | 452 (100.0%) | 447 (100.0%) |
Commute Time in Forsyth
The most frequently occuring commute durations in Forsyth are 10 to 14 minutes (156 commuters, 17.8%), 30 to 34 minutes (148 commuters, 16.9%), and 20 to 24 minutes (102 commuters, 11.6%).
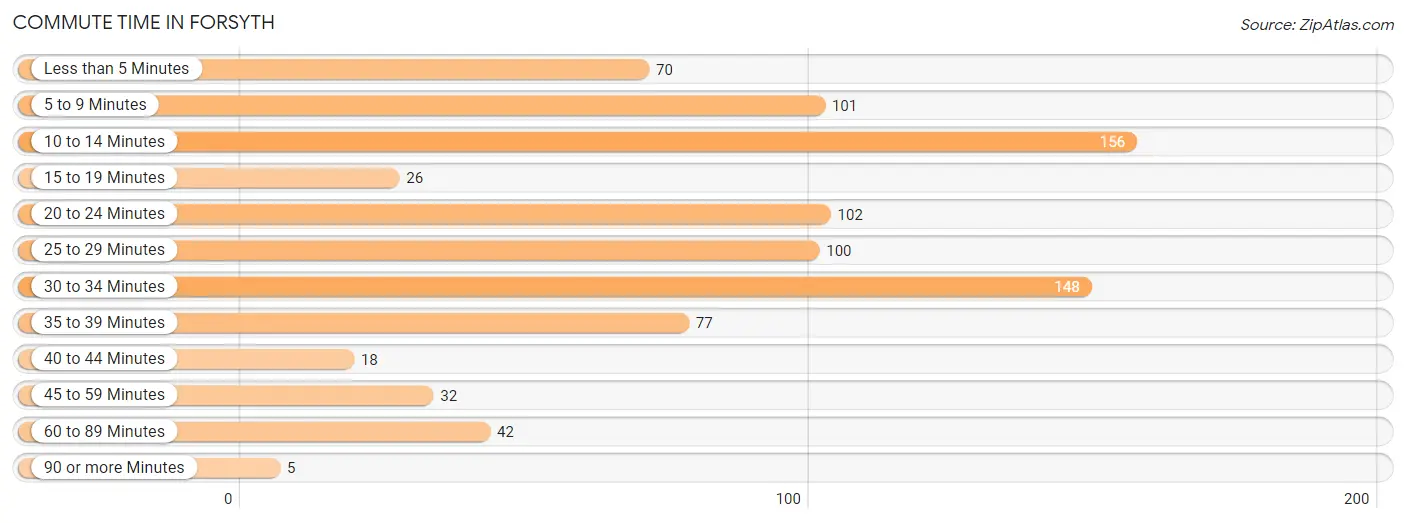
| Commute Time | # Commuters | % Commuters |
| Less than 5 Minutes | 70 | 8.0% |
| 5 to 9 Minutes | 101 | 11.5% |
| 10 to 14 Minutes | 156 | 17.8% |
| 15 to 19 Minutes | 26 | 3.0% |
| 20 to 24 Minutes | 102 | 11.6% |
| 25 to 29 Minutes | 100 | 11.4% |
| 30 to 34 Minutes | 148 | 16.9% |
| 35 to 39 Minutes | 77 | 8.8% |
| 40 to 44 Minutes | 18 | 2.1% |
| 45 to 59 Minutes | 32 | 3.6% |
| 60 to 89 Minutes | 42 | 4.8% |
| 90 or more Minutes | 5 | 0.6% |
Commute Time by Sex in Forsyth
The most common commute times in Forsyth are 10 to 14 minutes (104 commuters, 23.7%) for males and 30 to 34 minutes (97 commuters, 22.1%) for females.
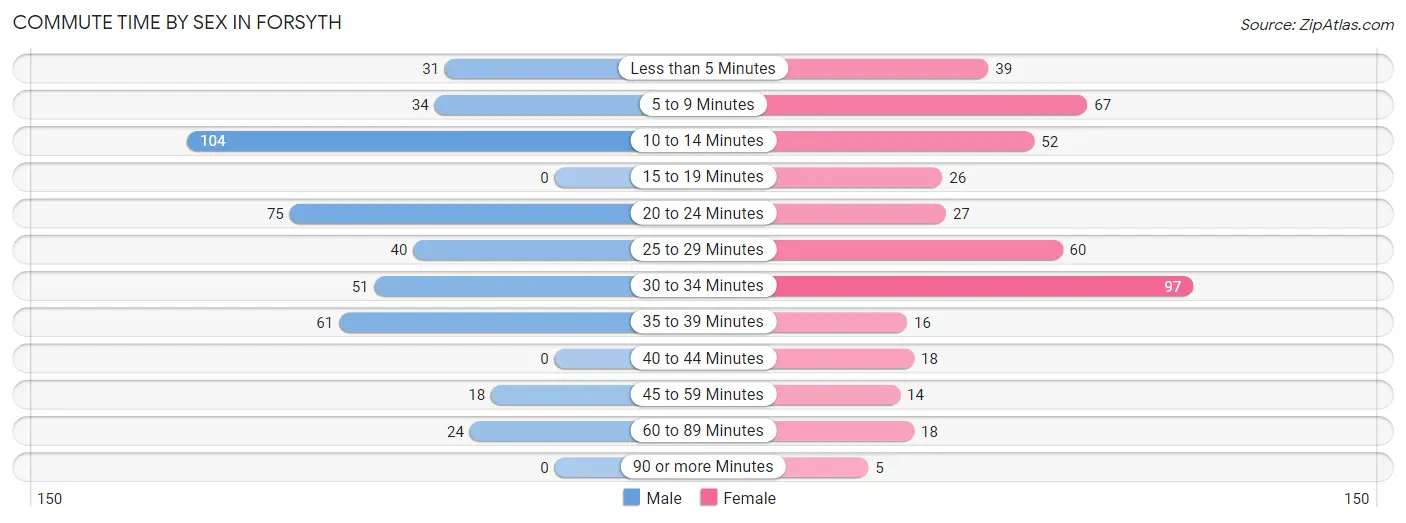
| Commute Time | Male | Female |
| Less than 5 Minutes | 31 (7.1%) | 39 (8.9%) |
| 5 to 9 Minutes | 34 (7.8%) | 67 (15.3%) |
| 10 to 14 Minutes | 104 (23.7%) | 52 (11.8%) |
| 15 to 19 Minutes | 0 (0.0%) | 26 (5.9%) |
| 20 to 24 Minutes | 75 (17.1%) | 27 (6.1%) |
| 25 to 29 Minutes | 40 (9.1%) | 60 (13.7%) |
| 30 to 34 Minutes | 51 (11.6%) | 97 (22.1%) |
| 35 to 39 Minutes | 61 (13.9%) | 16 (3.6%) |
| 40 to 44 Minutes | 0 (0.0%) | 18 (4.1%) |
| 45 to 59 Minutes | 18 (4.1%) | 14 (3.2%) |
| 60 to 89 Minutes | 24 (5.5%) | 18 (4.1%) |
| 90 or more Minutes | 0 (0.0%) | 5 (1.1%) |
Time of Departure to Work by Sex in Forsyth
The most frequent times of departure to work in Forsyth are 7:30 AM to 7:59 AM (171, 39.0%) for males and 7:30 AM to 7:59 AM (118, 26.9%) for females.
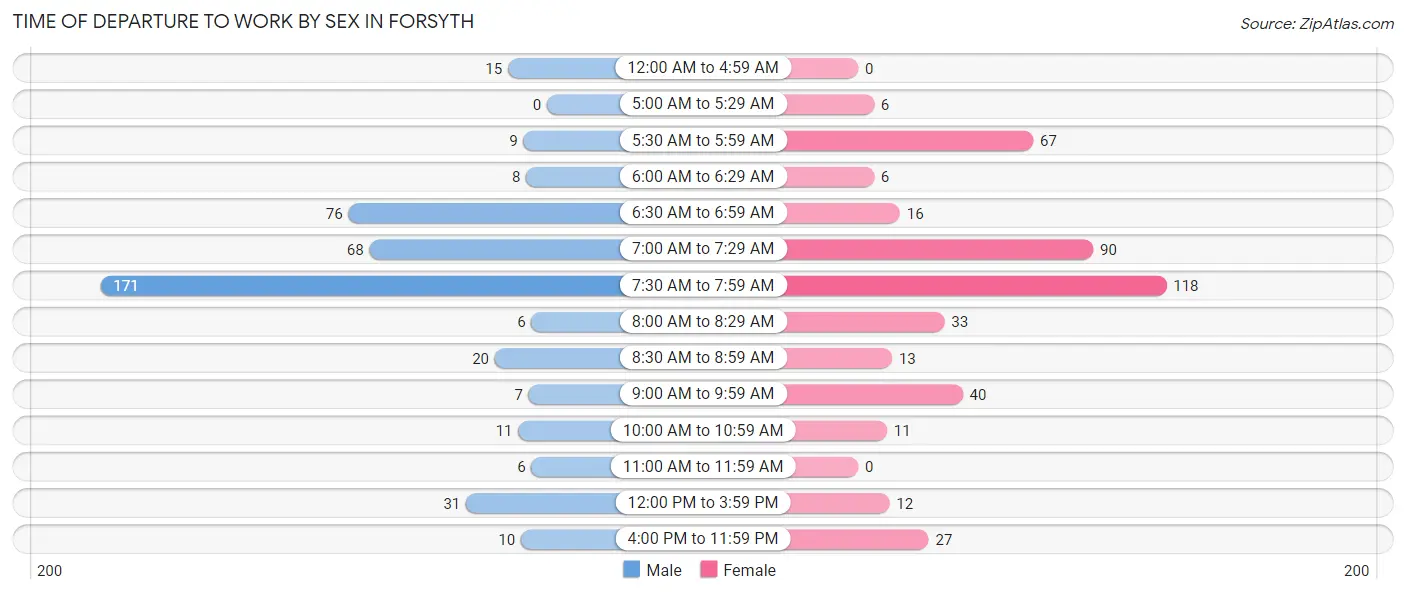
| Time of Departure | Male | Female |
| 12:00 AM to 4:59 AM | 15 (3.4%) | 0 (0.0%) |
| 5:00 AM to 5:29 AM | 0 (0.0%) | 6 (1.4%) |
| 5:30 AM to 5:59 AM | 9 (2.1%) | 67 (15.3%) |
| 6:00 AM to 6:29 AM | 8 (1.8%) | 6 (1.4%) |
| 6:30 AM to 6:59 AM | 76 (17.3%) | 16 (3.6%) |
| 7:00 AM to 7:29 AM | 68 (15.5%) | 90 (20.5%) |
| 7:30 AM to 7:59 AM | 171 (39.0%) | 118 (26.9%) |
| 8:00 AM to 8:29 AM | 6 (1.4%) | 33 (7.5%) |
| 8:30 AM to 8:59 AM | 20 (4.6%) | 13 (3.0%) |
| 9:00 AM to 9:59 AM | 7 (1.6%) | 40 (9.1%) |
| 10:00 AM to 10:59 AM | 11 (2.5%) | 11 (2.5%) |
| 11:00 AM to 11:59 AM | 6 (1.4%) | 0 (0.0%) |
| 12:00 PM to 3:59 PM | 31 (7.1%) | 12 (2.7%) |
| 4:00 PM to 11:59 PM | 10 (2.3%) | 27 (6.1%) |
| Total | 438 (100.0%) | 439 (100.0%) |
Housing Occupancy in Forsyth
Occupancy by Ownership in Forsyth
Of the total 1,308 dwellings in Forsyth, owner-occupied units account for 951 (72.7%), while renter-occupied units make up 357 (27.3%).
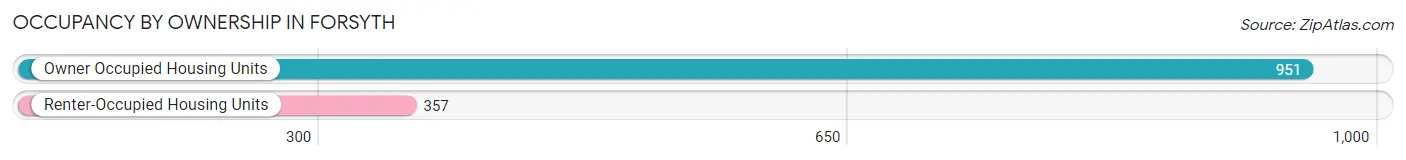
| Occupancy | # Housing Units | % Housing Units |
| Owner Occupied Housing Units | 951 | 72.7% |
| Renter-Occupied Housing Units | 357 | 27.3% |
| Total Occupied Housing Units | 1,308 | 100.0% |
Occupancy by Household Size in Forsyth
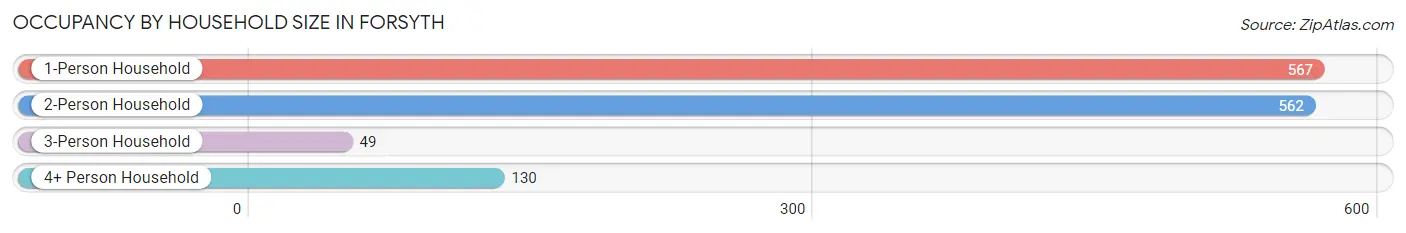
| Household Size | # Housing Units | % Housing Units |
| 1-Person Household | 567 | 43.3% |
| 2-Person Household | 562 | 43.0% |
| 3-Person Household | 49 | 3.7% |
| 4+ Person Household | 130 | 9.9% |
| Total Housing Units | 1,308 | 100.0% |
Occupancy by Ownership by Household Size in Forsyth
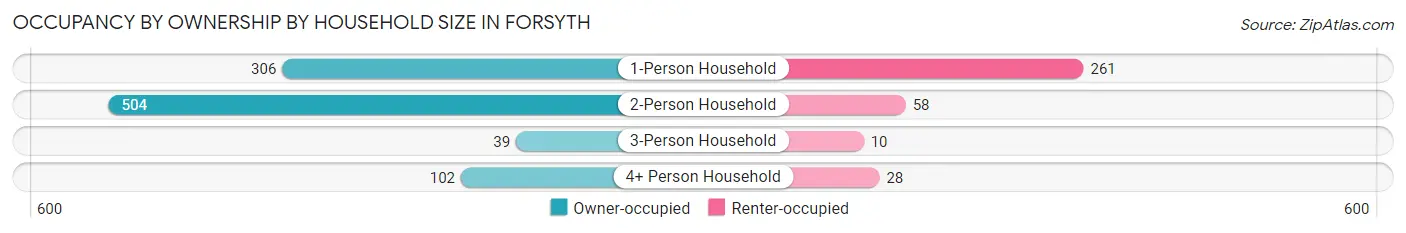
| Household Size | Owner-occupied | Renter-occupied |
| 1-Person Household | 306 (54.0%) | 261 (46.0%) |
| 2-Person Household | 504 (89.7%) | 58 (10.3%) |
| 3-Person Household | 39 (79.6%) | 10 (20.4%) |
| 4+ Person Household | 102 (78.5%) | 28 (21.5%) |
| Total Housing Units | 951 (72.7%) | 357 (27.3%) |
Occupancy by Educational Attainment in Forsyth
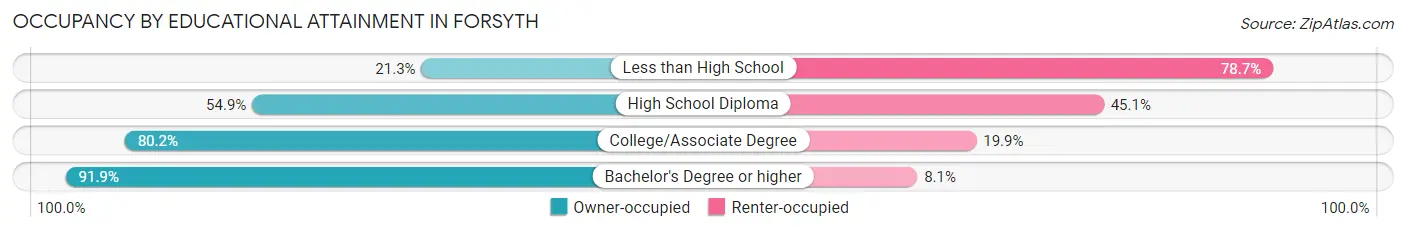
| Household Size | Owner-occupied | Renter-occupied |
| Less than High School | 16 (21.3%) | 59 (78.7%) |
| High School Diploma | 225 (54.9%) | 185 (45.1%) |
| College/Associate Degree | 315 (80.1%) | 78 (19.9%) |
| Bachelor's Degree or higher | 395 (91.9%) | 35 (8.1%) |
Occupancy by Age of Householder in Forsyth
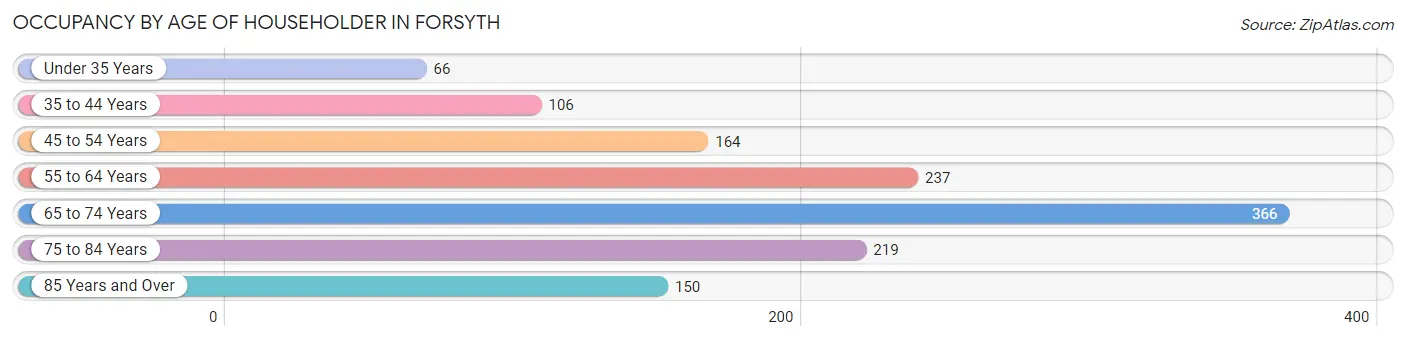
| Age Bracket | # Households | % Households |
| Under 35 Years | 66 | 5.1% |
| 35 to 44 Years | 106 | 8.1% |
| 45 to 54 Years | 164 | 12.5% |
| 55 to 64 Years | 237 | 18.1% |
| 65 to 74 Years | 366 | 28.0% |
| 75 to 84 Years | 219 | 16.7% |
| 85 Years and Over | 150 | 11.5% |
| Total | 1,308 | 100.0% |
Housing Finances in Forsyth
Median Income by Occupancy in Forsyth
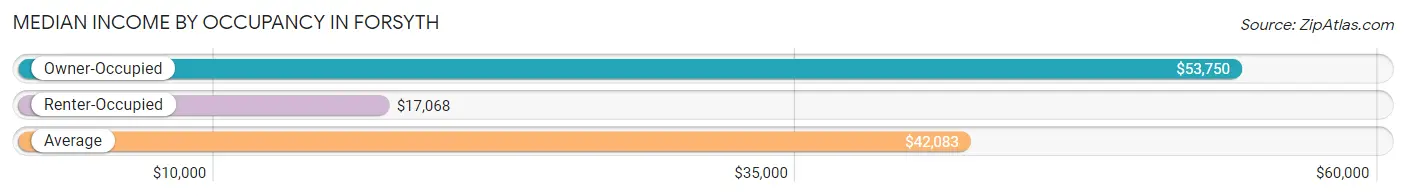
| Occupancy Type | # Households | Median Income |
| Owner-Occupied | 951 (72.7%) | $53,750 |
| Renter-Occupied | 357 (27.3%) | $17,068 |
| Average | 1,308 (100.0%) | $42,083 |
Occupancy by Householder Income Bracket in Forsyth
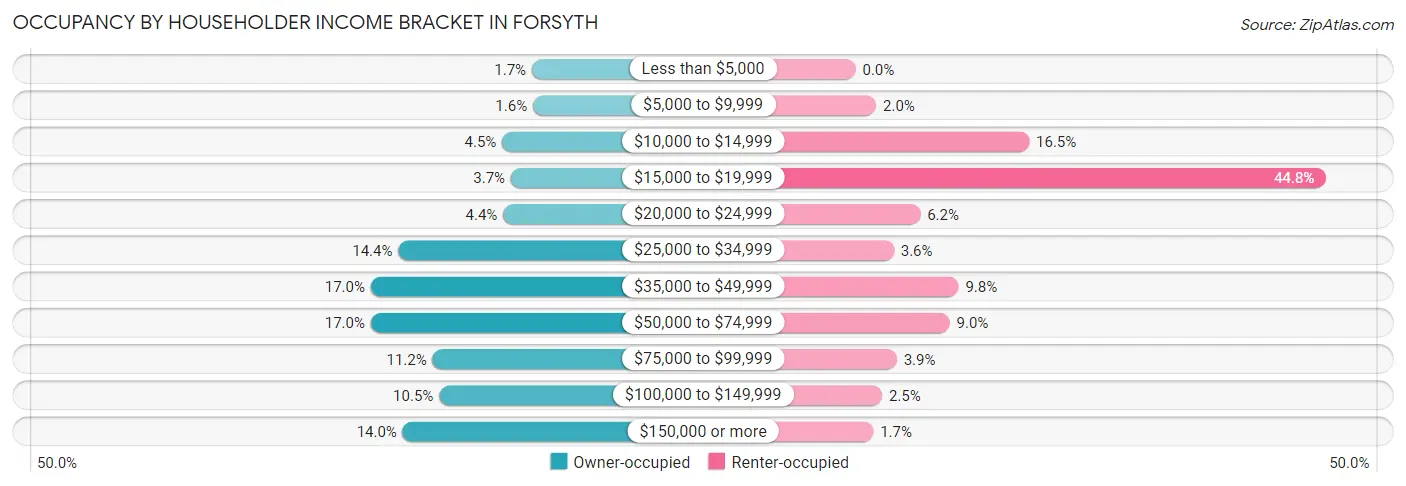
| Income Bracket | Owner-occupied | Renter-occupied |
| Less than $5,000 | 16 (1.7%) | 0 (0.0%) |
| $5,000 to $9,999 | 15 (1.6%) | 7 (2.0%) |
| $10,000 to $14,999 | 43 (4.5%) | 59 (16.5%) |
| $15,000 to $19,999 | 35 (3.7%) | 160 (44.8%) |
| $20,000 to $24,999 | 42 (4.4%) | 22 (6.2%) |
| $25,000 to $34,999 | 137 (14.4%) | 13 (3.6%) |
| $35,000 to $49,999 | 162 (17.0%) | 35 (9.8%) |
| $50,000 to $74,999 | 162 (17.0%) | 32 (9.0%) |
| $75,000 to $99,999 | 106 (11.2%) | 14 (3.9%) |
| $100,000 to $149,999 | 100 (10.5%) | 9 (2.5%) |
| $150,000 or more | 133 (14.0%) | 6 (1.7%) |
| Total | 951 (100.0%) | 357 (100.0%) |
Monthly Housing Cost Tiers in Forsyth
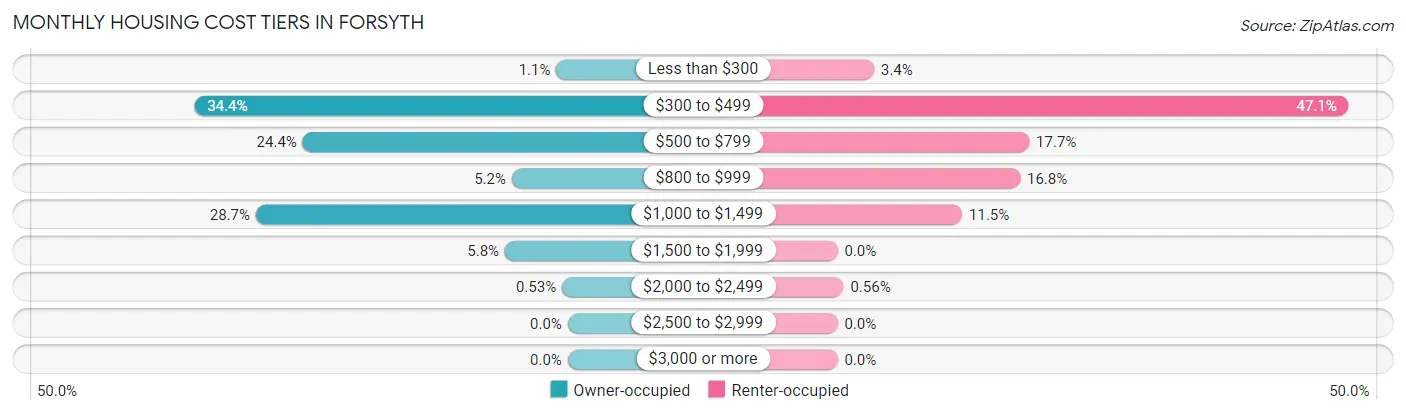
| Monthly Cost | Owner-occupied | Renter-occupied |
| Less than $300 | 10 (1.1%) | 12 (3.4%) |
| $300 to $499 | 327 (34.4%) | 168 (47.1%) |
| $500 to $799 | 232 (24.4%) | 63 (17.6%) |
| $800 to $999 | 49 (5.1%) | 60 (16.8%) |
| $1,000 to $1,499 | 273 (28.7%) | 41 (11.5%) |
| $1,500 to $1,999 | 55 (5.8%) | 0 (0.0%) |
| $2,000 to $2,499 | 5 (0.5%) | 2 (0.6%) |
| $2,500 to $2,999 | 0 (0.0%) | 0 (0.0%) |
| $3,000 or more | 0 (0.0%) | 0 (0.0%) |
| Total | 951 (100.0%) | 357 (100.0%) |
Physical Housing Characteristics in Forsyth
Housing Structures in Forsyth
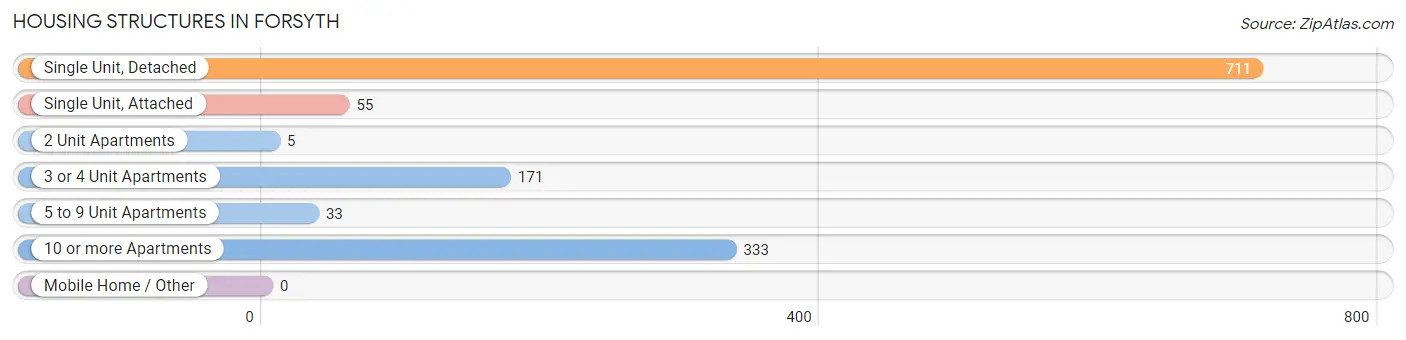
| Structure Type | # Housing Units | % Housing Units |
| Single Unit, Detached | 711 | 54.4% |
| Single Unit, Attached | 55 | 4.2% |
| 2 Unit Apartments | 5 | 0.4% |
| 3 or 4 Unit Apartments | 171 | 13.1% |
| 5 to 9 Unit Apartments | 33 | 2.5% |
| 10 or more Apartments | 333 | 25.5% |
| Mobile Home / Other | 0 | 0.0% |
| Total | 1,308 | 100.0% |
Housing Structures by Occupancy in Forsyth
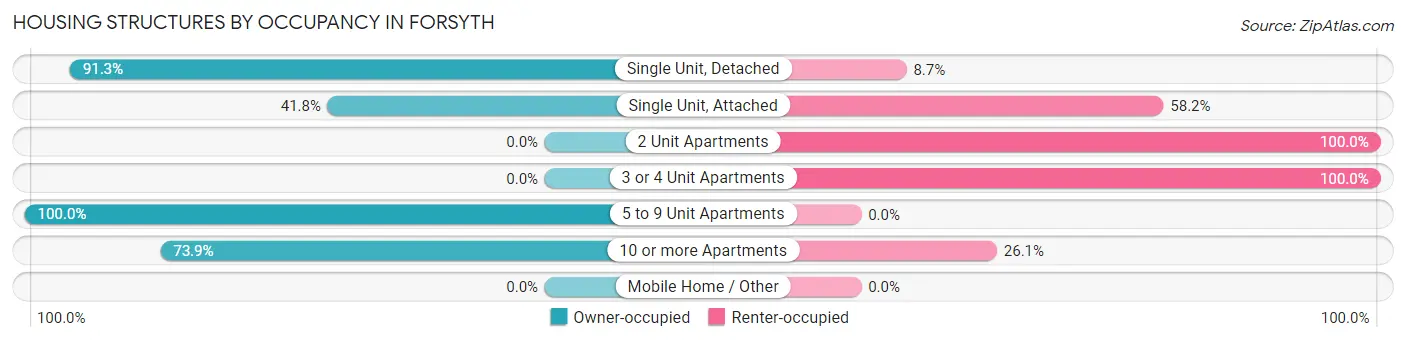
| Structure Type | Owner-occupied | Renter-occupied |
| Single Unit, Detached | 649 (91.3%) | 62 (8.7%) |
| Single Unit, Attached | 23 (41.8%) | 32 (58.2%) |
| 2 Unit Apartments | 0 (0.0%) | 5 (100.0%) |
| 3 or 4 Unit Apartments | 0 (0.0%) | 171 (100.0%) |
| 5 to 9 Unit Apartments | 33 (100.0%) | 0 (0.0%) |
| 10 or more Apartments | 246 (73.9%) | 87 (26.1%) |
| Mobile Home / Other | 0 (0.0%) | 0 (0.0%) |
| Total | 951 (72.7%) | 357 (27.3%) |
Housing Structures by Number of Rooms in Forsyth
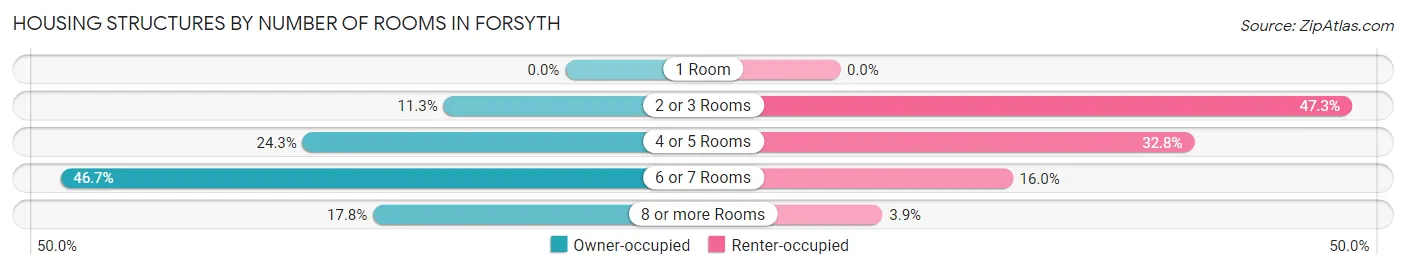
| Number of Rooms | Owner-occupied | Renter-occupied |
| 1 Room | 0 (0.0%) | 0 (0.0%) |
| 2 or 3 Rooms | 107 (11.3%) | 169 (47.3%) |
| 4 or 5 Rooms | 231 (24.3%) | 117 (32.8%) |
| 6 or 7 Rooms | 444 (46.7%) | 57 (16.0%) |
| 8 or more Rooms | 169 (17.8%) | 14 (3.9%) |
| Total | 951 (100.0%) | 357 (100.0%) |
Housing Structure by Heating Type in Forsyth
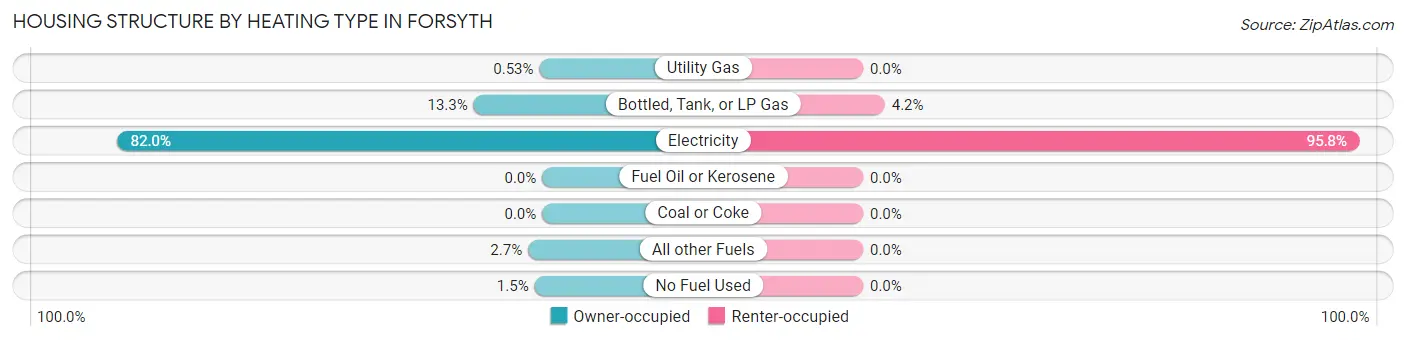
| Heating Type | Owner-occupied | Renter-occupied |
| Utility Gas | 5 (0.5%) | 0 (0.0%) |
| Bottled, Tank, or LP Gas | 126 (13.3%) | 15 (4.2%) |
| Electricity | 780 (82.0%) | 342 (95.8%) |
| Fuel Oil or Kerosene | 0 (0.0%) | 0 (0.0%) |
| Coal or Coke | 0 (0.0%) | 0 (0.0%) |
| All other Fuels | 26 (2.7%) | 0 (0.0%) |
| No Fuel Used | 14 (1.5%) | 0 (0.0%) |
| Total | 951 (100.0%) | 357 (100.0%) |
Household Vehicle Usage in Forsyth
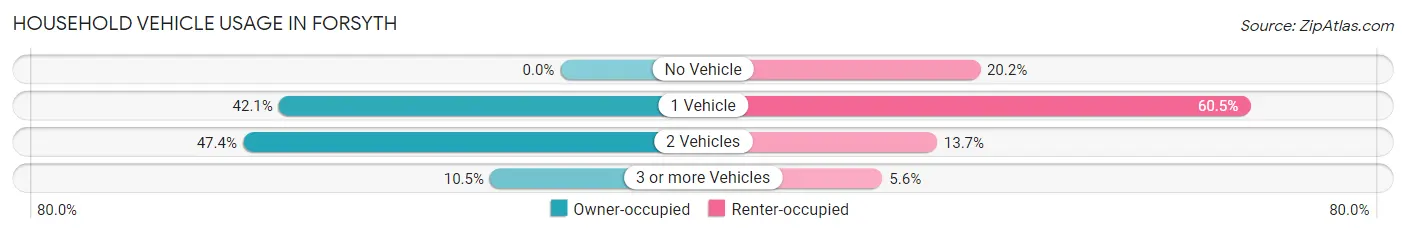
| Vehicles per Household | Owner-occupied | Renter-occupied |
| No Vehicle | 0 (0.0%) | 72 (20.2%) |
| 1 Vehicle | 400 (42.1%) | 216 (60.5%) |
| 2 Vehicles | 451 (47.4%) | 49 (13.7%) |
| 3 or more Vehicles | 100 (10.5%) | 20 (5.6%) |
| Total | 951 (100.0%) | 357 (100.0%) |
Real Estate & Mortgages in Forsyth
Real Estate and Mortgage Overview in Forsyth
| Characteristic | Without Mortgage | With Mortgage |
| Housing Units | 566 | 385 |
| Median Property Value | $160,400 | $167,000 |
| Median Household Income | $46,618 | $22 |
| Monthly Housing Costs | $480 | $0 |
| Real Estate Taxes | $967 | $7 |
Property Value by Mortgage Status in Forsyth
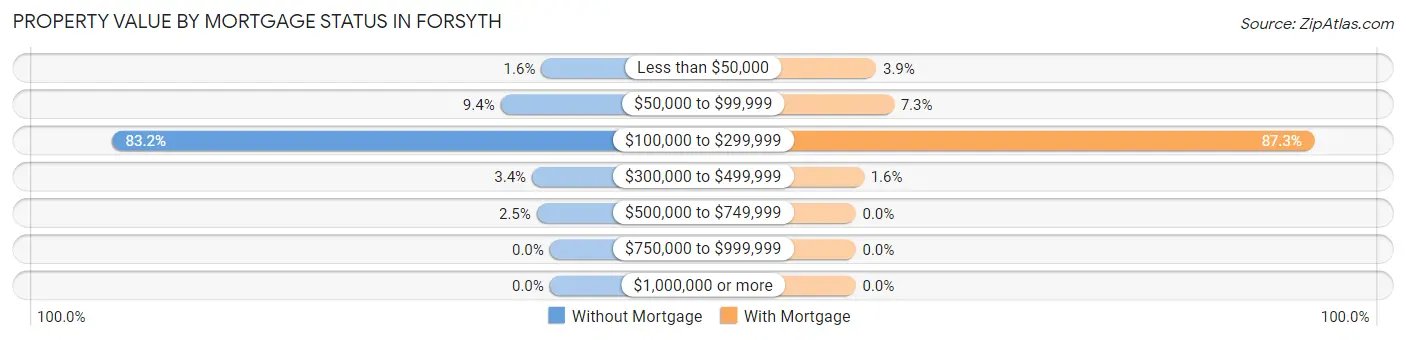
| Property Value | Without Mortgage | With Mortgage |
| Less than $50,000 | 9 (1.6%) | 15 (3.9%) |
| $50,000 to $99,999 | 53 (9.4%) | 28 (7.3%) |
| $100,000 to $299,999 | 471 (83.2%) | 336 (87.3%) |
| $300,000 to $499,999 | 19 (3.4%) | 6 (1.6%) |
| $500,000 to $749,999 | 14 (2.5%) | 0 (0.0%) |
| $750,000 to $999,999 | 0 (0.0%) | 0 (0.0%) |
| $1,000,000 or more | 0 (0.0%) | 0 (0.0%) |
| Total | 566 (100.0%) | 385 (100.0%) |
Household Income by Mortgage Status in Forsyth
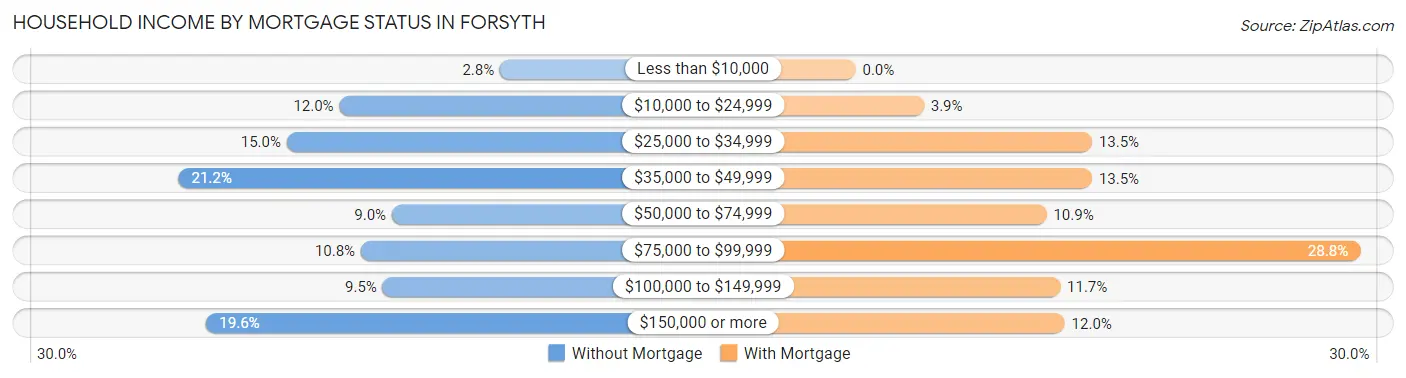
| Household Income | Without Mortgage | With Mortgage |
| Less than $10,000 | 16 (2.8%) | 0 (0.0%) |
| $10,000 to $24,999 | 68 (12.0%) | 15 (3.9%) |
| $25,000 to $34,999 | 85 (15.0%) | 52 (13.5%) |
| $35,000 to $49,999 | 120 (21.2%) | 52 (13.5%) |
| $50,000 to $74,999 | 51 (9.0%) | 42 (10.9%) |
| $75,000 to $99,999 | 61 (10.8%) | 111 (28.8%) |
| $100,000 to $149,999 | 54 (9.5%) | 45 (11.7%) |
| $150,000 or more | 111 (19.6%) | 46 (11.9%) |
| Total | 566 (100.0%) | 385 (100.0%) |
Property Value to Household Income Ratio in Forsyth
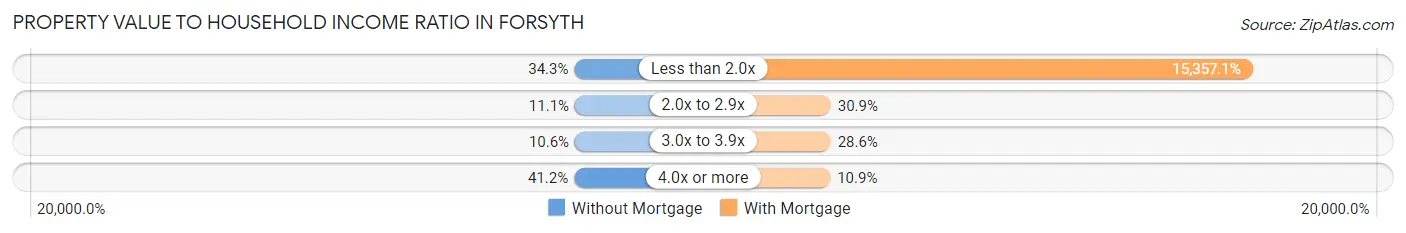
| Value-to-Income Ratio | Without Mortgage | With Mortgage |
| Less than 2.0x | 194 (34.3%) | 59,125 (15,357.1%) |
| 2.0x to 2.9x | 63 (11.1%) | 119 (30.9%) |
| 3.0x to 3.9x | 60 (10.6%) | 110 (28.6%) |
| 4.0x or more | 233 (41.2%) | 42 (10.9%) |
| Total | 566 (100.0%) | 385 (100.0%) |
Real Estate Taxes by Mortgage Status in Forsyth
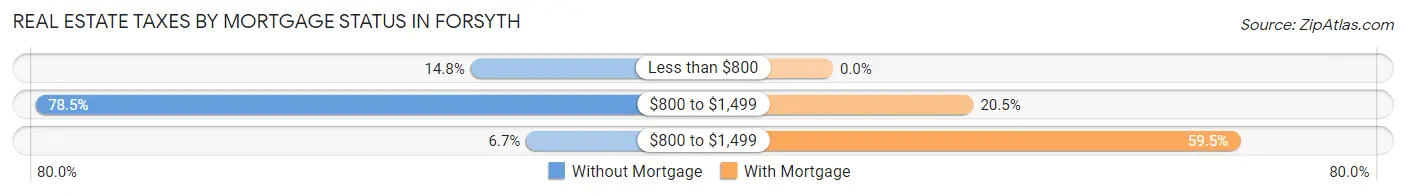
| Property Taxes | Without Mortgage | With Mortgage |
| Less than $800 | 84 (14.8%) | 0 (0.0%) |
| $800 to $1,499 | 444 (78.4%) | 79 (20.5%) |
| $800 to $1,499 | 38 (6.7%) | 229 (59.5%) |
| Total | 566 (100.0%) | 385 (100.0%) |
Health & Disability in Forsyth
Health Insurance Coverage by Age in Forsyth
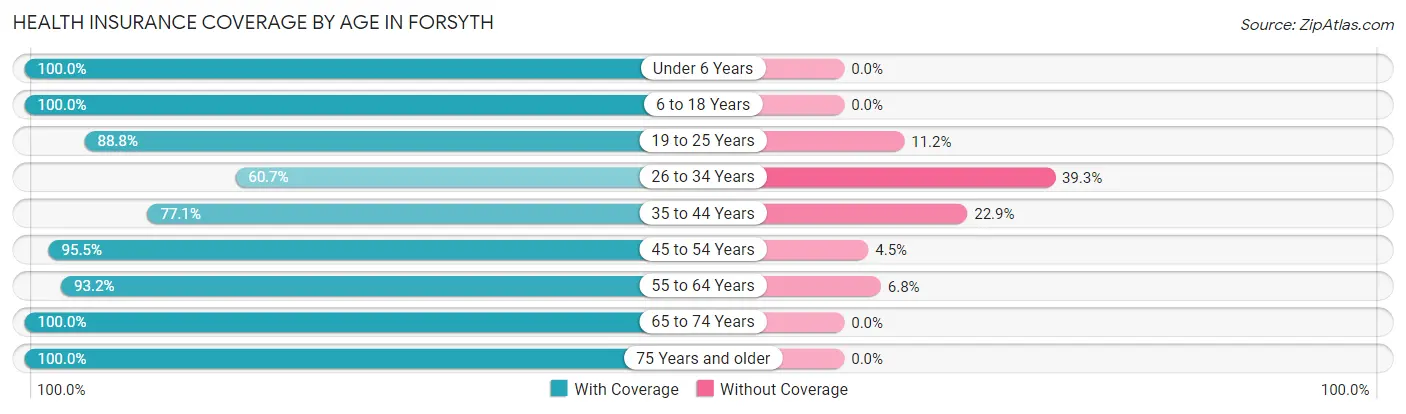
| Age Bracket | With Coverage | Without Coverage |
| Under 6 Years | 86 (100.0%) | 0 (0.0%) |
| 6 to 18 Years | 244 (100.0%) | 0 (0.0%) |
| 19 to 25 Years | 127 (88.8%) | 16 (11.2%) |
| 26 to 34 Years | 85 (60.7%) | 55 (39.3%) |
| 35 to 44 Years | 168 (77.1%) | 50 (22.9%) |
| 45 to 54 Years | 256 (95.5%) | 12 (4.5%) |
| 55 to 64 Years | 410 (93.2%) | 30 (6.8%) |
| 65 to 74 Years | 522 (100.0%) | 0 (0.0%) |
| 75 Years and older | 475 (100.0%) | 0 (0.0%) |
| Total | 2,373 (93.6%) | 163 (6.4%) |
Health Insurance Coverage by Citizenship Status in Forsyth
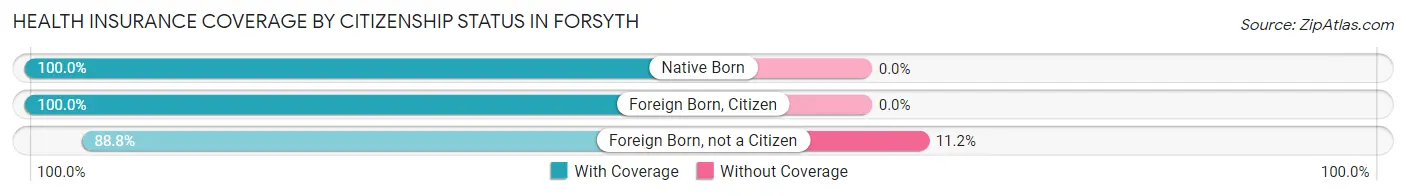
| Citizenship Status | With Coverage | Without Coverage |
| Native Born | 86 (100.0%) | 0 (0.0%) |
| Foreign Born, Citizen | 244 (100.0%) | 0 (0.0%) |
| Foreign Born, not a Citizen | 127 (88.8%) | 16 (11.2%) |
Health Insurance Coverage by Household Income in Forsyth
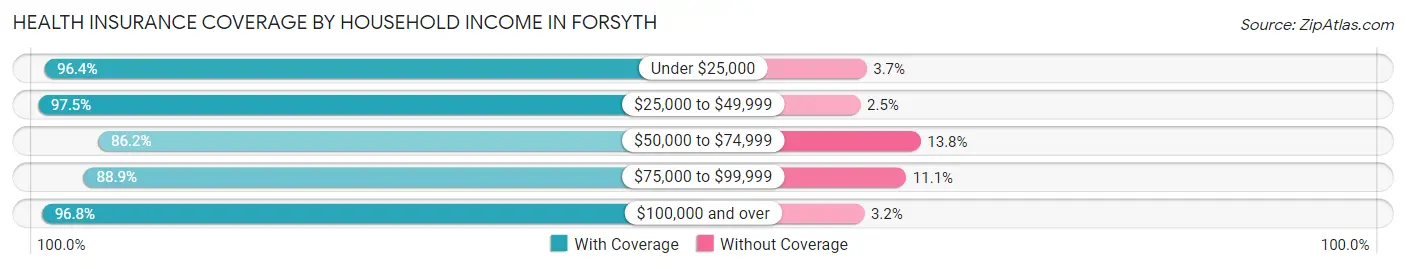
| Household Income | With Coverage | Without Coverage |
| Under $25,000 | 502 (96.4%) | 19 (3.6%) |
| $25,000 to $49,999 | 548 (97.5%) | 14 (2.5%) |
| $50,000 to $74,999 | 488 (86.2%) | 78 (13.8%) |
| $75,000 to $99,999 | 273 (88.9%) | 34 (11.1%) |
| $100,000 and over | 542 (96.8%) | 18 (3.2%) |
Public vs Private Health Insurance Coverage by Age in Forsyth
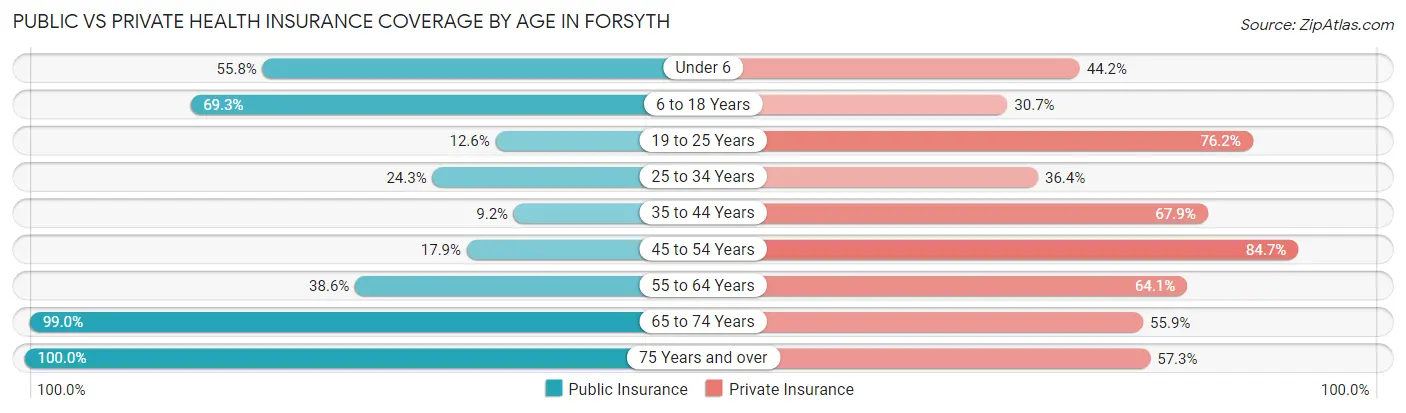
| Age Bracket | Public Insurance | Private Insurance |
| Under 6 | 48 (55.8%) | 38 (44.2%) |
| 6 to 18 Years | 169 (69.3%) | 75 (30.7%) |
| 19 to 25 Years | 18 (12.6%) | 109 (76.2%) |
| 25 to 34 Years | 34 (24.3%) | 51 (36.4%) |
| 35 to 44 Years | 20 (9.2%) | 148 (67.9%) |
| 45 to 54 Years | 48 (17.9%) | 227 (84.7%) |
| 55 to 64 Years | 170 (38.6%) | 282 (64.1%) |
| 65 to 74 Years | 517 (99.0%) | 292 (55.9%) |
| 75 Years and over | 475 (100.0%) | 272 (57.3%) |
| Total | 1,499 (59.1%) | 1,494 (58.9%) |
Disability Status by Sex by Age in Forsyth
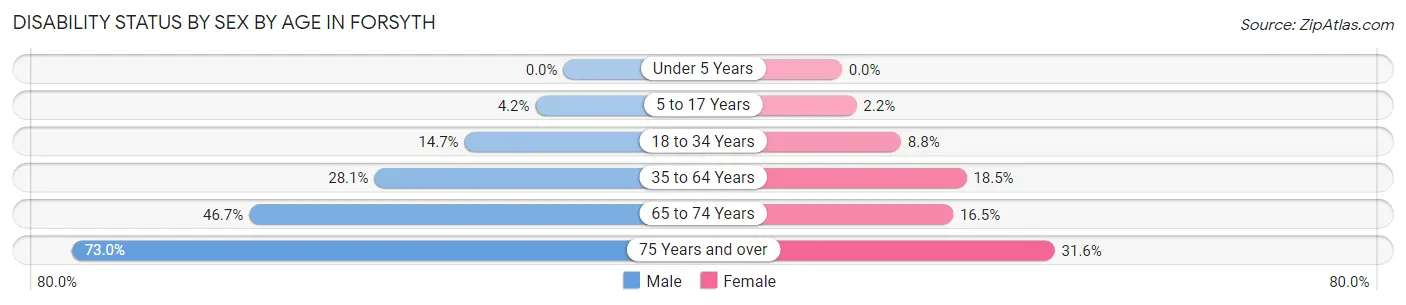
| Age Bracket | Male | Female |
| Under 5 Years | 0 (0.0%) | 0 (0.0%) |
| 5 to 17 Years | 7 (4.2%) | 2 (2.2%) |
| 18 to 34 Years | 21 (14.7%) | 13 (8.8%) |
| 35 to 64 Years | 128 (28.1%) | 87 (18.5%) |
| 65 to 74 Years | 91 (46.7%) | 54 (16.5%) |
| 75 Years and over | 192 (73.0%) | 67 (31.6%) |
Disability Class by Sex by Age in Forsyth
Disability Class: Hearing Difficulty
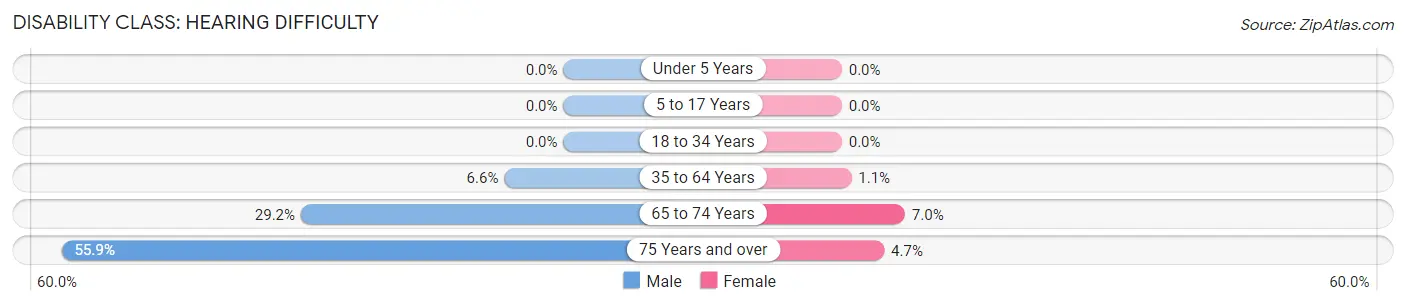
| Age Bracket | Male | Female |
| Under 5 Years | 0 (0.0%) | 0 (0.0%) |
| 5 to 17 Years | 0 (0.0%) | 0 (0.0%) |
| 18 to 34 Years | 0 (0.0%) | 0 (0.0%) |
| 35 to 64 Years | 30 (6.6%) | 5 (1.1%) |
| 65 to 74 Years | 57 (29.2%) | 23 (7.0%) |
| 75 Years and over | 147 (55.9%) | 10 (4.7%) |
Disability Class: Vision Difficulty
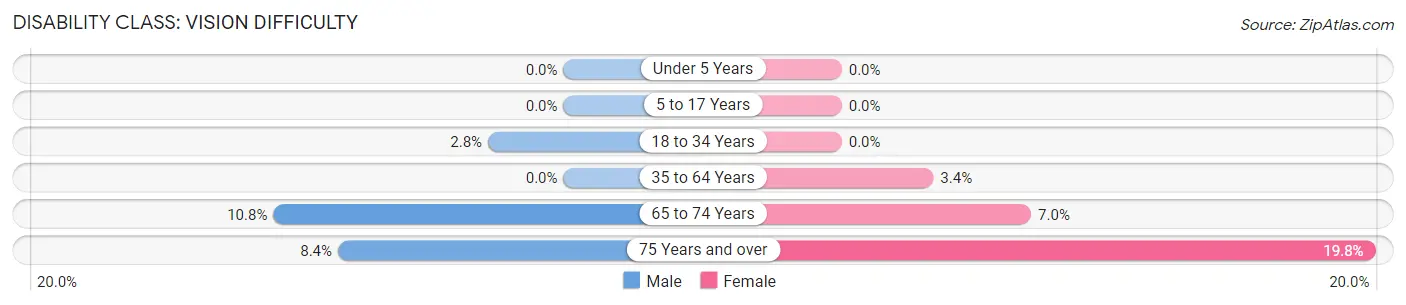
| Age Bracket | Male | Female |
| Under 5 Years | 0 (0.0%) | 0 (0.0%) |
| 5 to 17 Years | 0 (0.0%) | 0 (0.0%) |
| 18 to 34 Years | 4 (2.8%) | 0 (0.0%) |
| 35 to 64 Years | 0 (0.0%) | 16 (3.4%) |
| 65 to 74 Years | 21 (10.8%) | 23 (7.0%) |
| 75 Years and over | 22 (8.4%) | 42 (19.8%) |
Disability Class: Cognitive Difficulty
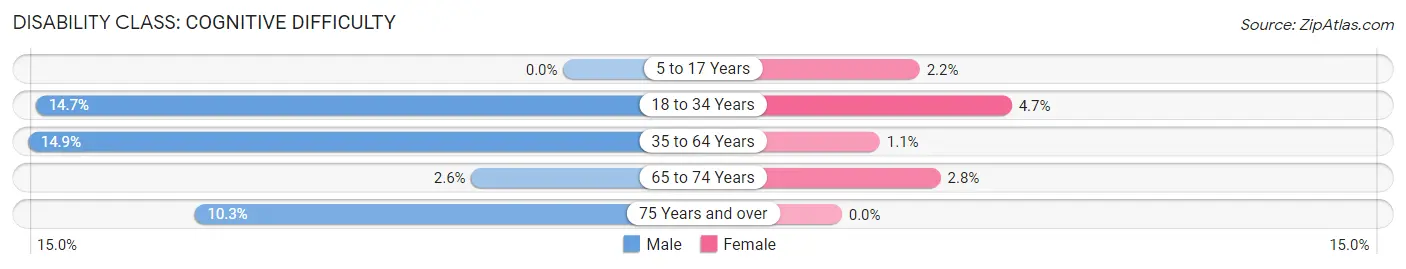
| Age Bracket | Male | Female |
| 5 to 17 Years | 0 (0.0%) | 2 (2.2%) |
| 18 to 34 Years | 21 (14.7%) | 7 (4.7%) |
| 35 to 64 Years | 68 (14.9%) | 5 (1.1%) |
| 65 to 74 Years | 5 (2.6%) | 9 (2.8%) |
| 75 Years and over | 27 (10.3%) | 0 (0.0%) |
Disability Class: Ambulatory Difficulty
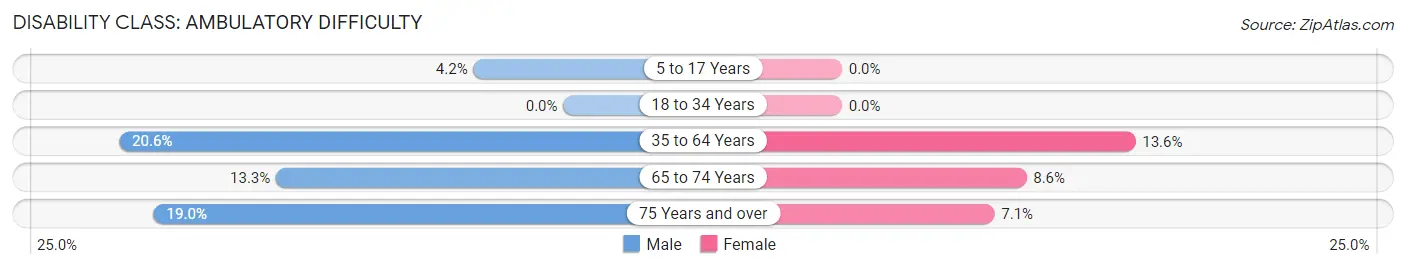
| Age Bracket | Male | Female |
| 5 to 17 Years | 7 (4.2%) | 0 (0.0%) |
| 18 to 34 Years | 0 (0.0%) | 0 (0.0%) |
| 35 to 64 Years | 94 (20.6%) | 64 (13.6%) |
| 65 to 74 Years | 26 (13.3%) | 28 (8.6%) |
| 75 Years and over | 50 (19.0%) | 15 (7.1%) |
Disability Class: Self-Care Difficulty
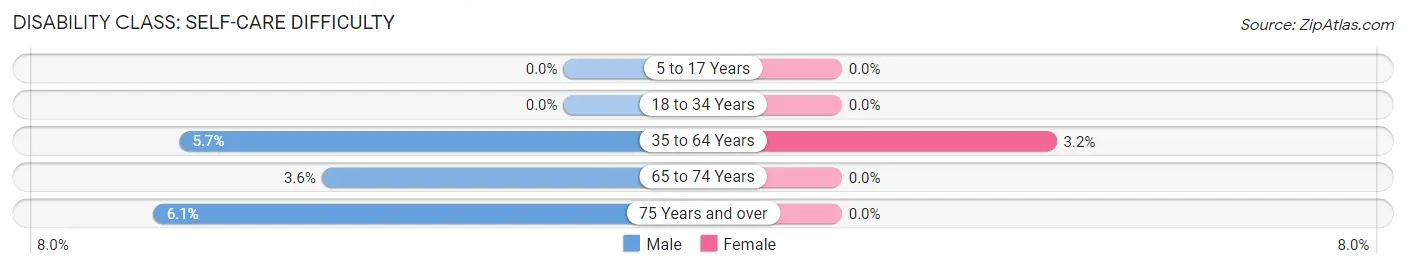
| Age Bracket | Male | Female |
| 5 to 17 Years | 0 (0.0%) | 0 (0.0%) |
| 18 to 34 Years | 0 (0.0%) | 0 (0.0%) |
| 35 to 64 Years | 26 (5.7%) | 15 (3.2%) |
| 65 to 74 Years | 7 (3.6%) | 0 (0.0%) |
| 75 Years and over | 16 (6.1%) | 0 (0.0%) |
Technology Access in Forsyth
Computing Device Access in Forsyth
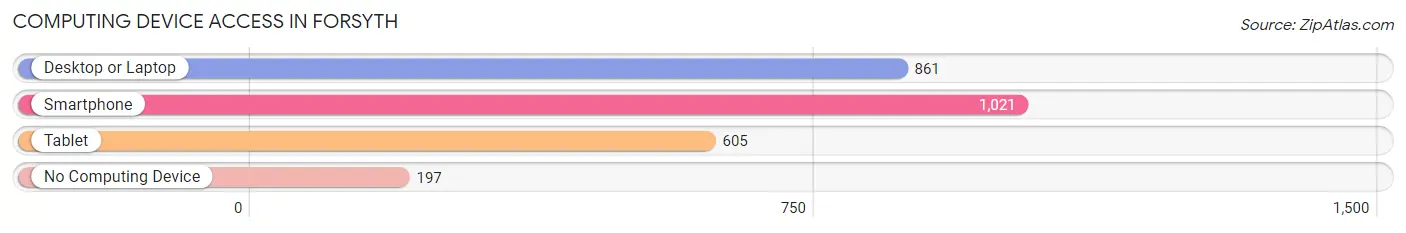
| Device Type | # Households | % Households |
| Desktop or Laptop | 861 | 65.8% |
| Smartphone | 1,021 | 78.1% |
| Tablet | 605 | 46.3% |
| No Computing Device | 197 | 15.1% |
| Total | 1,308 | 100.0% |
Internet Access in Forsyth
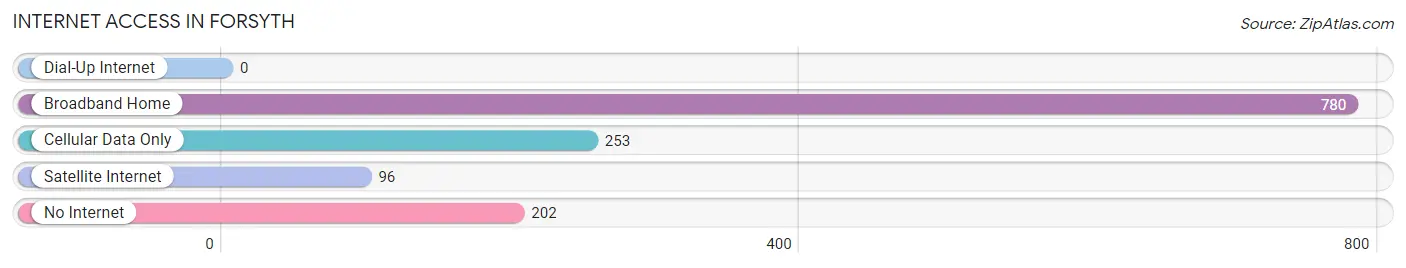
| Internet Type | # Households | % Households |
| Dial-Up Internet | 0 | 0.0% |
| Broadband Home | 780 | 59.6% |
| Cellular Data Only | 253 | 19.3% |
| Satellite Internet | 96 | 7.3% |
| No Internet | 202 | 15.4% |
| Total | 1,308 | 100.0% |
Forsyth Summary
Forsyth is a small city located in Taney County, Missouri. It is situated in the Ozark Mountains, approximately 20 miles south of Branson. The city has a population of 2,845 people, according to the 2010 census.
History
Forsyth was founded in 1883 by William and Mary Forsyth, who had moved to the area from Indiana. The city was named after the couple, and the first post office was established in 1884. The city was incorporated in 1887.
In the early 1900s, the city was a popular tourist destination, with many visitors coming to enjoy the natural beauty of the Ozark Mountains. The city was also home to several resorts, including the Forsyth Hotel, which was built in 1906.
In the 1950s, the city began to experience a decline in tourism, as the popularity of the nearby city of Branson began to grow. This led to a decrease in the city’s population, and by the 1970s, the city was in decline.
In the 1980s, the city began to experience a resurgence, as the city began to attract new businesses and residents. The city has since become a popular destination for retirees, and the population has grown steadily since the 1990s.
Geography
Forsyth is located in the Ozark Mountains, approximately 20 miles south of Branson. The city is situated on the White River, which flows through the city. The city is surrounded by hills and forests, and is home to several parks and recreational areas.
The city has a total area of 4.2 square miles, of which 4.1 square miles is land and 0.1 square miles is water. The city has a humid subtropical climate, with hot, humid summers and mild winters.
Economy
Forsyth’s economy is largely based on tourism and retail. The city is home to several tourist attractions, including the Forsyth Hotel, which is a popular destination for visitors. The city is also home to several retail stores, restaurants, and other businesses.
The city is also home to several manufacturing companies, including a furniture factory and a plastics factory. The city is also home to several medical facilities, including a hospital and several clinics.
Demographics
According to the 2010 census, the city has a population of 2,845 people. The population is predominantly white, with a small percentage of African Americans and Hispanics. The median household income is $37,941, and the median age is 44.
The city is home to several churches, including the First Baptist Church, the First United Methodist Church, and the Church of the Nazarene. The city is also home to several schools, including Forsyth Elementary School, Forsyth Middle School, and Forsyth High School.
Common Questions
What is Per Capita Income in Forsyth?
Per Capita income in Forsyth is $28,578.
What is the Median Family Income in Forsyth?
Median Family Income in Forsyth is $72,813.
What is the Median Household income in Forsyth?
Median Household Income in Forsyth is $42,083.
What is Income or Wage Gap in Forsyth?
Income or Wage Gap in Forsyth is 25.6%.
Women in Forsyth earn 74.4 cents for every dollar earned by a man.
What is Family Income Deficit in Forsyth?
Family Income Deficit in Forsyth is $6,565.
Families that are below poverty line in Forsyth earn $6,565 less on average than the poverty threshold level.
What is Inequality or Gini Index in Forsyth?
Inequality or Gini Index in Forsyth is 0.42.
What is the Total Population of Forsyth?
Total Population of Forsyth is 2,731.
What is the Total Male Population of Forsyth?
Total Male Population of Forsyth is 1,409.
What is the Total Female Population of Forsyth?
Total Female Population of Forsyth is 1,322.
What is the Ratio of Males per 100 Females in Forsyth?
There are 106.58 Males per 100 Females in Forsyth.
What is the Ratio of Females per 100 Males in Forsyth?
There are 93.83 Females per 100 Males in Forsyth.
What is the Median Population Age in Forsyth?
Median Population Age in Forsyth is 58.5 Years.
What is the Average Family Size in Forsyth
Average Family Size in Forsyth is 2.5 People.
What is the Average Household Size in Forsyth
Average Household Size in Forsyth is 1.9 People.
How Large is the Labor Force in Forsyth?
There are 942 People in the Labor Forcein in Forsyth.
What is the Percentage of People in the Labor Force in Forsyth?
38.6% of People are in the Labor Force in Forsyth.
What is the Unemployment Rate in Forsyth?
Unemployment Rate in Forsyth is 3.0%.