Festus, MO Map & Demographics
Festus Map
Festus Overview
$29,736
PER CAPITA INCOME
$78,139
AVG FAMILY INCOME
$65,942
AVG HOUSEHOLD INCOME
25.6%
WAGE / INCOME GAP [ % ]
74.4¢/ $1
WAGE / INCOME GAP [ $ ]
$13,573
FAMILY INCOME DEFICIT
0.40
INEQUALITY / GINI INDEX
12,772
TOTAL POPULATION
6,018
MALE POPULATION
6,754
FEMALE POPULATION
89.10
MALES / 100 FEMALES
112.23
FEMALES / 100 MALES
37.0
MEDIAN AGE
3.0
AVG FAMILY SIZE
2.5
AVG HOUSEHOLD SIZE
5,926
LABOR FORCE [ PEOPLE ]
61.2%
PERCENT IN LABOR FORCE
5.4%
UNEMPLOYMENT RATE
Festus Zip Codes
Festus Area Codes
Income in Festus
Income Overview in Festus
Per Capita Income in Festus is $29,736, while median incomes of families and households are $78,139 and $65,942 respectively.
| Characteristic | Number | Measure |
| Per Capita Income | 12,772 | $29,736 |
| Median Family Income | 3,430 | $78,139 |
| Mean Family Income | 3,430 | $89,923 |
| Median Household Income | 5,021 | $65,942 |
| Mean Household Income | 5,021 | $75,540 |
| Income Deficit | 3,430 | $13,573 |
| Wage / Income Gap (%) | 12,772 | 25.63% |
| Wage / Income Gap ($) | 12,772 | 74.37¢ per $1 |
| Gini / Inequality Index | 12,772 | 0.40 |
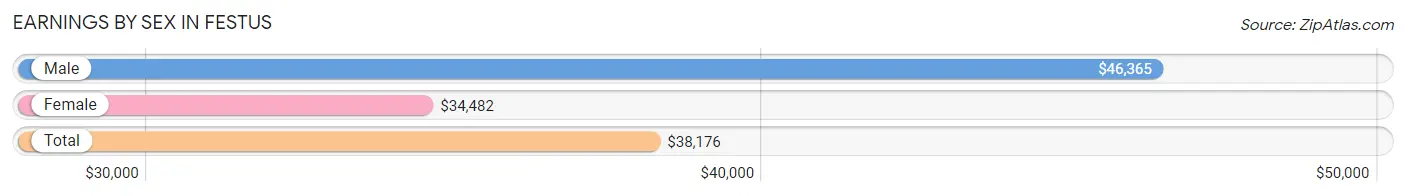
Earnings by Sex in Festus
Average Earnings in Festus are $38,176, $46,365 for men and $34,482 for women, a difference of 25.6%.
| Sex | Number | Average Earnings |
| Male | 3,146 (50.8%) | $46,365 |
| Female | 3,044 (49.2%) | $34,482 |
| Total | 6,190 (100.0%) | $38,176 |
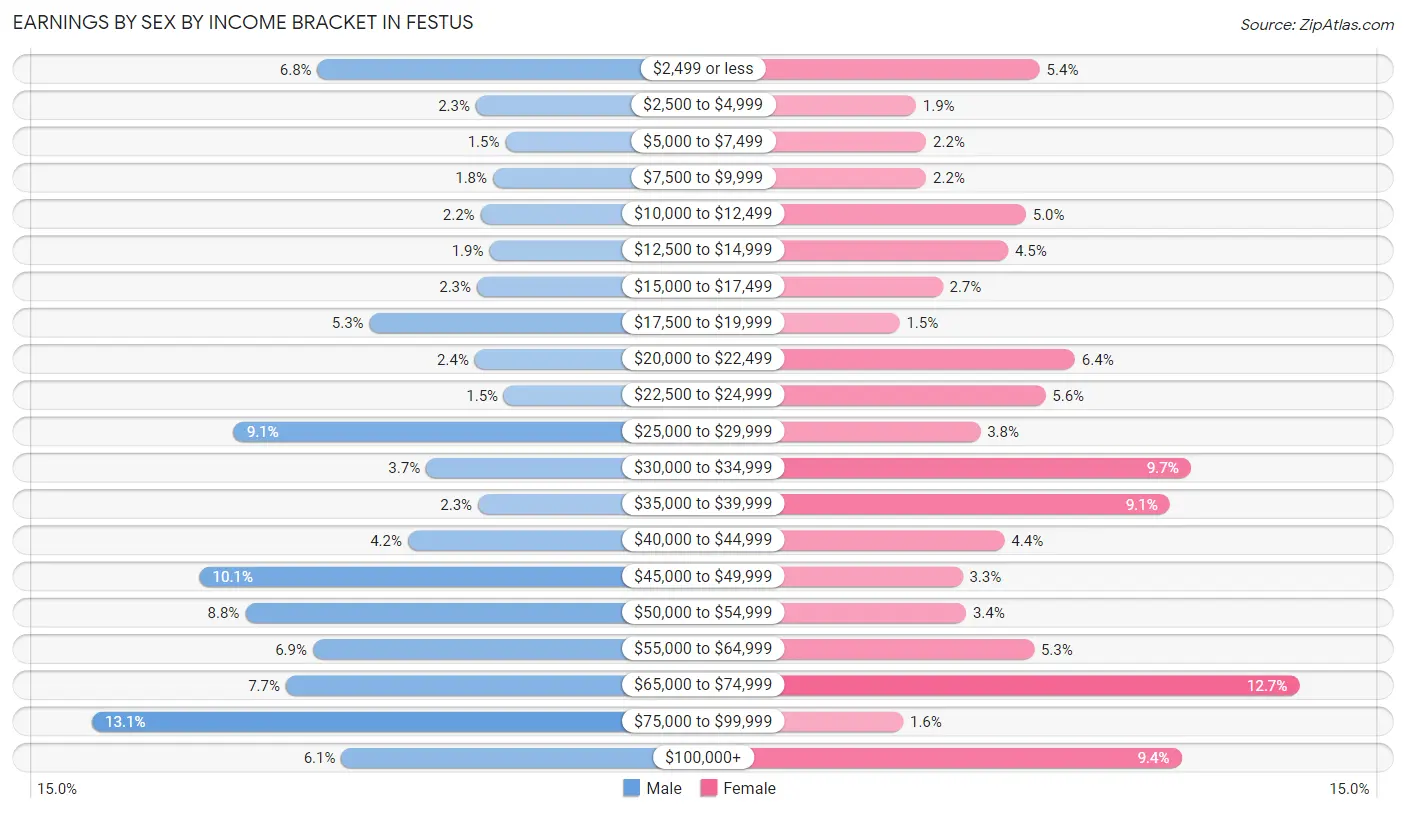
Earnings by Sex by Income Bracket in Festus
The most common earnings brackets in Festus are $75,000 to $99,999 for men (412 | 13.1%) and $65,000 to $74,999 for women (387 | 12.7%).
| Income | Male | Female |
| $2,499 or less | 213 (6.8%) | 165 (5.4%) |
| $2,500 to $4,999 | 73 (2.3%) | 59 (1.9%) |
| $5,000 to $7,499 | 47 (1.5%) | 68 (2.2%) |
| $7,500 to $9,999 | 58 (1.8%) | 68 (2.2%) |
| $10,000 to $12,499 | 69 (2.2%) | 153 (5.0%) |
| $12,500 to $14,999 | 61 (1.9%) | 138 (4.5%) |
| $15,000 to $17,499 | 72 (2.3%) | 82 (2.7%) |
| $17,500 to $19,999 | 167 (5.3%) | 45 (1.5%) |
| $20,000 to $22,499 | 74 (2.4%) | 195 (6.4%) |
| $22,500 to $24,999 | 48 (1.5%) | 170 (5.6%) |
| $25,000 to $29,999 | 287 (9.1%) | 114 (3.7%) |
| $30,000 to $34,999 | 117 (3.7%) | 294 (9.7%) |
| $35,000 to $39,999 | 71 (2.3%) | 276 (9.1%) |
| $40,000 to $44,999 | 133 (4.2%) | 135 (4.4%) |
| $45,000 to $49,999 | 317 (10.1%) | 99 (3.3%) |
| $50,000 to $54,999 | 277 (8.8%) | 102 (3.4%) |
| $55,000 to $64,999 | 217 (6.9%) | 160 (5.3%) |
| $65,000 to $74,999 | 241 (7.7%) | 387 (12.7%) |
| $75,000 to $99,999 | 412 (13.1%) | 48 (1.6%) |
| $100,000+ | 192 (6.1%) | 286 (9.4%) |
| Total | 3,146 (100.0%) | 3,044 (100.0%) |
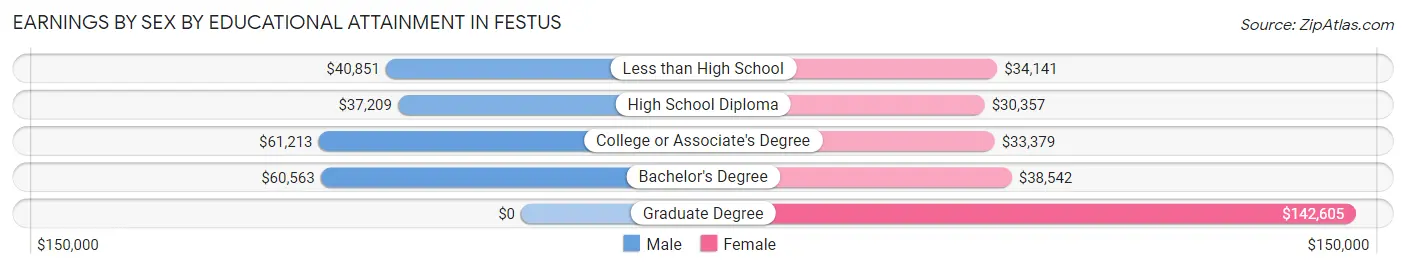
Earnings by Sex by Educational Attainment in Festus
Average earnings in Festus are $49,424 for men and $36,561 for women, a difference of 26.0%. Men with an educational attainment of college or associate's degree enjoy the highest average annual earnings of $61,213, while those with high school diploma education earn the least with $37,209. Women with an educational attainment of graduate degree earn the most with the average annual earnings of $142,605, while those with high school diploma education have the smallest earnings of $30,357.
| Educational Attainment | Male Income | Female Income |
| Less than High School | $40,851 | $34,141 |
| High School Diploma | $37,209 | $30,357 |
| College or Associate's Degree | $61,213 | $33,379 |
| Bachelor's Degree | $60,563 | $38,542 |
| Graduate Degree | - | - |
| Total | $49,424 | $36,561 |
Family Income in Festus
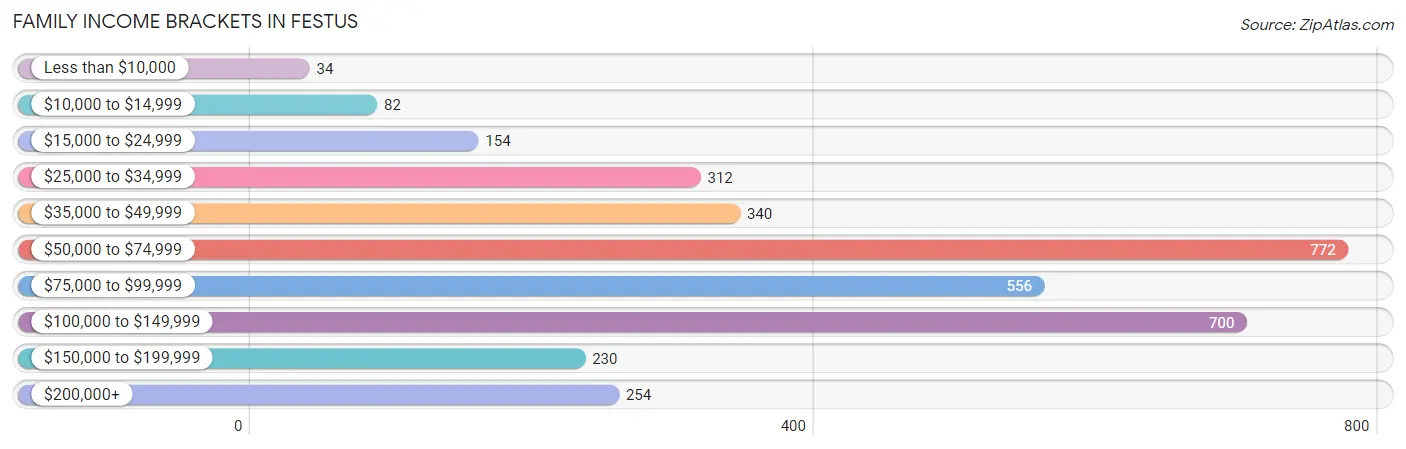
Family Income Brackets in Festus
According to the Festus family income data, there are 772 families falling into the $50,000 to $74,999 income range, which is the most common income bracket and makes up 22.5% of all families. Conversely, the less than $10,000 income bracket is the least frequent group with only 34 families (1.0%) belonging to this category.
| Income Bracket | # Families | % Families |
| Less than $10,000 | 34 | 1.0% |
| $10,000 to $14,999 | 82 | 2.4% |
| $15,000 to $24,999 | 154 | 4.5% |
| $25,000 to $34,999 | 312 | 9.1% |
| $35,000 to $49,999 | 340 | 9.9% |
| $50,000 to $74,999 | 772 | 22.5% |
| $75,000 to $99,999 | 556 | 16.2% |
| $100,000 to $149,999 | 700 | 20.4% |
| $150,000 to $199,999 | 230 | 6.7% |
| $200,000+ | 254 | 7.4% |
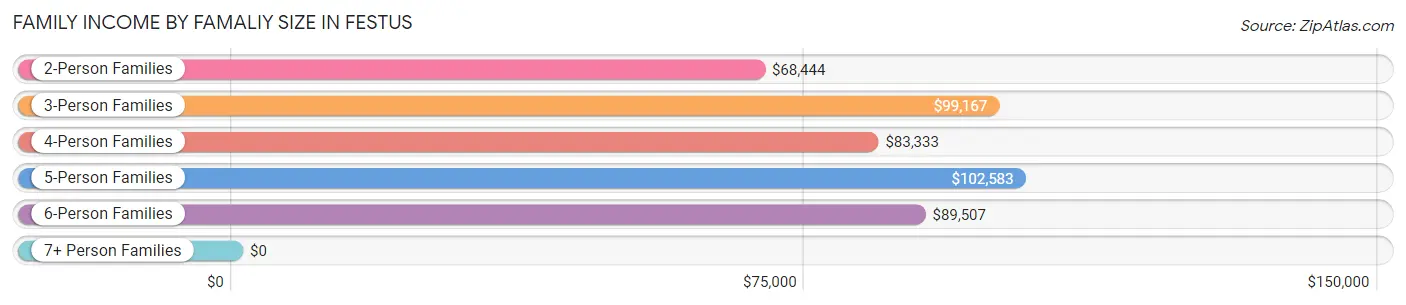
Family Income by Famaliy Size in Festus
5-person families (211 | 6.1%) account for the highest median family income in Festus with $102,583 per family, while 2-person families (1,472 | 42.9%) have the highest median income of $34,222 per family member.
| Income Bracket | # Families | Median Income |
| 2-Person Families | 1,472 (42.9%) | $68,444 |
| 3-Person Families | 930 (27.1%) | $99,167 |
| 4-Person Families | 708 (20.6%) | $83,333 |
| 5-Person Families | 211 (6.1%) | $102,583 |
| 6-Person Families | 61 (1.8%) | $89,507 |
| 7+ Person Families | 48 (1.4%) | $0 |
| Total | 3,430 (100.0%) | $78,139 |
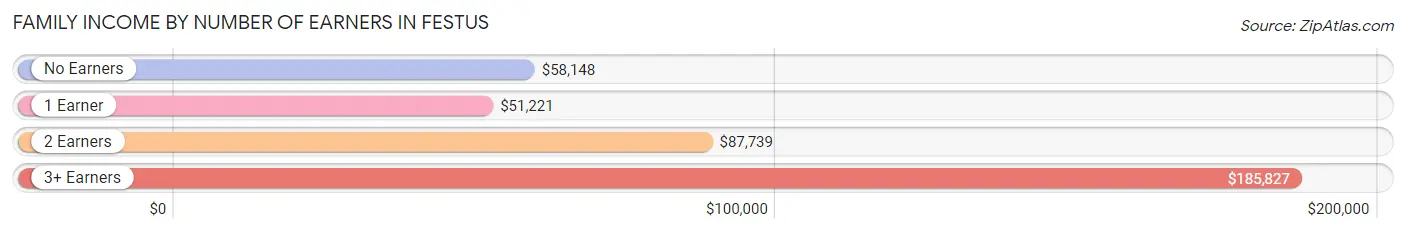
Family Income by Number of Earners in Festus
The median family income in Festus is $78,139, with families comprising 3+ earners (523) having the highest median family income of $185,827, while families with 1 earner (1,214) have the lowest median family income of $51,221, accounting for 15.2% and 35.4% of families, respectively.
| Number of Earners | # Families | Median Income |
| No Earners | 478 (13.9%) | $58,148 |
| 1 Earner | 1,214 (35.4%) | $51,221 |
| 2 Earners | 1,215 (35.4%) | $87,739 |
| 3+ Earners | 523 (15.2%) | $185,827 |
| Total | 3,430 (100.0%) | $78,139 |
Household Income in Festus
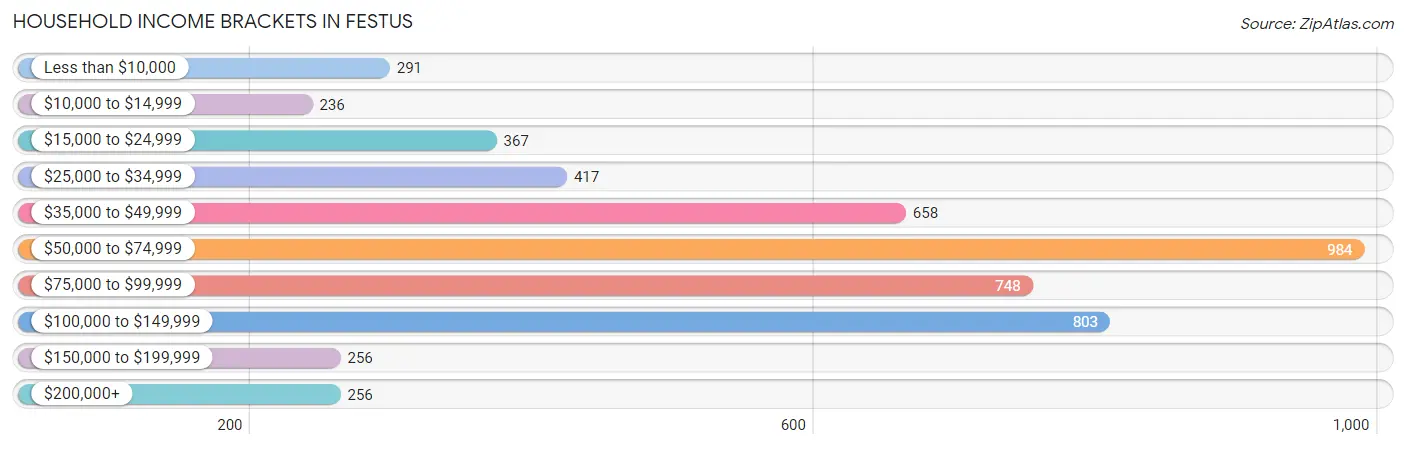
Household Income Brackets in Festus
With 984 households falling in the category, the $50,000 to $74,999 income range is the most frequent in Festus, accounting for 19.6% of all households. In contrast, only 236 households (4.7%) fall into the $10,000 to $14,999 income bracket, making it the least populous group.
| Income Bracket | # Households | % Households |
| Less than $10,000 | 291 | 5.8% |
| $10,000 to $14,999 | 236 | 4.7% |
| $15,000 to $24,999 | 367 | 7.3% |
| $25,000 to $34,999 | 417 | 8.3% |
| $35,000 to $49,999 | 658 | 13.1% |
| $50,000 to $74,999 | 984 | 19.6% |
| $75,000 to $99,999 | 748 | 14.9% |
| $100,000 to $149,999 | 803 | 16.0% |
| $150,000 to $199,999 | 256 | 5.1% |
| $200,000+ | 256 | 5.1% |
Household Income by Householder Age in Festus
The median household income in Festus is $65,942, with the highest median household income of $69,560 found in the 25 to 44 years age bracket for the primary householder. A total of 1,962 households (39.1%) fall into this category. Meanwhile, the 15 to 24 years age bracket for the primary householder has the lowest median household income of $0, with 55 households (1.1%) in this group.
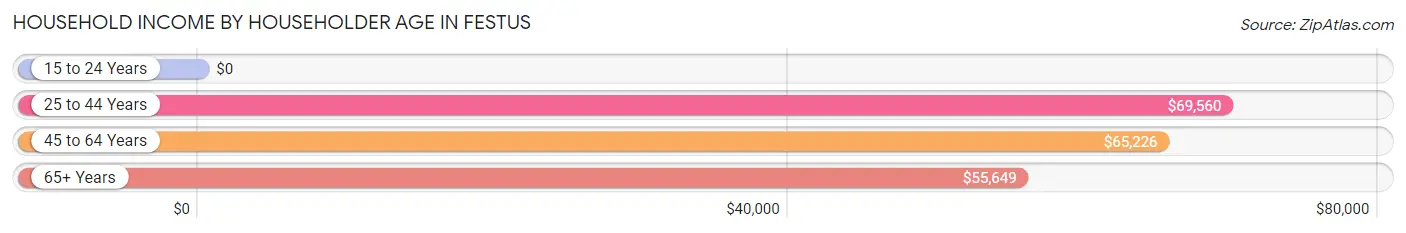
| Income Bracket | # Households | Median Income |
| 15 to 24 Years | 55 (1.1%) | $0 |
| 25 to 44 Years | 1,962 (39.1%) | $69,560 |
| 45 to 64 Years | 1,695 (33.8%) | $65,226 |
| 65+ Years | 1,309 (26.1%) | $55,649 |
| Total | 5,021 (100.0%) | $65,942 |
Poverty in Festus
Income Below Poverty by Sex and Age in Festus
With 10.3% poverty level for males and 13.9% for females among the residents of Festus, 6 to 11 year old males and 35 to 44 year old females are the most vulnerable to poverty, with 104 males (18.3%) and 203 females (20.7%) in their respective age groups living below the poverty level.
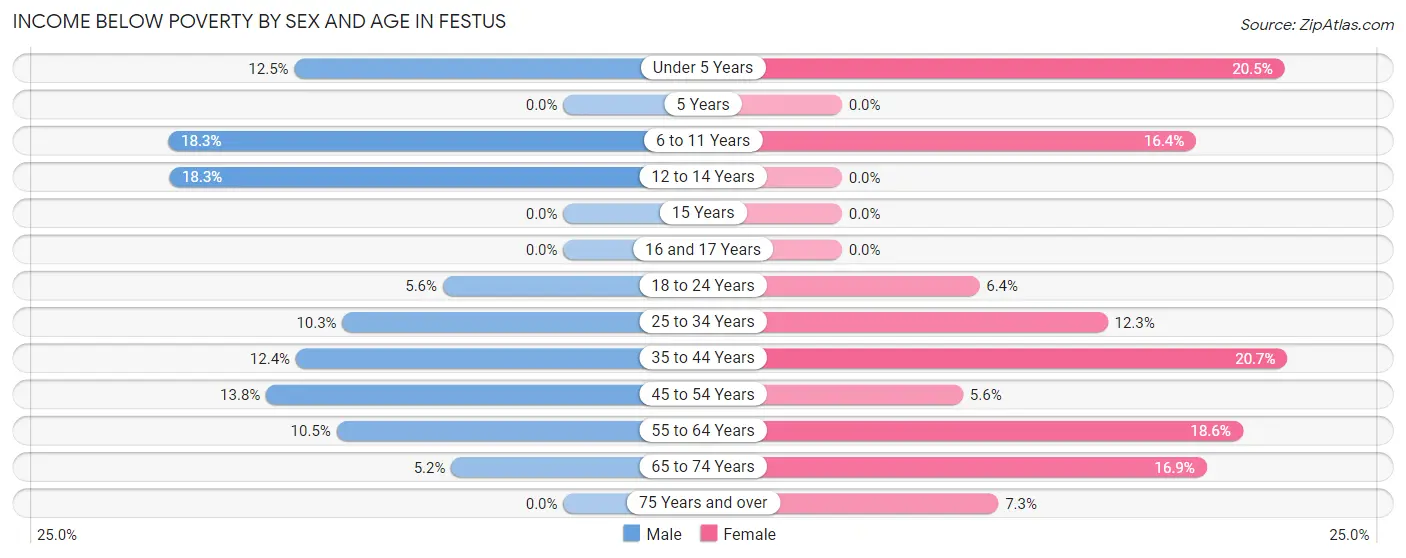
| Age Bracket | Male | Female |
| Under 5 Years | 69 (12.5%) | 107 (20.5%) |
| 5 Years | 0 (0.0%) | 0 (0.0%) |
| 6 to 11 Years | 104 (18.3%) | 108 (16.4%) |
| 12 to 14 Years | 28 (18.3%) | 0 (0.0%) |
| 15 Years | 0 (0.0%) | 0 (0.0%) |
| 16 and 17 Years | 0 (0.0%) | 0 (0.0%) |
| 18 to 24 Years | 36 (5.6%) | 27 (6.4%) |
| 25 to 34 Years | 85 (10.2%) | 106 (12.3%) |
| 35 to 44 Years | 98 (12.4%) | 203 (20.7%) |
| 45 to 54 Years | 103 (13.8%) | 36 (5.6%) |
| 55 to 64 Years | 63 (10.5%) | 176 (18.6%) |
| 65 to 74 Years | 29 (5.2%) | 116 (16.9%) |
| 75 Years and over | 0 (0.0%) | 26 (7.3%) |
| Total | 615 (10.3%) | 905 (13.9%) |
Income Above Poverty by Sex and Age in Festus
According to the poverty statistics in Festus, males aged 5 years and females aged 5 years are the age groups that are most secure financially, with 100.0% of males and 100.0% of females in these age groups living above the poverty line.
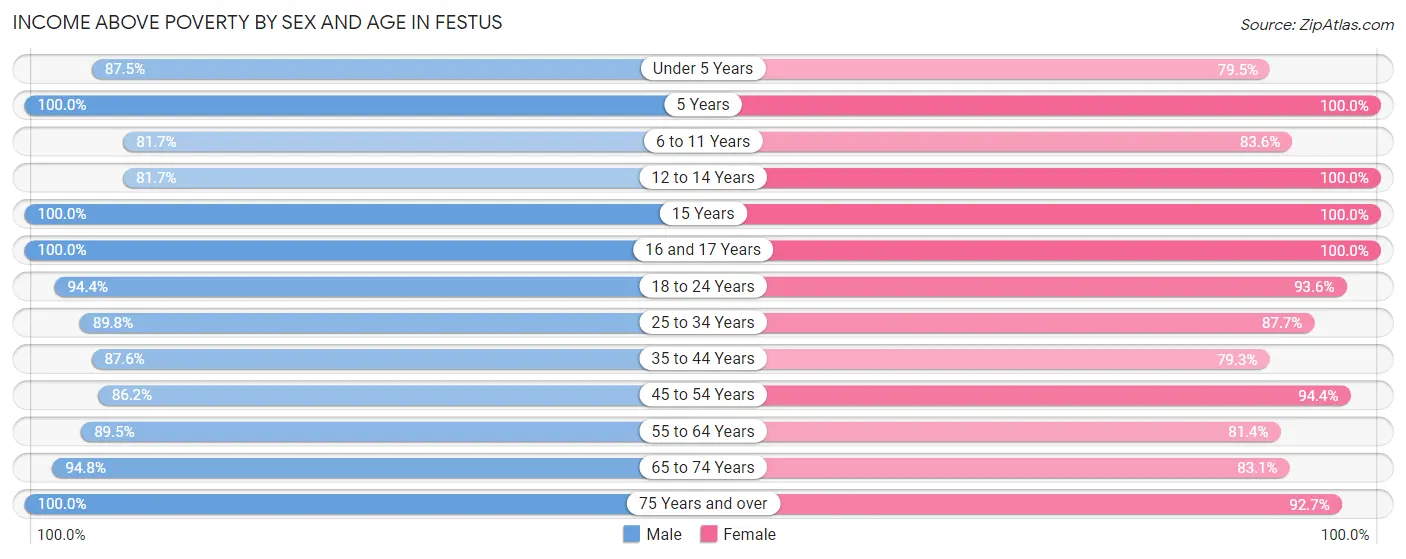
| Age Bracket | Male | Female |
| Under 5 Years | 484 (87.5%) | 414 (79.5%) |
| 5 Years | 34 (100.0%) | 80 (100.0%) |
| 6 to 11 Years | 463 (81.7%) | 549 (83.6%) |
| 12 to 14 Years | 125 (81.7%) | 279 (100.0%) |
| 15 Years | 50 (100.0%) | 48 (100.0%) |
| 16 and 17 Years | 123 (100.0%) | 46 (100.0%) |
| 18 to 24 Years | 608 (94.4%) | 396 (93.6%) |
| 25 to 34 Years | 744 (89.7%) | 754 (87.7%) |
| 35 to 44 Years | 692 (87.6%) | 779 (79.3%) |
| 45 to 54 Years | 644 (86.2%) | 605 (94.4%) |
| 55 to 64 Years | 536 (89.5%) | 770 (81.4%) |
| 65 to 74 Years | 529 (94.8%) | 569 (83.1%) |
| 75 Years and over | 309 (100.0%) | 332 (92.7%) |
| Total | 5,341 (89.7%) | 5,621 (86.1%) |
Income Below Poverty Among Married-Couple Families in Festus
The poverty statistics for married-couple families in Festus show that 3.5% or 81 of the total 2,317 families live below the poverty line. Families with 5 or more children have the highest poverty rate of 100.0%, comprising of 38 families. On the other hand, families with 3 or 4 children have the lowest poverty rate of 0.0%, which includes 0 families.
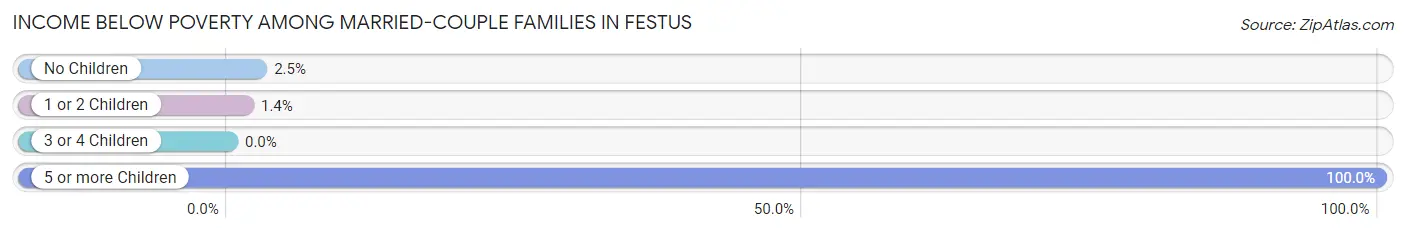
| Children | Above Poverty | Below Poverty |
| No Children | 1,268 (97.5%) | 33 (2.5%) |
| 1 or 2 Children | 712 (98.6%) | 10 (1.4%) |
| 3 or 4 Children | 256 (100.0%) | 0 (0.0%) |
| 5 or more Children | 0 (0.0%) | 38 (100.0%) |
| Total | 2,236 (96.5%) | 81 (3.5%) |
Income Below Poverty Among Single-Parent Households in Festus
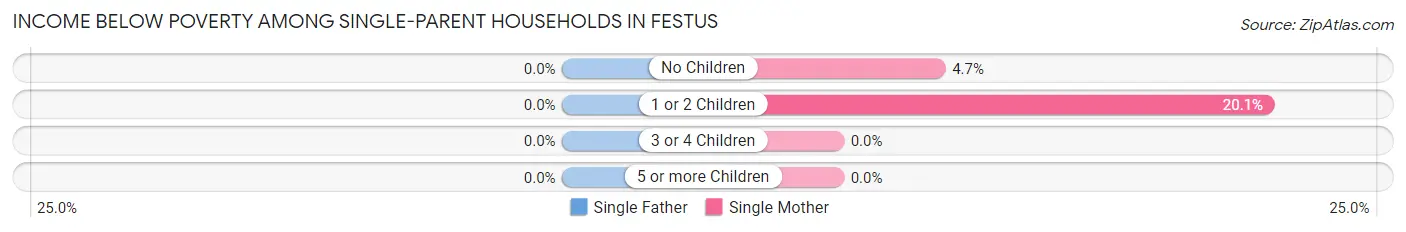
| Children | Single Father | Single Mother |
| No Children | 0 (0.0%) | 16 (4.7%) |
| 1 or 2 Children | 0 (0.0%) | 107 (20.1%) |
| 3 or 4 Children | 0 (0.0%) | 0 (0.0%) |
| 5 or more Children | 0 (0.0%) | 0 (0.0%) |
| Total | 0 (0.0%) | 123 (14.1%) |
Income Below Poverty Among Married-Couple vs Single-Parent Households in Festus
The poverty data for Festus shows that 81 of the married-couple family households (3.5%) and 123 of the single-parent households (11.1%) are living below the poverty level. Within the married-couple family households, those with 5 or more children have the highest poverty rate, with 38 households (100.0%) falling below the poverty line. Among the single-parent households, those with 1 or 2 children have the highest poverty rate, with 107 household (16.7%) living below poverty.
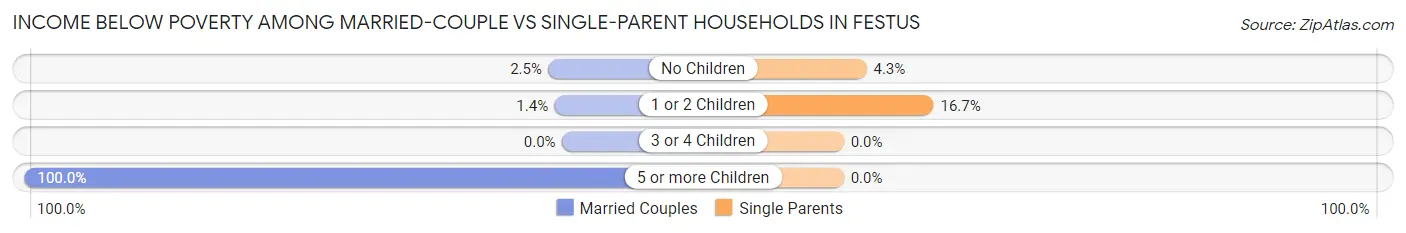
| Children | Married-Couple Families | Single-Parent Households |
| No Children | 33 (2.5%) | 16 (4.3%) |
| 1 or 2 Children | 10 (1.4%) | 107 (16.7%) |
| 3 or 4 Children | 0 (0.0%) | 0 (0.0%) |
| 5 or more Children | 38 (100.0%) | 0 (0.0%) |
| Total | 81 (3.5%) | 123 (11.1%) |
Race in Festus
The most populous races in Festus are White / Caucasian (11,267 | 88.2%), Two or more Races (950 | 7.4%), and Hispanic or Latino (499 | 3.9%).
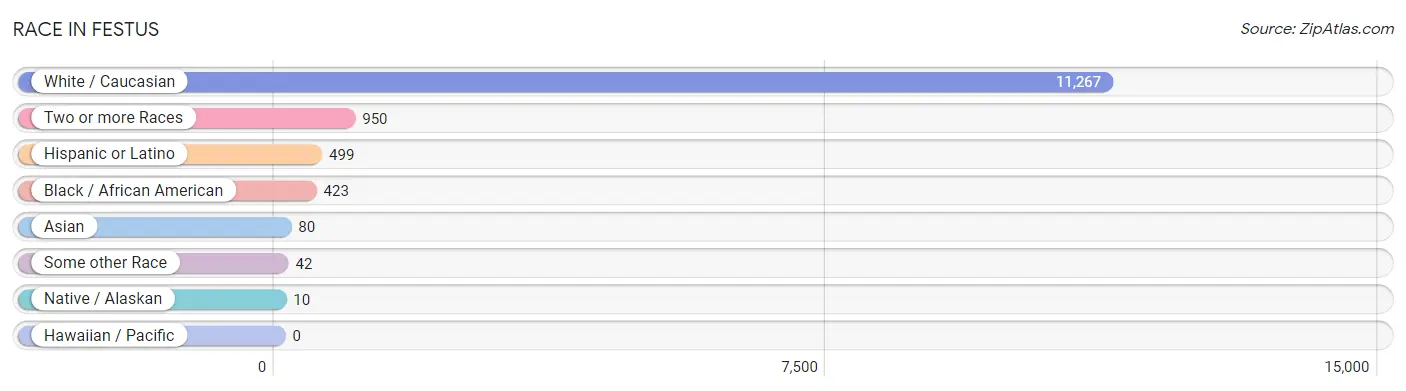
| Race | # Population | % Population |
| Asian | 80 | 0.6% |
| Black / African American | 423 | 3.3% |
| Hawaiian / Pacific | 0 | 0.0% |
| Hispanic or Latino | 499 | 3.9% |
| Native / Alaskan | 10 | 0.1% |
| White / Caucasian | 11,267 | 88.2% |
| Two or more Races | 950 | 7.4% |
| Some other Race | 42 | 0.3% |
| Total | 12,772 | 100.0% |
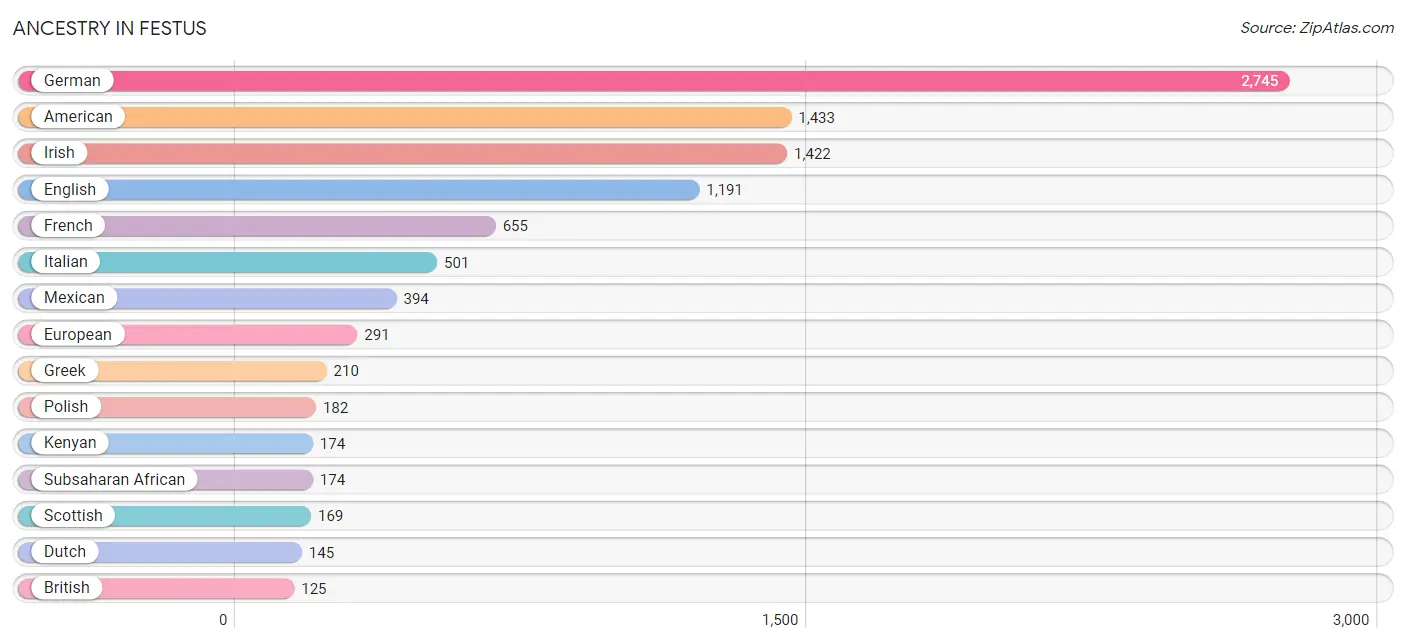
Ancestry in Festus
The most populous ancestries reported in Festus are German (2,745 | 21.5%), American (1,433 | 11.2%), Irish (1,422 | 11.1%), English (1,191 | 9.3%), and French (655 | 5.1%), together accounting for 58.3% of all Festus residents.
| Ancestry | # Population | % Population |
| American | 1,433 | 11.2% |
| Apache | 8 | 0.1% |
| Arab | 52 | 0.4% |
| Belgian | 16 | 0.1% |
| Bhutanese | 9 | 0.1% |
| British | 125 | 1.0% |
| Celtic | 26 | 0.2% |
| Central American Indian | 5 | 0.0% |
| Cherokee | 22 | 0.2% |
| Croatian | 30 | 0.2% |
| Cuban | 15 | 0.1% |
| Czech | 38 | 0.3% |
| Danish | 19 | 0.2% |
| Dutch | 145 | 1.1% |
| Eastern European | 54 | 0.4% |
| English | 1,191 | 9.3% |
| European | 291 | 2.3% |
| French | 655 | 5.1% |
| French American Indian | 1 | 0.0% |
| German | 2,745 | 21.5% |
| Greek | 210 | 1.6% |
| Hungarian | 38 | 0.3% |
| Irish | 1,422 | 11.1% |
| Iroquois | 7 | 0.1% |
| Italian | 501 | 3.9% |
| Kenyan | 174 | 1.4% |
| Korean | 32 | 0.3% |
| Lebanese | 22 | 0.2% |
| Lithuanian | 18 | 0.1% |
| Mexican | 394 | 3.1% |
| Norwegian | 55 | 0.4% |
| Pennsylvania German | 15 | 0.1% |
| Polish | 182 | 1.4% |
| Russian | 7 | 0.1% |
| Scandinavian | 13 | 0.1% |
| Scotch-Irish | 111 | 0.9% |
| Scottish | 169 | 1.3% |
| Slavic | 20 | 0.2% |
| Slovene | 10 | 0.1% |
| Spanish | 77 | 0.6% |
| Sri Lankan | 14 | 0.1% |
| Subsaharan African | 174 | 1.4% |
| Swedish | 51 | 0.4% |
| Tongan | 15 | 0.1% |
| Ukrainian | 14 | 0.1% | View All 45 Rows |
Immigrants in Festus
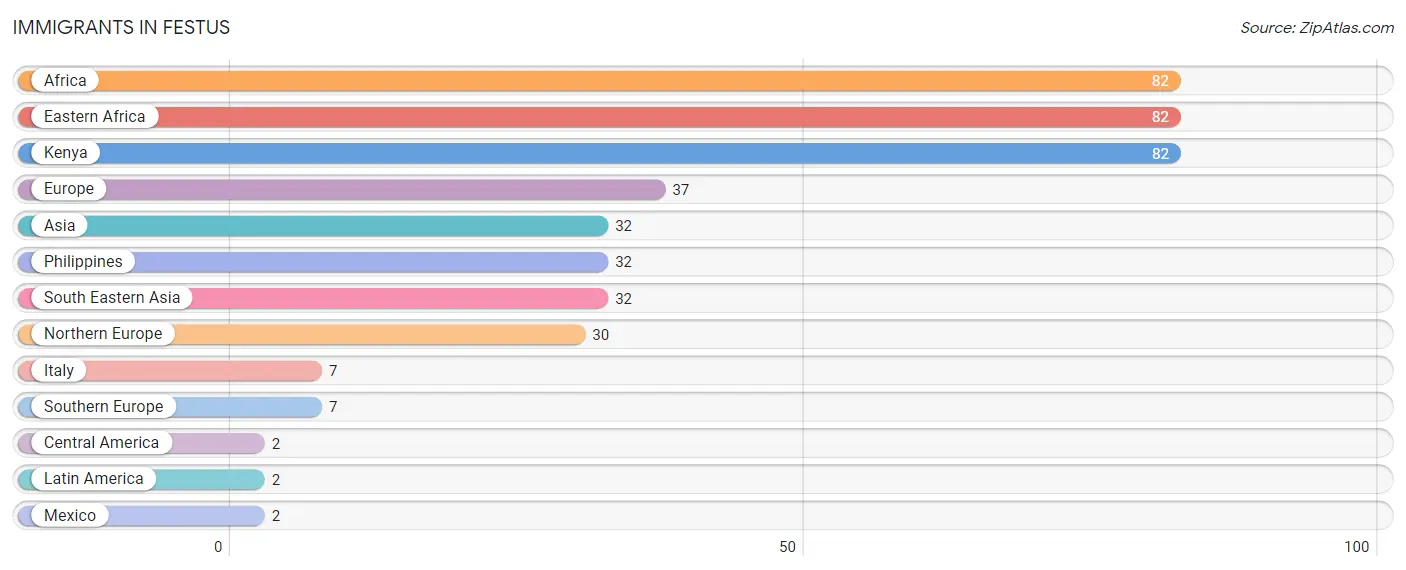
The most numerous immigrant groups reported in Festus came from Africa (82 | 0.6%), Eastern Africa (82 | 0.6%), Kenya (82 | 0.6%), Europe (37 | 0.3%), and Asia (32 | 0.3%), together accounting for 2.5% of all Festus residents.
| Immigration Origin | # Population | % Population |
| Africa | 82 | 0.6% |
| Asia | 32 | 0.3% |
| Central America | 2 | 0.0% |
| Eastern Africa | 82 | 0.6% |
| Europe | 37 | 0.3% |
| Italy | 7 | 0.1% |
| Kenya | 82 | 0.6% |
| Latin America | 2 | 0.0% |
| Mexico | 2 | 0.0% |
| Northern Europe | 30 | 0.2% |
| Philippines | 32 | 0.3% |
| South Eastern Asia | 32 | 0.3% |
| Southern Europe | 7 | 0.1% | View All 13 Rows |
Sex and Age in Festus
Sex and Age in Festus
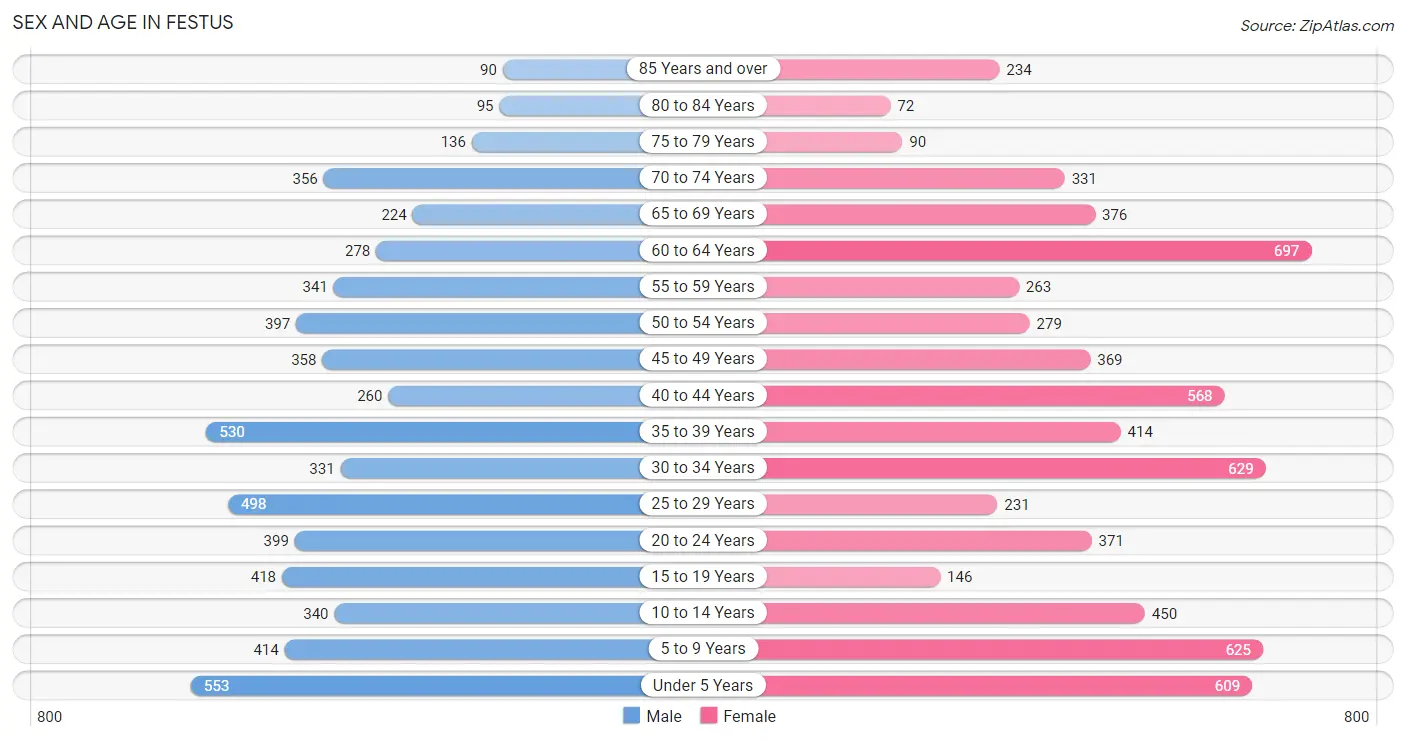
The most populous age groups in Festus are Under 5 Years (553 | 9.2%) for men and 60 to 64 Years (697 | 10.3%) for women.
| Age Bracket | Male | Female |
| Under 5 Years | 553 (9.2%) | 609 (9.0%) |
| 5 to 9 Years | 414 (6.9%) | 625 (9.2%) |
| 10 to 14 Years | 340 (5.7%) | 450 (6.7%) |
| 15 to 19 Years | 418 (7.0%) | 146 (2.2%) |
| 20 to 24 Years | 399 (6.6%) | 371 (5.5%) |
| 25 to 29 Years | 498 (8.3%) | 231 (3.4%) |
| 30 to 34 Years | 331 (5.5%) | 629 (9.3%) |
| 35 to 39 Years | 530 (8.8%) | 414 (6.1%) |
| 40 to 44 Years | 260 (4.3%) | 568 (8.4%) |
| 45 to 49 Years | 358 (5.9%) | 369 (5.5%) |
| 50 to 54 Years | 397 (6.6%) | 279 (4.1%) |
| 55 to 59 Years | 341 (5.7%) | 263 (3.9%) |
| 60 to 64 Years | 278 (4.6%) | 697 (10.3%) |
| 65 to 69 Years | 224 (3.7%) | 376 (5.6%) |
| 70 to 74 Years | 356 (5.9%) | 331 (4.9%) |
| 75 to 79 Years | 136 (2.3%) | 90 (1.3%) |
| 80 to 84 Years | 95 (1.6%) | 72 (1.1%) |
| 85 Years and over | 90 (1.5%) | 234 (3.5%) |
| Total | 6,018 (100.0%) | 6,754 (100.0%) |
Families and Households in Festus
Median Family Size in Festus
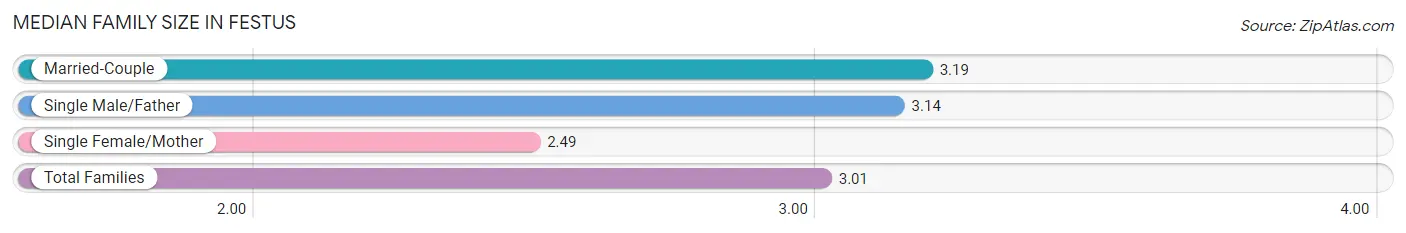
The median family size in Festus is 3.01 persons per family, with married-couple families (2,317 | 67.5%) accounting for the largest median family size of 3.19 persons per family. On the other hand, single female/mother families (871 | 25.4%) represent the smallest median family size with 2.49 persons per family.
| Family Type | # Families | Family Size |
| Married-Couple | 2,317 (67.5%) | 3.19 |
| Single Male/Father | 242 (7.1%) | 3.14 |
| Single Female/Mother | 871 (25.4%) | 2.49 |
| Total Families | 3,430 (100.0%) | 3.01 |
Median Household Size in Festus
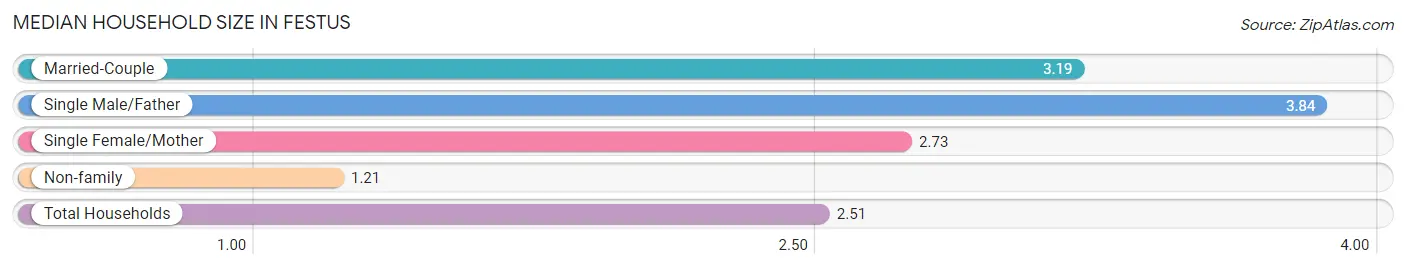
The median household size in Festus is 2.51 persons per household, with single male/father households (242 | 4.8%) accounting for the largest median household size of 3.84 persons per household. non-family households (1,591 | 31.7%) represent the smallest median household size with 1.21 persons per household.
| Household Type | # Households | Household Size |
| Married-Couple | 2,317 (46.2%) | 3.19 |
| Single Male/Father | 242 (4.8%) | 3.84 |
| Single Female/Mother | 871 (17.3%) | 2.73 |
| Non-family | 1,591 (31.7%) | 1.21 |
| Total Households | 5,021 (100.0%) | 2.51 |
Household Size by Marriage Status in Festus
Out of a total of 5,021 households in Festus, 3,430 (68.3%) are family households, while 1,591 (31.7%) are nonfamily households. The most numerous type of family households are 2-person households, comprising 1,370, and the most common type of nonfamily households are 1-person households, comprising 1,371.
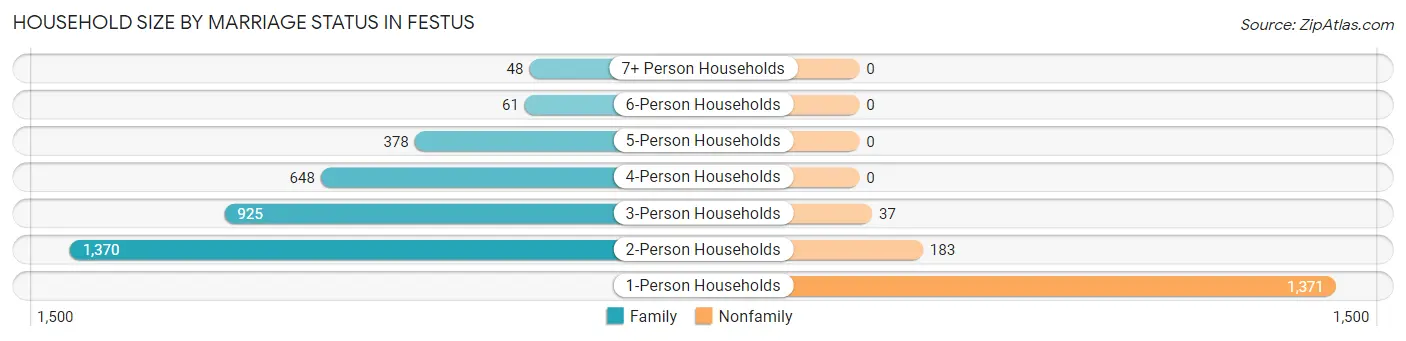
| Household Size | Family Households | Nonfamily Households |
| 1-Person Households | - | 1,371 (27.3%) |
| 2-Person Households | 1,370 (27.3%) | 183 (3.6%) |
| 3-Person Households | 925 (18.4%) | 37 (0.7%) |
| 4-Person Households | 648 (12.9%) | 0 (0.0%) |
| 5-Person Households | 378 (7.5%) | 0 (0.0%) |
| 6-Person Households | 61 (1.2%) | 0 (0.0%) |
| 7+ Person Households | 48 (1.0%) | 0 (0.0%) |
| Total | 3,430 (68.3%) | 1,591 (31.7%) |
Female Fertility in Festus
Fertility by Age in Festus
Average fertility rate in Festus is 80.0 births per 1,000 women. Women in the age bracket of 20 to 34 years have the highest fertility rate with 171.0 births per 1,000 women. Women in the age bracket of 20 to 34 years acount for 94.2% of all women with births.
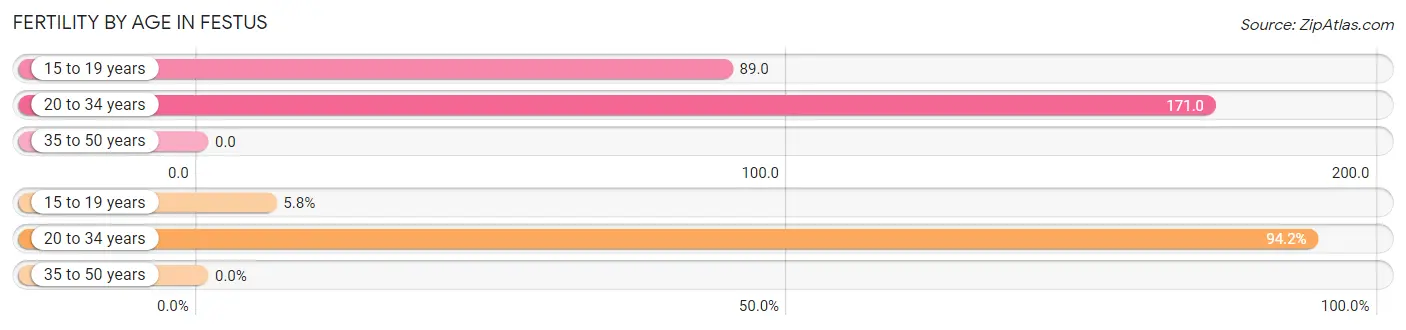
| Age Bracket | Women with Births | Births / 1,000 Women |
| 15 to 19 years | 13 (5.8%) | 89.0 |
| 20 to 34 years | 211 (94.2%) | 171.0 |
| 35 to 50 years | 0 (0.0%) | 0.0 |
| Total | 224 (100.0%) | 80.0 |
Fertility by Age by Marriage Status in Festus
62.1% of women with births (224) in Festus are married. The highest percentage of unmarried women with births falls into 15 to 19 years age bracket with 100.0% of them unmarried at the time of birth, while the lowest percentage of unmarried women with births belong to 20 to 34 years age bracket with 34.1% of them unmarried.
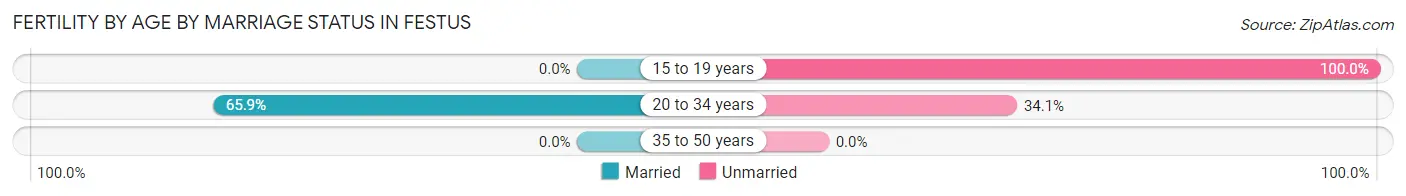
| Age Bracket | Married | Unmarried |
| 15 to 19 years | 0 (0.0%) | 13 (100.0%) |
| 20 to 34 years | 139 (65.9%) | 72 (34.1%) |
| 35 to 50 years | 0 (0.0%) | 0 (0.0%) |
| Total | 139 (62.1%) | 85 (38.0%) |
Fertility by Education in Festus
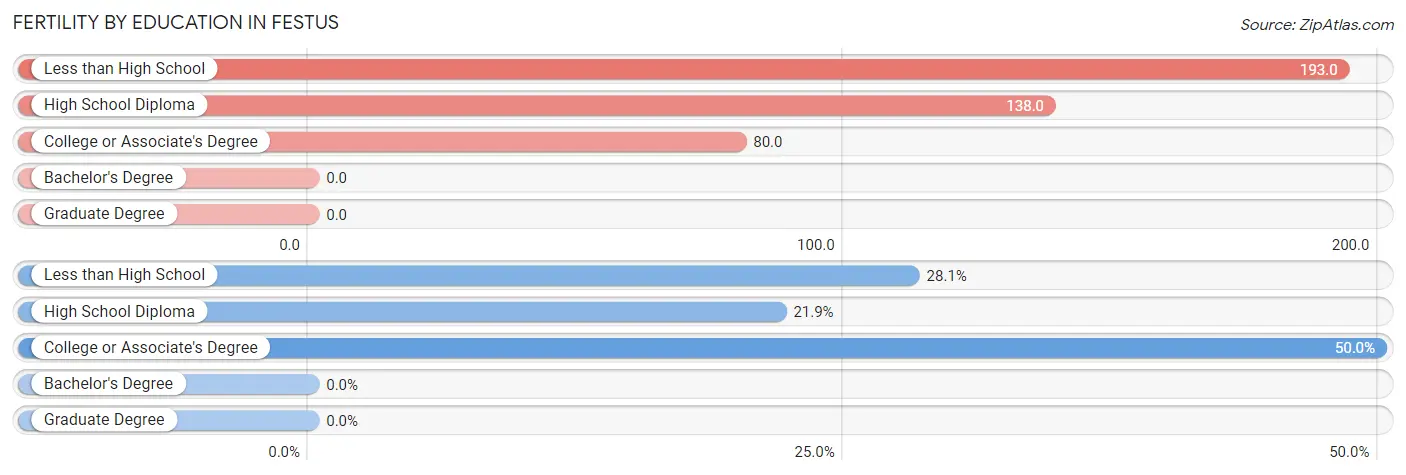
| Educational Attainment | Women with Births | Births / 1,000 Women |
| Less than High School | 63 (28.1%) | 193.0 |
| High School Diploma | 49 (21.9%) | 138.0 |
| College or Associate's Degree | 112 (50.0%) | 80.0 |
| Bachelor's Degree | 0 (0.0%) | 0.0 |
| Graduate Degree | 0 (0.0%) | 0.0 |
| Total | 224 (100.0%) | 80.0 |
Fertility by Education by Marriage Status in Festus
38.0% of women with births in Festus are unmarried. Women with the educational attainment of college or associate's degree are most likely to be married with 77.7% of them married at childbirth, while women with the educational attainment of high school diploma are least likely to be married with 63.3% of them unmarried at childbirth.
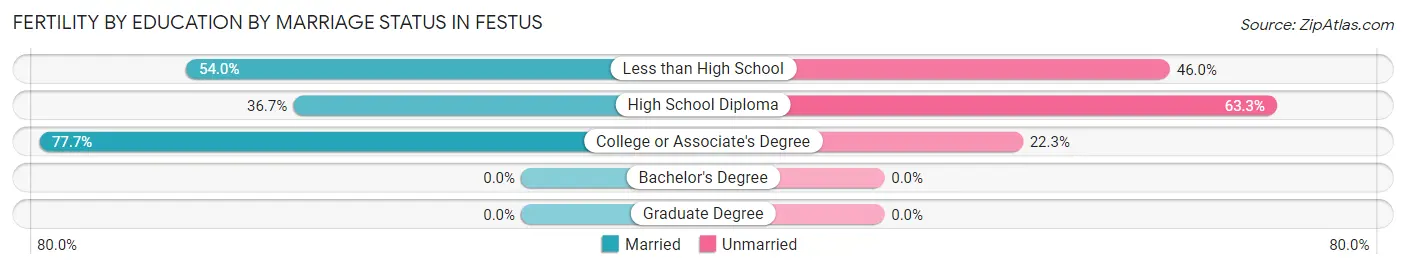
| Educational Attainment | Married | Unmarried |
| Less than High School | 34 (54.0%) | 29 (46.0%) |
| High School Diploma | 18 (36.7%) | 31 (63.3%) |
| College or Associate's Degree | 87 (77.7%) | 25 (22.3%) |
| Bachelor's Degree | 0 (0.0%) | 0 (0.0%) |
| Graduate Degree | 0 (0.0%) | 0 (0.0%) |
| Total | 139 (62.1%) | 85 (38.0%) |
Employment Characteristics in Festus
Employment by Class of Employer in Festus
Among the 5,528 employed individuals in Festus, private company employees (3,954 | 71.5%), not-for-profit organizations (489 | 8.8%), and local government employees (353 | 6.4%) make up the most common classes of employment.
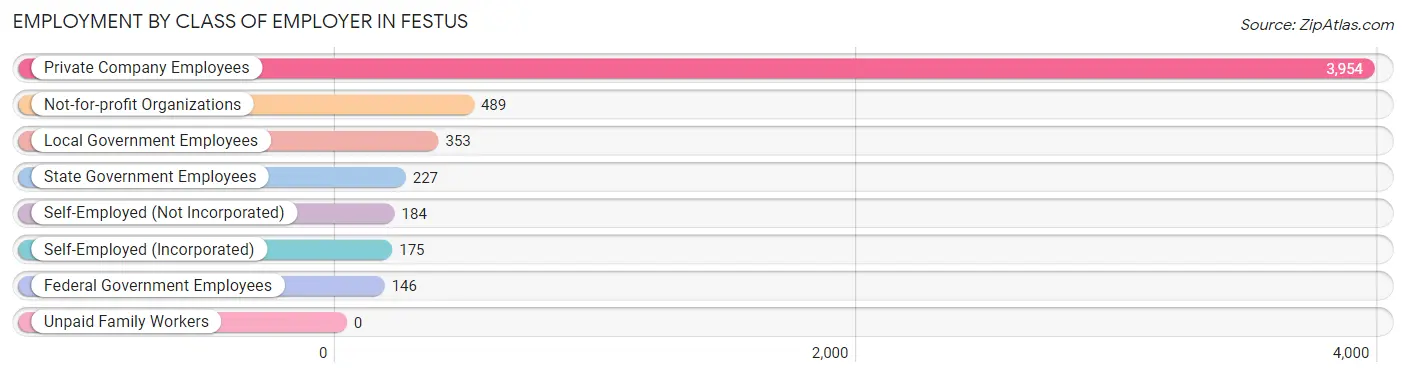
| Employer Class | # Employees | % Employees |
| Private Company Employees | 3,954 | 71.5% |
| Self-Employed (Incorporated) | 175 | 3.2% |
| Self-Employed (Not Incorporated) | 184 | 3.3% |
| Not-for-profit Organizations | 489 | 8.8% |
| Local Government Employees | 353 | 6.4% |
| State Government Employees | 227 | 4.1% |
| Federal Government Employees | 146 | 2.6% |
| Unpaid Family Workers | 0 | 0.0% |
| Total | 5,528 | 100.0% |
Employment Status by Age in Festus
According to the labor force statistics for Festus, out of the total population over 16 years of age (9,683), 61.2% or 5,926 individuals are in the labor force, with 5.4% or 320 of them unemployed. The age group with the highest labor force participation rate is 20 to 24 years, with 87.1% or 671 individuals in the labor force. Within the labor force, the 60 to 64 years age range has the highest percentage of unemployed individuals, with 15.4% or 76 of them being unemployed.
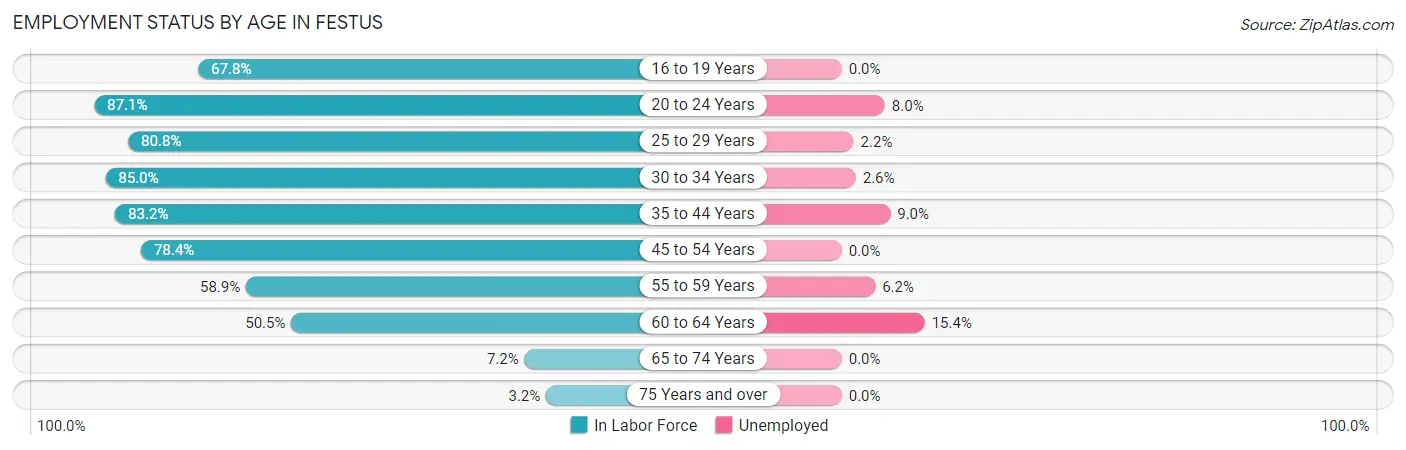
| Age Bracket | In Labor Force | Unemployed |
| 16 to 19 Years | 316 (67.8%) | 0 (0.0%) |
| 20 to 24 Years | 671 (87.1%) | 54 (8.0%) |
| 25 to 29 Years | 589 (80.8%) | 13 (2.2%) |
| 30 to 34 Years | 816 (85.0%) | 21 (2.6%) |
| 35 to 44 Years | 1,474 (83.2%) | 133 (9.0%) |
| 45 to 54 Years | 1,100 (78.4%) | 0 (0.0%) |
| 55 to 59 Years | 356 (58.9%) | 22 (6.2%) |
| 60 to 64 Years | 492 (50.5%) | 76 (15.4%) |
| 65 to 74 Years | 93 (7.2%) | 0 (0.0%) |
| 75 Years and over | 23 (3.2%) | 0 (0.0%) |
| Total | 5,926 (61.2%) | 320 (5.4%) |
Employment Status by Educational Attainment in Festus
According to labor force statistics for Festus, 74.9% of individuals (4,826) out of the total population between 25 and 64 years of age (6,443) are in the labor force, with 5.5% or 265 of them being unemployed. The group with the highest labor force participation rate are those with the educational attainment of bachelor's degree or higher, with 94.9% or 1,370 individuals in the labor force. Within the labor force, individuals with college / associate degree education have the highest percentage of unemployment, with 7.2% or 141 of them being unemployed.
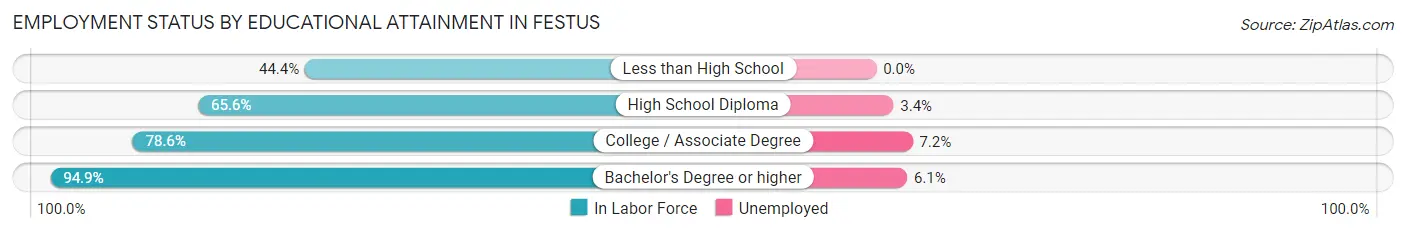
| Educational Attainment | In Labor Force | Unemployed |
| Less than High School | 307 (44.4%) | 0 (0.0%) |
| High School Diploma | 1,193 (65.6%) | 62 (3.4%) |
| College / Associate Degree | 1,956 (78.6%) | 179 (7.2%) |
| Bachelor's Degree or higher | 1,370 (94.9%) | 88 (6.1%) |
| Total | 4,826 (74.9%) | 354 (5.5%) |
Employment Occupations by Sex in Festus
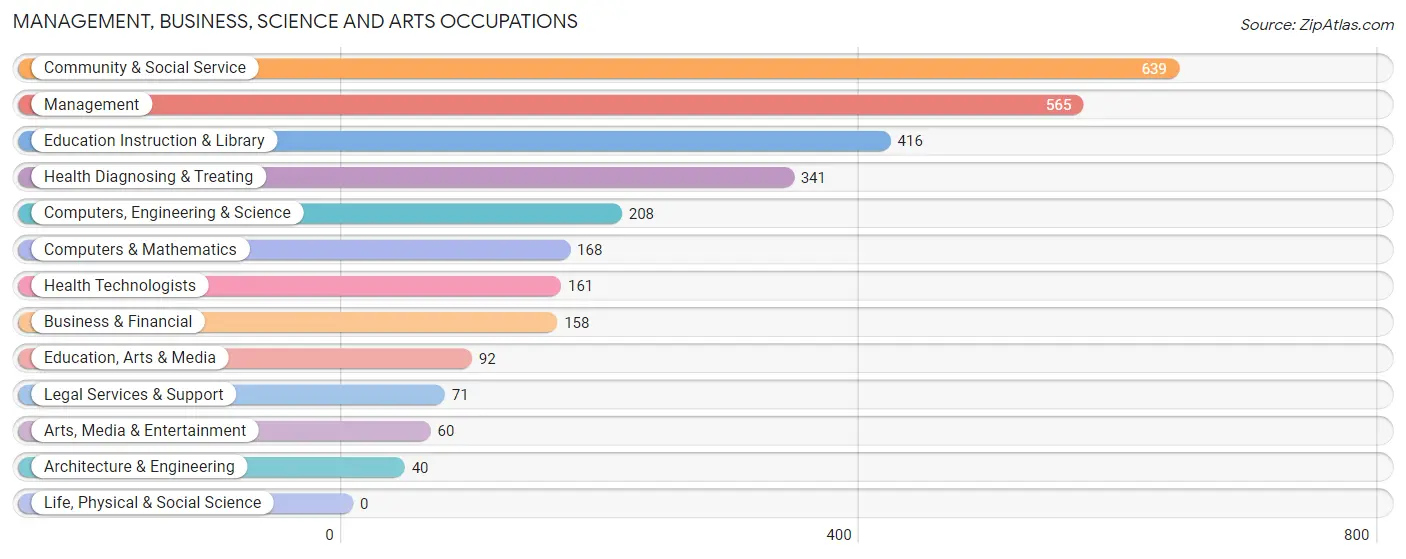
Management, Business, Science and Arts Occupations
The most common Management, Business, Science and Arts occupations in Festus are Community & Social Service (639 | 11.4%), Management (565 | 10.1%), Education Instruction & Library (416 | 7.4%), Health Diagnosing & Treating (341 | 6.1%), and Computers, Engineering & Science (208 | 3.7%).
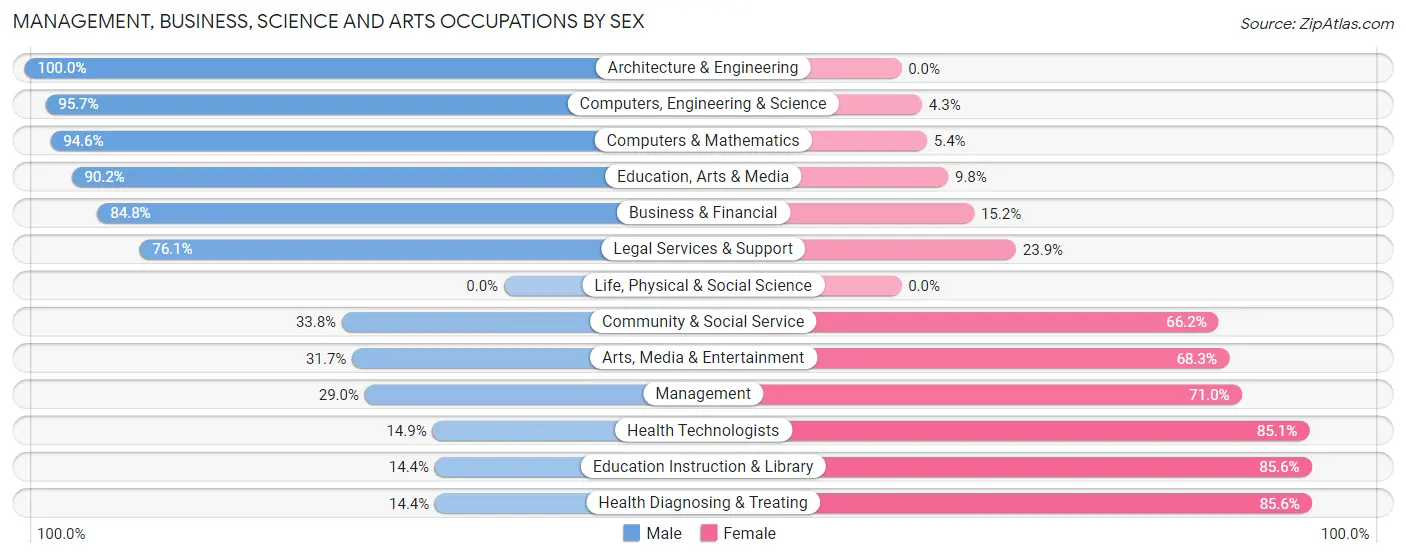
Management, Business, Science and Arts Occupations by Sex
Within the Management, Business, Science and Arts occupations in Festus, the most male-oriented occupations are Architecture & Engineering (100.0%), Computers, Engineering & Science (95.7%), and Computers & Mathematics (94.6%), while the most female-oriented occupations are Health Diagnosing & Treating (85.6%), Education Instruction & Library (85.6%), and Health Technologists (85.1%).
| Occupation | Male | Female |
| Management | 164 (29.0%) | 401 (71.0%) |
| Business & Financial | 134 (84.8%) | 24 (15.2%) |
| Computers, Engineering & Science | 199 (95.7%) | 9 (4.3%) |
| Computers & Mathematics | 159 (94.6%) | 9 (5.4%) |
| Architecture & Engineering | 40 (100.0%) | 0 (0.0%) |
| Life, Physical & Social Science | 0 (0.0%) | 0 (0.0%) |
| Community & Social Service | 216 (33.8%) | 423 (66.2%) |
| Education, Arts & Media | 83 (90.2%) | 9 (9.8%) |
| Legal Services & Support | 54 (76.1%) | 17 (23.9%) |
| Education Instruction & Library | 60 (14.4%) | 356 (85.6%) |
| Arts, Media & Entertainment | 19 (31.7%) | 41 (68.3%) |
| Health Diagnosing & Treating | 49 (14.4%) | 292 (85.6%) |
| Health Technologists | 24 (14.9%) | 137 (85.1%) |
| Total (Category) | 762 (39.9%) | 1,149 (60.1%) |
| Total (Overall) | 2,897 (51.6%) | 2,715 (48.4%) |
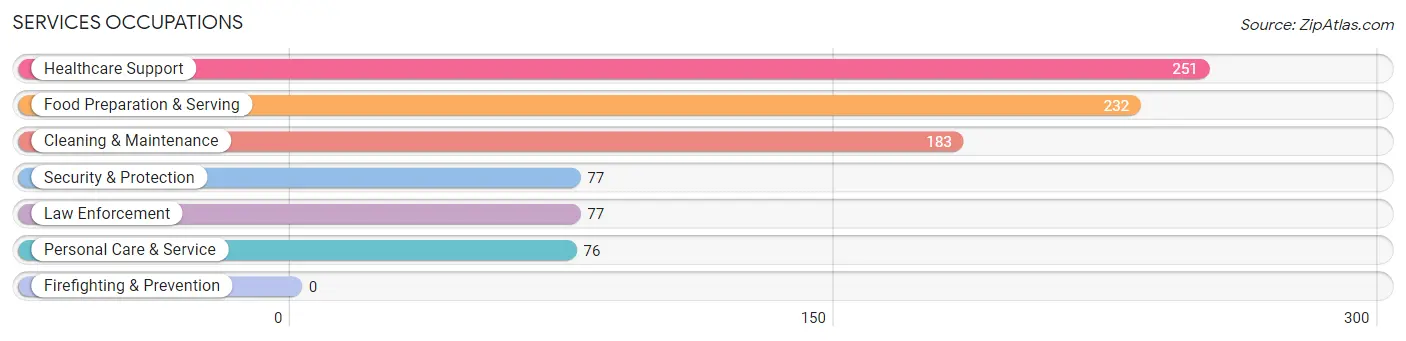
Services Occupations
The most common Services occupations in Festus are Healthcare Support (251 | 4.5%), Food Preparation & Serving (232 | 4.1%), Cleaning & Maintenance (183 | 3.3%), Security & Protection (77 | 1.4%), and Law Enforcement (77 | 1.4%).
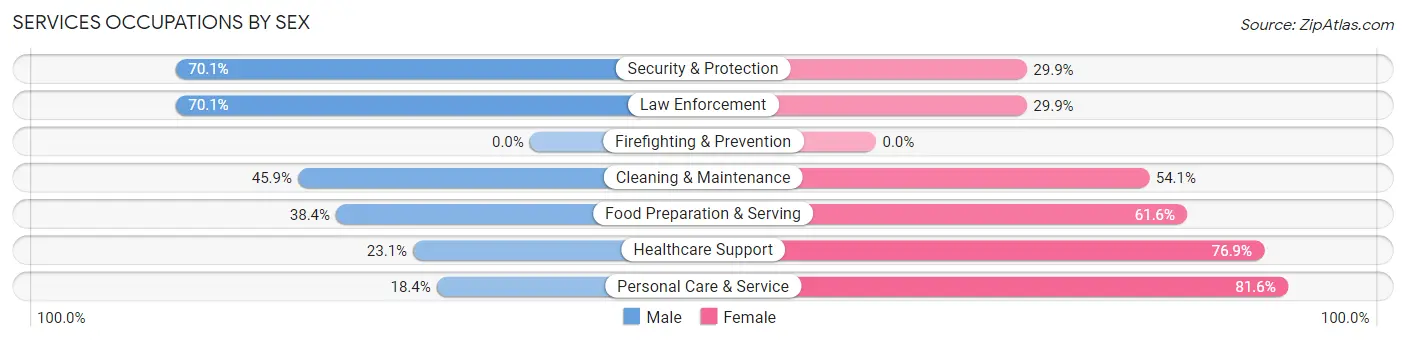
Services Occupations by Sex
Within the Services occupations in Festus, the most male-oriented occupations are Security & Protection (70.1%), Law Enforcement (70.1%), and Cleaning & Maintenance (45.9%), while the most female-oriented occupations are Personal Care & Service (81.6%), Healthcare Support (76.9%), and Food Preparation & Serving (61.6%).
| Occupation | Male | Female |
| Healthcare Support | 58 (23.1%) | 193 (76.9%) |
| Security & Protection | 54 (70.1%) | 23 (29.9%) |
| Firefighting & Prevention | 0 (0.0%) | 0 (0.0%) |
| Law Enforcement | 54 (70.1%) | 23 (29.9%) |
| Food Preparation & Serving | 89 (38.4%) | 143 (61.6%) |
| Cleaning & Maintenance | 84 (45.9%) | 99 (54.1%) |
| Personal Care & Service | 14 (18.4%) | 62 (81.6%) |
| Total (Category) | 299 (36.5%) | 520 (63.5%) |
| Total (Overall) | 2,897 (51.6%) | 2,715 (48.4%) |
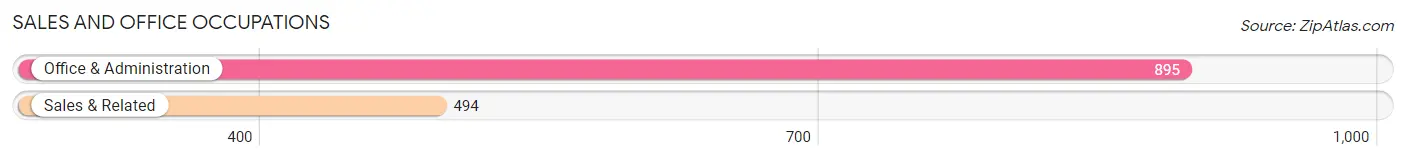
Sales and Office Occupations
The most common Sales and Office occupations in Festus are Office & Administration (895 | 16.0%), and Sales & Related (494 | 8.8%).
Sales and Office Occupations by Sex
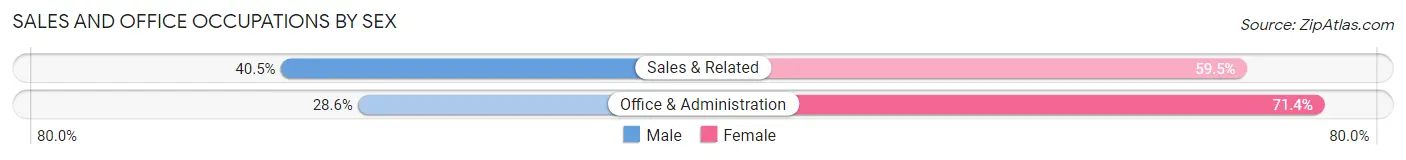
| Occupation | Male | Female |
| Sales & Related | 200 (40.5%) | 294 (59.5%) |
| Office & Administration | 256 (28.6%) | 639 (71.4%) |
| Total (Category) | 456 (32.8%) | 933 (67.2%) |
| Total (Overall) | 2,897 (51.6%) | 2,715 (48.4%) |
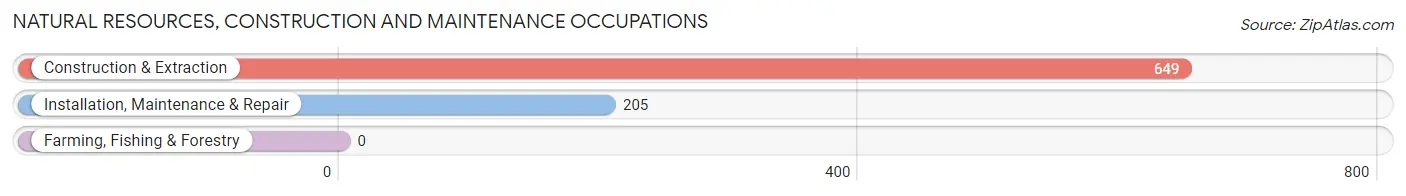
Natural Resources, Construction and Maintenance Occupations
The most common Natural Resources, Construction and Maintenance occupations in Festus are Construction & Extraction (649 | 11.6%), and Installation, Maintenance & Repair (205 | 3.6%).
Natural Resources, Construction and Maintenance Occupations by Sex
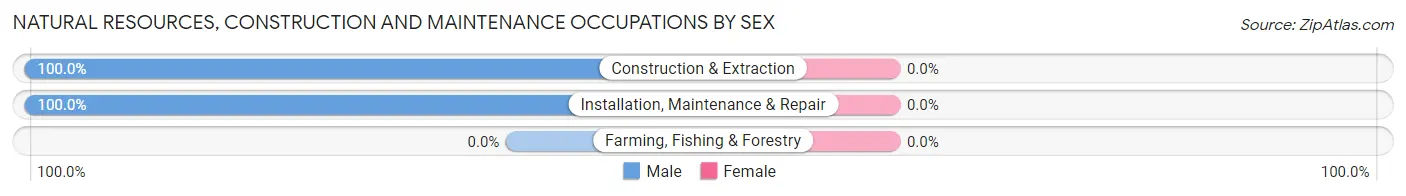
| Occupation | Male | Female |
| Farming, Fishing & Forestry | 0 (0.0%) | 0 (0.0%) |
| Construction & Extraction | 649 (100.0%) | 0 (0.0%) |
| Installation, Maintenance & Repair | 205 (100.0%) | 0 (0.0%) |
| Total (Category) | 854 (100.0%) | 0 (0.0%) |
| Total (Overall) | 2,897 (51.6%) | 2,715 (48.4%) |
Production, Transportation and Moving Occupations
The most common Production, Transportation and Moving occupations in Festus are Transportation (298 | 5.3%), Production (234 | 4.2%), and Material Moving (107 | 1.9%).
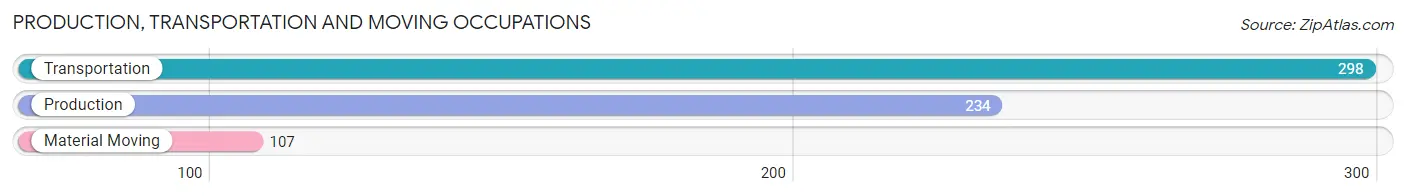
Production, Transportation and Moving Occupations by Sex
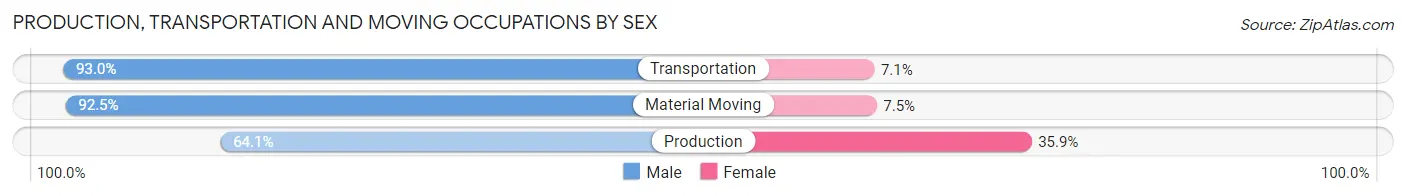
| Occupation | Male | Female |
| Production | 150 (64.1%) | 84 (35.9%) |
| Transportation | 277 (92.9%) | 21 (7.0%) |
| Material Moving | 99 (92.5%) | 8 (7.5%) |
| Total (Category) | 526 (82.3%) | 113 (17.7%) |
| Total (Overall) | 2,897 (51.6%) | 2,715 (48.4%) |
Employment Industries by Sex in Festus
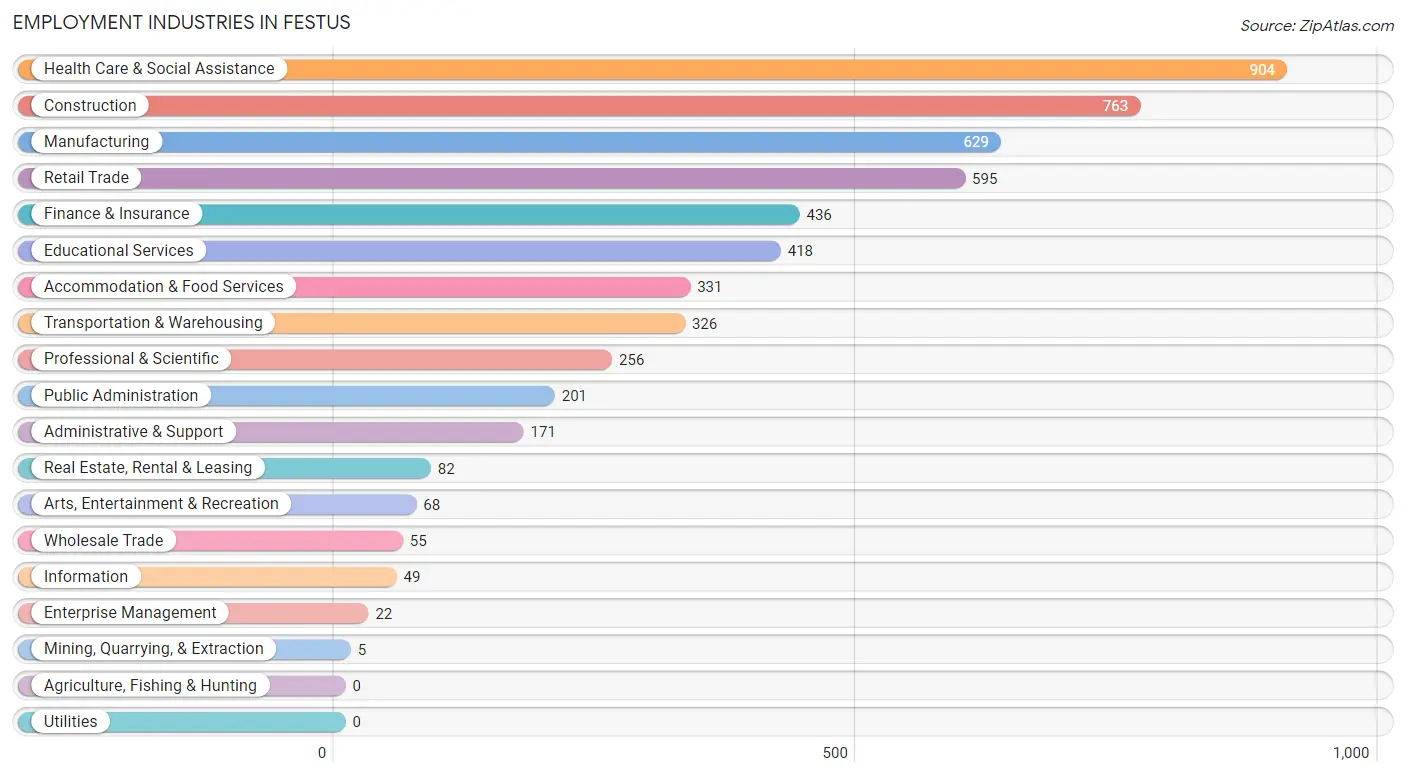
Employment Industries in Festus
The major employment industries in Festus include Health Care & Social Assistance (904 | 16.1%), Construction (763 | 13.6%), Manufacturing (629 | 11.2%), Retail Trade (595 | 10.6%), and Finance & Insurance (436 | 7.8%).
Employment Industries by Sex in Festus
The Festus industries that see more men than women are Mining, Quarrying, & Extraction (100.0%), Construction (100.0%), and Information (100.0%), whereas the industries that tend to have a higher number of women are Health Care & Social Assistance (87.6%), Arts, Entertainment & Recreation (86.8%), and Administrative & Support (81.3%).
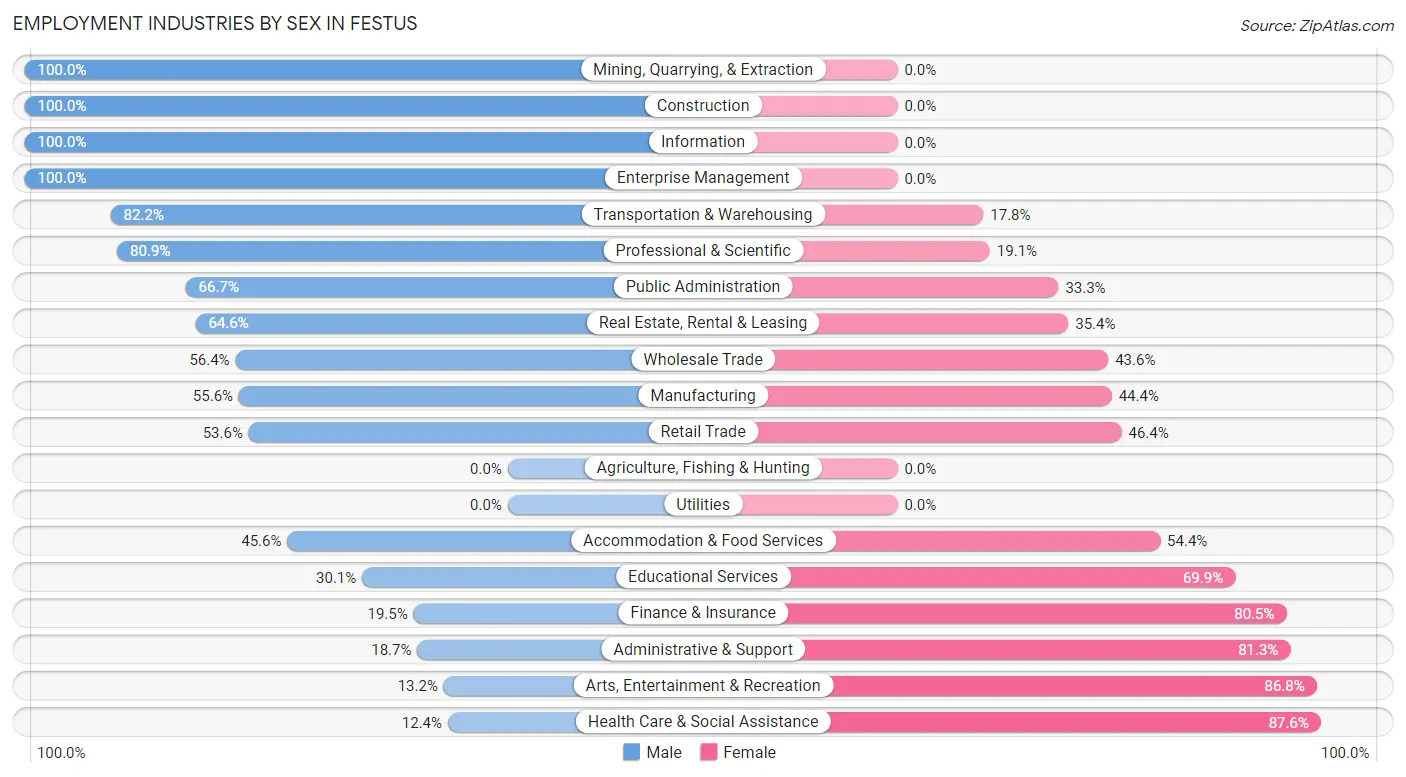
| Industry | Male | Female |
| Agriculture, Fishing & Hunting | 0 (0.0%) | 0 (0.0%) |
| Mining, Quarrying, & Extraction | 5 (100.0%) | 0 (0.0%) |
| Construction | 763 (100.0%) | 0 (0.0%) |
| Manufacturing | 350 (55.6%) | 279 (44.4%) |
| Wholesale Trade | 31 (56.4%) | 24 (43.6%) |
| Retail Trade | 319 (53.6%) | 276 (46.4%) |
| Transportation & Warehousing | 268 (82.2%) | 58 (17.8%) |
| Utilities | 0 (0.0%) | 0 (0.0%) |
| Information | 49 (100.0%) | 0 (0.0%) |
| Finance & Insurance | 85 (19.5%) | 351 (80.5%) |
| Real Estate, Rental & Leasing | 53 (64.6%) | 29 (35.4%) |
| Professional & Scientific | 207 (80.9%) | 49 (19.1%) |
| Enterprise Management | 22 (100.0%) | 0 (0.0%) |
| Administrative & Support | 32 (18.7%) | 139 (81.3%) |
| Educational Services | 126 (30.1%) | 292 (69.9%) |
| Health Care & Social Assistance | 112 (12.4%) | 792 (87.6%) |
| Arts, Entertainment & Recreation | 9 (13.2%) | 59 (86.8%) |
| Accommodation & Food Services | 151 (45.6%) | 180 (54.4%) |
| Public Administration | 134 (66.7%) | 67 (33.3%) |
| Total | 2,897 (51.6%) | 2,715 (48.4%) |
Education in Festus
School Enrollment in Festus
The most common levels of schooling among the 3,061 students in Festus are elementary school (886 | 28.9%), middle school (531 | 17.3%), and college / undergraduate (502 | 16.4%).
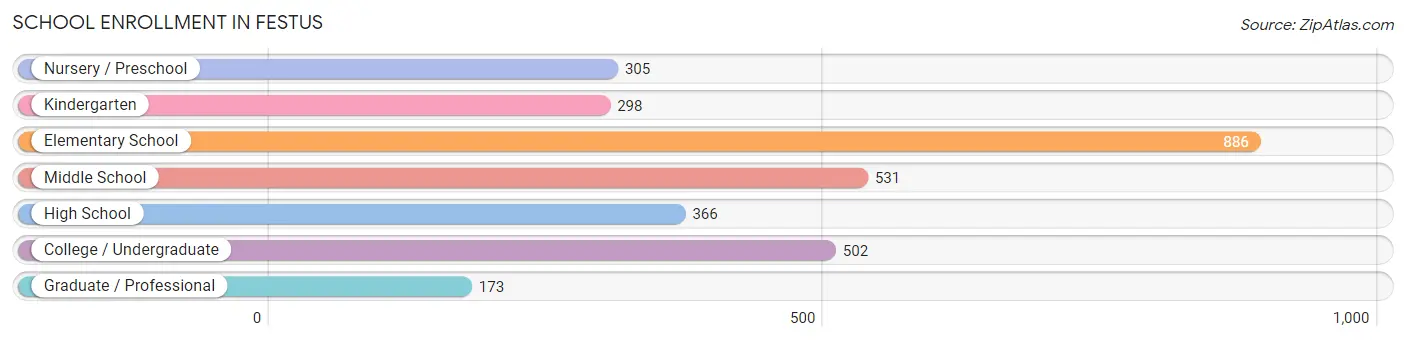
| School Level | # Students | % Students |
| Nursery / Preschool | 305 | 10.0% |
| Kindergarten | 298 | 9.7% |
| Elementary School | 886 | 28.9% |
| Middle School | 531 | 17.3% |
| High School | 366 | 12.0% |
| College / Undergraduate | 502 | 16.4% |
| Graduate / Professional | 173 | 5.7% |
| Total | 3,061 | 100.0% |
School Enrollment by Age by Funding Source in Festus
Out of a total of 3,061 students who are enrolled in schools in Festus, 407 (13.3%) attend a private institution, while the remaining 2,654 (86.7%) are enrolled in public schools. The age group of 35 years and over has the highest likelihood of being enrolled in private schools, with 37 (33.0% in the age bracket) enrolled. Conversely, the age group of 18 to 19 year olds has the lowest likelihood of being enrolled in a private school, with 117 (100.0% in the age bracket) attending a public institution.
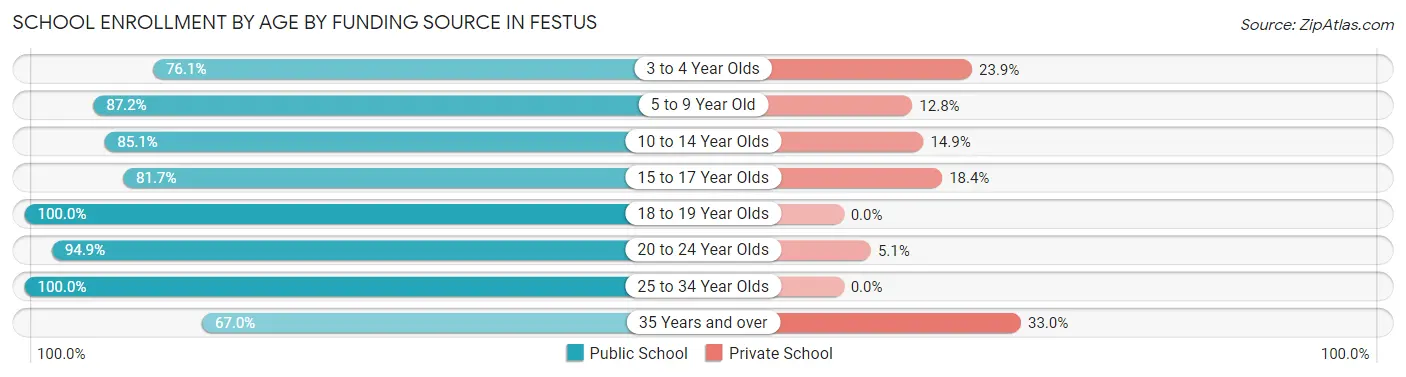
| Age Bracket | Public School | Private School |
| 3 to 4 Year Olds | 194 (76.1%) | 61 (23.9%) |
| 5 to 9 Year Old | 906 (87.2%) | 133 (12.8%) |
| 10 to 14 Year Olds | 647 (85.1%) | 113 (14.9%) |
| 15 to 17 Year Olds | 218 (81.7%) | 49 (18.3%) |
| 18 to 19 Year Olds | 117 (100.0%) | 0 (0.0%) |
| 20 to 24 Year Olds | 243 (94.9%) | 13 (5.1%) |
| 25 to 34 Year Olds | 255 (100.0%) | 0 (0.0%) |
| 35 Years and over | 75 (67.0%) | 37 (33.0%) |
| Total | 2,654 (86.7%) | 407 (13.3%) |
Educational Attainment by Field of Study in Festus
Business (814 | 40.5%), education (296 | 14.7%), arts & humanities (164 | 8.2%), liberal arts & history (148 | 7.4%), and science & technology (129 | 6.4%) are the most common fields of study among 2,009 individuals in Festus who have obtained a bachelor's degree or higher.
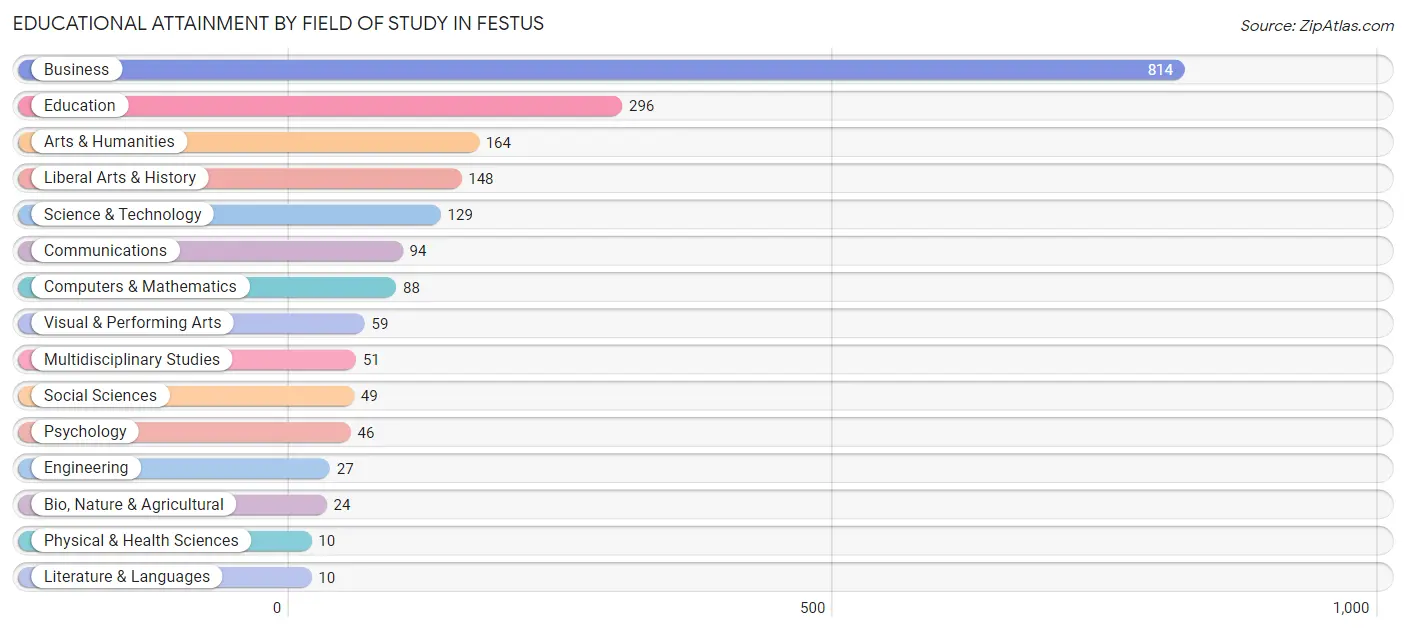
| Field of Study | # Graduates | % Graduates |
| Computers & Mathematics | 88 | 4.4% |
| Bio, Nature & Agricultural | 24 | 1.2% |
| Physical & Health Sciences | 10 | 0.5% |
| Psychology | 46 | 2.3% |
| Social Sciences | 49 | 2.4% |
| Engineering | 27 | 1.3% |
| Multidisciplinary Studies | 51 | 2.5% |
| Science & Technology | 129 | 6.4% |
| Business | 814 | 40.5% |
| Education | 296 | 14.7% |
| Literature & Languages | 10 | 0.5% |
| Liberal Arts & History | 148 | 7.4% |
| Visual & Performing Arts | 59 | 2.9% |
| Communications | 94 | 4.7% |
| Arts & Humanities | 164 | 8.2% |
| Total | 2,009 | 100.0% |
Transportation & Commute in Festus
Vehicle Availability by Sex in Festus
The most prevalent vehicle ownership categories in Festus are males with 2 vehicles (1,097, accounting for 37.9%) and females with 2 vehicles (1,040, making up 41.7%).
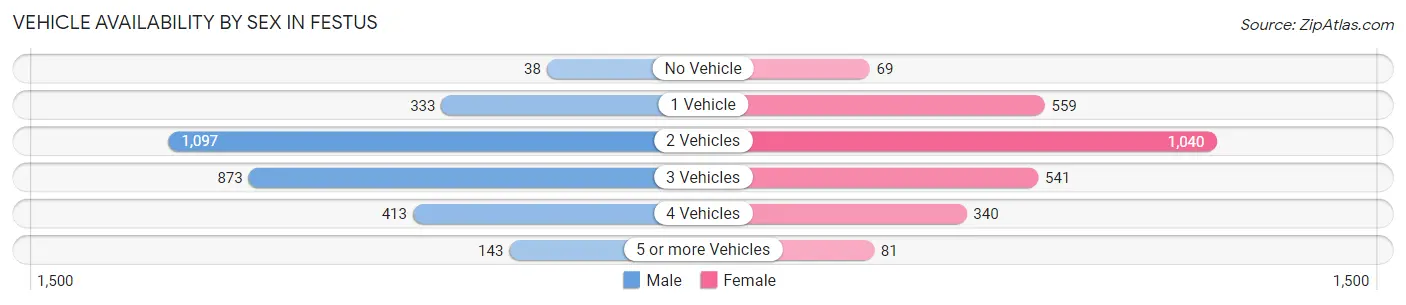
| Vehicles Available | Male | Female |
| No Vehicle | 38 (1.3%) | 69 (2.6%) |
| 1 Vehicle | 333 (11.5%) | 559 (21.2%) |
| 2 Vehicles | 1,097 (37.9%) | 1,040 (39.5%) |
| 3 Vehicles | 873 (30.1%) | 541 (20.6%) |
| 4 Vehicles | 413 (14.3%) | 340 (12.9%) |
| 5 or more Vehicles | 143 (4.9%) | 81 (3.1%) |
| Total | 2,897 (100.0%) | 2,630 (100.0%) |
Commute Time in Festus
The most frequently occuring commute durations in Festus are 45 to 59 minutes (741 commuters, 14.3%), 5 to 9 minutes (725 commuters, 14.0%), and 15 to 19 minutes (617 commuters, 11.9%).
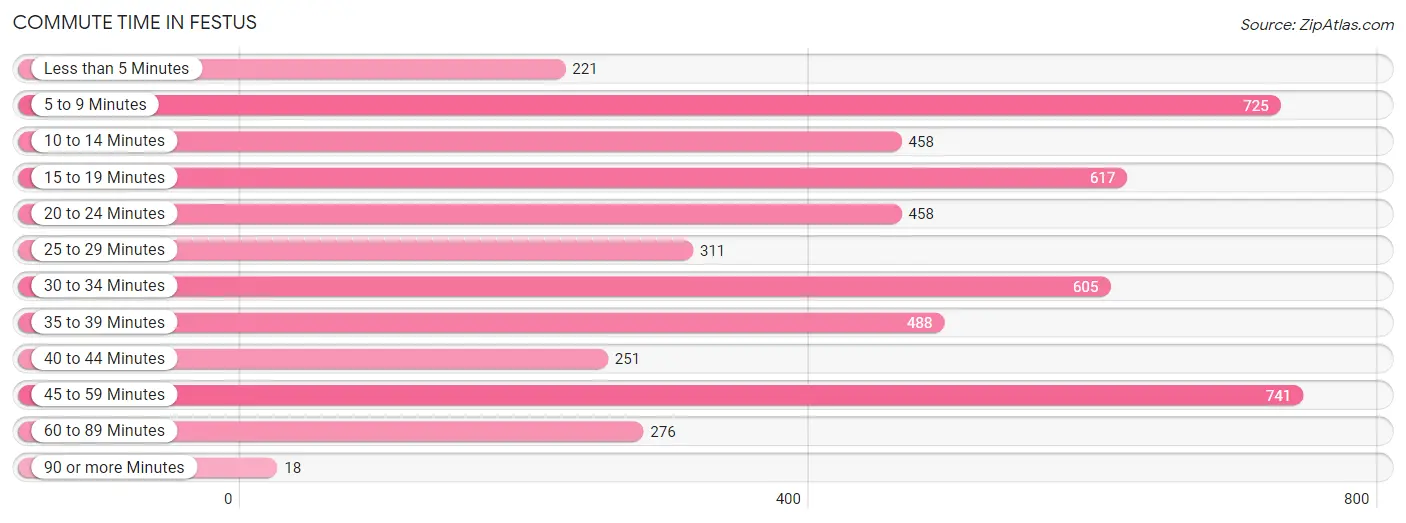
| Commute Time | # Commuters | % Commuters |
| Less than 5 Minutes | 221 | 4.3% |
| 5 to 9 Minutes | 725 | 14.0% |
| 10 to 14 Minutes | 458 | 8.9% |
| 15 to 19 Minutes | 617 | 11.9% |
| 20 to 24 Minutes | 458 | 8.9% |
| 25 to 29 Minutes | 311 | 6.0% |
| 30 to 34 Minutes | 605 | 11.7% |
| 35 to 39 Minutes | 488 | 9.4% |
| 40 to 44 Minutes | 251 | 4.9% |
| 45 to 59 Minutes | 741 | 14.3% |
| 60 to 89 Minutes | 276 | 5.3% |
| 90 or more Minutes | 18 | 0.4% |
Commute Time by Sex in Festus
The most common commute times in Festus are 5 to 9 minutes (420 commuters, 15.1%) for males and 45 to 59 minutes (484 commuters, 20.2%) for females.
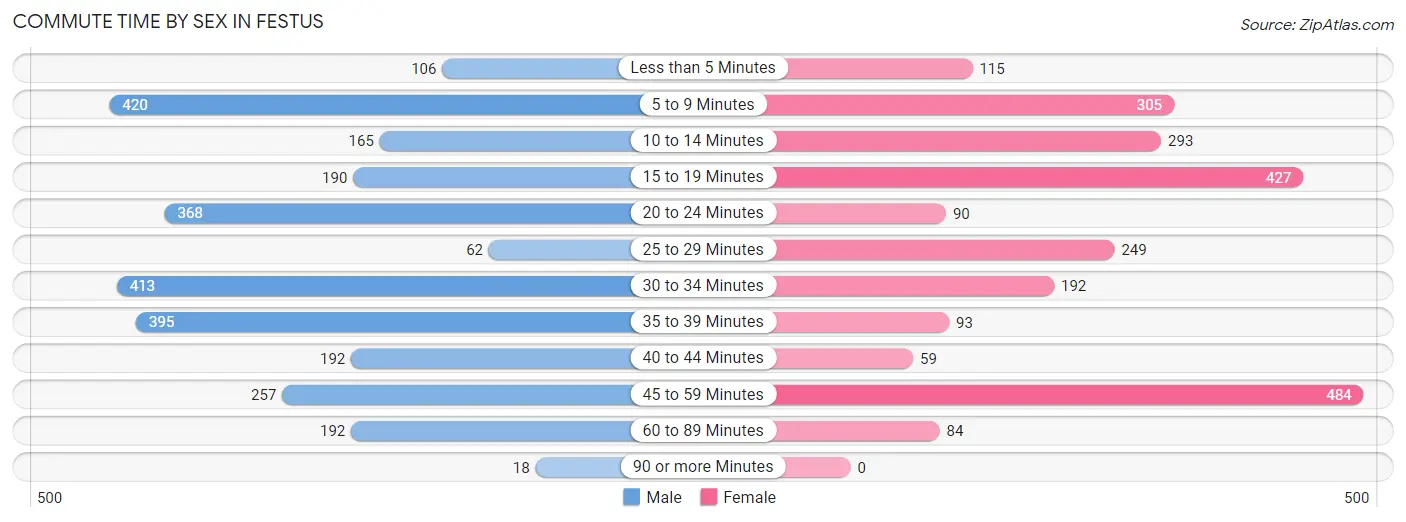
| Commute Time | Male | Female |
| Less than 5 Minutes | 106 (3.8%) | 115 (4.8%) |
| 5 to 9 Minutes | 420 (15.1%) | 305 (12.8%) |
| 10 to 14 Minutes | 165 (5.9%) | 293 (12.2%) |
| 15 to 19 Minutes | 190 (6.8%) | 427 (17.9%) |
| 20 to 24 Minutes | 368 (13.3%) | 90 (3.8%) |
| 25 to 29 Minutes | 62 (2.2%) | 249 (10.4%) |
| 30 to 34 Minutes | 413 (14.9%) | 192 (8.0%) |
| 35 to 39 Minutes | 395 (14.2%) | 93 (3.9%) |
| 40 to 44 Minutes | 192 (6.9%) | 59 (2.5%) |
| 45 to 59 Minutes | 257 (9.2%) | 484 (20.2%) |
| 60 to 89 Minutes | 192 (6.9%) | 84 (3.5%) |
| 90 or more Minutes | 18 (0.6%) | 0 (0.0%) |
Time of Departure to Work by Sex in Festus
The most frequent times of departure to work in Festus are 6:30 AM to 6:59 AM (438, 15.8%) for males and 7:00 AM to 7:29 AM (616, 25.8%) for females.
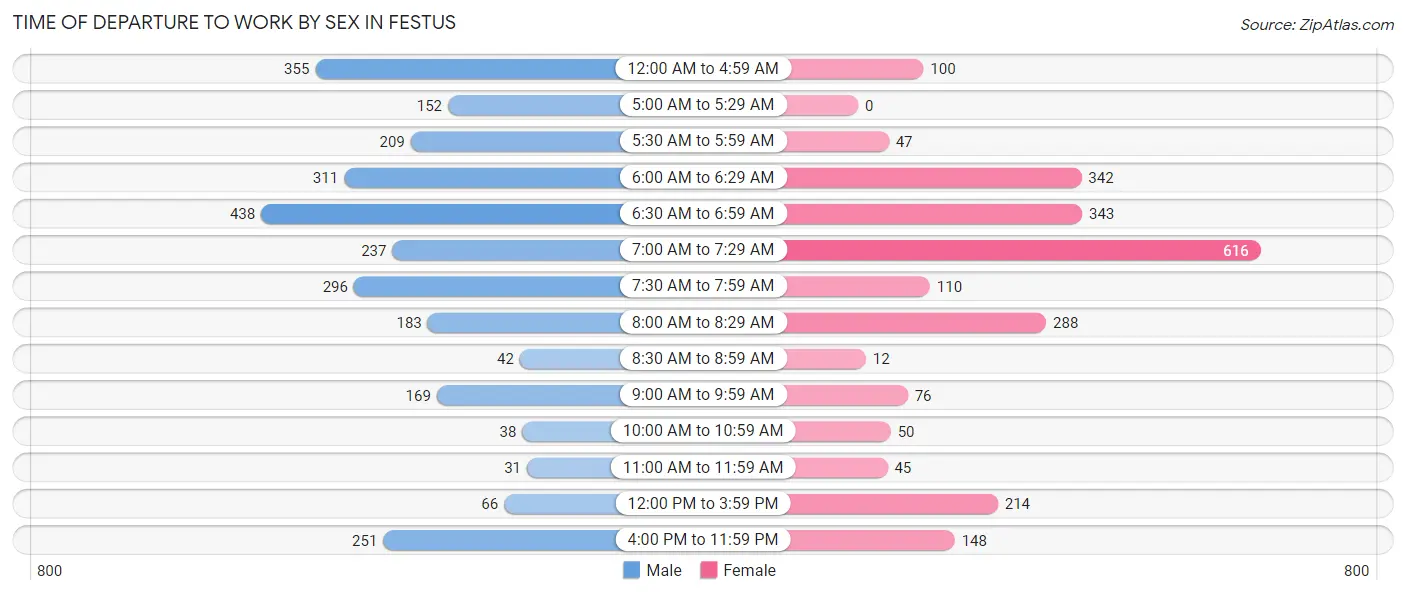
| Time of Departure | Male | Female |
| 12:00 AM to 4:59 AM | 355 (12.8%) | 100 (4.2%) |
| 5:00 AM to 5:29 AM | 152 (5.5%) | 0 (0.0%) |
| 5:30 AM to 5:59 AM | 209 (7.5%) | 47 (2.0%) |
| 6:00 AM to 6:29 AM | 311 (11.2%) | 342 (14.3%) |
| 6:30 AM to 6:59 AM | 438 (15.8%) | 343 (14.3%) |
| 7:00 AM to 7:29 AM | 237 (8.5%) | 616 (25.8%) |
| 7:30 AM to 7:59 AM | 296 (10.7%) | 110 (4.6%) |
| 8:00 AM to 8:29 AM | 183 (6.6%) | 288 (12.0%) |
| 8:30 AM to 8:59 AM | 42 (1.5%) | 12 (0.5%) |
| 9:00 AM to 9:59 AM | 169 (6.1%) | 76 (3.2%) |
| 10:00 AM to 10:59 AM | 38 (1.4%) | 50 (2.1%) |
| 11:00 AM to 11:59 AM | 31 (1.1%) | 45 (1.9%) |
| 12:00 PM to 3:59 PM | 66 (2.4%) | 214 (8.9%) |
| 4:00 PM to 11:59 PM | 251 (9.0%) | 148 (6.2%) |
| Total | 2,778 (100.0%) | 2,391 (100.0%) |
Housing Occupancy in Festus
Occupancy by Ownership in Festus
Of the total 5,021 dwellings in Festus, owner-occupied units account for 2,787 (55.5%), while renter-occupied units make up 2,234 (44.5%).
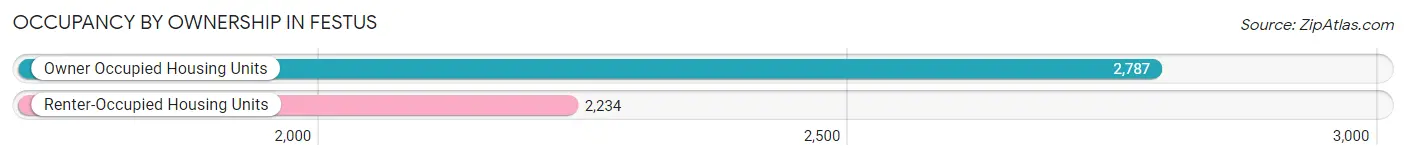
| Occupancy | # Housing Units | % Housing Units |
| Owner Occupied Housing Units | 2,787 | 55.5% |
| Renter-Occupied Housing Units | 2,234 | 44.5% |
| Total Occupied Housing Units | 5,021 | 100.0% |
Occupancy by Household Size in Festus
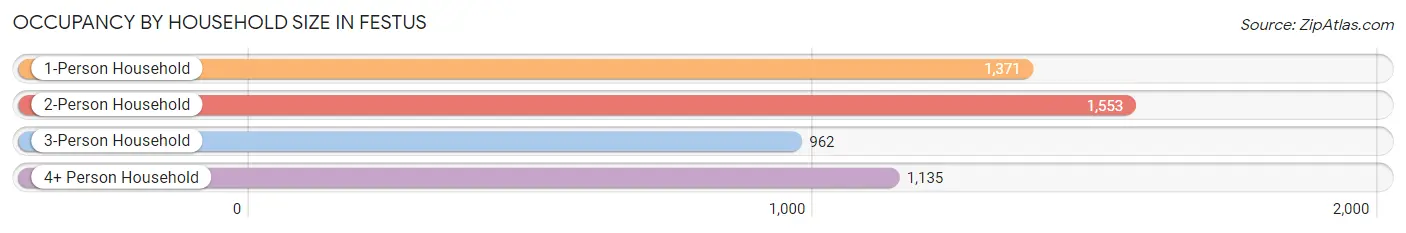
| Household Size | # Housing Units | % Housing Units |
| 1-Person Household | 1,371 | 27.3% |
| 2-Person Household | 1,553 | 30.9% |
| 3-Person Household | 962 | 19.2% |
| 4+ Person Household | 1,135 | 22.6% |
| Total Housing Units | 5,021 | 100.0% |
Occupancy by Ownership by Household Size in Festus
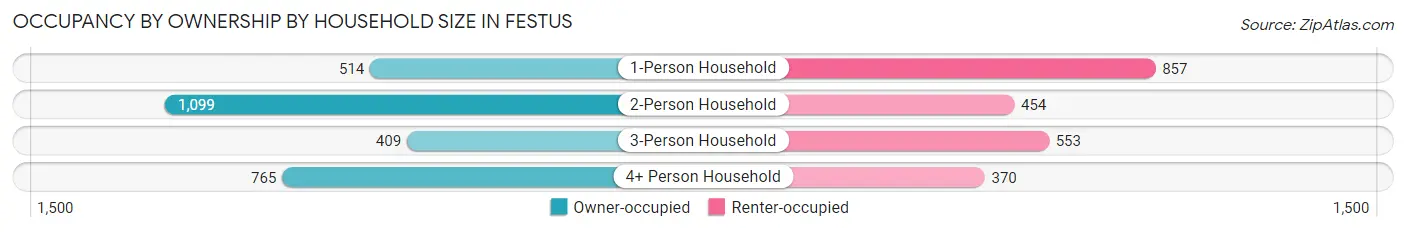
| Household Size | Owner-occupied | Renter-occupied |
| 1-Person Household | 514 (37.5%) | 857 (62.5%) |
| 2-Person Household | 1,099 (70.8%) | 454 (29.2%) |
| 3-Person Household | 409 (42.5%) | 553 (57.5%) |
| 4+ Person Household | 765 (67.4%) | 370 (32.6%) |
| Total Housing Units | 2,787 (55.5%) | 2,234 (44.5%) |
Occupancy by Educational Attainment in Festus
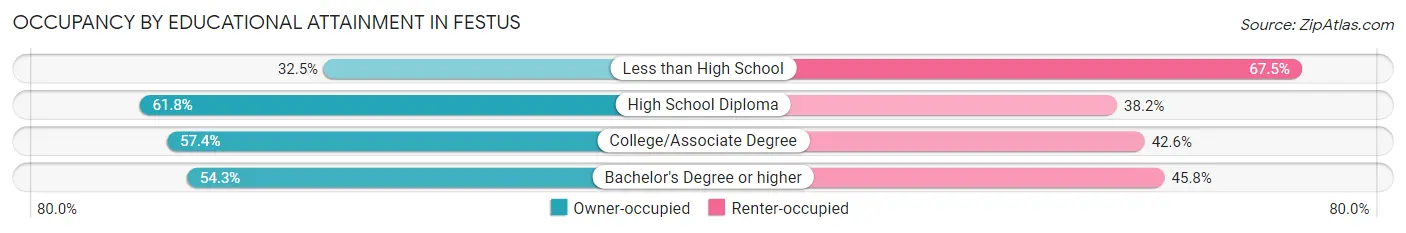
| Household Size | Owner-occupied | Renter-occupied |
| Less than High School | 147 (32.5%) | 305 (67.5%) |
| High School Diploma | 813 (61.8%) | 503 (38.2%) |
| College/Associate Degree | 1,137 (57.4%) | 844 (42.6%) |
| Bachelor's Degree or higher | 690 (54.2%) | 582 (45.8%) |
Occupancy by Age of Householder in Festus
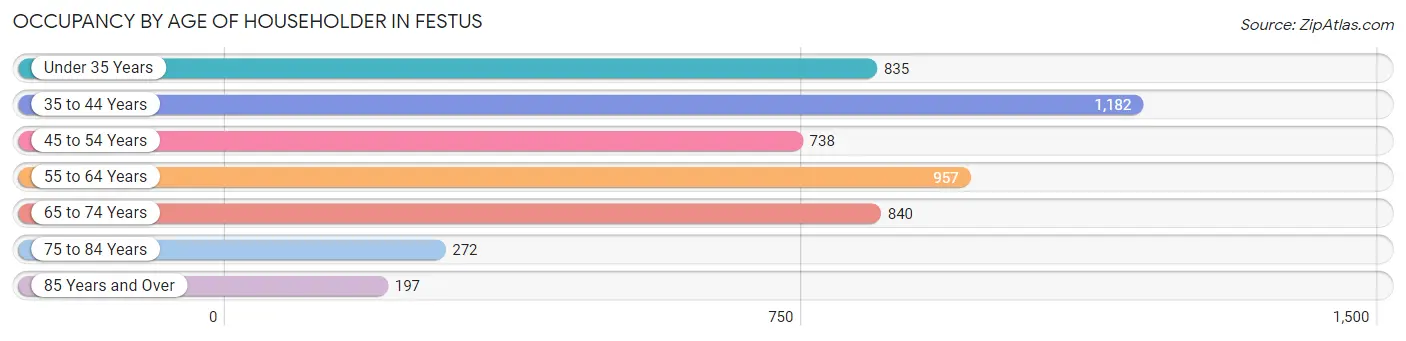
| Age Bracket | # Households | % Households |
| Under 35 Years | 835 | 16.6% |
| 35 to 44 Years | 1,182 | 23.5% |
| 45 to 54 Years | 738 | 14.7% |
| 55 to 64 Years | 957 | 19.1% |
| 65 to 74 Years | 840 | 16.7% |
| 75 to 84 Years | 272 | 5.4% |
| 85 Years and Over | 197 | 3.9% |
| Total | 5,021 | 100.0% |
Housing Finances in Festus
Median Income by Occupancy in Festus
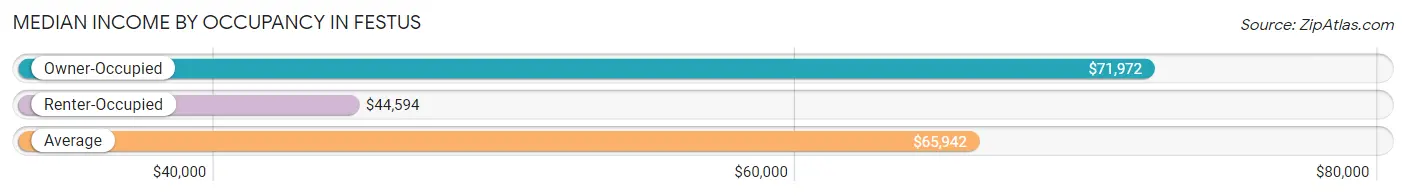
| Occupancy Type | # Households | Median Income |
| Owner-Occupied | 2,787 (55.5%) | $71,972 |
| Renter-Occupied | 2,234 (44.5%) | $44,594 |
| Average | 5,021 (100.0%) | $65,942 |
Occupancy by Householder Income Bracket in Festus
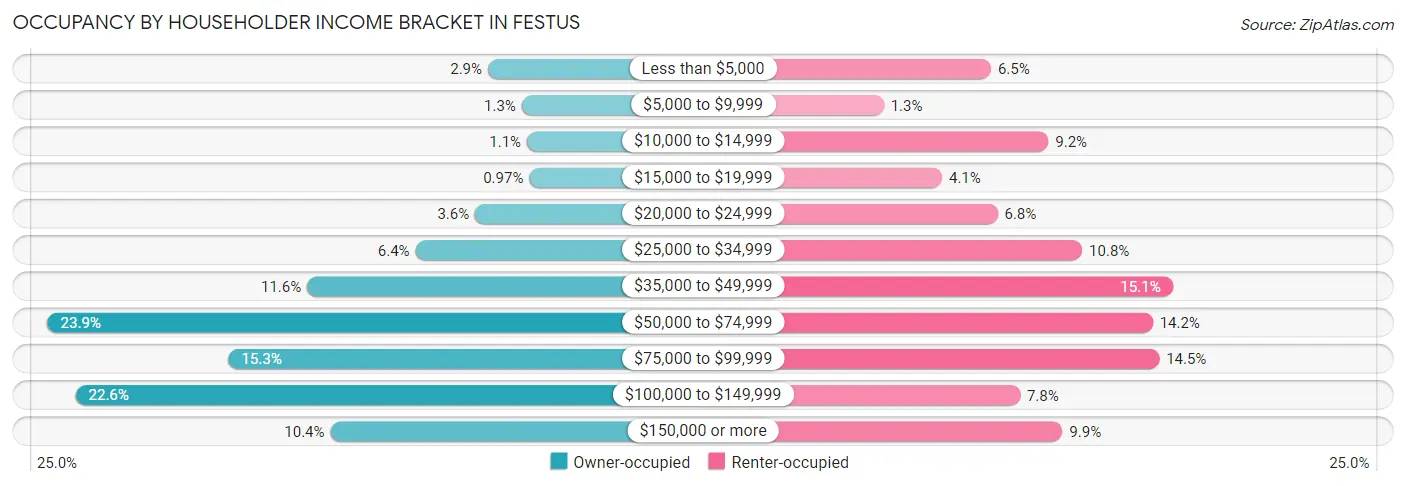
| Income Bracket | Owner-occupied | Renter-occupied |
| Less than $5,000 | 82 (2.9%) | 144 (6.5%) |
| $5,000 to $9,999 | 37 (1.3%) | 30 (1.3%) |
| $10,000 to $14,999 | 30 (1.1%) | 205 (9.2%) |
| $15,000 to $19,999 | 27 (1.0%) | 92 (4.1%) |
| $20,000 to $24,999 | 99 (3.5%) | 151 (6.8%) |
| $25,000 to $34,999 | 178 (6.4%) | 241 (10.8%) |
| $35,000 to $49,999 | 322 (11.6%) | 337 (15.1%) |
| $50,000 to $74,999 | 666 (23.9%) | 316 (14.1%) |
| $75,000 to $99,999 | 426 (15.3%) | 323 (14.5%) |
| $100,000 to $149,999 | 629 (22.6%) | 175 (7.8%) |
| $150,000 or more | 291 (10.4%) | 220 (9.9%) |
| Total | 2,787 (100.0%) | 2,234 (100.0%) |
Monthly Housing Cost Tiers in Festus
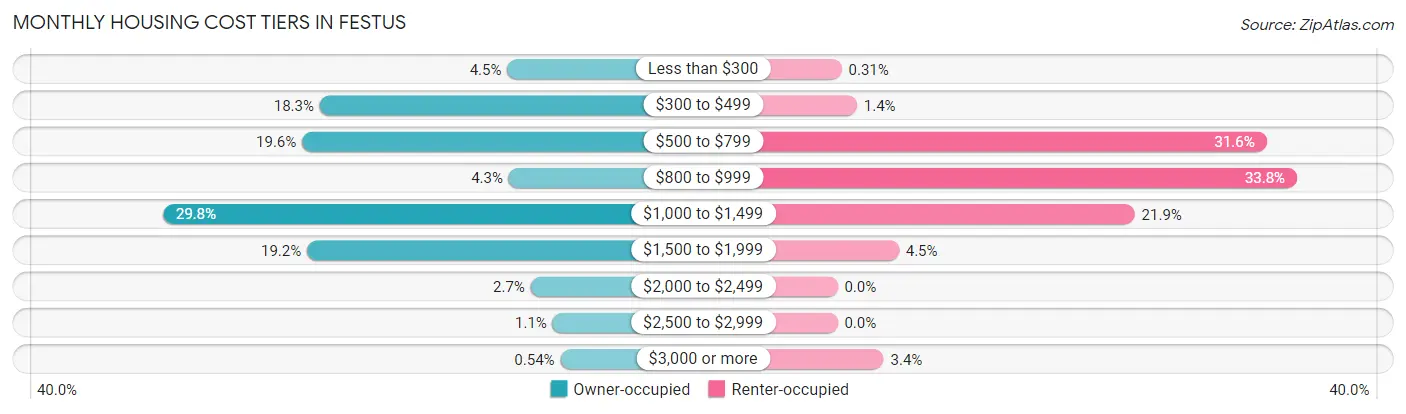
| Monthly Cost | Owner-occupied | Renter-occupied |
| Less than $300 | 124 (4.4%) | 7 (0.3%) |
| $300 to $499 | 509 (18.3%) | 32 (1.4%) |
| $500 to $799 | 545 (19.6%) | 706 (31.6%) |
| $800 to $999 | 121 (4.3%) | 756 (33.8%) |
| $1,000 to $1,499 | 831 (29.8%) | 489 (21.9%) |
| $1,500 to $1,999 | 535 (19.2%) | 101 (4.5%) |
| $2,000 to $2,499 | 76 (2.7%) | 0 (0.0%) |
| $2,500 to $2,999 | 31 (1.1%) | 0 (0.0%) |
| $3,000 or more | 15 (0.5%) | 76 (3.4%) |
| Total | 2,787 (100.0%) | 2,234 (100.0%) |
Physical Housing Characteristics in Festus
Housing Structures in Festus
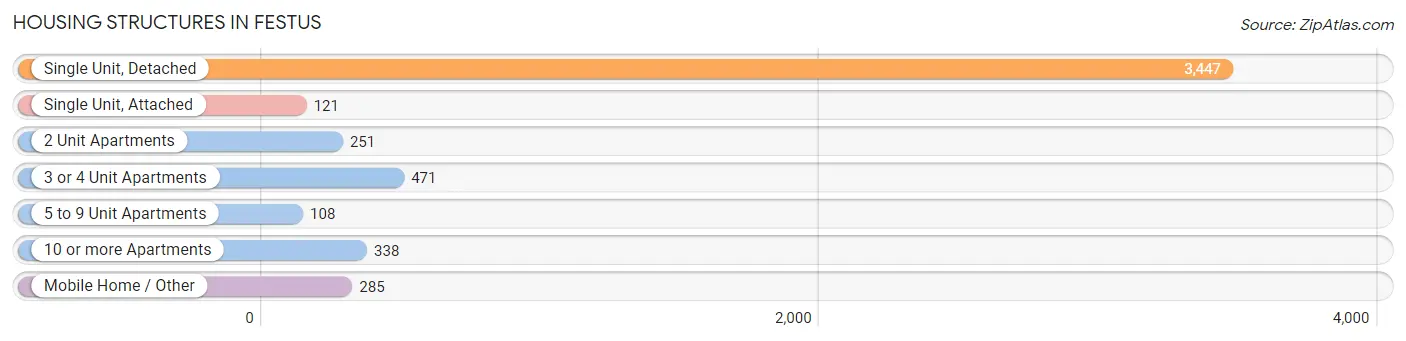
| Structure Type | # Housing Units | % Housing Units |
| Single Unit, Detached | 3,447 | 68.6% |
| Single Unit, Attached | 121 | 2.4% |
| 2 Unit Apartments | 251 | 5.0% |
| 3 or 4 Unit Apartments | 471 | 9.4% |
| 5 to 9 Unit Apartments | 108 | 2.1% |
| 10 or more Apartments | 338 | 6.7% |
| Mobile Home / Other | 285 | 5.7% |
| Total | 5,021 | 100.0% |
Housing Structures by Occupancy in Festus
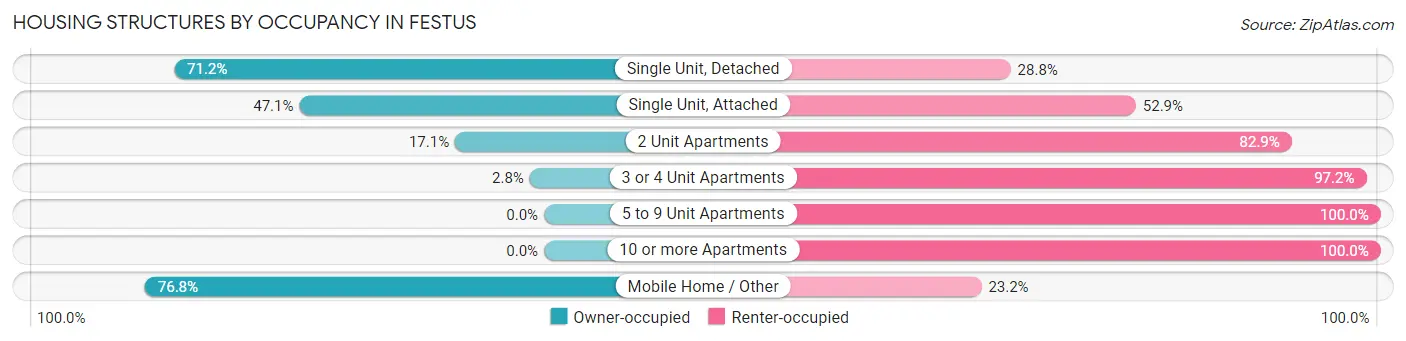
| Structure Type | Owner-occupied | Renter-occupied |
| Single Unit, Detached | 2,455 (71.2%) | 992 (28.8%) |
| Single Unit, Attached | 57 (47.1%) | 64 (52.9%) |
| 2 Unit Apartments | 43 (17.1%) | 208 (82.9%) |
| 3 or 4 Unit Apartments | 13 (2.8%) | 458 (97.2%) |
| 5 to 9 Unit Apartments | 0 (0.0%) | 108 (100.0%) |
| 10 or more Apartments | 0 (0.0%) | 338 (100.0%) |
| Mobile Home / Other | 219 (76.8%) | 66 (23.2%) |
| Total | 2,787 (55.5%) | 2,234 (44.5%) |
Housing Structures by Number of Rooms in Festus
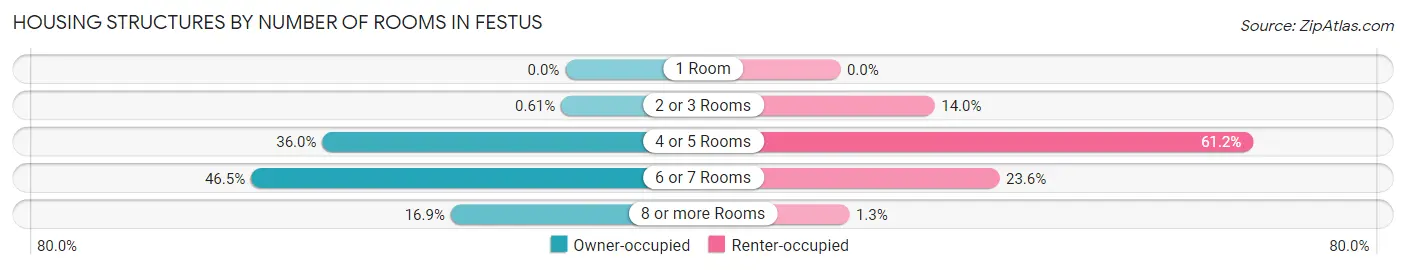
| Number of Rooms | Owner-occupied | Renter-occupied |
| 1 Room | 0 (0.0%) | 0 (0.0%) |
| 2 or 3 Rooms | 17 (0.6%) | 312 (14.0%) |
| 4 or 5 Rooms | 1,002 (35.9%) | 1,366 (61.2%) |
| 6 or 7 Rooms | 1,296 (46.5%) | 526 (23.5%) |
| 8 or more Rooms | 472 (16.9%) | 30 (1.3%) |
| Total | 2,787 (100.0%) | 2,234 (100.0%) |
Housing Structure by Heating Type in Festus
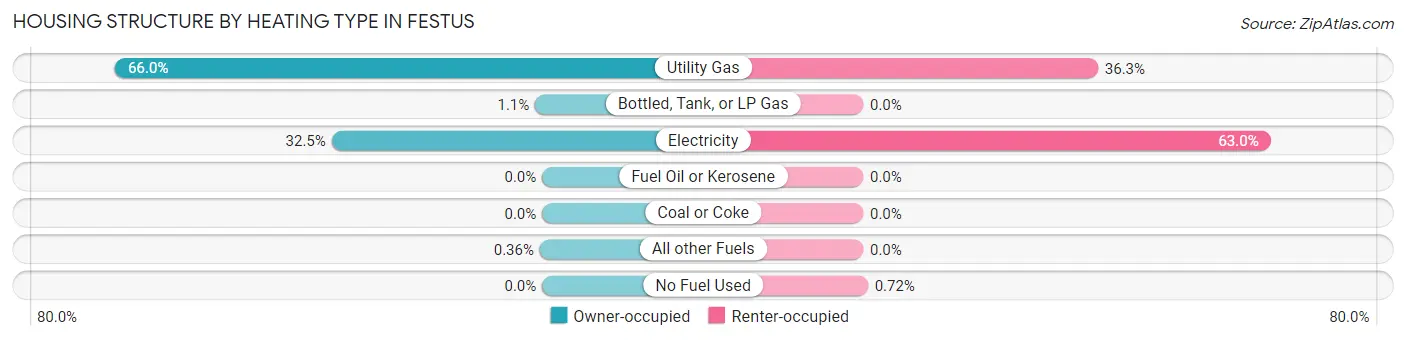
| Heating Type | Owner-occupied | Renter-occupied |
| Utility Gas | 1,840 (66.0%) | 811 (36.3%) |
| Bottled, Tank, or LP Gas | 30 (1.1%) | 0 (0.0%) |
| Electricity | 907 (32.5%) | 1,407 (63.0%) |
| Fuel Oil or Kerosene | 0 (0.0%) | 0 (0.0%) |
| Coal or Coke | 0 (0.0%) | 0 (0.0%) |
| All other Fuels | 10 (0.4%) | 0 (0.0%) |
| No Fuel Used | 0 (0.0%) | 16 (0.7%) |
| Total | 2,787 (100.0%) | 2,234 (100.0%) |
Household Vehicle Usage in Festus
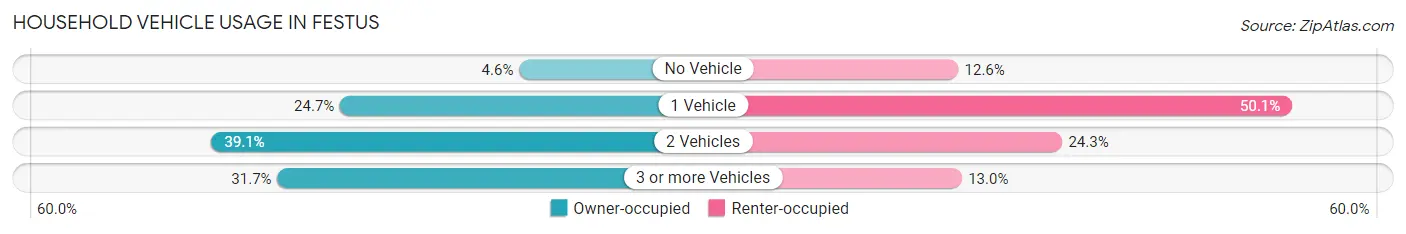
| Vehicles per Household | Owner-occupied | Renter-occupied |
| No Vehicle | 128 (4.6%) | 282 (12.6%) |
| 1 Vehicle | 687 (24.6%) | 1,119 (50.1%) |
| 2 Vehicles | 1,089 (39.1%) | 542 (24.3%) |
| 3 or more Vehicles | 883 (31.7%) | 291 (13.0%) |
| Total | 2,787 (100.0%) | 2,234 (100.0%) |
Real Estate & Mortgages in Festus
Real Estate and Mortgage Overview in Festus
| Characteristic | Without Mortgage | With Mortgage |
| Housing Units | 934 | 1,853 |
| Median Property Value | $179,500 | $192,400 |
| Median Household Income | $57,500 | $180 |
| Monthly Housing Costs | $448 | $15 |
| Real Estate Taxes | $1,198 | $54 |
Property Value by Mortgage Status in Festus
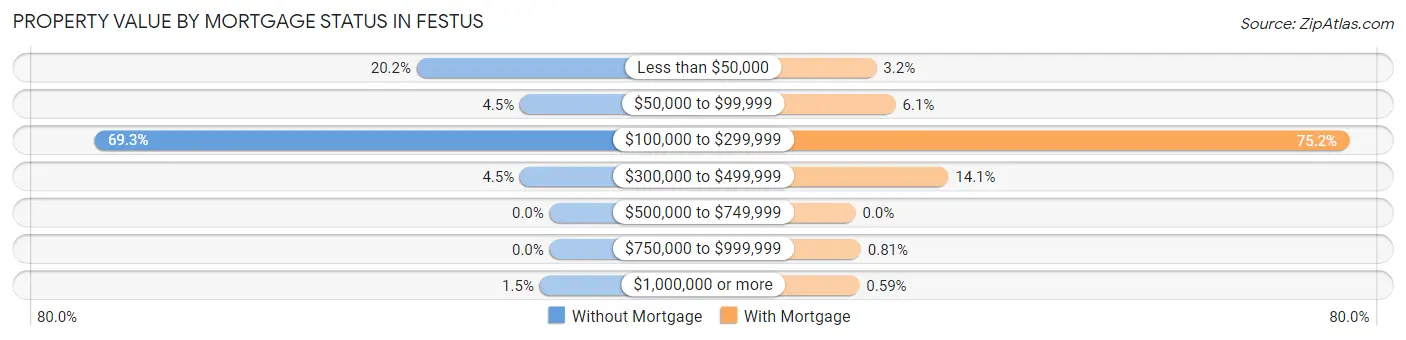
| Property Value | Without Mortgage | With Mortgage |
| Less than $50,000 | 189 (20.2%) | 59 (3.2%) |
| $50,000 to $99,999 | 42 (4.5%) | 113 (6.1%) |
| $100,000 to $299,999 | 647 (69.3%) | 1,393 (75.2%) |
| $300,000 to $499,999 | 42 (4.5%) | 262 (14.1%) |
| $500,000 to $749,999 | 0 (0.0%) | 0 (0.0%) |
| $750,000 to $999,999 | 0 (0.0%) | 15 (0.8%) |
| $1,000,000 or more | 14 (1.5%) | 11 (0.6%) |
| Total | 934 (100.0%) | 1,853 (100.0%) |
Household Income by Mortgage Status in Festus
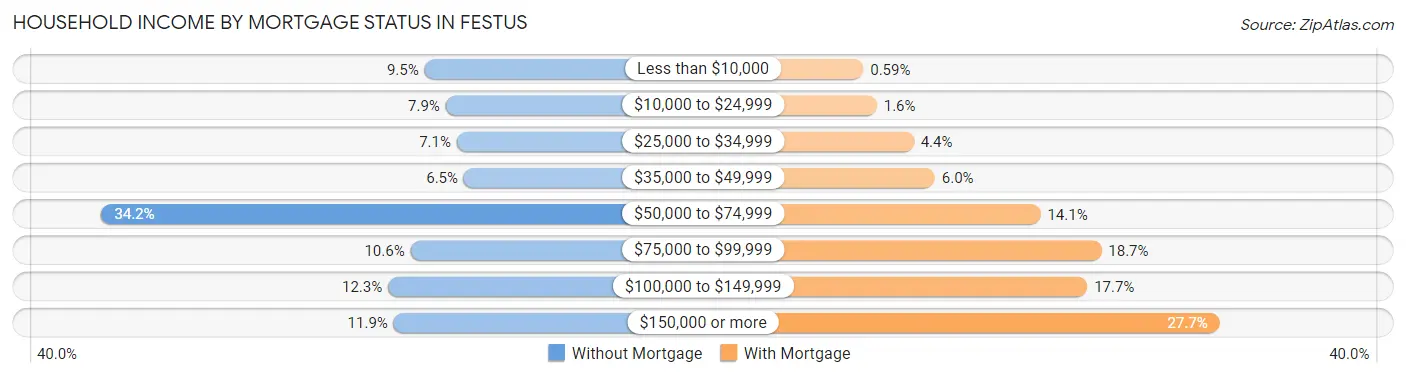
| Household Income | Without Mortgage | With Mortgage |
| Less than $10,000 | 89 (9.5%) | 11 (0.6%) |
| $10,000 to $24,999 | 74 (7.9%) | 30 (1.6%) |
| $25,000 to $34,999 | 66 (7.1%) | 82 (4.4%) |
| $35,000 to $49,999 | 61 (6.5%) | 112 (6.0%) |
| $50,000 to $74,999 | 319 (34.2%) | 261 (14.1%) |
| $75,000 to $99,999 | 99 (10.6%) | 347 (18.7%) |
| $100,000 to $149,999 | 115 (12.3%) | 327 (17.6%) |
| $150,000 or more | 111 (11.9%) | 514 (27.7%) |
| Total | 934 (100.0%) | 1,853 (100.0%) |
Property Value to Household Income Ratio in Festus
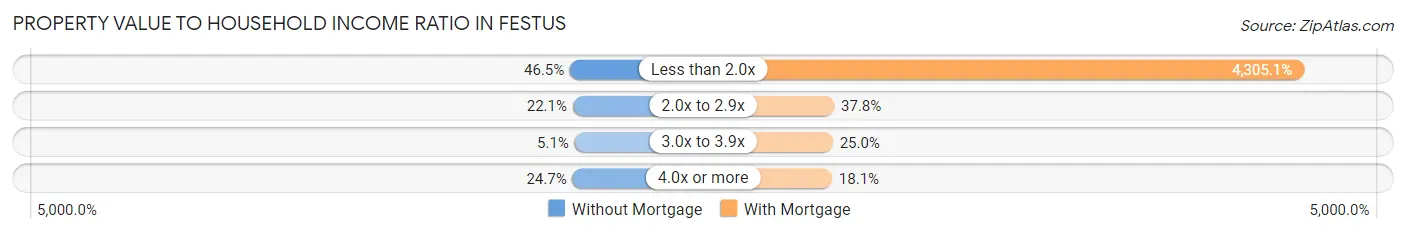
| Value-to-Income Ratio | Without Mortgage | With Mortgage |
| Less than 2.0x | 434 (46.5%) | 79,774 (4,305.1%) |
| 2.0x to 2.9x | 206 (22.1%) | 700 (37.8%) |
| 3.0x to 3.9x | 48 (5.1%) | 464 (25.0%) |
| 4.0x or more | 231 (24.7%) | 335 (18.1%) |
| Total | 934 (100.0%) | 1,853 (100.0%) |
Real Estate Taxes by Mortgage Status in Festus
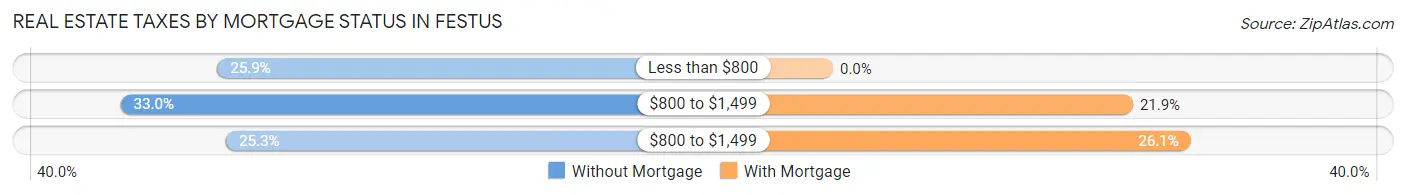
| Property Taxes | Without Mortgage | With Mortgage |
| Less than $800 | 242 (25.9%) | 0 (0.0%) |
| $800 to $1,499 | 308 (33.0%) | 406 (21.9%) |
| $800 to $1,499 | 236 (25.3%) | 484 (26.1%) |
| Total | 934 (100.0%) | 1,853 (100.0%) |
Health & Disability in Festus
Health Insurance Coverage by Age in Festus
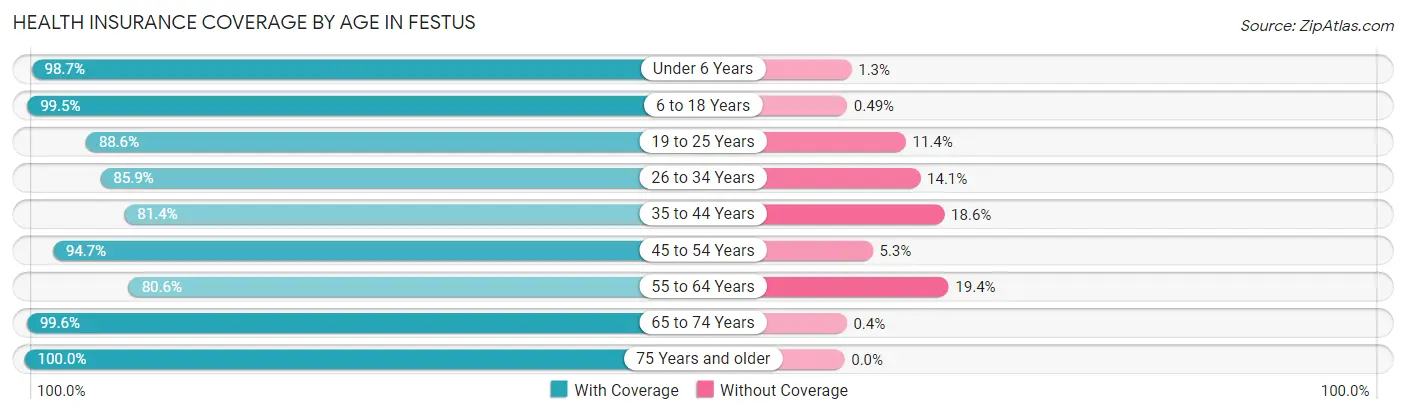
| Age Bracket | With Coverage | Without Coverage |
| Under 6 Years | 1,291 (98.7%) | 17 (1.3%) |
| 6 to 18 Years | 2,028 (99.5%) | 10 (0.5%) |
| 19 to 25 Years | 985 (88.6%) | 127 (11.4%) |
| 26 to 34 Years | 1,336 (85.9%) | 220 (14.1%) |
| 35 to 44 Years | 1,442 (81.4%) | 330 (18.6%) |
| 45 to 54 Years | 1,315 (94.7%) | 73 (5.3%) |
| 55 to 64 Years | 1,245 (80.6%) | 300 (19.4%) |
| 65 to 74 Years | 1,238 (99.6%) | 5 (0.4%) |
| 75 Years and older | 667 (100.0%) | 0 (0.0%) |
| Total | 11,547 (91.4%) | 1,082 (8.6%) |
Health Insurance Coverage by Citizenship Status in Festus
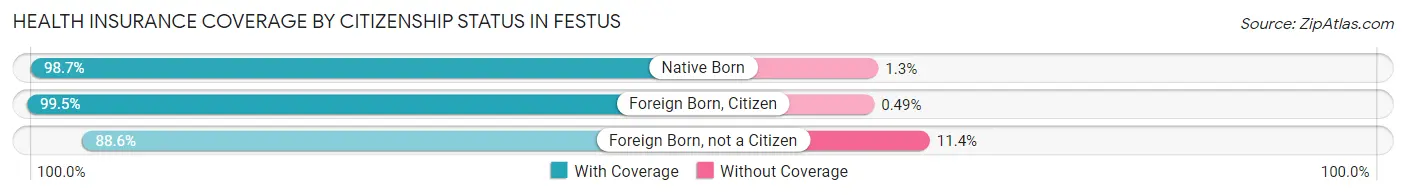
| Citizenship Status | With Coverage | Without Coverage |
| Native Born | 1,291 (98.7%) | 17 (1.3%) |
| Foreign Born, Citizen | 2,028 (99.5%) | 10 (0.5%) |
| Foreign Born, not a Citizen | 985 (88.6%) | 127 (11.4%) |
Health Insurance Coverage by Household Income in Festus
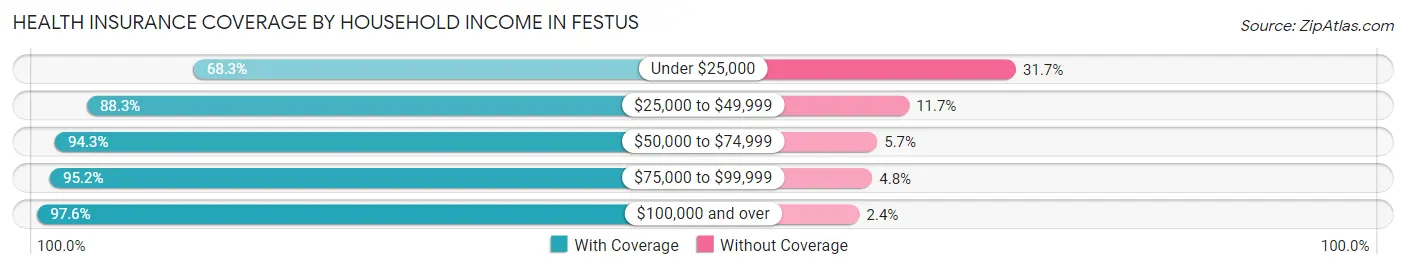
| Household Income | With Coverage | Without Coverage |
| Under $25,000 | 943 (68.3%) | 438 (31.7%) |
| $25,000 to $49,999 | 2,357 (88.3%) | 312 (11.7%) |
| $50,000 to $74,999 | 2,163 (94.3%) | 131 (5.7%) |
| $75,000 to $99,999 | 2,013 (95.2%) | 101 (4.8%) |
| $100,000 and over | 4,064 (97.6%) | 100 (2.4%) |
Public vs Private Health Insurance Coverage by Age in Festus
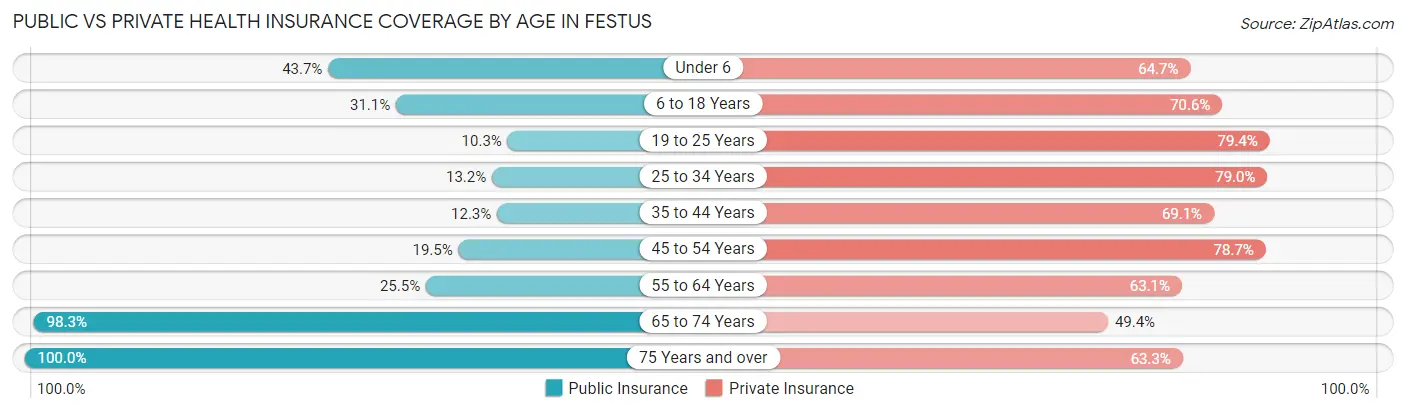
| Age Bracket | Public Insurance | Private Insurance |
| Under 6 | 571 (43.6%) | 846 (64.7%) |
| 6 to 18 Years | 633 (31.1%) | 1,439 (70.6%) |
| 19 to 25 Years | 115 (10.3%) | 883 (79.4%) |
| 25 to 34 Years | 206 (13.2%) | 1,229 (79.0%) |
| 35 to 44 Years | 218 (12.3%) | 1,224 (69.1%) |
| 45 to 54 Years | 270 (19.5%) | 1,092 (78.7%) |
| 55 to 64 Years | 394 (25.5%) | 975 (63.1%) |
| 65 to 74 Years | 1,222 (98.3%) | 614 (49.4%) |
| 75 Years and over | 667 (100.0%) | 422 (63.3%) |
| Total | 4,296 (34.0%) | 8,724 (69.1%) |
Disability Status by Sex by Age in Festus
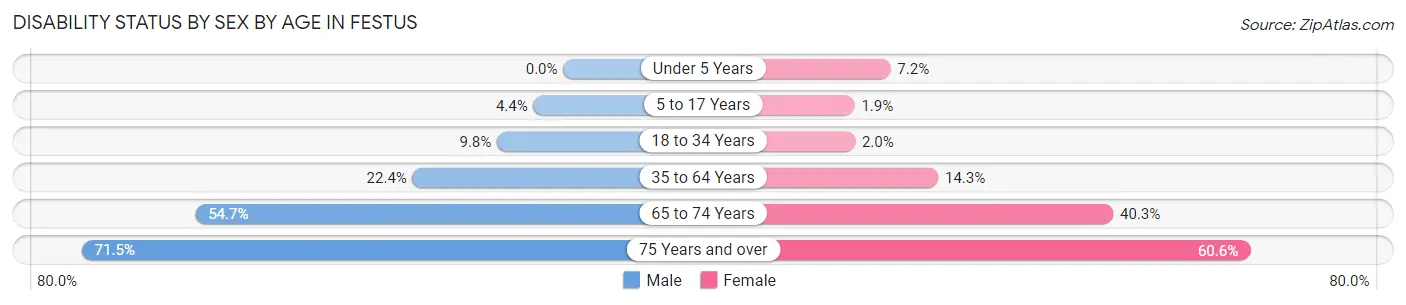
| Age Bracket | Male | Female |
| Under 5 Years | 0 (0.0%) | 44 (7.2%) |
| 5 to 17 Years | 41 (4.4%) | 22 (1.9%) |
| 18 to 34 Years | 145 (9.8%) | 25 (1.9%) |
| 35 to 64 Years | 478 (22.4%) | 367 (14.3%) |
| 65 to 74 Years | 305 (54.7%) | 276 (40.3%) |
| 75 Years and over | 221 (71.5%) | 217 (60.6%) |
Disability Class by Sex by Age in Festus
Disability Class: Hearing Difficulty
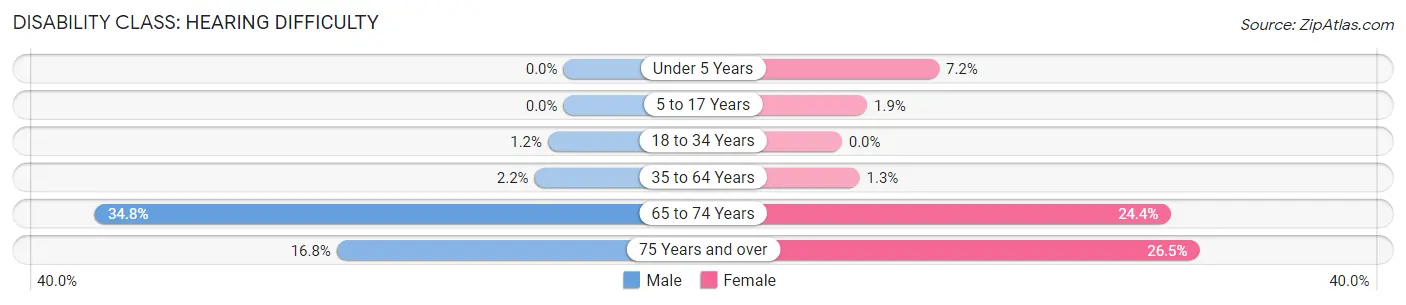
| Age Bracket | Male | Female |
| Under 5 Years | 0 (0.0%) | 44 (7.2%) |
| 5 to 17 Years | 0 (0.0%) | 22 (1.9%) |
| 18 to 34 Years | 17 (1.1%) | 0 (0.0%) |
| 35 to 64 Years | 46 (2.1%) | 34 (1.3%) |
| 65 to 74 Years | 194 (34.8%) | 167 (24.4%) |
| 75 Years and over | 52 (16.8%) | 95 (26.5%) |
Disability Class: Vision Difficulty
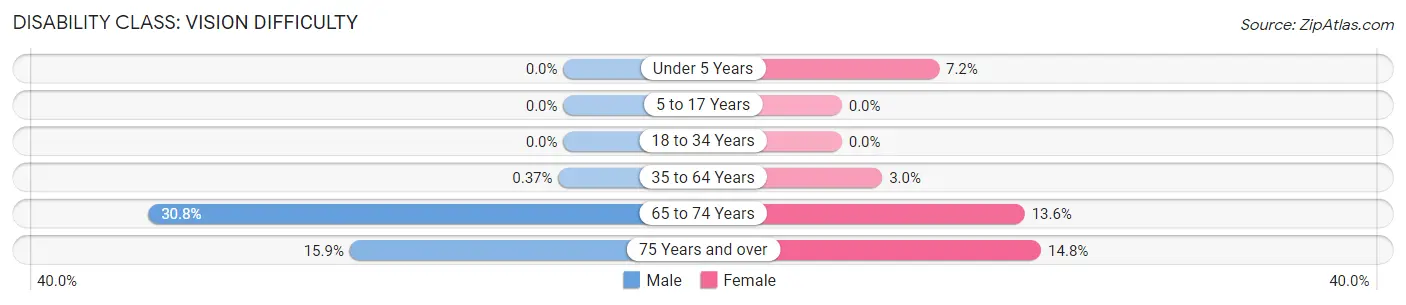
| Age Bracket | Male | Female |
| Under 5 Years | 0 (0.0%) | 44 (7.2%) |
| 5 to 17 Years | 0 (0.0%) | 0 (0.0%) |
| 18 to 34 Years | 0 (0.0%) | 0 (0.0%) |
| 35 to 64 Years | 8 (0.4%) | 77 (3.0%) |
| 65 to 74 Years | 172 (30.8%) | 93 (13.6%) |
| 75 Years and over | 49 (15.9%) | 53 (14.8%) |
Disability Class: Cognitive Difficulty
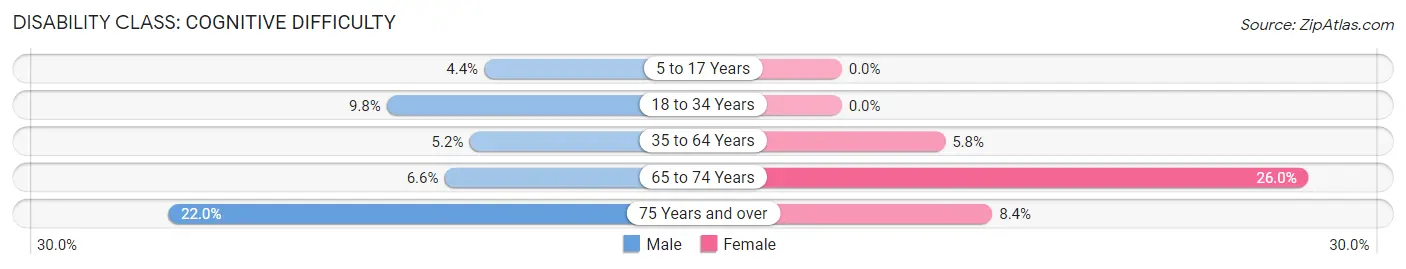
| Age Bracket | Male | Female |
| 5 to 17 Years | 41 (4.4%) | 0 (0.0%) |
| 18 to 34 Years | 145 (9.8%) | 0 (0.0%) |
| 35 to 64 Years | 112 (5.2%) | 148 (5.8%) |
| 65 to 74 Years | 37 (6.6%) | 178 (26.0%) |
| 75 Years and over | 68 (22.0%) | 30 (8.4%) |
Disability Class: Ambulatory Difficulty
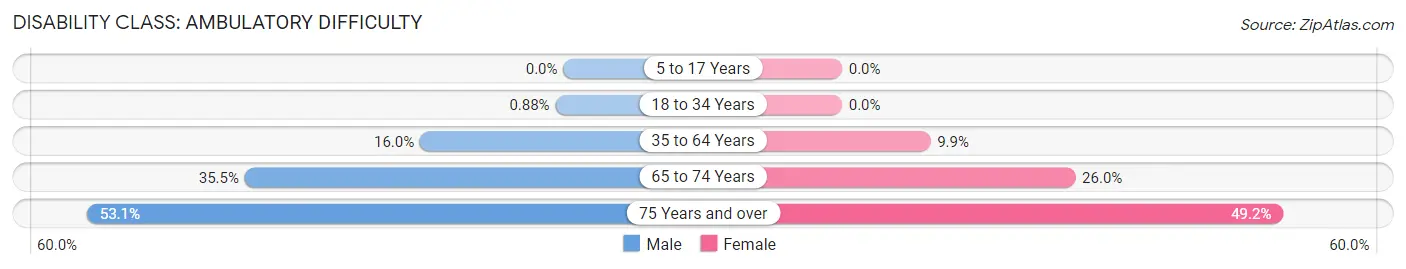
| Age Bracket | Male | Female |
| 5 to 17 Years | 0 (0.0%) | 0 (0.0%) |
| 18 to 34 Years | 13 (0.9%) | 0 (0.0%) |
| 35 to 64 Years | 341 (16.0%) | 253 (9.9%) |
| 65 to 74 Years | 198 (35.5%) | 178 (26.0%) |
| 75 Years and over | 164 (53.1%) | 176 (49.2%) |
Disability Class: Self-Care Difficulty
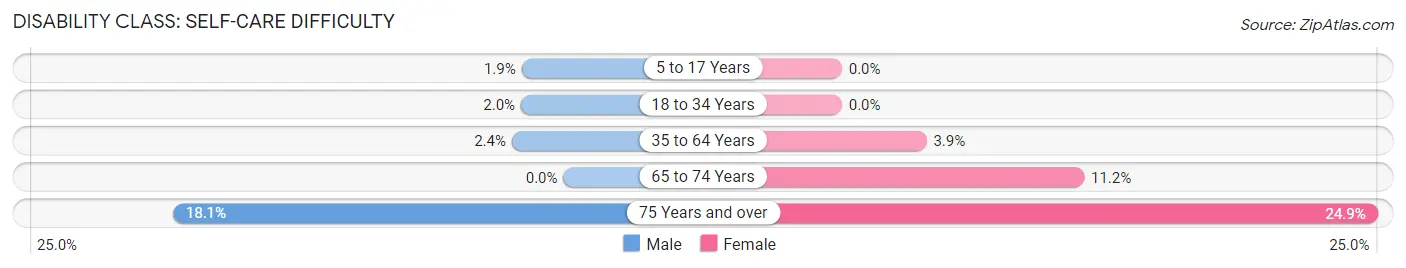
| Age Bracket | Male | Female |
| 5 to 17 Years | 18 (1.9%) | 0 (0.0%) |
| 18 to 34 Years | 29 (2.0%) | 0 (0.0%) |
| 35 to 64 Years | 51 (2.4%) | 101 (3.9%) |
| 65 to 74 Years | 0 (0.0%) | 77 (11.2%) |
| 75 Years and over | 56 (18.1%) | 89 (24.9%) |
Technology Access in Festus
Computing Device Access in Festus
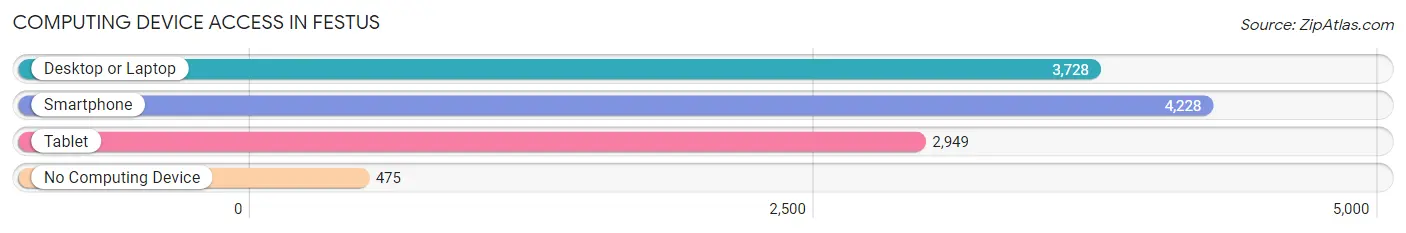
| Device Type | # Households | % Households |
| Desktop or Laptop | 3,728 | 74.3% |
| Smartphone | 4,228 | 84.2% |
| Tablet | 2,949 | 58.7% |
| No Computing Device | 475 | 9.5% |
| Total | 5,021 | 100.0% |
Internet Access in Festus
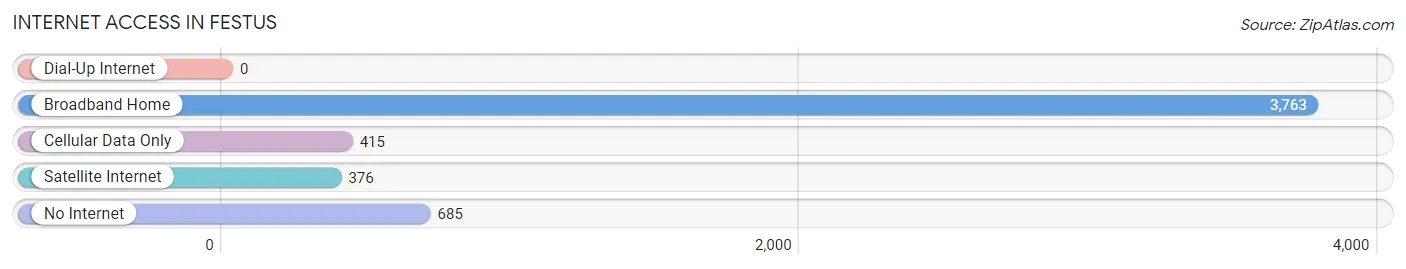
| Internet Type | # Households | % Households |
| Dial-Up Internet | 0 | 0.0% |
| Broadband Home | 3,763 | 75.0% |
| Cellular Data Only | 415 | 8.3% |
| Satellite Internet | 376 | 7.5% |
| No Internet | 685 | 13.6% |
| Total | 5,021 | 100.0% |
Festus Summary
Festus, Missouri is a small city located in Jefferson County, Missouri. It is situated about 30 miles south of St. Louis and is part of the St. Louis Metropolitan Statistical Area. The city has a population of 11,602 as of the 2010 census, making it the second largest city in Jefferson County.
History
Festus was founded in 1867 by a group of German immigrants who had settled in the area. The city was named after the Latin word for “festival”, and the city was originally known as “Festival”. The city was incorporated in 1887 and was officially renamed “Festus” in 1895.
The city was a major center for coal mining in the late 19th and early 20th centuries. The city was also home to a large number of brickyards and other industries. The city was also home to a large number of German immigrants, who brought with them their culture and traditions.
Geography
Festus is located in the southeastern corner of Jefferson County, Missouri. It is situated on the banks of the Mississippi River, about 30 miles south of St. Louis. The city has a total area of 4.2 square miles, all of which is land.
The city is located in the Ozark Plateau region of Missouri, and is surrounded by rolling hills and forests. The city is also located near the Meramec River, which is a popular destination for fishing and other outdoor activities.
Economy
Festus has a diverse economy, with a variety of industries and businesses. The city is home to a number of manufacturing companies, including a large automotive parts manufacturer. The city is also home to a number of retail stores, restaurants, and other businesses.
The city is also home to a number of medical facilities, including a hospital and several clinics. The city is also home to a number of educational institutions, including a community college and a technical school.
Demographics
As of the 2010 census, the population of Festus was 11,602. The racial makeup of the city was 95.3% White, 1.2% African American, 0.3% Native American, 0.7% Asian, 0.1% Pacific Islander, 0.7% from other races, and 1.9% from two or more races. Hispanic or Latino of any race were 2.2% of the population.
The median income for a household in the city was $41,945, and the median income for a family was $50,945. The per capita income for the city was $20,845. About 8.2% of families and 10.2% of the population were below the poverty line, including 14.2% of those under age 18 and 6.2% of those age 65 or over.
Festus is a small city with a rich history and a diverse economy. The city is home to a number of manufacturing companies, retail stores, restaurants, and other businesses. The city is also home to a number of educational institutions, medical facilities, and other services. The city has a population of 11,602 as of the 2010 census, and is part of the St. Louis Metropolitan Statistical Area.
Common Questions
What is Per Capita Income in Festus?
Per Capita income in Festus is $29,736.
What is the Median Family Income in Festus?
Median Family Income in Festus is $78,139.
What is the Median Household income in Festus?
Median Household Income in Festus is $65,942.
What is Income or Wage Gap in Festus?
Income or Wage Gap in Festus is 25.6%.
Women in Festus earn 74.4 cents for every dollar earned by a man.
What is Family Income Deficit in Festus?
Family Income Deficit in Festus is $13,573.
Families that are below poverty line in Festus earn $13,573 less on average than the poverty threshold level.
What is Inequality or Gini Index in Festus?
Inequality or Gini Index in Festus is 0.40.
What is the Total Population of Festus?
Total Population of Festus is 12,772.
What is the Total Male Population of Festus?
Total Male Population of Festus is 6,018.
What is the Total Female Population of Festus?
Total Female Population of Festus is 6,754.
What is the Ratio of Males per 100 Females in Festus?
There are 89.10 Males per 100 Females in Festus.
What is the Ratio of Females per 100 Males in Festus?
There are 112.23 Females per 100 Males in Festus.
What is the Median Population Age in Festus?
Median Population Age in Festus is 37.0 Years.
What is the Average Family Size in Festus
Average Family Size in Festus is 3.0 People.
What is the Average Household Size in Festus
Average Household Size in Festus is 2.5 People.
How Large is the Labor Force in Festus?
There are 5,926 People in the Labor Forcein in Festus.
What is the Percentage of People in the Labor Force in Festus?
61.2% of People are in the Labor Force in Festus.
What is the Unemployment Rate in Festus?
Unemployment Rate in Festus is 5.4%.