Fair Grove, MO Map & Demographics
Fair Grove Map
Fair Grove Overview
$34,433
PER CAPITA INCOME
$82,500
AVG FAMILY INCOME
$71,000
AVG HOUSEHOLD INCOME
31.5%
WAGE / INCOME GAP [ % ]
68.5¢/ $1
WAGE / INCOME GAP [ $ ]
0.42
INEQUALITY / GINI INDEX
1,625
TOTAL POPULATION
789
MALE POPULATION
836
FEMALE POPULATION
94.38
MALES / 100 FEMALES
105.96
FEMALES / 100 MALES
28.5
MEDIAN AGE
3.2
AVG FAMILY SIZE
2.8
AVG HOUSEHOLD SIZE
907
LABOR FORCE [ PEOPLE ]
77.0%
PERCENT IN LABOR FORCE
4.8%
UNEMPLOYMENT RATE
Fair Grove Zip Codes
Fair Grove Area Codes
Income in Fair Grove
Income Overview in Fair Grove
Per Capita Income in Fair Grove is $34,433, while median incomes of families and households are $82,500 and $71,000 respectively.
| Characteristic | Number | Measure |
| Per Capita Income | 1,625 | $34,433 |
| Median Family Income | 454 | $82,500 |
| Mean Family Income | 454 | $90,271 |
| Median Household Income | 586 | $71,000 |
| Mean Household Income | 586 | $94,148 |
| Income Deficit | 454 | $0 |
| Wage / Income Gap (%) | 1,625 | 31.53% |
| Wage / Income Gap ($) | 1,625 | 68.47¢ per $1 |
| Gini / Inequality Index | 1,625 | 0.42 |
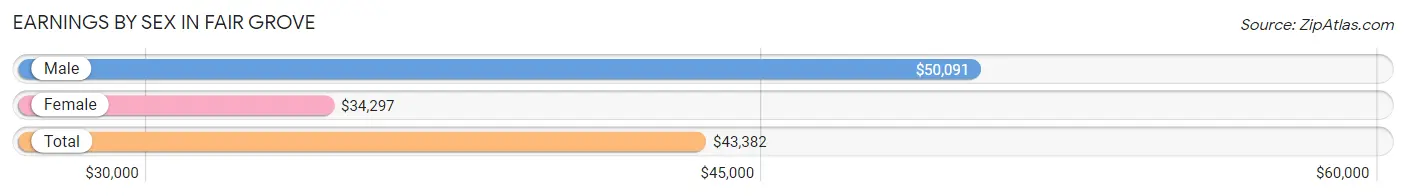
Earnings by Sex in Fair Grove
Average Earnings in Fair Grove are $43,382, $50,091 for men and $34,297 for women, a difference of 31.5%.
| Sex | Number | Average Earnings |
| Male | 491 (51.8%) | $50,091 |
| Female | 457 (48.2%) | $34,297 |
| Total | 948 (100.0%) | $43,382 |
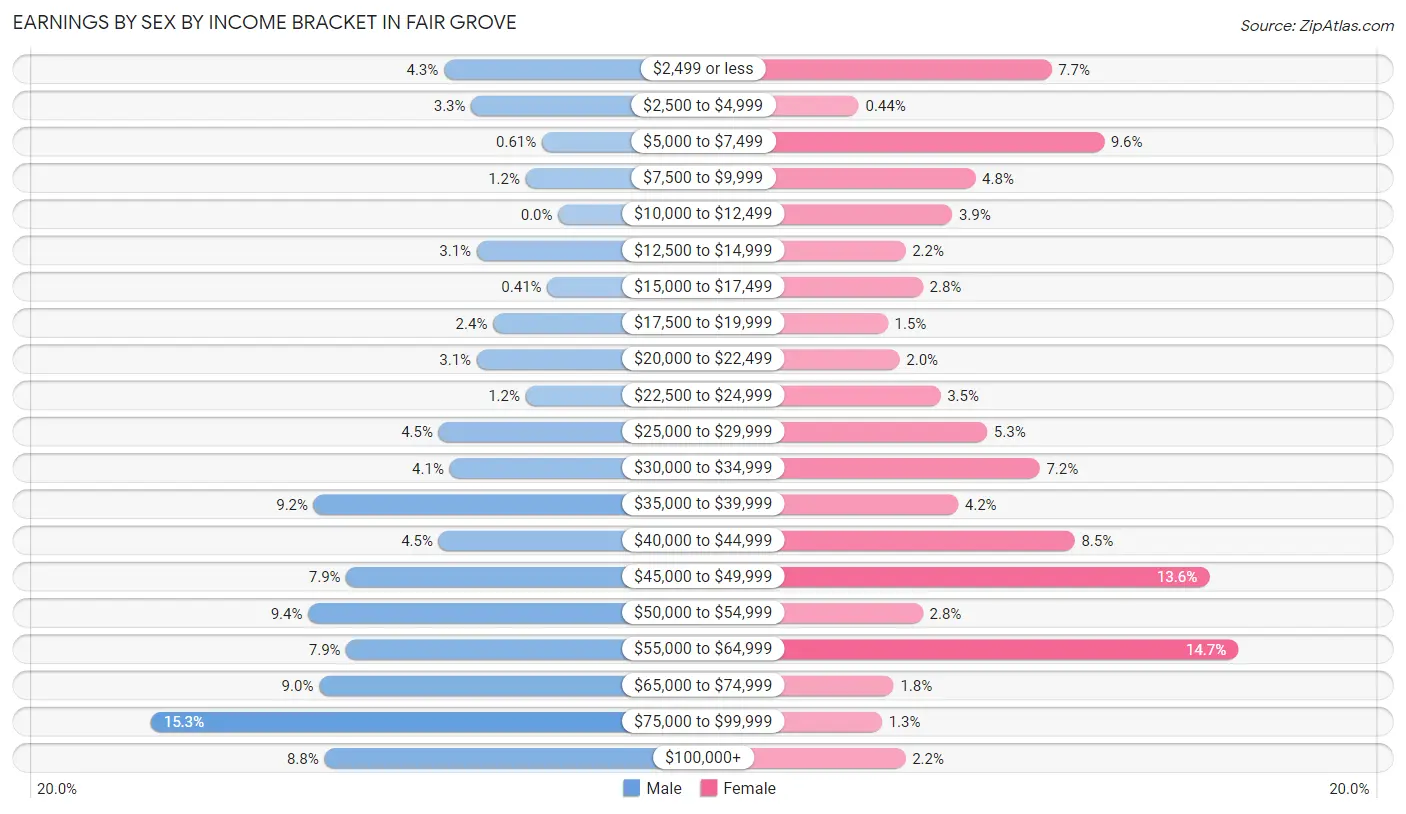
Earnings by Sex by Income Bracket in Fair Grove
The most common earnings brackets in Fair Grove are $75,000 to $99,999 for men (75 | 15.3%) and $55,000 to $64,999 for women (67 | 14.7%).
| Income | Male | Female |
| $2,499 or less | 21 (4.3%) | 35 (7.7%) |
| $2,500 to $4,999 | 16 (3.3%) | 2 (0.4%) |
| $5,000 to $7,499 | 3 (0.6%) | 44 (9.6%) |
| $7,500 to $9,999 | 6 (1.2%) | 22 (4.8%) |
| $10,000 to $12,499 | 0 (0.0%) | 18 (3.9%) |
| $12,500 to $14,999 | 15 (3.0%) | 10 (2.2%) |
| $15,000 to $17,499 | 2 (0.4%) | 13 (2.8%) |
| $17,500 to $19,999 | 12 (2.4%) | 7 (1.5%) |
| $20,000 to $22,499 | 15 (3.0%) | 9 (2.0%) |
| $22,500 to $24,999 | 6 (1.2%) | 16 (3.5%) |
| $25,000 to $29,999 | 22 (4.5%) | 24 (5.2%) |
| $30,000 to $34,999 | 20 (4.1%) | 33 (7.2%) |
| $35,000 to $39,999 | 45 (9.2%) | 19 (4.2%) |
| $40,000 to $44,999 | 22 (4.5%) | 39 (8.5%) |
| $45,000 to $49,999 | 39 (7.9%) | 62 (13.6%) |
| $50,000 to $54,999 | 46 (9.4%) | 13 (2.8%) |
| $55,000 to $64,999 | 39 (7.9%) | 67 (14.7%) |
| $65,000 to $74,999 | 44 (9.0%) | 8 (1.8%) |
| $75,000 to $99,999 | 75 (15.3%) | 6 (1.3%) |
| $100,000+ | 43 (8.8%) | 10 (2.2%) |
| Total | 491 (100.0%) | 457 (100.0%) |
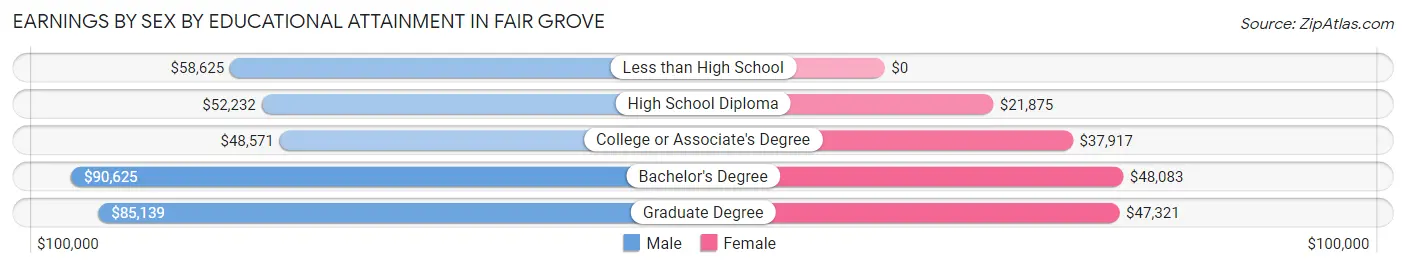
Earnings by Sex by Educational Attainment in Fair Grove
Average earnings in Fair Grove are $52,165 for men and $39,479 for women, a difference of 24.3%. Men with an educational attainment of bachelor's degree enjoy the highest average annual earnings of $90,625, while those with college or associate's degree education earn the least with $48,571. Women with an educational attainment of bachelor's degree earn the most with the average annual earnings of $48,083, while those with high school diploma education have the smallest earnings of $21,875.
| Educational Attainment | Male Income | Female Income |
| Less than High School | $58,625 | $0 |
| High School Diploma | $52,232 | $21,875 |
| College or Associate's Degree | $48,571 | $37,917 |
| Bachelor's Degree | $90,625 | $48,083 |
| Graduate Degree | $85,139 | $47,321 |
| Total | $52,165 | $39,479 |
Family Income in Fair Grove
Family Income Brackets in Fair Grove
According to the Fair Grove family income data, there are 112 families falling into the $50,000 to $74,999 income range, which is the most common income bracket and makes up 24.7% of all families. Conversely, the $10,000 to $14,999 income bracket is the least frequent group with only 4 families (0.9%) belonging to this category.
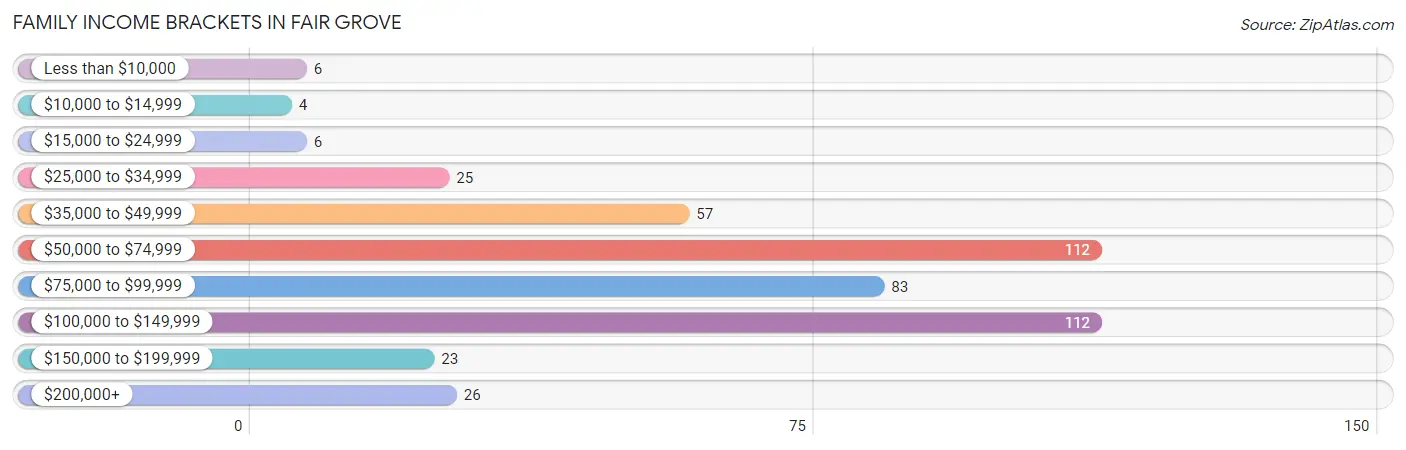
| Income Bracket | # Families | % Families |
| Less than $10,000 | 6 | 1.3% |
| $10,000 to $14,999 | 4 | 0.9% |
| $15,000 to $24,999 | 6 | 1.3% |
| $25,000 to $34,999 | 25 | 5.5% |
| $35,000 to $49,999 | 57 | 12.6% |
| $50,000 to $74,999 | 112 | 24.7% |
| $75,000 to $99,999 | 83 | 18.3% |
| $100,000 to $149,999 | 112 | 24.7% |
| $150,000 to $199,999 | 23 | 5.1% |
| $200,000+ | 26 | 5.7% |
Family Income by Famaliy Size in Fair Grove
2-person families (174 | 38.3%) account for the highest median family income in Fair Grove with $92,500 per family, while 2-person families (174 | 38.3%) have the highest median income of $46,250 per family member.
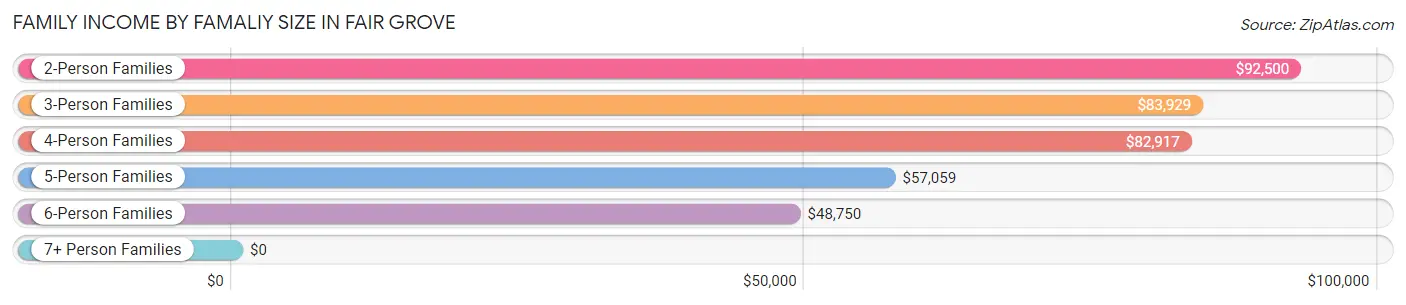
| Income Bracket | # Families | Median Income |
| 2-Person Families | 174 (38.3%) | $92,500 |
| 3-Person Families | 144 (31.7%) | $83,929 |
| 4-Person Families | 69 (15.2%) | $82,917 |
| 5-Person Families | 50 (11.0%) | $57,059 |
| 6-Person Families | 10 (2.2%) | $48,750 |
| 7+ Person Families | 7 (1.5%) | $0 |
| Total | 454 (100.0%) | $82,500 |
Family Income by Number of Earners in Fair Grove
The median family income in Fair Grove is $82,500, with families comprising 2 earners (287) having the highest median family income of $94,926, while families with no earners (27) have the lowest median family income of $37,375, accounting for 63.2% and 5.9% of families, respectively.
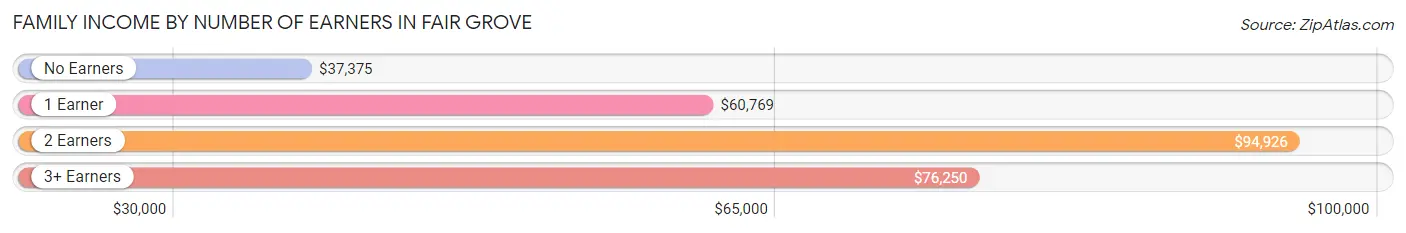
| Number of Earners | # Families | Median Income |
| No Earners | 27 (5.9%) | $37,375 |
| 1 Earner | 104 (22.9%) | $60,769 |
| 2 Earners | 287 (63.2%) | $94,926 |
| 3+ Earners | 36 (7.9%) | $76,250 |
| Total | 454 (100.0%) | $82,500 |
Household Income in Fair Grove
Household Income Brackets in Fair Grove
With 159 households falling in the category, the $50,000 to $74,999 income range is the most frequent in Fair Grove, accounting for 27.1% of all households. In contrast, only 7 households (1.2%) fall into the less than $10,000 income bracket, making it the least populous group.
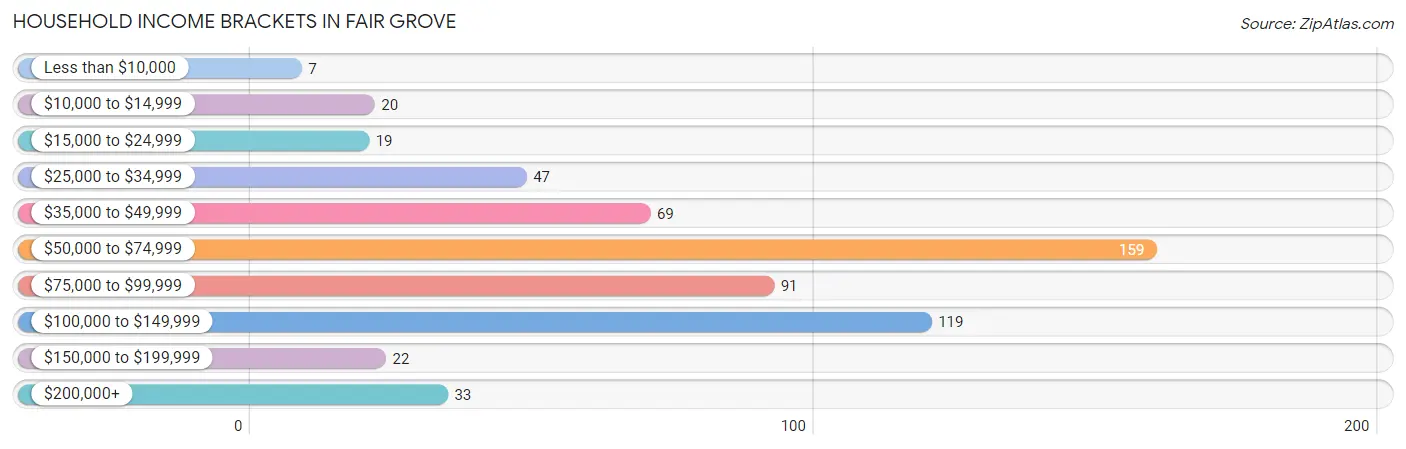
| Income Bracket | # Households | % Households |
| Less than $10,000 | 7 | 1.2% |
| $10,000 to $14,999 | 20 | 3.4% |
| $15,000 to $24,999 | 19 | 3.2% |
| $25,000 to $34,999 | 47 | 8.0% |
| $35,000 to $49,999 | 69 | 11.8% |
| $50,000 to $74,999 | 159 | 27.1% |
| $75,000 to $99,999 | 91 | 15.5% |
| $100,000 to $149,999 | 119 | 20.3% |
| $150,000 to $199,999 | 22 | 3.8% |
| $200,000+ | 33 | 5.6% |
Household Income by Householder Age in Fair Grove
The median household income in Fair Grove is $71,000, with the highest median household income of $83,750 found in the 25 to 44 years age bracket for the primary householder. A total of 259 households (44.2%) fall into this category. Meanwhile, the 65+ years age bracket for the primary householder has the lowest median household income of $38,333, with 120 households (20.5%) in this group.
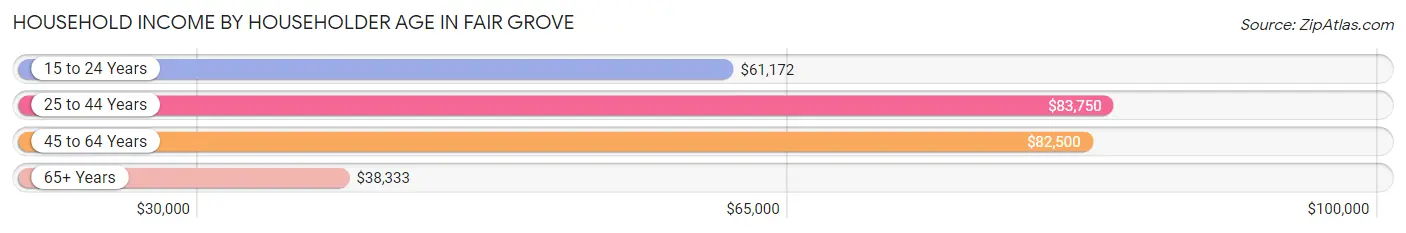
| Income Bracket | # Households | Median Income |
| 15 to 24 Years | 37 (6.3%) | $61,172 |
| 25 to 44 Years | 259 (44.2%) | $83,750 |
| 45 to 64 Years | 170 (29.0%) | $82,500 |
| 65+ Years | 120 (20.5%) | $38,333 |
| Total | 586 (100.0%) | $71,000 |
Poverty in Fair Grove
Income Below Poverty by Sex and Age in Fair Grove
With 4.8% poverty level for males and 5.9% for females among the residents of Fair Grove, 6 to 11 year old males and 65 to 74 year old females are the most vulnerable to poverty, with 11 males (18.0%) and 12 females (22.6%) in their respective age groups living below the poverty level.
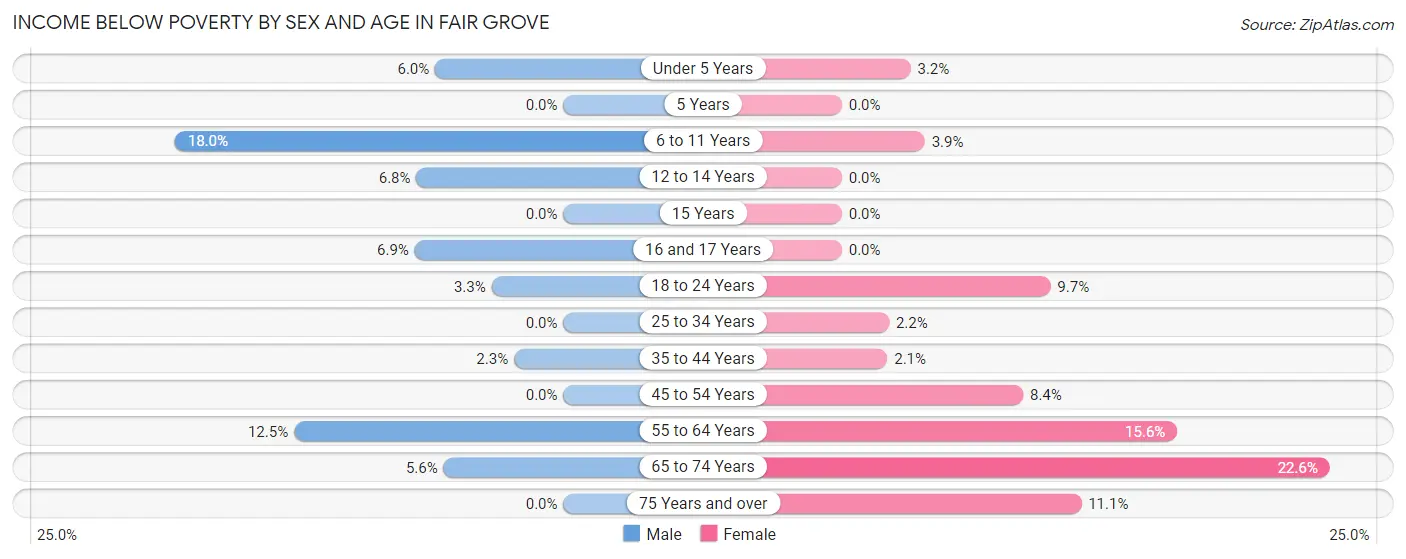
| Age Bracket | Male | Female |
| Under 5 Years | 5 (5.9%) | 3 (3.2%) |
| 5 Years | 0 (0.0%) | 0 (0.0%) |
| 6 to 11 Years | 11 (18.0%) | 3 (3.8%) |
| 12 to 14 Years | 3 (6.8%) | 0 (0.0%) |
| 15 Years | 0 (0.0%) | 0 (0.0%) |
| 16 and 17 Years | 2 (6.9%) | 0 (0.0%) |
| 18 to 24 Years | 3 (3.3%) | 6 (9.7%) |
| 25 to 34 Years | 0 (0.0%) | 4 (2.2%) |
| 35 to 44 Years | 3 (2.3%) | 2 (2.1%) |
| 45 to 54 Years | 0 (0.0%) | 9 (8.4%) |
| 55 to 64 Years | 9 (12.5%) | 7 (15.6%) |
| 65 to 74 Years | 2 (5.6%) | 12 (22.6%) |
| 75 Years and over | 0 (0.0%) | 3 (11.1%) |
| Total | 38 (4.8%) | 49 (5.9%) |
Income Above Poverty by Sex and Age in Fair Grove
According to the poverty statistics in Fair Grove, males aged 5 years and females aged 5 years are the age groups that are most secure financially, with 100.0% of males and 100.0% of females in these age groups living above the poverty line.
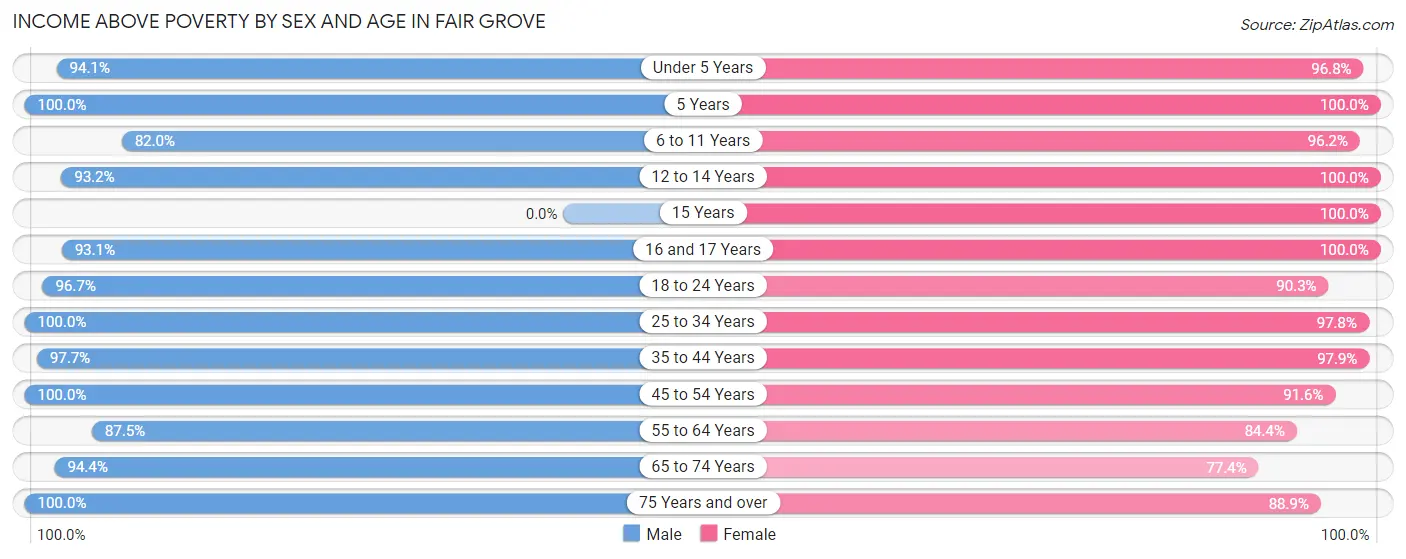
| Age Bracket | Male | Female |
| Under 5 Years | 79 (94.1%) | 91 (96.8%) |
| 5 Years | 4 (100.0%) | 17 (100.0%) |
| 6 to 11 Years | 50 (82.0%) | 75 (96.2%) |
| 12 to 14 Years | 41 (93.2%) | 39 (100.0%) |
| 15 Years | 0 (0.0%) | 24 (100.0%) |
| 16 and 17 Years | 27 (93.1%) | 12 (100.0%) |
| 18 to 24 Years | 87 (96.7%) | 56 (90.3%) |
| 25 to 34 Years | 145 (100.0%) | 179 (97.8%) |
| 35 to 44 Years | 128 (97.7%) | 93 (97.9%) |
| 45 to 54 Years | 62 (100.0%) | 98 (91.6%) |
| 55 to 64 Years | 63 (87.5%) | 38 (84.4%) |
| 65 to 74 Years | 34 (94.4%) | 41 (77.4%) |
| 75 Years and over | 29 (100.0%) | 24 (88.9%) |
| Total | 749 (95.2%) | 787 (94.1%) |
Income Below Poverty Among Married-Couple Families in Fair Grove
The poverty statistics for married-couple families in Fair Grove show that 2.4% or 9 of the total 383 families live below the poverty line. Families with 5 or more children have the highest poverty rate of 28.6%, comprising of 2 families. On the other hand, families with 3 or 4 children have the lowest poverty rate of 0.0%, which includes 0 families.
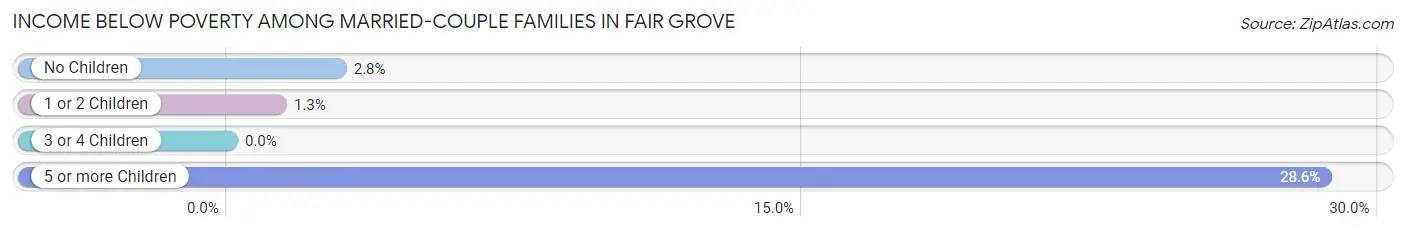
| Children | Above Poverty | Below Poverty |
| No Children | 171 (97.2%) | 5 (2.8%) |
| 1 or 2 Children | 154 (98.7%) | 2 (1.3%) |
| 3 or 4 Children | 44 (100.0%) | 0 (0.0%) |
| 5 or more Children | 5 (71.4%) | 2 (28.6%) |
| Total | 374 (97.7%) | 9 (2.4%) |
Income Below Poverty Among Single-Parent Households in Fair Grove
According to the poverty data in Fair Grove, 27.3% or 3 single-father households and 10.0% or 6 single-mother households are living below the poverty line. Among single-father households, those with 1 or 2 children have the highest poverty rate, with 3 households (42.9%) experiencing poverty. Likewise, among single-mother households, those with 1 or 2 children have the highest poverty rate, with 6 households (14.3%) falling below the poverty line.
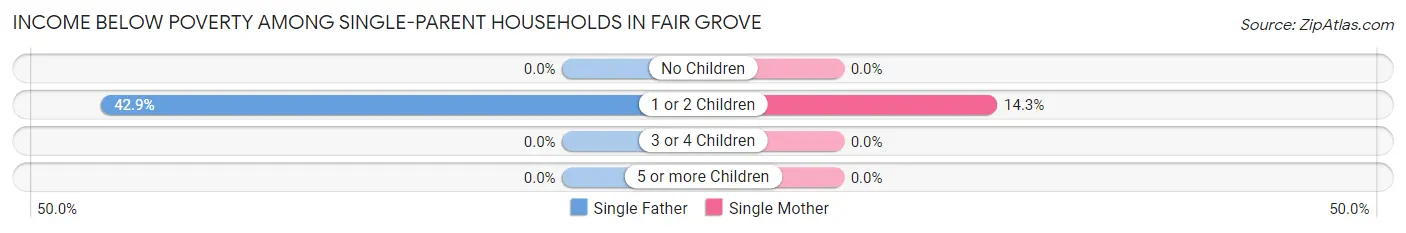
| Children | Single Father | Single Mother |
| No Children | 0 (0.0%) | 0 (0.0%) |
| 1 or 2 Children | 3 (42.9%) | 6 (14.3%) |
| 3 or 4 Children | 0 (0.0%) | 0 (0.0%) |
| 5 or more Children | 0 (0.0%) | 0 (0.0%) |
| Total | 3 (27.3%) | 6 (10.0%) |
Income Below Poverty Among Married-Couple vs Single-Parent Households in Fair Grove
The poverty data for Fair Grove shows that 9 of the married-couple family households (2.4%) and 9 of the single-parent households (12.7%) are living below the poverty level. Within the married-couple family households, those with 5 or more children have the highest poverty rate, with 2 households (28.6%) falling below the poverty line. Among the single-parent households, those with 1 or 2 children have the highest poverty rate, with 9 household (18.4%) living below poverty.
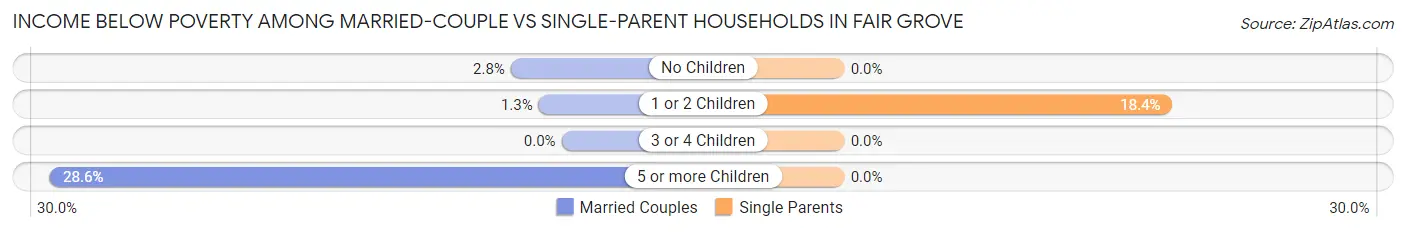
| Children | Married-Couple Families | Single-Parent Households |
| No Children | 5 (2.8%) | 0 (0.0%) |
| 1 or 2 Children | 2 (1.3%) | 9 (18.4%) |
| 3 or 4 Children | 0 (0.0%) | 0 (0.0%) |
| 5 or more Children | 2 (28.6%) | 0 (0.0%) |
| Total | 9 (2.4%) | 9 (12.7%) |
Race in Fair Grove
The most populous races in Fair Grove are White / Caucasian (1,429 | 87.9%), Two or more Races (189 | 11.6%), and Hispanic or Latino (11 | 0.7%).
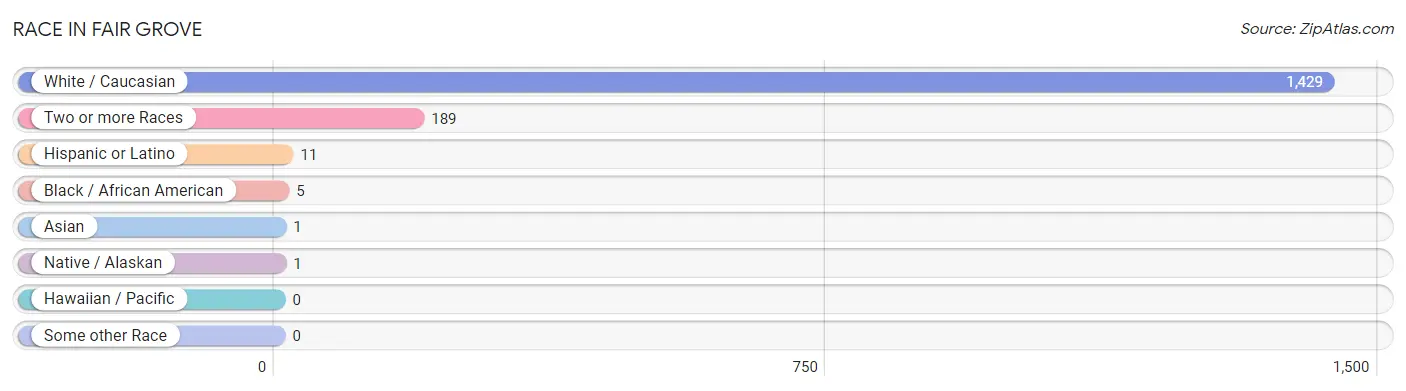
| Race | # Population | % Population |
| Asian | 1 | 0.1% |
| Black / African American | 5 | 0.3% |
| Hawaiian / Pacific | 0 | 0.0% |
| Hispanic or Latino | 11 | 0.7% |
| Native / Alaskan | 1 | 0.1% |
| White / Caucasian | 1,429 | 87.9% |
| Two or more Races | 189 | 11.6% |
| Some other Race | 0 | 0.0% |
| Total | 1,625 | 100.0% |
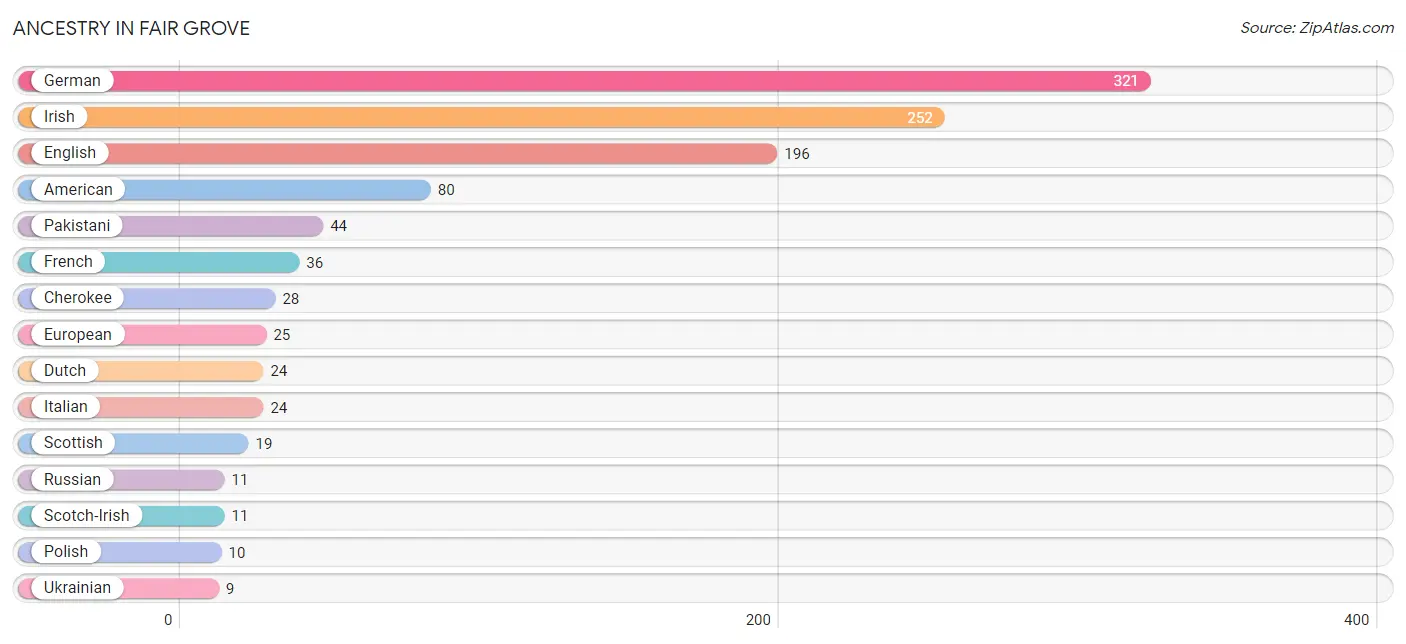
Ancestry in Fair Grove
The most populous ancestries reported in Fair Grove are German (321 | 19.8%), Irish (252 | 15.5%), English (196 | 12.1%), American (80 | 4.9%), and Pakistani (44 | 2.7%), together accounting for 54.9% of all Fair Grove residents.
| Ancestry | # Population | % Population |
| American | 80 | 4.9% |
| Burmese | 1 | 0.1% |
| Cherokee | 28 | 1.7% |
| Cheyenne | 2 | 0.1% |
| Czech | 2 | 0.1% |
| Dutch | 24 | 1.5% |
| Dutch West Indian | 3 | 0.2% |
| English | 196 | 12.1% |
| Estonian | 4 | 0.3% |
| European | 25 | 1.5% |
| Finnish | 4 | 0.3% |
| French | 36 | 2.2% |
| French Canadian | 5 | 0.3% |
| German | 321 | 19.8% |
| Irish | 252 | 15.5% |
| Italian | 24 | 1.5% |
| Lithuanian | 2 | 0.1% |
| Mexican | 7 | 0.4% |
| Navajo | 1 | 0.1% |
| Norwegian | 2 | 0.1% |
| Pakistani | 44 | 2.7% |
| Polish | 10 | 0.6% |
| Russian | 11 | 0.7% |
| Scotch-Irish | 11 | 0.7% |
| Scottish | 19 | 1.2% |
| Spaniard | 4 | 0.3% |
| Swedish | 4 | 0.3% |
| Ukrainian | 9 | 0.5% | View All 28 Rows |
Immigrants in Fair Grove
The most numerous immigrant groups reported in Fair Grove came from Eastern Europe (8 | 0.5%), Europe (8 | 0.5%), Ukraine (4 | 0.3%), Asia (1 | 0.1%), and Eastern Asia (1 | 0.1%), together accounting for 1.3% of all Fair Grove residents.
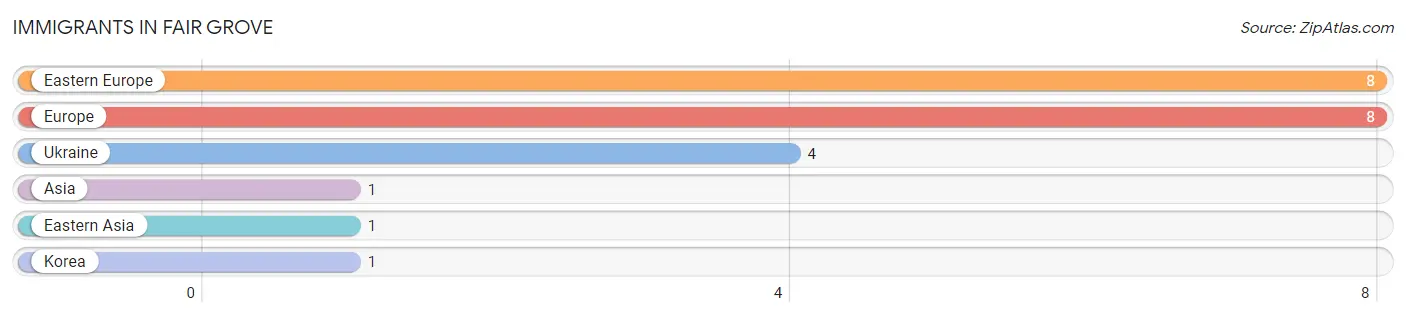
| Immigration Origin | # Population | % Population |
| Asia | 1 | 0.1% |
| Eastern Asia | 1 | 0.1% |
| Eastern Europe | 8 | 0.5% |
| Europe | 8 | 0.5% |
| Korea | 1 | 0.1% |
| Ukraine | 4 | 0.3% | View All 6 Rows |
Sex and Age in Fair Grove
Sex and Age in Fair Grove
The most populous age groups in Fair Grove are 25 to 29 Years (114 | 14.4%) for men and 25 to 29 Years (137 | 16.4%) for women.
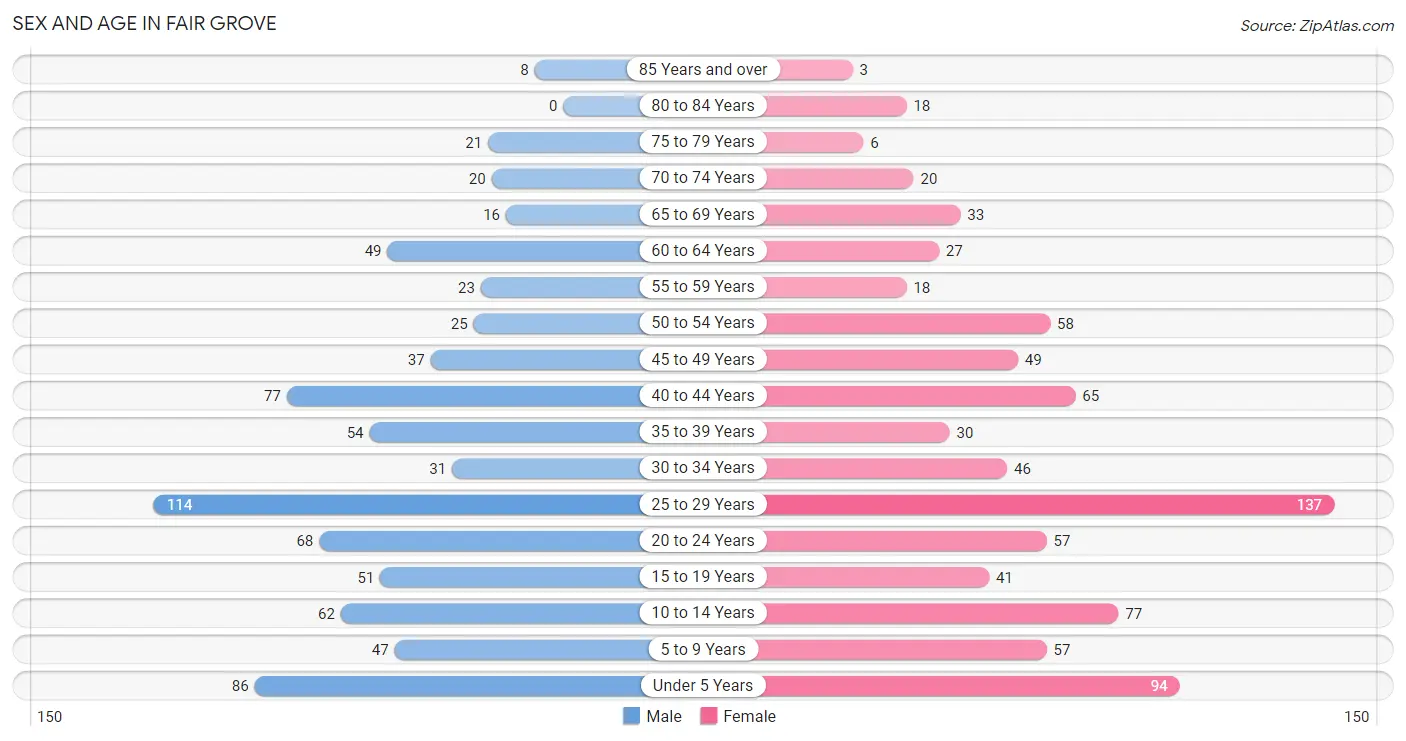
| Age Bracket | Male | Female |
| Under 5 Years | 86 (10.9%) | 94 (11.2%) |
| 5 to 9 Years | 47 (6.0%) | 57 (6.8%) |
| 10 to 14 Years | 62 (7.9%) | 77 (9.2%) |
| 15 to 19 Years | 51 (6.5%) | 41 (4.9%) |
| 20 to 24 Years | 68 (8.6%) | 57 (6.8%) |
| 25 to 29 Years | 114 (14.4%) | 137 (16.4%) |
| 30 to 34 Years | 31 (3.9%) | 46 (5.5%) |
| 35 to 39 Years | 54 (6.8%) | 30 (3.6%) |
| 40 to 44 Years | 77 (9.8%) | 65 (7.8%) |
| 45 to 49 Years | 37 (4.7%) | 49 (5.9%) |
| 50 to 54 Years | 25 (3.2%) | 58 (6.9%) |
| 55 to 59 Years | 23 (2.9%) | 18 (2.1%) |
| 60 to 64 Years | 49 (6.2%) | 27 (3.2%) |
| 65 to 69 Years | 16 (2.0%) | 33 (4.0%) |
| 70 to 74 Years | 20 (2.5%) | 20 (2.4%) |
| 75 to 79 Years | 21 (2.7%) | 6 (0.7%) |
| 80 to 84 Years | 0 (0.0%) | 18 (2.1%) |
| 85 Years and over | 8 (1.0%) | 3 (0.4%) |
| Total | 789 (100.0%) | 836 (100.0%) |
Families and Households in Fair Grove
Median Family Size in Fair Grove
The median family size in Fair Grove is 3.19 persons per family, with married-couple families (383 | 84.4%) accounting for the largest median family size of 3.26 persons per family. On the other hand, single female/mother families (60 | 13.2%) represent the smallest median family size with 2.82 persons per family.
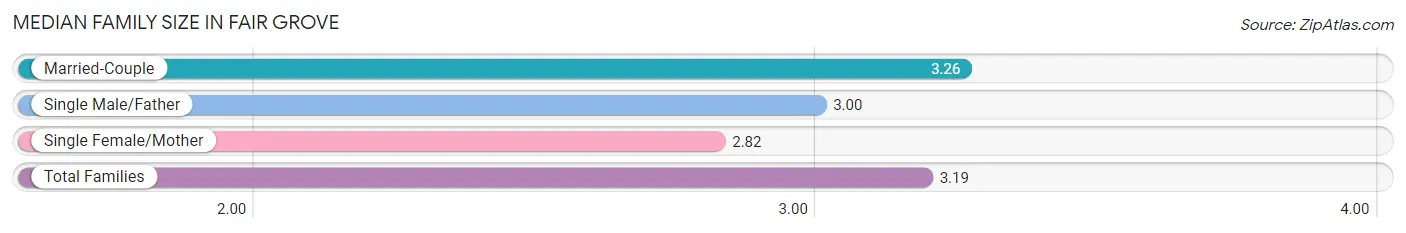
| Family Type | # Families | Family Size |
| Married-Couple | 383 (84.4%) | 3.26 |
| Single Male/Father | 11 (2.4%) | 3.00 |
| Single Female/Mother | 60 (13.2%) | 2.82 |
| Total Families | 454 (100.0%) | 3.19 |
Median Household Size in Fair Grove
The median household size in Fair Grove is 2.77 persons per household, with single male/father households (11 | 1.9%) accounting for the largest median household size of 4.09 persons per household. non-family households (132 | 22.5%) represent the smallest median household size with 1.13 persons per household.
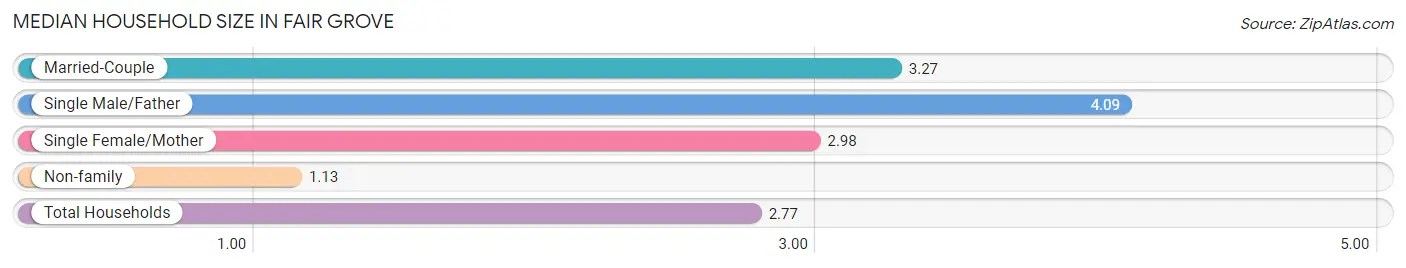
| Household Type | # Households | Household Size |
| Married-Couple | 383 (65.4%) | 3.27 |
| Single Male/Father | 11 (1.9%) | 4.09 |
| Single Female/Mother | 60 (10.2%) | 2.98 |
| Non-family | 132 (22.5%) | 1.13 |
| Total Households | 586 (100.0%) | 2.77 |
Household Size by Marriage Status in Fair Grove
Out of a total of 586 households in Fair Grove, 454 (77.5%) are family households, while 132 (22.5%) are nonfamily households. The most numerous type of family households are 2-person households, comprising 163, and the most common type of nonfamily households are 1-person households, comprising 116.
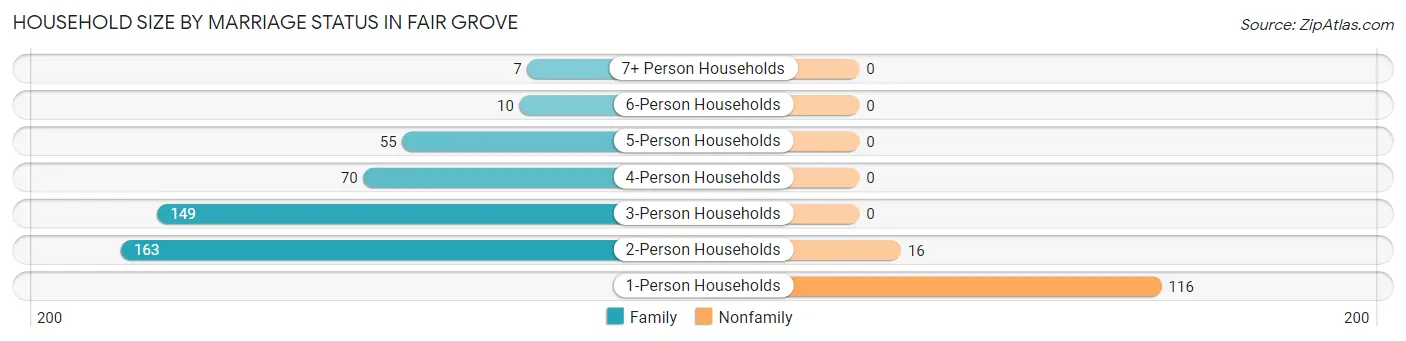
| Household Size | Family Households | Nonfamily Households |
| 1-Person Households | - | 116 (19.8%) |
| 2-Person Households | 163 (27.8%) | 16 (2.7%) |
| 3-Person Households | 149 (25.4%) | 0 (0.0%) |
| 4-Person Households | 70 (11.9%) | 0 (0.0%) |
| 5-Person Households | 55 (9.4%) | 0 (0.0%) |
| 6-Person Households | 10 (1.7%) | 0 (0.0%) |
| 7+ Person Households | 7 (1.2%) | 0 (0.0%) |
| Total | 454 (77.5%) | 132 (22.5%) |
Female Fertility in Fair Grove
Fertility by Age in Fair Grove
Average fertility rate in Fair Grove is 90.0 births per 1,000 women. Women in the age bracket of 20 to 34 years have the highest fertility rate with 142.0 births per 1,000 women. Women in the age bracket of 20 to 34 years acount for 87.2% of all women with births.
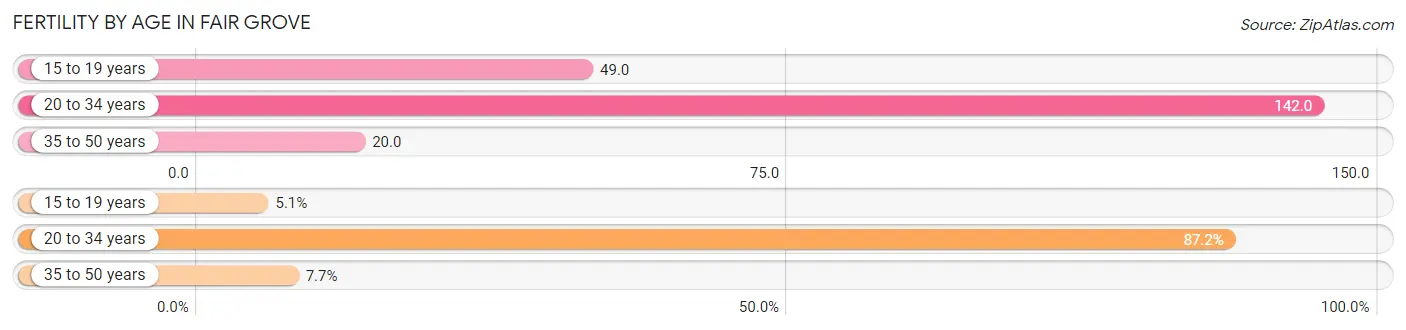
| Age Bracket | Women with Births | Births / 1,000 Women |
| 15 to 19 years | 2 (5.1%) | 49.0 |
| 20 to 34 years | 34 (87.2%) | 142.0 |
| 35 to 50 years | 3 (7.7%) | 20.0 |
| Total | 39 (100.0%) | 90.0 |
Fertility by Age by Marriage Status in Fair Grove
94.9% of women with births (39) in Fair Grove are married. The highest percentage of unmarried women with births falls into 15 to 19 years age bracket with 100.0% of them unmarried at the time of birth, while the lowest percentage of unmarried women with births belong to 20 to 34 years age bracket with 0.0% of them unmarried.
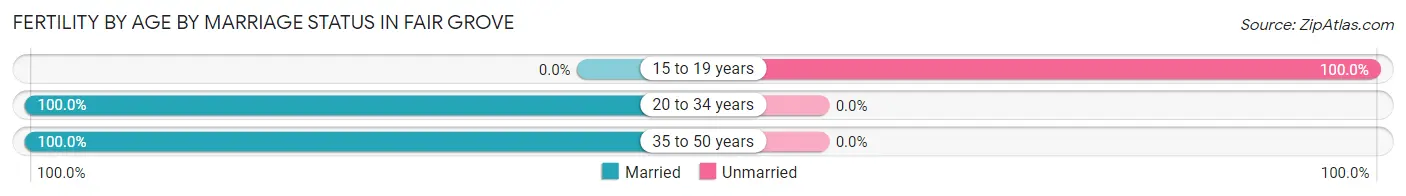
| Age Bracket | Married | Unmarried |
| 15 to 19 years | 0 (0.0%) | 2 (100.0%) |
| 20 to 34 years | 34 (100.0%) | 0 (0.0%) |
| 35 to 50 years | 3 (100.0%) | 0 (0.0%) |
| Total | 37 (94.9%) | 2 (5.1%) |
Fertility by Education in Fair Grove
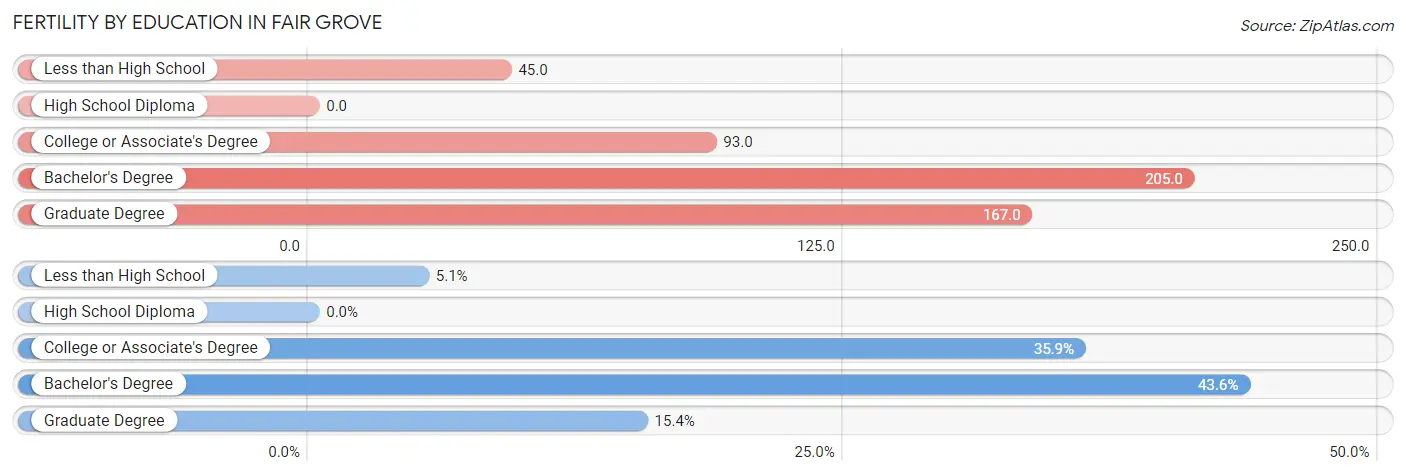
| Educational Attainment | Women with Births | Births / 1,000 Women |
| Less than High School | 2 (5.1%) | 45.0 |
| High School Diploma | 0 (0.0%) | 0.0 |
| College or Associate's Degree | 14 (35.9%) | 93.0 |
| Bachelor's Degree | 17 (43.6%) | 205.0 |
| Graduate Degree | 6 (15.4%) | 167.0 |
| Total | 39 (100.0%) | 90.0 |
Fertility by Education by Marriage Status in Fair Grove
5.1% of women with births in Fair Grove are unmarried. Women with the educational attainment of college or associate's degree are most likely to be married with 100.0% of them married at childbirth, while women with the educational attainment of less than high school are least likely to be married with 100.0% of them unmarried at childbirth.
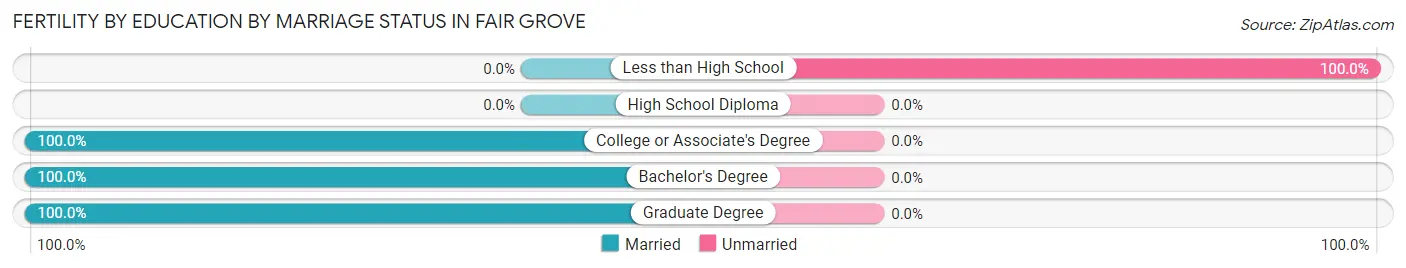
| Educational Attainment | Married | Unmarried |
| Less than High School | 0 (0.0%) | 2 (100.0%) |
| High School Diploma | 0 (0.0%) | 0 (0.0%) |
| College or Associate's Degree | 14 (100.0%) | 0 (0.0%) |
| Bachelor's Degree | 17 (100.0%) | 0 (0.0%) |
| Graduate Degree | 6 (100.0%) | 0 (0.0%) |
| Total | 37 (94.9%) | 2 (5.1%) |
Employment Characteristics in Fair Grove
Employment by Class of Employer in Fair Grove
Among the 840 employed individuals in Fair Grove, private company employees (583 | 69.4%), not-for-profit organizations (79 | 9.4%), and self-employed (incorporated) (50 | 5.9%) make up the most common classes of employment.
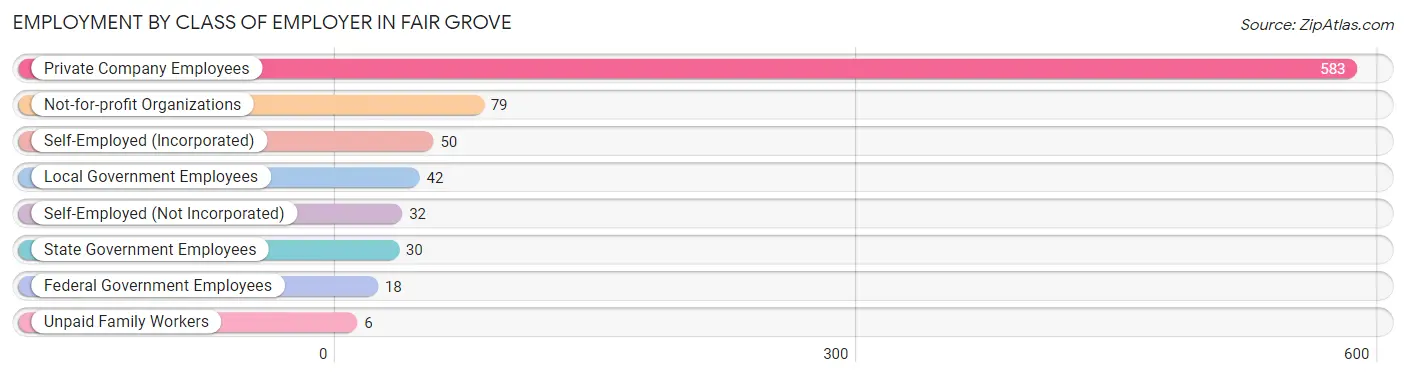
| Employer Class | # Employees | % Employees |
| Private Company Employees | 583 | 69.4% |
| Self-Employed (Incorporated) | 50 | 5.9% |
| Self-Employed (Not Incorporated) | 32 | 3.8% |
| Not-for-profit Organizations | 79 | 9.4% |
| Local Government Employees | 42 | 5.0% |
| State Government Employees | 30 | 3.6% |
| Federal Government Employees | 18 | 2.1% |
| Unpaid Family Workers | 6 | 0.7% |
| Total | 840 | 100.0% |
Employment Status by Age in Fair Grove
According to the labor force statistics for Fair Grove, out of the total population over 16 years of age (1,178), 77.0% or 907 individuals are in the labor force, with 4.8% or 44 of them unemployed. The age group with the highest labor force participation rate is 45 to 54 years, with 95.9% or 162 individuals in the labor force. Within the labor force, the 35 to 44 years age range has the highest percentage of unemployed individuals, with 8.5% or 18 of them being unemployed.
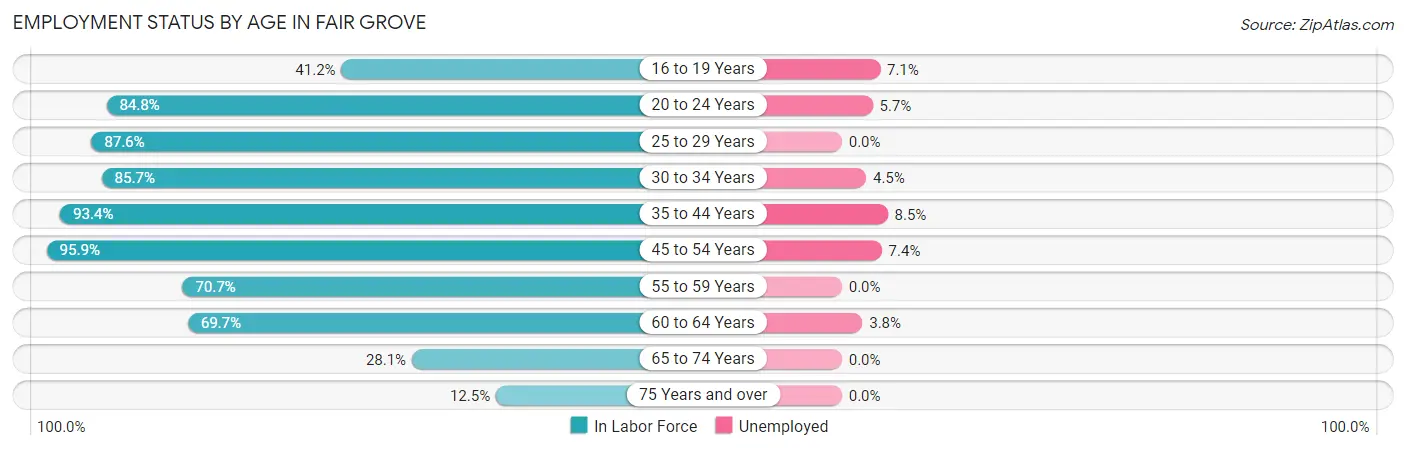
| Age Bracket | In Labor Force | Unemployed |
| 16 to 19 Years | 28 (41.2%) | 2 (7.1%) |
| 20 to 24 Years | 106 (84.8%) | 6 (5.7%) |
| 25 to 29 Years | 220 (87.6%) | 0 (0.0%) |
| 30 to 34 Years | 66 (85.7%) | 3 (4.5%) |
| 35 to 44 Years | 211 (93.4%) | 18 (8.5%) |
| 45 to 54 Years | 162 (95.9%) | 12 (7.4%) |
| 55 to 59 Years | 29 (70.7%) | 0 (0.0%) |
| 60 to 64 Years | 53 (69.7%) | 2 (3.8%) |
| 65 to 74 Years | 25 (28.1%) | 0 (0.0%) |
| 75 Years and over | 7 (12.5%) | 0 (0.0%) |
| Total | 907 (77.0%) | 44 (4.8%) |
Employment Status by Educational Attainment in Fair Grove
According to labor force statistics for Fair Grove, 88.2% of individuals (741) out of the total population between 25 and 64 years of age (840) are in the labor force, with 4.8% or 36 of them being unemployed. The group with the highest labor force participation rate are those with the educational attainment of bachelor's degree or higher, with 92.2% or 201 individuals in the labor force. Within the labor force, individuals with college / associate degree education have the highest percentage of unemployment, with 9.6% or 28 of them being unemployed.
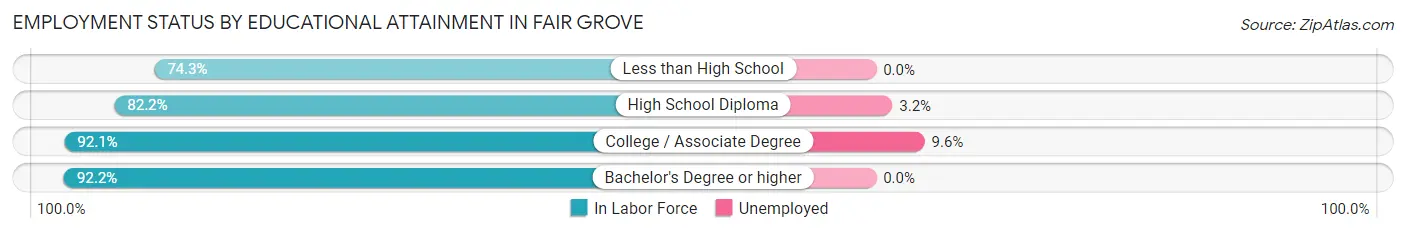
| Educational Attainment | In Labor Force | Unemployed |
| Less than High School | 26 (74.3%) | 0 (0.0%) |
| High School Diploma | 222 (82.2%) | 9 (3.2%) |
| College / Associate Degree | 292 (92.1%) | 30 (9.6%) |
| Bachelor's Degree or higher | 201 (92.2%) | 0 (0.0%) |
| Total | 741 (88.2%) | 40 (4.8%) |
Employment Occupations by Sex in Fair Grove
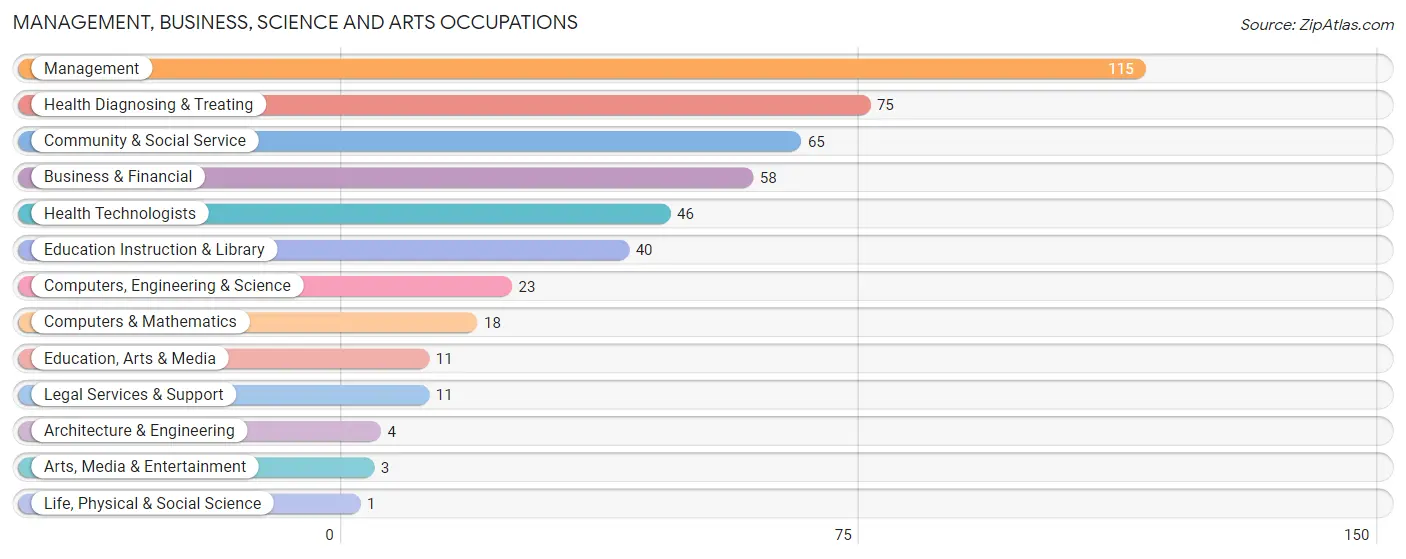
Management, Business, Science and Arts Occupations
The most common Management, Business, Science and Arts occupations in Fair Grove are Management (115 | 13.6%), Health Diagnosing & Treating (75 | 8.8%), Community & Social Service (65 | 7.7%), Business & Financial (58 | 6.8%), and Health Technologists (46 | 5.4%).
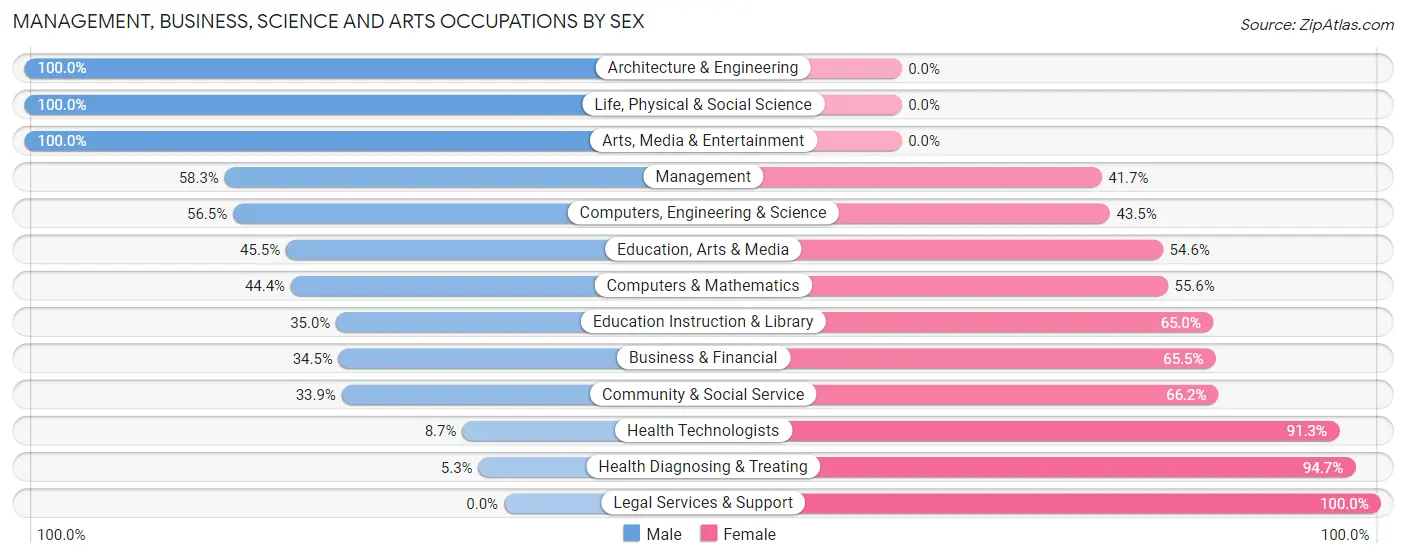
Management, Business, Science and Arts Occupations by Sex
Within the Management, Business, Science and Arts occupations in Fair Grove, the most male-oriented occupations are Architecture & Engineering (100.0%), Life, Physical & Social Science (100.0%), and Arts, Media & Entertainment (100.0%), while the most female-oriented occupations are Legal Services & Support (100.0%), Health Diagnosing & Treating (94.7%), and Health Technologists (91.3%).
| Occupation | Male | Female |
| Management | 67 (58.3%) | 48 (41.7%) |
| Business & Financial | 20 (34.5%) | 38 (65.5%) |
| Computers, Engineering & Science | 13 (56.5%) | 10 (43.5%) |
| Computers & Mathematics | 8 (44.4%) | 10 (55.6%) |
| Architecture & Engineering | 4 (100.0%) | 0 (0.0%) |
| Life, Physical & Social Science | 1 (100.0%) | 0 (0.0%) |
| Community & Social Service | 22 (33.9%) | 43 (66.1%) |
| Education, Arts & Media | 5 (45.5%) | 6 (54.5%) |
| Legal Services & Support | 0 (0.0%) | 11 (100.0%) |
| Education Instruction & Library | 14 (35.0%) | 26 (65.0%) |
| Arts, Media & Entertainment | 3 (100.0%) | 0 (0.0%) |
| Health Diagnosing & Treating | 4 (5.3%) | 71 (94.7%) |
| Health Technologists | 4 (8.7%) | 42 (91.3%) |
| Total (Category) | 126 (37.5%) | 210 (62.5%) |
| Total (Overall) | 444 (52.3%) | 405 (47.7%) |
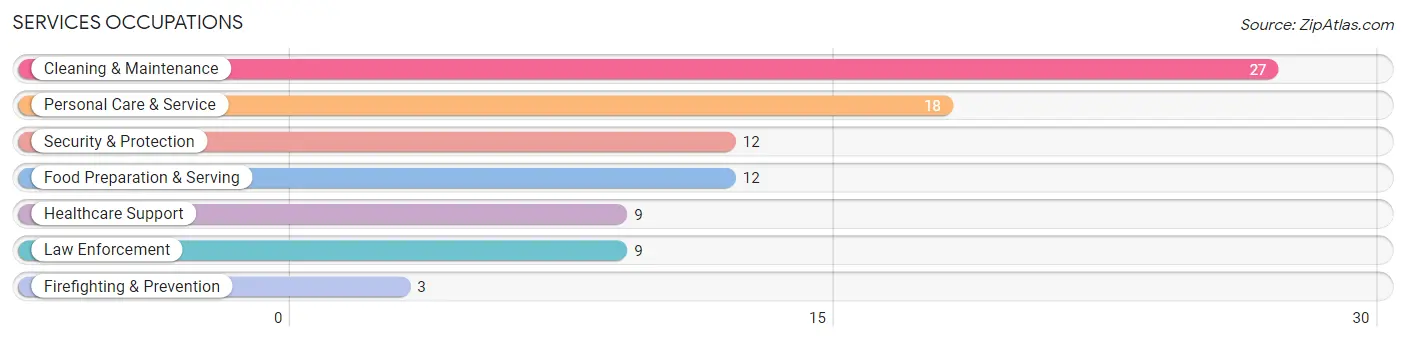
Services Occupations
The most common Services occupations in Fair Grove are Cleaning & Maintenance (27 | 3.2%), Personal Care & Service (18 | 2.1%), Security & Protection (12 | 1.4%), Food Preparation & Serving (12 | 1.4%), and Healthcare Support (9 | 1.1%).
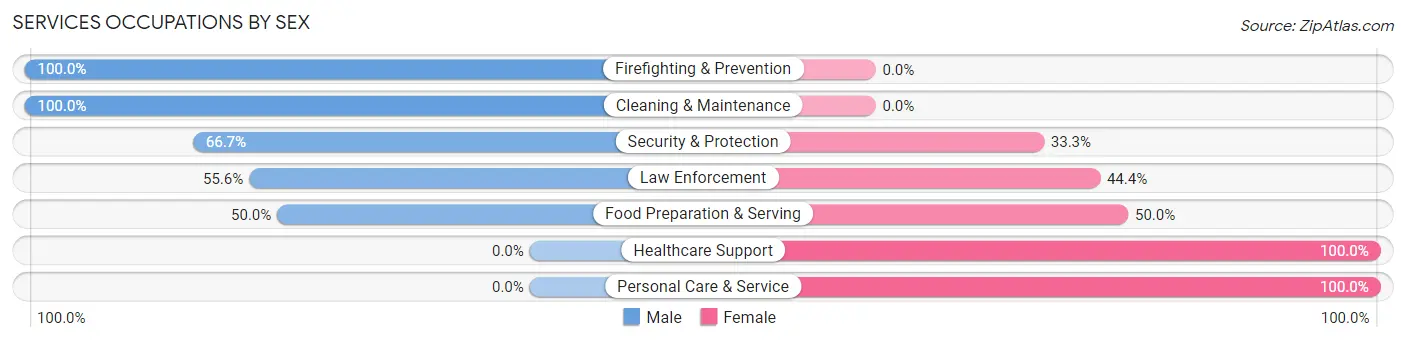
Services Occupations by Sex
Within the Services occupations in Fair Grove, the most male-oriented occupations are Firefighting & Prevention (100.0%), Cleaning & Maintenance (100.0%), and Security & Protection (66.7%), while the most female-oriented occupations are Healthcare Support (100.0%), Personal Care & Service (100.0%), and Food Preparation & Serving (50.0%).
| Occupation | Male | Female |
| Healthcare Support | 0 (0.0%) | 9 (100.0%) |
| Security & Protection | 8 (66.7%) | 4 (33.3%) |
| Firefighting & Prevention | 3 (100.0%) | 0 (0.0%) |
| Law Enforcement | 5 (55.6%) | 4 (44.4%) |
| Food Preparation & Serving | 6 (50.0%) | 6 (50.0%) |
| Cleaning & Maintenance | 27 (100.0%) | 0 (0.0%) |
| Personal Care & Service | 0 (0.0%) | 18 (100.0%) |
| Total (Category) | 41 (52.6%) | 37 (47.4%) |
| Total (Overall) | 444 (52.3%) | 405 (47.7%) |
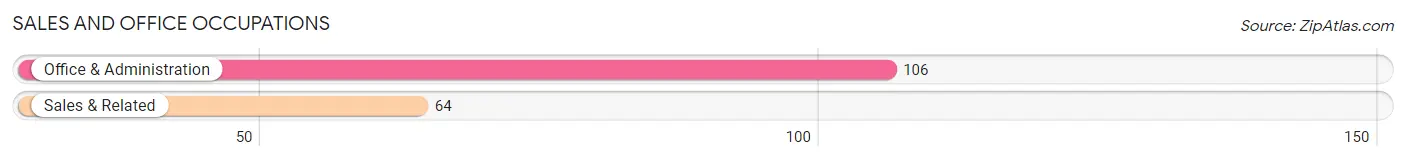
Sales and Office Occupations
The most common Sales and Office occupations in Fair Grove are Office & Administration (106 | 12.5%), and Sales & Related (64 | 7.5%).
Sales and Office Occupations by Sex
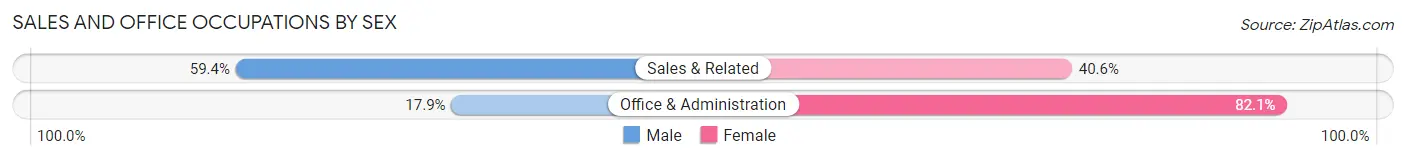
| Occupation | Male | Female |
| Sales & Related | 38 (59.4%) | 26 (40.6%) |
| Office & Administration | 19 (17.9%) | 87 (82.1%) |
| Total (Category) | 57 (33.5%) | 113 (66.5%) |
| Total (Overall) | 444 (52.3%) | 405 (47.7%) |
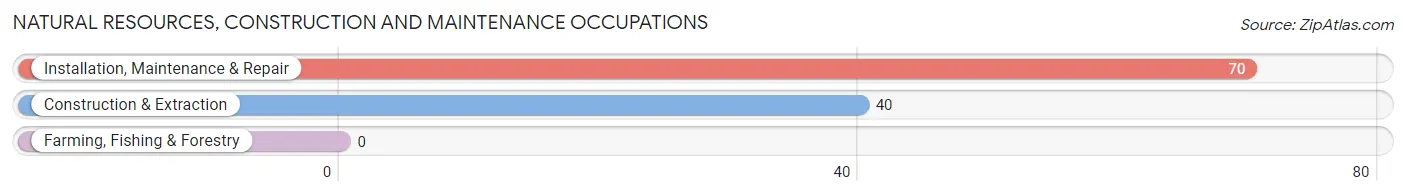
Natural Resources, Construction and Maintenance Occupations
The most common Natural Resources, Construction and Maintenance occupations in Fair Grove are Installation, Maintenance & Repair (70 | 8.2%), and Construction & Extraction (40 | 4.7%).
Natural Resources, Construction and Maintenance Occupations by Sex
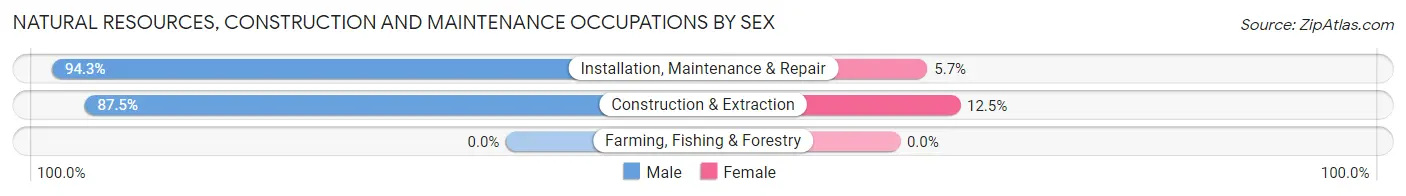
| Occupation | Male | Female |
| Farming, Fishing & Forestry | 0 (0.0%) | 0 (0.0%) |
| Construction & Extraction | 35 (87.5%) | 5 (12.5%) |
| Installation, Maintenance & Repair | 66 (94.3%) | 4 (5.7%) |
| Total (Category) | 101 (91.8%) | 9 (8.2%) |
| Total (Overall) | 444 (52.3%) | 405 (47.7%) |
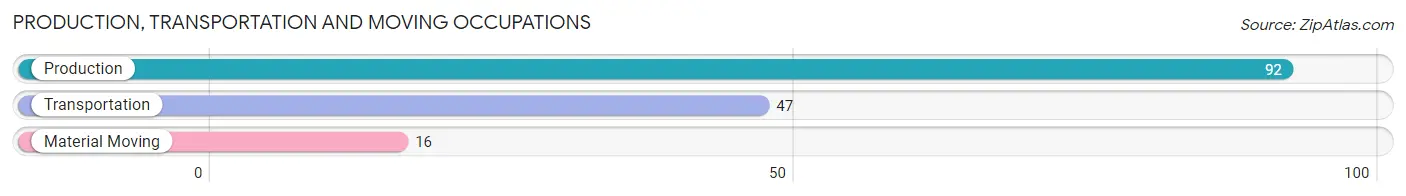
Production, Transportation and Moving Occupations
The most common Production, Transportation and Moving occupations in Fair Grove are Production (92 | 10.8%), Transportation (47 | 5.5%), and Material Moving (16 | 1.9%).
Production, Transportation and Moving Occupations by Sex
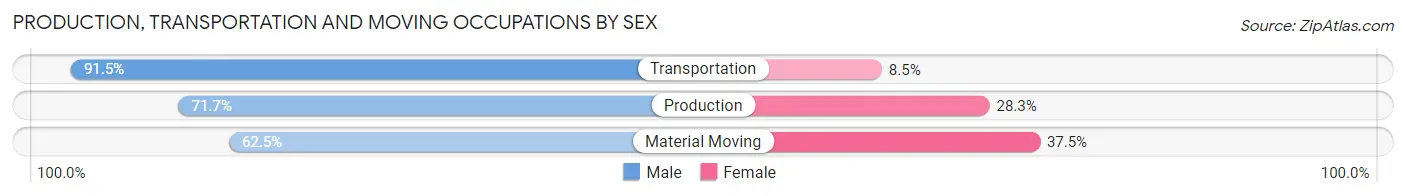
| Occupation | Male | Female |
| Production | 66 (71.7%) | 26 (28.3%) |
| Transportation | 43 (91.5%) | 4 (8.5%) |
| Material Moving | 10 (62.5%) | 6 (37.5%) |
| Total (Category) | 119 (76.8%) | 36 (23.2%) |
| Total (Overall) | 444 (52.3%) | 405 (47.7%) |
Employment Industries by Sex in Fair Grove
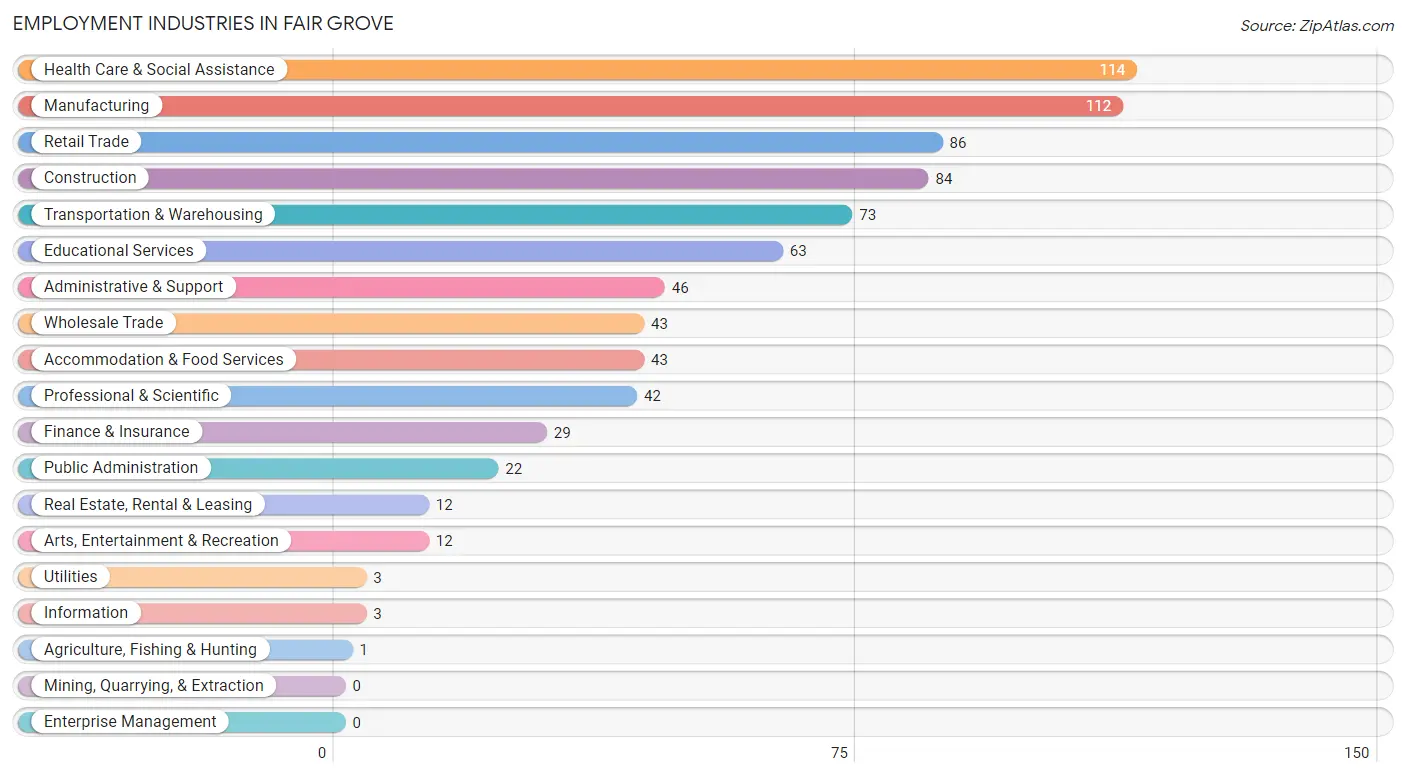
Employment Industries in Fair Grove
The major employment industries in Fair Grove include Health Care & Social Assistance (114 | 13.4%), Manufacturing (112 | 13.2%), Retail Trade (86 | 10.1%), Construction (84 | 9.9%), and Transportation & Warehousing (73 | 8.6%).
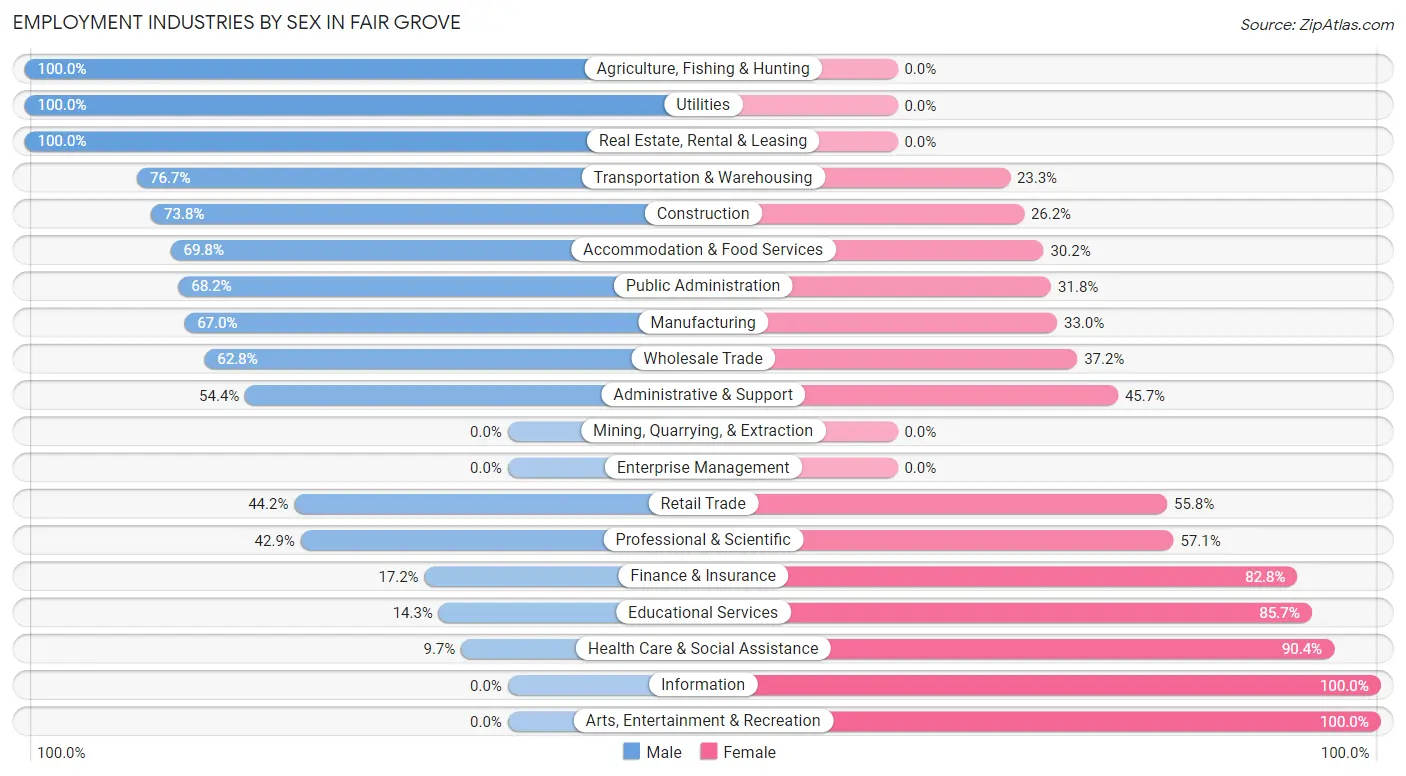
Employment Industries by Sex in Fair Grove
The Fair Grove industries that see more men than women are Agriculture, Fishing & Hunting (100.0%), Utilities (100.0%), and Real Estate, Rental & Leasing (100.0%), whereas the industries that tend to have a higher number of women are Information (100.0%), Arts, Entertainment & Recreation (100.0%), and Health Care & Social Assistance (90.3%).
| Industry | Male | Female |
| Agriculture, Fishing & Hunting | 1 (100.0%) | 0 (0.0%) |
| Mining, Quarrying, & Extraction | 0 (0.0%) | 0 (0.0%) |
| Construction | 62 (73.8%) | 22 (26.2%) |
| Manufacturing | 75 (67.0%) | 37 (33.0%) |
| Wholesale Trade | 27 (62.8%) | 16 (37.2%) |
| Retail Trade | 38 (44.2%) | 48 (55.8%) |
| Transportation & Warehousing | 56 (76.7%) | 17 (23.3%) |
| Utilities | 3 (100.0%) | 0 (0.0%) |
| Information | 0 (0.0%) | 3 (100.0%) |
| Finance & Insurance | 5 (17.2%) | 24 (82.8%) |
| Real Estate, Rental & Leasing | 12 (100.0%) | 0 (0.0%) |
| Professional & Scientific | 18 (42.9%) | 24 (57.1%) |
| Enterprise Management | 0 (0.0%) | 0 (0.0%) |
| Administrative & Support | 25 (54.3%) | 21 (45.7%) |
| Educational Services | 9 (14.3%) | 54 (85.7%) |
| Health Care & Social Assistance | 11 (9.7%) | 103 (90.3%) |
| Arts, Entertainment & Recreation | 0 (0.0%) | 12 (100.0%) |
| Accommodation & Food Services | 30 (69.8%) | 13 (30.2%) |
| Public Administration | 15 (68.2%) | 7 (31.8%) |
| Total | 444 (52.3%) | 405 (47.7%) |
Education in Fair Grove
School Enrollment in Fair Grove
The most common levels of schooling among the 479 students in Fair Grove are college / undergraduate (117 | 24.4%), elementary school (92 | 19.2%), and high school (91 | 19.0%).
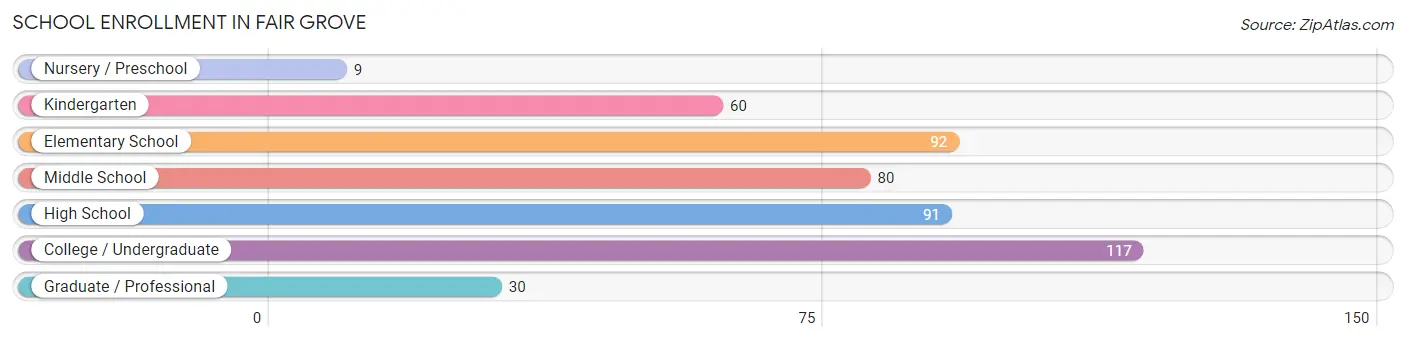
| School Level | # Students | % Students |
| Nursery / Preschool | 9 | 1.9% |
| Kindergarten | 60 | 12.5% |
| Elementary School | 92 | 19.2% |
| Middle School | 80 | 16.7% |
| High School | 91 | 19.0% |
| College / Undergraduate | 117 | 24.4% |
| Graduate / Professional | 30 | 6.3% |
| Total | 479 | 100.0% |
School Enrollment by Age by Funding Source in Fair Grove
Out of a total of 479 students who are enrolled in schools in Fair Grove, 52 (10.9%) attend a private institution, while the remaining 427 (89.1%) are enrolled in public schools. The age group of 18 to 19 year olds has the highest likelihood of being enrolled in private schools, with 11 (84.6% in the age bracket) enrolled. Conversely, the age group of 10 to 14 year olds has the lowest likelihood of being enrolled in a private school, with 137 (100.0% in the age bracket) attending a public institution.
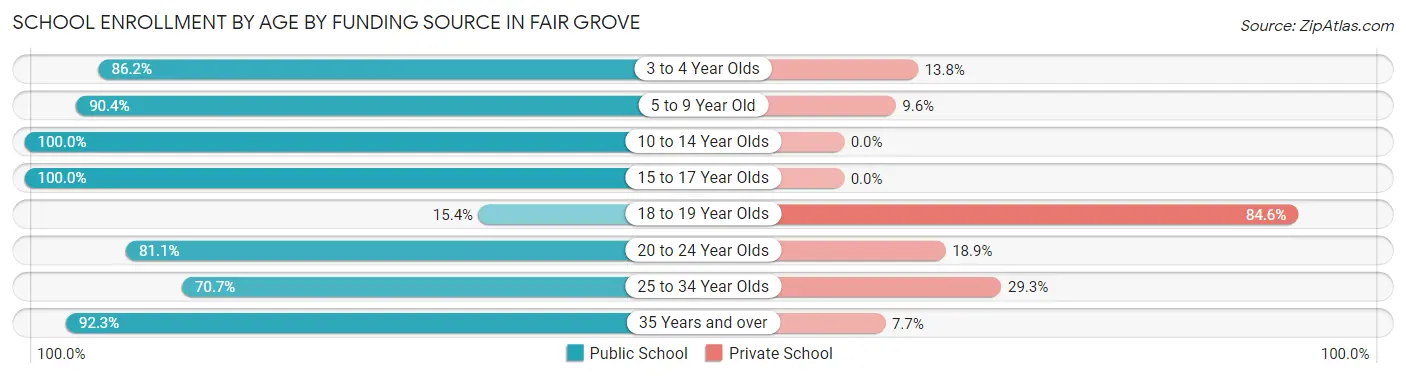
| Age Bracket | Public School | Private School |
| 3 to 4 Year Olds | 25 (86.2%) | 4 (13.8%) |
| 5 to 9 Year Old | 94 (90.4%) | 10 (9.6%) |
| 10 to 14 Year Olds | 137 (100.0%) | 0 (0.0%) |
| 15 to 17 Year Olds | 62 (100.0%) | 0 (0.0%) |
| 18 to 19 Year Olds | 2 (15.4%) | 11 (84.6%) |
| 20 to 24 Year Olds | 30 (81.1%) | 7 (18.9%) |
| 25 to 34 Year Olds | 41 (70.7%) | 17 (29.3%) |
| 35 Years and over | 36 (92.3%) | 3 (7.7%) |
| Total | 427 (89.1%) | 52 (10.9%) |
Educational Attainment by Field of Study in Fair Grove
Business (80 | 31.2%), education (43 | 16.8%), science & technology (25 | 9.8%), arts & humanities (21 | 8.2%), and bio, nature & agricultural (20 | 7.8%) are the most common fields of study among 256 individuals in Fair Grove who have obtained a bachelor's degree or higher.
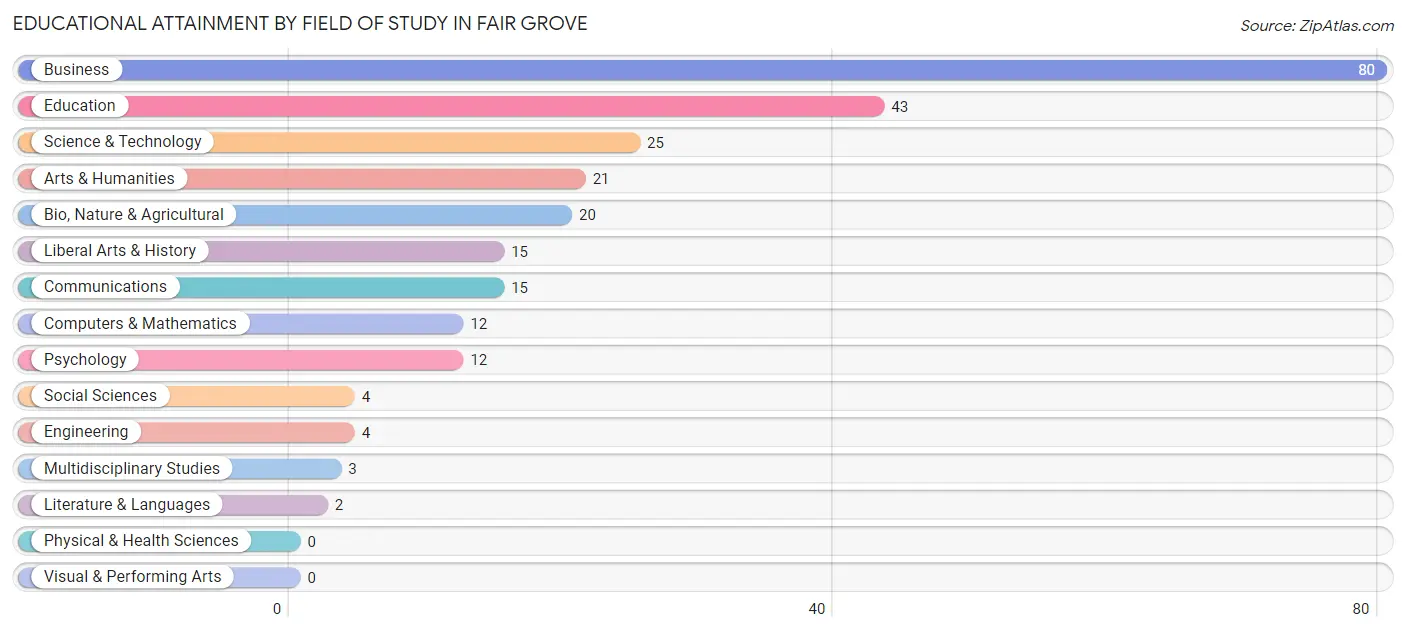
| Field of Study | # Graduates | % Graduates |
| Computers & Mathematics | 12 | 4.7% |
| Bio, Nature & Agricultural | 20 | 7.8% |
| Physical & Health Sciences | 0 | 0.0% |
| Psychology | 12 | 4.7% |
| Social Sciences | 4 | 1.6% |
| Engineering | 4 | 1.6% |
| Multidisciplinary Studies | 3 | 1.2% |
| Science & Technology | 25 | 9.8% |
| Business | 80 | 31.2% |
| Education | 43 | 16.8% |
| Literature & Languages | 2 | 0.8% |
| Liberal Arts & History | 15 | 5.9% |
| Visual & Performing Arts | 0 | 0.0% |
| Communications | 15 | 5.9% |
| Arts & Humanities | 21 | 8.2% |
| Total | 256 | 100.0% |
Transportation & Commute in Fair Grove
Vehicle Availability by Sex in Fair Grove
The most prevalent vehicle ownership categories in Fair Grove are males with 2 vehicles (259, accounting for 59.0%) and females with 2 vehicles (188, making up 64.6%).
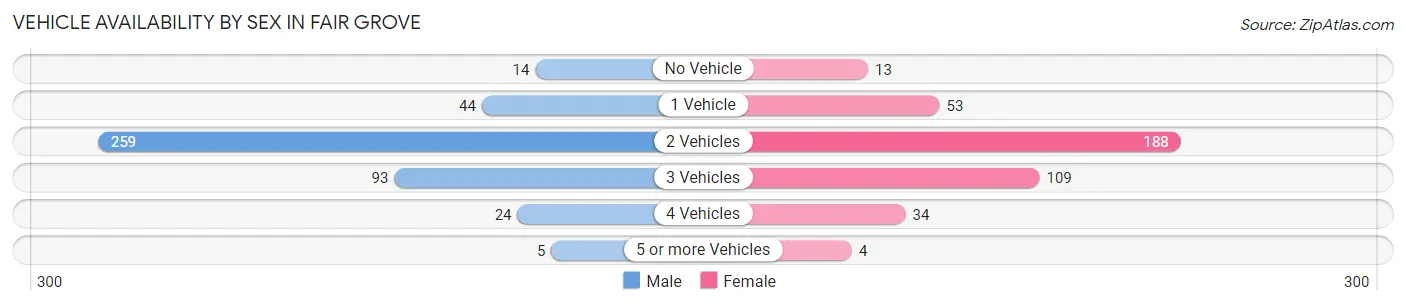
| Vehicles Available | Male | Female |
| No Vehicle | 14 (3.2%) | 13 (3.2%) |
| 1 Vehicle | 44 (10.0%) | 53 (13.2%) |
| 2 Vehicles | 259 (59.0%) | 188 (46.9%) |
| 3 Vehicles | 93 (21.2%) | 109 (27.2%) |
| 4 Vehicles | 24 (5.5%) | 34 (8.5%) |
| 5 or more Vehicles | 5 (1.1%) | 4 (1.0%) |
| Total | 439 (100.0%) | 401 (100.0%) |
Commute Time in Fair Grove
The most frequently occuring commute durations in Fair Grove are 20 to 24 minutes (216 commuters, 29.7%), 30 to 34 minutes (167 commuters, 23.0%), and 25 to 29 minutes (76 commuters, 10.4%).
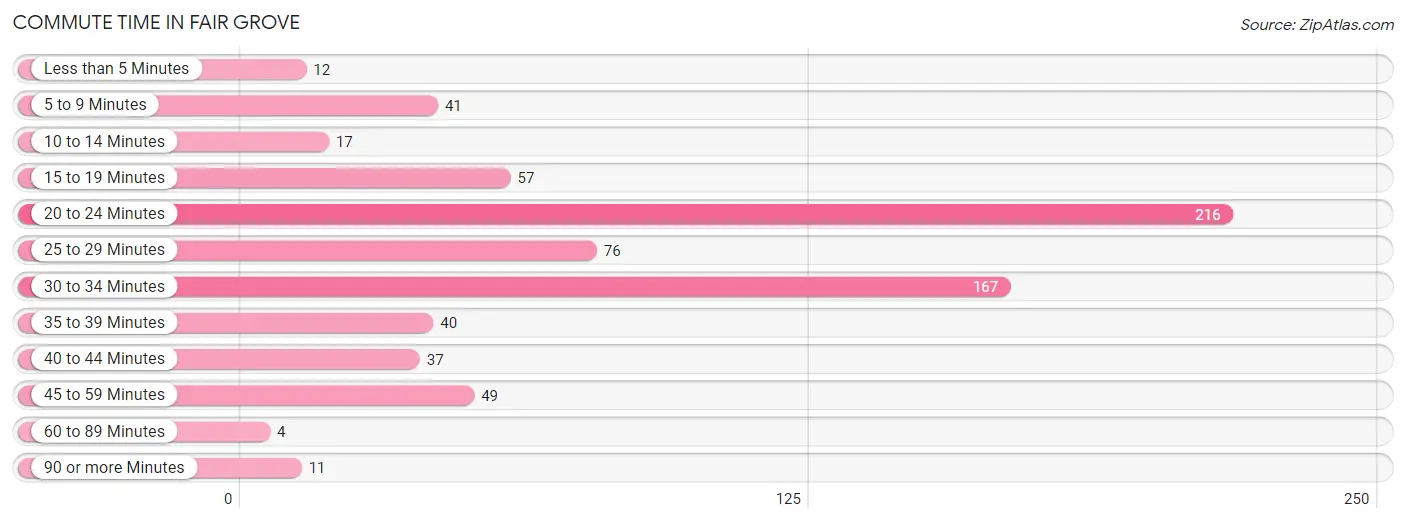
| Commute Time | # Commuters | % Commuters |
| Less than 5 Minutes | 12 | 1.7% |
| 5 to 9 Minutes | 41 | 5.6% |
| 10 to 14 Minutes | 17 | 2.3% |
| 15 to 19 Minutes | 57 | 7.8% |
| 20 to 24 Minutes | 216 | 29.7% |
| 25 to 29 Minutes | 76 | 10.4% |
| 30 to 34 Minutes | 167 | 23.0% |
| 35 to 39 Minutes | 40 | 5.5% |
| 40 to 44 Minutes | 37 | 5.1% |
| 45 to 59 Minutes | 49 | 6.7% |
| 60 to 89 Minutes | 4 | 0.5% |
| 90 or more Minutes | 11 | 1.5% |
Commute Time by Sex in Fair Grove
The most common commute times in Fair Grove are 20 to 24 minutes (119 commuters, 30.5%) for males and 20 to 24 minutes (97 commuters, 28.8%) for females.
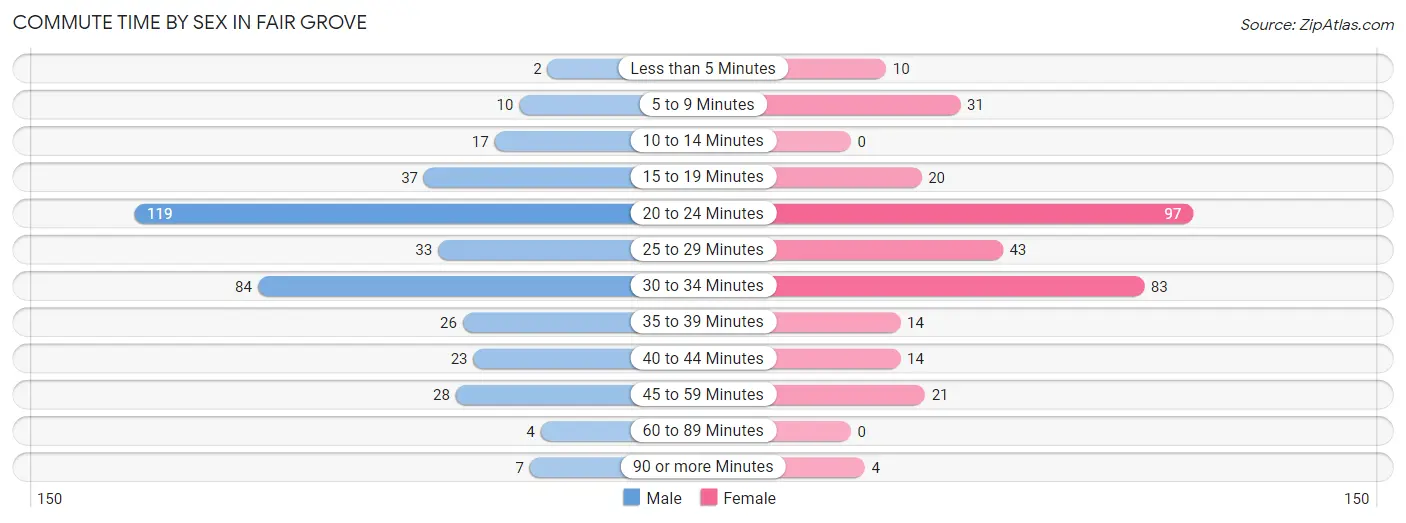
| Commute Time | Male | Female |
| Less than 5 Minutes | 2 (0.5%) | 10 (3.0%) |
| 5 to 9 Minutes | 10 (2.6%) | 31 (9.2%) |
| 10 to 14 Minutes | 17 (4.4%) | 0 (0.0%) |
| 15 to 19 Minutes | 37 (9.5%) | 20 (5.9%) |
| 20 to 24 Minutes | 119 (30.5%) | 97 (28.8%) |
| 25 to 29 Minutes | 33 (8.5%) | 43 (12.8%) |
| 30 to 34 Minutes | 84 (21.5%) | 83 (24.6%) |
| 35 to 39 Minutes | 26 (6.7%) | 14 (4.2%) |
| 40 to 44 Minutes | 23 (5.9%) | 14 (4.2%) |
| 45 to 59 Minutes | 28 (7.2%) | 21 (6.2%) |
| 60 to 89 Minutes | 4 (1.0%) | 0 (0.0%) |
| 90 or more Minutes | 7 (1.8%) | 4 (1.2%) |
Time of Departure to Work by Sex in Fair Grove
The most frequent times of departure to work in Fair Grove are 7:00 AM to 7:29 AM (132, 33.9%) for males and 7:00 AM to 7:29 AM (119, 35.3%) for females.
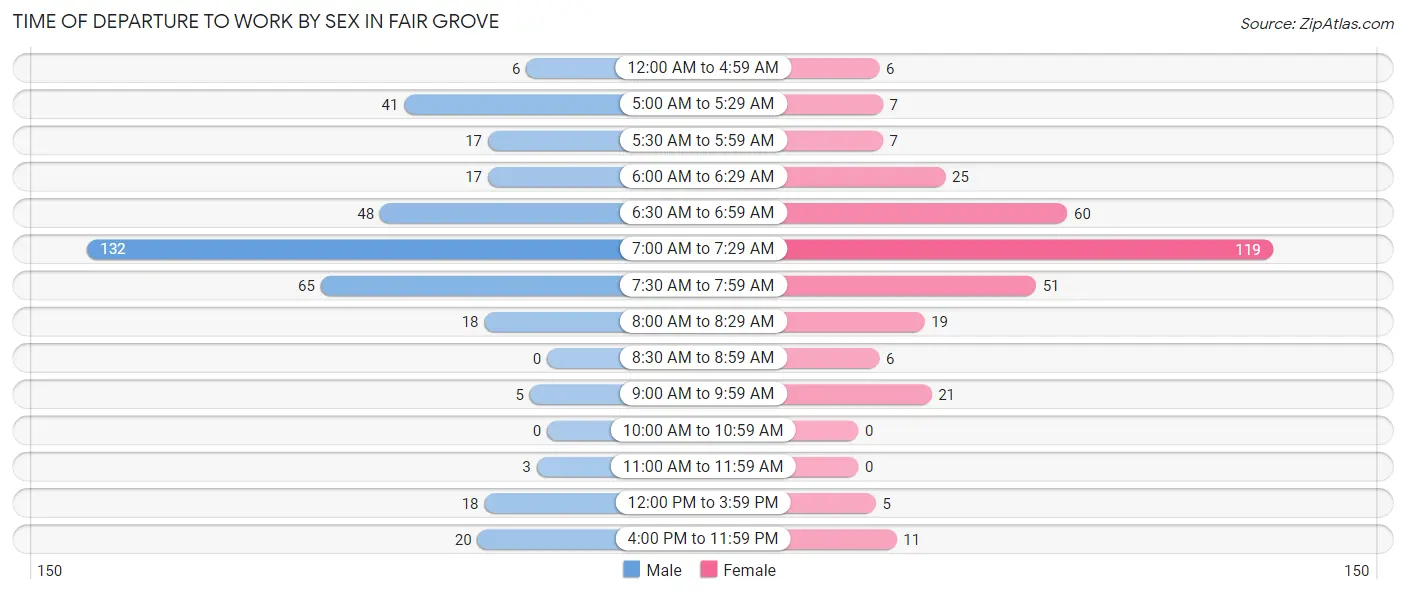
| Time of Departure | Male | Female |
| 12:00 AM to 4:59 AM | 6 (1.5%) | 6 (1.8%) |
| 5:00 AM to 5:29 AM | 41 (10.5%) | 7 (2.1%) |
| 5:30 AM to 5:59 AM | 17 (4.4%) | 7 (2.1%) |
| 6:00 AM to 6:29 AM | 17 (4.4%) | 25 (7.4%) |
| 6:30 AM to 6:59 AM | 48 (12.3%) | 60 (17.8%) |
| 7:00 AM to 7:29 AM | 132 (33.9%) | 119 (35.3%) |
| 7:30 AM to 7:59 AM | 65 (16.7%) | 51 (15.1%) |
| 8:00 AM to 8:29 AM | 18 (4.6%) | 19 (5.6%) |
| 8:30 AM to 8:59 AM | 0 (0.0%) | 6 (1.8%) |
| 9:00 AM to 9:59 AM | 5 (1.3%) | 21 (6.2%) |
| 10:00 AM to 10:59 AM | 0 (0.0%) | 0 (0.0%) |
| 11:00 AM to 11:59 AM | 3 (0.8%) | 0 (0.0%) |
| 12:00 PM to 3:59 PM | 18 (4.6%) | 5 (1.5%) |
| 4:00 PM to 11:59 PM | 20 (5.1%) | 11 (3.3%) |
| Total | 390 (100.0%) | 337 (100.0%) |
Housing Occupancy in Fair Grove
Occupancy by Ownership in Fair Grove
Of the total 586 dwellings in Fair Grove, owner-occupied units account for 430 (73.4%), while renter-occupied units make up 156 (26.6%).
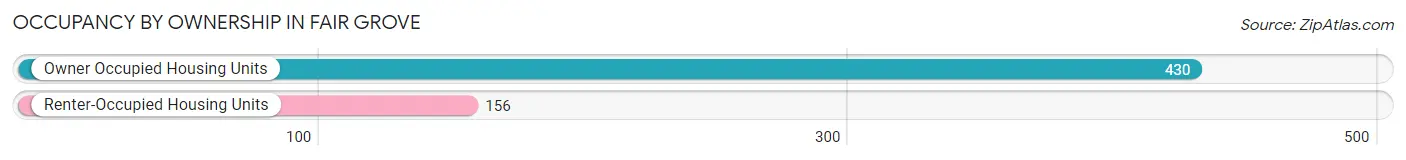
| Occupancy | # Housing Units | % Housing Units |
| Owner Occupied Housing Units | 430 | 73.4% |
| Renter-Occupied Housing Units | 156 | 26.6% |
| Total Occupied Housing Units | 586 | 100.0% |
Occupancy by Household Size in Fair Grove
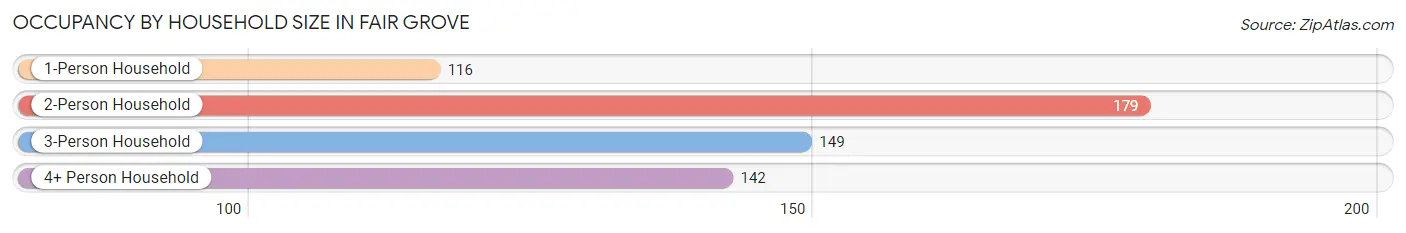
| Household Size | # Housing Units | % Housing Units |
| 1-Person Household | 116 | 19.8% |
| 2-Person Household | 179 | 30.5% |
| 3-Person Household | 149 | 25.4% |
| 4+ Person Household | 142 | 24.2% |
| Total Housing Units | 586 | 100.0% |
Occupancy by Ownership by Household Size in Fair Grove
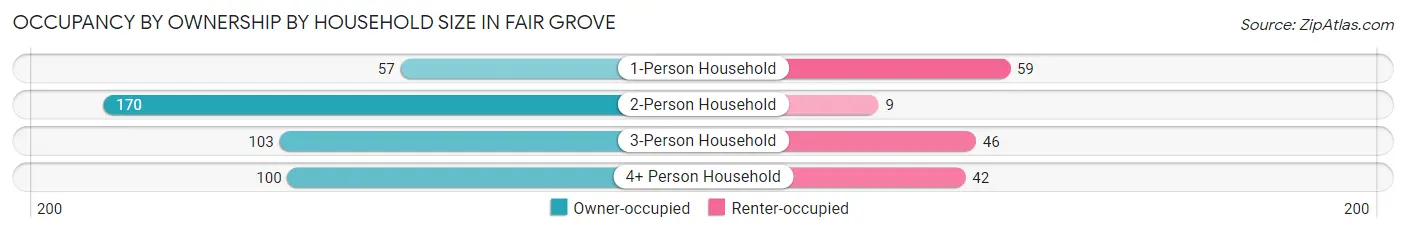
| Household Size | Owner-occupied | Renter-occupied |
| 1-Person Household | 57 (49.1%) | 59 (50.9%) |
| 2-Person Household | 170 (95.0%) | 9 (5.0%) |
| 3-Person Household | 103 (69.1%) | 46 (30.9%) |
| 4+ Person Household | 100 (70.4%) | 42 (29.6%) |
| Total Housing Units | 430 (73.4%) | 156 (26.6%) |
Occupancy by Educational Attainment in Fair Grove
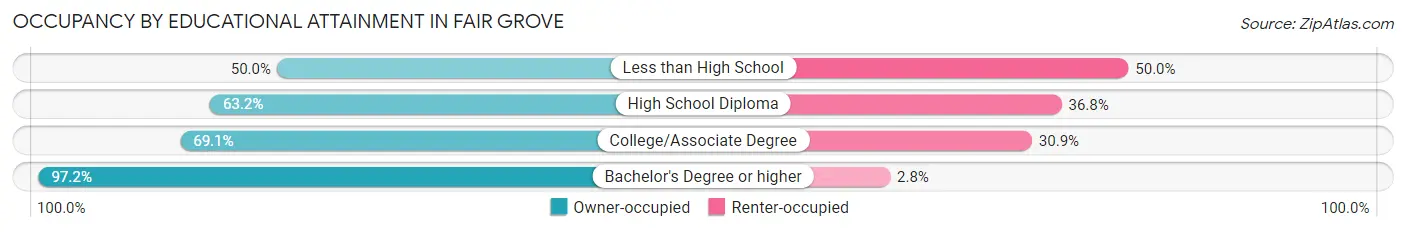
| Household Size | Owner-occupied | Renter-occupied |
| Less than High School | 10 (50.0%) | 10 (50.0%) |
| High School Diploma | 129 (63.2%) | 75 (36.8%) |
| College/Associate Degree | 150 (69.1%) | 67 (30.9%) |
| Bachelor's Degree or higher | 141 (97.2%) | 4 (2.8%) |
Occupancy by Age of Householder in Fair Grove
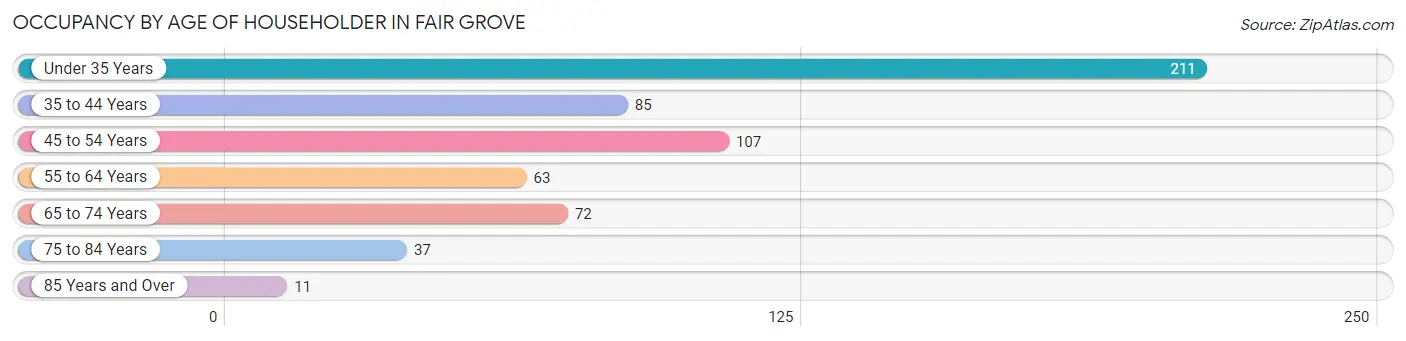
| Age Bracket | # Households | % Households |
| Under 35 Years | 211 | 36.0% |
| 35 to 44 Years | 85 | 14.5% |
| 45 to 54 Years | 107 | 18.3% |
| 55 to 64 Years | 63 | 10.7% |
| 65 to 74 Years | 72 | 12.3% |
| 75 to 84 Years | 37 | 6.3% |
| 85 Years and Over | 11 | 1.9% |
| Total | 586 | 100.0% |
Housing Finances in Fair Grove
Median Income by Occupancy in Fair Grove
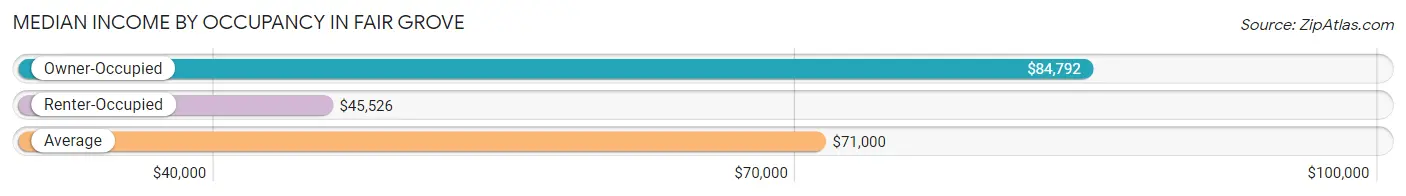
| Occupancy Type | # Households | Median Income |
| Owner-Occupied | 430 (73.4%) | $84,792 |
| Renter-Occupied | 156 (26.6%) | $45,526 |
| Average | 586 (100.0%) | $71,000 |
Occupancy by Householder Income Bracket in Fair Grove
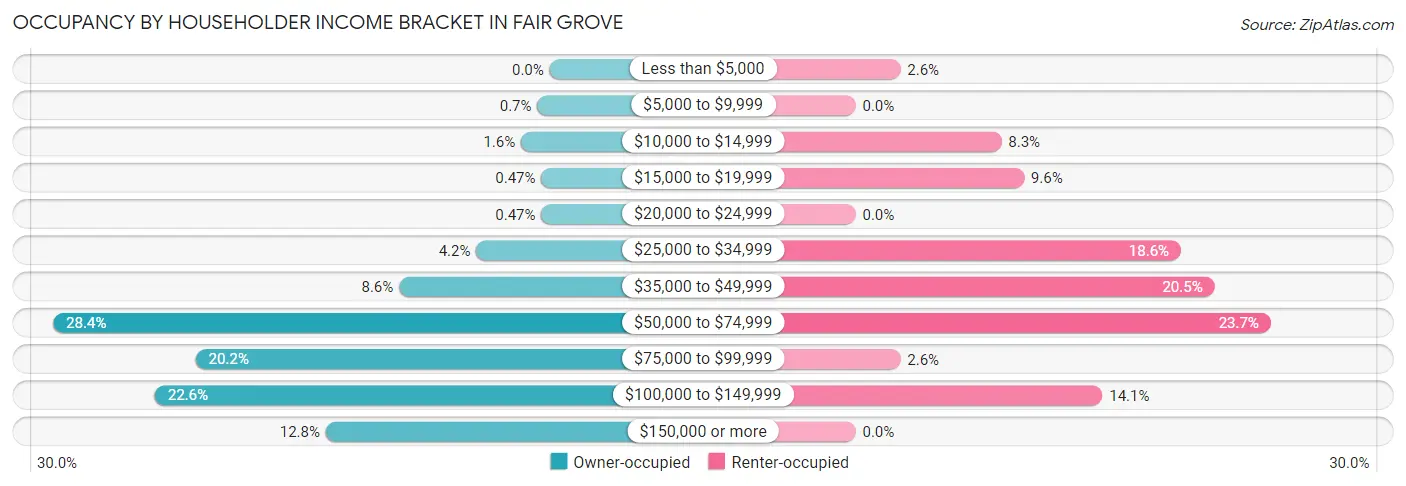
| Income Bracket | Owner-occupied | Renter-occupied |
| Less than $5,000 | 0 (0.0%) | 4 (2.6%) |
| $5,000 to $9,999 | 3 (0.7%) | 0 (0.0%) |
| $10,000 to $14,999 | 7 (1.6%) | 13 (8.3%) |
| $15,000 to $19,999 | 2 (0.5%) | 15 (9.6%) |
| $20,000 to $24,999 | 2 (0.5%) | 0 (0.0%) |
| $25,000 to $34,999 | 18 (4.2%) | 29 (18.6%) |
| $35,000 to $49,999 | 37 (8.6%) | 32 (20.5%) |
| $50,000 to $74,999 | 122 (28.4%) | 37 (23.7%) |
| $75,000 to $99,999 | 87 (20.2%) | 4 (2.6%) |
| $100,000 to $149,999 | 97 (22.6%) | 22 (14.1%) |
| $150,000 or more | 55 (12.8%) | 0 (0.0%) |
| Total | 430 (100.0%) | 156 (100.0%) |
Monthly Housing Cost Tiers in Fair Grove
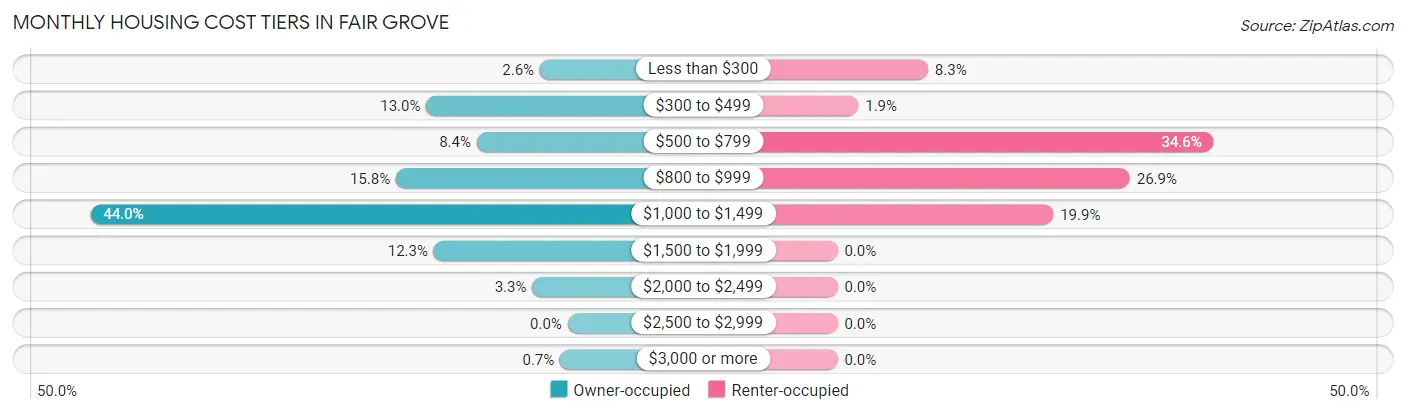
| Monthly Cost | Owner-occupied | Renter-occupied |
| Less than $300 | 11 (2.6%) | 13 (8.3%) |
| $300 to $499 | 56 (13.0%) | 3 (1.9%) |
| $500 to $799 | 36 (8.4%) | 54 (34.6%) |
| $800 to $999 | 68 (15.8%) | 42 (26.9%) |
| $1,000 to $1,499 | 189 (44.0%) | 31 (19.9%) |
| $1,500 to $1,999 | 53 (12.3%) | 0 (0.0%) |
| $2,000 to $2,499 | 14 (3.3%) | 0 (0.0%) |
| $2,500 to $2,999 | 0 (0.0%) | 0 (0.0%) |
| $3,000 or more | 3 (0.7%) | 0 (0.0%) |
| Total | 430 (100.0%) | 156 (100.0%) |
Physical Housing Characteristics in Fair Grove
Housing Structures in Fair Grove
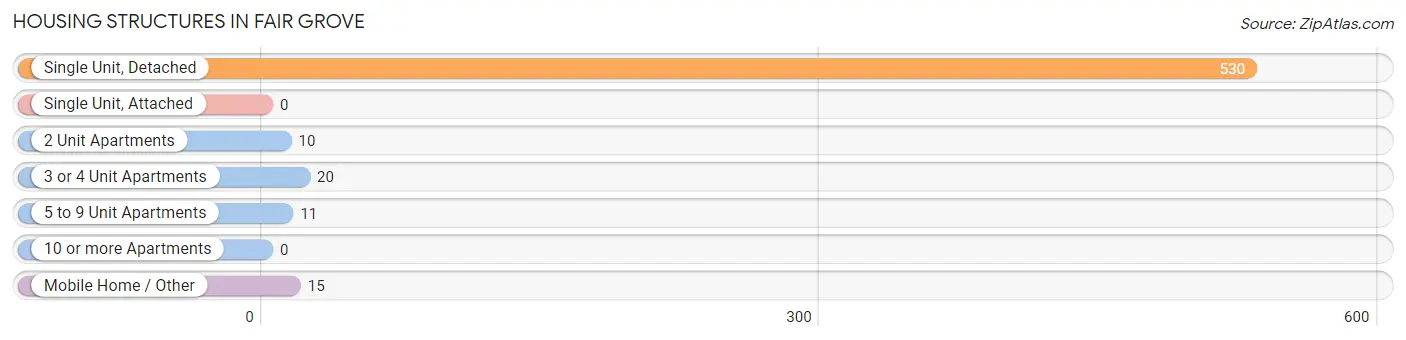
| Structure Type | # Housing Units | % Housing Units |
| Single Unit, Detached | 530 | 90.4% |
| Single Unit, Attached | 0 | 0.0% |
| 2 Unit Apartments | 10 | 1.7% |
| 3 or 4 Unit Apartments | 20 | 3.4% |
| 5 to 9 Unit Apartments | 11 | 1.9% |
| 10 or more Apartments | 0 | 0.0% |
| Mobile Home / Other | 15 | 2.6% |
| Total | 586 | 100.0% |
Housing Structures by Occupancy in Fair Grove
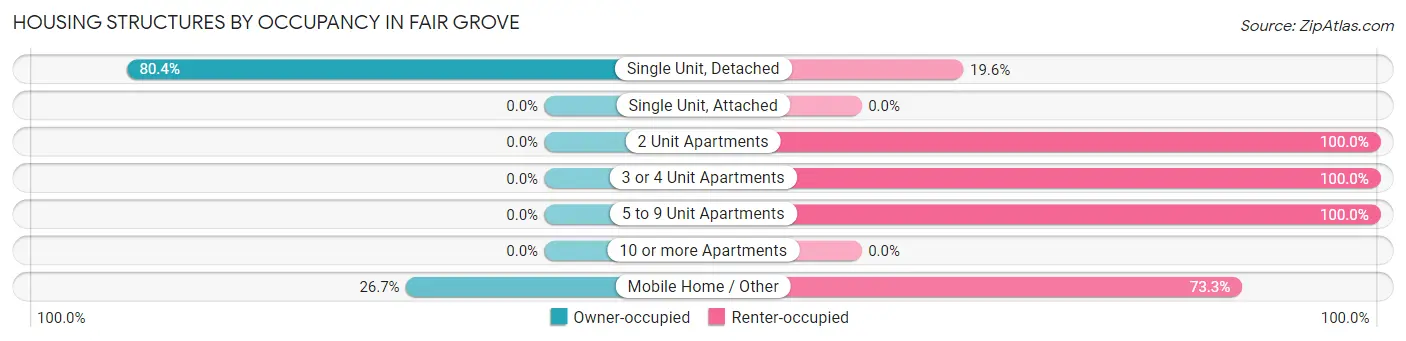
| Structure Type | Owner-occupied | Renter-occupied |
| Single Unit, Detached | 426 (80.4%) | 104 (19.6%) |
| Single Unit, Attached | 0 (0.0%) | 0 (0.0%) |
| 2 Unit Apartments | 0 (0.0%) | 10 (100.0%) |
| 3 or 4 Unit Apartments | 0 (0.0%) | 20 (100.0%) |
| 5 to 9 Unit Apartments | 0 (0.0%) | 11 (100.0%) |
| 10 or more Apartments | 0 (0.0%) | 0 (0.0%) |
| Mobile Home / Other | 4 (26.7%) | 11 (73.3%) |
| Total | 430 (73.4%) | 156 (26.6%) |
Housing Structures by Number of Rooms in Fair Grove
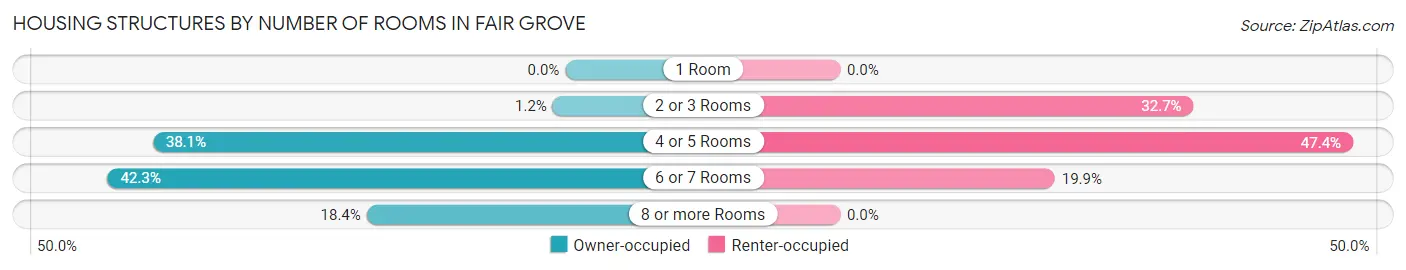
| Number of Rooms | Owner-occupied | Renter-occupied |
| 1 Room | 0 (0.0%) | 0 (0.0%) |
| 2 or 3 Rooms | 5 (1.2%) | 51 (32.7%) |
| 4 or 5 Rooms | 164 (38.1%) | 74 (47.4%) |
| 6 or 7 Rooms | 182 (42.3%) | 31 (19.9%) |
| 8 or more Rooms | 79 (18.4%) | 0 (0.0%) |
| Total | 430 (100.0%) | 156 (100.0%) |
Housing Structure by Heating Type in Fair Grove
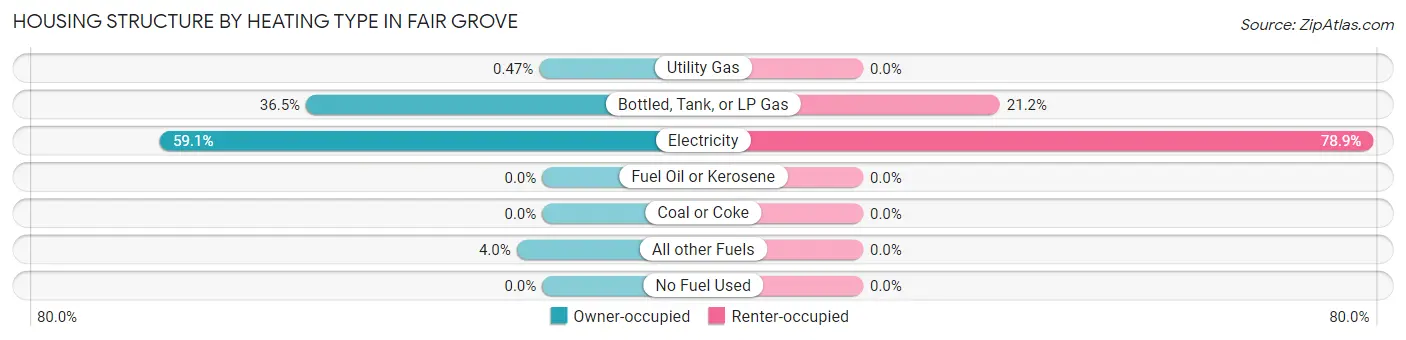
| Heating Type | Owner-occupied | Renter-occupied |
| Utility Gas | 2 (0.5%) | 0 (0.0%) |
| Bottled, Tank, or LP Gas | 157 (36.5%) | 33 (21.1%) |
| Electricity | 254 (59.1%) | 123 (78.8%) |
| Fuel Oil or Kerosene | 0 (0.0%) | 0 (0.0%) |
| Coal or Coke | 0 (0.0%) | 0 (0.0%) |
| All other Fuels | 17 (4.0%) | 0 (0.0%) |
| No Fuel Used | 0 (0.0%) | 0 (0.0%) |
| Total | 430 (100.0%) | 156 (100.0%) |
Household Vehicle Usage in Fair Grove
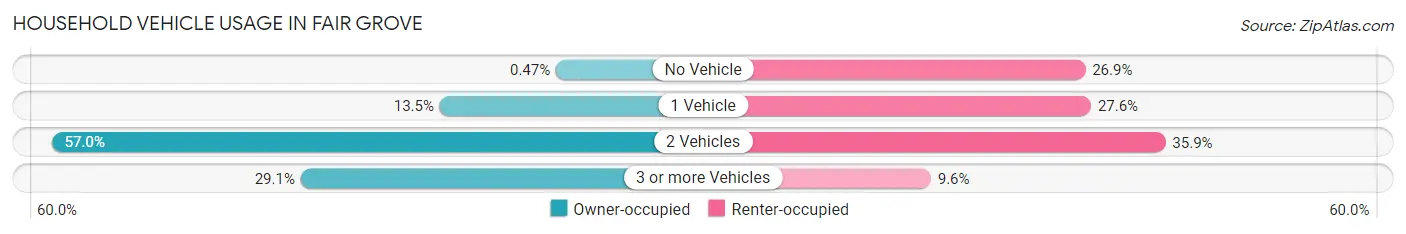
| Vehicles per Household | Owner-occupied | Renter-occupied |
| No Vehicle | 2 (0.5%) | 42 (26.9%) |
| 1 Vehicle | 58 (13.5%) | 43 (27.6%) |
| 2 Vehicles | 245 (57.0%) | 56 (35.9%) |
| 3 or more Vehicles | 125 (29.1%) | 15 (9.6%) |
| Total | 430 (100.0%) | 156 (100.0%) |
Real Estate & Mortgages in Fair Grove
Real Estate and Mortgage Overview in Fair Grove
| Characteristic | Without Mortgage | With Mortgage |
| Housing Units | 117 | 313 |
| Median Property Value | $164,000 | $171,500 |
| Median Household Income | $65,208 | $49 |
| Monthly Housing Costs | $477 | $3 |
| Real Estate Taxes | $1,311 | $9 |
Property Value by Mortgage Status in Fair Grove
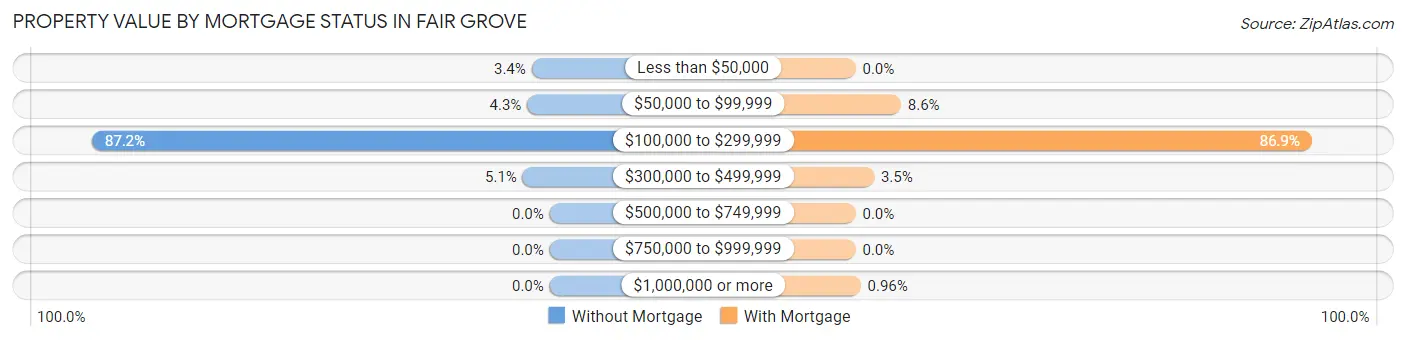
| Property Value | Without Mortgage | With Mortgage |
| Less than $50,000 | 4 (3.4%) | 0 (0.0%) |
| $50,000 to $99,999 | 5 (4.3%) | 27 (8.6%) |
| $100,000 to $299,999 | 102 (87.2%) | 272 (86.9%) |
| $300,000 to $499,999 | 6 (5.1%) | 11 (3.5%) |
| $500,000 to $749,999 | 0 (0.0%) | 0 (0.0%) |
| $750,000 to $999,999 | 0 (0.0%) | 0 (0.0%) |
| $1,000,000 or more | 0 (0.0%) | 3 (1.0%) |
| Total | 117 (100.0%) | 313 (100.0%) |
Household Income by Mortgage Status in Fair Grove
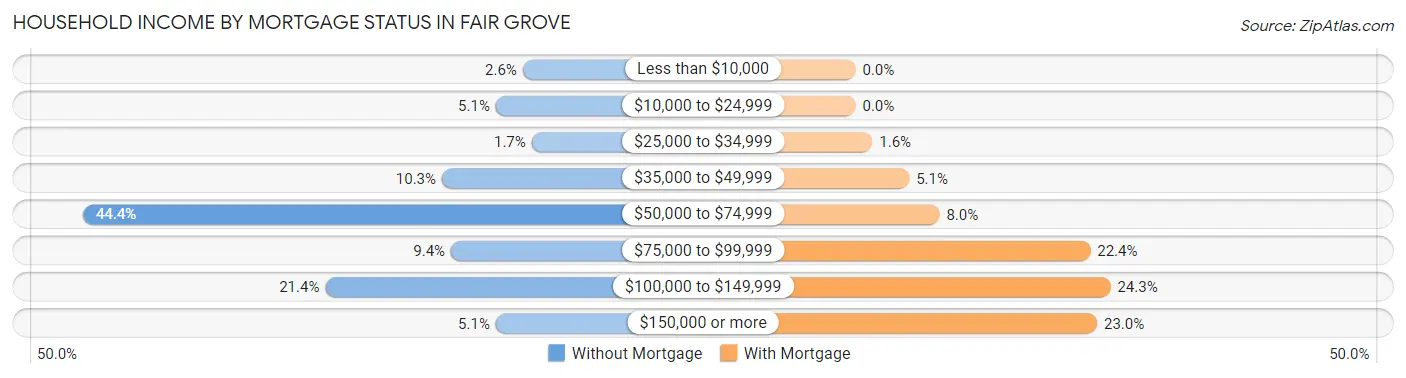
| Household Income | Without Mortgage | With Mortgage |
| Less than $10,000 | 3 (2.6%) | 0 (0.0%) |
| $10,000 to $24,999 | 6 (5.1%) | 0 (0.0%) |
| $25,000 to $34,999 | 2 (1.7%) | 5 (1.6%) |
| $35,000 to $49,999 | 12 (10.3%) | 16 (5.1%) |
| $50,000 to $74,999 | 52 (44.4%) | 25 (8.0%) |
| $75,000 to $99,999 | 11 (9.4%) | 70 (22.4%) |
| $100,000 to $149,999 | 25 (21.4%) | 76 (24.3%) |
| $150,000 or more | 6 (5.1%) | 72 (23.0%) |
| Total | 117 (100.0%) | 313 (100.0%) |
Property Value to Household Income Ratio in Fair Grove
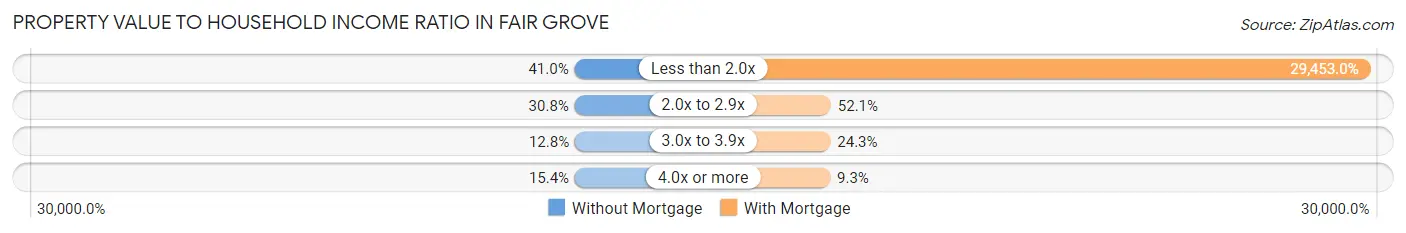
| Value-to-Income Ratio | Without Mortgage | With Mortgage |
| Less than 2.0x | 48 (41.0%) | 92,188 (29,453.0%) |
| 2.0x to 2.9x | 36 (30.8%) | 163 (52.1%) |
| 3.0x to 3.9x | 15 (12.8%) | 76 (24.3%) |
| 4.0x or more | 18 (15.4%) | 29 (9.3%) |
| Total | 117 (100.0%) | 313 (100.0%) |
Real Estate Taxes by Mortgage Status in Fair Grove
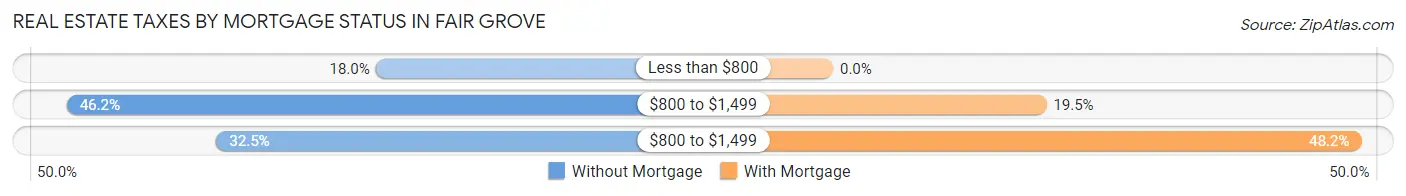
| Property Taxes | Without Mortgage | With Mortgage |
| Less than $800 | 21 (17.9%) | 0 (0.0%) |
| $800 to $1,499 | 54 (46.2%) | 61 (19.5%) |
| $800 to $1,499 | 38 (32.5%) | 151 (48.2%) |
| Total | 117 (100.0%) | 313 (100.0%) |
Health & Disability in Fair Grove
Health Insurance Coverage by Age in Fair Grove
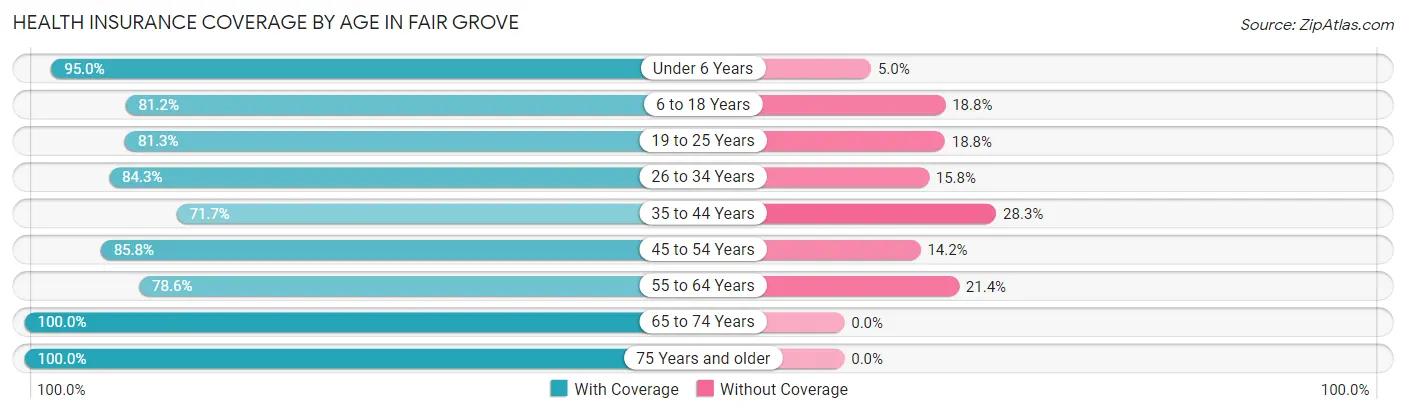
| Age Bracket | With Coverage | Without Coverage |
| Under 6 Years | 191 (95.0%) | 10 (5.0%) |
| 6 to 18 Years | 233 (81.2%) | 54 (18.8%) |
| 19 to 25 Years | 156 (81.2%) | 36 (18.8%) |
| 26 to 34 Years | 230 (84.3%) | 43 (15.8%) |
| 35 to 44 Years | 162 (71.7%) | 64 (28.3%) |
| 45 to 54 Years | 145 (85.8%) | 24 (14.2%) |
| 55 to 64 Years | 92 (78.6%) | 25 (21.4%) |
| 65 to 74 Years | 89 (100.0%) | 0 (0.0%) |
| 75 Years and older | 56 (100.0%) | 0 (0.0%) |
| Total | 1,354 (84.1%) | 256 (15.9%) |
Health Insurance Coverage by Citizenship Status in Fair Grove
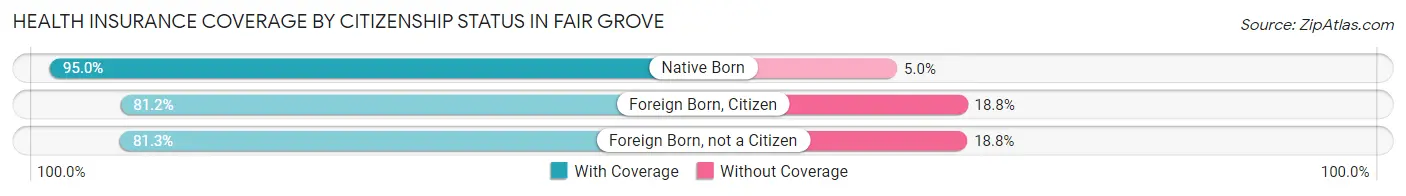
| Citizenship Status | With Coverage | Without Coverage |
| Native Born | 191 (95.0%) | 10 (5.0%) |
| Foreign Born, Citizen | 233 (81.2%) | 54 (18.8%) |
| Foreign Born, not a Citizen | 156 (81.2%) | 36 (18.8%) |
Health Insurance Coverage by Household Income in Fair Grove
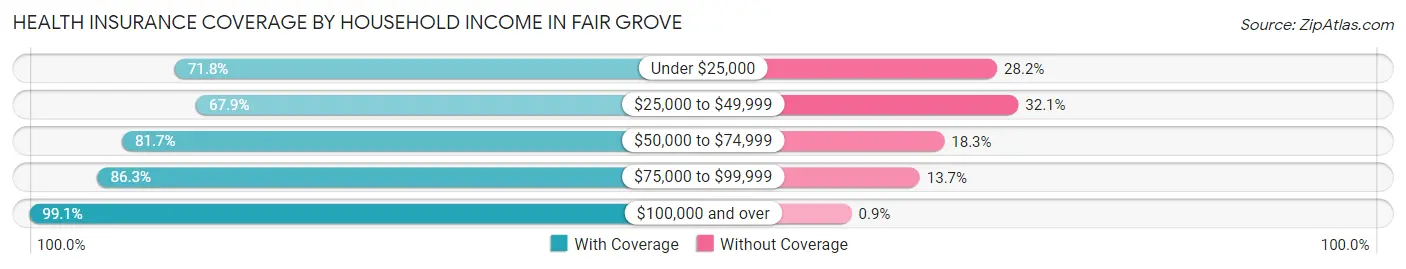
| Household Income | With Coverage | Without Coverage |
| Under $25,000 | 51 (71.8%) | 20 (28.2%) |
| $25,000 to $49,999 | 228 (67.9%) | 108 (32.1%) |
| $50,000 to $74,999 | 362 (81.7%) | 81 (18.3%) |
| $75,000 to $99,999 | 271 (86.3%) | 43 (13.7%) |
| $100,000 and over | 442 (99.1%) | 4 (0.9%) |
Public vs Private Health Insurance Coverage by Age in Fair Grove
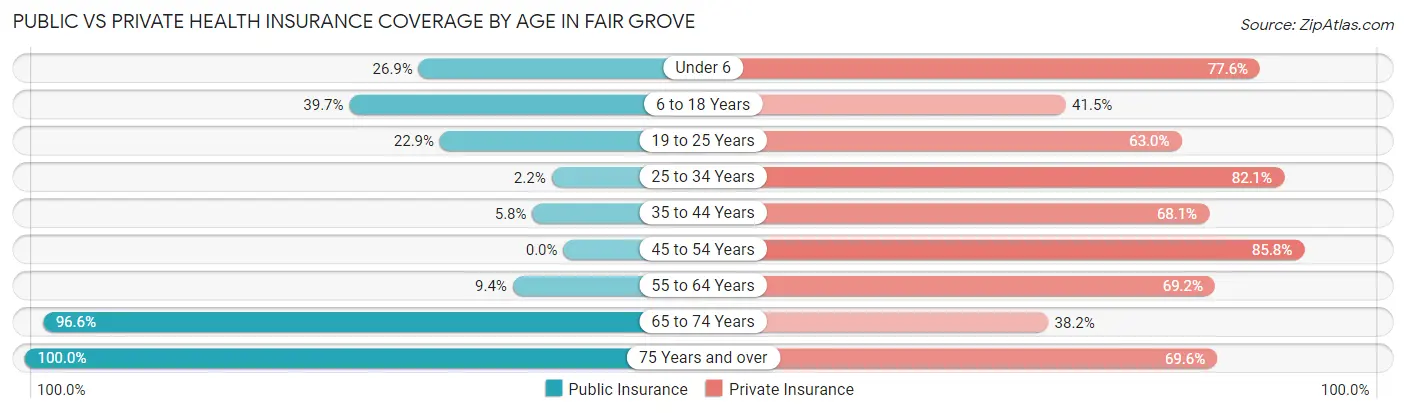
| Age Bracket | Public Insurance | Private Insurance |
| Under 6 | 54 (26.9%) | 156 (77.6%) |
| 6 to 18 Years | 114 (39.7%) | 119 (41.5%) |
| 19 to 25 Years | 44 (22.9%) | 121 (63.0%) |
| 25 to 34 Years | 6 (2.2%) | 224 (82.1%) |
| 35 to 44 Years | 13 (5.8%) | 154 (68.1%) |
| 45 to 54 Years | 0 (0.0%) | 145 (85.8%) |
| 55 to 64 Years | 11 (9.4%) | 81 (69.2%) |
| 65 to 74 Years | 86 (96.6%) | 34 (38.2%) |
| 75 Years and over | 56 (100.0%) | 39 (69.6%) |
| Total | 384 (23.8%) | 1,073 (66.6%) |
Disability Status by Sex by Age in Fair Grove
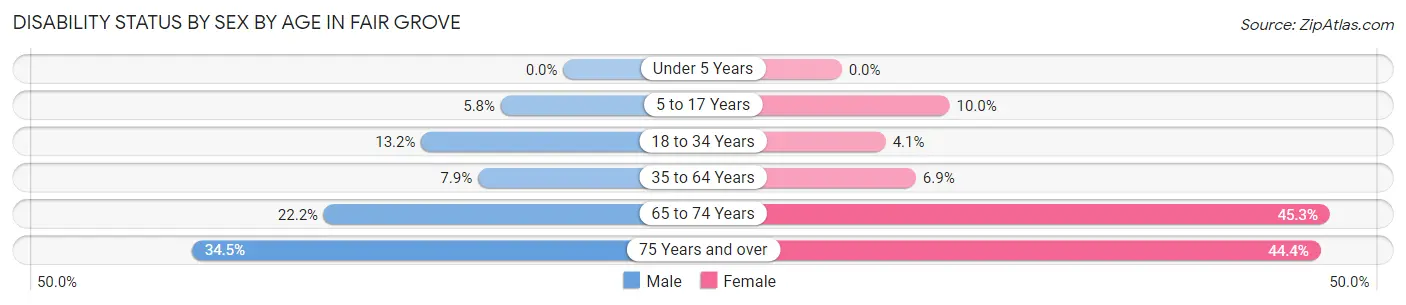
| Age Bracket | Male | Female |
| Under 5 Years | 0 (0.0%) | 0 (0.0%) |
| 5 to 17 Years | 8 (5.8%) | 17 (10.0%) |
| 18 to 34 Years | 29 (13.2%) | 10 (4.1%) |
| 35 to 64 Years | 21 (7.9%) | 17 (6.9%) |
| 65 to 74 Years | 8 (22.2%) | 24 (45.3%) |
| 75 Years and over | 10 (34.5%) | 12 (44.4%) |
Disability Class by Sex by Age in Fair Grove
Disability Class: Hearing Difficulty
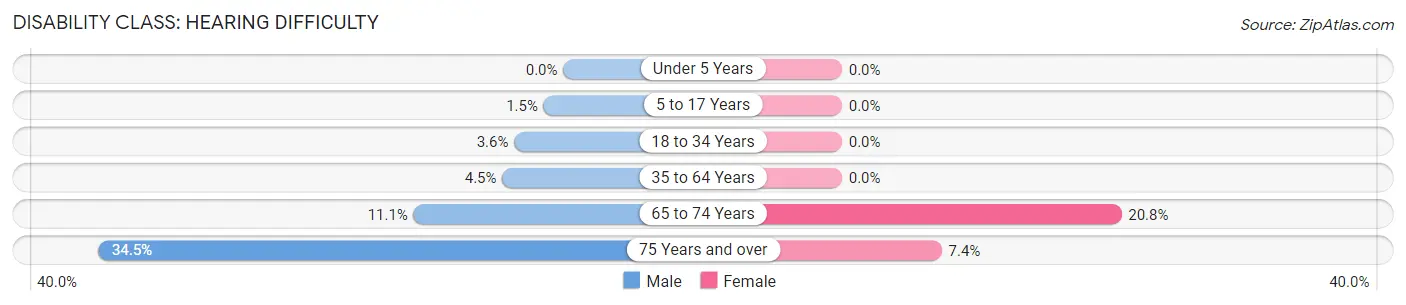
| Age Bracket | Male | Female |
| Under 5 Years | 0 (0.0%) | 0 (0.0%) |
| 5 to 17 Years | 2 (1.5%) | 0 (0.0%) |
| 18 to 34 Years | 8 (3.6%) | 0 (0.0%) |
| 35 to 64 Years | 12 (4.5%) | 0 (0.0%) |
| 65 to 74 Years | 4 (11.1%) | 11 (20.7%) |
| 75 Years and over | 10 (34.5%) | 2 (7.4%) |
Disability Class: Vision Difficulty
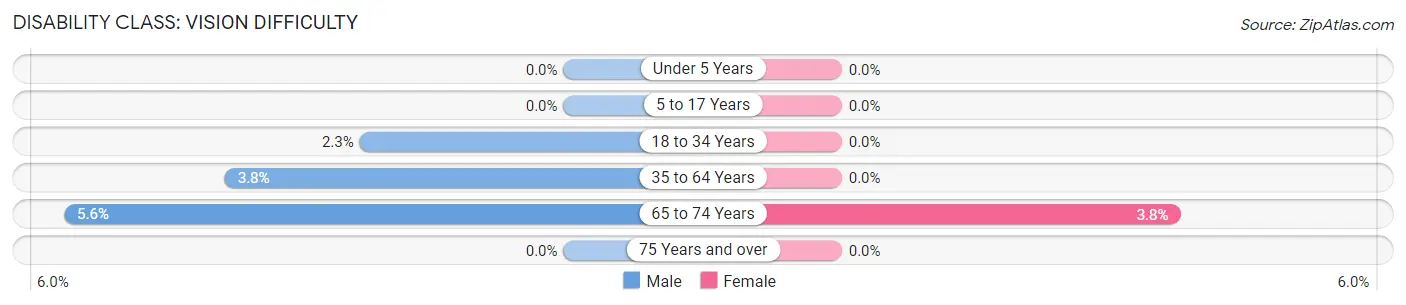
| Age Bracket | Male | Female |
| Under 5 Years | 0 (0.0%) | 0 (0.0%) |
| 5 to 17 Years | 0 (0.0%) | 0 (0.0%) |
| 18 to 34 Years | 5 (2.3%) | 0 (0.0%) |
| 35 to 64 Years | 10 (3.8%) | 0 (0.0%) |
| 65 to 74 Years | 2 (5.6%) | 2 (3.8%) |
| 75 Years and over | 0 (0.0%) | 0 (0.0%) |
Disability Class: Cognitive Difficulty
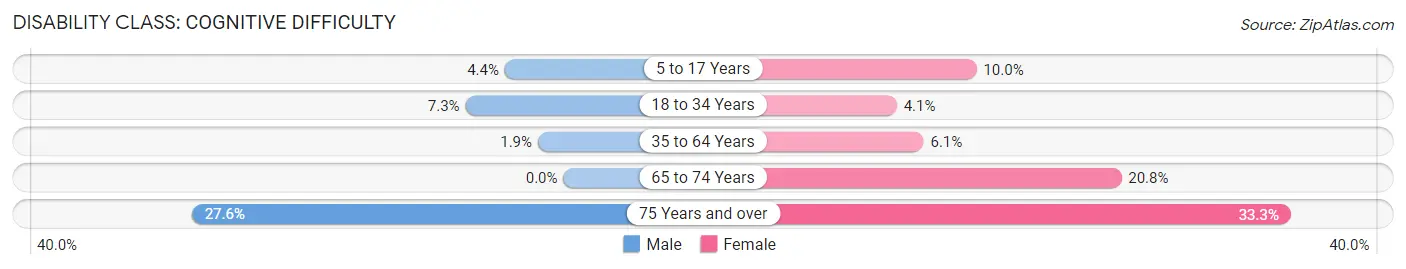
| Age Bracket | Male | Female |
| 5 to 17 Years | 6 (4.3%) | 17 (10.0%) |
| 18 to 34 Years | 16 (7.3%) | 10 (4.1%) |
| 35 to 64 Years | 5 (1.9%) | 15 (6.1%) |
| 65 to 74 Years | 0 (0.0%) | 11 (20.7%) |
| 75 Years and over | 8 (27.6%) | 9 (33.3%) |
Disability Class: Ambulatory Difficulty
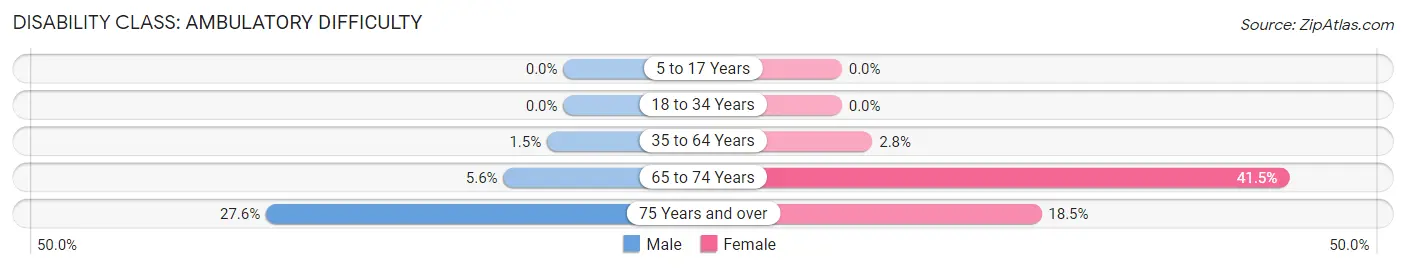
| Age Bracket | Male | Female |
| 5 to 17 Years | 0 (0.0%) | 0 (0.0%) |
| 18 to 34 Years | 0 (0.0%) | 0 (0.0%) |
| 35 to 64 Years | 4 (1.5%) | 7 (2.8%) |
| 65 to 74 Years | 2 (5.6%) | 22 (41.5%) |
| 75 Years and over | 8 (27.6%) | 5 (18.5%) |
Disability Class: Self-Care Difficulty
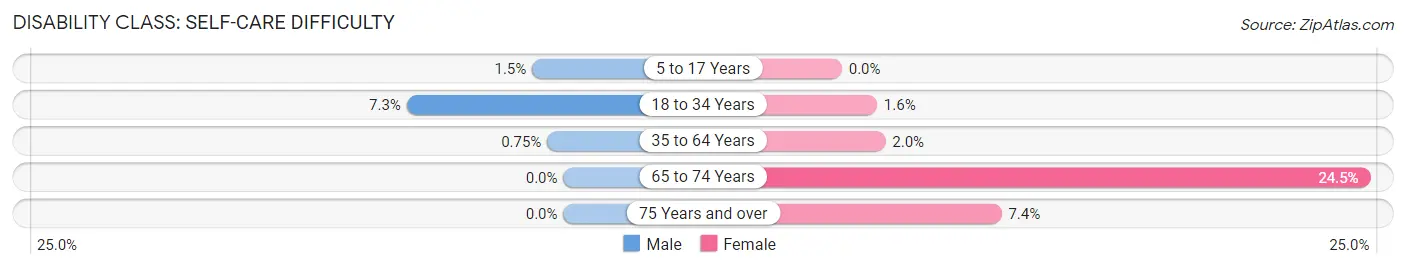
| Age Bracket | Male | Female |
| 5 to 17 Years | 2 (1.5%) | 0 (0.0%) |
| 18 to 34 Years | 16 (7.3%) | 4 (1.6%) |
| 35 to 64 Years | 2 (0.7%) | 5 (2.0%) |
| 65 to 74 Years | 0 (0.0%) | 13 (24.5%) |
| 75 Years and over | 0 (0.0%) | 2 (7.4%) |
Technology Access in Fair Grove
Computing Device Access in Fair Grove
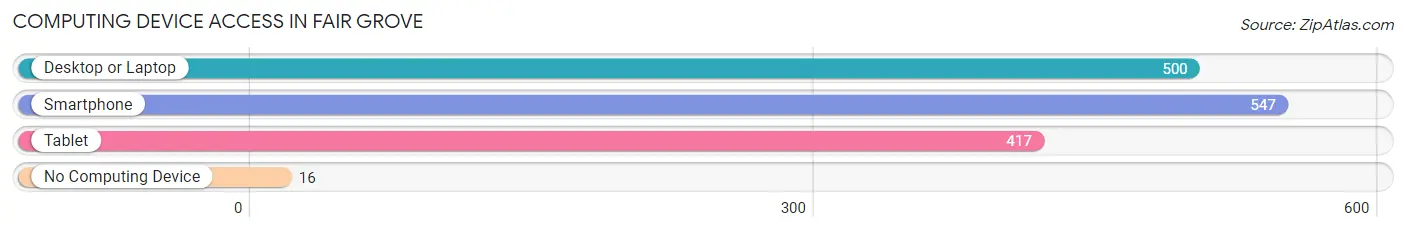
| Device Type | # Households | % Households |
| Desktop or Laptop | 500 | 85.3% |
| Smartphone | 547 | 93.3% |
| Tablet | 417 | 71.2% |
| No Computing Device | 16 | 2.7% |
| Total | 586 | 100.0% |
Internet Access in Fair Grove
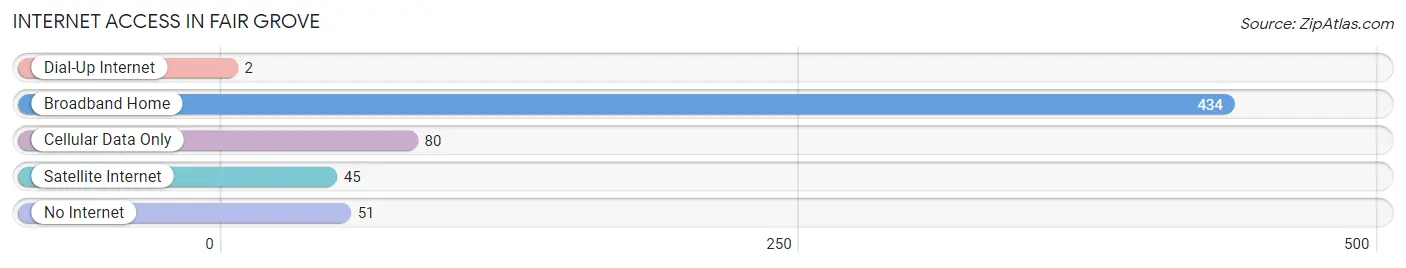
| Internet Type | # Households | % Households |
| Dial-Up Internet | 2 | 0.3% |
| Broadband Home | 434 | 74.1% |
| Cellular Data Only | 80 | 13.7% |
| Satellite Internet | 45 | 7.7% |
| No Internet | 51 | 8.7% |
| Total | 586 | 100.0% |
Fair Grove Summary
History
Fair Grove, Missouri is a small town located in Greene County, Missouri. It is situated about 20 miles northeast of Springfield, the county seat. The town was founded in 1856 by a group of settlers from Tennessee, led by William and Mary Fair. The town was named after the Fair family, and the first post office was established in 1858.
The town grew slowly but steadily over the years, and by the early 1900s, it had become a thriving agricultural community. The town was home to several churches, a school, a bank, a hotel, and a variety of businesses. The town also had a railroad station, which connected it to the larger cities of Springfield and St. Louis.
In the early 1900s, Fair Grove was a popular destination for tourists, who came to enjoy the town’s natural beauty and the nearby lakes. The town was also known for its annual fair, which was held in the summer and featured a variety of activities, including horse racing, carnival rides, and a variety of other attractions.
In the 1950s, the town began to decline as the railroad station closed and the population began to move away. The town’s economy suffered, and many of the businesses closed. However, in the late 1970s, the town began to experience a resurgence as new businesses opened and the population began to grow again.
Today, Fair Grove is a small but vibrant community. It is home to a variety of businesses, including a grocery store, a hardware store, a bank, and several restaurants. The town also has a post office, a library, and a museum. The town is also home to a variety of recreational activities, including fishing, camping, and hiking.
Geography
Fair Grove is located in Greene County, Missouri, about 20 miles northeast of Springfield. The town is situated in the Ozark Mountains, and is surrounded by rolling hills and forests. The town is located on the banks of the James River, which flows through the town and provides a variety of recreational activities.
The town has a total area of 1.3 square miles, all of which is land. The town has a humid subtropical climate, with hot, humid summers and mild winters. The average temperature in the summer is around 80 degrees Fahrenheit, and the average temperature in the winter is around 40 degrees Fahrenheit.
Economy
The economy of Fair Grove is largely based on agriculture and tourism. The town is home to several farms, which produce a variety of crops, including corn, soybeans, and wheat. The town is also home to several wineries, which produce a variety of wines.
The town is also home to a variety of businesses, including a grocery store, a hardware store, a bank, and several restaurants. The town is also home to a variety of recreational activities, including fishing, camping, and hiking.
Demographics
As of the 2010 census, the population of Fair Grove was 1,845. The town has a population density of 1,400 people per square mile. The median age of the population is 42.7 years, and the median household income is $45,000. The town is predominantly white, with 92.3% of the population identifying as white. The town also has a small Hispanic population, with 4.3% of the population identifying as Hispanic or Latino.
Common Questions
What is Per Capita Income in Fair Grove?
Per Capita income in Fair Grove is $34,433.
What is the Median Family Income in Fair Grove?
Median Family Income in Fair Grove is $82,500.
What is the Median Household income in Fair Grove?
Median Household Income in Fair Grove is $71,000.
What is Income or Wage Gap in Fair Grove?
Income or Wage Gap in Fair Grove is 31.5%.
Women in Fair Grove earn 68.5 cents for every dollar earned by a man.
What is Inequality or Gini Index in Fair Grove?
Inequality or Gini Index in Fair Grove is 0.42.
What is the Total Population of Fair Grove?
Total Population of Fair Grove is 1,625.
What is the Total Male Population of Fair Grove?
Total Male Population of Fair Grove is 789.
What is the Total Female Population of Fair Grove?
Total Female Population of Fair Grove is 836.
What is the Ratio of Males per 100 Females in Fair Grove?
There are 94.38 Males per 100 Females in Fair Grove.
What is the Ratio of Females per 100 Males in Fair Grove?
There are 105.96 Females per 100 Males in Fair Grove.
What is the Median Population Age in Fair Grove?
Median Population Age in Fair Grove is 28.5 Years.
What is the Average Family Size in Fair Grove
Average Family Size in Fair Grove is 3.2 People.
What is the Average Household Size in Fair Grove
Average Household Size in Fair Grove is 2.8 People.
How Large is the Labor Force in Fair Grove?
There are 907 People in the Labor Forcein in Fair Grove.
What is the Percentage of People in the Labor Force in Fair Grove?
77.0% of People are in the Labor Force in Fair Grove.
What is the Unemployment Rate in Fair Grove?
Unemployment Rate in Fair Grove is 4.8%.