Excelsior Springs, MO Map & Demographics
Excelsior Springs Map
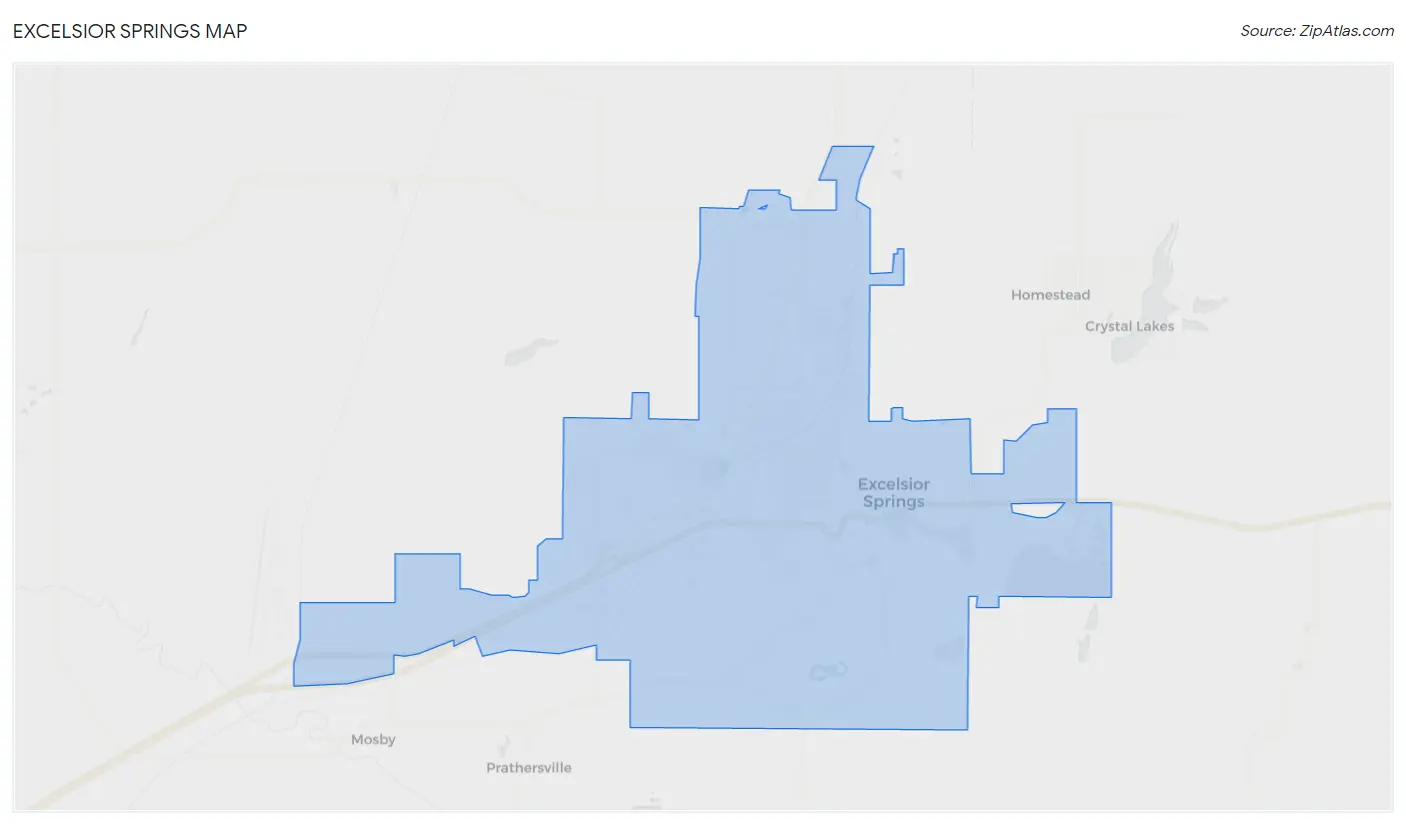
Excelsior Springs Overview
$30,682
PER CAPITA INCOME
$87,852
AVG FAMILY INCOME
$74,196
AVG HOUSEHOLD INCOME
27.1%
WAGE / INCOME GAP [ % ]
72.9¢/ $1
WAGE / INCOME GAP [ $ ]
$10,429
FAMILY INCOME DEFICIT
0.38
INEQUALITY / GINI INDEX
10,546
TOTAL POPULATION
5,036
MALE POPULATION
5,510
FEMALE POPULATION
91.40
MALES / 100 FEMALES
109.41
FEMALES / 100 MALES
35.2
MEDIAN AGE
3.1
AVG FAMILY SIZE
2.6
AVG HOUSEHOLD SIZE
5,478
LABOR FORCE [ PEOPLE ]
64.2%
PERCENT IN LABOR FORCE
4.0%
UNEMPLOYMENT RATE
Excelsior Springs Zip Codes
Excelsior Springs Area Codes
Income in Excelsior Springs
Income Overview in Excelsior Springs
Per Capita Income in Excelsior Springs is $30,682, while median incomes of families and households are $87,852 and $74,196 respectively.
| Characteristic | Number | Measure |
| Per Capita Income | 10,546 | $30,682 |
| Median Family Income | 2,645 | $87,852 |
| Mean Family Income | 2,645 | $93,547 |
| Median Household Income | 3,853 | $74,196 |
| Mean Household Income | 3,853 | $80,702 |
| Income Deficit | 2,645 | $10,429 |
| Wage / Income Gap (%) | 10,546 | 27.09% |
| Wage / Income Gap ($) | 10,546 | 72.91¢ per $1 |
| Gini / Inequality Index | 10,546 | 0.38 |
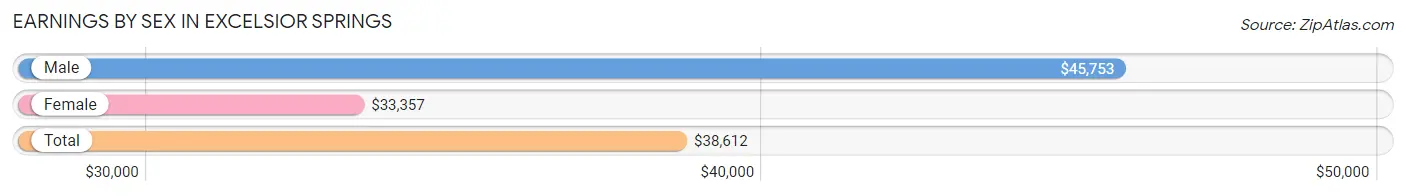
Earnings by Sex in Excelsior Springs
Average Earnings in Excelsior Springs are $38,612, $45,753 for men and $33,357 for women, a difference of 27.1%.
| Sex | Number | Average Earnings |
| Male | 3,040 (53.6%) | $45,753 |
| Female | 2,629 (46.4%) | $33,357 |
| Total | 5,669 (100.0%) | $38,612 |
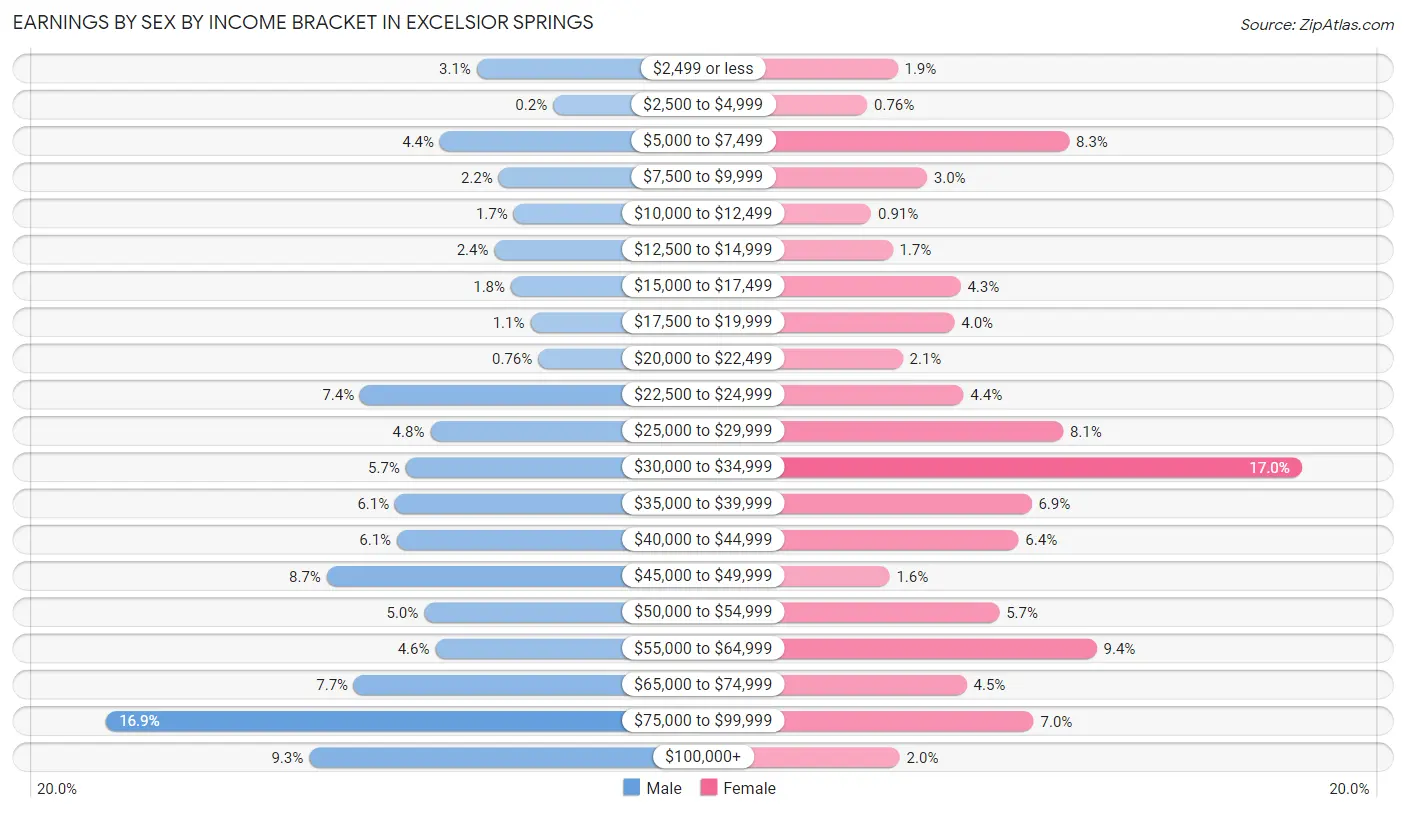
Earnings by Sex by Income Bracket in Excelsior Springs
The most common earnings brackets in Excelsior Springs are $75,000 to $99,999 for men (515 | 16.9%) and $30,000 to $34,999 for women (448 | 17.0%).
| Income | Male | Female |
| $2,499 or less | 93 (3.1%) | 50 (1.9%) |
| $2,500 to $4,999 | 6 (0.2%) | 20 (0.8%) |
| $5,000 to $7,499 | 135 (4.4%) | 219 (8.3%) |
| $7,500 to $9,999 | 68 (2.2%) | 79 (3.0%) |
| $10,000 to $12,499 | 51 (1.7%) | 24 (0.9%) |
| $12,500 to $14,999 | 73 (2.4%) | 45 (1.7%) |
| $15,000 to $17,499 | 54 (1.8%) | 112 (4.3%) |
| $17,500 to $19,999 | 32 (1.1%) | 106 (4.0%) |
| $20,000 to $22,499 | 23 (0.8%) | 55 (2.1%) |
| $22,500 to $24,999 | 226 (7.4%) | 115 (4.4%) |
| $25,000 to $29,999 | 146 (4.8%) | 213 (8.1%) |
| $30,000 to $34,999 | 174 (5.7%) | 448 (17.0%) |
| $35,000 to $39,999 | 186 (6.1%) | 182 (6.9%) |
| $40,000 to $44,999 | 184 (6.0%) | 169 (6.4%) |
| $45,000 to $49,999 | 264 (8.7%) | 42 (1.6%) |
| $50,000 to $54,999 | 153 (5.0%) | 150 (5.7%) |
| $55,000 to $64,999 | 140 (4.6%) | 246 (9.4%) |
| $65,000 to $74,999 | 233 (7.7%) | 118 (4.5%) |
| $75,000 to $99,999 | 515 (16.9%) | 184 (7.0%) |
| $100,000+ | 284 (9.3%) | 52 (2.0%) |
| Total | 3,040 (100.0%) | 2,629 (100.0%) |
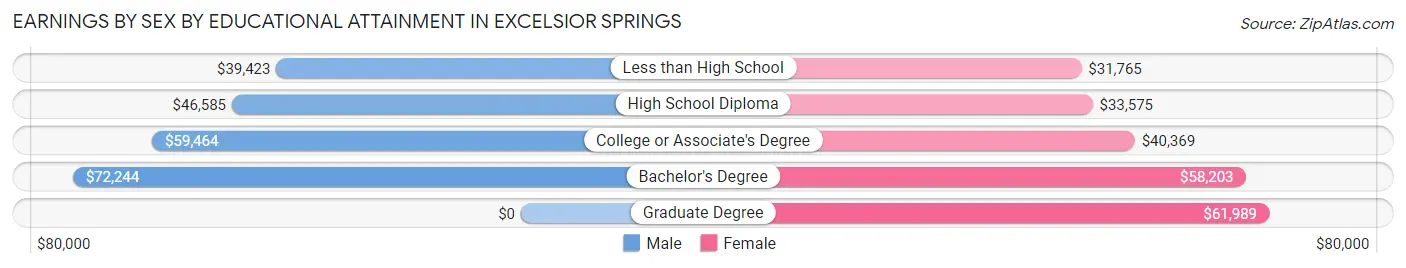
Earnings by Sex by Educational Attainment in Excelsior Springs
Average earnings in Excelsior Springs are $49,036 for men and $37,321 for women, a difference of 23.9%. Men with an educational attainment of bachelor's degree enjoy the highest average annual earnings of $72,244, while those with less than high school education earn the least with $39,423. Women with an educational attainment of graduate degree earn the most with the average annual earnings of $61,989, while those with less than high school education have the smallest earnings of $31,765.
| Educational Attainment | Male Income | Female Income |
| Less than High School | $39,423 | $31,765 |
| High School Diploma | $46,585 | $33,575 |
| College or Associate's Degree | $59,464 | $40,369 |
| Bachelor's Degree | $72,244 | $58,203 |
| Graduate Degree | - | - |
| Total | $49,036 | $37,321 |
Family Income in Excelsior Springs
Family Income Brackets in Excelsior Springs
According to the Excelsior Springs family income data, there are 659 families falling into the $100,000 to $149,999 income range, which is the most common income bracket and makes up 24.9% of all families. Conversely, the $15,000 to $24,999 income bracket is the least frequent group with only 40 families (1.5%) belonging to this category.
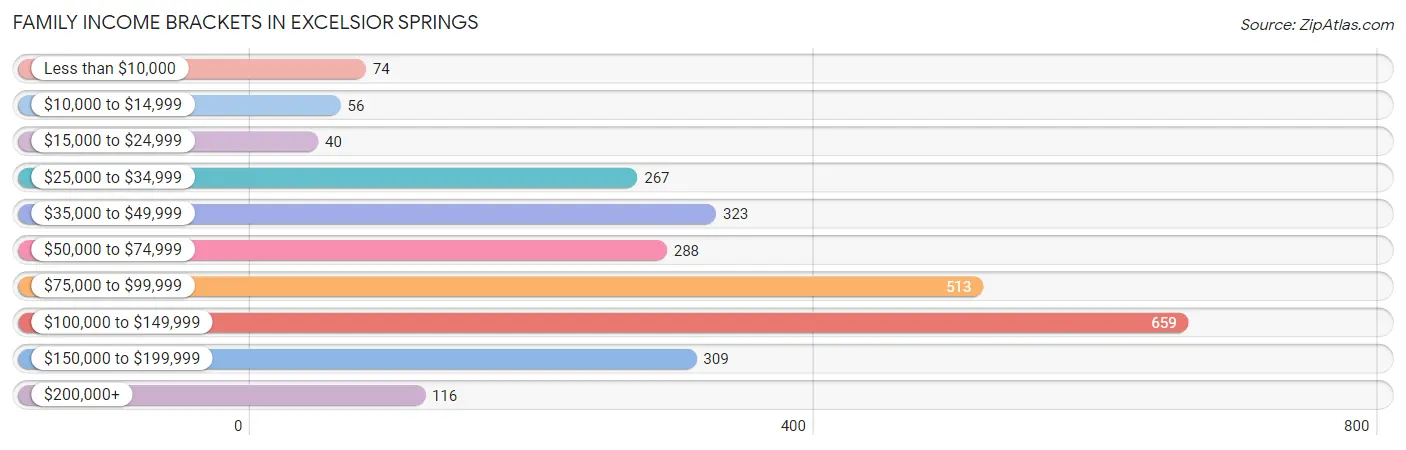
| Income Bracket | # Families | % Families |
| Less than $10,000 | 74 | 2.8% |
| $10,000 to $14,999 | 56 | 2.1% |
| $15,000 to $24,999 | 40 | 1.5% |
| $25,000 to $34,999 | 267 | 10.1% |
| $35,000 to $49,999 | 323 | 12.2% |
| $50,000 to $74,999 | 288 | 10.9% |
| $75,000 to $99,999 | 513 | 19.4% |
| $100,000 to $149,999 | 659 | 24.9% |
| $150,000 to $199,999 | 309 | 11.7% |
| $200,000+ | 116 | 4.4% |
Family Income by Famaliy Size in Excelsior Springs
7+ person families (73 | 2.8%) account for the highest median family income in Excelsior Springs with $140,884 per family, while 2-person families (1,311 | 49.6%) have the highest median income of $40,553 per family member.
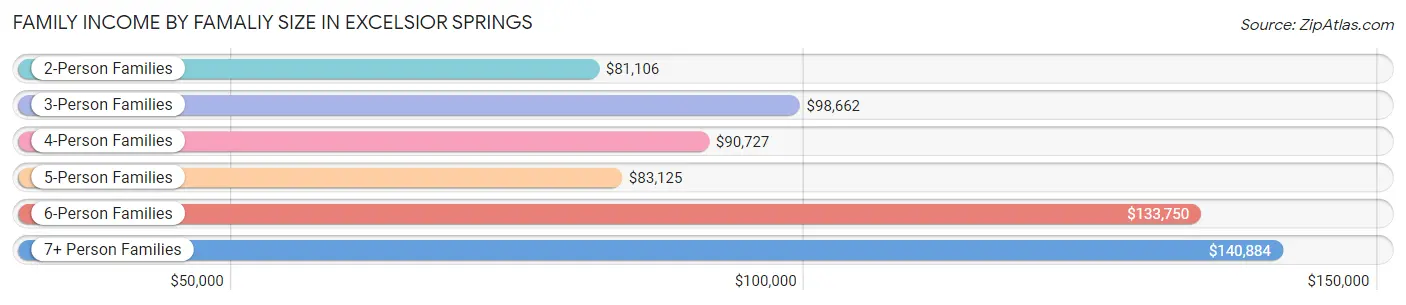
| Income Bracket | # Families | Median Income |
| 2-Person Families | 1,311 (49.6%) | $81,106 |
| 3-Person Families | 481 (18.2%) | $98,662 |
| 4-Person Families | 439 (16.6%) | $90,727 |
| 5-Person Families | 301 (11.4%) | $83,125 |
| 6-Person Families | 40 (1.5%) | $133,750 |
| 7+ Person Families | 73 (2.8%) | $140,884 |
| Total | 2,645 (100.0%) | $87,852 |
Family Income by Number of Earners in Excelsior Springs
The median family income in Excelsior Springs is $87,852, with families comprising 3+ earners (299) having the highest median family income of $144,417, while families with no earners (380) have the lowest median family income of $33,640, accounting for 11.3% and 14.4% of families, respectively.
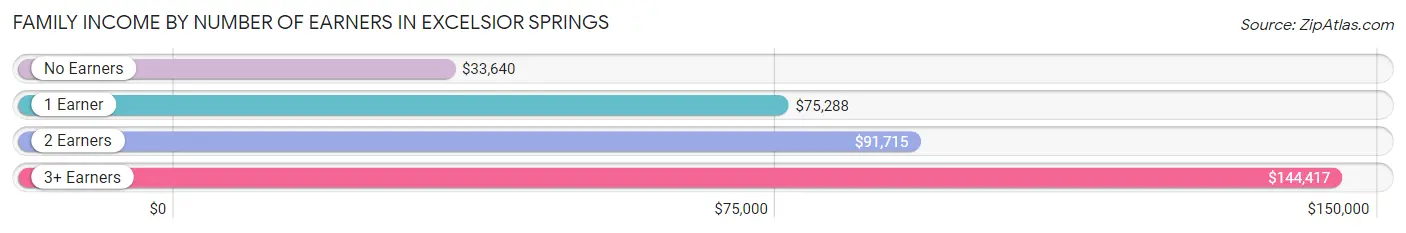
| Number of Earners | # Families | Median Income |
| No Earners | 380 (14.4%) | $33,640 |
| 1 Earner | 707 (26.7%) | $75,288 |
| 2 Earners | 1,259 (47.6%) | $91,715 |
| 3+ Earners | 299 (11.3%) | $144,417 |
| Total | 2,645 (100.0%) | $87,852 |
Household Income in Excelsior Springs
Household Income Brackets in Excelsior Springs
With 740 households falling in the category, the $100,000 to $149,999 income range is the most frequent in Excelsior Springs, accounting for 19.2% of all households. In contrast, only 131 households (3.4%) fall into the $200,000+ income bracket, making it the least populous group.
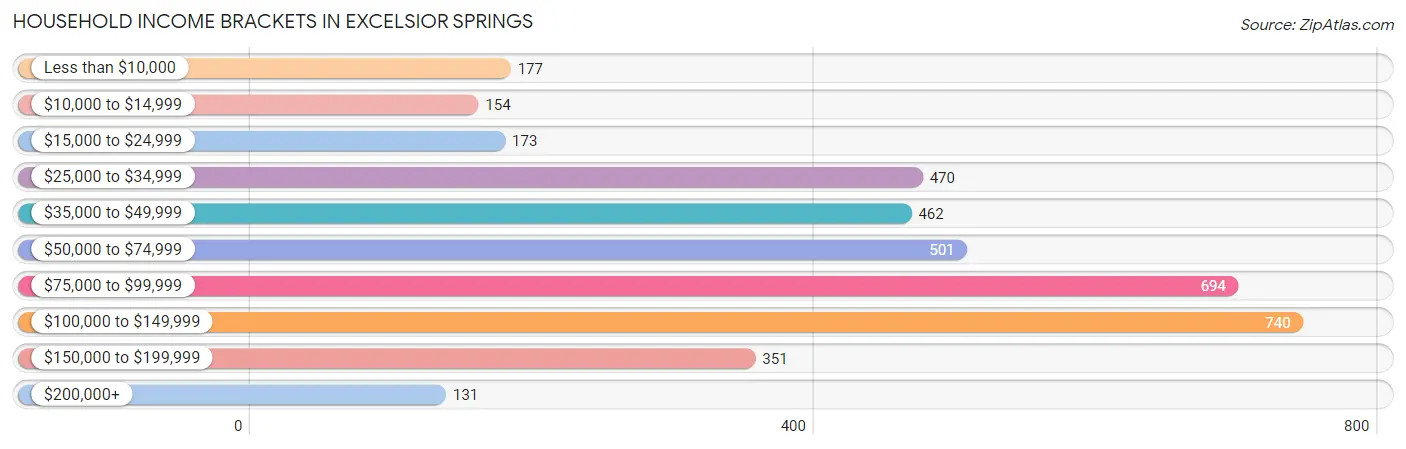
| Income Bracket | # Households | % Households |
| Less than $10,000 | 177 | 4.6% |
| $10,000 to $14,999 | 154 | 4.0% |
| $15,000 to $24,999 | 173 | 4.5% |
| $25,000 to $34,999 | 470 | 12.2% |
| $35,000 to $49,999 | 462 | 12.0% |
| $50,000 to $74,999 | 501 | 13.0% |
| $75,000 to $99,999 | 694 | 18.0% |
| $100,000 to $149,999 | 740 | 19.2% |
| $150,000 to $199,999 | 351 | 9.1% |
| $200,000+ | 131 | 3.4% |
Household Income by Householder Age in Excelsior Springs
The median household income in Excelsior Springs is $74,196, with the highest median household income of $88,246 found in the 45 to 64 years age bracket for the primary householder. A total of 1,326 households (34.4%) fall into this category. Meanwhile, the 65+ years age bracket for the primary householder has the lowest median household income of $39,643, with 986 households (25.6%) in this group.
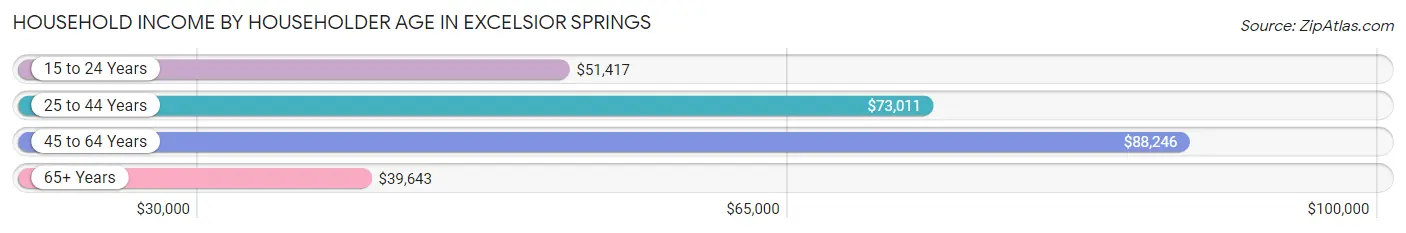
| Income Bracket | # Households | Median Income |
| 15 to 24 Years | 188 (4.9%) | $51,417 |
| 25 to 44 Years | 1,353 (35.1%) | $73,011 |
| 45 to 64 Years | 1,326 (34.4%) | $88,246 |
| 65+ Years | 986 (25.6%) | $39,643 |
| Total | 3,853 (100.0%) | $74,196 |
Poverty in Excelsior Springs
Income Below Poverty by Sex and Age in Excelsior Springs
With 12.0% poverty level for males and 13.5% for females among the residents of Excelsior Springs, 5 year old males and 15 year old females are the most vulnerable to poverty, with 35 males (62.5%) and 20 females (28.2%) in their respective age groups living below the poverty level.
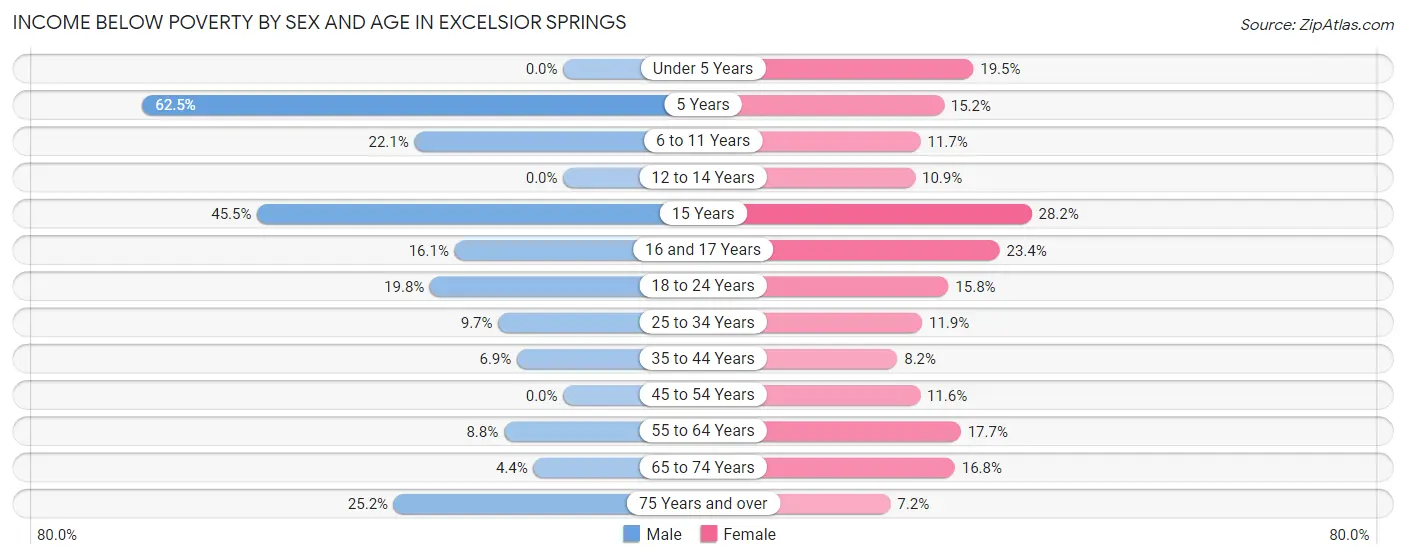
| Age Bracket | Male | Female |
| Under 5 Years | 0 (0.0%) | 67 (19.5%) |
| 5 Years | 35 (62.5%) | 5 (15.1%) |
| 6 to 11 Years | 78 (22.1%) | 47 (11.7%) |
| 12 to 14 Years | 0 (0.0%) | 41 (10.9%) |
| 15 Years | 15 (45.5%) | 20 (28.2%) |
| 16 and 17 Years | 25 (16.1%) | 26 (23.4%) |
| 18 to 24 Years | 160 (19.8%) | 85 (15.8%) |
| 25 to 34 Years | 81 (9.7%) | 90 (11.9%) |
| 35 to 44 Years | 46 (6.9%) | 51 (8.2%) |
| 45 to 54 Years | 0 (0.0%) | 75 (11.6%) |
| 55 to 64 Years | 62 (8.8%) | 95 (17.7%) |
| 65 to 74 Years | 14 (4.4%) | 98 (16.8%) |
| 75 Years and over | 78 (25.2%) | 26 (7.2%) |
| Total | 594 (12.0%) | 726 (13.5%) |
Income Above Poverty by Sex and Age in Excelsior Springs
According to the poverty statistics in Excelsior Springs, males aged under 5 years and females aged 75 years and over are the age groups that are most secure financially, with 100.0% of males and 92.8% of females in these age groups living above the poverty line.
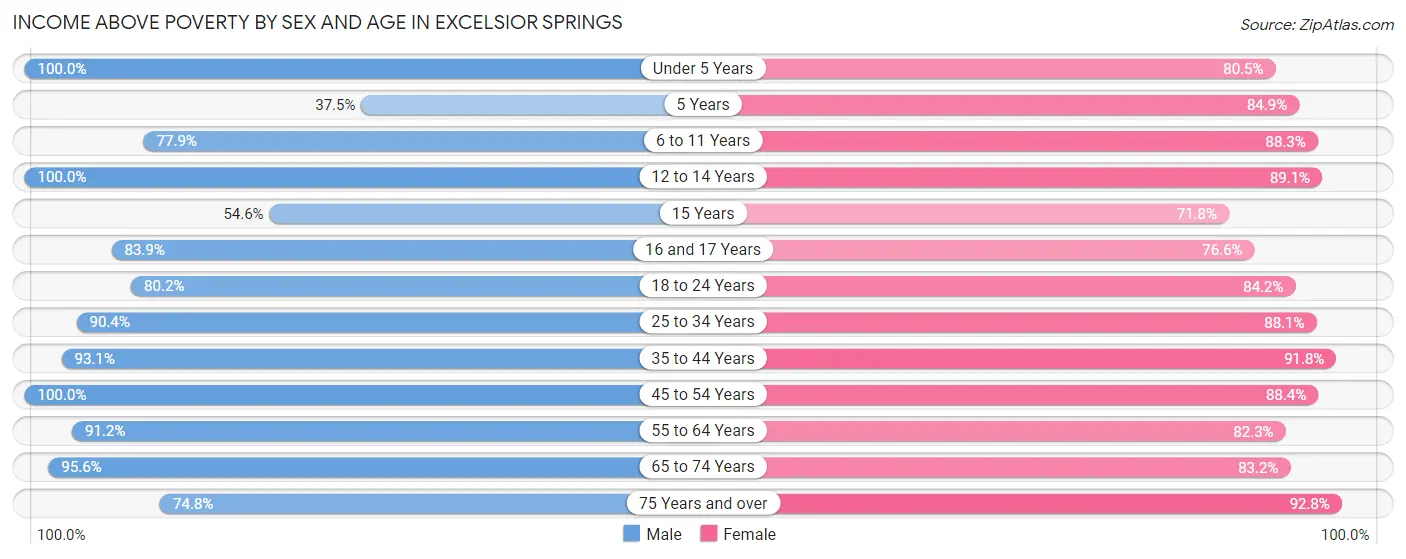
| Age Bracket | Male | Female |
| Under 5 Years | 118 (100.0%) | 276 (80.5%) |
| 5 Years | 21 (37.5%) | 28 (84.9%) |
| 6 to 11 Years | 275 (77.9%) | 355 (88.3%) |
| 12 to 14 Years | 207 (100.0%) | 336 (89.1%) |
| 15 Years | 18 (54.5%) | 51 (71.8%) |
| 16 and 17 Years | 130 (83.9%) | 85 (76.6%) |
| 18 to 24 Years | 649 (80.2%) | 452 (84.2%) |
| 25 to 34 Years | 758 (90.3%) | 665 (88.1%) |
| 35 to 44 Years | 624 (93.1%) | 568 (91.8%) |
| 45 to 54 Years | 389 (100.0%) | 571 (88.4%) |
| 55 to 64 Years | 642 (91.2%) | 443 (82.3%) |
| 65 to 74 Years | 302 (95.6%) | 486 (83.2%) |
| 75 Years and over | 232 (74.8%) | 334 (92.8%) |
| Total | 4,365 (88.0%) | 4,650 (86.5%) |
Income Below Poverty Among Married-Couple Families in Excelsior Springs
The poverty statistics for married-couple families in Excelsior Springs show that 3.2% or 63 of the total 1,980 families live below the poverty line. Families with 3 or 4 children have the highest poverty rate of 16.3%, comprising of 39 families. On the other hand, families with 5 or more children have the lowest poverty rate of 0.0%, which includes 0 families.
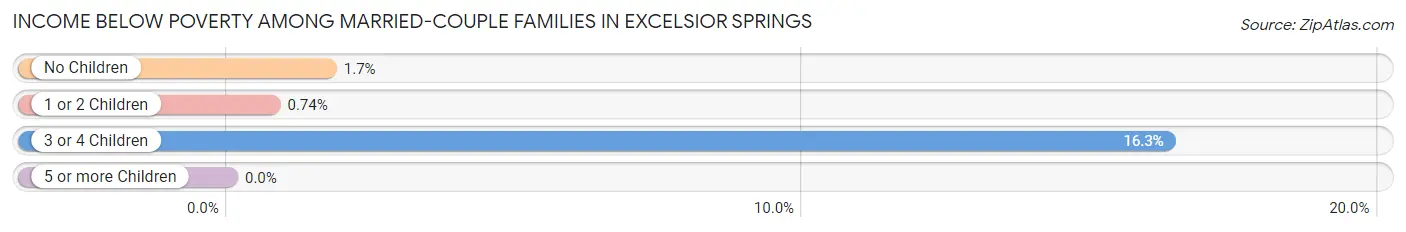
| Children | Above Poverty | Below Poverty |
| No Children | 1,145 (98.3%) | 20 (1.7%) |
| 1 or 2 Children | 540 (99.3%) | 4 (0.7%) |
| 3 or 4 Children | 200 (83.7%) | 39 (16.3%) |
| 5 or more Children | 32 (100.0%) | 0 (0.0%) |
| Total | 1,917 (96.8%) | 63 (3.2%) |
Income Below Poverty Among Single-Parent Households in Excelsior Springs
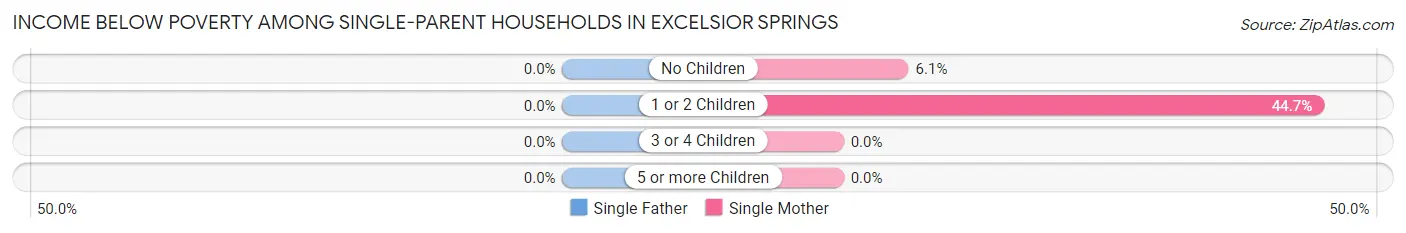
| Children | Single Father | Single Mother |
| No Children | 0 (0.0%) | 15 (6.0%) |
| 1 or 2 Children | 0 (0.0%) | 123 (44.7%) |
| 3 or 4 Children | 0 (0.0%) | 0 (0.0%) |
| 5 or more Children | 0 (0.0%) | 0 (0.0%) |
| Total | 0 (0.0%) | 138 (26.4%) |
Income Below Poverty Among Married-Couple vs Single-Parent Households in Excelsior Springs
The poverty data for Excelsior Springs shows that 63 of the married-couple family households (3.2%) and 138 of the single-parent households (20.7%) are living below the poverty level. Within the married-couple family households, those with 3 or 4 children have the highest poverty rate, with 39 households (16.3%) falling below the poverty line. Among the single-parent households, those with 1 or 2 children have the highest poverty rate, with 123 household (33.7%) living below poverty.
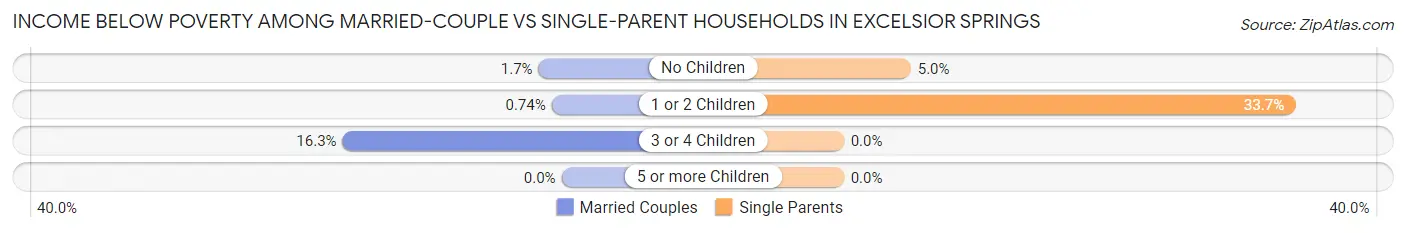
| Children | Married-Couple Families | Single-Parent Households |
| No Children | 20 (1.7%) | 15 (5.0%) |
| 1 or 2 Children | 4 (0.7%) | 123 (33.7%) |
| 3 or 4 Children | 39 (16.3%) | 0 (0.0%) |
| 5 or more Children | 0 (0.0%) | 0 (0.0%) |
| Total | 63 (3.2%) | 138 (20.7%) |
Race in Excelsior Springs
The most populous races in Excelsior Springs are White / Caucasian (9,305 | 88.2%), Hispanic or Latino (638 | 6.0%), and Black / African American (574 | 5.4%).
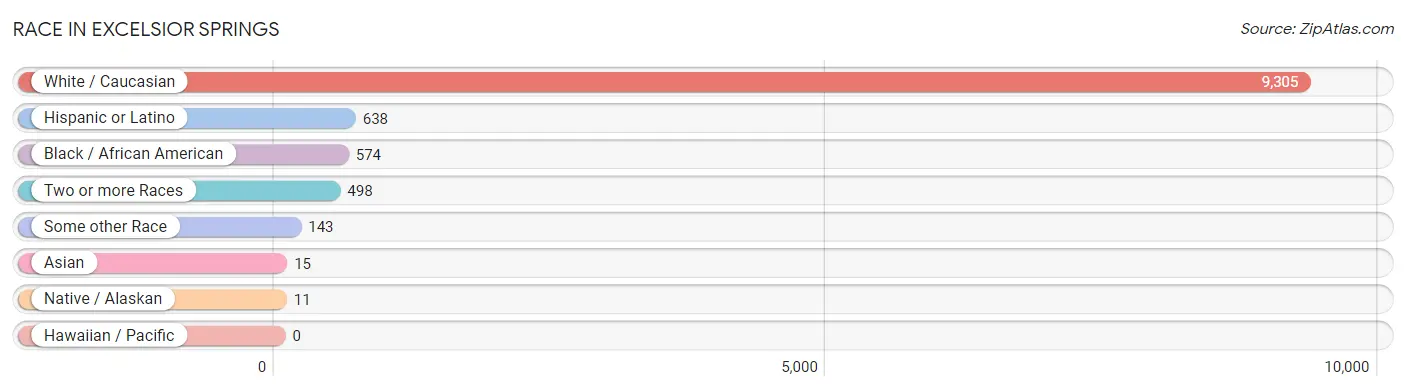
| Race | # Population | % Population |
| Asian | 15 | 0.1% |
| Black / African American | 574 | 5.4% |
| Hawaiian / Pacific | 0 | 0.0% |
| Hispanic or Latino | 638 | 6.0% |
| Native / Alaskan | 11 | 0.1% |
| White / Caucasian | 9,305 | 88.2% |
| Two or more Races | 498 | 4.7% |
| Some other Race | 143 | 1.4% |
| Total | 10,546 | 100.0% |
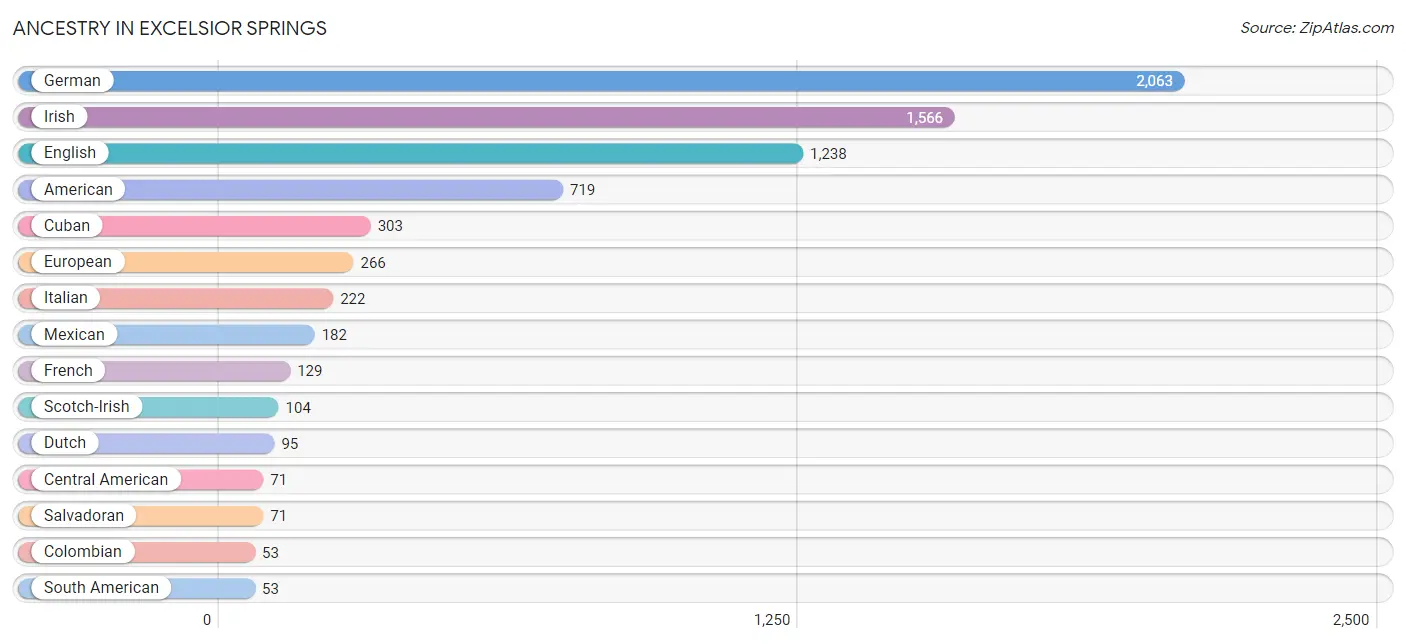
Ancestry in Excelsior Springs
The most populous ancestries reported in Excelsior Springs are German (2,063 | 19.6%), Irish (1,566 | 14.8%), English (1,238 | 11.7%), American (719 | 6.8%), and Cuban (303 | 2.9%), together accounting for 55.8% of all Excelsior Springs residents.
| Ancestry | # Population | % Population |
| African | 10 | 0.1% |
| American | 719 | 6.8% |
| Belgian | 13 | 0.1% |
| British | 43 | 0.4% |
| Canadian | 45 | 0.4% |
| Central American | 71 | 0.7% |
| Cherokee | 10 | 0.1% |
| Colombian | 53 | 0.5% |
| Cuban | 303 | 2.9% |
| Czech | 15 | 0.1% |
| Danish | 18 | 0.2% |
| Dutch | 95 | 0.9% |
| Eastern European | 14 | 0.1% |
| English | 1,238 | 11.7% |
| European | 266 | 2.5% |
| Finnish | 19 | 0.2% |
| French | 129 | 1.2% |
| French American Indian | 6 | 0.1% |
| French Canadian | 7 | 0.1% |
| German | 2,063 | 19.6% |
| Irish | 1,566 | 14.8% |
| Italian | 222 | 2.1% |
| Korean | 15 | 0.1% |
| Mexican | 182 | 1.7% |
| Mexican American Indian | 52 | 0.5% |
| Norwegian | 48 | 0.5% |
| Pennsylvania German | 12 | 0.1% |
| Polish | 35 | 0.3% |
| Salvadoran | 71 | 0.7% |
| Scotch-Irish | 104 | 1.0% |
| Scottish | 44 | 0.4% |
| Serbian | 17 | 0.2% |
| Slavic | 6 | 0.1% |
| Slovak | 22 | 0.2% |
| Somali | 13 | 0.1% |
| South American | 53 | 0.5% |
| South American Indian | 4 | 0.0% |
| Spanish | 21 | 0.2% |
| Sri Lankan | 18 | 0.2% |
| Subsaharan African | 30 | 0.3% |
| Swedish | 31 | 0.3% |
| Swiss | 15 | 0.1% |
| Welsh | 30 | 0.3% |
| Yugoslavian | 17 | 0.2% | View All 44 Rows |
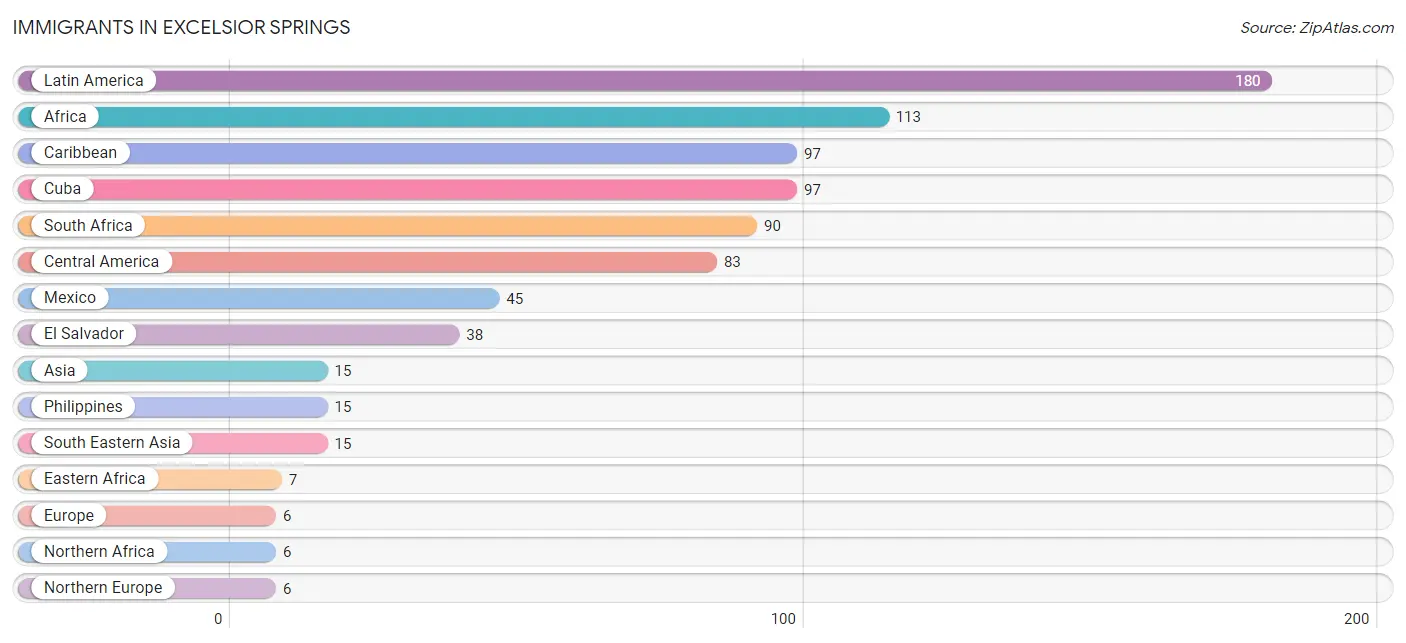
Immigrants in Excelsior Springs
The most numerous immigrant groups reported in Excelsior Springs came from Latin America (180 | 1.7%), Africa (113 | 1.1%), Caribbean (97 | 0.9%), Cuba (97 | 0.9%), and South Africa (90 | 0.9%), together accounting for 5.5% of all Excelsior Springs residents.
| Immigration Origin | # Population | % Population |
| Africa | 113 | 1.1% |
| Asia | 15 | 0.1% |
| Caribbean | 97 | 0.9% |
| Central America | 83 | 0.8% |
| Cuba | 97 | 0.9% |
| Eastern Africa | 7 | 0.1% |
| El Salvador | 38 | 0.4% |
| Europe | 6 | 0.1% |
| Latin America | 180 | 1.7% |
| Mexico | 45 | 0.4% |
| Northern Africa | 6 | 0.1% |
| Northern Europe | 6 | 0.1% |
| Philippines | 15 | 0.1% |
| Scotland | 6 | 0.1% |
| South Africa | 90 | 0.9% |
| South Eastern Asia | 15 | 0.1% |
| Sudan | 6 | 0.1% | View All 17 Rows |
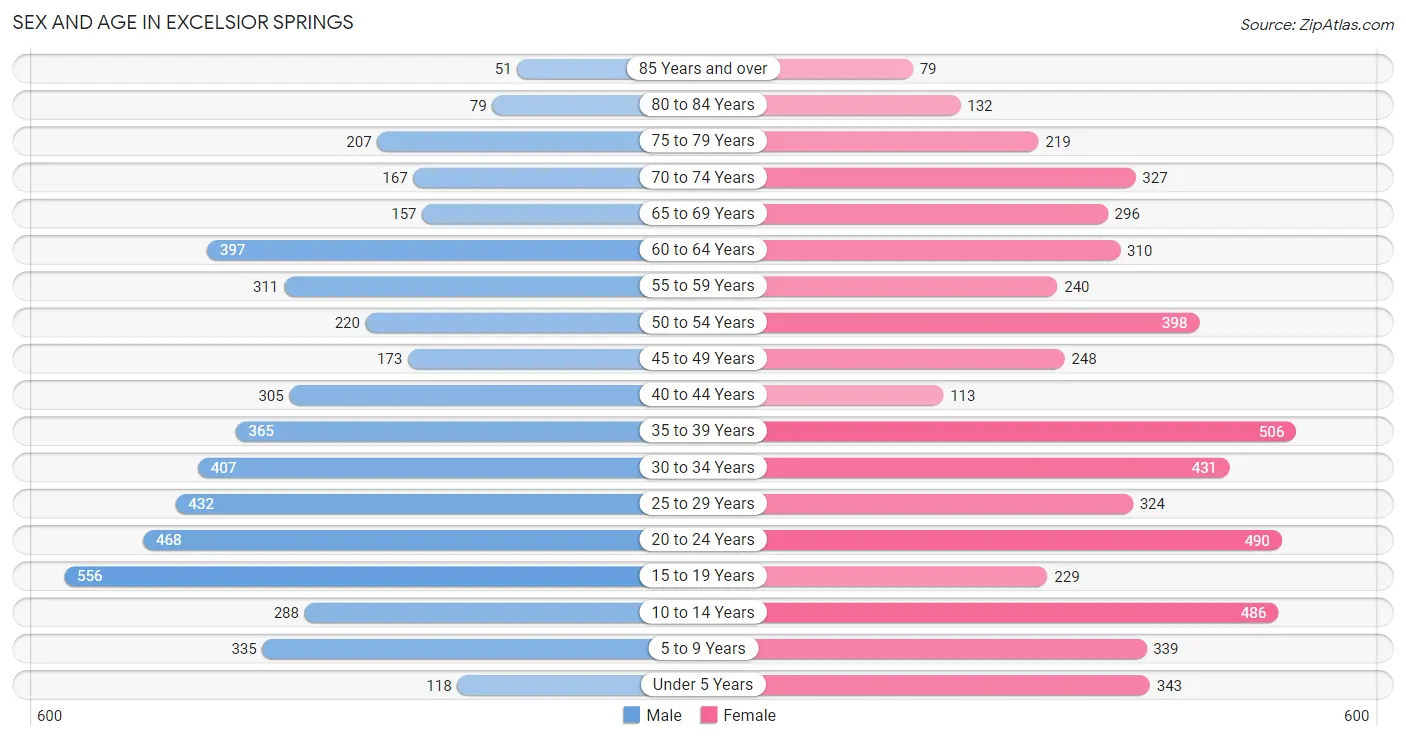
Sex and Age in Excelsior Springs
Sex and Age in Excelsior Springs
The most populous age groups in Excelsior Springs are 15 to 19 Years (556 | 11.0%) for men and 35 to 39 Years (506 | 9.2%) for women.
| Age Bracket | Male | Female |
| Under 5 Years | 118 (2.3%) | 343 (6.2%) |
| 5 to 9 Years | 335 (6.7%) | 339 (6.1%) |
| 10 to 14 Years | 288 (5.7%) | 486 (8.8%) |
| 15 to 19 Years | 556 (11.0%) | 229 (4.2%) |
| 20 to 24 Years | 468 (9.3%) | 490 (8.9%) |
| 25 to 29 Years | 432 (8.6%) | 324 (5.9%) |
| 30 to 34 Years | 407 (8.1%) | 431 (7.8%) |
| 35 to 39 Years | 365 (7.2%) | 506 (9.2%) |
| 40 to 44 Years | 305 (6.1%) | 113 (2.1%) |
| 45 to 49 Years | 173 (3.4%) | 248 (4.5%) |
| 50 to 54 Years | 220 (4.4%) | 398 (7.2%) |
| 55 to 59 Years | 311 (6.2%) | 240 (4.4%) |
| 60 to 64 Years | 397 (7.9%) | 310 (5.6%) |
| 65 to 69 Years | 157 (3.1%) | 296 (5.4%) |
| 70 to 74 Years | 167 (3.3%) | 327 (5.9%) |
| 75 to 79 Years | 207 (4.1%) | 219 (4.0%) |
| 80 to 84 Years | 79 (1.6%) | 132 (2.4%) |
| 85 Years and over | 51 (1.0%) | 79 (1.4%) |
| Total | 5,036 (100.0%) | 5,510 (100.0%) |
Families and Households in Excelsior Springs
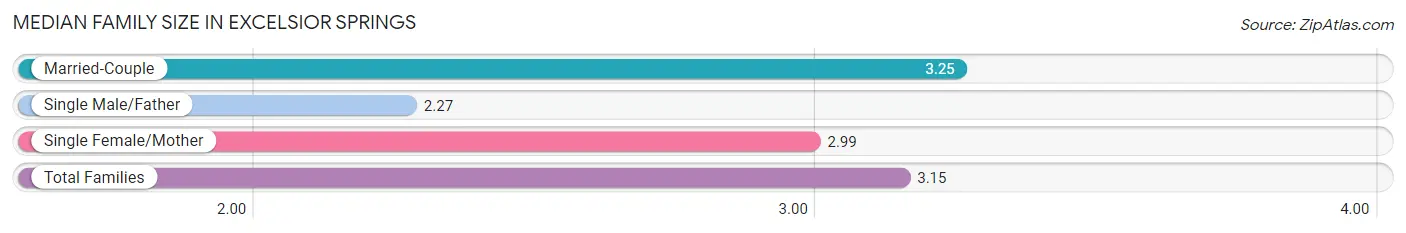
Median Family Size in Excelsior Springs
The median family size in Excelsior Springs is 3.15 persons per family, with married-couple families (1,980 | 74.9%) accounting for the largest median family size of 3.25 persons per family. On the other hand, single male/father families (142 | 5.4%) represent the smallest median family size with 2.27 persons per family.
| Family Type | # Families | Family Size |
| Married-Couple | 1,980 (74.9%) | 3.25 |
| Single Male/Father | 142 (5.4%) | 2.27 |
| Single Female/Mother | 523 (19.8%) | 2.99 |
| Total Families | 2,645 (100.0%) | 3.15 |
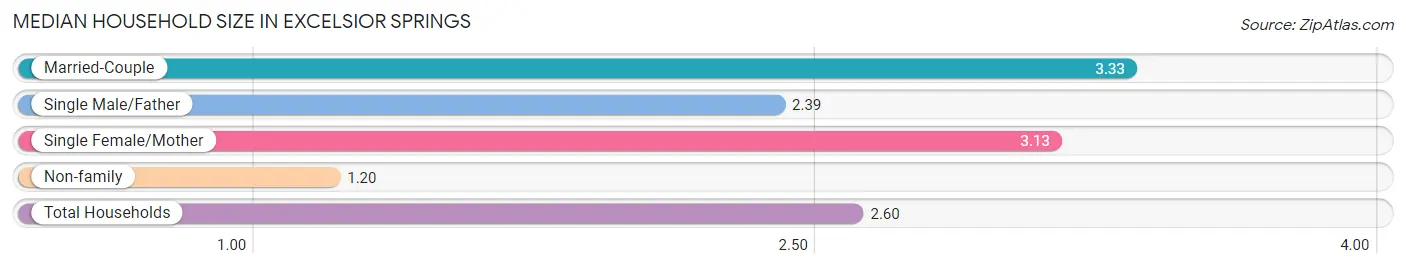
Median Household Size in Excelsior Springs
The median household size in Excelsior Springs is 2.60 persons per household, with married-couple households (1,980 | 51.4%) accounting for the largest median household size of 3.33 persons per household. non-family households (1,208 | 31.4%) represent the smallest median household size with 1.20 persons per household.
| Household Type | # Households | Household Size |
| Married-Couple | 1,980 (51.4%) | 3.33 |
| Single Male/Father | 142 (3.7%) | 2.39 |
| Single Female/Mother | 523 (13.6%) | 3.13 |
| Non-family | 1,208 (31.4%) | 1.20 |
| Total Households | 3,853 (100.0%) | 2.60 |
Household Size by Marriage Status in Excelsior Springs
Out of a total of 3,853 households in Excelsior Springs, 2,645 (68.6%) are family households, while 1,208 (31.4%) are nonfamily households. The most numerous type of family households are 2-person households, comprising 1,272, and the most common type of nonfamily households are 1-person households, comprising 1,013.
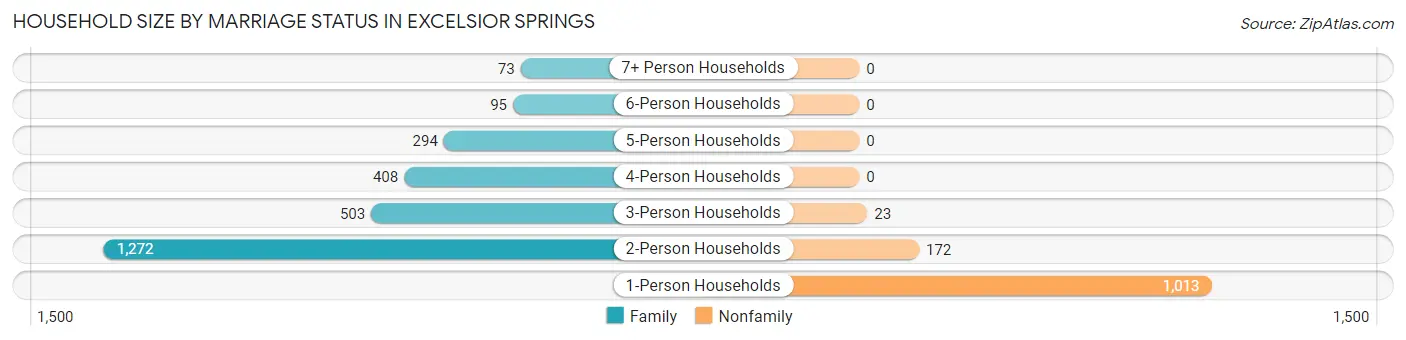
| Household Size | Family Households | Nonfamily Households |
| 1-Person Households | - | 1,013 (26.3%) |
| 2-Person Households | 1,272 (33.0%) | 172 (4.5%) |
| 3-Person Households | 503 (13.1%) | 23 (0.6%) |
| 4-Person Households | 408 (10.6%) | 0 (0.0%) |
| 5-Person Households | 294 (7.6%) | 0 (0.0%) |
| 6-Person Households | 95 (2.5%) | 0 (0.0%) |
| 7+ Person Households | 73 (1.9%) | 0 (0.0%) |
| Total | 2,645 (68.6%) | 1,208 (31.4%) |
Female Fertility in Excelsior Springs
Fertility by Age in Excelsior Springs
Average fertility rate in Excelsior Springs is 18.0 births per 1,000 women. Women in the age bracket of 20 to 34 years have the highest fertility rate with 32.0 births per 1,000 women. Women in the age bracket of 20 to 34 years acount for 88.9% of all women with births.
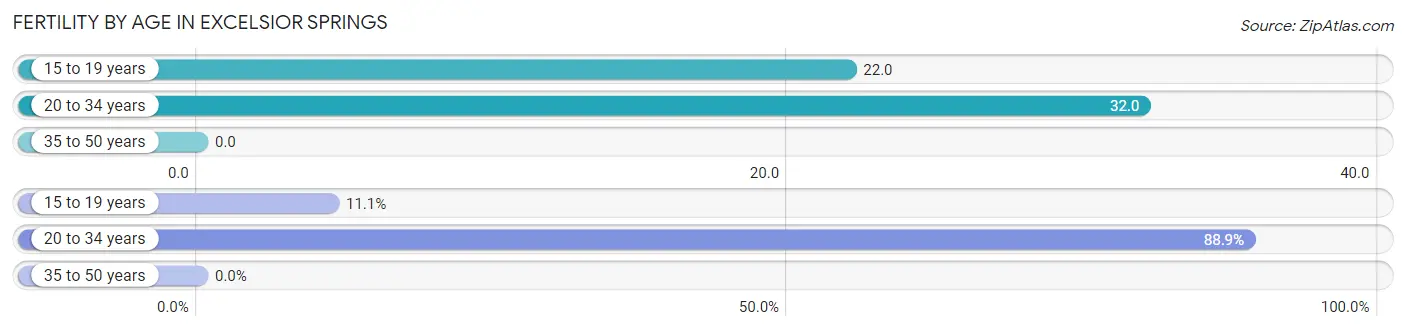
| Age Bracket | Women with Births | Births / 1,000 Women |
| 15 to 19 years | 5 (11.1%) | 22.0 |
| 20 to 34 years | 40 (88.9%) | 32.0 |
| 35 to 50 years | 0 (0.0%) | 0.0 |
| Total | 45 (100.0%) | 18.0 |
Fertility by Age by Marriage Status in Excelsior Springs
88.9% of women with births (45) in Excelsior Springs are married. The highest percentage of unmarried women with births falls into 15 to 19 years age bracket with 100.0% of them unmarried at the time of birth, while the lowest percentage of unmarried women with births belong to 20 to 34 years age bracket with 0.0% of them unmarried.
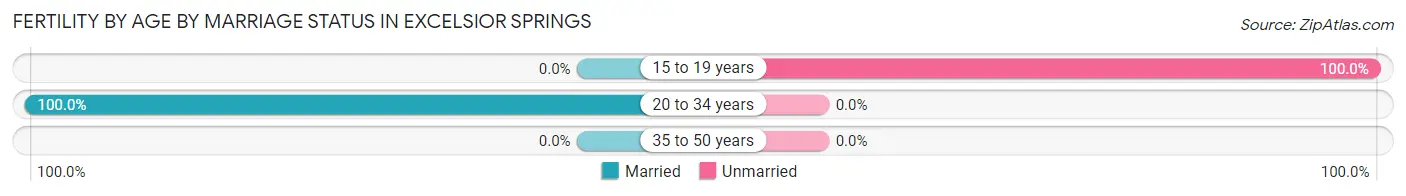
| Age Bracket | Married | Unmarried |
| 15 to 19 years | 0 (0.0%) | 5 (100.0%) |
| 20 to 34 years | 40 (100.0%) | 0 (0.0%) |
| 35 to 50 years | 0 (0.0%) | 0 (0.0%) |
| Total | 40 (88.9%) | 5 (11.1%) |
Fertility by Education in Excelsior Springs
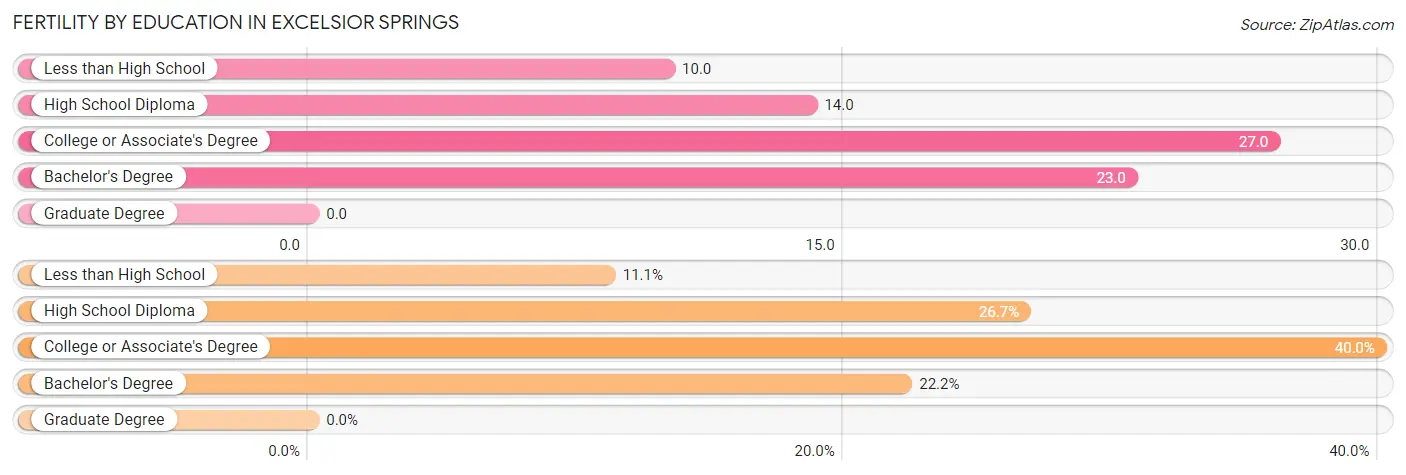
| Educational Attainment | Women with Births | Births / 1,000 Women |
| Less than High School | 5 (11.1%) | 10.0 |
| High School Diploma | 12 (26.7%) | 14.0 |
| College or Associate's Degree | 18 (40.0%) | 27.0 |
| Bachelor's Degree | 10 (22.2%) | 23.0 |
| Graduate Degree | 0 (0.0%) | 0.0 |
| Total | 45 (100.0%) | 18.0 |
Fertility by Education by Marriage Status in Excelsior Springs
11.1% of women with births in Excelsior Springs are unmarried. Women with the educational attainment of high school diploma are most likely to be married with 100.0% of them married at childbirth, while women with the educational attainment of less than high school are least likely to be married with 100.0% of them unmarried at childbirth.
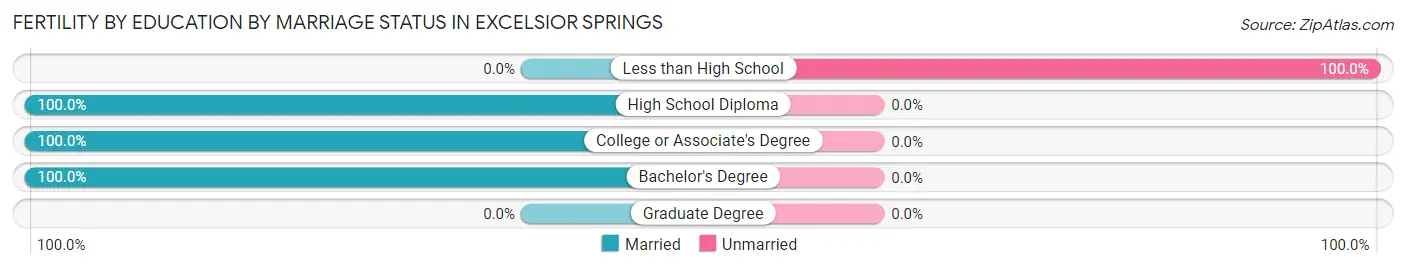
| Educational Attainment | Married | Unmarried |
| Less than High School | 0 (0.0%) | 5 (100.0%) |
| High School Diploma | 12 (100.0%) | 0 (0.0%) |
| College or Associate's Degree | 18 (100.0%) | 0 (0.0%) |
| Bachelor's Degree | 10 (100.0%) | 0 (0.0%) |
| Graduate Degree | 0 (0.0%) | 0 (0.0%) |
| Total | 40 (88.9%) | 5 (11.1%) |
Employment Characteristics in Excelsior Springs
Employment by Class of Employer in Excelsior Springs
Among the 5,213 employed individuals in Excelsior Springs, private company employees (4,019 | 77.1%), local government employees (300 | 5.8%), and not-for-profit organizations (273 | 5.2%) make up the most common classes of employment.
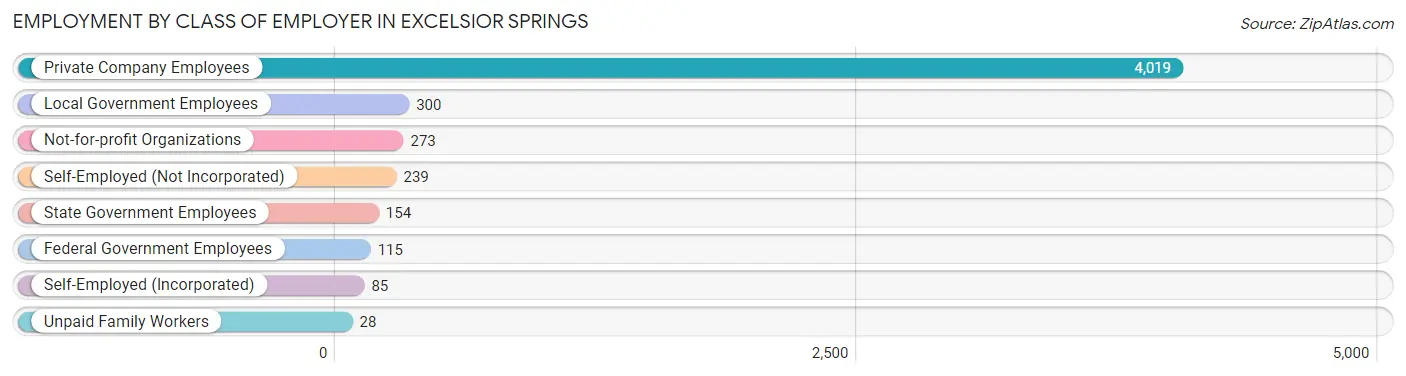
| Employer Class | # Employees | % Employees |
| Private Company Employees | 4,019 | 77.1% |
| Self-Employed (Incorporated) | 85 | 1.6% |
| Self-Employed (Not Incorporated) | 239 | 4.6% |
| Not-for-profit Organizations | 273 | 5.2% |
| Local Government Employees | 300 | 5.8% |
| State Government Employees | 154 | 2.9% |
| Federal Government Employees | 115 | 2.2% |
| Unpaid Family Workers | 28 | 0.5% |
| Total | 5,213 | 100.0% |
Employment Status by Age in Excelsior Springs
According to the labor force statistics for Excelsior Springs, out of the total population over 16 years of age (8,533), 64.2% or 5,478 individuals are in the labor force, with 4.0% or 219 of them unemployed. The age group with the highest labor force participation rate is 20 to 24 years, with 88.6% or 849 individuals in the labor force. Within the labor force, the 16 to 19 years age range has the highest percentage of unemployed individuals, with 36.1% or 83 of them being unemployed.
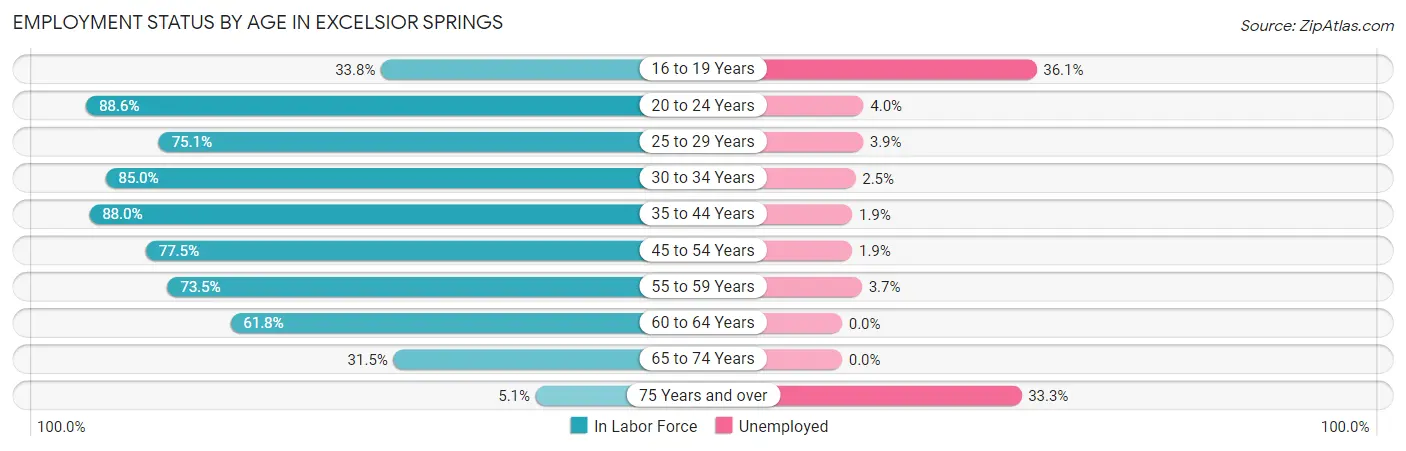
| Age Bracket | In Labor Force | Unemployed |
| 16 to 19 Years | 230 (33.8%) | 83 (36.1%) |
| 20 to 24 Years | 849 (88.6%) | 34 (4.0%) |
| 25 to 29 Years | 568 (75.1%) | 22 (3.9%) |
| 30 to 34 Years | 712 (85.0%) | 18 (2.5%) |
| 35 to 44 Years | 1,134 (88.0%) | 22 (1.9%) |
| 45 to 54 Years | 805 (77.5%) | 15 (1.9%) |
| 55 to 59 Years | 405 (73.5%) | 15 (3.7%) |
| 60 to 64 Years | 437 (61.8%) | 0 (0.0%) |
| 65 to 74 Years | 298 (31.5%) | 0 (0.0%) |
| 75 Years and over | 39 (5.1%) | 13 (33.3%) |
| Total | 5,478 (64.2%) | 219 (4.0%) |
Employment Status by Educational Attainment in Excelsior Springs
According to labor force statistics for Excelsior Springs, 78.4% of individuals (4,061) out of the total population between 25 and 64 years of age (5,180) are in the labor force, with 2.2% or 89 of them being unemployed. The group with the highest labor force participation rate are those with the educational attainment of bachelor's degree or higher, with 84.2% or 815 individuals in the labor force. Within the labor force, individuals with less than high school education have the highest percentage of unemployment, with 7.1% or 29 of them being unemployed.
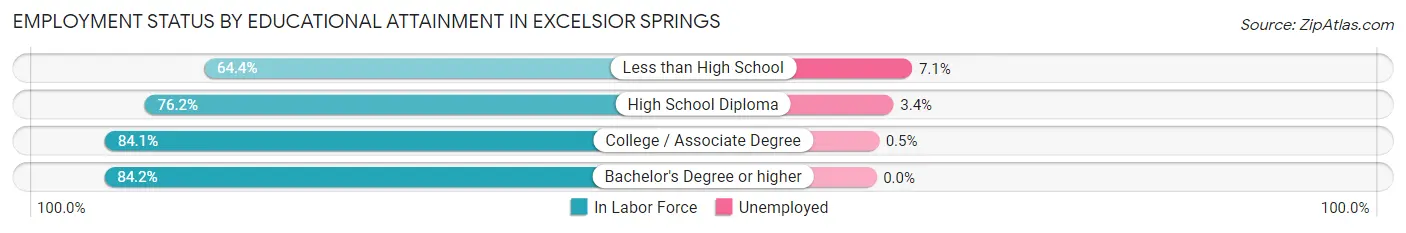
| Educational Attainment | In Labor Force | Unemployed |
| Less than High School | 408 (64.4%) | 45 (7.1%) |
| High School Diploma | 1,657 (76.2%) | 74 (3.4%) |
| College / Associate Degree | 1,180 (84.1%) | 7 (0.5%) |
| Bachelor's Degree or higher | 815 (84.2%) | 0 (0.0%) |
| Total | 4,061 (78.4%) | 114 (2.2%) |
Employment Occupations by Sex in Excelsior Springs
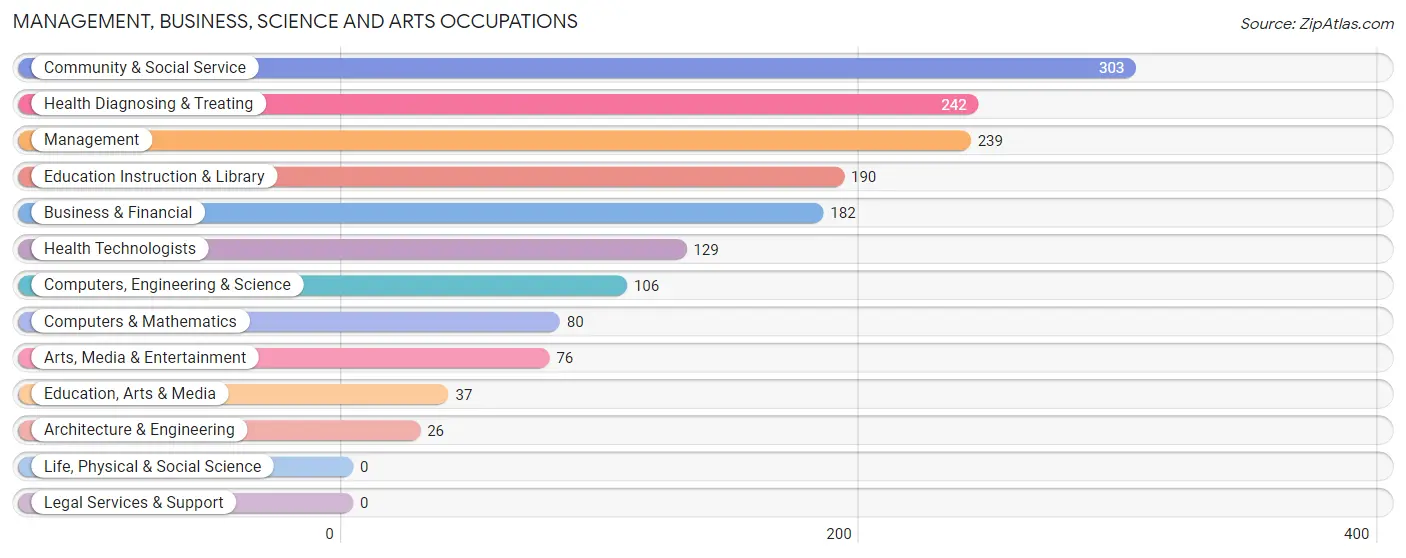
Management, Business, Science and Arts Occupations
The most common Management, Business, Science and Arts occupations in Excelsior Springs are Community & Social Service (303 | 5.8%), Health Diagnosing & Treating (242 | 4.6%), Management (239 | 4.5%), Education Instruction & Library (190 | 3.6%), and Business & Financial (182 | 3.5%).
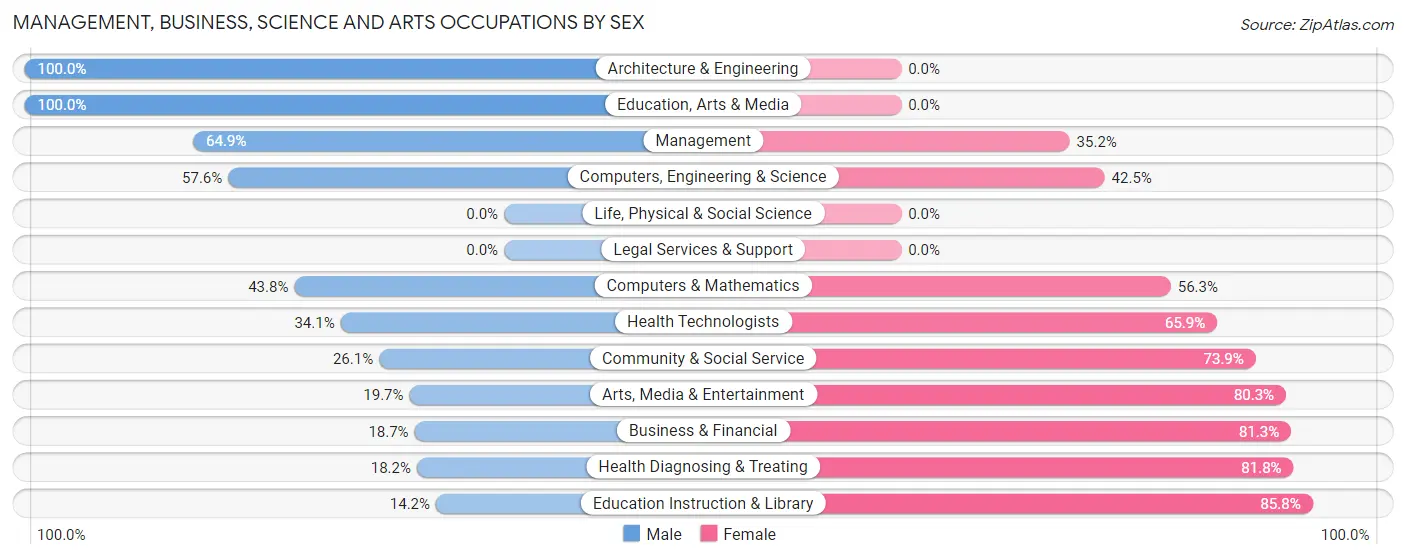
Management, Business, Science and Arts Occupations by Sex
Within the Management, Business, Science and Arts occupations in Excelsior Springs, the most male-oriented occupations are Architecture & Engineering (100.0%), Education, Arts & Media (100.0%), and Management (64.8%), while the most female-oriented occupations are Education Instruction & Library (85.8%), Health Diagnosing & Treating (81.8%), and Business & Financial (81.3%).
| Occupation | Male | Female |
| Management | 155 (64.8%) | 84 (35.1%) |
| Business & Financial | 34 (18.7%) | 148 (81.3%) |
| Computers, Engineering & Science | 61 (57.6%) | 45 (42.4%) |
| Computers & Mathematics | 35 (43.8%) | 45 (56.2%) |
| Architecture & Engineering | 26 (100.0%) | 0 (0.0%) |
| Life, Physical & Social Science | 0 (0.0%) | 0 (0.0%) |
| Community & Social Service | 79 (26.1%) | 224 (73.9%) |
| Education, Arts & Media | 37 (100.0%) | 0 (0.0%) |
| Legal Services & Support | 0 (0.0%) | 0 (0.0%) |
| Education Instruction & Library | 27 (14.2%) | 163 (85.8%) |
| Arts, Media & Entertainment | 15 (19.7%) | 61 (80.3%) |
| Health Diagnosing & Treating | 44 (18.2%) | 198 (81.8%) |
| Health Technologists | 44 (34.1%) | 85 (65.9%) |
| Total (Category) | 373 (34.8%) | 699 (65.2%) |
| Total (Overall) | 2,836 (54.0%) | 2,420 (46.0%) |
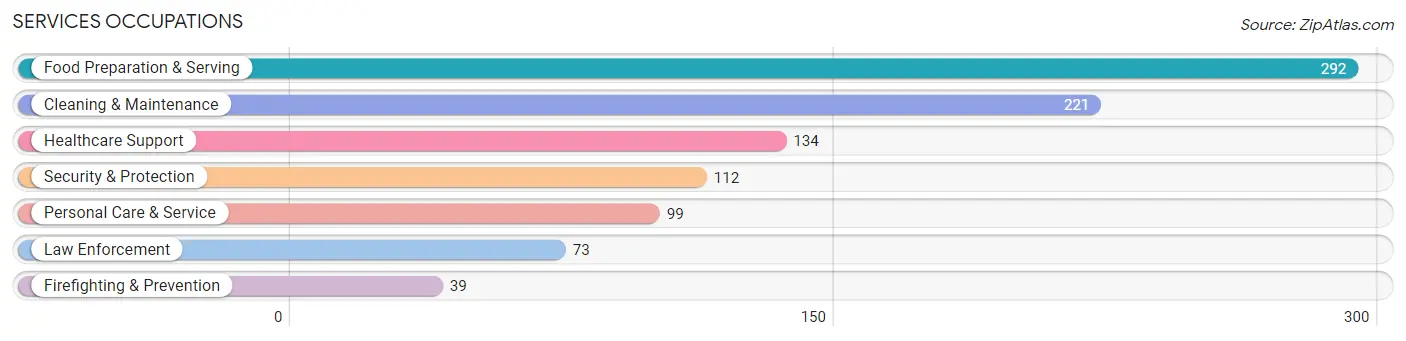
Services Occupations
The most common Services occupations in Excelsior Springs are Food Preparation & Serving (292 | 5.6%), Cleaning & Maintenance (221 | 4.2%), Healthcare Support (134 | 2.5%), Security & Protection (112 | 2.1%), and Personal Care & Service (99 | 1.9%).
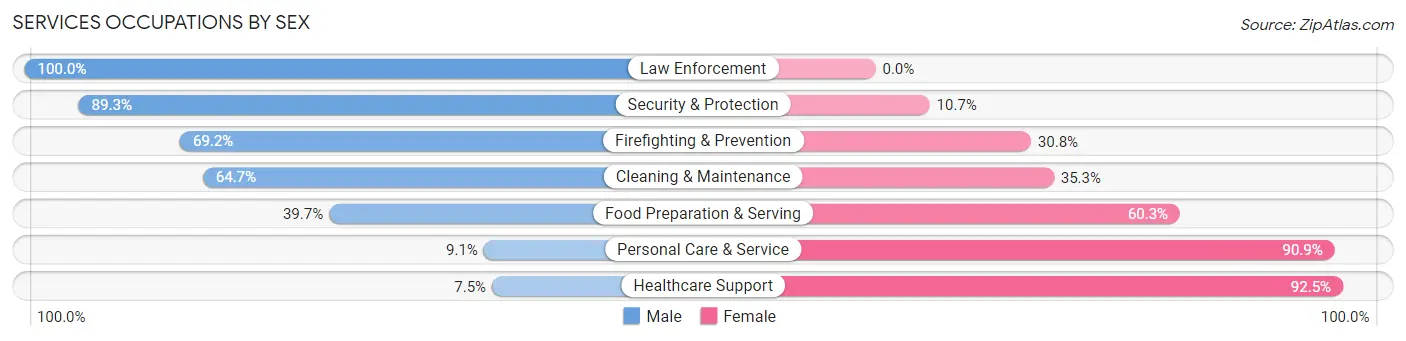
Services Occupations by Sex
Within the Services occupations in Excelsior Springs, the most male-oriented occupations are Law Enforcement (100.0%), Security & Protection (89.3%), and Firefighting & Prevention (69.2%), while the most female-oriented occupations are Healthcare Support (92.5%), Personal Care & Service (90.9%), and Food Preparation & Serving (60.3%).
| Occupation | Male | Female |
| Healthcare Support | 10 (7.5%) | 124 (92.5%) |
| Security & Protection | 100 (89.3%) | 12 (10.7%) |
| Firefighting & Prevention | 27 (69.2%) | 12 (30.8%) |
| Law Enforcement | 73 (100.0%) | 0 (0.0%) |
| Food Preparation & Serving | 116 (39.7%) | 176 (60.3%) |
| Cleaning & Maintenance | 143 (64.7%) | 78 (35.3%) |
| Personal Care & Service | 9 (9.1%) | 90 (90.9%) |
| Total (Category) | 378 (44.1%) | 480 (55.9%) |
| Total (Overall) | 2,836 (54.0%) | 2,420 (46.0%) |
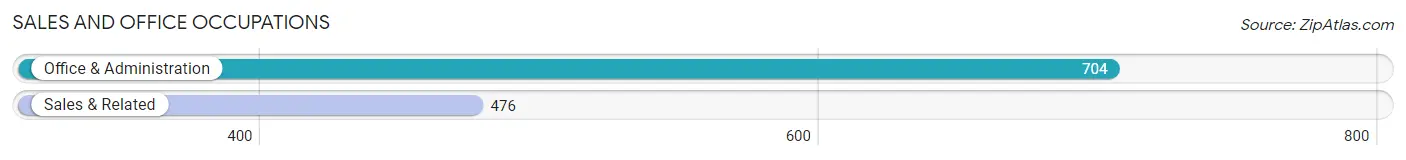
Sales and Office Occupations
The most common Sales and Office occupations in Excelsior Springs are Office & Administration (704 | 13.4%), and Sales & Related (476 | 9.1%).
Sales and Office Occupations by Sex
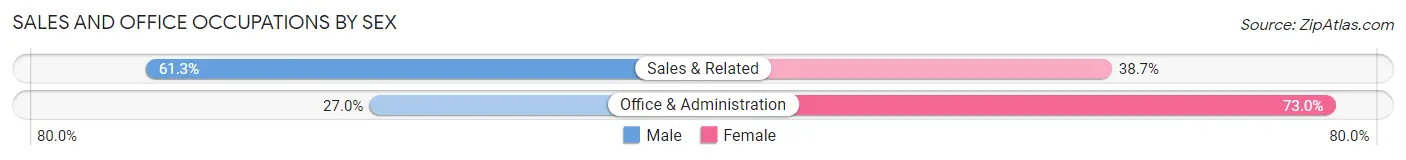
| Occupation | Male | Female |
| Sales & Related | 292 (61.3%) | 184 (38.7%) |
| Office & Administration | 190 (27.0%) | 514 (73.0%) |
| Total (Category) | 482 (40.8%) | 698 (59.2%) |
| Total (Overall) | 2,836 (54.0%) | 2,420 (46.0%) |
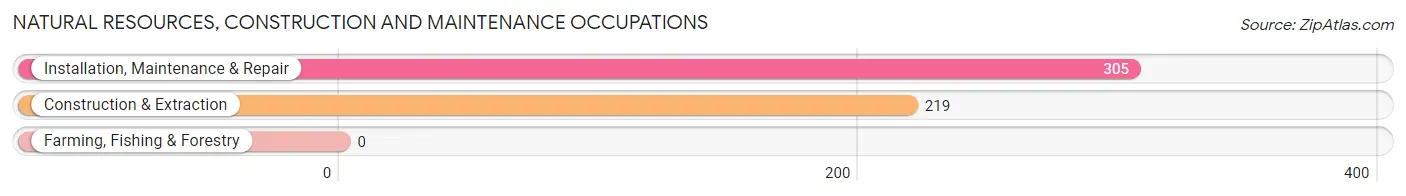
Natural Resources, Construction and Maintenance Occupations
The most common Natural Resources, Construction and Maintenance occupations in Excelsior Springs are Installation, Maintenance & Repair (305 | 5.8%), and Construction & Extraction (219 | 4.2%).
Natural Resources, Construction and Maintenance Occupations by Sex
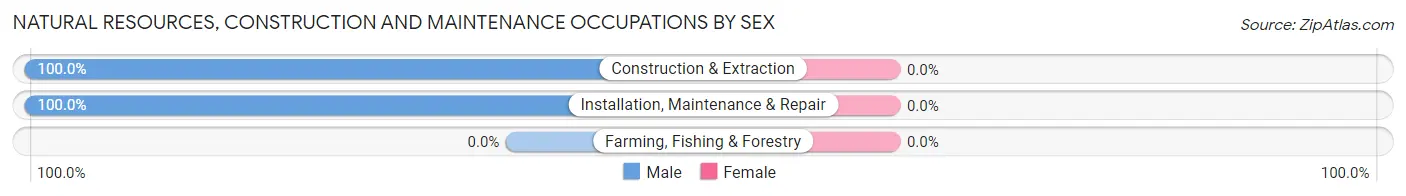
| Occupation | Male | Female |
| Farming, Fishing & Forestry | 0 (0.0%) | 0 (0.0%) |
| Construction & Extraction | 219 (100.0%) | 0 (0.0%) |
| Installation, Maintenance & Repair | 305 (100.0%) | 0 (0.0%) |
| Total (Category) | 524 (100.0%) | 0 (0.0%) |
| Total (Overall) | 2,836 (54.0%) | 2,420 (46.0%) |
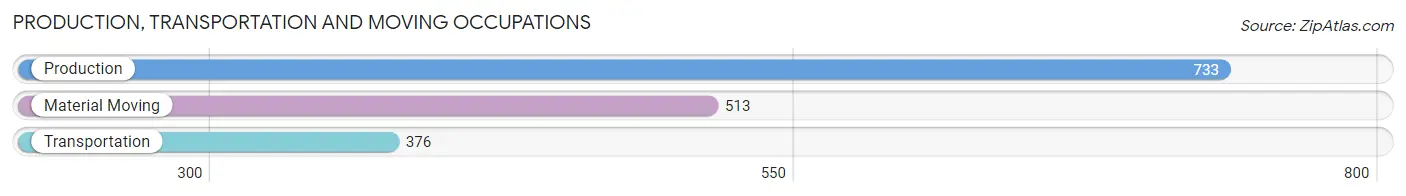
Production, Transportation and Moving Occupations
The most common Production, Transportation and Moving occupations in Excelsior Springs are Production (733 | 14.0%), Material Moving (513 | 9.8%), and Transportation (376 | 7.1%).
Production, Transportation and Moving Occupations by Sex
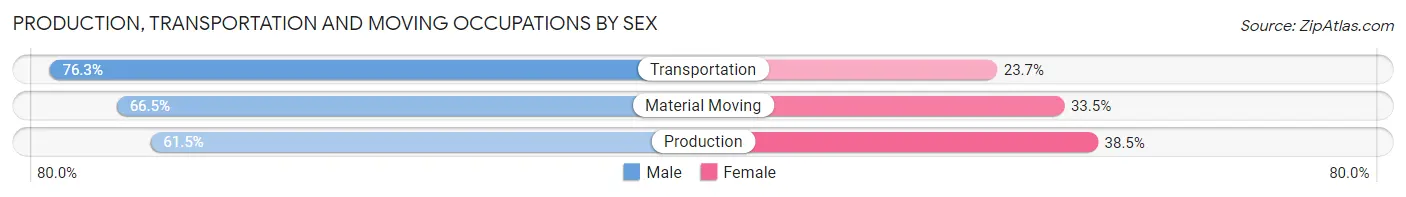
| Occupation | Male | Female |
| Production | 451 (61.5%) | 282 (38.5%) |
| Transportation | 287 (76.3%) | 89 (23.7%) |
| Material Moving | 341 (66.5%) | 172 (33.5%) |
| Total (Category) | 1,079 (66.5%) | 543 (33.5%) |
| Total (Overall) | 2,836 (54.0%) | 2,420 (46.0%) |
Employment Industries by Sex in Excelsior Springs
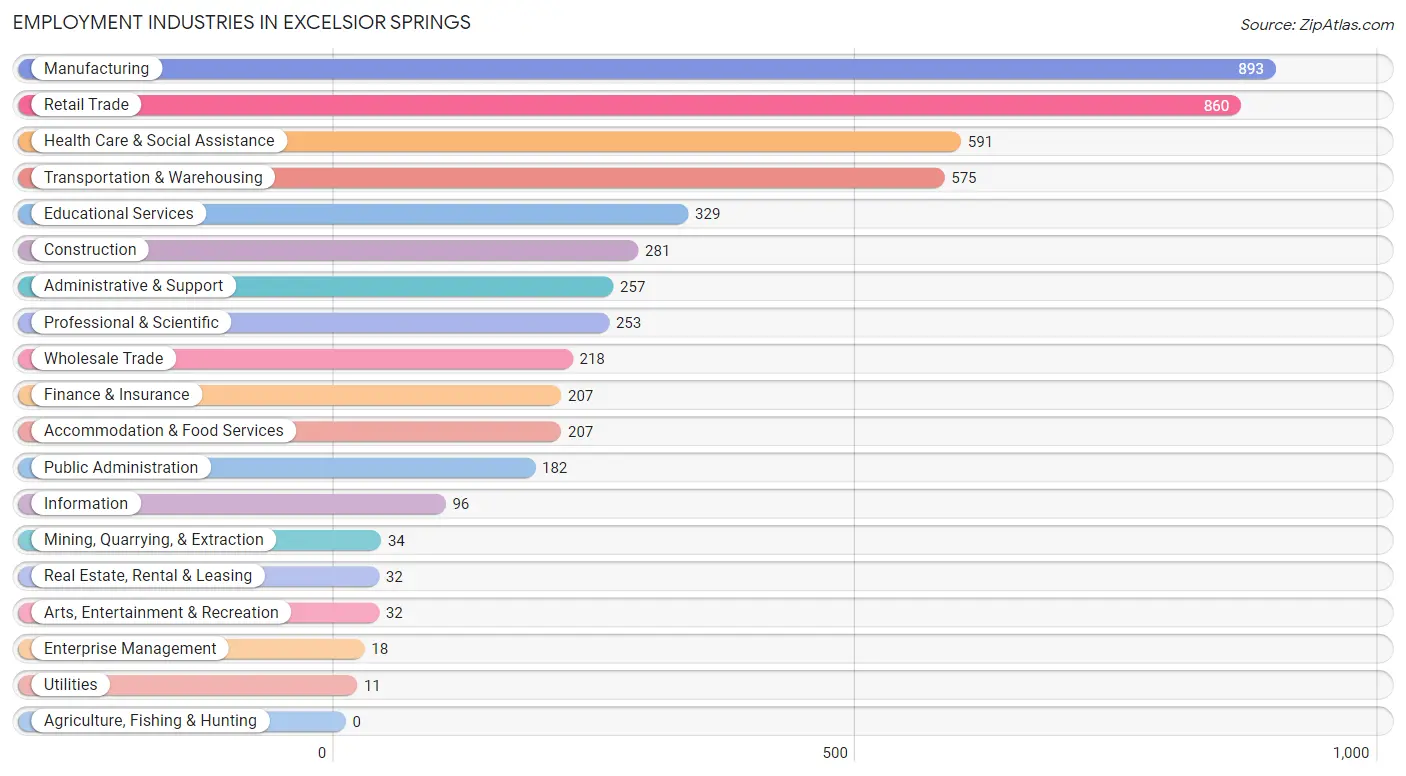
Employment Industries in Excelsior Springs
The major employment industries in Excelsior Springs include Manufacturing (893 | 17.0%), Retail Trade (860 | 16.4%), Health Care & Social Assistance (591 | 11.2%), Transportation & Warehousing (575 | 10.9%), and Educational Services (329 | 6.3%).
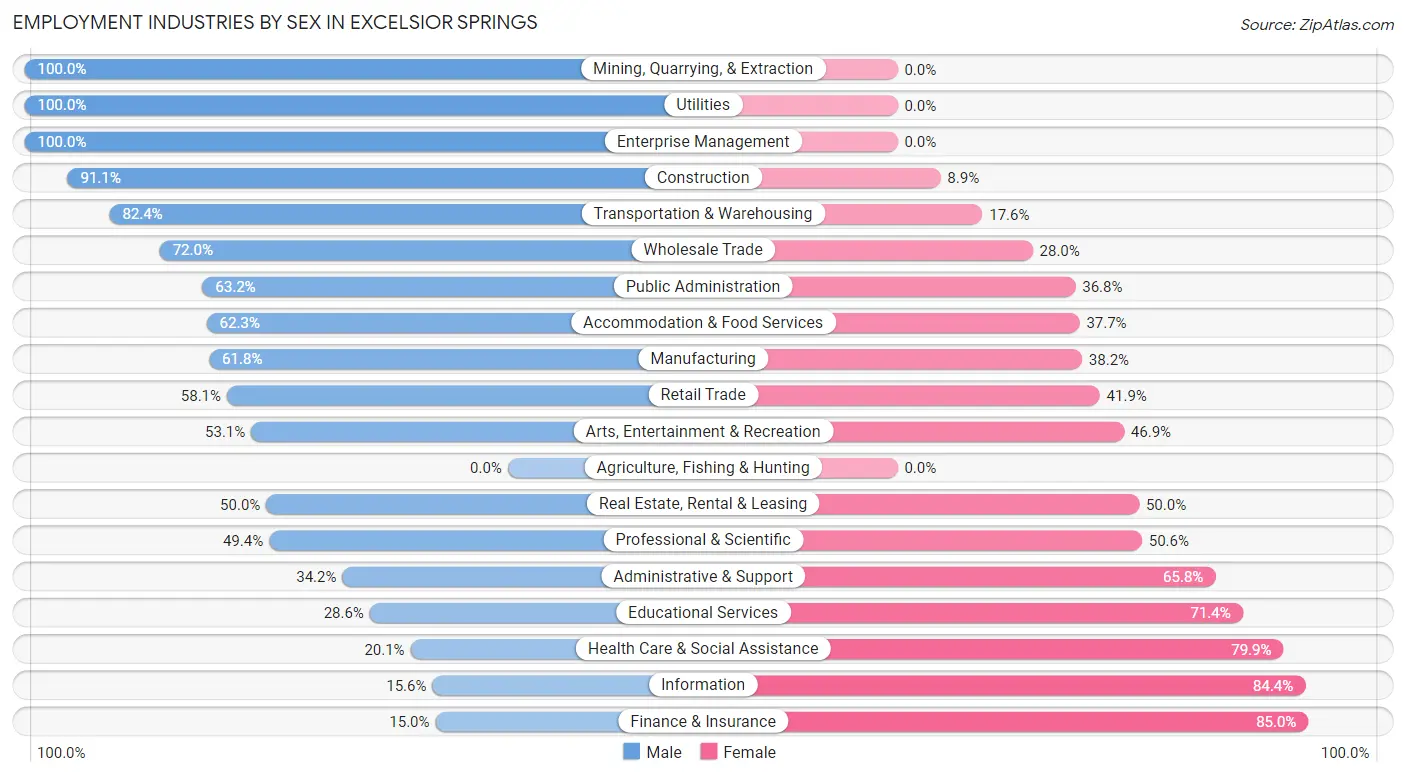
Employment Industries by Sex in Excelsior Springs
The Excelsior Springs industries that see more men than women are Mining, Quarrying, & Extraction (100.0%), Utilities (100.0%), and Enterprise Management (100.0%), whereas the industries that tend to have a higher number of women are Finance & Insurance (85.0%), Information (84.4%), and Health Care & Social Assistance (79.9%).
| Industry | Male | Female |
| Agriculture, Fishing & Hunting | 0 (0.0%) | 0 (0.0%) |
| Mining, Quarrying, & Extraction | 34 (100.0%) | 0 (0.0%) |
| Construction | 256 (91.1%) | 25 (8.9%) |
| Manufacturing | 552 (61.8%) | 341 (38.2%) |
| Wholesale Trade | 157 (72.0%) | 61 (28.0%) |
| Retail Trade | 500 (58.1%) | 360 (41.9%) |
| Transportation & Warehousing | 474 (82.4%) | 101 (17.6%) |
| Utilities | 11 (100.0%) | 0 (0.0%) |
| Information | 15 (15.6%) | 81 (84.4%) |
| Finance & Insurance | 31 (15.0%) | 176 (85.0%) |
| Real Estate, Rental & Leasing | 16 (50.0%) | 16 (50.0%) |
| Professional & Scientific | 125 (49.4%) | 128 (50.6%) |
| Enterprise Management | 18 (100.0%) | 0 (0.0%) |
| Administrative & Support | 88 (34.2%) | 169 (65.8%) |
| Educational Services | 94 (28.6%) | 235 (71.4%) |
| Health Care & Social Assistance | 119 (20.1%) | 472 (79.9%) |
| Arts, Entertainment & Recreation | 17 (53.1%) | 15 (46.9%) |
| Accommodation & Food Services | 129 (62.3%) | 78 (37.7%) |
| Public Administration | 115 (63.2%) | 67 (36.8%) |
| Total | 2,836 (54.0%) | 2,420 (46.0%) |
Education in Excelsior Springs
School Enrollment in Excelsior Springs
The most common levels of schooling among the 2,354 students in Excelsior Springs are high school (656 | 27.9%), elementary school (546 | 23.2%), and middle school (540 | 22.9%).
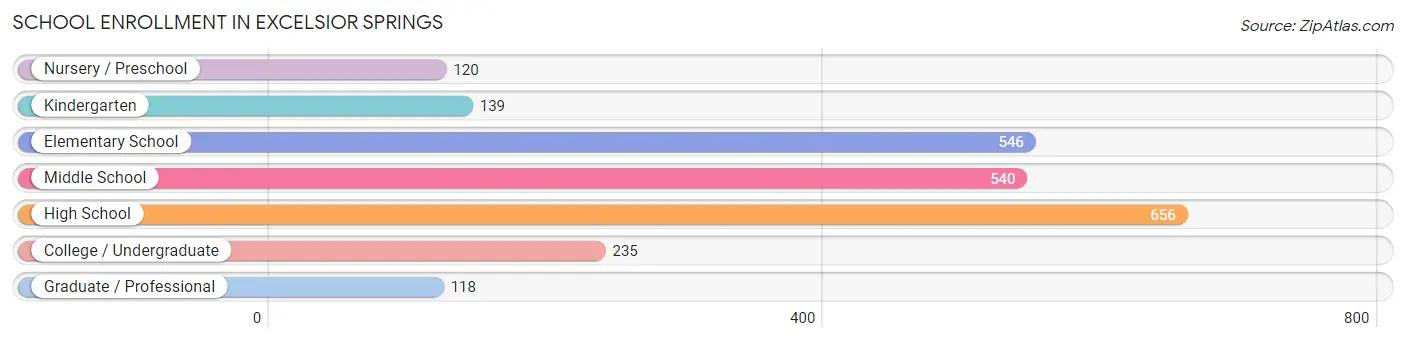
| School Level | # Students | % Students |
| Nursery / Preschool | 120 | 5.1% |
| Kindergarten | 139 | 5.9% |
| Elementary School | 546 | 23.2% |
| Middle School | 540 | 22.9% |
| High School | 656 | 27.9% |
| College / Undergraduate | 235 | 10.0% |
| Graduate / Professional | 118 | 5.0% |
| Total | 2,354 | 100.0% |
School Enrollment by Age by Funding Source in Excelsior Springs
Out of a total of 2,354 students who are enrolled in schools in Excelsior Springs, 273 (11.6%) attend a private institution, while the remaining 2,081 (88.4%) are enrolled in public schools. The age group of 25 to 34 year olds has the highest likelihood of being enrolled in private schools, with 98 (100.0% in the age bracket) enrolled. Conversely, the age group of 15 to 17 year olds has the lowest likelihood of being enrolled in a private school, with 334 (100.0% in the age bracket) attending a public institution.
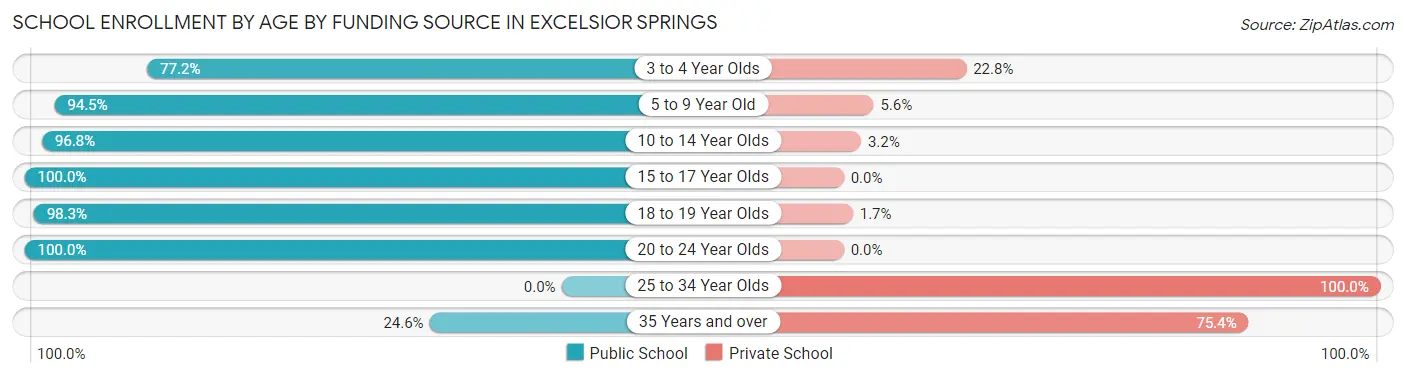
| Age Bracket | Public School | Private School |
| 3 to 4 Year Olds | 71 (77.2%) | 21 (22.8%) |
| 5 to 9 Year Old | 579 (94.5%) | 34 (5.6%) |
| 10 to 14 Year Olds | 721 (96.8%) | 24 (3.2%) |
| 15 to 17 Year Olds | 334 (100.0%) | 0 (0.0%) |
| 18 to 19 Year Olds | 231 (98.3%) | 4 (1.7%) |
| 20 to 24 Year Olds | 115 (100.0%) | 0 (0.0%) |
| 25 to 34 Year Olds | 0 (0.0%) | 98 (100.0%) |
| 35 Years and over | 30 (24.6%) | 92 (75.4%) |
| Total | 2,081 (88.4%) | 273 (11.6%) |
Educational Attainment by Field of Study in Excelsior Springs
Business (379 | 29.7%), education (373 | 29.2%), science & technology (151 | 11.8%), physical & health sciences (86 | 6.7%), and psychology (70 | 5.5%) are the most common fields of study among 1,276 individuals in Excelsior Springs who have obtained a bachelor's degree or higher.
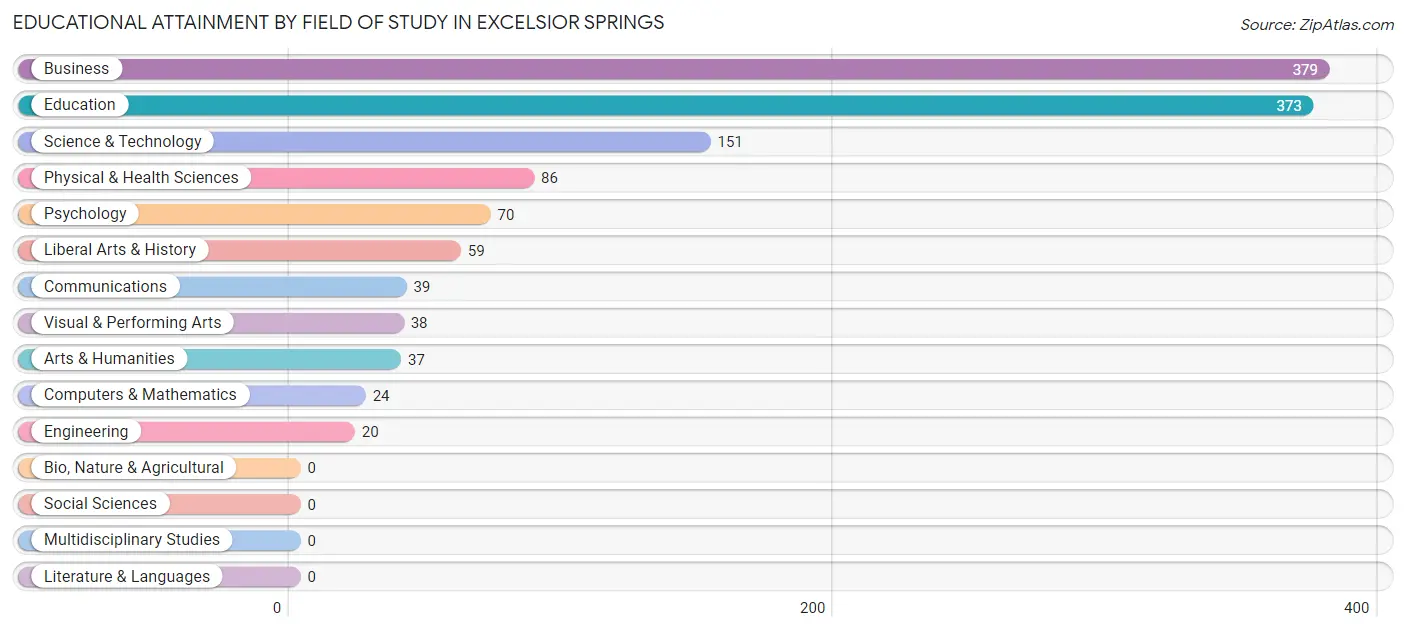
| Field of Study | # Graduates | % Graduates |
| Computers & Mathematics | 24 | 1.9% |
| Bio, Nature & Agricultural | 0 | 0.0% |
| Physical & Health Sciences | 86 | 6.7% |
| Psychology | 70 | 5.5% |
| Social Sciences | 0 | 0.0% |
| Engineering | 20 | 1.6% |
| Multidisciplinary Studies | 0 | 0.0% |
| Science & Technology | 151 | 11.8% |
| Business | 379 | 29.7% |
| Education | 373 | 29.2% |
| Literature & Languages | 0 | 0.0% |
| Liberal Arts & History | 59 | 4.6% |
| Visual & Performing Arts | 38 | 3.0% |
| Communications | 39 | 3.1% |
| Arts & Humanities | 37 | 2.9% |
| Total | 1,276 | 100.0% |
Transportation & Commute in Excelsior Springs
Vehicle Availability by Sex in Excelsior Springs
The most prevalent vehicle ownership categories in Excelsior Springs are males with 2 vehicles (1,054, accounting for 38.2%) and females with 2 vehicles (739, making up 43.7%).
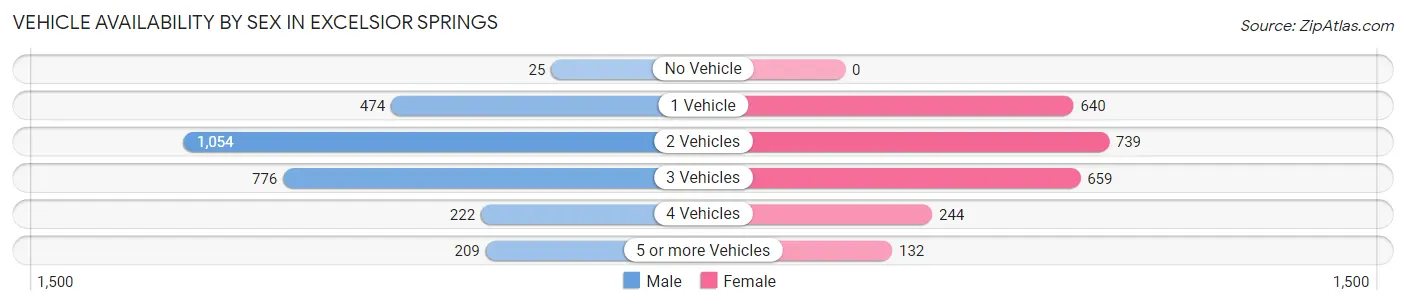
| Vehicles Available | Male | Female |
| No Vehicle | 25 (0.9%) | 0 (0.0%) |
| 1 Vehicle | 474 (17.2%) | 640 (26.5%) |
| 2 Vehicles | 1,054 (38.2%) | 739 (30.6%) |
| 3 Vehicles | 776 (28.1%) | 659 (27.3%) |
| 4 Vehicles | 222 (8.0%) | 244 (10.1%) |
| 5 or more Vehicles | 209 (7.6%) | 132 (5.5%) |
| Total | 2,760 (100.0%) | 2,414 (100.0%) |
Commute Time in Excelsior Springs
The most frequently occuring commute durations in Excelsior Springs are 5 to 9 minutes (813 commuters, 16.6%), 20 to 24 minutes (629 commuters, 12.9%), and 15 to 19 minutes (562 commuters, 11.5%).
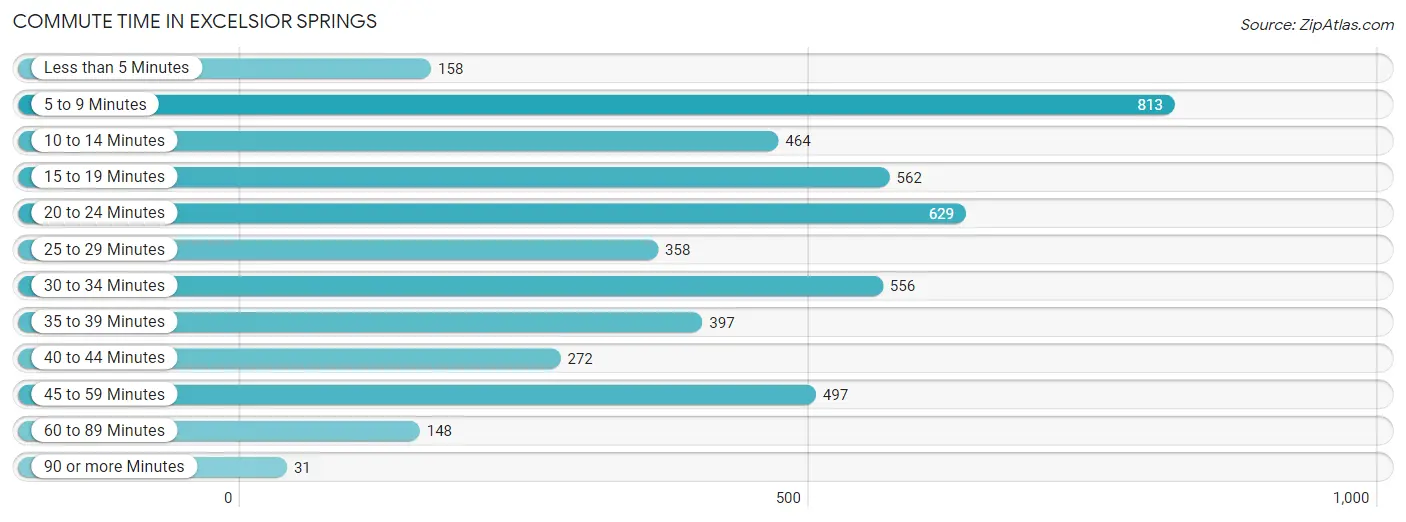
| Commute Time | # Commuters | % Commuters |
| Less than 5 Minutes | 158 | 3.2% |
| 5 to 9 Minutes | 813 | 16.6% |
| 10 to 14 Minutes | 464 | 9.5% |
| 15 to 19 Minutes | 562 | 11.5% |
| 20 to 24 Minutes | 629 | 12.9% |
| 25 to 29 Minutes | 358 | 7.3% |
| 30 to 34 Minutes | 556 | 11.4% |
| 35 to 39 Minutes | 397 | 8.1% |
| 40 to 44 Minutes | 272 | 5.6% |
| 45 to 59 Minutes | 497 | 10.2% |
| 60 to 89 Minutes | 148 | 3.0% |
| 90 or more Minutes | 31 | 0.6% |
Commute Time by Sex in Excelsior Springs
The most common commute times in Excelsior Springs are 30 to 34 minutes (318 commuters, 12.4%) for males and 5 to 9 minutes (511 commuters, 22.0%) for females.
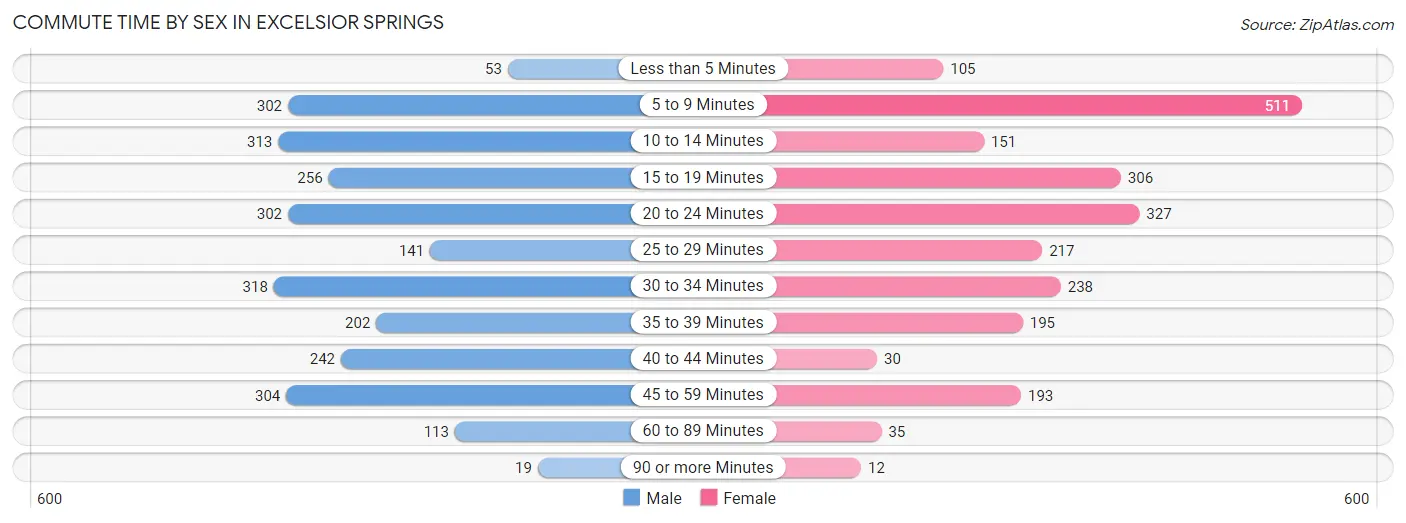
| Commute Time | Male | Female |
| Less than 5 Minutes | 53 (2.1%) | 105 (4.5%) |
| 5 to 9 Minutes | 302 (11.8%) | 511 (22.0%) |
| 10 to 14 Minutes | 313 (12.2%) | 151 (6.5%) |
| 15 to 19 Minutes | 256 (10.0%) | 306 (13.2%) |
| 20 to 24 Minutes | 302 (11.8%) | 327 (14.1%) |
| 25 to 29 Minutes | 141 (5.5%) | 217 (9.3%) |
| 30 to 34 Minutes | 318 (12.4%) | 238 (10.3%) |
| 35 to 39 Minutes | 202 (7.9%) | 195 (8.4%) |
| 40 to 44 Minutes | 242 (9.4%) | 30 (1.3%) |
| 45 to 59 Minutes | 304 (11.8%) | 193 (8.3%) |
| 60 to 89 Minutes | 113 (4.4%) | 35 (1.5%) |
| 90 or more Minutes | 19 (0.7%) | 12 (0.5%) |
Time of Departure to Work by Sex in Excelsior Springs
The most frequent times of departure to work in Excelsior Springs are 6:00 AM to 6:29 AM (628, 24.5%) for males and 7:00 AM to 7:29 AM (520, 22.4%) for females.
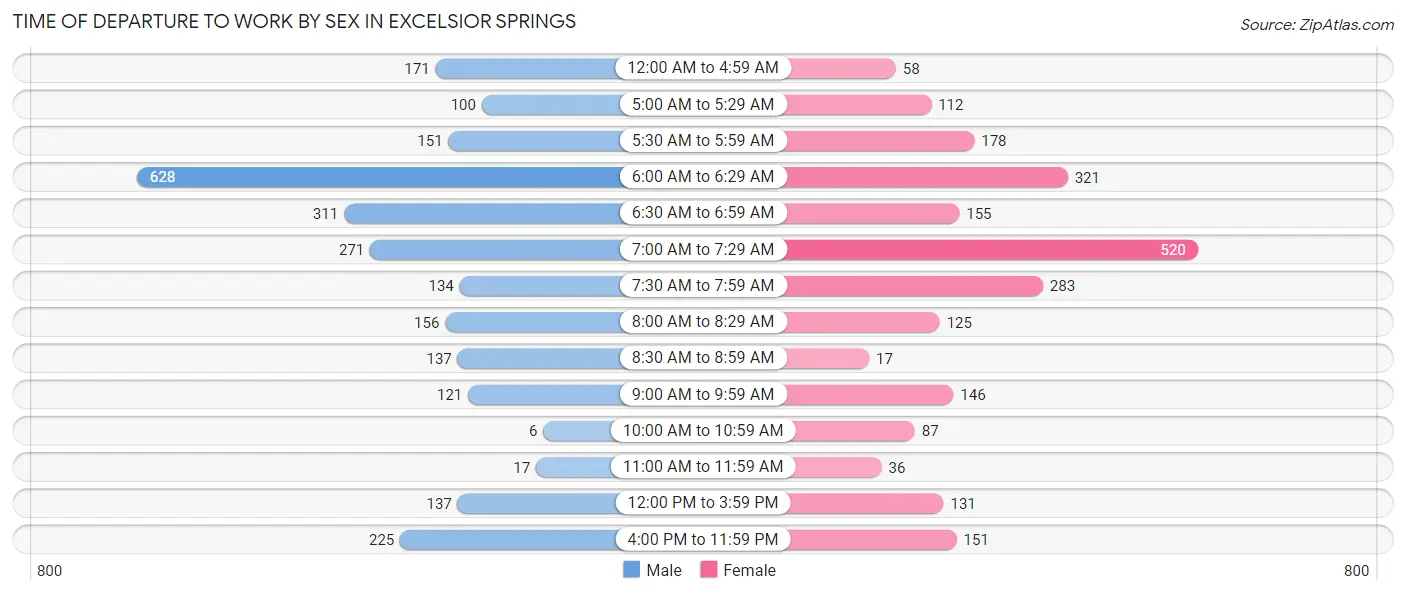
| Time of Departure | Male | Female |
| 12:00 AM to 4:59 AM | 171 (6.7%) | 58 (2.5%) |
| 5:00 AM to 5:29 AM | 100 (3.9%) | 112 (4.8%) |
| 5:30 AM to 5:59 AM | 151 (5.9%) | 178 (7.7%) |
| 6:00 AM to 6:29 AM | 628 (24.5%) | 321 (13.8%) |
| 6:30 AM to 6:59 AM | 311 (12.1%) | 155 (6.7%) |
| 7:00 AM to 7:29 AM | 271 (10.6%) | 520 (22.4%) |
| 7:30 AM to 7:59 AM | 134 (5.2%) | 283 (12.2%) |
| 8:00 AM to 8:29 AM | 156 (6.1%) | 125 (5.4%) |
| 8:30 AM to 8:59 AM | 137 (5.3%) | 17 (0.7%) |
| 9:00 AM to 9:59 AM | 121 (4.7%) | 146 (6.3%) |
| 10:00 AM to 10:59 AM | 6 (0.2%) | 87 (3.7%) |
| 11:00 AM to 11:59 AM | 17 (0.7%) | 36 (1.5%) |
| 12:00 PM to 3:59 PM | 137 (5.3%) | 131 (5.7%) |
| 4:00 PM to 11:59 PM | 225 (8.8%) | 151 (6.5%) |
| Total | 2,565 (100.0%) | 2,320 (100.0%) |
Housing Occupancy in Excelsior Springs
Occupancy by Ownership in Excelsior Springs
Of the total 3,853 dwellings in Excelsior Springs, owner-occupied units account for 2,450 (63.6%), while renter-occupied units make up 1,403 (36.4%).
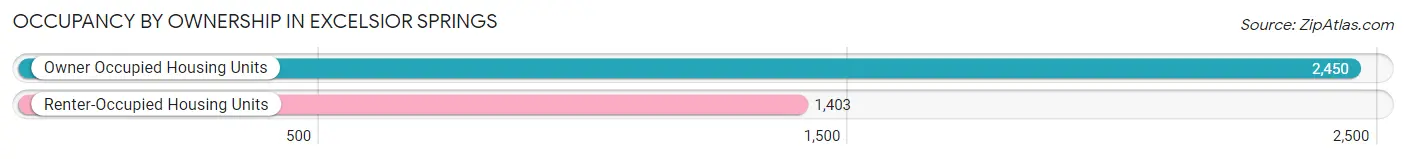
| Occupancy | # Housing Units | % Housing Units |
| Owner Occupied Housing Units | 2,450 | 63.6% |
| Renter-Occupied Housing Units | 1,403 | 36.4% |
| Total Occupied Housing Units | 3,853 | 100.0% |
Occupancy by Household Size in Excelsior Springs
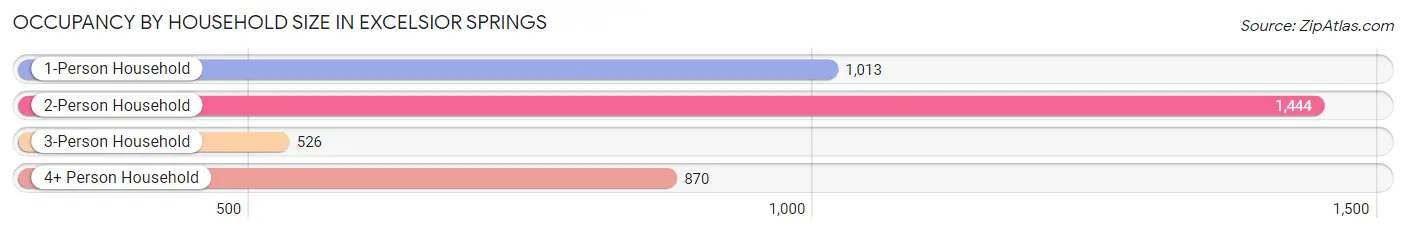
| Household Size | # Housing Units | % Housing Units |
| 1-Person Household | 1,013 | 26.3% |
| 2-Person Household | 1,444 | 37.5% |
| 3-Person Household | 526 | 13.7% |
| 4+ Person Household | 870 | 22.6% |
| Total Housing Units | 3,853 | 100.0% |
Occupancy by Ownership by Household Size in Excelsior Springs
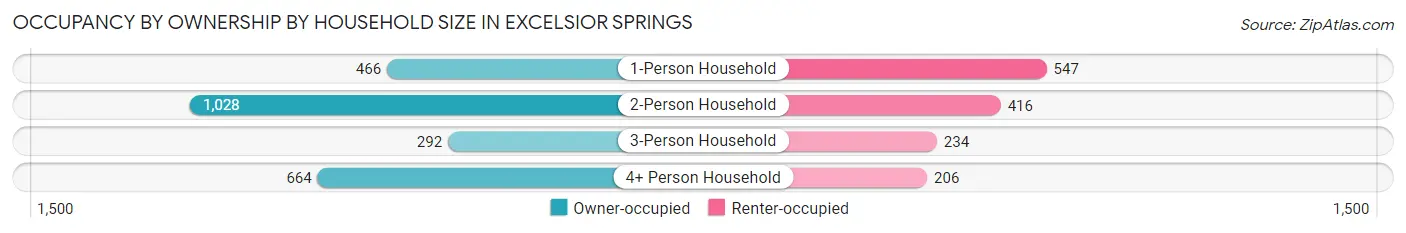
| Household Size | Owner-occupied | Renter-occupied |
| 1-Person Household | 466 (46.0%) | 547 (54.0%) |
| 2-Person Household | 1,028 (71.2%) | 416 (28.8%) |
| 3-Person Household | 292 (55.5%) | 234 (44.5%) |
| 4+ Person Household | 664 (76.3%) | 206 (23.7%) |
| Total Housing Units | 2,450 (63.6%) | 1,403 (36.4%) |
Occupancy by Educational Attainment in Excelsior Springs
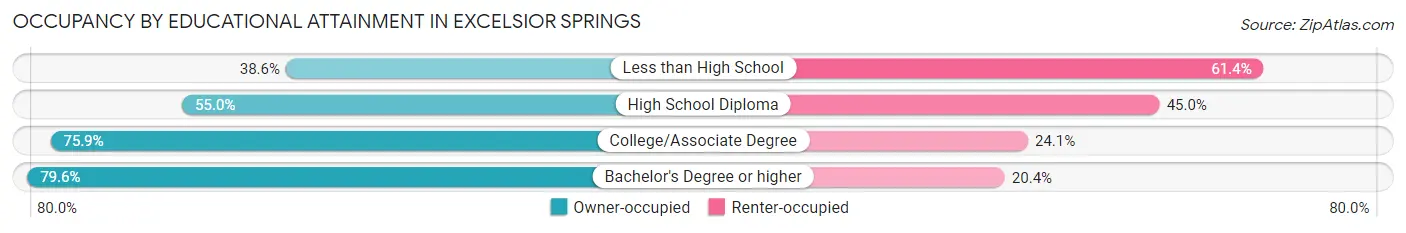
| Household Size | Owner-occupied | Renter-occupied |
| Less than High School | 194 (38.6%) | 309 (61.4%) |
| High School Diploma | 821 (55.0%) | 671 (45.0%) |
| College/Associate Degree | 901 (75.9%) | 286 (24.1%) |
| Bachelor's Degree or higher | 534 (79.6%) | 137 (20.4%) |
Occupancy by Age of Householder in Excelsior Springs
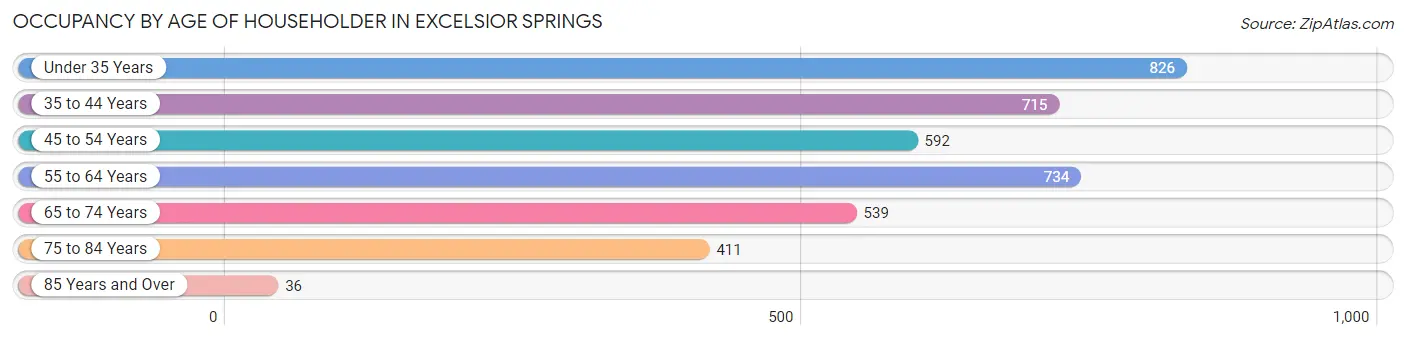
| Age Bracket | # Households | % Households |
| Under 35 Years | 826 | 21.4% |
| 35 to 44 Years | 715 | 18.6% |
| 45 to 54 Years | 592 | 15.4% |
| 55 to 64 Years | 734 | 19.1% |
| 65 to 74 Years | 539 | 14.0% |
| 75 to 84 Years | 411 | 10.7% |
| 85 Years and Over | 36 | 0.9% |
| Total | 3,853 | 100.0% |
Housing Finances in Excelsior Springs
Median Income by Occupancy in Excelsior Springs
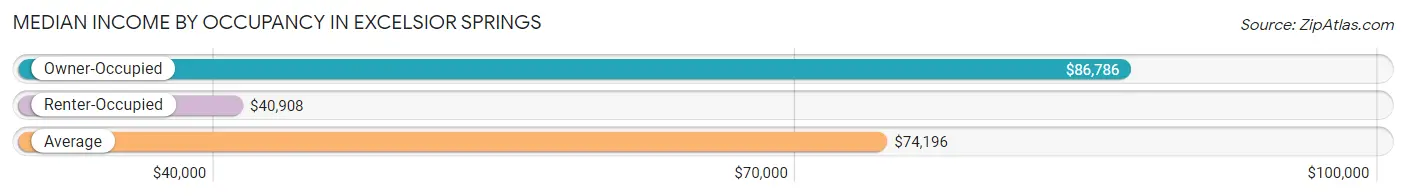
| Occupancy Type | # Households | Median Income |
| Owner-Occupied | 2,450 (63.6%) | $86,786 |
| Renter-Occupied | 1,403 (36.4%) | $40,908 |
| Average | 3,853 (100.0%) | $74,196 |
Occupancy by Householder Income Bracket in Excelsior Springs
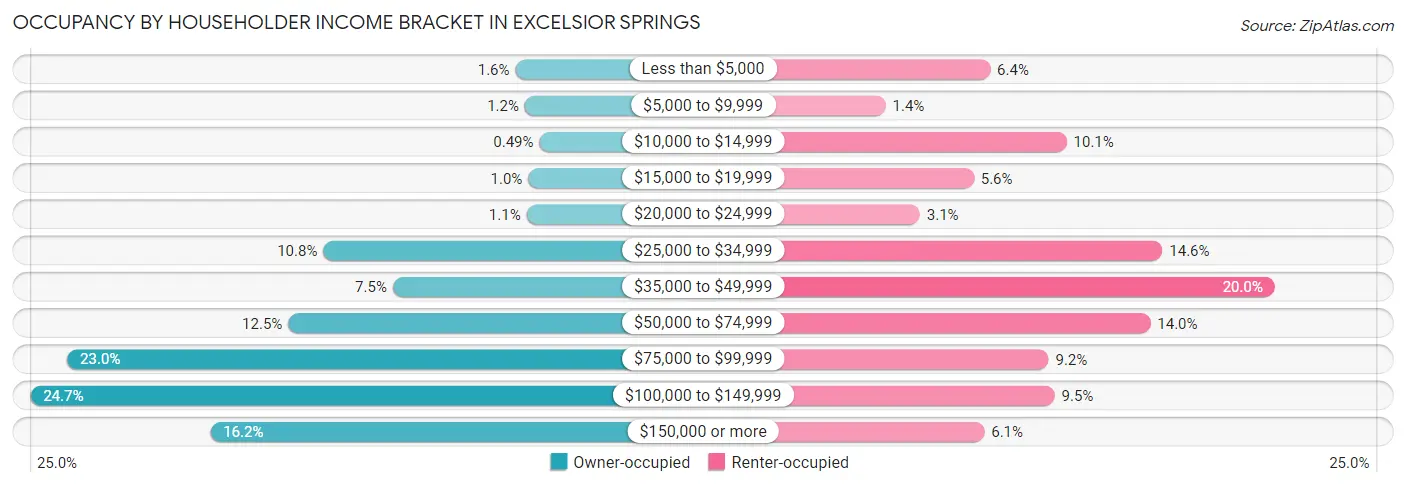
| Income Bracket | Owner-occupied | Renter-occupied |
| Less than $5,000 | 40 (1.6%) | 90 (6.4%) |
| $5,000 to $9,999 | 29 (1.2%) | 20 (1.4%) |
| $10,000 to $14,999 | 12 (0.5%) | 141 (10.1%) |
| $15,000 to $19,999 | 25 (1.0%) | 79 (5.6%) |
| $20,000 to $24,999 | 27 (1.1%) | 43 (3.1%) |
| $25,000 to $34,999 | 264 (10.8%) | 205 (14.6%) |
| $35,000 to $49,999 | 183 (7.5%) | 280 (20.0%) |
| $50,000 to $74,999 | 305 (12.4%) | 197 (14.0%) |
| $75,000 to $99,999 | 563 (23.0%) | 129 (9.2%) |
| $100,000 to $149,999 | 606 (24.7%) | 133 (9.5%) |
| $150,000 or more | 396 (16.2%) | 86 (6.1%) |
| Total | 2,450 (100.0%) | 1,403 (100.0%) |
Monthly Housing Cost Tiers in Excelsior Springs
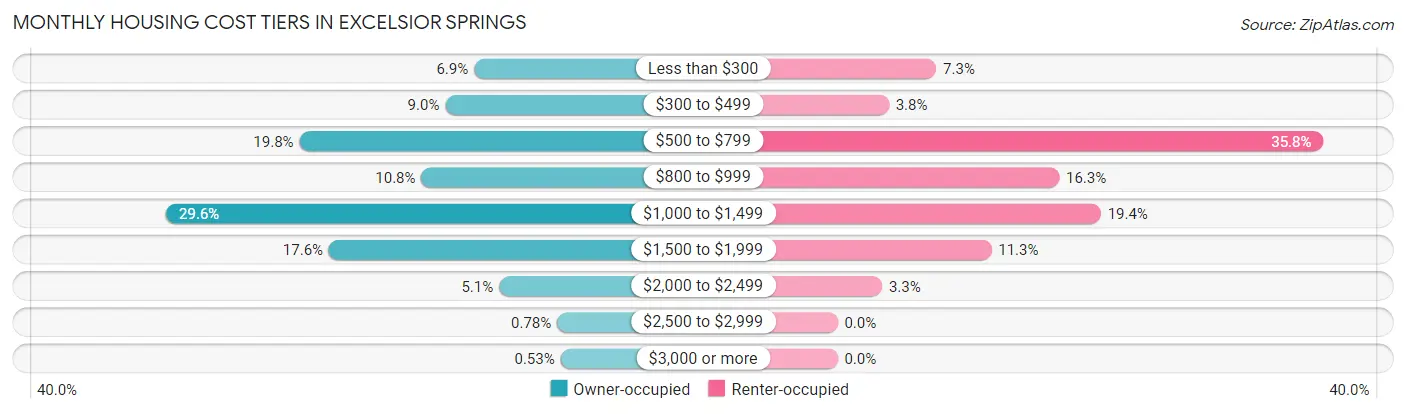
| Monthly Cost | Owner-occupied | Renter-occupied |
| Less than $300 | 169 (6.9%) | 102 (7.3%) |
| $300 to $499 | 221 (9.0%) | 53 (3.8%) |
| $500 to $799 | 484 (19.8%) | 502 (35.8%) |
| $800 to $999 | 264 (10.8%) | 229 (16.3%) |
| $1,000 to $1,499 | 725 (29.6%) | 272 (19.4%) |
| $1,500 to $1,999 | 431 (17.6%) | 159 (11.3%) |
| $2,000 to $2,499 | 124 (5.1%) | 46 (3.3%) |
| $2,500 to $2,999 | 19 (0.8%) | 0 (0.0%) |
| $3,000 or more | 13 (0.5%) | 0 (0.0%) |
| Total | 2,450 (100.0%) | 1,403 (100.0%) |
Physical Housing Characteristics in Excelsior Springs
Housing Structures in Excelsior Springs
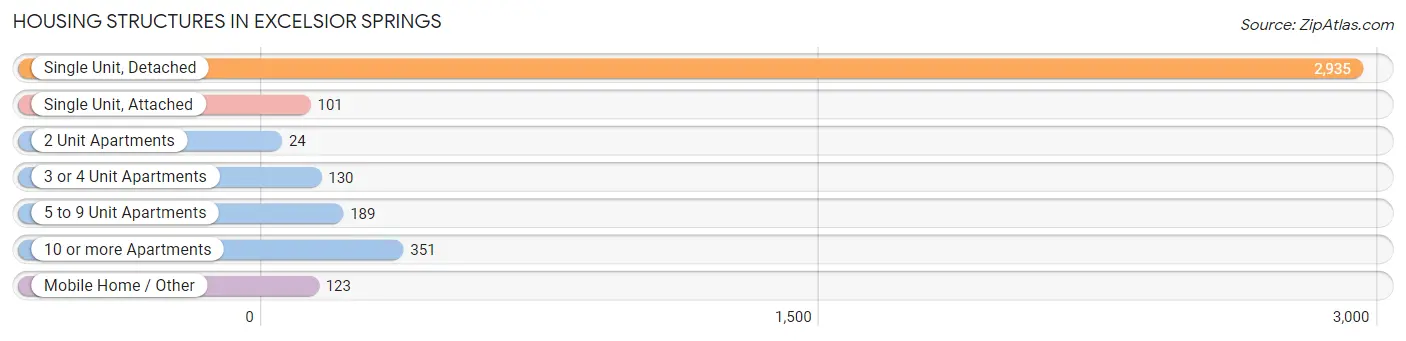
| Structure Type | # Housing Units | % Housing Units |
| Single Unit, Detached | 2,935 | 76.2% |
| Single Unit, Attached | 101 | 2.6% |
| 2 Unit Apartments | 24 | 0.6% |
| 3 or 4 Unit Apartments | 130 | 3.4% |
| 5 to 9 Unit Apartments | 189 | 4.9% |
| 10 or more Apartments | 351 | 9.1% |
| Mobile Home / Other | 123 | 3.2% |
| Total | 3,853 | 100.0% |
Housing Structures by Occupancy in Excelsior Springs
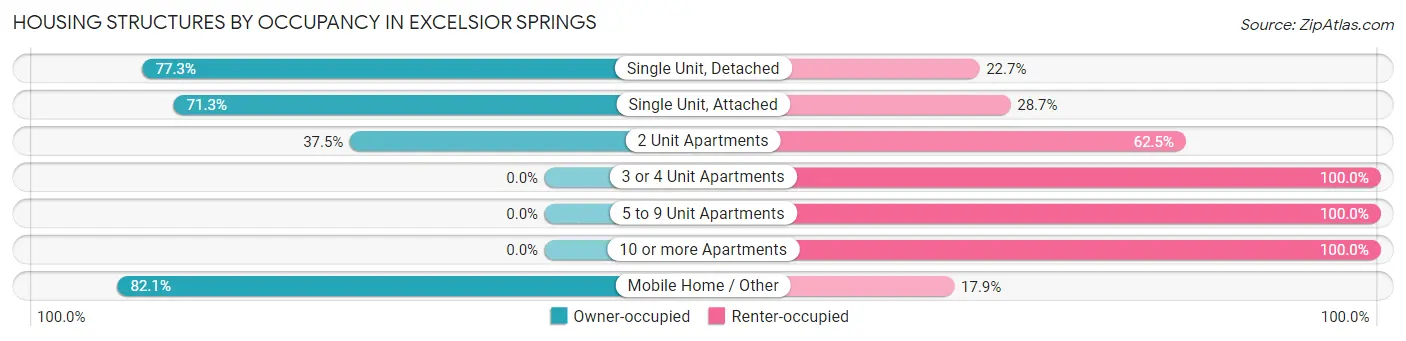
| Structure Type | Owner-occupied | Renter-occupied |
| Single Unit, Detached | 2,268 (77.3%) | 667 (22.7%) |
| Single Unit, Attached | 72 (71.3%) | 29 (28.7%) |
| 2 Unit Apartments | 9 (37.5%) | 15 (62.5%) |
| 3 or 4 Unit Apartments | 0 (0.0%) | 130 (100.0%) |
| 5 to 9 Unit Apartments | 0 (0.0%) | 189 (100.0%) |
| 10 or more Apartments | 0 (0.0%) | 351 (100.0%) |
| Mobile Home / Other | 101 (82.1%) | 22 (17.9%) |
| Total | 2,450 (63.6%) | 1,403 (36.4%) |
Housing Structures by Number of Rooms in Excelsior Springs
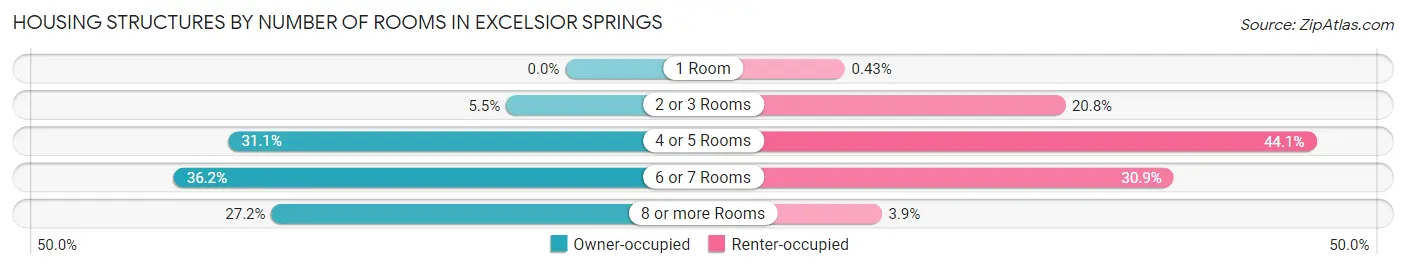
| Number of Rooms | Owner-occupied | Renter-occupied |
| 1 Room | 0 (0.0%) | 6 (0.4%) |
| 2 or 3 Rooms | 134 (5.5%) | 292 (20.8%) |
| 4 or 5 Rooms | 763 (31.1%) | 618 (44.1%) |
| 6 or 7 Rooms | 887 (36.2%) | 433 (30.9%) |
| 8 or more Rooms | 666 (27.2%) | 54 (3.8%) |
| Total | 2,450 (100.0%) | 1,403 (100.0%) |
Housing Structure by Heating Type in Excelsior Springs
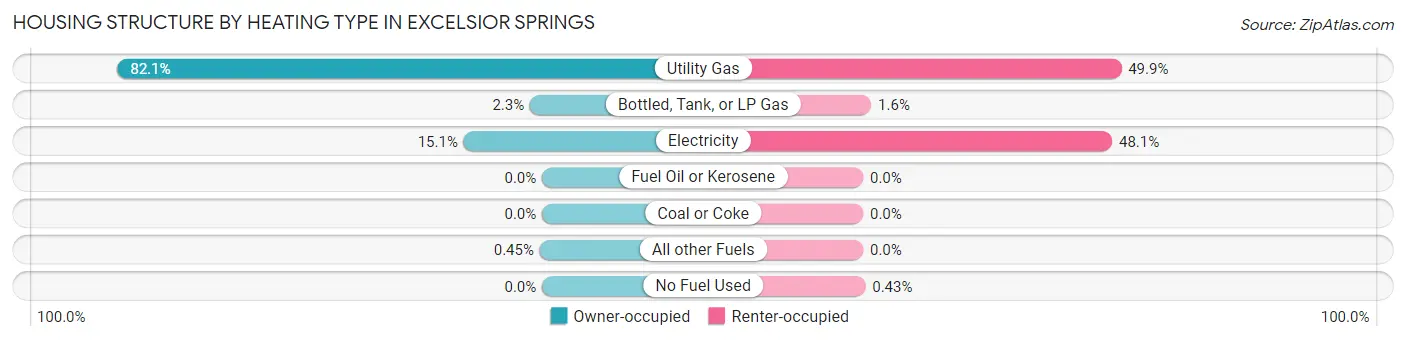
| Heating Type | Owner-occupied | Renter-occupied |
| Utility Gas | 2,011 (82.1%) | 700 (49.9%) |
| Bottled, Tank, or LP Gas | 57 (2.3%) | 22 (1.6%) |
| Electricity | 371 (15.1%) | 675 (48.1%) |
| Fuel Oil or Kerosene | 0 (0.0%) | 0 (0.0%) |
| Coal or Coke | 0 (0.0%) | 0 (0.0%) |
| All other Fuels | 11 (0.4%) | 0 (0.0%) |
| No Fuel Used | 0 (0.0%) | 6 (0.4%) |
| Total | 2,450 (100.0%) | 1,403 (100.0%) |
Household Vehicle Usage in Excelsior Springs
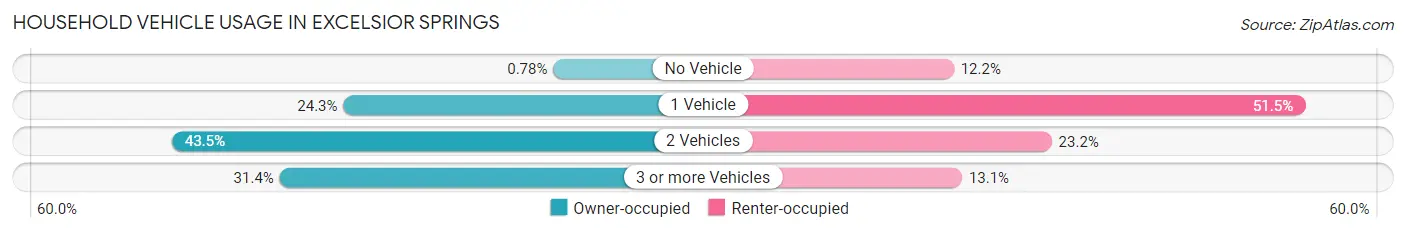
| Vehicles per Household | Owner-occupied | Renter-occupied |
| No Vehicle | 19 (0.8%) | 171 (12.2%) |
| 1 Vehicle | 595 (24.3%) | 723 (51.5%) |
| 2 Vehicles | 1,066 (43.5%) | 325 (23.2%) |
| 3 or more Vehicles | 770 (31.4%) | 184 (13.1%) |
| Total | 2,450 (100.0%) | 1,403 (100.0%) |
Real Estate & Mortgages in Excelsior Springs
Real Estate and Mortgage Overview in Excelsior Springs
| Characteristic | Without Mortgage | With Mortgage |
| Housing Units | 871 | 1,579 |
| Median Property Value | $155,200 | $170,600 |
| Median Household Income | $59,297 | $354 |
| Monthly Housing Costs | $522 | $13 |
| Real Estate Taxes | $1,881 | $88 |
Property Value by Mortgage Status in Excelsior Springs
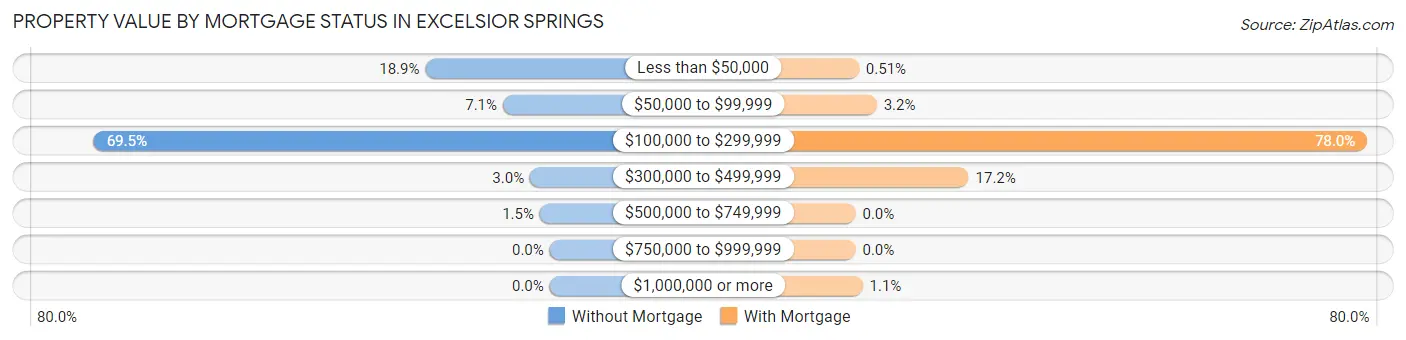
| Property Value | Without Mortgage | With Mortgage |
| Less than $50,000 | 165 (18.9%) | 8 (0.5%) |
| $50,000 to $99,999 | 62 (7.1%) | 51 (3.2%) |
| $100,000 to $299,999 | 605 (69.5%) | 1,231 (78.0%) |
| $300,000 to $499,999 | 26 (3.0%) | 272 (17.2%) |
| $500,000 to $749,999 | 13 (1.5%) | 0 (0.0%) |
| $750,000 to $999,999 | 0 (0.0%) | 0 (0.0%) |
| $1,000,000 or more | 0 (0.0%) | 17 (1.1%) |
| Total | 871 (100.0%) | 1,579 (100.0%) |
Household Income by Mortgage Status in Excelsior Springs
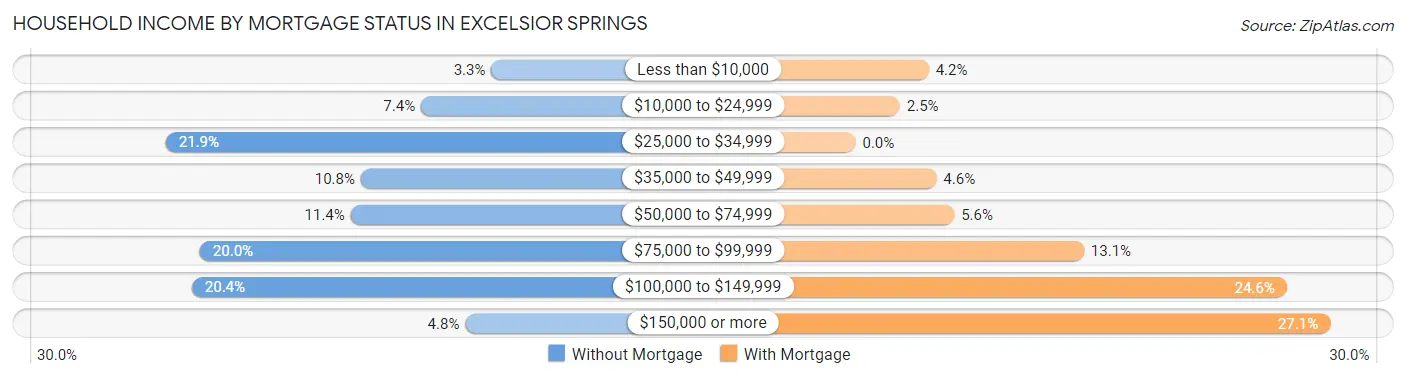
| Household Income | Without Mortgage | With Mortgage |
| Less than $10,000 | 29 (3.3%) | 66 (4.2%) |
| $10,000 to $24,999 | 64 (7.3%) | 40 (2.5%) |
| $25,000 to $34,999 | 191 (21.9%) | 0 (0.0%) |
| $35,000 to $49,999 | 94 (10.8%) | 73 (4.6%) |
| $50,000 to $74,999 | 99 (11.4%) | 89 (5.6%) |
| $75,000 to $99,999 | 174 (20.0%) | 206 (13.1%) |
| $100,000 to $149,999 | 178 (20.4%) | 389 (24.6%) |
| $150,000 or more | 42 (4.8%) | 428 (27.1%) |
| Total | 871 (100.0%) | 1,579 (100.0%) |
Property Value to Household Income Ratio in Excelsior Springs
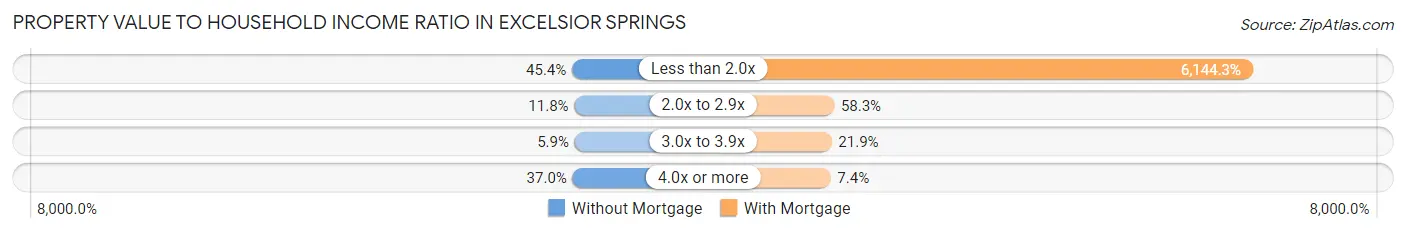
| Value-to-Income Ratio | Without Mortgage | With Mortgage |
| Less than 2.0x | 395 (45.4%) | 97,019 (6,144.3%) |
| 2.0x to 2.9x | 103 (11.8%) | 921 (58.3%) |
| 3.0x to 3.9x | 51 (5.9%) | 345 (21.8%) |
| 4.0x or more | 322 (37.0%) | 116 (7.3%) |
| Total | 871 (100.0%) | 1,579 (100.0%) |
Real Estate Taxes by Mortgage Status in Excelsior Springs
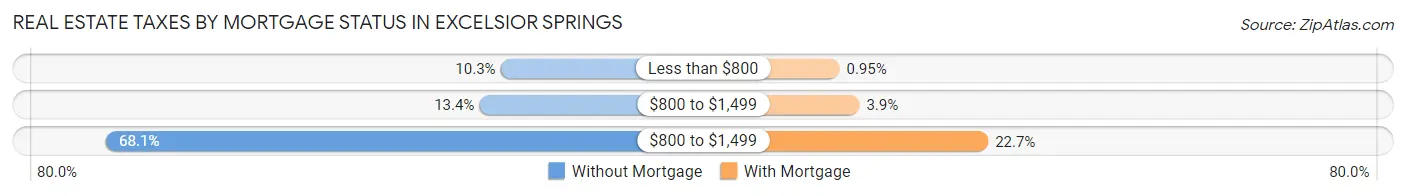
| Property Taxes | Without Mortgage | With Mortgage |
| Less than $800 | 90 (10.3%) | 15 (0.9%) |
| $800 to $1,499 | 117 (13.4%) | 61 (3.9%) |
| $800 to $1,499 | 593 (68.1%) | 358 (22.7%) |
| Total | 871 (100.0%) | 1,579 (100.0%) |
Health & Disability in Excelsior Springs
Health Insurance Coverage by Age in Excelsior Springs
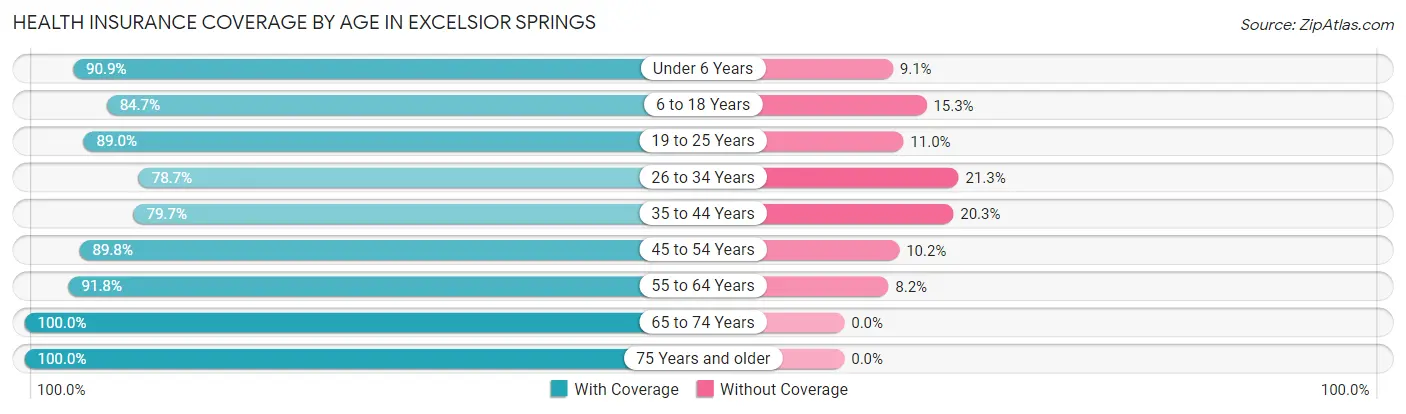
| Age Bracket | With Coverage | Without Coverage |
| Under 6 Years | 512 (90.9%) | 51 (9.1%) |
| 6 to 18 Years | 1,680 (84.7%) | 304 (15.3%) |
| 19 to 25 Years | 1,090 (89.0%) | 135 (11.0%) |
| 26 to 34 Years | 1,160 (78.7%) | 314 (21.3%) |
| 35 to 44 Years | 1,027 (79.7%) | 262 (20.3%) |
| 45 to 54 Years | 929 (89.8%) | 106 (10.2%) |
| 55 to 64 Years | 1,140 (91.8%) | 102 (8.2%) |
| 65 to 74 Years | 900 (100.0%) | 0 (0.0%) |
| 75 Years and older | 670 (100.0%) | 0 (0.0%) |
| Total | 9,108 (87.7%) | 1,274 (12.3%) |
Health Insurance Coverage by Citizenship Status in Excelsior Springs
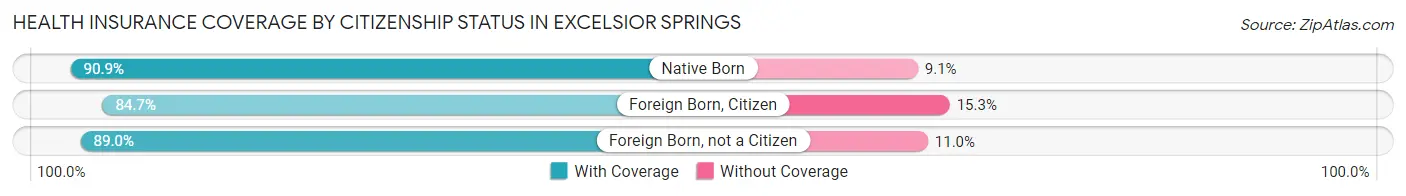
| Citizenship Status | With Coverage | Without Coverage |
| Native Born | 512 (90.9%) | 51 (9.1%) |
| Foreign Born, Citizen | 1,680 (84.7%) | 304 (15.3%) |
| Foreign Born, not a Citizen | 1,090 (89.0%) | 135 (11.0%) |
Health Insurance Coverage by Household Income in Excelsior Springs
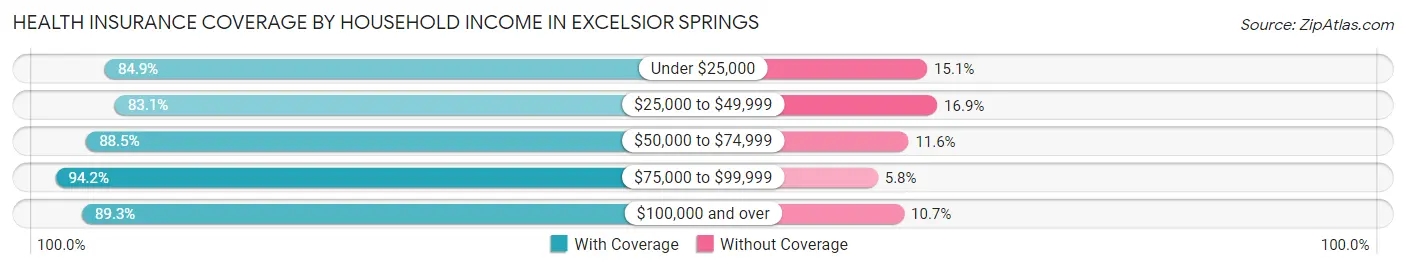
| Household Income | With Coverage | Without Coverage |
| Under $25,000 | 660 (84.9%) | 117 (15.1%) |
| $25,000 to $49,999 | 1,732 (83.1%) | 353 (16.9%) |
| $50,000 to $74,999 | 988 (88.4%) | 129 (11.6%) |
| $75,000 to $99,999 | 1,914 (94.2%) | 118 (5.8%) |
| $100,000 and over | 3,573 (89.3%) | 430 (10.7%) |
Public vs Private Health Insurance Coverage by Age in Excelsior Springs
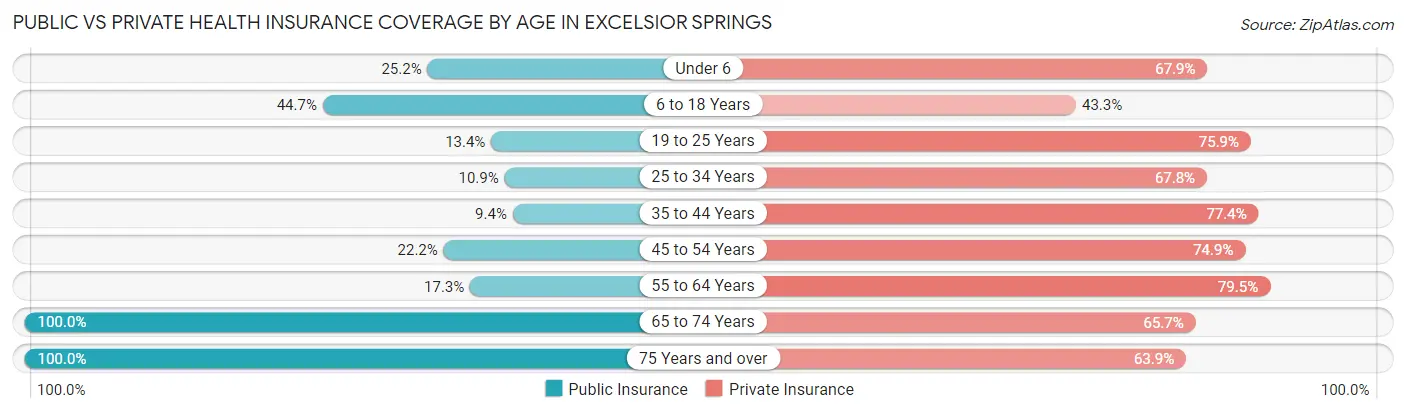
| Age Bracket | Public Insurance | Private Insurance |
| Under 6 | 142 (25.2%) | 382 (67.8%) |
| 6 to 18 Years | 886 (44.7%) | 859 (43.3%) |
| 19 to 25 Years | 164 (13.4%) | 930 (75.9%) |
| 25 to 34 Years | 161 (10.9%) | 999 (67.8%) |
| 35 to 44 Years | 121 (9.4%) | 997 (77.3%) |
| 45 to 54 Years | 230 (22.2%) | 775 (74.9%) |
| 55 to 64 Years | 215 (17.3%) | 987 (79.5%) |
| 65 to 74 Years | 900 (100.0%) | 591 (65.7%) |
| 75 Years and over | 670 (100.0%) | 428 (63.9%) |
| Total | 3,489 (33.6%) | 6,948 (66.9%) |
Disability Status by Sex by Age in Excelsior Springs
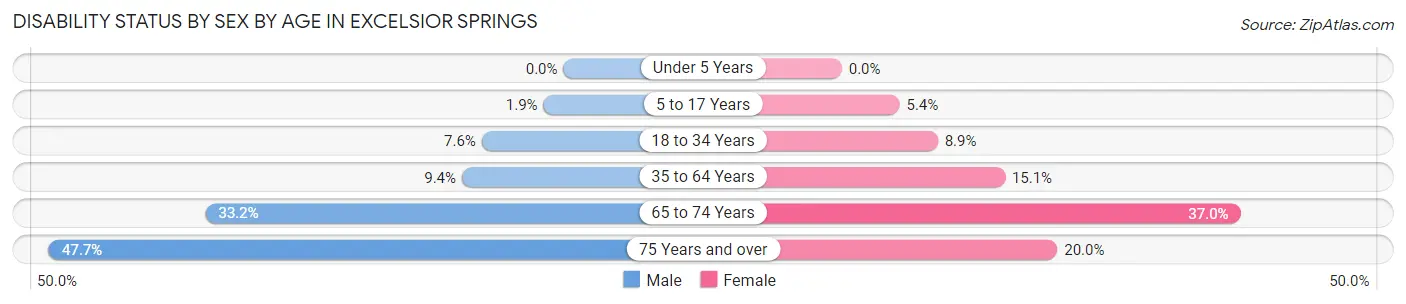
| Age Bracket | Male | Female |
| Under 5 Years | 0 (0.0%) | 0 (0.0%) |
| 5 to 17 Years | 15 (1.8%) | 54 (5.4%) |
| 18 to 34 Years | 127 (7.6%) | 115 (8.9%) |
| 35 to 64 Years | 166 (9.4%) | 273 (15.1%) |
| 65 to 74 Years | 105 (33.2%) | 216 (37.0%) |
| 75 Years and over | 148 (47.7%) | 72 (20.0%) |
Disability Class by Sex by Age in Excelsior Springs
Disability Class: Hearing Difficulty
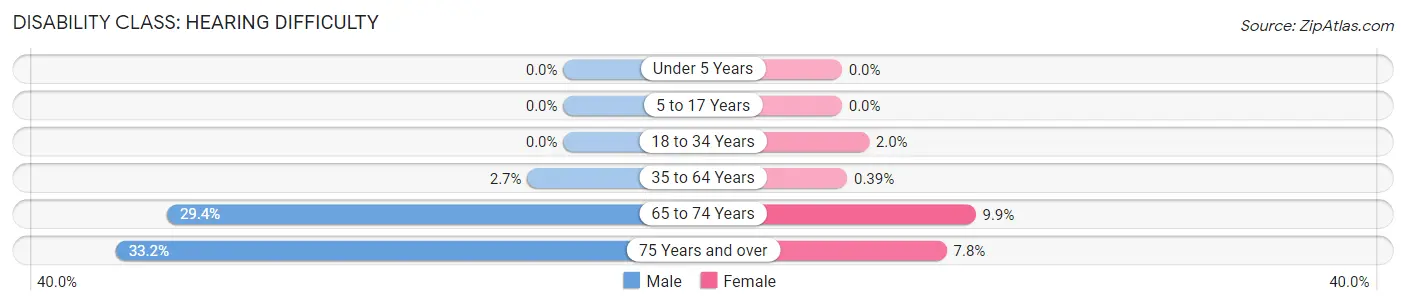
| Age Bracket | Male | Female |
| Under 5 Years | 0 (0.0%) | 0 (0.0%) |
| 5 to 17 Years | 0 (0.0%) | 0 (0.0%) |
| 18 to 34 Years | 0 (0.0%) | 26 (2.0%) |
| 35 to 64 Years | 47 (2.7%) | 7 (0.4%) |
| 65 to 74 Years | 93 (29.4%) | 58 (9.9%) |
| 75 Years and over | 103 (33.2%) | 28 (7.8%) |
Disability Class: Vision Difficulty
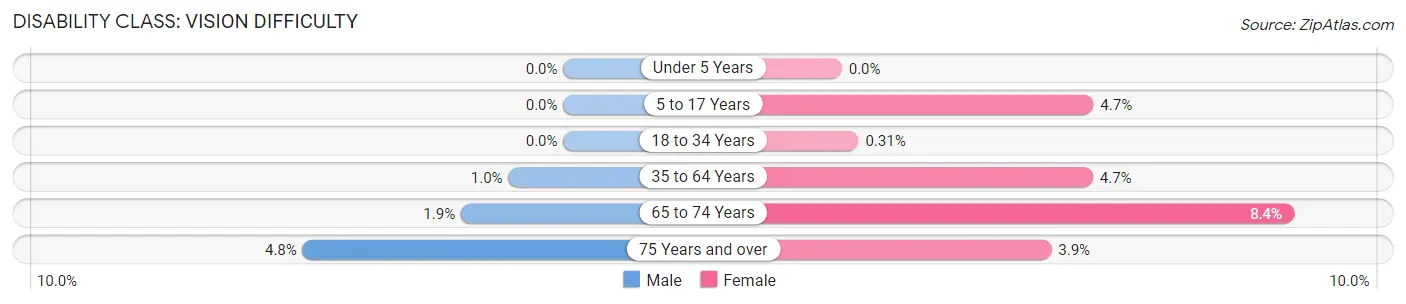
| Age Bracket | Male | Female |
| Under 5 Years | 0 (0.0%) | 0 (0.0%) |
| 5 to 17 Years | 0 (0.0%) | 47 (4.7%) |
| 18 to 34 Years | 0 (0.0%) | 4 (0.3%) |
| 35 to 64 Years | 18 (1.0%) | 84 (4.7%) |
| 65 to 74 Years | 6 (1.9%) | 49 (8.4%) |
| 75 Years and over | 15 (4.8%) | 14 (3.9%) |
Disability Class: Cognitive Difficulty
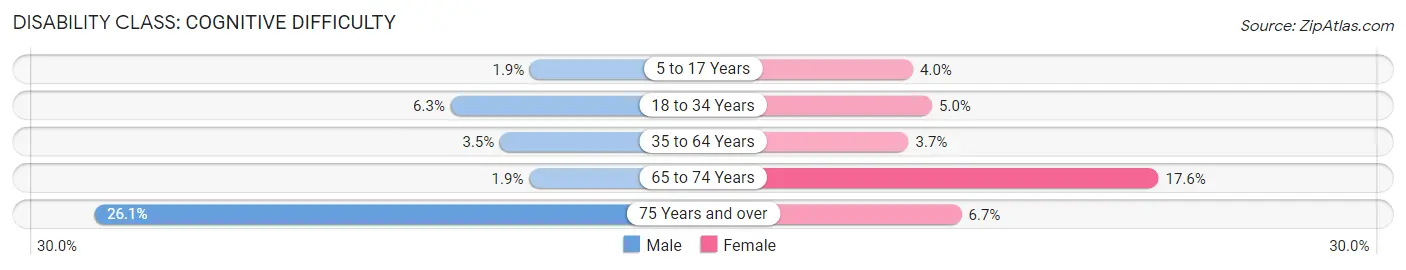
| Age Bracket | Male | Female |
| 5 to 17 Years | 15 (1.8%) | 40 (4.0%) |
| 18 to 34 Years | 105 (6.3%) | 65 (5.0%) |
| 35 to 64 Years | 62 (3.5%) | 67 (3.7%) |
| 65 to 74 Years | 6 (1.9%) | 103 (17.6%) |
| 75 Years and over | 81 (26.1%) | 24 (6.7%) |
Disability Class: Ambulatory Difficulty
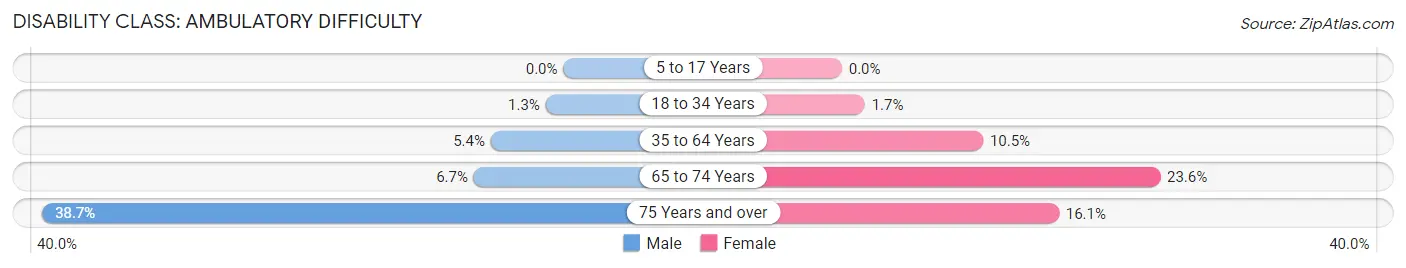
| Age Bracket | Male | Female |
| 5 to 17 Years | 0 (0.0%) | 0 (0.0%) |
| 18 to 34 Years | 22 (1.3%) | 22 (1.7%) |
| 35 to 64 Years | 95 (5.4%) | 189 (10.5%) |
| 65 to 74 Years | 21 (6.7%) | 138 (23.6%) |
| 75 Years and over | 120 (38.7%) | 58 (16.1%) |
Disability Class: Self-Care Difficulty
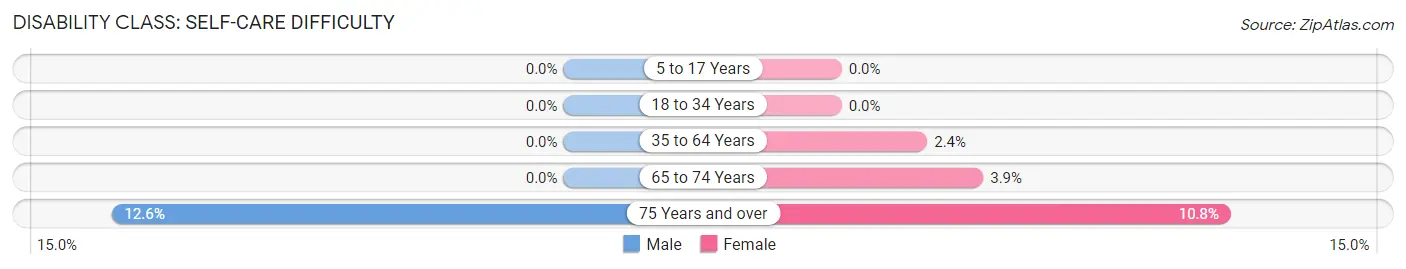
| Age Bracket | Male | Female |
| 5 to 17 Years | 0 (0.0%) | 0 (0.0%) |
| 18 to 34 Years | 0 (0.0%) | 0 (0.0%) |
| 35 to 64 Years | 0 (0.0%) | 43 (2.4%) |
| 65 to 74 Years | 0 (0.0%) | 23 (3.9%) |
| 75 Years and over | 39 (12.6%) | 39 (10.8%) |
Technology Access in Excelsior Springs
Computing Device Access in Excelsior Springs
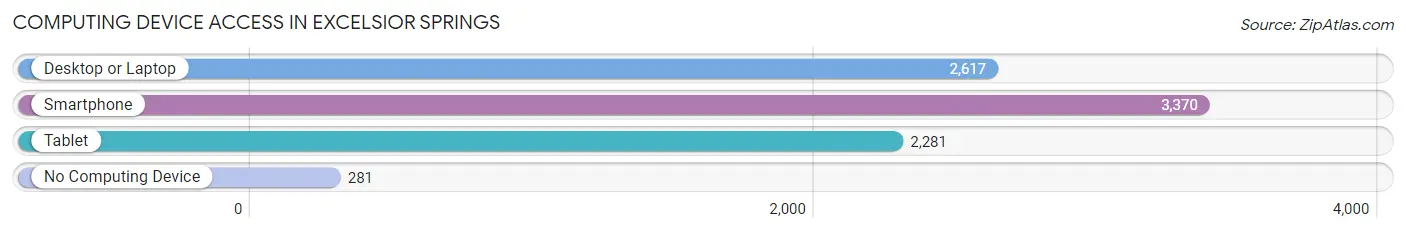
| Device Type | # Households | % Households |
| Desktop or Laptop | 2,617 | 67.9% |
| Smartphone | 3,370 | 87.5% |
| Tablet | 2,281 | 59.2% |
| No Computing Device | 281 | 7.3% |
| Total | 3,853 | 100.0% |
Internet Access in Excelsior Springs
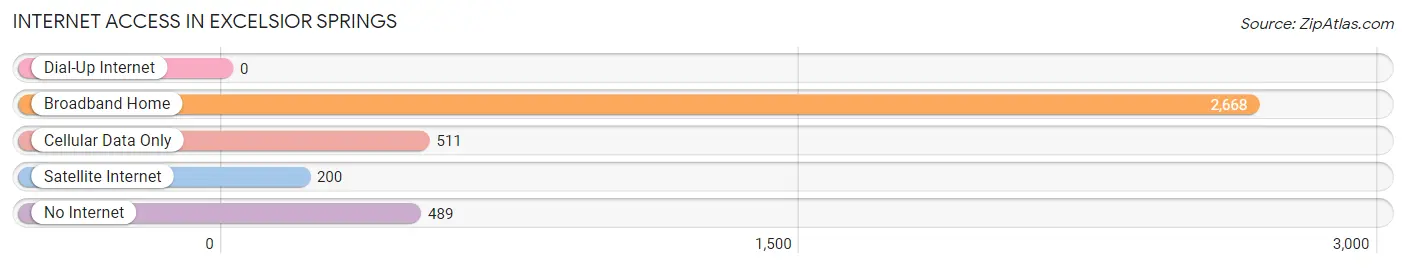
| Internet Type | # Households | % Households |
| Dial-Up Internet | 0 | 0.0% |
| Broadband Home | 2,668 | 69.2% |
| Cellular Data Only | 511 | 13.3% |
| Satellite Internet | 200 | 5.2% |
| No Internet | 489 | 12.7% |
| Total | 3,853 | 100.0% |
Excelsior Springs Summary
Excelsior Springs is a city located in Clay and Ray counties in the state of Missouri. It is situated on the banks of the East Fork Fishing River, approximately 30 miles northeast of Kansas City. The city is known for its natural mineral springs, which have been used for therapeutic purposes since the late 19th century. The population of Excelsior Springs was 11,084 at the 2010 census.
Geography
Excelsior Springs is located at 39°20'25" North, 94°14'17" West (39.340278, -94.238056). According to the United States Census Bureau, the city has a total area of 8.2 square miles, of which 8.1 square miles is land and 0.1 square mile is water.
Economy
Excelsior Springs is home to a variety of businesses, including manufacturing, retail, and service industries. The city is also home to several large employers, including Excelsior Springs Hospital, Excelsior Springs School District, and the Excelsior Springs Job Corps Center.
Demographics
As of the census of 2010, there were 11,084 people, 4,541 households, and 2,845 families residing in the city. The population density was 1,364.2 people per square mile. The racial makeup of the city was 87.2% White, 8.2% African American, 0.4% Native American, 0.7% Asian, 0.1% Pacific Islander, 1.2% from other races, and 2.2% from two or more races. Hispanic or Latino of any race were 3.2% of the population.
The median income for a household in the city was $37,945, and the median income for a family was $45,945. Males had a median income of $35,945 versus $25,945 for females. The per capita income for the city was $19,945. About 11.2% of families and 14.2% of the population were below the poverty line, including 19.2% of those under age 18 and 8.2% of those age 65 or over.
History
Excelsior Springs was founded in 1868 by William Gilman and named after the Latin phrase “excelsior,” meaning “ever upward.” The city was originally a resort town, known for its natural mineral springs. In the late 19th century, the city became a popular destination for those seeking to take advantage of the therapeutic benefits of the springs.
In the early 20th century, Excelsior Springs became a popular destination for celebrities, including Clark Gable, Judy Garland, and Harry Truman. The city was also home to the Excelsior Springs Hall of Waters, which was the largest indoor mineral water spa in the world. The Hall of Waters was destroyed by a fire in 1976, but the city still retains its reputation as a health resort.
Today, Excelsior Springs is a vibrant community with a variety of attractions, including the historic downtown district, the Elms Hotel and Spa, and the Excelsior Springs Museum and Archives. The city is also home to a number of annual events, including the Excelsior Springs Jazz Festival and the Excelsior Springs Art Fair.
Common Questions
What is Per Capita Income in Excelsior Springs?
Per Capita income in Excelsior Springs is $30,682.
What is the Median Family Income in Excelsior Springs?
Median Family Income in Excelsior Springs is $87,852.
What is the Median Household income in Excelsior Springs?
Median Household Income in Excelsior Springs is $74,196.
What is Income or Wage Gap in Excelsior Springs?
Income or Wage Gap in Excelsior Springs is 27.1%.
Women in Excelsior Springs earn 72.9 cents for every dollar earned by a man.
What is Family Income Deficit in Excelsior Springs?
Family Income Deficit in Excelsior Springs is $10,429.
Families that are below poverty line in Excelsior Springs earn $10,429 less on average than the poverty threshold level.
What is Inequality or Gini Index in Excelsior Springs?
Inequality or Gini Index in Excelsior Springs is 0.38.
What is the Total Population of Excelsior Springs?
Total Population of Excelsior Springs is 10,546.
What is the Total Male Population of Excelsior Springs?
Total Male Population of Excelsior Springs is 5,036.
What is the Total Female Population of Excelsior Springs?
Total Female Population of Excelsior Springs is 5,510.
What is the Ratio of Males per 100 Females in Excelsior Springs?
There are 91.40 Males per 100 Females in Excelsior Springs.
What is the Ratio of Females per 100 Males in Excelsior Springs?
There are 109.41 Females per 100 Males in Excelsior Springs.
What is the Median Population Age in Excelsior Springs?
Median Population Age in Excelsior Springs is 35.2 Years.
What is the Average Family Size in Excelsior Springs
Average Family Size in Excelsior Springs is 3.1 People.
What is the Average Household Size in Excelsior Springs
Average Household Size in Excelsior Springs is 2.6 People.
How Large is the Labor Force in Excelsior Springs?
There are 5,478 People in the Labor Forcein in Excelsior Springs.
What is the Percentage of People in the Labor Force in Excelsior Springs?
64.2% of People are in the Labor Force in Excelsior Springs.
What is the Unemployment Rate in Excelsior Springs?
Unemployment Rate in Excelsior Springs is 4.0%.