Eureka, MO Map & Demographics
Eureka Map
Eureka Overview
$46,904
PER CAPITA INCOME
$130,824
AVG FAMILY INCOME
$104,697
AVG HOUSEHOLD INCOME
34.4%
WAGE / INCOME GAP [ % ]
65.6¢/ $1
WAGE / INCOME GAP [ $ ]
0.40
INEQUALITY / GINI INDEX
12,008
TOTAL POPULATION
6,354
MALE POPULATION
5,654
FEMALE POPULATION
112.38
MALES / 100 FEMALES
88.98
FEMALES / 100 MALES
37.9
MEDIAN AGE
3.4
AVG FAMILY SIZE
2.8
AVG HOUSEHOLD SIZE
6,026
LABOR FORCE [ PEOPLE ]
68.5%
PERCENT IN LABOR FORCE
5.4%
UNEMPLOYMENT RATE
Eureka Zip Codes
Eureka Area Codes
Income in Eureka
Income Overview in Eureka
Per Capita Income in Eureka is $46,904, while median incomes of families and households are $130,824 and $104,697 respectively.
| Characteristic | Number | Measure |
| Per Capita Income | 12,008 | $46,904 |
| Median Family Income | 2,963 | $130,824 |
| Mean Family Income | 2,963 | $153,585 |
| Median Household Income | 4,229 | $104,697 |
| Mean Household Income | 4,229 | $131,671 |
| Income Deficit | 2,963 | $0 |
| Wage / Income Gap (%) | 12,008 | 34.45% |
| Wage / Income Gap ($) | 12,008 | 65.55¢ per $1 |
| Gini / Inequality Index | 12,008 | 0.40 |
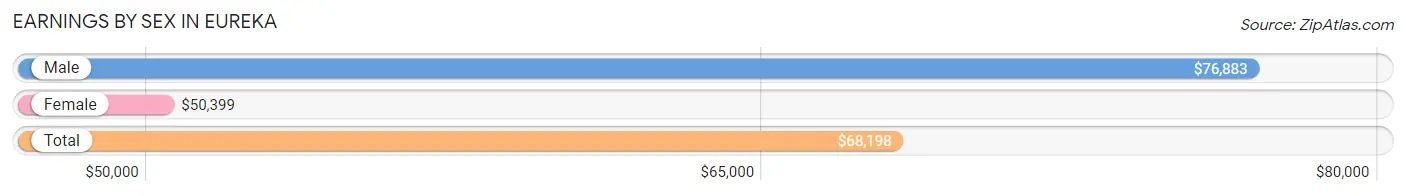
Earnings by Sex in Eureka
Average Earnings in Eureka are $68,198, $76,883 for men and $50,399 for women, a difference of 34.4%.
| Sex | Number | Average Earnings |
| Male | 3,605 (56.8%) | $76,883 |
| Female | 2,747 (43.2%) | $50,399 |
| Total | 6,352 (100.0%) | $68,198 |
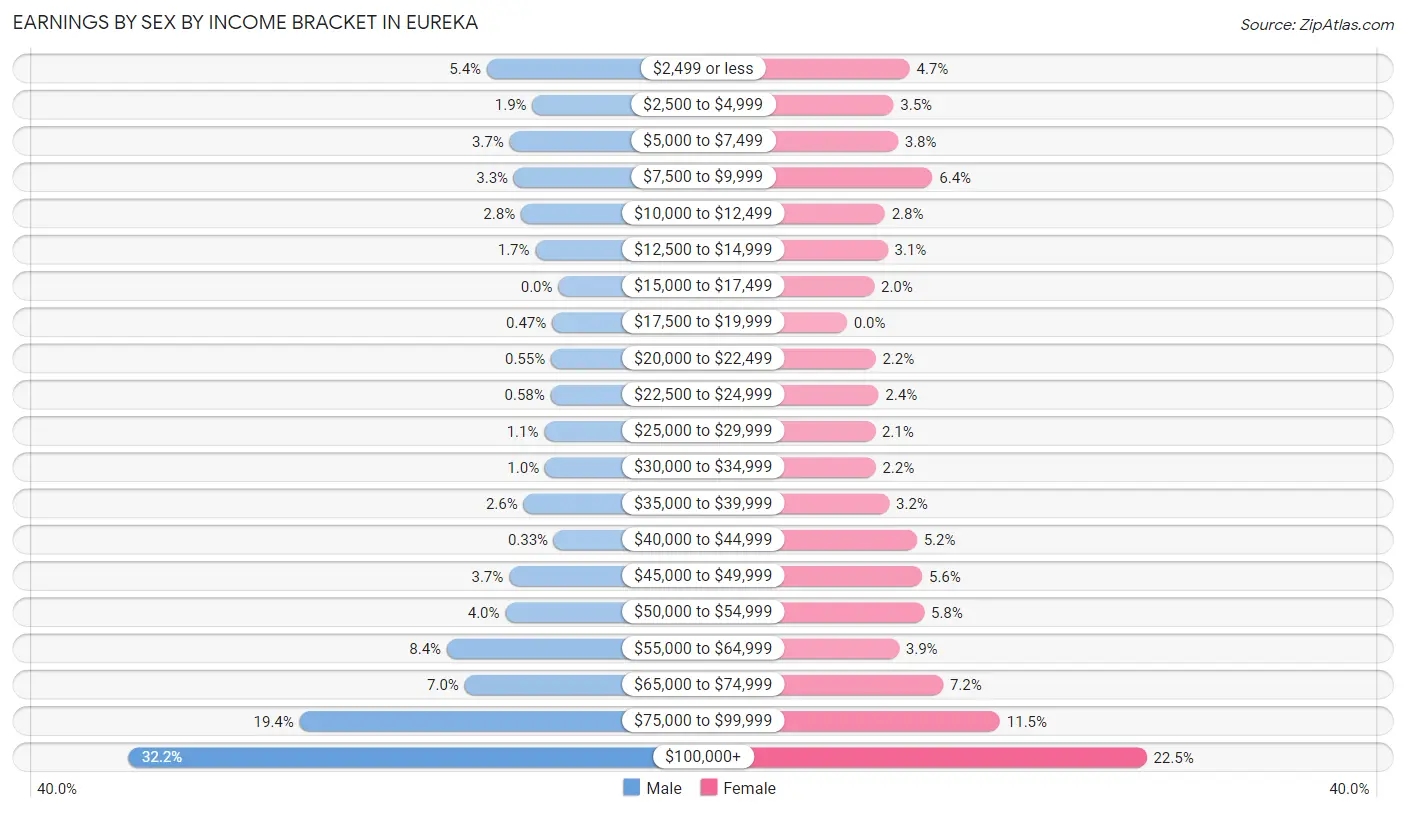
Earnings by Sex by Income Bracket in Eureka
The most common earnings brackets in Eureka are $100,000+ for men (1,160 | 32.2%) and $100,000+ for women (617 | 22.5%).
| Income | Male | Female |
| $2,499 or less | 193 (5.3%) | 129 (4.7%) |
| $2,500 to $4,999 | 70 (1.9%) | 96 (3.5%) |
| $5,000 to $7,499 | 132 (3.7%) | 105 (3.8%) |
| $7,500 to $9,999 | 120 (3.3%) | 176 (6.4%) |
| $10,000 to $12,499 | 101 (2.8%) | 78 (2.8%) |
| $12,500 to $14,999 | 62 (1.7%) | 84 (3.1%) |
| $15,000 to $17,499 | 0 (0.0%) | 56 (2.0%) |
| $17,500 to $19,999 | 17 (0.5%) | 0 (0.0%) |
| $20,000 to $22,499 | 20 (0.5%) | 59 (2.1%) |
| $22,500 to $24,999 | 21 (0.6%) | 65 (2.4%) |
| $25,000 to $29,999 | 38 (1.1%) | 58 (2.1%) |
| $30,000 to $34,999 | 36 (1.0%) | 59 (2.1%) |
| $35,000 to $39,999 | 94 (2.6%) | 87 (3.2%) |
| $40,000 to $44,999 | 12 (0.3%) | 144 (5.2%) |
| $45,000 to $49,999 | 133 (3.7%) | 155 (5.6%) |
| $50,000 to $54,999 | 143 (4.0%) | 159 (5.8%) |
| $55,000 to $64,999 | 301 (8.4%) | 107 (3.9%) |
| $65,000 to $74,999 | 253 (7.0%) | 198 (7.2%) |
| $75,000 to $99,999 | 699 (19.4%) | 315 (11.5%) |
| $100,000+ | 1,160 (32.2%) | 617 (22.5%) |
| Total | 3,605 (100.0%) | 2,747 (100.0%) |
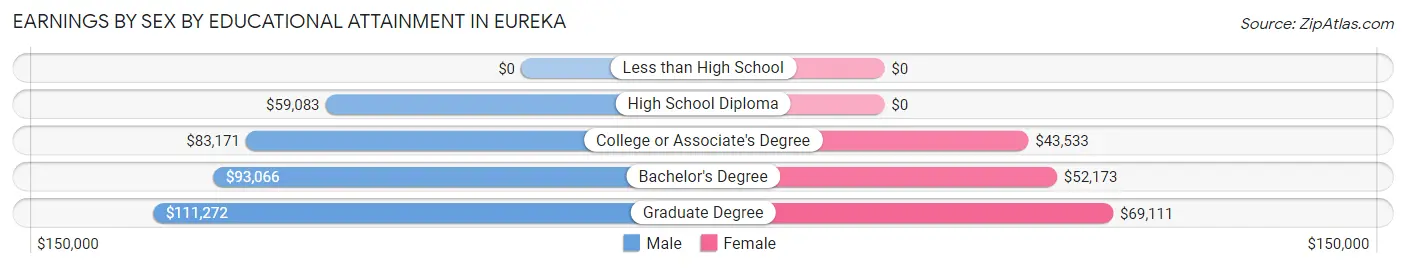
Earnings by Sex by Educational Attainment in Eureka
Average earnings in Eureka are $87,681 for men and $52,473 for women, a difference of 40.2%. Men with an educational attainment of graduate degree enjoy the highest average annual earnings of $111,272, while those with high school diploma education earn the least with $59,083. Women with an educational attainment of graduate degree earn the most with the average annual earnings of $69,111, while those with college or associate's degree education have the smallest earnings of $43,533.
| Educational Attainment | Male Income | Female Income |
| Less than High School | - | - |
| High School Diploma | $59,083 | $0 |
| College or Associate's Degree | $83,171 | $43,533 |
| Bachelor's Degree | $93,066 | $52,173 |
| Graduate Degree | $111,272 | $69,111 |
| Total | $87,681 | $52,473 |
Family Income in Eureka
Family Income Brackets in Eureka
According to the Eureka family income data, there are 779 families falling into the $100,000 to $149,999 income range, which is the most common income bracket and makes up 26.3% of all families.
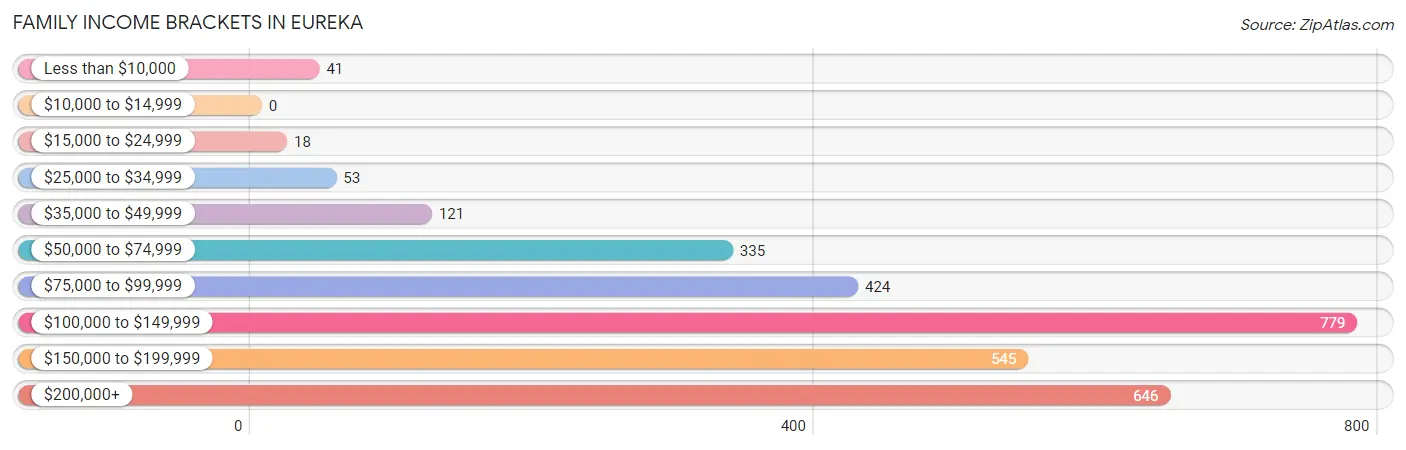
| Income Bracket | # Families | % Families |
| Less than $10,000 | 41 | 1.4% |
| $10,000 to $14,999 | 0 | 0.0% |
| $15,000 to $24,999 | 18 | 0.6% |
| $25,000 to $34,999 | 53 | 1.8% |
| $35,000 to $49,999 | 121 | 4.1% |
| $50,000 to $74,999 | 335 | 11.3% |
| $75,000 to $99,999 | 424 | 14.3% |
| $100,000 to $149,999 | 779 | 26.3% |
| $150,000 to $199,999 | 545 | 18.4% |
| $200,000+ | 646 | 21.8% |
Family Income by Famaliy Size in Eureka
6-person families (58 | 2.0%) account for the highest median family income in Eureka with $180,385 per family, while 2-person families (1,069 | 36.1%) have the highest median income of $53,438 per family member.
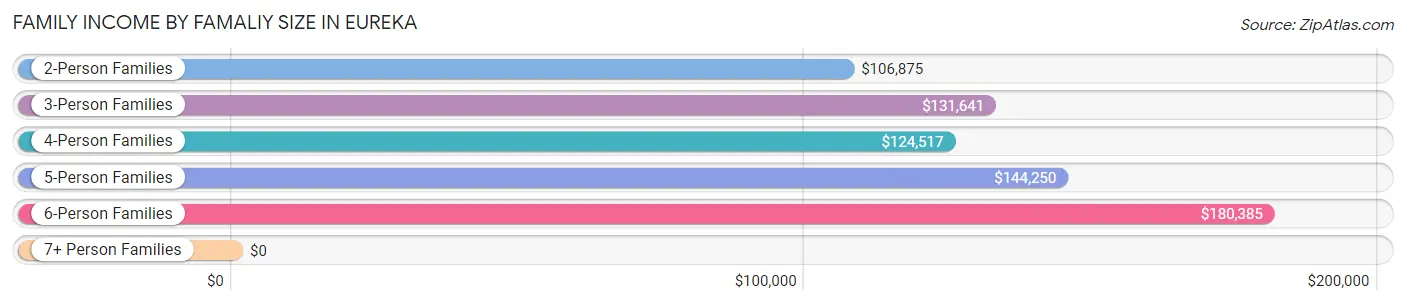
| Income Bracket | # Families | Median Income |
| 2-Person Families | 1,069 (36.1%) | $106,875 |
| 3-Person Families | 537 (18.1%) | $131,641 |
| 4-Person Families | 835 (28.2%) | $124,517 |
| 5-Person Families | 422 (14.2%) | $144,250 |
| 6-Person Families | 58 (2.0%) | $180,385 |
| 7+ Person Families | 42 (1.4%) | $0 |
| Total | 2,963 (100.0%) | $130,824 |
Family Income by Number of Earners in Eureka
The median family income in Eureka is $130,824, with families comprising 2 earners (1,430) having the highest median family income of $170,461, while families with no earners (210) have the lowest median family income of $59,231, accounting for 48.3% and 7.1% of families, respectively.
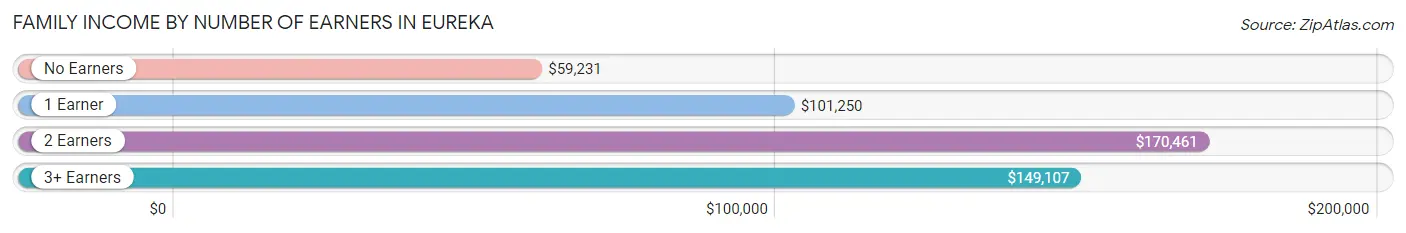
| Number of Earners | # Families | Median Income |
| No Earners | 210 (7.1%) | $59,231 |
| 1 Earner | 918 (31.0%) | $101,250 |
| 2 Earners | 1,430 (48.3%) | $170,461 |
| 3+ Earners | 405 (13.7%) | $149,107 |
| Total | 2,963 (100.0%) | $130,824 |
Household Income in Eureka
Household Income Brackets in Eureka
With 875 households falling in the category, the $100,000 to $149,999 income range is the most frequent in Eureka, accounting for 20.7% of all households. In contrast, only 51 households (1.2%) fall into the $10,000 to $14,999 income bracket, making it the least populous group.
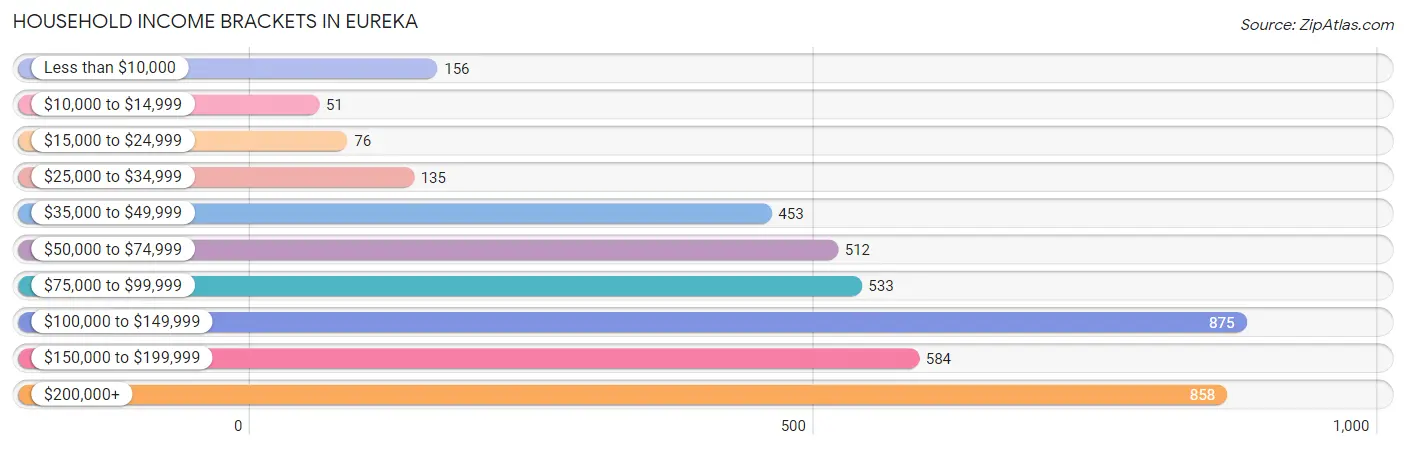
| Income Bracket | # Households | % Households |
| Less than $10,000 | 156 | 3.7% |
| $10,000 to $14,999 | 51 | 1.2% |
| $15,000 to $24,999 | 76 | 1.8% |
| $25,000 to $34,999 | 135 | 3.2% |
| $35,000 to $49,999 | 453 | 10.7% |
| $50,000 to $74,999 | 512 | 12.1% |
| $75,000 to $99,999 | 533 | 12.6% |
| $100,000 to $149,999 | 875 | 20.7% |
| $150,000 to $199,999 | 584 | 13.8% |
| $200,000+ | 858 | 20.3% |
Household Income by Householder Age in Eureka
The median household income in Eureka is $104,697, with the highest median household income of $153,693 found in the 45 to 64 years age bracket for the primary householder. A total of 1,511 households (35.7%) fall into this category. Meanwhile, the 65+ years age bracket for the primary householder has the lowest median household income of $48,403, with 1,021 households (24.1%) in this group.
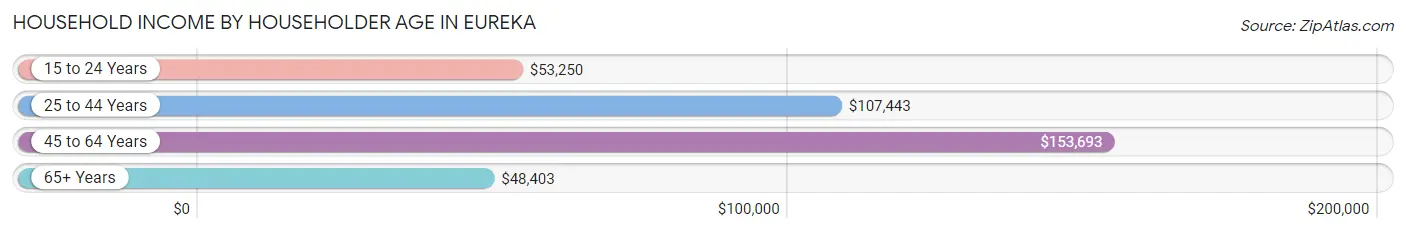
| Income Bracket | # Households | Median Income |
| 15 to 24 Years | 84 (2.0%) | $53,250 |
| 25 to 44 Years | 1,613 (38.1%) | $107,443 |
| 45 to 64 Years | 1,511 (35.7%) | $153,693 |
| 65+ Years | 1,021 (24.1%) | $48,403 |
| Total | 4,229 (100.0%) | $104,697 |
Poverty in Eureka
Income Below Poverty by Sex and Age in Eureka
With 7.3% poverty level for males and 3.3% for females among the residents of Eureka, 15 year old males and 18 to 24 year old females are the most vulnerable to poverty, with 39 males (37.9%) and 45 females (17.4%) in their respective age groups living below the poverty level.
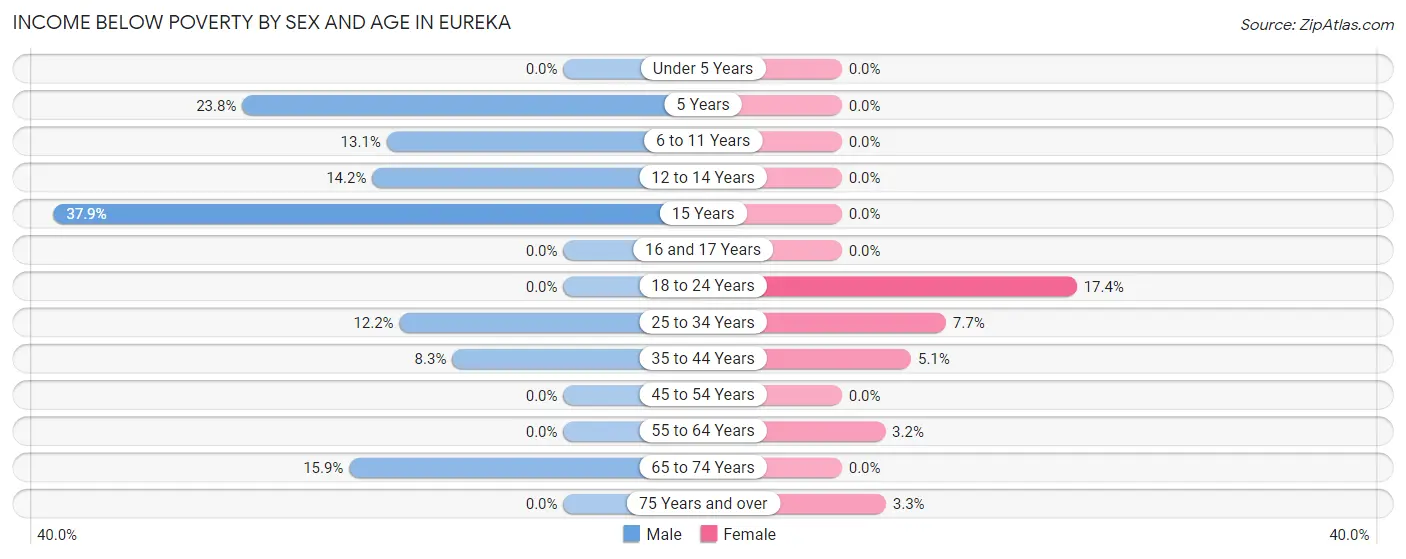
| Age Bracket | Male | Female |
| Under 5 Years | 0 (0.0%) | 0 (0.0%) |
| 5 Years | 41 (23.8%) | 0 (0.0%) |
| 6 to 11 Years | 119 (13.1%) | 0 (0.0%) |
| 12 to 14 Years | 41 (14.2%) | 0 (0.0%) |
| 15 Years | 39 (37.9%) | 0 (0.0%) |
| 16 and 17 Years | 0 (0.0%) | 0 (0.0%) |
| 18 to 24 Years | 0 (0.0%) | 45 (17.4%) |
| 25 to 34 Years | 64 (12.2%) | 59 (7.7%) |
| 35 to 44 Years | 80 (8.3%) | 39 (5.1%) |
| 45 to 54 Years | 0 (0.0%) | 0 (0.0%) |
| 55 to 64 Years | 0 (0.0%) | 22 (3.2%) |
| 65 to 74 Years | 73 (15.9%) | 0 (0.0%) |
| 75 Years and over | 0 (0.0%) | 13 (3.3%) |
| Total | 457 (7.3%) | 178 (3.3%) |
Income Above Poverty by Sex and Age in Eureka
According to the poverty statistics in Eureka, males aged under 5 years and females aged under 5 years are the age groups that are most secure financially, with 100.0% of males and 100.0% of females in these age groups living above the poverty line.
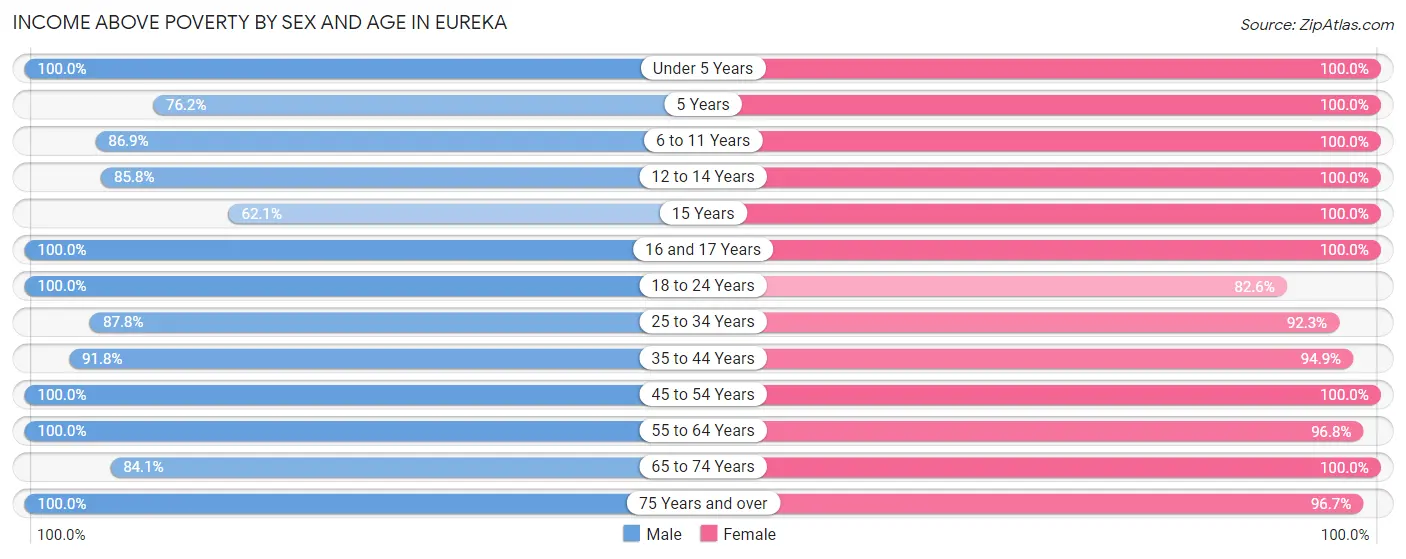
| Age Bracket | Male | Female |
| Under 5 Years | 433 (100.0%) | 387 (100.0%) |
| 5 Years | 131 (76.2%) | 145 (100.0%) |
| 6 to 11 Years | 788 (86.9%) | 500 (100.0%) |
| 12 to 14 Years | 248 (85.8%) | 113 (100.0%) |
| 15 Years | 64 (62.1%) | 121 (100.0%) |
| 16 and 17 Years | 254 (100.0%) | 150 (100.0%) |
| 18 to 24 Years | 353 (100.0%) | 213 (82.6%) |
| 25 to 34 Years | 462 (87.8%) | 704 (92.3%) |
| 35 to 44 Years | 890 (91.7%) | 720 (94.9%) |
| 45 to 54 Years | 763 (100.0%) | 778 (100.0%) |
| 55 to 64 Years | 800 (100.0%) | 662 (96.8%) |
| 65 to 74 Years | 386 (84.1%) | 415 (100.0%) |
| 75 Years and over | 193 (100.0%) | 385 (96.7%) |
| Total | 5,765 (92.7%) | 5,293 (96.8%) |
Income Below Poverty Among Married-Couple Families in Eureka
The poverty statistics for married-couple families in Eureka show that 1.5% or 39 of the total 2,608 families live below the poverty line. Families with 3 or 4 children have the highest poverty rate of 11.4%, comprising of 39 families. On the other hand, families with no children have the lowest poverty rate of 0.0%, which includes 0 families.
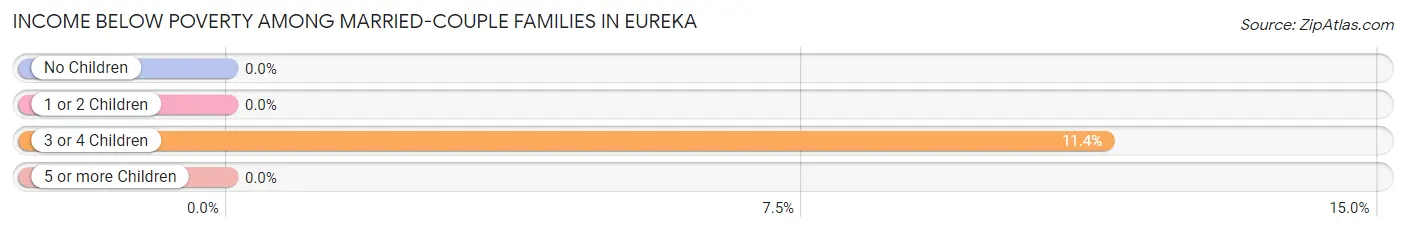
| Children | Above Poverty | Below Poverty |
| No Children | 1,142 (100.0%) | 0 (0.0%) |
| 1 or 2 Children | 1,083 (100.0%) | 0 (0.0%) |
| 3 or 4 Children | 302 (88.6%) | 39 (11.4%) |
| 5 or more Children | 42 (100.0%) | 0 (0.0%) |
| Total | 2,569 (98.5%) | 39 (1.5%) |
Income Below Poverty Among Single-Parent Households in Eureka
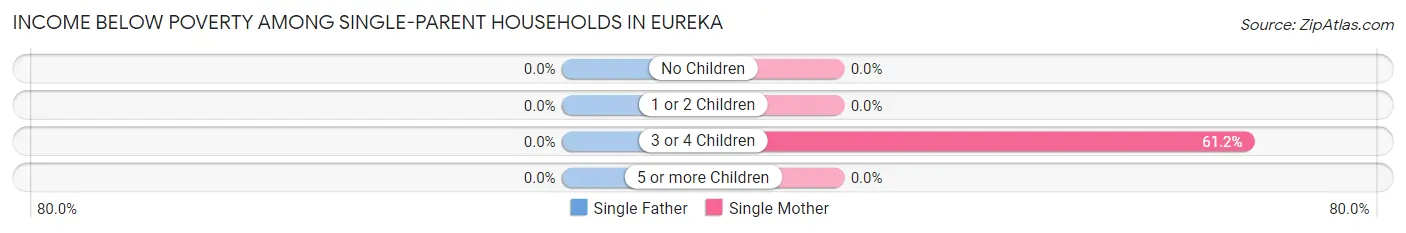
| Children | Single Father | Single Mother |
| No Children | 0 (0.0%) | 0 (0.0%) |
| 1 or 2 Children | 0 (0.0%) | 0 (0.0%) |
| 3 or 4 Children | 0 (0.0%) | 41 (61.2%) |
| 5 or more Children | 0 (0.0%) | 0 (0.0%) |
| Total | 0 (0.0%) | 41 (16.0%) |
Income Below Poverty Among Married-Couple vs Single-Parent Households in Eureka
The poverty data for Eureka shows that 39 of the married-couple family households (1.5%) and 41 of the single-parent households (11.6%) are living below the poverty level. Within the married-couple family households, those with 3 or 4 children have the highest poverty rate, with 39 households (11.4%) falling below the poverty line. Among the single-parent households, those with 3 or 4 children have the highest poverty rate, with 41 household (61.2%) living below poverty.
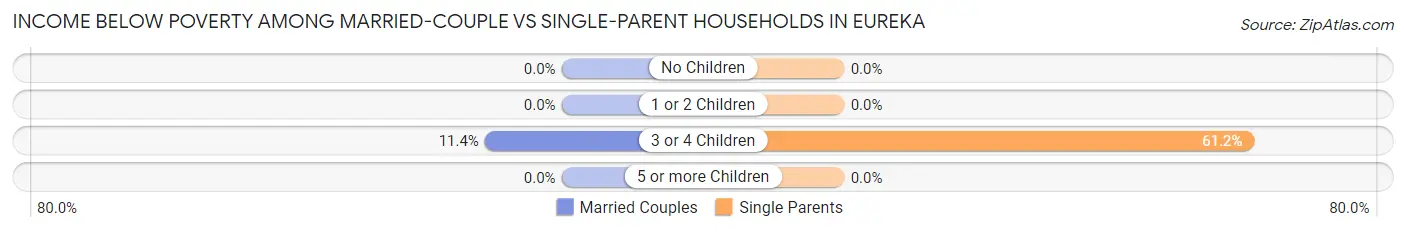
| Children | Married-Couple Families | Single-Parent Households |
| No Children | 0 (0.0%) | 0 (0.0%) |
| 1 or 2 Children | 0 (0.0%) | 0 (0.0%) |
| 3 or 4 Children | 39 (11.4%) | 41 (61.2%) |
| 5 or more Children | 0 (0.0%) | 0 (0.0%) |
| Total | 39 (1.5%) | 41 (11.6%) |
Race in Eureka
The most populous races in Eureka are White / Caucasian (10,596 | 88.2%), Two or more Races (976 | 8.1%), and Asian (236 | 2.0%).
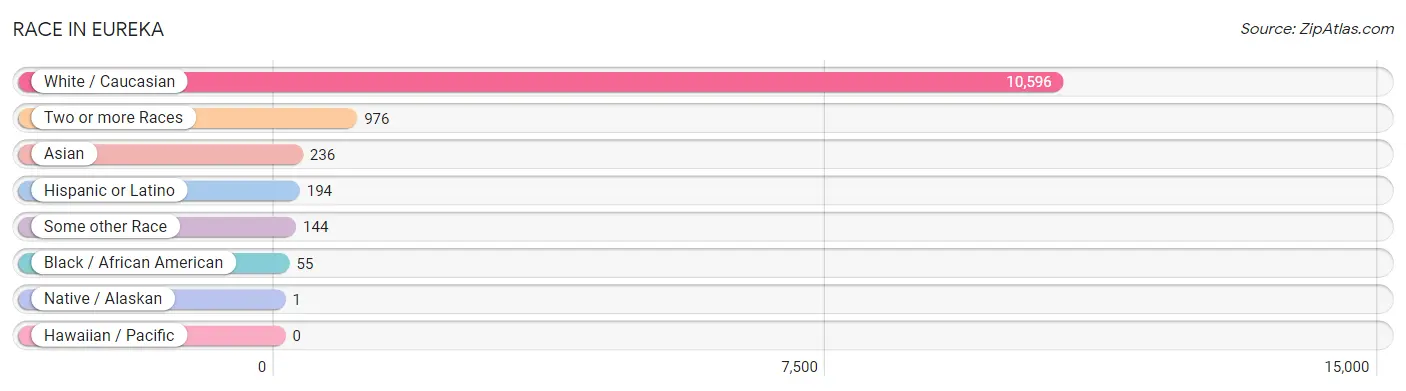
| Race | # Population | % Population |
| Asian | 236 | 2.0% |
| Black / African American | 55 | 0.5% |
| Hawaiian / Pacific | 0 | 0.0% |
| Hispanic or Latino | 194 | 1.6% |
| Native / Alaskan | 1 | 0.0% |
| White / Caucasian | 10,596 | 88.2% |
| Two or more Races | 976 | 8.1% |
| Some other Race | 144 | 1.2% |
| Total | 12,008 | 100.0% |
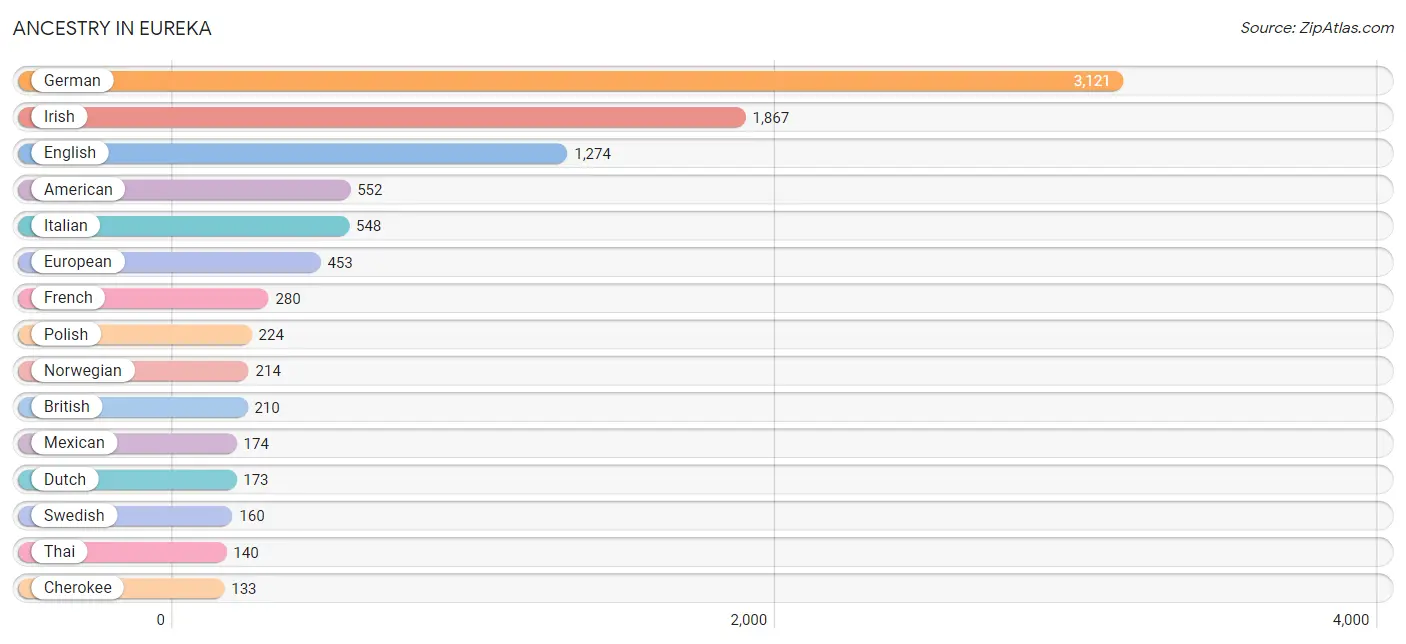
Ancestry in Eureka
The most populous ancestries reported in Eureka are German (3,121 | 26.0%), Irish (1,867 | 15.5%), English (1,274 | 10.6%), American (552 | 4.6%), and Italian (548 | 4.6%), together accounting for 61.3% of all Eureka residents.
| Ancestry | # Population | % Population |
| American | 552 | 4.6% |
| Arab | 1 | 0.0% |
| Belgian | 60 | 0.5% |
| British | 210 | 1.8% |
| Burmese | 77 | 0.6% |
| Canadian | 22 | 0.2% |
| Central American | 20 | 0.2% |
| Central American Indian | 1 | 0.0% |
| Cherokee | 133 | 1.1% |
| Czech | 27 | 0.2% |
| Czechoslovakian | 42 | 0.4% |
| Danish | 20 | 0.2% |
| Dutch | 173 | 1.4% |
| English | 1,274 | 10.6% |
| European | 453 | 3.8% |
| French | 280 | 2.3% |
| German | 3,121 | 26.0% |
| Greek | 55 | 0.5% |
| Honduran | 20 | 0.2% |
| Indian (Asian) | 36 | 0.3% |
| Irish | 1,867 | 15.5% |
| Israeli | 12 | 0.1% |
| Italian | 548 | 4.6% |
| Lithuanian | 17 | 0.1% |
| Mexican | 174 | 1.5% |
| Norwegian | 214 | 1.8% |
| Polish | 224 | 1.9% |
| Potawatomi | 47 | 0.4% |
| Romanian | 31 | 0.3% |
| Russian | 58 | 0.5% |
| Scandinavian | 23 | 0.2% |
| Scotch-Irish | 109 | 0.9% |
| Scottish | 102 | 0.9% |
| Swedish | 160 | 1.3% |
| Syrian | 1 | 0.0% |
| Thai | 140 | 1.2% |
| Welsh | 79 | 0.7% | View All 37 Rows |
Immigrants in Eureka
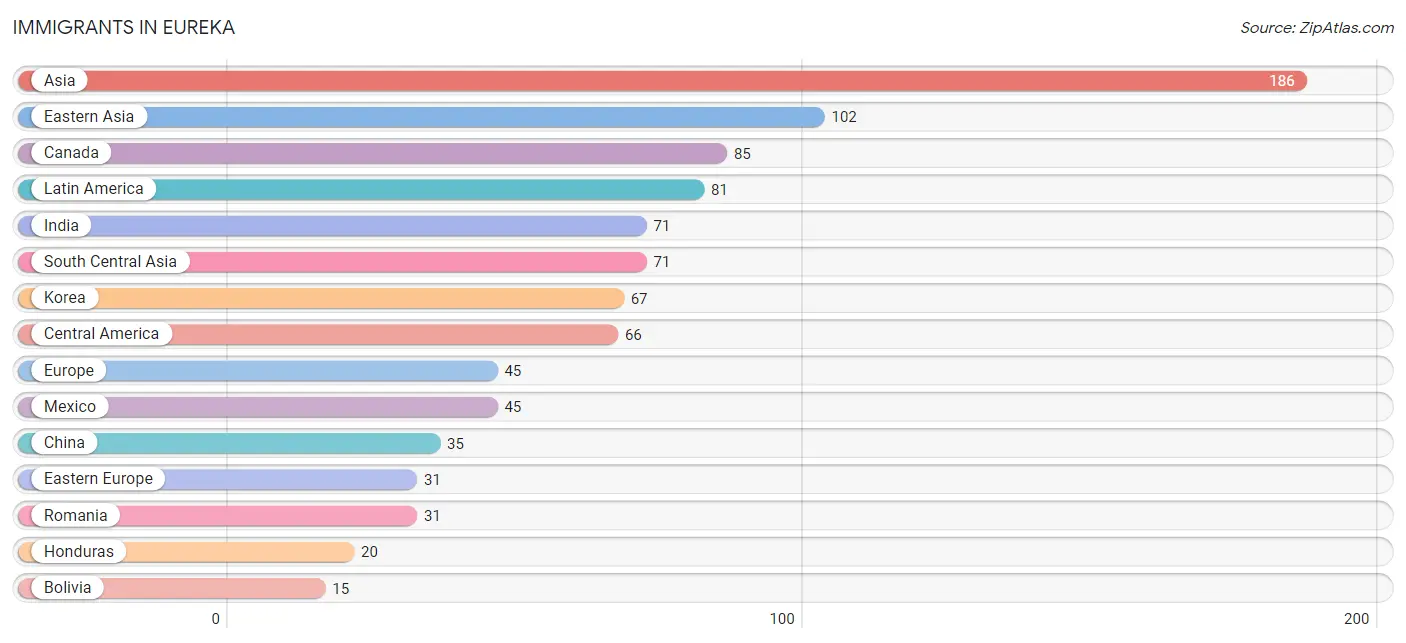
The most numerous immigrant groups reported in Eureka came from Asia (186 | 1.5%), Eastern Asia (102 | 0.9%), Canada (85 | 0.7%), Latin America (81 | 0.7%), and India (71 | 0.6%), together accounting for 4.4% of all Eureka residents.
| Immigration Origin | # Population | % Population |
| Asia | 186 | 1.5% |
| Belize | 1 | 0.0% |
| Bolivia | 15 | 0.1% |
| Canada | 85 | 0.7% |
| Central America | 66 | 0.5% |
| China | 35 | 0.3% |
| Eastern Asia | 102 | 0.9% |
| Eastern Europe | 31 | 0.3% |
| Europe | 45 | 0.4% |
| Germany | 14 | 0.1% |
| Honduras | 20 | 0.2% |
| India | 71 | 0.6% |
| Israel | 12 | 0.1% |
| Korea | 67 | 0.6% |
| Latin America | 81 | 0.7% |
| Malaysia | 1 | 0.0% |
| Mexico | 45 | 0.4% |
| Romania | 31 | 0.3% |
| South America | 15 | 0.1% |
| South Central Asia | 71 | 0.6% |
| South Eastern Asia | 1 | 0.0% |
| Western Asia | 12 | 0.1% |
| Western Europe | 14 | 0.1% | View All 23 Rows |
Sex and Age in Eureka
Sex and Age in Eureka
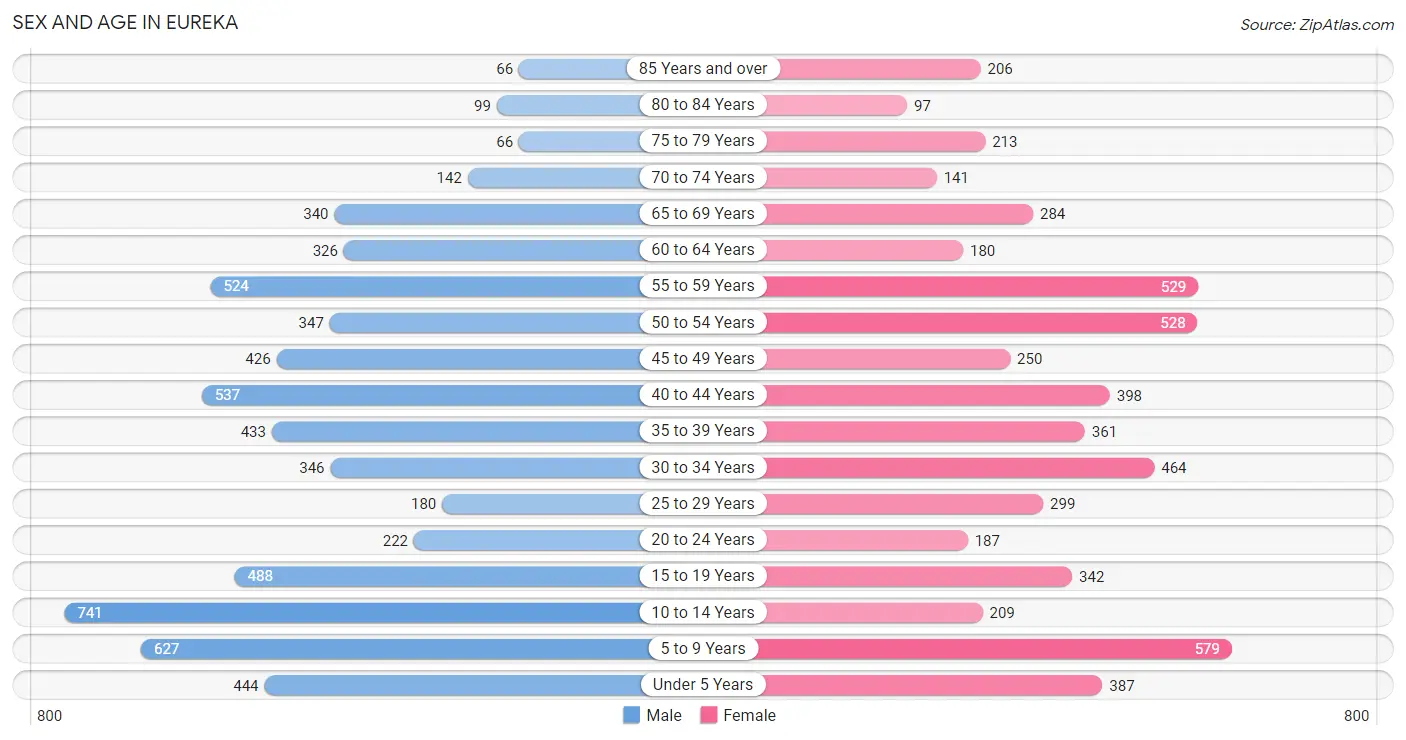
The most populous age groups in Eureka are 10 to 14 Years (741 | 11.7%) for men and 5 to 9 Years (579 | 10.2%) for women.
| Age Bracket | Male | Female |
| Under 5 Years | 444 (7.0%) | 387 (6.8%) |
| 5 to 9 Years | 627 (9.9%) | 579 (10.2%) |
| 10 to 14 Years | 741 (11.7%) | 209 (3.7%) |
| 15 to 19 Years | 488 (7.7%) | 342 (6.0%) |
| 20 to 24 Years | 222 (3.5%) | 187 (3.3%) |
| 25 to 29 Years | 180 (2.8%) | 299 (5.3%) |
| 30 to 34 Years | 346 (5.4%) | 464 (8.2%) |
| 35 to 39 Years | 433 (6.8%) | 361 (6.4%) |
| 40 to 44 Years | 537 (8.5%) | 398 (7.0%) |
| 45 to 49 Years | 426 (6.7%) | 250 (4.4%) |
| 50 to 54 Years | 347 (5.5%) | 528 (9.3%) |
| 55 to 59 Years | 524 (8.3%) | 529 (9.4%) |
| 60 to 64 Years | 326 (5.1%) | 180 (3.2%) |
| 65 to 69 Years | 340 (5.3%) | 284 (5.0%) |
| 70 to 74 Years | 142 (2.2%) | 141 (2.5%) |
| 75 to 79 Years | 66 (1.0%) | 213 (3.8%) |
| 80 to 84 Years | 99 (1.6%) | 97 (1.7%) |
| 85 Years and over | 66 (1.0%) | 206 (3.6%) |
| Total | 6,354 (100.0%) | 5,654 (100.0%) |
Families and Households in Eureka
Median Family Size in Eureka
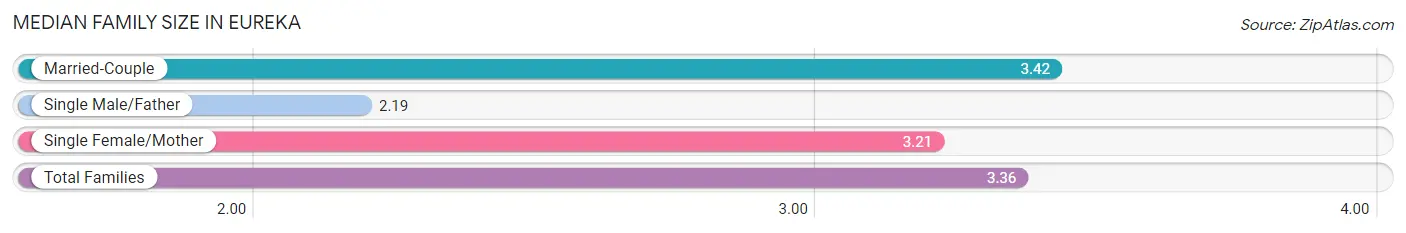
The median family size in Eureka is 3.36 persons per family, with married-couple families (2,608 | 88.0%) accounting for the largest median family size of 3.42 persons per family. On the other hand, single male/father families (98 | 3.3%) represent the smallest median family size with 2.19 persons per family.
| Family Type | # Families | Family Size |
| Married-Couple | 2,608 (88.0%) | 3.42 |
| Single Male/Father | 98 (3.3%) | 2.19 |
| Single Female/Mother | 257 (8.7%) | 3.21 |
| Total Families | 2,963 (100.0%) | 3.36 |
Median Household Size in Eureka
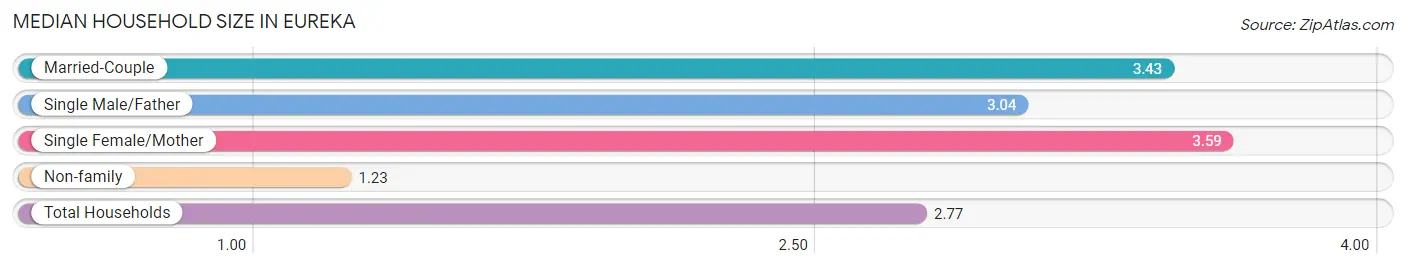
The median household size in Eureka is 2.77 persons per household, with single female/mother households (257 | 6.1%) accounting for the largest median household size of 3.59 persons per household. non-family households (1,266 | 29.9%) represent the smallest median household size with 1.23 persons per household.
| Household Type | # Households | Household Size |
| Married-Couple | 2,608 (61.7%) | 3.43 |
| Single Male/Father | 98 (2.3%) | 3.04 |
| Single Female/Mother | 257 (6.1%) | 3.59 |
| Non-family | 1,266 (29.9%) | 1.23 |
| Total Households | 4,229 (100.0%) | 2.77 |
Household Size by Marriage Status in Eureka
Out of a total of 4,229 households in Eureka, 2,963 (70.1%) are family households, while 1,266 (29.9%) are nonfamily households. The most numerous type of family households are 2-person households, comprising 967, and the most common type of nonfamily households are 1-person households, comprising 948.
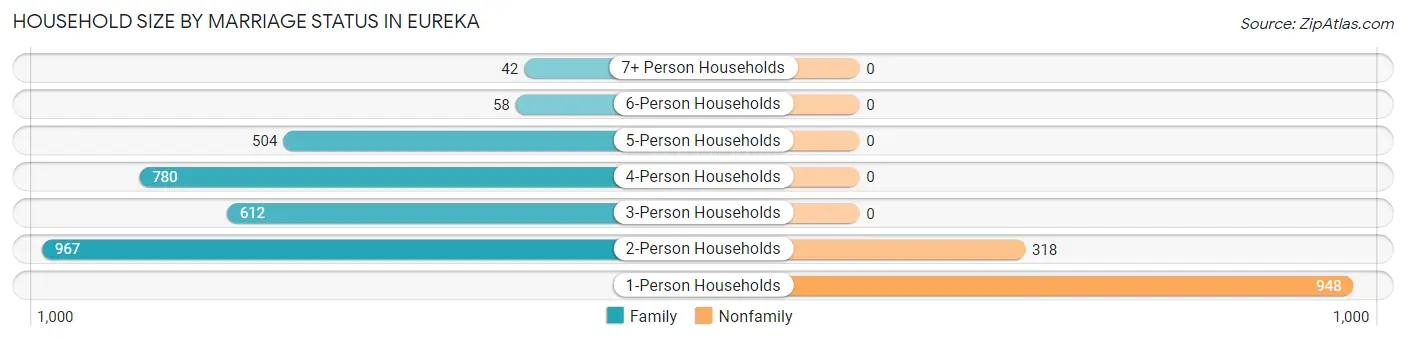
| Household Size | Family Households | Nonfamily Households |
| 1-Person Households | - | 948 (22.4%) |
| 2-Person Households | 967 (22.9%) | 318 (7.5%) |
| 3-Person Households | 612 (14.5%) | 0 (0.0%) |
| 4-Person Households | 780 (18.4%) | 0 (0.0%) |
| 5-Person Households | 504 (11.9%) | 0 (0.0%) |
| 6-Person Households | 58 (1.4%) | 0 (0.0%) |
| 7+ Person Households | 42 (1.0%) | 0 (0.0%) |
| Total | 2,963 (70.1%) | 1,266 (29.9%) |
Female Fertility in Eureka
Fertility by Age in Eureka
Average fertility rate in Eureka is 67.0 births per 1,000 women. Women in the age bracket of 20 to 34 years have the highest fertility rate with 149.0 births per 1,000 women. Women in the age bracket of 20 to 34 years acount for 88.2% of all women with births.
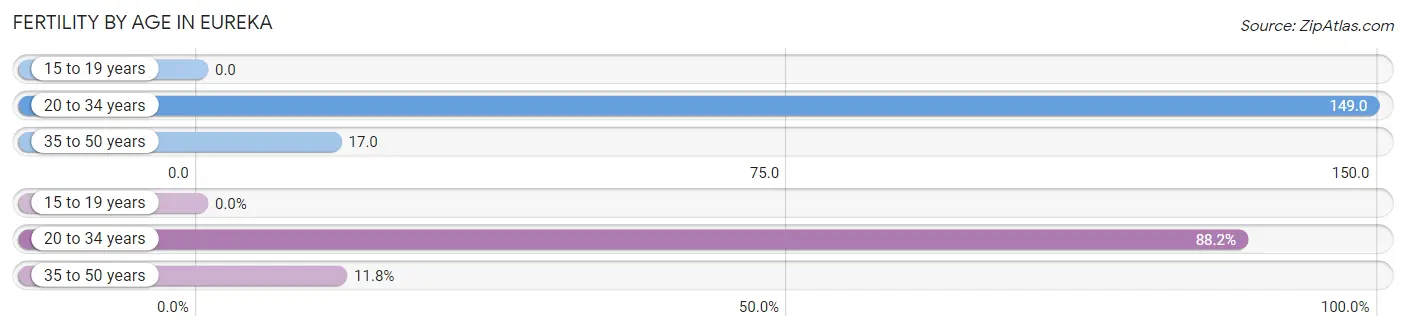
| Age Bracket | Women with Births | Births / 1,000 Women |
| 15 to 19 years | 0 (0.0%) | 0.0 |
| 20 to 34 years | 142 (88.2%) | 149.0 |
| 35 to 50 years | 19 (11.8%) | 17.0 |
| Total | 161 (100.0%) | 67.0 |
Fertility by Age by Marriage Status in Eureka
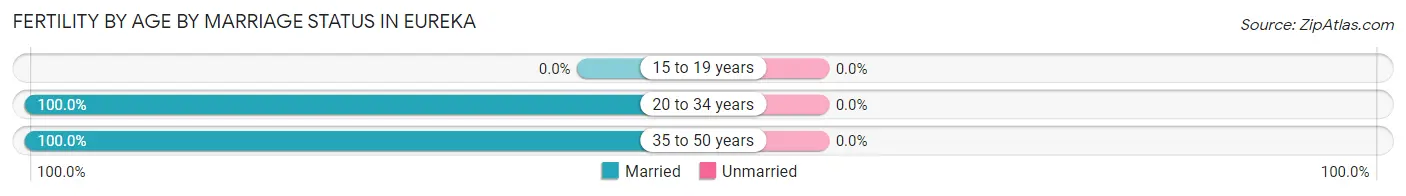
| Age Bracket | Married | Unmarried |
| 15 to 19 years | 0 (0.0%) | 0 (0.0%) |
| 20 to 34 years | 142 (100.0%) | 0 (0.0%) |
| 35 to 50 years | 19 (100.0%) | 0 (0.0%) |
| Total | 161 (100.0%) | 0 (0.0%) |
Fertility by Education in Eureka
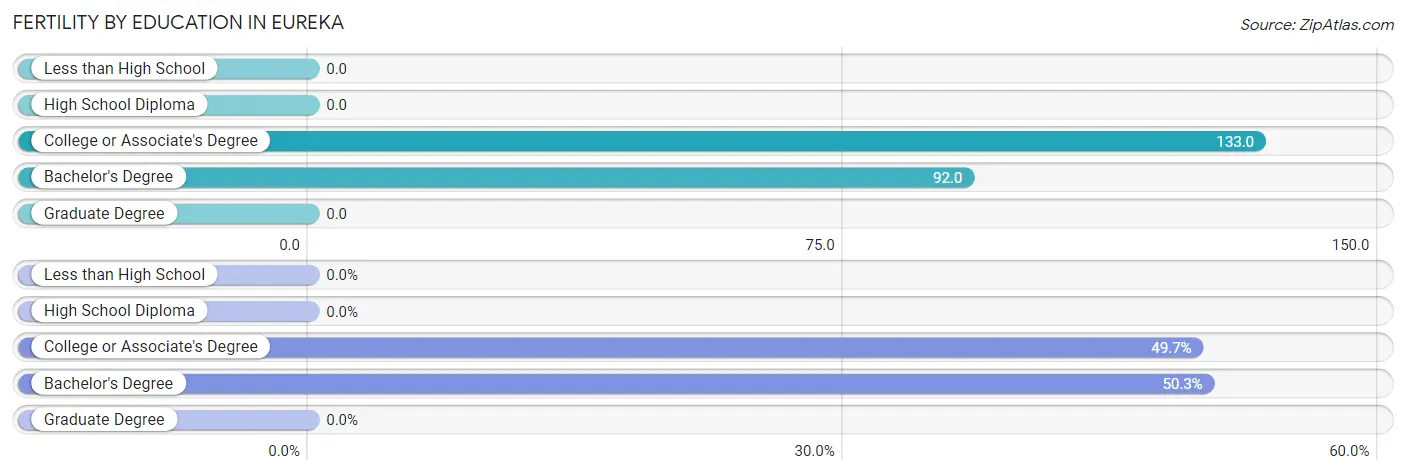
| Educational Attainment | Women with Births | Births / 1,000 Women |
| Less than High School | 0 (0.0%) | 0.0 |
| High School Diploma | 0 (0.0%) | 0.0 |
| College or Associate's Degree | 80 (49.7%) | 133.0 |
| Bachelor's Degree | 81 (50.3%) | 92.0 |
| Graduate Degree | 0 (0.0%) | 0.0 |
| Total | 161 (100.0%) | 67.0 |
Fertility by Education by Marriage Status in Eureka
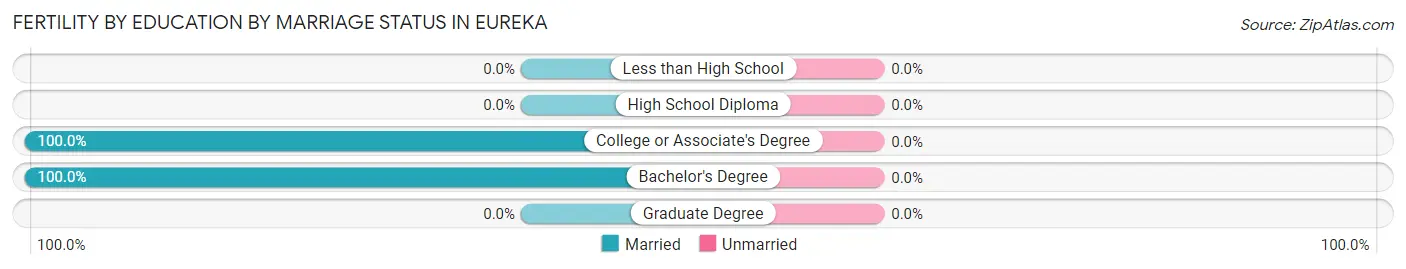
| Educational Attainment | Married | Unmarried |
| Less than High School | 0 (0.0%) | 0 (0.0%) |
| High School Diploma | 0 (0.0%) | 0 (0.0%) |
| College or Associate's Degree | 80 (100.0%) | 0 (0.0%) |
| Bachelor's Degree | 81 (100.0%) | 0 (0.0%) |
| Graduate Degree | 0 (0.0%) | 0 (0.0%) |
| Total | 161 (100.0%) | 0 (0.0%) |
Employment Characteristics in Eureka
Employment by Class of Employer in Eureka
Among the 5,616 employed individuals in Eureka, private company employees (3,814 | 67.9%), local government employees (480 | 8.6%), and federal government employees (443 | 7.9%) make up the most common classes of employment.
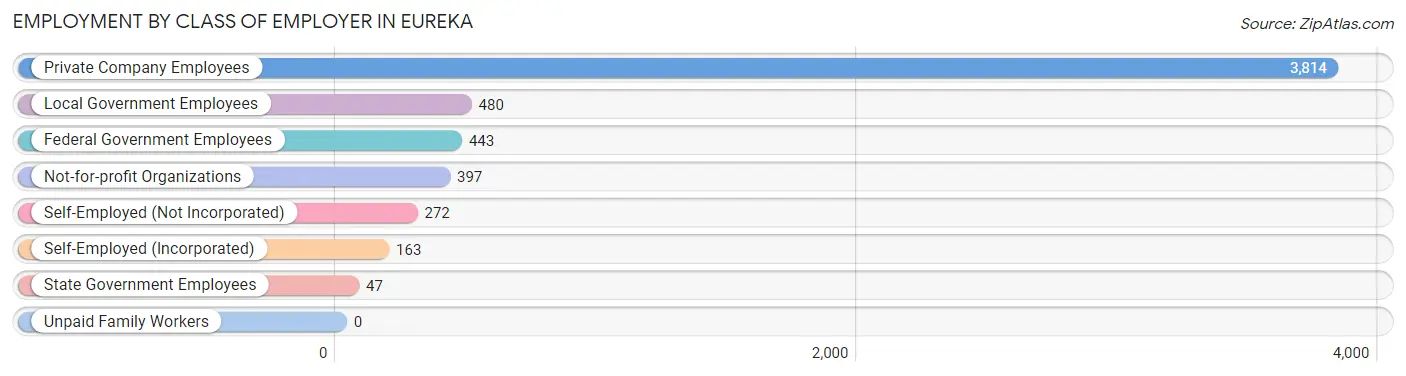
| Employer Class | # Employees | % Employees |
| Private Company Employees | 3,814 | 67.9% |
| Self-Employed (Incorporated) | 163 | 2.9% |
| Self-Employed (Not Incorporated) | 272 | 4.8% |
| Not-for-profit Organizations | 397 | 7.1% |
| Local Government Employees | 480 | 8.6% |
| State Government Employees | 47 | 0.8% |
| Federal Government Employees | 443 | 7.9% |
| Unpaid Family Workers | 0 | 0.0% |
| Total | 5,616 | 100.0% |
Employment Status by Age in Eureka
According to the labor force statistics for Eureka, out of the total population over 16 years of age (8,797), 68.5% or 6,026 individuals are in the labor force, with 5.4% or 325 of them unemployed. The age group with the highest labor force participation rate is 20 to 24 years, with 100.0% or 409 individuals in the labor force. Within the labor force, the 75 years and over age range has the highest percentage of unemployed individuals, with 62.2% or 28 of them being unemployed.
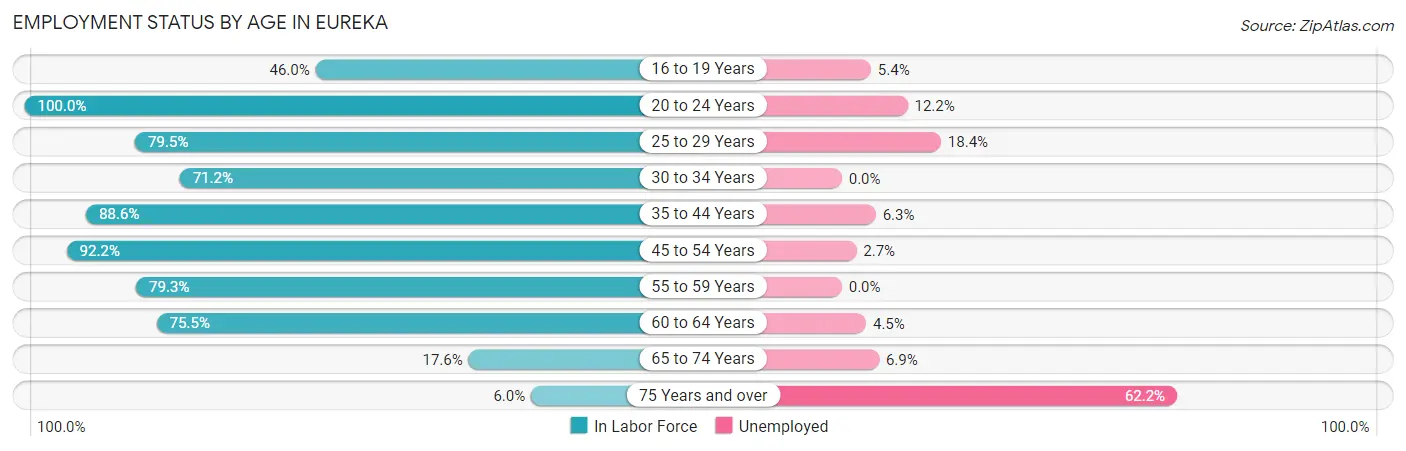
| Age Bracket | In Labor Force | Unemployed |
| 16 to 19 Years | 279 (46.0%) | 15 (5.4%) |
| 20 to 24 Years | 409 (100.0%) | 50 (12.2%) |
| 25 to 29 Years | 381 (79.5%) | 70 (18.4%) |
| 30 to 34 Years | 577 (71.2%) | 0 (0.0%) |
| 35 to 44 Years | 1,532 (88.6%) | 97 (6.3%) |
| 45 to 54 Years | 1,430 (92.2%) | 39 (2.7%) |
| 55 to 59 Years | 835 (79.3%) | 0 (0.0%) |
| 60 to 64 Years | 382 (75.5%) | 17 (4.5%) |
| 65 to 74 Years | 160 (17.6%) | 11 (6.9%) |
| 75 Years and over | 45 (6.0%) | 28 (62.2%) |
| Total | 6,026 (68.5%) | 325 (5.4%) |
Employment Status by Educational Attainment in Eureka
According to labor force statistics for Eureka, 83.8% of individuals (5,135) out of the total population between 25 and 64 years of age (6,128) are in the labor force, with 4.3% or 221 of them being unemployed. The group with the highest labor force participation rate are those with the educational attainment of bachelor's degree or higher, with 89.6% or 3,099 individuals in the labor force. Within the labor force, individuals with less than high school education have the highest percentage of unemployment, with 39.8% or 41 of them being unemployed.
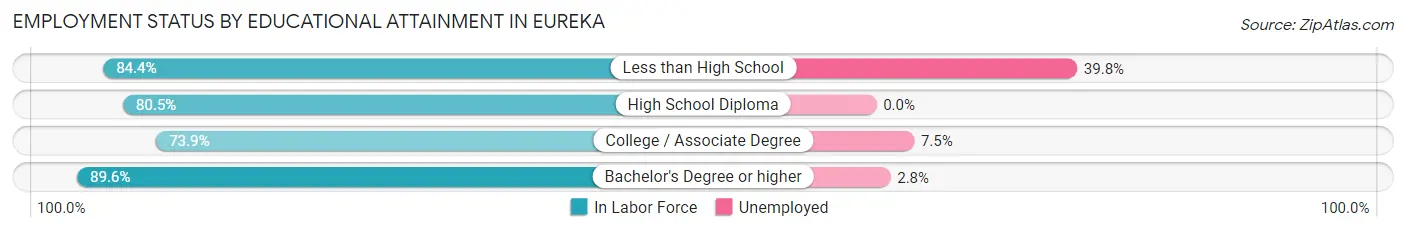
| Educational Attainment | In Labor Force | Unemployed |
| Less than High School | 103 (84.4%) | 49 (39.8%) |
| High School Diploma | 650 (80.5%) | 0 (0.0%) |
| College / Associate Degree | 1,286 (73.9%) | 130 (7.5%) |
| Bachelor's Degree or higher | 3,099 (89.6%) | 97 (2.8%) |
| Total | 5,135 (83.8%) | 264 (4.3%) |
Employment Occupations by Sex in Eureka
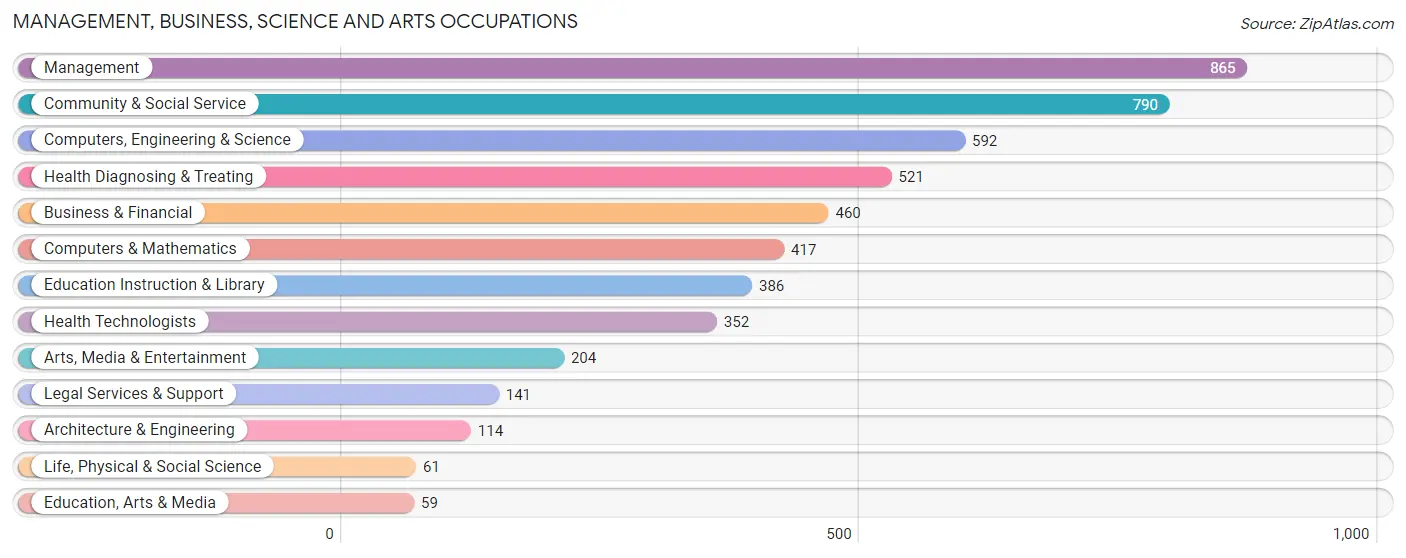
Management, Business, Science and Arts Occupations
The most common Management, Business, Science and Arts occupations in Eureka are Management (865 | 15.2%), Community & Social Service (790 | 13.9%), Computers, Engineering & Science (592 | 10.4%), Health Diagnosing & Treating (521 | 9.2%), and Business & Financial (460 | 8.1%).
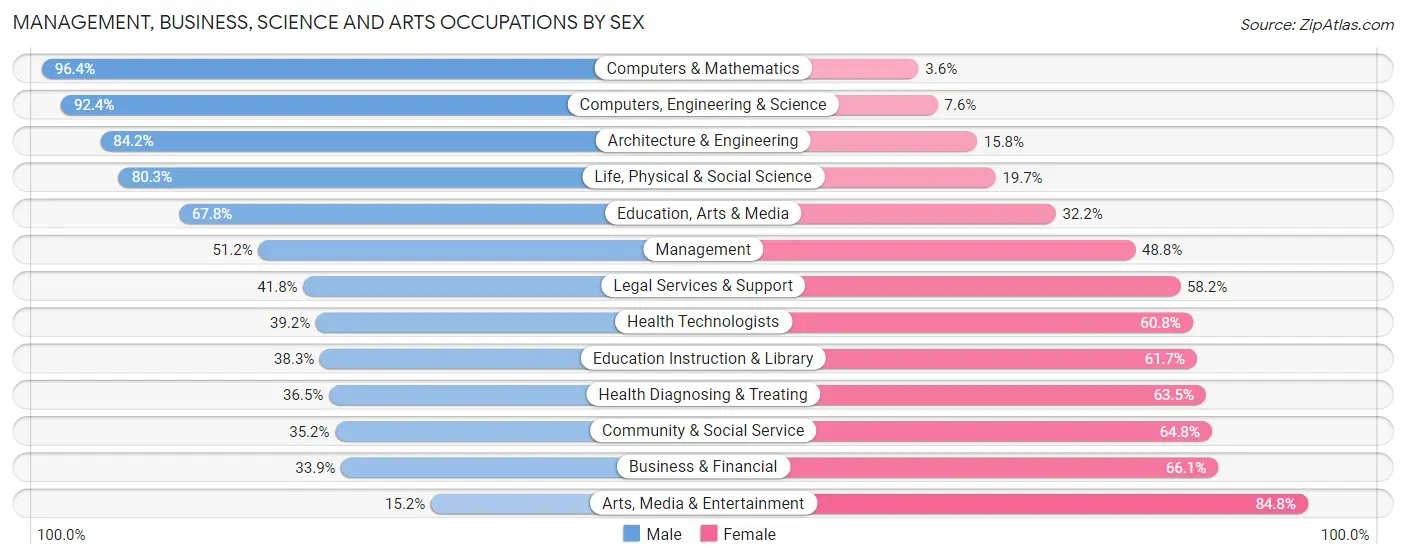
Management, Business, Science and Arts Occupations by Sex
Within the Management, Business, Science and Arts occupations in Eureka, the most male-oriented occupations are Computers & Mathematics (96.4%), Computers, Engineering & Science (92.4%), and Architecture & Engineering (84.2%), while the most female-oriented occupations are Arts, Media & Entertainment (84.8%), Business & Financial (66.1%), and Community & Social Service (64.8%).
| Occupation | Male | Female |
| Management | 443 (51.2%) | 422 (48.8%) |
| Business & Financial | 156 (33.9%) | 304 (66.1%) |
| Computers, Engineering & Science | 547 (92.4%) | 45 (7.6%) |
| Computers & Mathematics | 402 (96.4%) | 15 (3.6%) |
| Architecture & Engineering | 96 (84.2%) | 18 (15.8%) |
| Life, Physical & Social Science | 49 (80.3%) | 12 (19.7%) |
| Community & Social Service | 278 (35.2%) | 512 (64.8%) |
| Education, Arts & Media | 40 (67.8%) | 19 (32.2%) |
| Legal Services & Support | 59 (41.8%) | 82 (58.2%) |
| Education Instruction & Library | 148 (38.3%) | 238 (61.7%) |
| Arts, Media & Entertainment | 31 (15.2%) | 173 (84.8%) |
| Health Diagnosing & Treating | 190 (36.5%) | 331 (63.5%) |
| Health Technologists | 138 (39.2%) | 214 (60.8%) |
| Total (Category) | 1,614 (50.0%) | 1,614 (50.0%) |
| Total (Overall) | 3,266 (57.4%) | 2,423 (42.6%) |
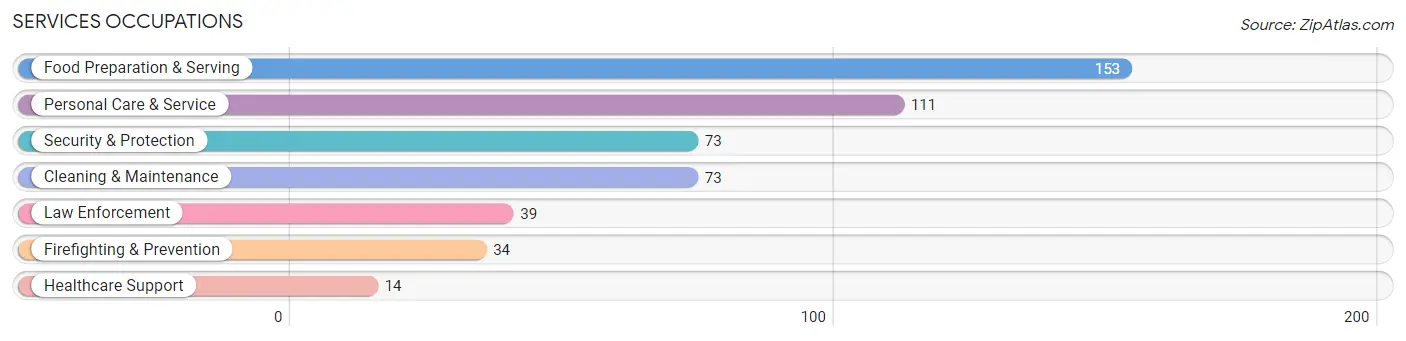
Services Occupations
The most common Services occupations in Eureka are Food Preparation & Serving (153 | 2.7%), Personal Care & Service (111 | 1.9%), Security & Protection (73 | 1.3%), Cleaning & Maintenance (73 | 1.3%), and Law Enforcement (39 | 0.7%).
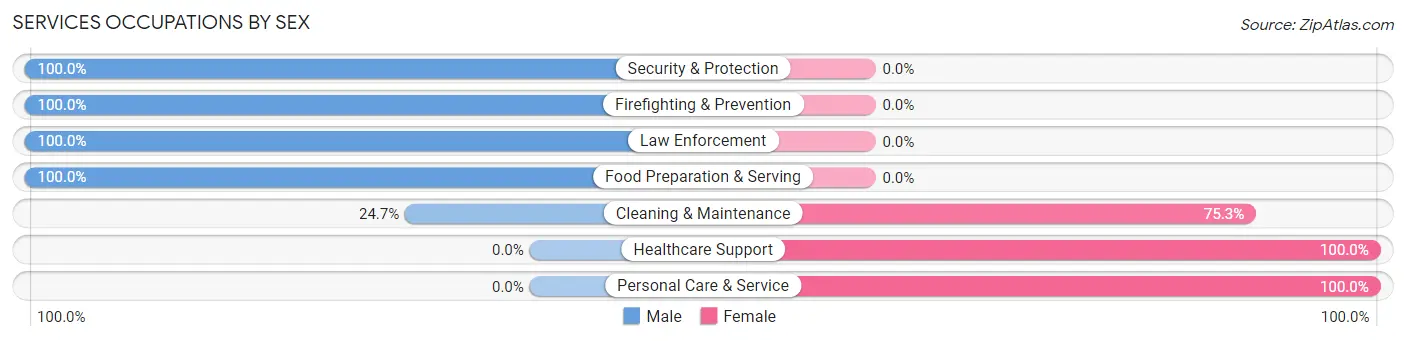
Services Occupations by Sex
Within the Services occupations in Eureka, the most male-oriented occupations are Security & Protection (100.0%), Firefighting & Prevention (100.0%), and Law Enforcement (100.0%), while the most female-oriented occupations are Healthcare Support (100.0%), Personal Care & Service (100.0%), and Cleaning & Maintenance (75.3%).
| Occupation | Male | Female |
| Healthcare Support | 0 (0.0%) | 14 (100.0%) |
| Security & Protection | 73 (100.0%) | 0 (0.0%) |
| Firefighting & Prevention | 34 (100.0%) | 0 (0.0%) |
| Law Enforcement | 39 (100.0%) | 0 (0.0%) |
| Food Preparation & Serving | 153 (100.0%) | 0 (0.0%) |
| Cleaning & Maintenance | 18 (24.7%) | 55 (75.3%) |
| Personal Care & Service | 0 (0.0%) | 111 (100.0%) |
| Total (Category) | 244 (57.6%) | 180 (42.4%) |
| Total (Overall) | 3,266 (57.4%) | 2,423 (42.6%) |
Sales and Office Occupations
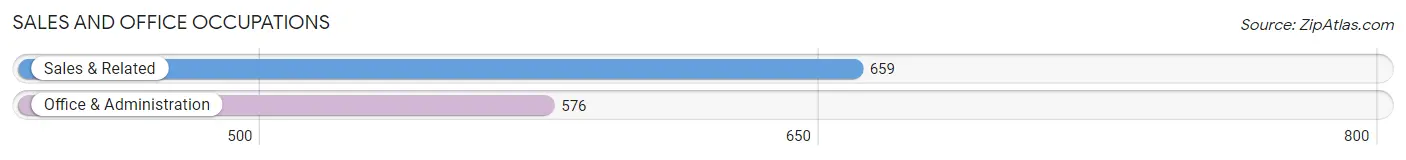
The most common Sales and Office occupations in Eureka are Sales & Related (659 | 11.6%), and Office & Administration (576 | 10.1%).
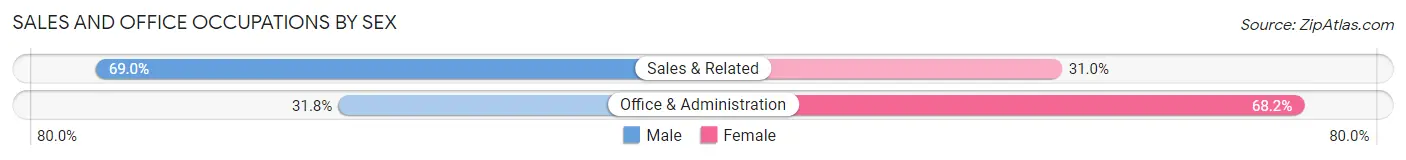
Sales and Office Occupations by Sex
| Occupation | Male | Female |
| Sales & Related | 455 (69.0%) | 204 (31.0%) |
| Office & Administration | 183 (31.8%) | 393 (68.2%) |
| Total (Category) | 638 (51.7%) | 597 (48.3%) |
| Total (Overall) | 3,266 (57.4%) | 2,423 (42.6%) |
Natural Resources, Construction and Maintenance Occupations
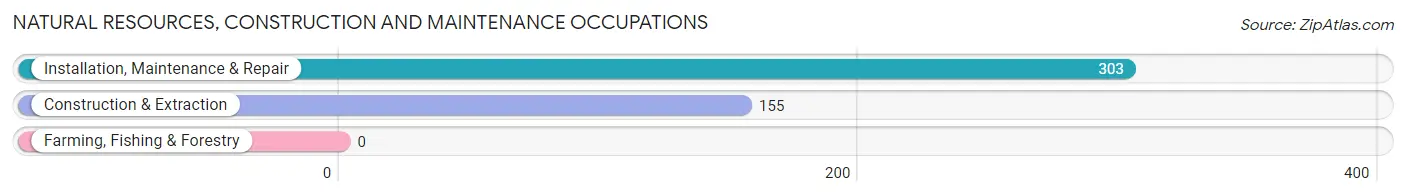
The most common Natural Resources, Construction and Maintenance occupations in Eureka are Installation, Maintenance & Repair (303 | 5.3%), and Construction & Extraction (155 | 2.7%).
Natural Resources, Construction and Maintenance Occupations by Sex

| Occupation | Male | Female |
| Farming, Fishing & Forestry | 0 (0.0%) | 0 (0.0%) |
| Construction & Extraction | 155 (100.0%) | 0 (0.0%) |
| Installation, Maintenance & Repair | 303 (100.0%) | 0 (0.0%) |
| Total (Category) | 458 (100.0%) | 0 (0.0%) |
| Total (Overall) | 3,266 (57.4%) | 2,423 (42.6%) |
Production, Transportation and Moving Occupations
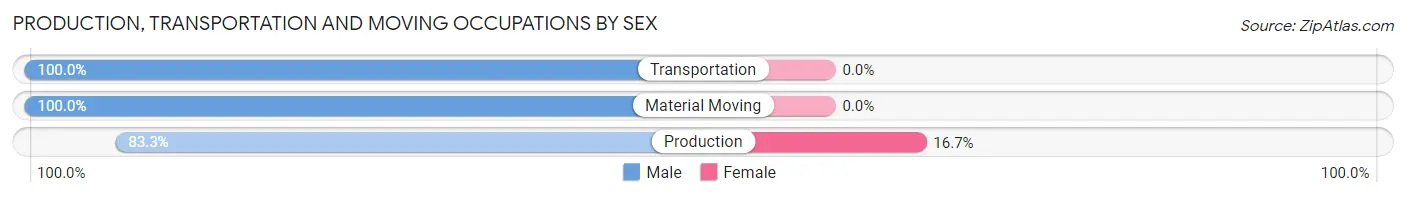
The most common Production, Transportation and Moving occupations in Eureka are Production (192 | 3.4%), Material Moving (78 | 1.4%), and Transportation (74 | 1.3%).

Production, Transportation and Moving Occupations by Sex
| Occupation | Male | Female |
| Production | 160 (83.3%) | 32 (16.7%) |
| Transportation | 74 (100.0%) | 0 (0.0%) |
| Material Moving | 78 (100.0%) | 0 (0.0%) |
| Total (Category) | 312 (90.7%) | 32 (9.3%) |
| Total (Overall) | 3,266 (57.4%) | 2,423 (42.6%) |
Employment Industries by Sex in Eureka
Employment Industries in Eureka
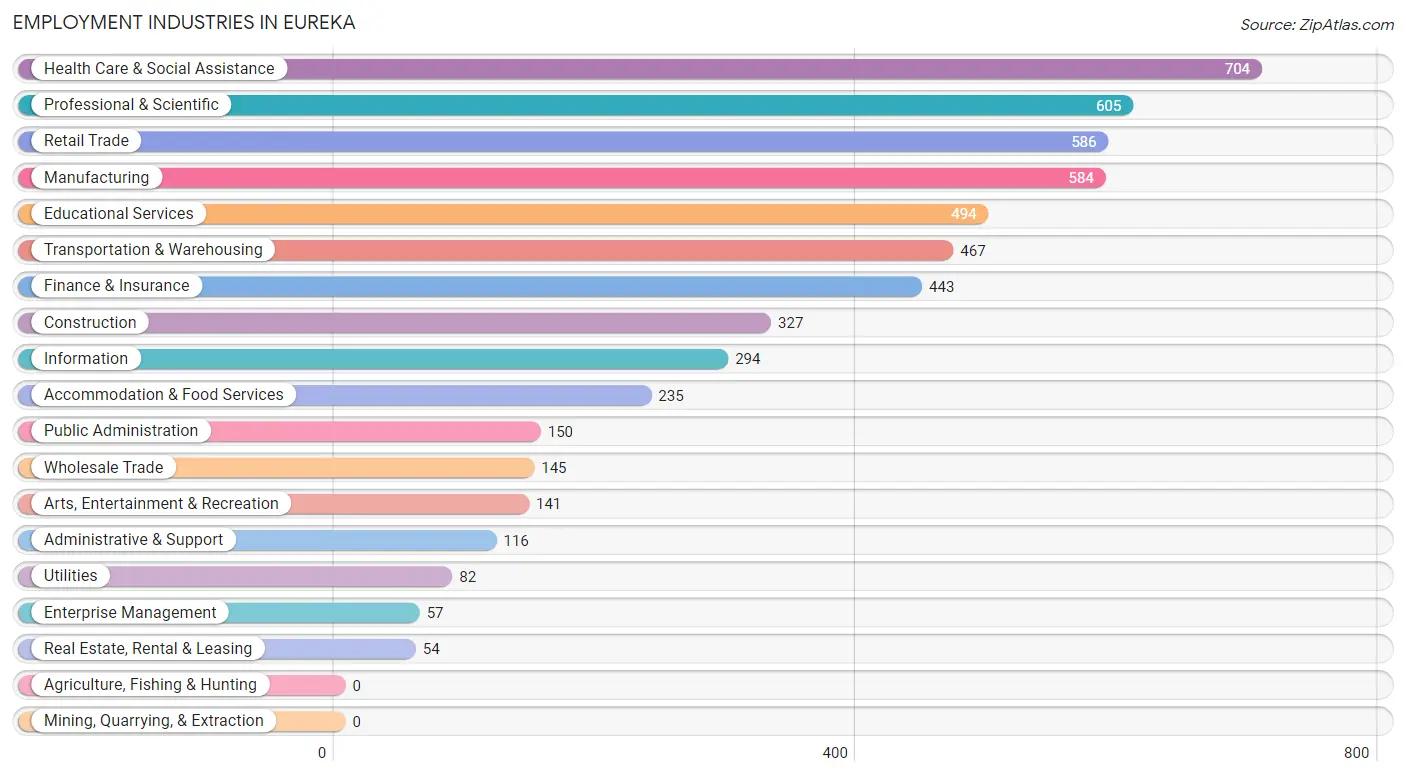
The major employment industries in Eureka include Health Care & Social Assistance (704 | 12.4%), Professional & Scientific (605 | 10.6%), Retail Trade (586 | 10.3%), Manufacturing (584 | 10.3%), and Educational Services (494 | 8.7%).
Employment Industries by Sex in Eureka
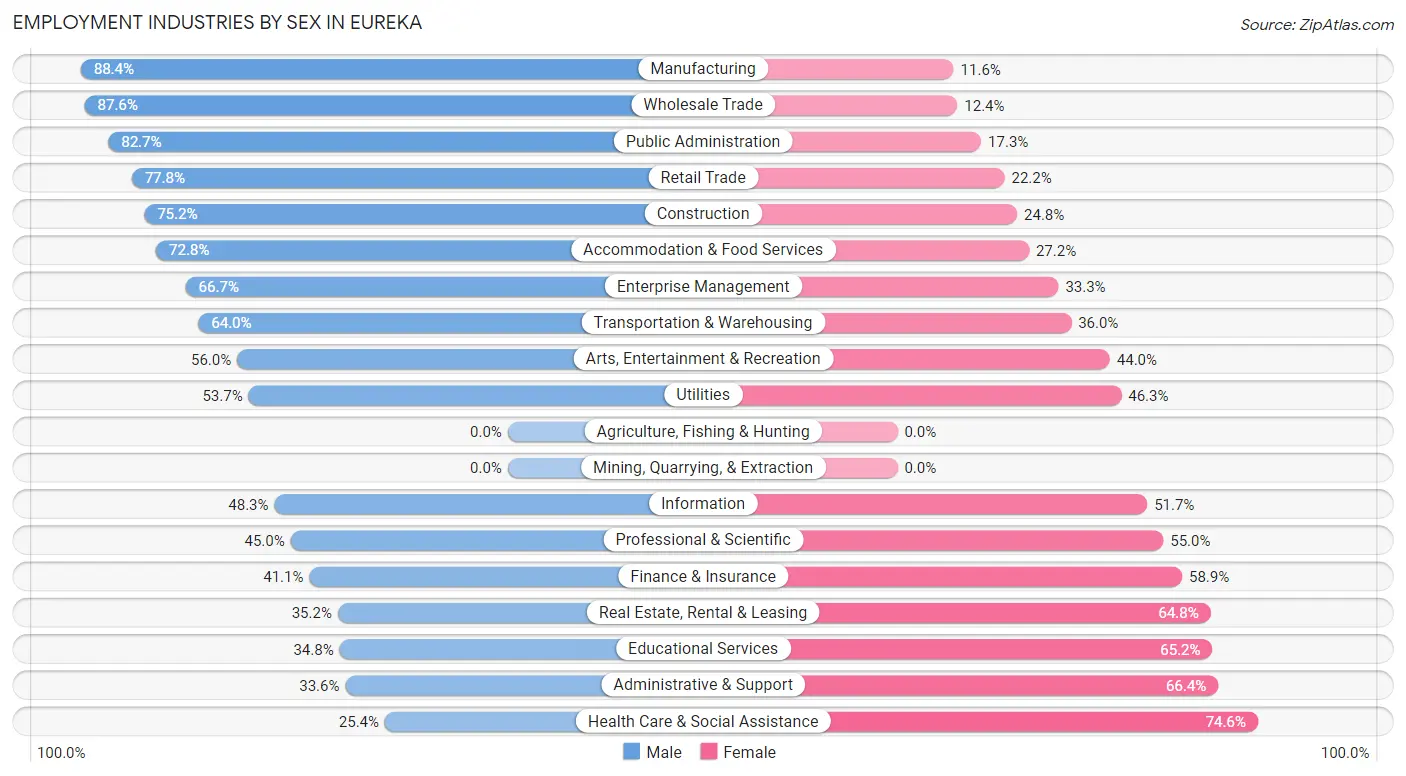
The Eureka industries that see more men than women are Manufacturing (88.4%), Wholesale Trade (87.6%), and Public Administration (82.7%), whereas the industries that tend to have a higher number of women are Health Care & Social Assistance (74.6%), Administrative & Support (66.4%), and Educational Services (65.2%).
| Industry | Male | Female |
| Agriculture, Fishing & Hunting | 0 (0.0%) | 0 (0.0%) |
| Mining, Quarrying, & Extraction | 0 (0.0%) | 0 (0.0%) |
| Construction | 246 (75.2%) | 81 (24.8%) |
| Manufacturing | 516 (88.4%) | 68 (11.6%) |
| Wholesale Trade | 127 (87.6%) | 18 (12.4%) |
| Retail Trade | 456 (77.8%) | 130 (22.2%) |
| Transportation & Warehousing | 299 (64.0%) | 168 (36.0%) |
| Utilities | 44 (53.7%) | 38 (46.3%) |
| Information | 142 (48.3%) | 152 (51.7%) |
| Finance & Insurance | 182 (41.1%) | 261 (58.9%) |
| Real Estate, Rental & Leasing | 19 (35.2%) | 35 (64.8%) |
| Professional & Scientific | 272 (45.0%) | 333 (55.0%) |
| Enterprise Management | 38 (66.7%) | 19 (33.3%) |
| Administrative & Support | 39 (33.6%) | 77 (66.4%) |
| Educational Services | 172 (34.8%) | 322 (65.2%) |
| Health Care & Social Assistance | 179 (25.4%) | 525 (74.6%) |
| Arts, Entertainment & Recreation | 79 (56.0%) | 62 (44.0%) |
| Accommodation & Food Services | 171 (72.8%) | 64 (27.2%) |
| Public Administration | 124 (82.7%) | 26 (17.3%) |
| Total | 3,266 (57.4%) | 2,423 (42.6%) |
Education in Eureka
School Enrollment in Eureka
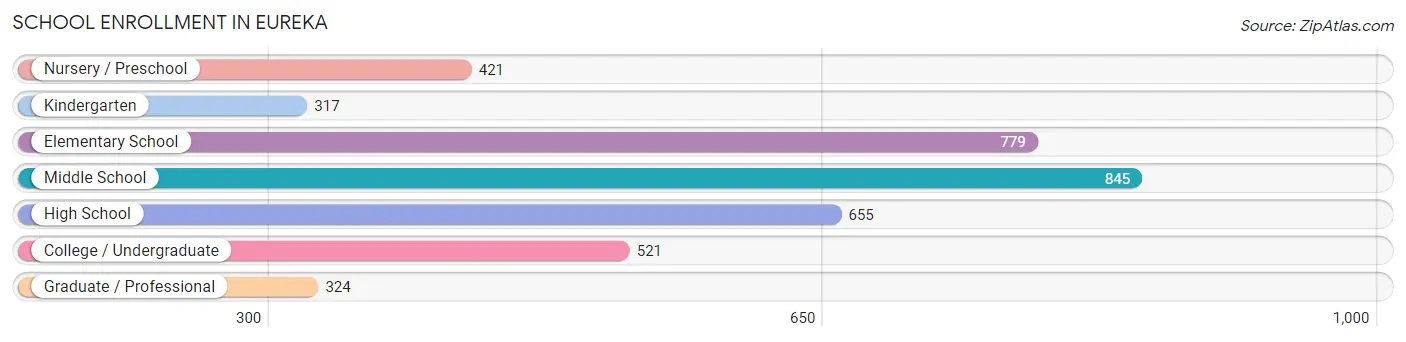
The most common levels of schooling among the 3,862 students in Eureka are middle school (845 | 21.9%), elementary school (779 | 20.2%), and high school (655 | 17.0%).
| School Level | # Students | % Students |
| Nursery / Preschool | 421 | 10.9% |
| Kindergarten | 317 | 8.2% |
| Elementary School | 779 | 20.2% |
| Middle School | 845 | 21.9% |
| High School | 655 | 17.0% |
| College / Undergraduate | 521 | 13.5% |
| Graduate / Professional | 324 | 8.4% |
| Total | 3,862 | 100.0% |
School Enrollment by Age by Funding Source in Eureka
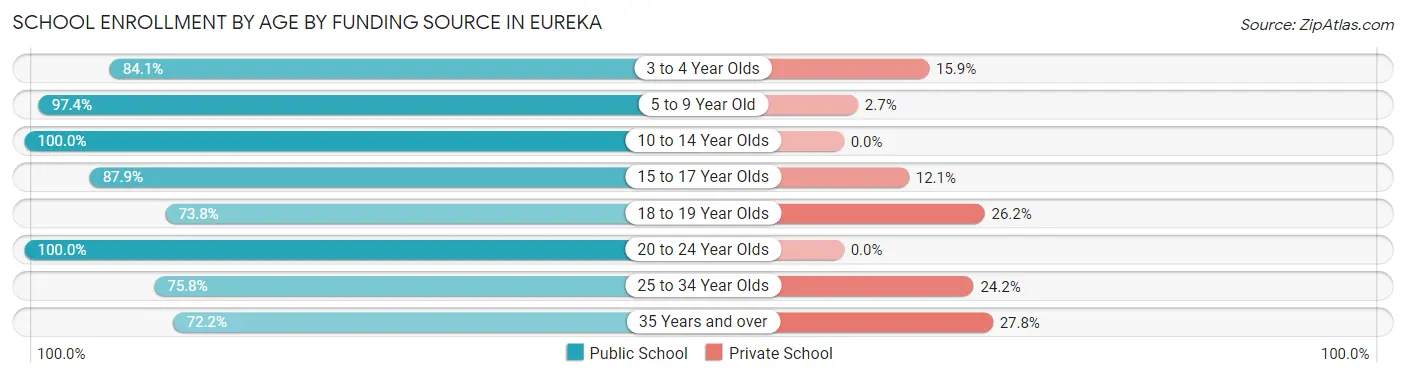
Out of a total of 3,862 students who are enrolled in schools in Eureka, 344 (8.9%) attend a private institution, while the remaining 3,518 (91.1%) are enrolled in public schools. The age group of 35 years and over has the highest likelihood of being enrolled in private schools, with 68 (27.8% in the age bracket) enrolled. Conversely, the age group of 10 to 14 year olds has the lowest likelihood of being enrolled in a private school, with 950 (100.0% in the age bracket) attending a public institution.
| Age Bracket | Public School | Private School |
| 3 to 4 Year Olds | 291 (84.1%) | 55 (15.9%) |
| 5 to 9 Year Old | 1,067 (97.4%) | 29 (2.6%) |
| 10 to 14 Year Olds | 950 (100.0%) | 0 (0.0%) |
| 15 to 17 Year Olds | 536 (87.9%) | 74 (12.1%) |
| 18 to 19 Year Olds | 149 (73.8%) | 53 (26.2%) |
| 20 to 24 Year Olds | 140 (100.0%) | 0 (0.0%) |
| 25 to 34 Year Olds | 207 (75.8%) | 66 (24.2%) |
| 35 Years and over | 177 (72.2%) | 68 (27.8%) |
| Total | 3,518 (91.1%) | 344 (8.9%) |
Educational Attainment by Field of Study in Eureka
Business (1,063 | 25.4%), education (494 | 11.8%), science & technology (394 | 9.4%), communications (334 | 8.0%), and arts & humanities (303 | 7.2%) are the most common fields of study among 4,181 individuals in Eureka who have obtained a bachelor's degree or higher.
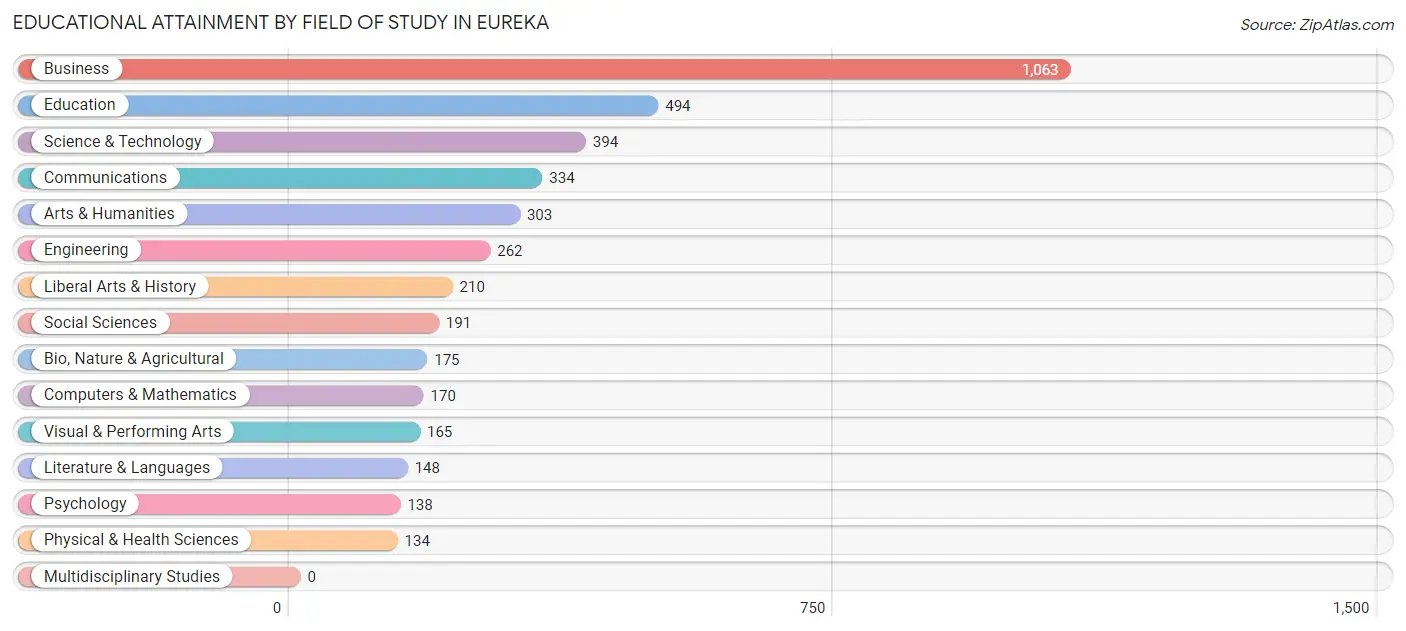
| Field of Study | # Graduates | % Graduates |
| Computers & Mathematics | 170 | 4.1% |
| Bio, Nature & Agricultural | 175 | 4.2% |
| Physical & Health Sciences | 134 | 3.2% |
| Psychology | 138 | 3.3% |
| Social Sciences | 191 | 4.6% |
| Engineering | 262 | 6.3% |
| Multidisciplinary Studies | 0 | 0.0% |
| Science & Technology | 394 | 9.4% |
| Business | 1,063 | 25.4% |
| Education | 494 | 11.8% |
| Literature & Languages | 148 | 3.5% |
| Liberal Arts & History | 210 | 5.0% |
| Visual & Performing Arts | 165 | 4.0% |
| Communications | 334 | 8.0% |
| Arts & Humanities | 303 | 7.2% |
| Total | 4,181 | 100.0% |
Transportation & Commute in Eureka
Vehicle Availability by Sex in Eureka
The most prevalent vehicle ownership categories in Eureka are males with 2 vehicles (1,587, accounting for 49.0%) and females with 2 vehicles (1,150, making up 66.9%).
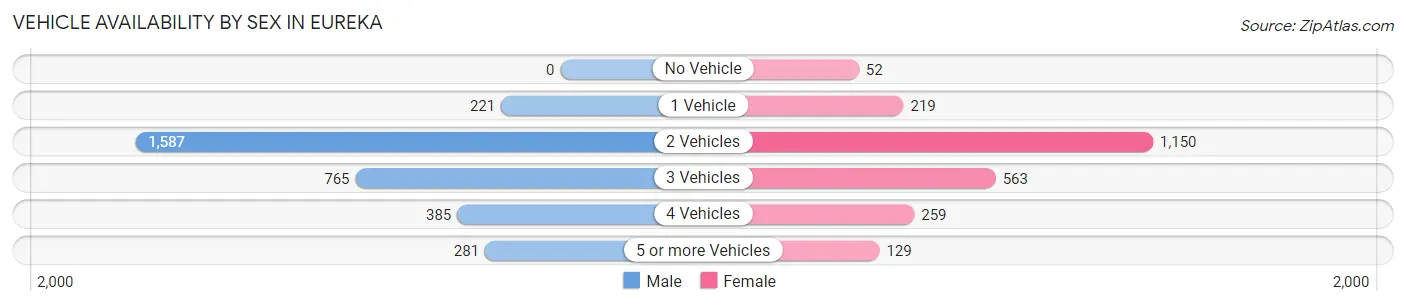
| Vehicles Available | Male | Female |
| No Vehicle | 0 (0.0%) | 52 (2.2%) |
| 1 Vehicle | 221 (6.8%) | 219 (9.2%) |
| 2 Vehicles | 1,587 (49.0%) | 1,150 (48.5%) |
| 3 Vehicles | 765 (23.6%) | 563 (23.7%) |
| 4 Vehicles | 385 (11.9%) | 259 (10.9%) |
| 5 or more Vehicles | 281 (8.7%) | 129 (5.4%) |
| Total | 3,239 (100.0%) | 2,372 (100.0%) |
Commute Time in Eureka
The most frequently occuring commute durations in Eureka are 30 to 34 minutes (1,007 commuters, 21.5%), 20 to 24 minutes (756 commuters, 16.2%), and 5 to 9 minutes (460 commuters, 9.8%).
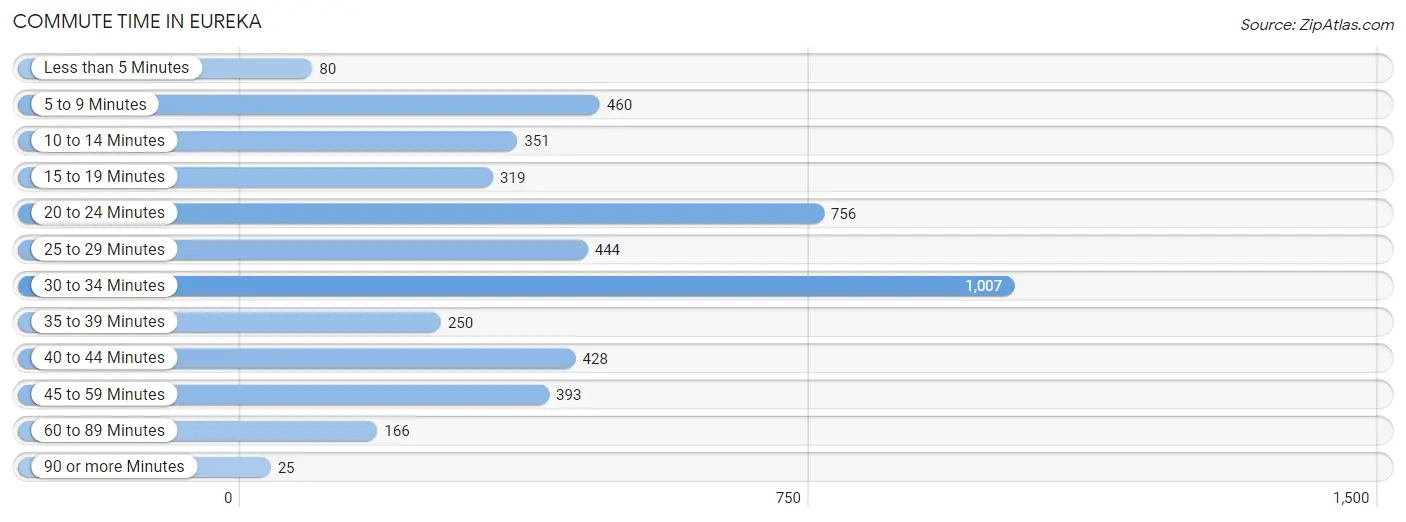
| Commute Time | # Commuters | % Commuters |
| Less than 5 Minutes | 80 | 1.7% |
| 5 to 9 Minutes | 460 | 9.8% |
| 10 to 14 Minutes | 351 | 7.5% |
| 15 to 19 Minutes | 319 | 6.8% |
| 20 to 24 Minutes | 756 | 16.2% |
| 25 to 29 Minutes | 444 | 9.5% |
| 30 to 34 Minutes | 1,007 | 21.5% |
| 35 to 39 Minutes | 250 | 5.3% |
| 40 to 44 Minutes | 428 | 9.1% |
| 45 to 59 Minutes | 393 | 8.4% |
| 60 to 89 Minutes | 166 | 3.5% |
| 90 or more Minutes | 25 | 0.5% |
Commute Time by Sex in Eureka
The most common commute times in Eureka are 30 to 34 minutes (628 commuters, 22.2%) for males and 30 to 34 minutes (379 commuters, 20.4%) for females.
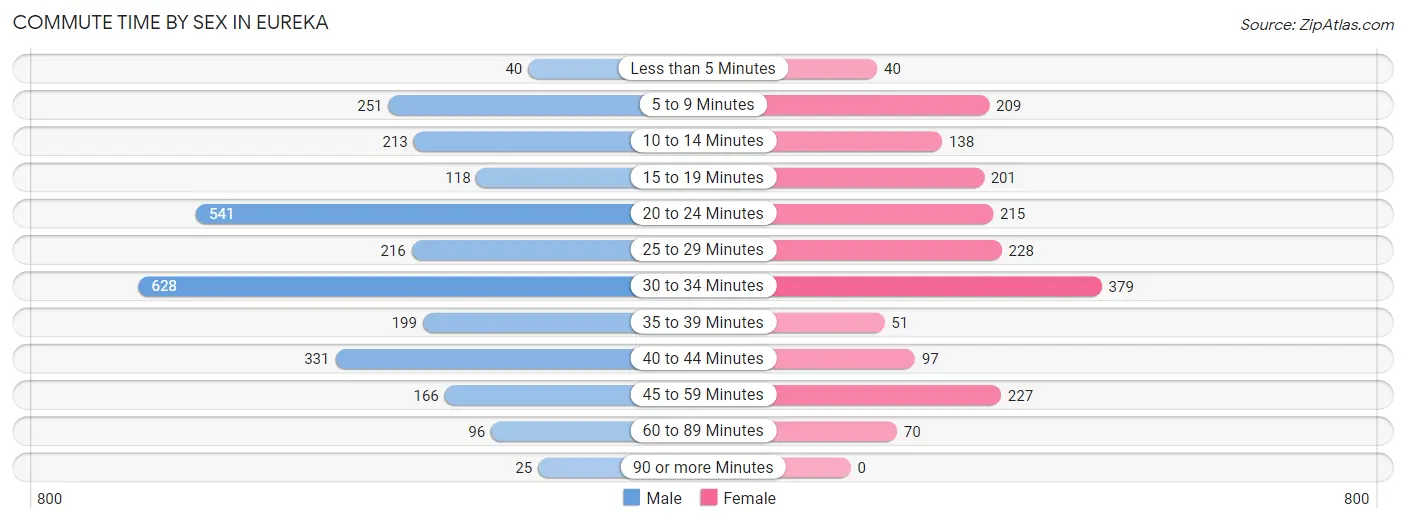
| Commute Time | Male | Female |
| Less than 5 Minutes | 40 (1.4%) | 40 (2.2%) |
| 5 to 9 Minutes | 251 (8.9%) | 209 (11.3%) |
| 10 to 14 Minutes | 213 (7.5%) | 138 (7.4%) |
| 15 to 19 Minutes | 118 (4.2%) | 201 (10.8%) |
| 20 to 24 Minutes | 541 (19.2%) | 215 (11.6%) |
| 25 to 29 Minutes | 216 (7.6%) | 228 (12.3%) |
| 30 to 34 Minutes | 628 (22.2%) | 379 (20.4%) |
| 35 to 39 Minutes | 199 (7.0%) | 51 (2.8%) |
| 40 to 44 Minutes | 331 (11.7%) | 97 (5.2%) |
| 45 to 59 Minutes | 166 (5.9%) | 227 (12.2%) |
| 60 to 89 Minutes | 96 (3.4%) | 70 (3.8%) |
| 90 or more Minutes | 25 (0.9%) | 0 (0.0%) |
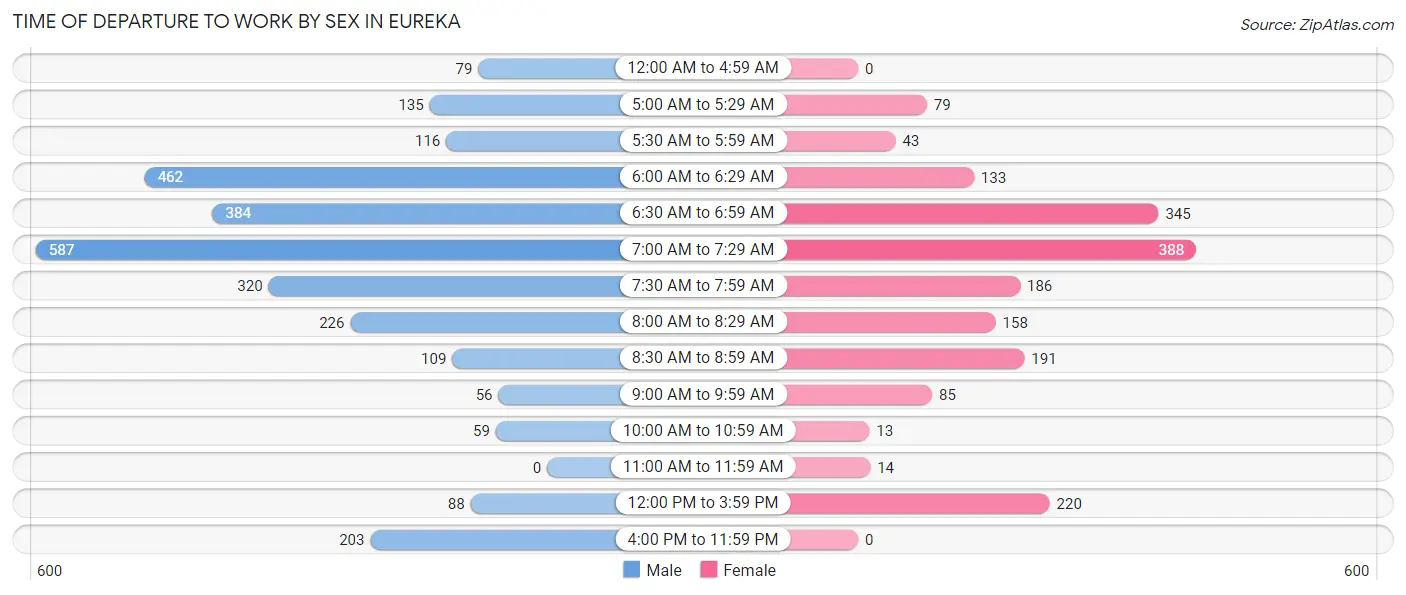
Time of Departure to Work by Sex in Eureka
The most frequent times of departure to work in Eureka are 7:00 AM to 7:29 AM (587, 20.8%) for males and 7:00 AM to 7:29 AM (388, 20.9%) for females.
| Time of Departure | Male | Female |
| 12:00 AM to 4:59 AM | 79 (2.8%) | 0 (0.0%) |
| 5:00 AM to 5:29 AM | 135 (4.8%) | 79 (4.3%) |
| 5:30 AM to 5:59 AM | 116 (4.1%) | 43 (2.3%) |
| 6:00 AM to 6:29 AM | 462 (16.4%) | 133 (7.2%) |
| 6:30 AM to 6:59 AM | 384 (13.6%) | 345 (18.6%) |
| 7:00 AM to 7:29 AM | 587 (20.8%) | 388 (20.9%) |
| 7:30 AM to 7:59 AM | 320 (11.3%) | 186 (10.0%) |
| 8:00 AM to 8:29 AM | 226 (8.0%) | 158 (8.5%) |
| 8:30 AM to 8:59 AM | 109 (3.9%) | 191 (10.3%) |
| 9:00 AM to 9:59 AM | 56 (2.0%) | 85 (4.6%) |
| 10:00 AM to 10:59 AM | 59 (2.1%) | 13 (0.7%) |
| 11:00 AM to 11:59 AM | 0 (0.0%) | 14 (0.7%) |
| 12:00 PM to 3:59 PM | 88 (3.1%) | 220 (11.9%) |
| 4:00 PM to 11:59 PM | 203 (7.2%) | 0 (0.0%) |
| Total | 2,824 (100.0%) | 1,855 (100.0%) |
Housing Occupancy in Eureka
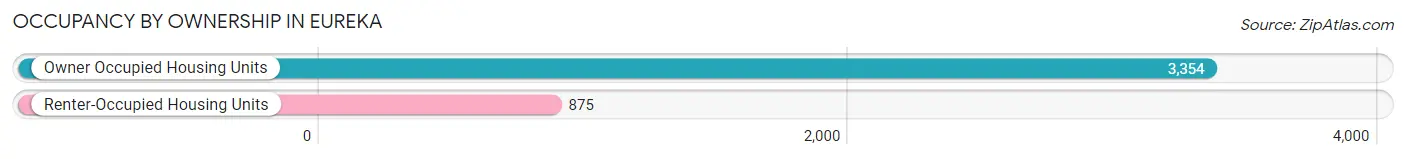
Occupancy by Ownership in Eureka
Of the total 4,229 dwellings in Eureka, owner-occupied units account for 3,354 (79.3%), while renter-occupied units make up 875 (20.7%).
| Occupancy | # Housing Units | % Housing Units |
| Owner Occupied Housing Units | 3,354 | 79.3% |
| Renter-Occupied Housing Units | 875 | 20.7% |
| Total Occupied Housing Units | 4,229 | 100.0% |
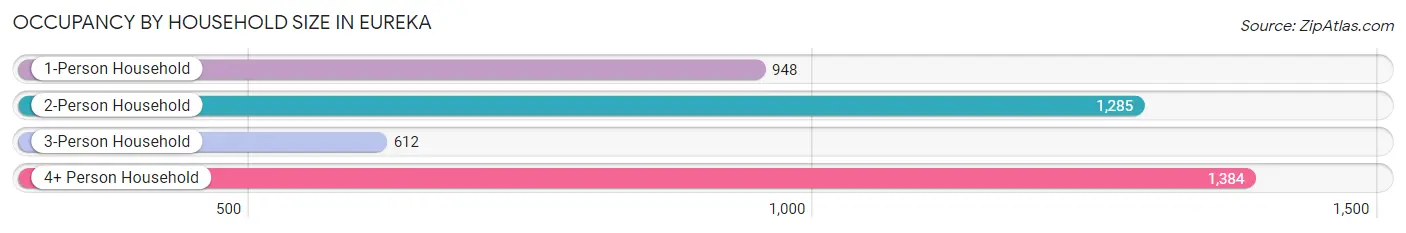
Occupancy by Household Size in Eureka
| Household Size | # Housing Units | % Housing Units |
| 1-Person Household | 948 | 22.4% |
| 2-Person Household | 1,285 | 30.4% |
| 3-Person Household | 612 | 14.5% |
| 4+ Person Household | 1,384 | 32.7% |
| Total Housing Units | 4,229 | 100.0% |
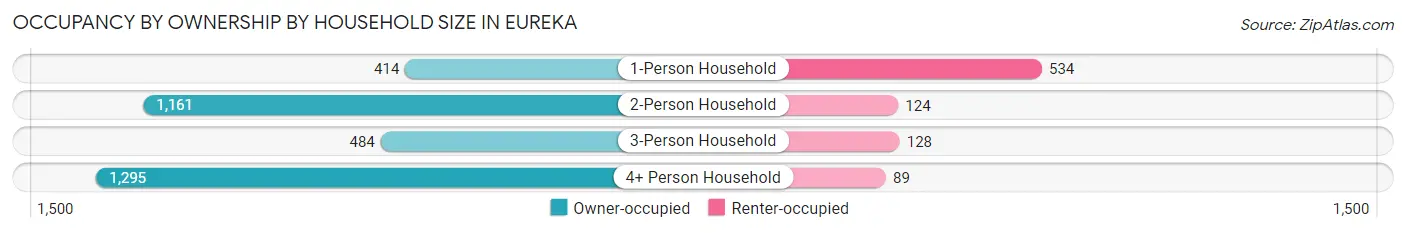
Occupancy by Ownership by Household Size in Eureka
| Household Size | Owner-occupied | Renter-occupied |
| 1-Person Household | 414 (43.7%) | 534 (56.3%) |
| 2-Person Household | 1,161 (90.3%) | 124 (9.7%) |
| 3-Person Household | 484 (79.1%) | 128 (20.9%) |
| 4+ Person Household | 1,295 (93.6%) | 89 (6.4%) |
| Total Housing Units | 3,354 (79.3%) | 875 (20.7%) |
Occupancy by Educational Attainment in Eureka
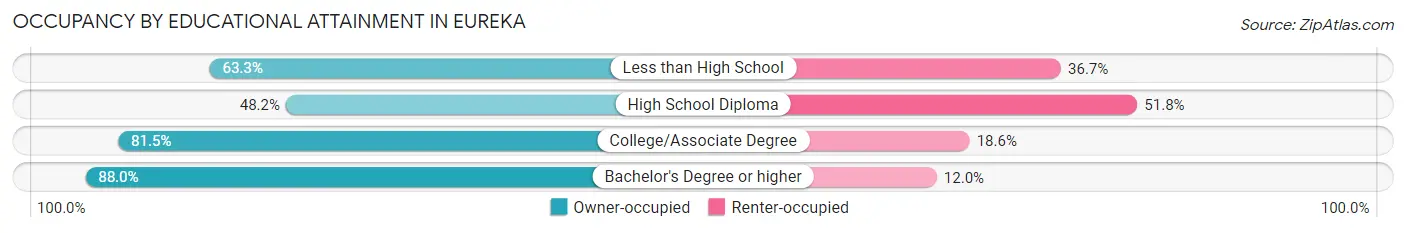
| Household Size | Owner-occupied | Renter-occupied |
| Less than High School | 76 (63.3%) | 44 (36.7%) |
| High School Diploma | 310 (48.2%) | 333 (51.8%) |
| College/Associate Degree | 1,010 (81.5%) | 230 (18.5%) |
| Bachelor's Degree or higher | 1,958 (88.0%) | 268 (12.0%) |
Occupancy by Age of Householder in Eureka
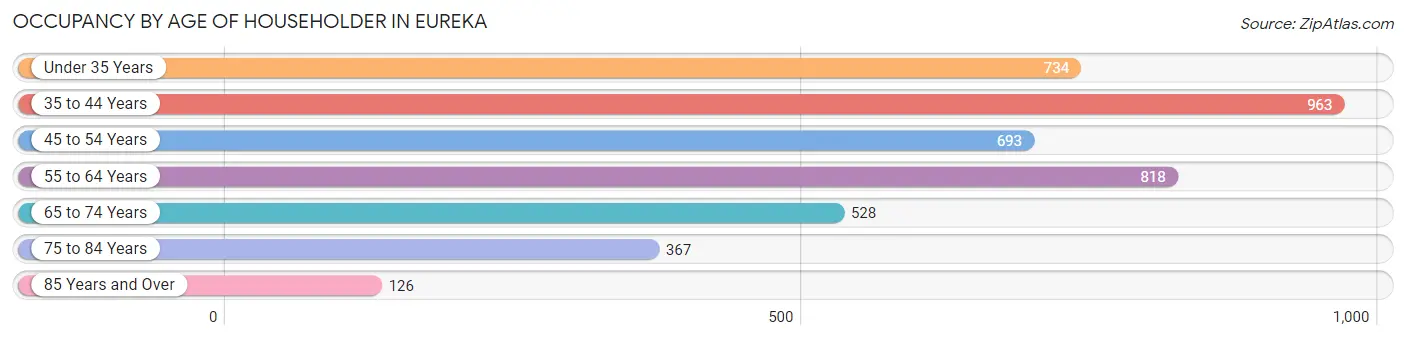
| Age Bracket | # Households | % Households |
| Under 35 Years | 734 | 17.4% |
| 35 to 44 Years | 963 | 22.8% |
| 45 to 54 Years | 693 | 16.4% |
| 55 to 64 Years | 818 | 19.3% |
| 65 to 74 Years | 528 | 12.5% |
| 75 to 84 Years | 367 | 8.7% |
| 85 Years and Over | 126 | 3.0% |
| Total | 4,229 | 100.0% |
Housing Finances in Eureka
Median Income by Occupancy in Eureka
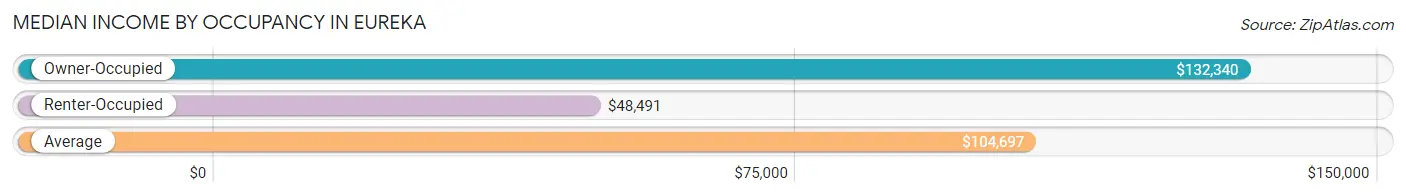
| Occupancy Type | # Households | Median Income |
| Owner-Occupied | 3,354 (79.3%) | $132,340 |
| Renter-Occupied | 875 (20.7%) | $48,491 |
| Average | 4,229 (100.0%) | $104,697 |
Occupancy by Householder Income Bracket in Eureka
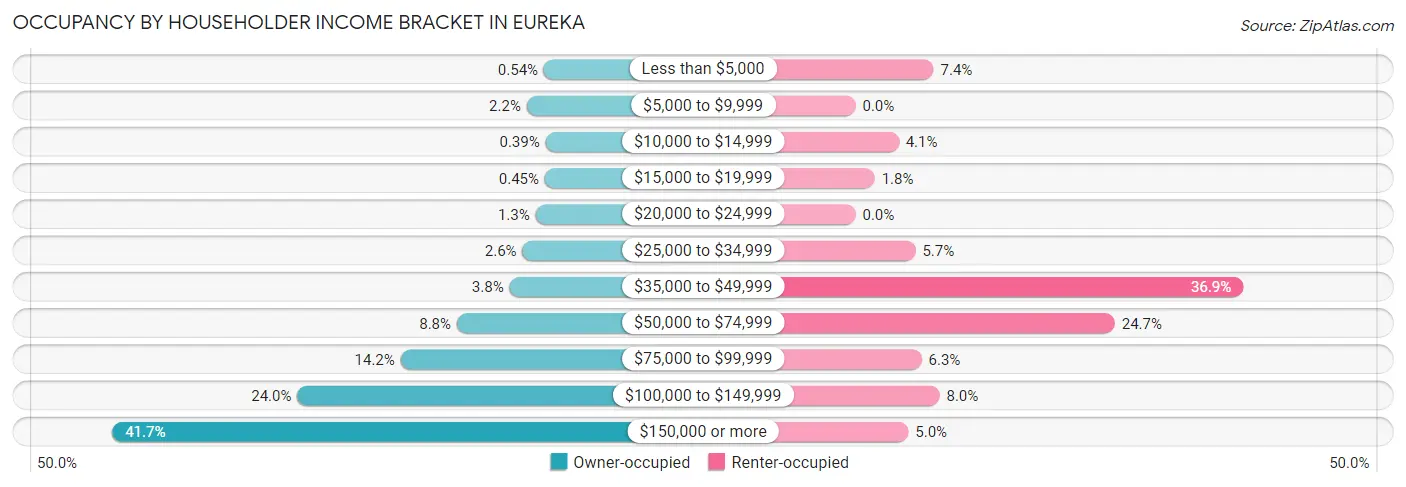
| Income Bracket | Owner-occupied | Renter-occupied |
| Less than $5,000 | 18 (0.5%) | 65 (7.4%) |
| $5,000 to $9,999 | 73 (2.2%) | 0 (0.0%) |
| $10,000 to $14,999 | 13 (0.4%) | 36 (4.1%) |
| $15,000 to $19,999 | 15 (0.4%) | 16 (1.8%) |
| $20,000 to $24,999 | 45 (1.3%) | 0 (0.0%) |
| $25,000 to $34,999 | 87 (2.6%) | 50 (5.7%) |
| $35,000 to $49,999 | 128 (3.8%) | 323 (36.9%) |
| $50,000 to $74,999 | 296 (8.8%) | 216 (24.7%) |
| $75,000 to $99,999 | 476 (14.2%) | 55 (6.3%) |
| $100,000 to $149,999 | 806 (24.0%) | 70 (8.0%) |
| $150,000 or more | 1,397 (41.6%) | 44 (5.0%) |
| Total | 3,354 (100.0%) | 875 (100.0%) |
Monthly Housing Cost Tiers in Eureka
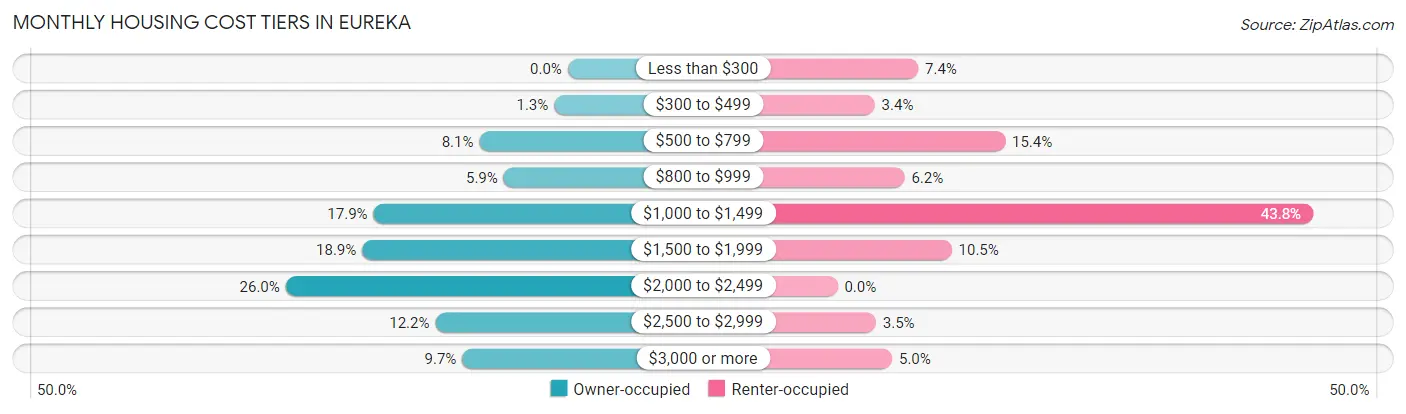
| Monthly Cost | Owner-occupied | Renter-occupied |
| Less than $300 | 0 (0.0%) | 65 (7.4%) |
| $300 to $499 | 42 (1.3%) | 30 (3.4%) |
| $500 to $799 | 273 (8.1%) | 135 (15.4%) |
| $800 to $999 | 198 (5.9%) | 54 (6.2%) |
| $1,000 to $1,499 | 600 (17.9%) | 383 (43.8%) |
| $1,500 to $1,999 | 635 (18.9%) | 92 (10.5%) |
| $2,000 to $2,499 | 871 (26.0%) | 0 (0.0%) |
| $2,500 to $2,999 | 409 (12.2%) | 31 (3.5%) |
| $3,000 or more | 326 (9.7%) | 44 (5.0%) |
| Total | 3,354 (100.0%) | 875 (100.0%) |
Physical Housing Characteristics in Eureka
Housing Structures in Eureka
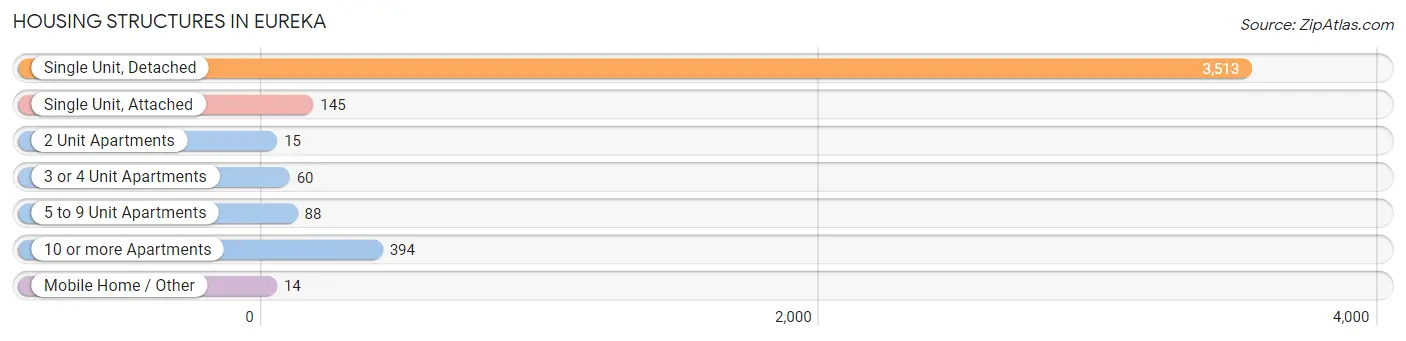
| Structure Type | # Housing Units | % Housing Units |
| Single Unit, Detached | 3,513 | 83.1% |
| Single Unit, Attached | 145 | 3.4% |
| 2 Unit Apartments | 15 | 0.4% |
| 3 or 4 Unit Apartments | 60 | 1.4% |
| 5 to 9 Unit Apartments | 88 | 2.1% |
| 10 or more Apartments | 394 | 9.3% |
| Mobile Home / Other | 14 | 0.3% |
| Total | 4,229 | 100.0% |
Housing Structures by Occupancy in Eureka
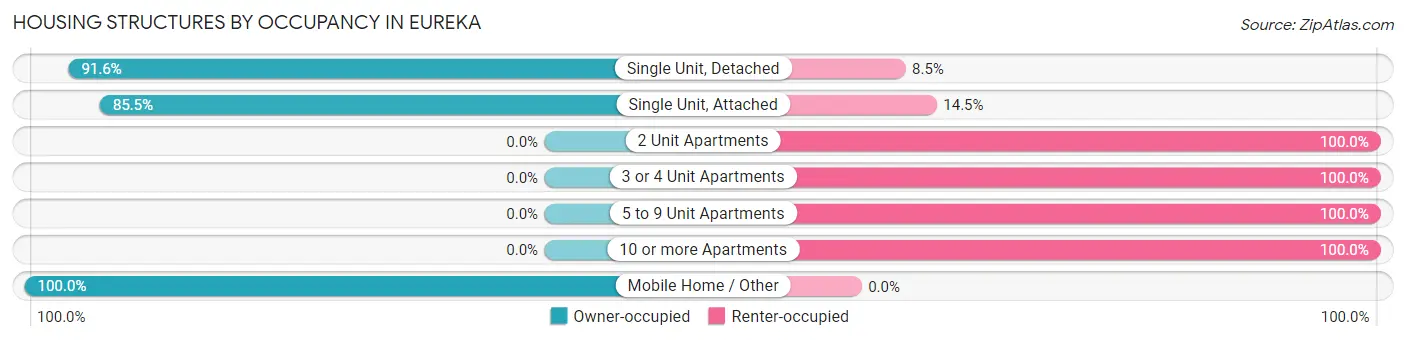
| Structure Type | Owner-occupied | Renter-occupied |
| Single Unit, Detached | 3,216 (91.5%) | 297 (8.5%) |
| Single Unit, Attached | 124 (85.5%) | 21 (14.5%) |
| 2 Unit Apartments | 0 (0.0%) | 15 (100.0%) |
| 3 or 4 Unit Apartments | 0 (0.0%) | 60 (100.0%) |
| 5 to 9 Unit Apartments | 0 (0.0%) | 88 (100.0%) |
| 10 or more Apartments | 0 (0.0%) | 394 (100.0%) |
| Mobile Home / Other | 14 (100.0%) | 0 (0.0%) |
| Total | 3,354 (79.3%) | 875 (20.7%) |
Housing Structures by Number of Rooms in Eureka
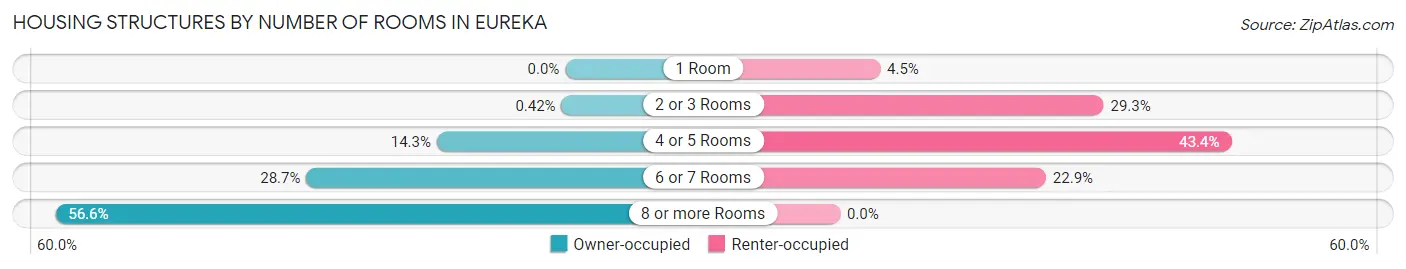
| Number of Rooms | Owner-occupied | Renter-occupied |
| 1 Room | 0 (0.0%) | 39 (4.5%) |
| 2 or 3 Rooms | 14 (0.4%) | 256 (29.3%) |
| 4 or 5 Rooms | 478 (14.2%) | 380 (43.4%) |
| 6 or 7 Rooms | 964 (28.7%) | 200 (22.9%) |
| 8 or more Rooms | 1,898 (56.6%) | 0 (0.0%) |
| Total | 3,354 (100.0%) | 875 (100.0%) |
Housing Structure by Heating Type in Eureka
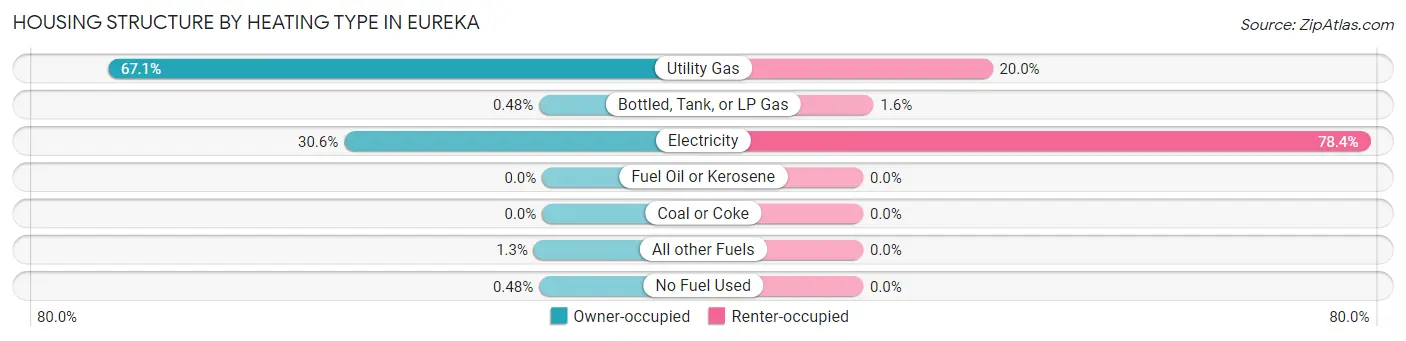
| Heating Type | Owner-occupied | Renter-occupied |
| Utility Gas | 2,252 (67.1%) | 175 (20.0%) |
| Bottled, Tank, or LP Gas | 16 (0.5%) | 14 (1.6%) |
| Electricity | 1,027 (30.6%) | 686 (78.4%) |
| Fuel Oil or Kerosene | 0 (0.0%) | 0 (0.0%) |
| Coal or Coke | 0 (0.0%) | 0 (0.0%) |
| All other Fuels | 43 (1.3%) | 0 (0.0%) |
| No Fuel Used | 16 (0.5%) | 0 (0.0%) |
| Total | 3,354 (100.0%) | 875 (100.0%) |
Household Vehicle Usage in Eureka
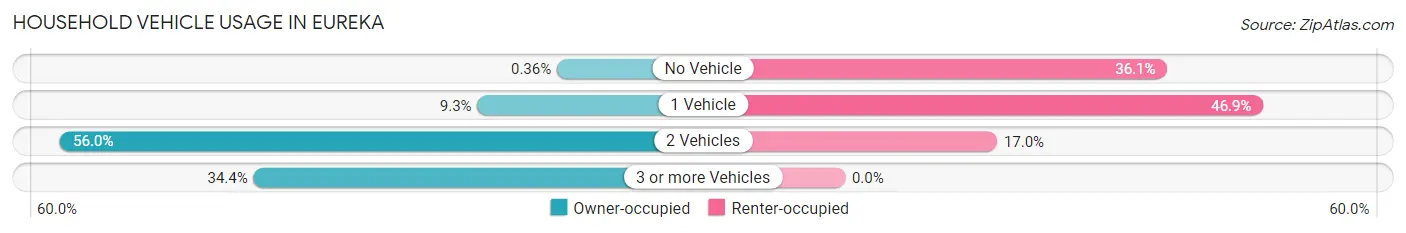
| Vehicles per Household | Owner-occupied | Renter-occupied |
| No Vehicle | 12 (0.4%) | 316 (36.1%) |
| 1 Vehicle | 311 (9.3%) | 410 (46.9%) |
| 2 Vehicles | 1,879 (56.0%) | 149 (17.0%) |
| 3 or more Vehicles | 1,152 (34.4%) | 0 (0.0%) |
| Total | 3,354 (100.0%) | 875 (100.0%) |
Real Estate & Mortgages in Eureka
Real Estate and Mortgage Overview in Eureka
| Characteristic | Without Mortgage | With Mortgage |
| Housing Units | 490 | 2,864 |
| Median Property Value | $252,300 | $344,500 |
| Median Household Income | $89,357 | $1,299 |
| Monthly Housing Costs | $744 | $326 |
| Real Estate Taxes | $3,351 | $22 |
Property Value by Mortgage Status in Eureka
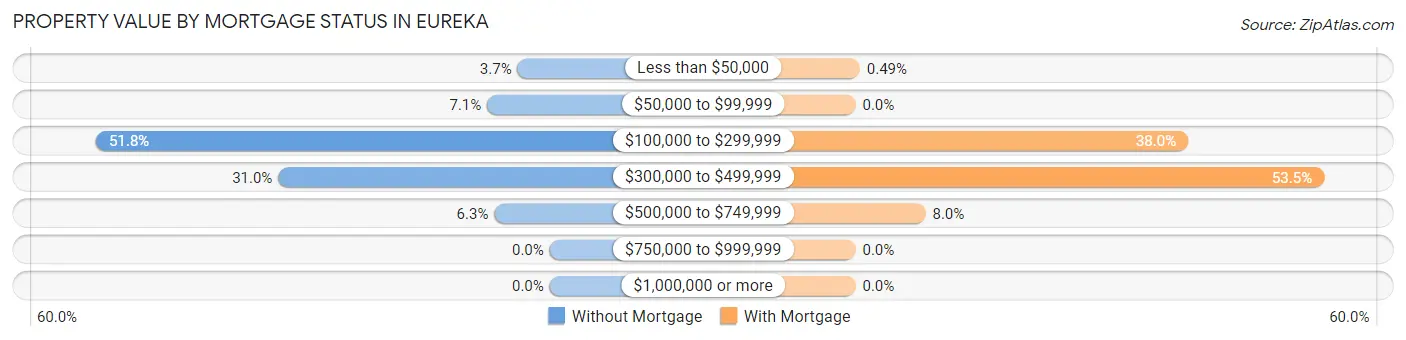
| Property Value | Without Mortgage | With Mortgage |
| Less than $50,000 | 18 (3.7%) | 14 (0.5%) |
| $50,000 to $99,999 | 35 (7.1%) | 0 (0.0%) |
| $100,000 to $299,999 | 254 (51.8%) | 1,088 (38.0%) |
| $300,000 to $499,999 | 152 (31.0%) | 1,533 (53.5%) |
| $500,000 to $749,999 | 31 (6.3%) | 229 (8.0%) |
| $750,000 to $999,999 | 0 (0.0%) | 0 (0.0%) |
| $1,000,000 or more | 0 (0.0%) | 0 (0.0%) |
| Total | 490 (100.0%) | 2,864 (100.0%) |
Household Income by Mortgage Status in Eureka
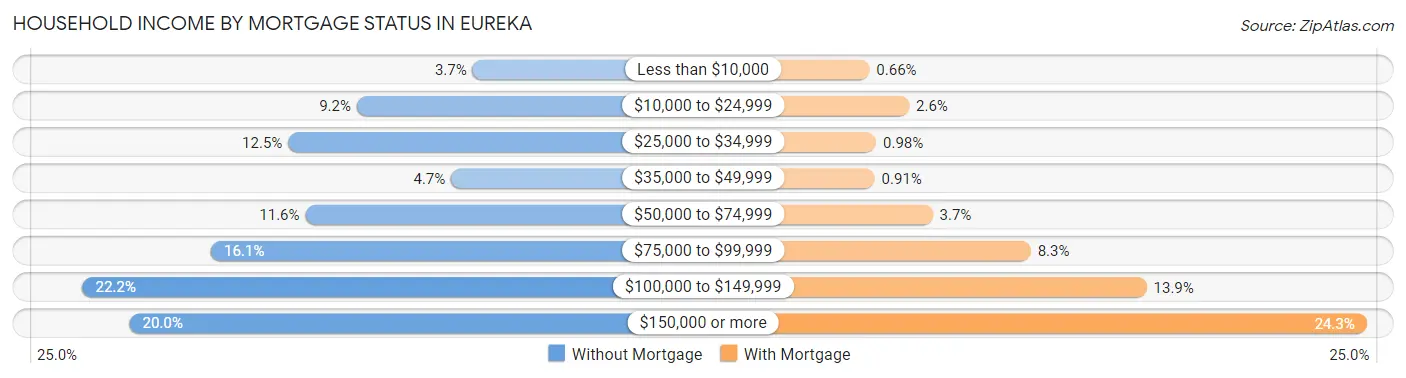
| Household Income | Without Mortgage | With Mortgage |
| Less than $10,000 | 18 (3.7%) | 19 (0.7%) |
| $10,000 to $24,999 | 45 (9.2%) | 73 (2.5%) |
| $25,000 to $34,999 | 61 (12.4%) | 28 (1.0%) |
| $35,000 to $49,999 | 23 (4.7%) | 26 (0.9%) |
| $50,000 to $74,999 | 57 (11.6%) | 105 (3.7%) |
| $75,000 to $99,999 | 79 (16.1%) | 239 (8.3%) |
| $100,000 to $149,999 | 109 (22.2%) | 397 (13.9%) |
| $150,000 or more | 98 (20.0%) | 697 (24.3%) |
| Total | 490 (100.0%) | 2,864 (100.0%) |
Property Value to Household Income Ratio in Eureka
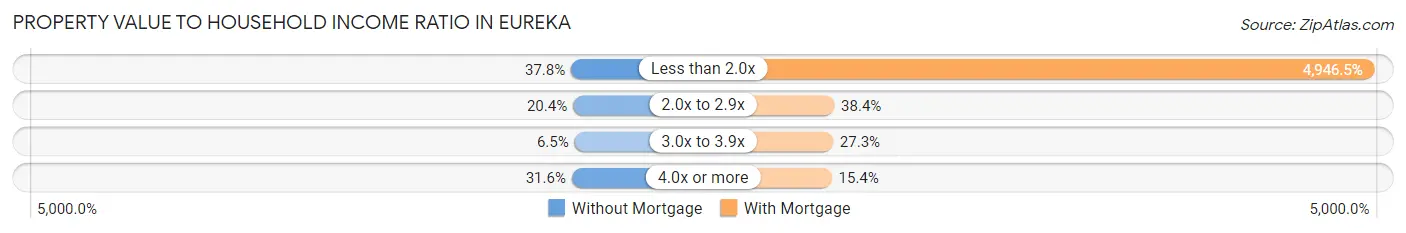
| Value-to-Income Ratio | Without Mortgage | With Mortgage |
| Less than 2.0x | 185 (37.8%) | 141,667 (4,946.5%) |
| 2.0x to 2.9x | 100 (20.4%) | 1,101 (38.4%) |
| 3.0x to 3.9x | 32 (6.5%) | 782 (27.3%) |
| 4.0x or more | 155 (31.6%) | 441 (15.4%) |
| Total | 490 (100.0%) | 2,864 (100.0%) |
Real Estate Taxes by Mortgage Status in Eureka
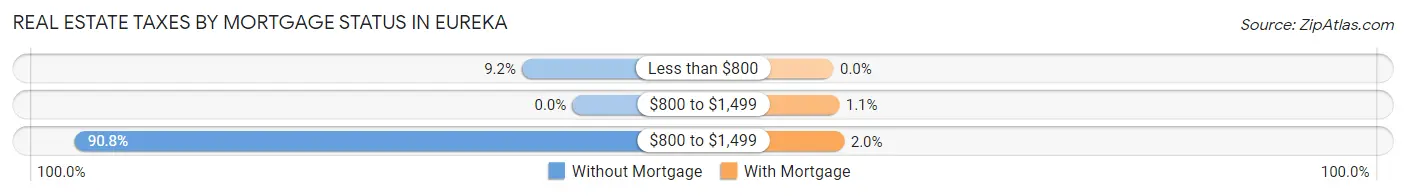
| Property Taxes | Without Mortgage | With Mortgage |
| Less than $800 | 45 (9.2%) | 0 (0.0%) |
| $800 to $1,499 | 0 (0.0%) | 30 (1.1%) |
| $800 to $1,499 | 445 (90.8%) | 56 (2.0%) |
| Total | 490 (100.0%) | 2,864 (100.0%) |
Health & Disability in Eureka
Health Insurance Coverage by Age in Eureka
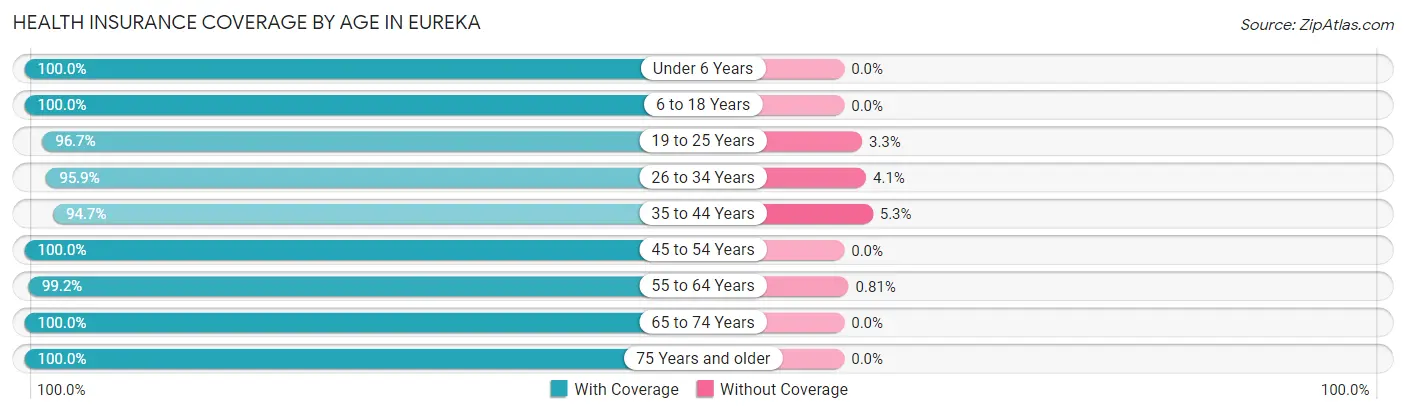
| Age Bracket | With Coverage | Without Coverage |
| Under 6 Years | 1,148 (100.0%) | 0 (0.0%) |
| 6 to 18 Years | 2,594 (100.0%) | 0 (0.0%) |
| 19 to 25 Years | 642 (96.7%) | 22 (3.3%) |
| 26 to 34 Years | 1,064 (95.9%) | 45 (4.1%) |
| 35 to 44 Years | 1,623 (94.7%) | 91 (5.3%) |
| 45 to 54 Years | 1,541 (100.0%) | 0 (0.0%) |
| 55 to 64 Years | 1,472 (99.2%) | 12 (0.8%) |
| 65 to 74 Years | 874 (100.0%) | 0 (0.0%) |
| 75 Years and older | 591 (100.0%) | 0 (0.0%) |
| Total | 11,549 (98.6%) | 170 (1.5%) |
Health Insurance Coverage by Citizenship Status in Eureka
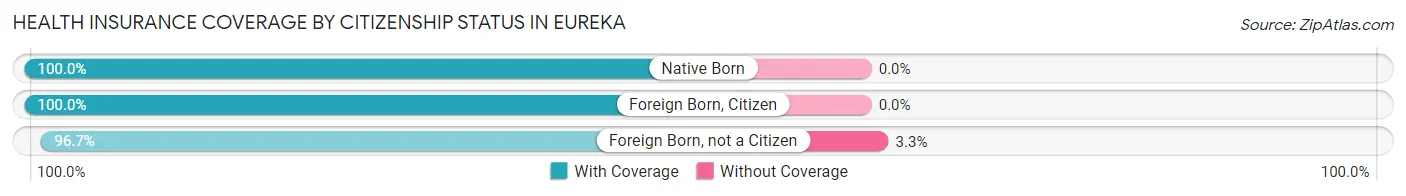
| Citizenship Status | With Coverage | Without Coverage |
| Native Born | 1,148 (100.0%) | 0 (0.0%) |
| Foreign Born, Citizen | 2,594 (100.0%) | 0 (0.0%) |
| Foreign Born, not a Citizen | 642 (96.7%) | 22 (3.3%) |
Health Insurance Coverage by Household Income in Eureka
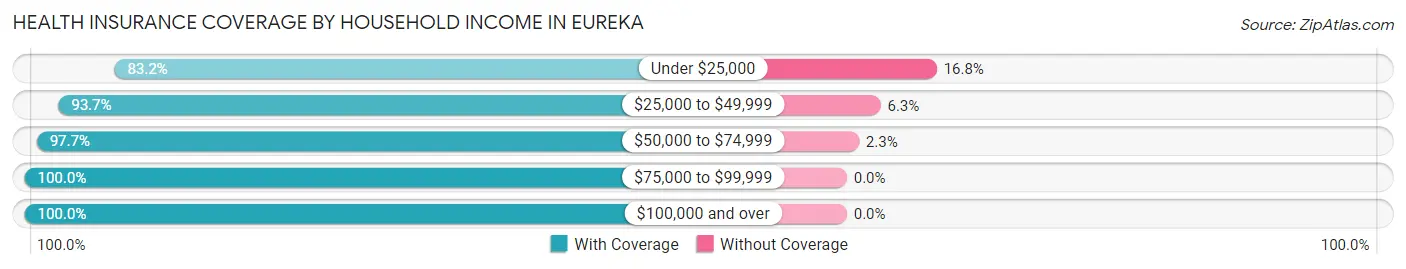
| Household Income | With Coverage | Without Coverage |
| Under $25,000 | 400 (83.2%) | 81 (16.8%) |
| $25,000 to $49,999 | 919 (93.7%) | 62 (6.3%) |
| $50,000 to $74,999 | 1,165 (97.7%) | 27 (2.3%) |
| $75,000 to $99,999 | 1,333 (100.0%) | 0 (0.0%) |
| $100,000 and over | 7,726 (100.0%) | 0 (0.0%) |
Public vs Private Health Insurance Coverage by Age in Eureka
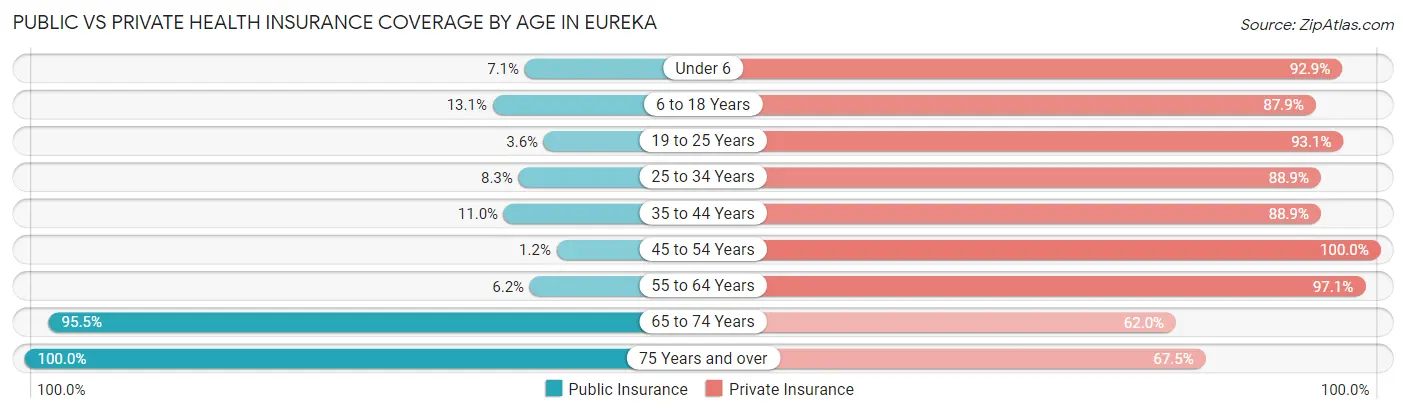
| Age Bracket | Public Insurance | Private Insurance |
| Under 6 | 82 (7.1%) | 1,066 (92.9%) |
| 6 to 18 Years | 340 (13.1%) | 2,281 (87.9%) |
| 19 to 25 Years | 24 (3.6%) | 618 (93.1%) |
| 25 to 34 Years | 92 (8.3%) | 986 (88.9%) |
| 35 to 44 Years | 189 (11.0%) | 1,524 (88.9%) |
| 45 to 54 Years | 19 (1.2%) | 1,541 (100.0%) |
| 55 to 64 Years | 92 (6.2%) | 1,441 (97.1%) |
| 65 to 74 Years | 835 (95.5%) | 542 (62.0%) |
| 75 Years and over | 591 (100.0%) | 399 (67.5%) |
| Total | 2,264 (19.3%) | 10,398 (88.7%) |
Disability Status by Sex by Age in Eureka
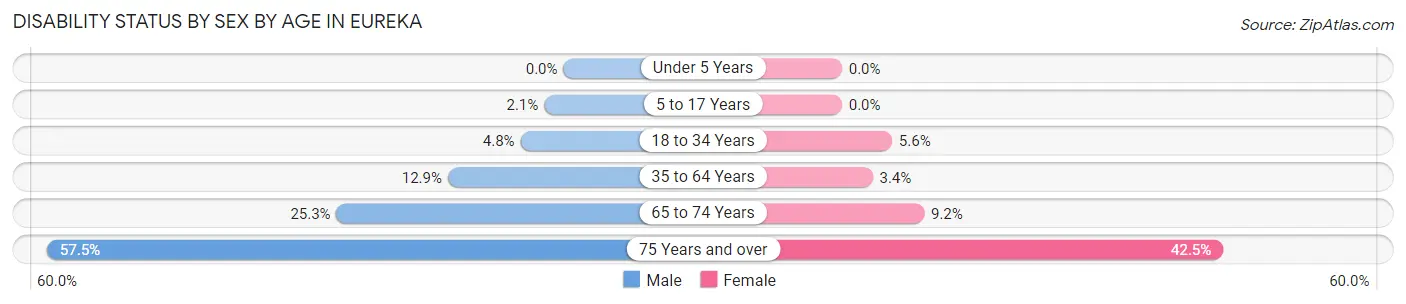
| Age Bracket | Male | Female |
| Under 5 Years | 0 (0.0%) | 0 (0.0%) |
| 5 to 17 Years | 37 (2.1%) | 0 (0.0%) |
| 18 to 34 Years | 42 (4.8%) | 57 (5.6%) |
| 35 to 64 Years | 324 (12.9%) | 76 (3.4%) |
| 65 to 74 Years | 116 (25.3%) | 38 (9.2%) |
| 75 Years and over | 111 (57.5%) | 169 (42.5%) |
Disability Class by Sex by Age in Eureka
Disability Class: Hearing Difficulty
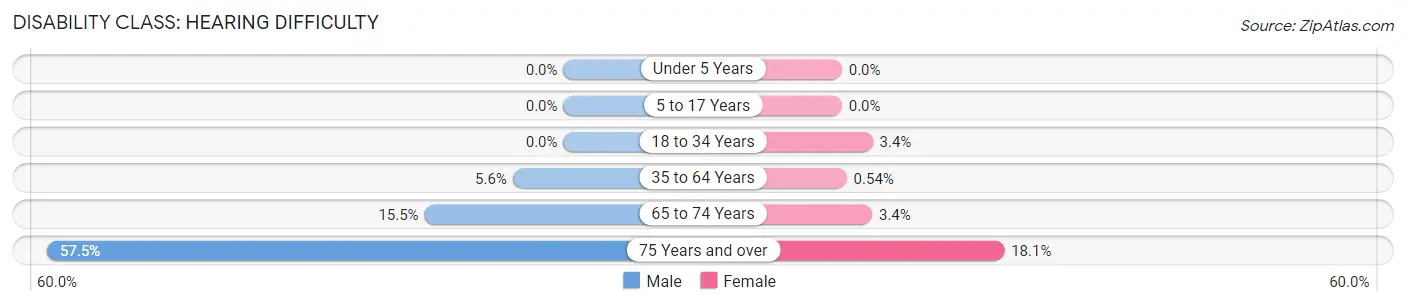
| Age Bracket | Male | Female |
| Under 5 Years | 0 (0.0%) | 0 (0.0%) |
| 5 to 17 Years | 0 (0.0%) | 0 (0.0%) |
| 18 to 34 Years | 0 (0.0%) | 35 (3.4%) |
| 35 to 64 Years | 142 (5.6%) | 12 (0.5%) |
| 65 to 74 Years | 71 (15.5%) | 14 (3.4%) |
| 75 Years and over | 111 (57.5%) | 72 (18.1%) |
Disability Class: Vision Difficulty
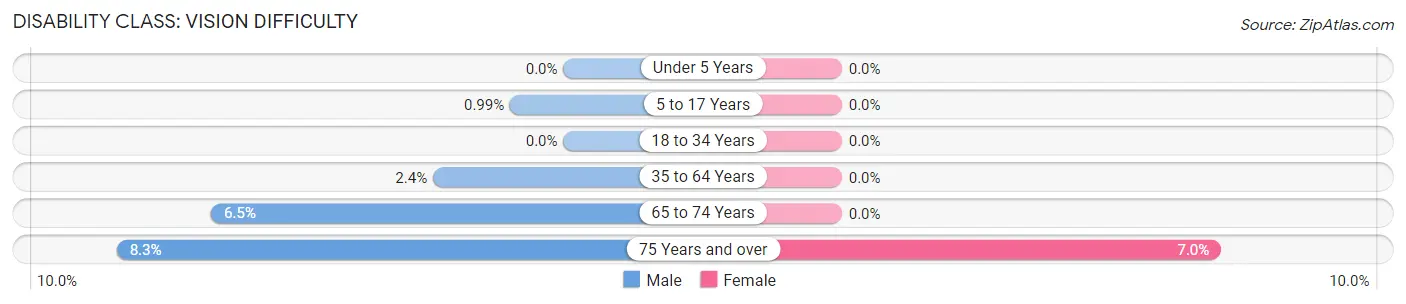
| Age Bracket | Male | Female |
| Under 5 Years | 0 (0.0%) | 0 (0.0%) |
| 5 to 17 Years | 17 (1.0%) | 0 (0.0%) |
| 18 to 34 Years | 0 (0.0%) | 0 (0.0%) |
| 35 to 64 Years | 61 (2.4%) | 0 (0.0%) |
| 65 to 74 Years | 30 (6.5%) | 0 (0.0%) |
| 75 Years and over | 16 (8.3%) | 28 (7.0%) |
Disability Class: Cognitive Difficulty
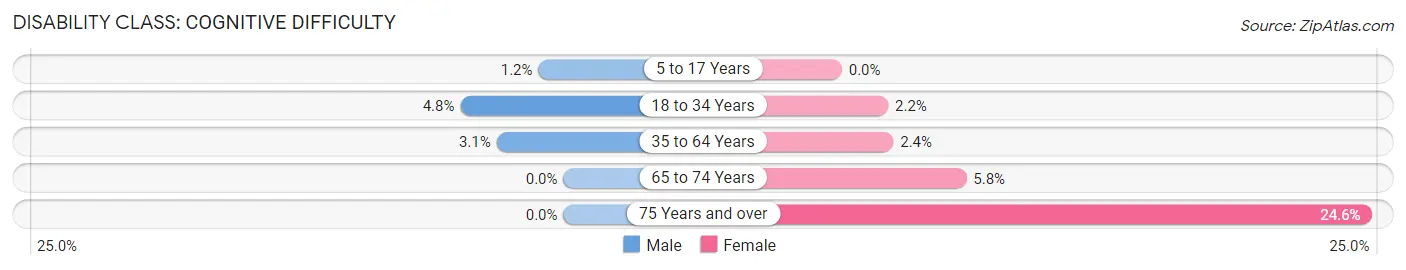
| Age Bracket | Male | Female |
| 5 to 17 Years | 20 (1.2%) | 0 (0.0%) |
| 18 to 34 Years | 42 (4.8%) | 22 (2.1%) |
| 35 to 64 Years | 78 (3.1%) | 53 (2.4%) |
| 65 to 74 Years | 0 (0.0%) | 24 (5.8%) |
| 75 Years and over | 0 (0.0%) | 98 (24.6%) |
Disability Class: Ambulatory Difficulty
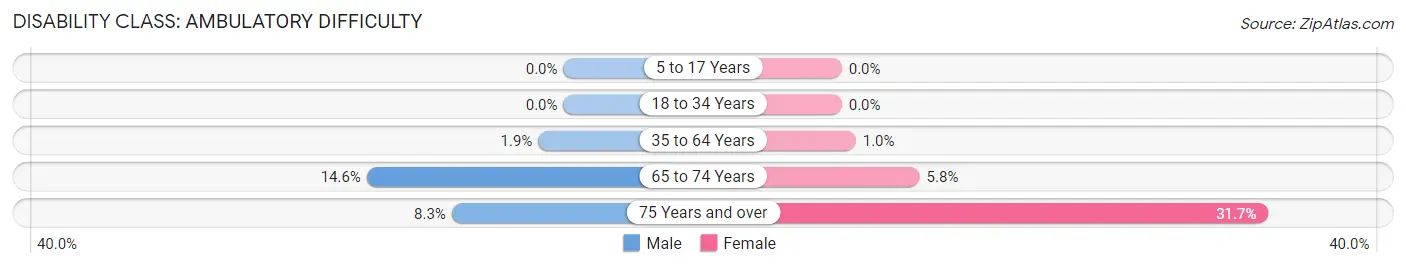
| Age Bracket | Male | Female |
| 5 to 17 Years | 0 (0.0%) | 0 (0.0%) |
| 18 to 34 Years | 0 (0.0%) | 0 (0.0%) |
| 35 to 64 Years | 47 (1.9%) | 23 (1.0%) |
| 65 to 74 Years | 67 (14.6%) | 24 (5.8%) |
| 75 Years and over | 16 (8.3%) | 126 (31.7%) |
Disability Class: Self-Care Difficulty
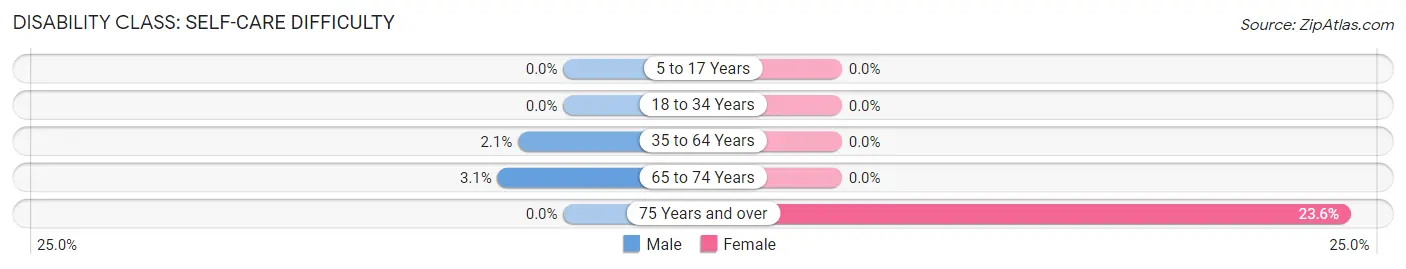
| Age Bracket | Male | Female |
| 5 to 17 Years | 0 (0.0%) | 0 (0.0%) |
| 18 to 34 Years | 0 (0.0%) | 0 (0.0%) |
| 35 to 64 Years | 53 (2.1%) | 0 (0.0%) |
| 65 to 74 Years | 14 (3.0%) | 0 (0.0%) |
| 75 Years and over | 0 (0.0%) | 94 (23.6%) |
Technology Access in Eureka
Computing Device Access in Eureka
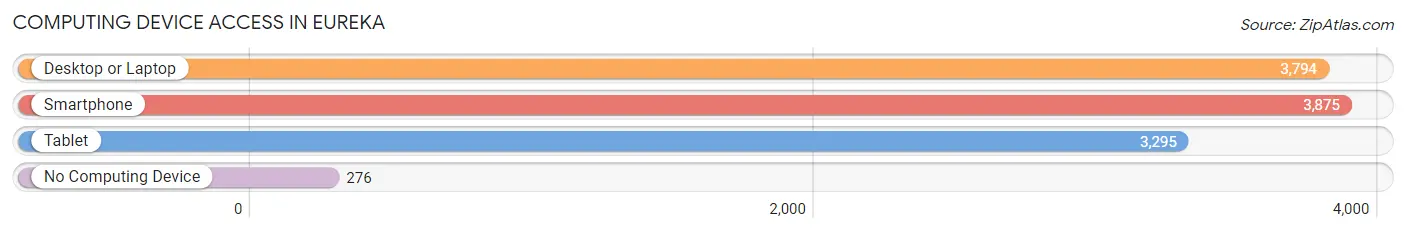
| Device Type | # Households | % Households |
| Desktop or Laptop | 3,794 | 89.7% |
| Smartphone | 3,875 | 91.6% |
| Tablet | 3,295 | 77.9% |
| No Computing Device | 276 | 6.5% |
| Total | 4,229 | 100.0% |
Internet Access in Eureka
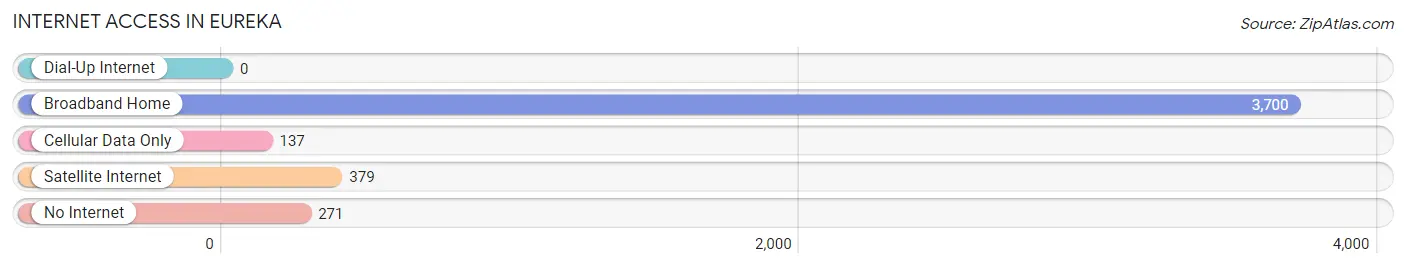
| Internet Type | # Households | % Households |
| Dial-Up Internet | 0 | 0.0% |
| Broadband Home | 3,700 | 87.5% |
| Cellular Data Only | 137 | 3.2% |
| Satellite Internet | 379 | 9.0% |
| No Internet | 271 | 6.4% |
| Total | 4,229 | 100.0% |
Eureka Summary
Eureka, Missouri is a city located in St. Louis County, Missouri, United States. The population was 10,189 at the 2010 census. The city is a suburb of St. Louis and is part of the Greater St. Louis metropolitan area.
History
The area that is now Eureka was first settled in the early 1800s by German immigrants. The town was originally known as "Friedenberg" and was founded in 1855. The name was changed to Eureka in 1858, after the Greek word for "I have found it". The town was incorporated in 1875.
In the late 19th century, Eureka was a popular tourist destination due to its proximity to St. Louis. The town was home to several resorts and hotels, as well as a casino. The casino was destroyed by a fire in 1891.
In the early 20th century, Eureka became a popular residential area for St. Louisans. The town was home to several large estates, including the estate of St. Louis beer baron Adolphus Busch.
Geography
Eureka is located in western St. Louis County, at the intersection of Interstate 44 and Missouri Route 109. The city is bordered by Pacific to the north, Wildwood to the east, and Ballwin to the south. The Meramec River forms the western boundary of the city.
The city has a total area of 8.2 square miles, of which 8.1 square miles is land and 0.1 square miles is water.
Economy
Eureka is home to several large employers, including the St. Louis County government, the St. Louis County Police Department, and the St. Louis County Library. The city is also home to several retail stores, restaurants, and other businesses.
Demographics
As of the 2010 census, there were 10,189 people, 4,072 households, and 2,717 families residing in the city. The population density was 1,253.3 people per square mile. The racial makeup of the city was 92.3% White, 2.7% African American, 0.3% Native American, 1.7% Asian, 0.1% Pacific Islander, 1.2% from other races, and 2.1% from two or more races. Hispanic or Latino of any race were 3.7% of the population.
The median income for a household in the city was $62,917, and the median income for a family was $76,917. The per capita income for the city was $30,917. About 3.2% of families and 4.7% of the population were below the poverty line, including 5.3% of those under age 18 and 4.2% of those age 65 or over.
Common Questions
What is Per Capita Income in Eureka?
Per Capita income in Eureka is $46,904.
What is the Median Family Income in Eureka?
Median Family Income in Eureka is $130,824.
What is the Median Household income in Eureka?
Median Household Income in Eureka is $104,697.
What is Income or Wage Gap in Eureka?
Income or Wage Gap in Eureka is 34.4%.
Women in Eureka earn 65.6 cents for every dollar earned by a man.
What is Inequality or Gini Index in Eureka?
Inequality or Gini Index in Eureka is 0.40.
What is the Total Population of Eureka?
Total Population of Eureka is 12,008.
What is the Total Male Population of Eureka?
Total Male Population of Eureka is 6,354.
What is the Total Female Population of Eureka?
Total Female Population of Eureka is 5,654.
What is the Ratio of Males per 100 Females in Eureka?
There are 112.38 Males per 100 Females in Eureka.
What is the Ratio of Females per 100 Males in Eureka?
There are 88.98 Females per 100 Males in Eureka.
What is the Median Population Age in Eureka?
Median Population Age in Eureka is 37.9 Years.
What is the Average Family Size in Eureka
Average Family Size in Eureka is 3.4 People.
What is the Average Household Size in Eureka
Average Household Size in Eureka is 2.8 People.
How Large is the Labor Force in Eureka?
There are 6,026 People in the Labor Forcein in Eureka.
What is the Percentage of People in the Labor Force in Eureka?
68.5% of People are in the Labor Force in Eureka.
What is the Unemployment Rate in Eureka?
Unemployment Rate in Eureka is 5.4%.