Duenweg, MO Map & Demographics
Duenweg Map
Duenweg Overview
$22,218
PER CAPITA INCOME
$53,750
AVG FAMILY INCOME
$46,917
AVG HOUSEHOLD INCOME
44.2%
WAGE / INCOME GAP [ % ]
55.8¢/ $1
WAGE / INCOME GAP [ $ ]
$13,289
FAMILY INCOME DEFICIT
0.41
INEQUALITY / GINI INDEX
1,604
TOTAL POPULATION
655
MALE POPULATION
949
FEMALE POPULATION
69.02
MALES / 100 FEMALES
144.89
FEMALES / 100 MALES
30.8
MEDIAN AGE
3.6
AVG FAMILY SIZE
3.0
AVG HOUSEHOLD SIZE
852
LABOR FORCE [ PEOPLE ]
73.3%
PERCENT IN LABOR FORCE
2.8%
UNEMPLOYMENT RATE
Duenweg Zip Codes
Duenweg Area Codes
Income in Duenweg
Income Overview in Duenweg
Per Capita Income in Duenweg is $22,218, while median incomes of families and households are $53,750 and $46,917 respectively.
| Characteristic | Number | Measure |
| Per Capita Income | 1,604 | $22,218 |
| Median Family Income | 358 | $53,750 |
| Mean Family Income | 358 | $62,318 |
| Median Household Income | 537 | $46,917 |
| Mean Household Income | 537 | $64,019 |
| Income Deficit | 358 | $13,289 |
| Wage / Income Gap (%) | 1,604 | 44.25% |
| Wage / Income Gap ($) | 1,604 | 55.75¢ per $1 |
| Gini / Inequality Index | 1,604 | 0.41 |
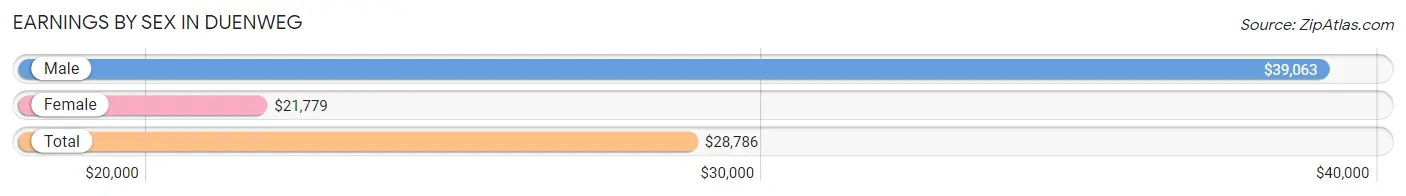
Earnings by Sex in Duenweg
Average Earnings in Duenweg are $28,786, $39,063 for men and $21,779 for women, a difference of 44.3%.
| Sex | Number | Average Earnings |
| Male | 351 (40.9%) | $39,063 |
| Female | 507 (59.1%) | $21,779 |
| Total | 858 (100.0%) | $28,786 |
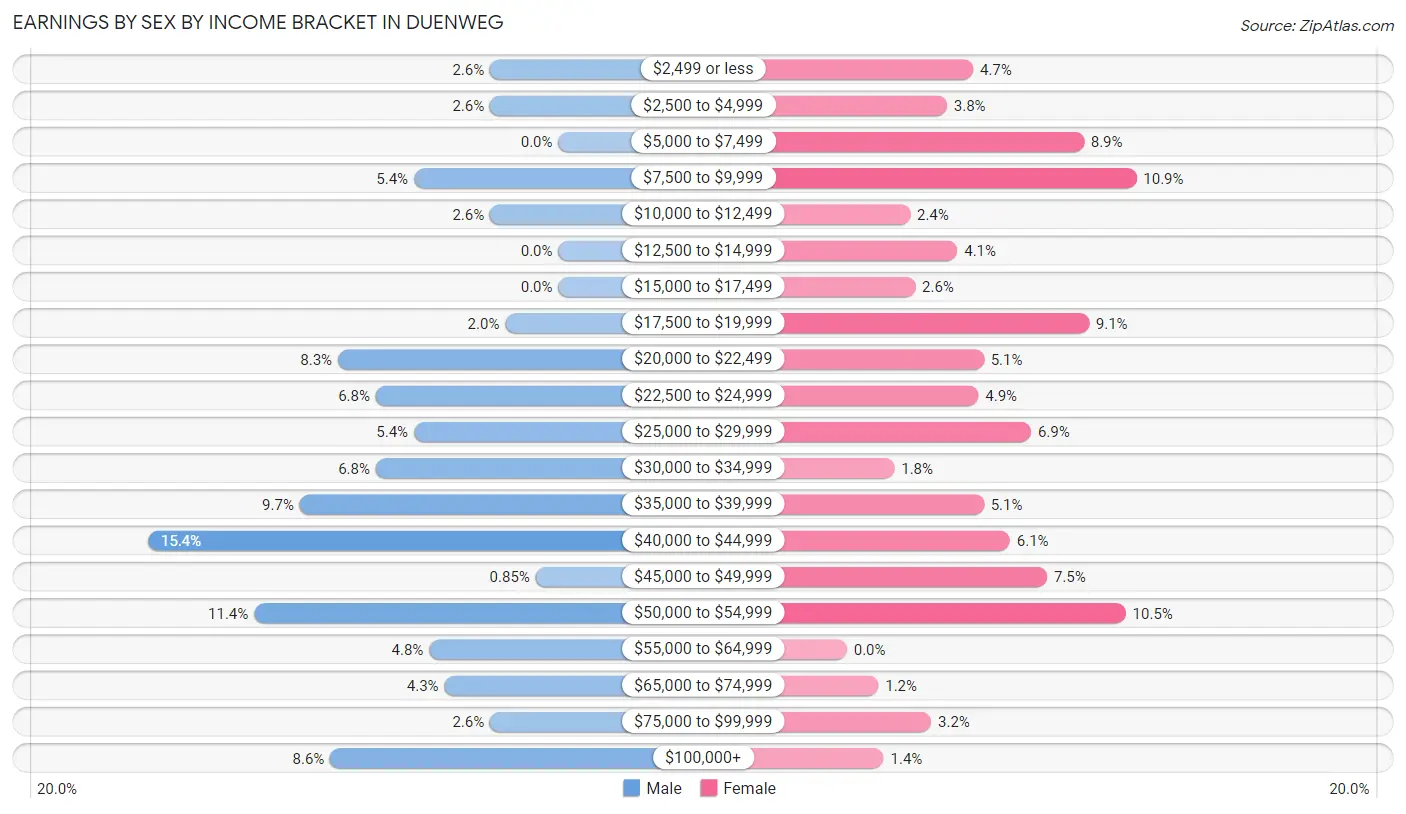
Earnings by Sex by Income Bracket in Duenweg
The most common earnings brackets in Duenweg are $40,000 to $44,999 for men (54 | 15.4%) and $7,500 to $9,999 for women (55 | 10.8%).
| Income | Male | Female |
| $2,499 or less | 9 (2.6%) | 24 (4.7%) |
| $2,500 to $4,999 | 9 (2.6%) | 19 (3.7%) |
| $5,000 to $7,499 | 0 (0.0%) | 45 (8.9%) |
| $7,500 to $9,999 | 19 (5.4%) | 55 (10.8%) |
| $10,000 to $12,499 | 9 (2.6%) | 12 (2.4%) |
| $12,500 to $14,999 | 0 (0.0%) | 21 (4.1%) |
| $15,000 to $17,499 | 0 (0.0%) | 13 (2.6%) |
| $17,500 to $19,999 | 7 (2.0%) | 46 (9.1%) |
| $20,000 to $22,499 | 29 (8.3%) | 26 (5.1%) |
| $22,500 to $24,999 | 24 (6.8%) | 25 (4.9%) |
| $25,000 to $29,999 | 19 (5.4%) | 35 (6.9%) |
| $30,000 to $34,999 | 24 (6.8%) | 9 (1.8%) |
| $35,000 to $39,999 | 34 (9.7%) | 26 (5.1%) |
| $40,000 to $44,999 | 54 (15.4%) | 31 (6.1%) |
| $45,000 to $49,999 | 3 (0.9%) | 38 (7.5%) |
| $50,000 to $54,999 | 40 (11.4%) | 53 (10.4%) |
| $55,000 to $64,999 | 17 (4.8%) | 0 (0.0%) |
| $65,000 to $74,999 | 15 (4.3%) | 6 (1.2%) |
| $75,000 to $99,999 | 9 (2.6%) | 16 (3.2%) |
| $100,000+ | 30 (8.6%) | 7 (1.4%) |
| Total | 351 (100.0%) | 507 (100.0%) |
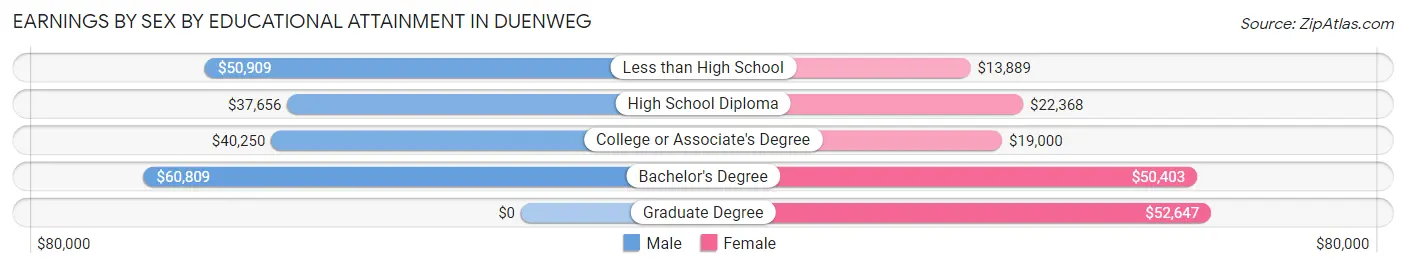
Earnings by Sex by Educational Attainment in Duenweg
Average earnings in Duenweg are $42,500 for men and $26,447 for women, a difference of 37.8%. Men with an educational attainment of bachelor's degree enjoy the highest average annual earnings of $60,809, while those with high school diploma education earn the least with $37,656. Women with an educational attainment of graduate degree earn the most with the average annual earnings of $52,647, while those with less than high school education have the smallest earnings of $13,889.
| Educational Attainment | Male Income | Female Income |
| Less than High School | $50,909 | $13,889 |
| High School Diploma | $37,656 | $22,368 |
| College or Associate's Degree | $40,250 | $19,000 |
| Bachelor's Degree | $60,809 | $50,403 |
| Graduate Degree | - | - |
| Total | $42,500 | $26,447 |
Family Income in Duenweg
Family Income Brackets in Duenweg
According to the Duenweg family income data, there are 97 families falling into the $35,000 to $49,999 income range, which is the most common income bracket and makes up 27.1% of all families.
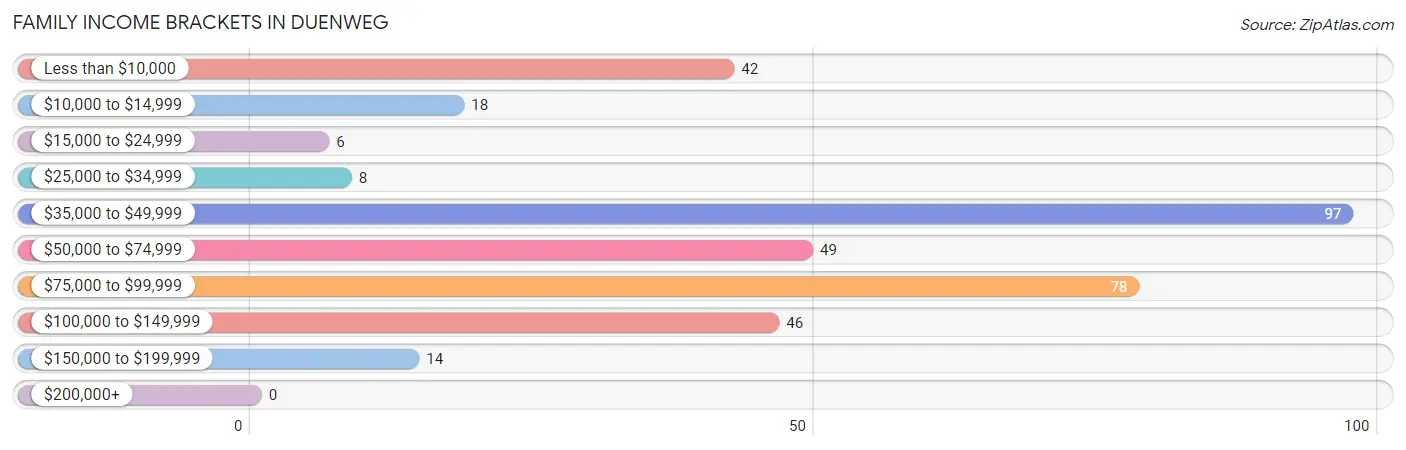
| Income Bracket | # Families | % Families |
| Less than $10,000 | 42 | 11.7% |
| $10,000 to $14,999 | 18 | 5.0% |
| $15,000 to $24,999 | 6 | 1.7% |
| $25,000 to $34,999 | 8 | 2.2% |
| $35,000 to $49,999 | 97 | 27.1% |
| $50,000 to $74,999 | 49 | 13.7% |
| $75,000 to $99,999 | 78 | 21.8% |
| $100,000 to $149,999 | 46 | 12.8% |
| $150,000 to $199,999 | 14 | 3.9% |
| $200,000+ | 0 | 0.0% |
Family Income by Famaliy Size in Duenweg
4-person families (38 | 10.6%) account for the highest median family income in Duenweg with $83,929 per family, while 2-person families (148 | 41.3%) have the highest median income of $22,084 per family member.
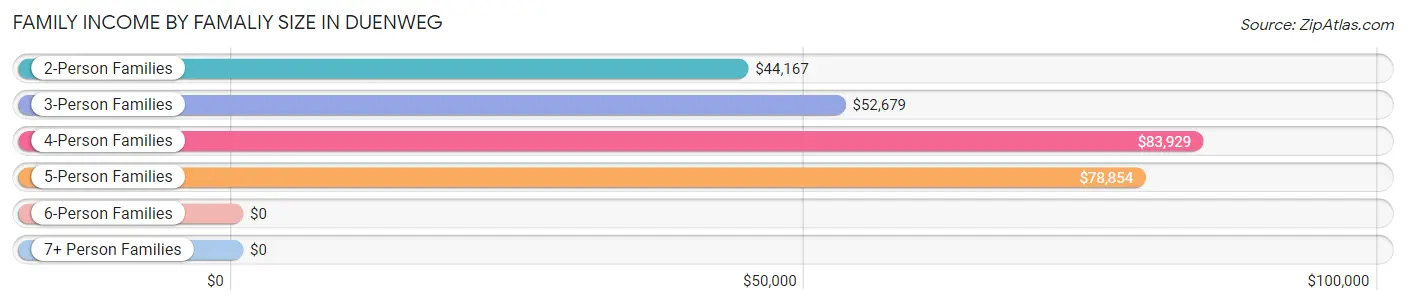
| Income Bracket | # Families | Median Income |
| 2-Person Families | 148 (41.3%) | $44,167 |
| 3-Person Families | 115 (32.1%) | $52,679 |
| 4-Person Families | 38 (10.6%) | $83,929 |
| 5-Person Families | 35 (9.8%) | $78,854 |
| 6-Person Families | 5 (1.4%) | $0 |
| 7+ Person Families | 17 (4.8%) | $0 |
| Total | 358 (100.0%) | $53,750 |
Family Income by Number of Earners in Duenweg
The median family income in Duenweg is $53,750, with families comprising 3+ earners (61) having the highest median family income of $84,107, while families with no earners (14) have the lowest median family income of $25,938, accounting for 17.0% and 3.9% of families, respectively.
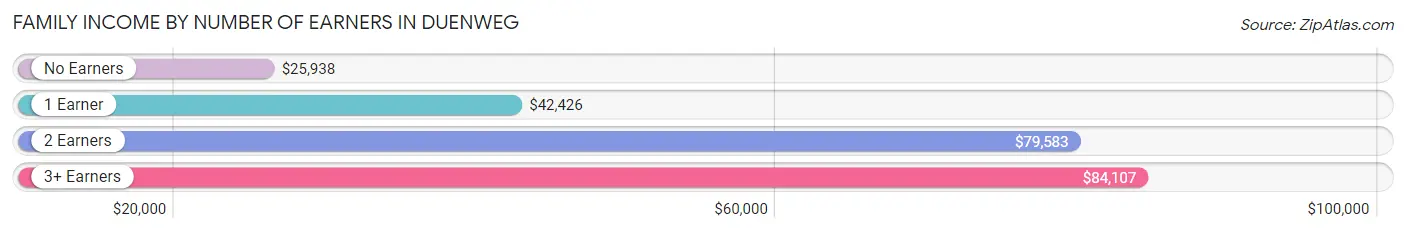
| Number of Earners | # Families | Median Income |
| No Earners | 14 (3.9%) | $25,938 |
| 1 Earner | 167 (46.7%) | $42,426 |
| 2 Earners | 116 (32.4%) | $79,583 |
| 3+ Earners | 61 (17.0%) | $84,107 |
| Total | 358 (100.0%) | $53,750 |
Household Income in Duenweg
Household Income Brackets in Duenweg
With 115 households falling in the category, the $35,000 to $49,999 income range is the most frequent in Duenweg, accounting for 21.4% of all households. In contrast, only 9 households (1.7%) fall into the $200,000+ income bracket, making it the least populous group.
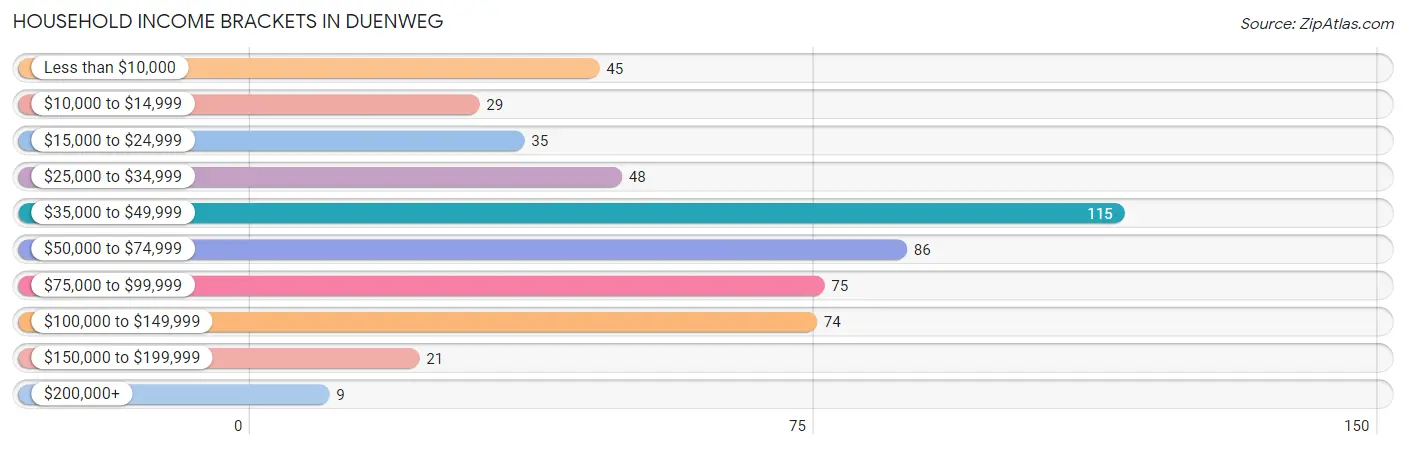
| Income Bracket | # Households | % Households |
| Less than $10,000 | 45 | 8.4% |
| $10,000 to $14,999 | 29 | 5.4% |
| $15,000 to $24,999 | 35 | 6.5% |
| $25,000 to $34,999 | 48 | 8.9% |
| $35,000 to $49,999 | 115 | 21.4% |
| $50,000 to $74,999 | 86 | 16.0% |
| $75,000 to $99,999 | 75 | 14.0% |
| $100,000 to $149,999 | 74 | 13.8% |
| $150,000 to $199,999 | 21 | 3.9% |
| $200,000+ | 9 | 1.7% |
Household Income by Householder Age in Duenweg
The median household income in Duenweg is $46,917, with the highest median household income of $66,705 found in the 25 to 44 years age bracket for the primary householder. A total of 235 households (43.8%) fall into this category. Meanwhile, the 15 to 24 years age bracket for the primary householder has the lowest median household income of $0, with 25 households (4.7%) in this group.
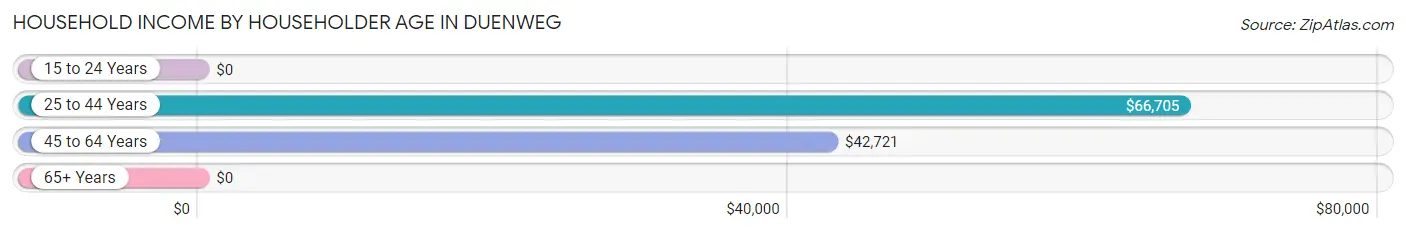
| Income Bracket | # Households | Median Income |
| 15 to 24 Years | 25 (4.7%) | $0 |
| 25 to 44 Years | 235 (43.8%) | $66,705 |
| 45 to 64 Years | 205 (38.2%) | $42,721 |
| 65+ Years | 72 (13.4%) | $0 |
| Total | 537 (100.0%) | $46,917 |
Poverty in Duenweg
Income Below Poverty by Sex and Age in Duenweg
With 21.8% poverty level for males and 30.8% for females among the residents of Duenweg, 16 and 17 year old males and 16 and 17 year old females are the most vulnerable to poverty, with 17 males (85.0%) and 16 females (100.0%) in their respective age groups living below the poverty level.
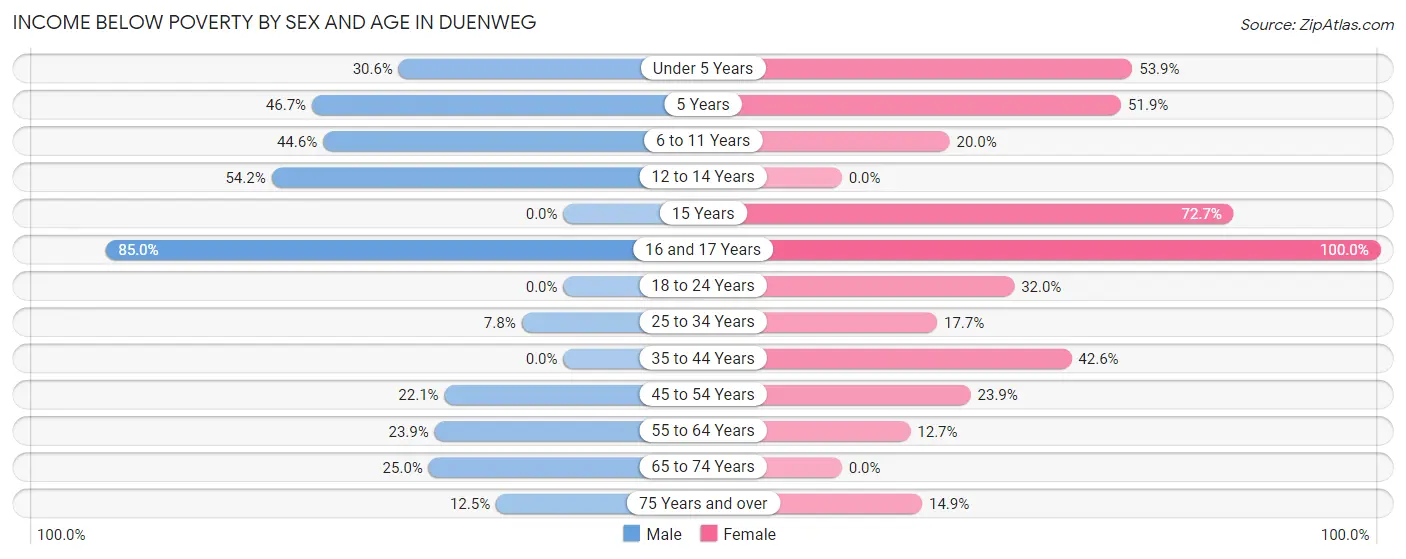
| Age Bracket | Male | Female |
| Under 5 Years | 22 (30.6%) | 55 (53.9%) |
| 5 Years | 14 (46.7%) | 14 (51.8%) |
| 6 to 11 Years | 29 (44.6%) | 15 (20.0%) |
| 12 to 14 Years | 13 (54.2%) | 0 (0.0%) |
| 15 Years | 0 (0.0%) | 24 (72.7%) |
| 16 and 17 Years | 17 (85.0%) | 16 (100.0%) |
| 18 to 24 Years | 0 (0.0%) | 40 (32.0%) |
| 25 to 34 Years | 8 (7.8%) | 29 (17.7%) |
| 35 to 44 Years | 0 (0.0%) | 52 (42.6%) |
| 45 to 54 Years | 17 (22.1%) | 33 (23.9%) |
| 55 to 64 Years | 11 (23.9%) | 7 (12.7%) |
| 65 to 74 Years | 9 (25.0%) | 0 (0.0%) |
| 75 Years and over | 3 (12.5%) | 7 (14.9%) |
| Total | 143 (21.8%) | 292 (30.8%) |
Income Above Poverty by Sex and Age in Duenweg
According to the poverty statistics in Duenweg, males aged 15 years and females aged 12 to 14 years are the age groups that are most secure financially, with 100.0% of males and 100.0% of females in these age groups living above the poverty line.
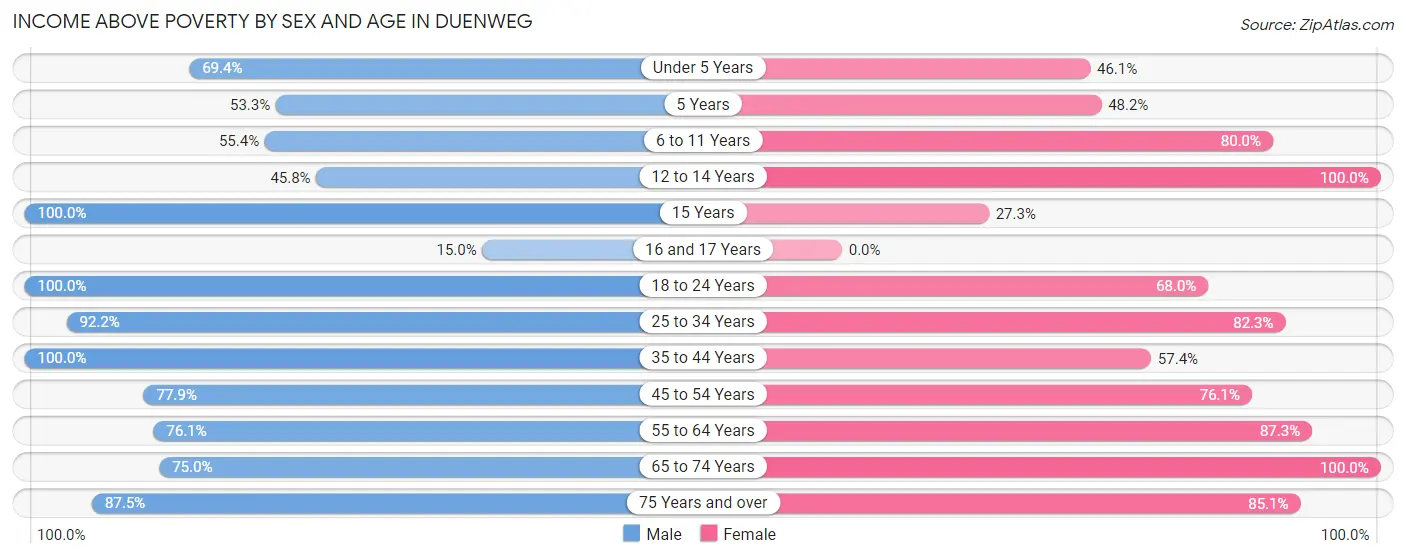
| Age Bracket | Male | Female |
| Under 5 Years | 50 (69.4%) | 47 (46.1%) |
| 5 Years | 16 (53.3%) | 13 (48.1%) |
| 6 to 11 Years | 36 (55.4%) | 60 (80.0%) |
| 12 to 14 Years | 11 (45.8%) | 9 (100.0%) |
| 15 Years | 4 (100.0%) | 9 (27.3%) |
| 16 and 17 Years | 3 (15.0%) | 0 (0.0%) |
| 18 to 24 Years | 51 (100.0%) | 85 (68.0%) |
| 25 to 34 Years | 95 (92.2%) | 135 (82.3%) |
| 35 to 44 Years | 103 (100.0%) | 70 (57.4%) |
| 45 to 54 Years | 60 (77.9%) | 105 (76.1%) |
| 55 to 64 Years | 35 (76.1%) | 48 (87.3%) |
| 65 to 74 Years | 27 (75.0%) | 36 (100.0%) |
| 75 Years and over | 21 (87.5%) | 40 (85.1%) |
| Total | 512 (78.2%) | 657 (69.2%) |
Income Below Poverty Among Married-Couple Families in Duenweg
The poverty statistics for married-couple families in Duenweg show that 10.9% or 20 of the total 184 families live below the poverty line. Families with 5 or more children have the highest poverty rate of 82.4%, comprising of 14 families. On the other hand, families with 1 or 2 children have the lowest poverty rate of 0.0%, which includes 0 families.
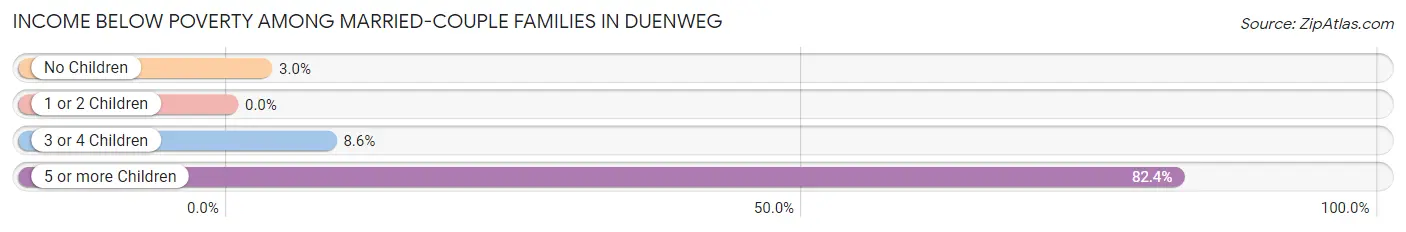
| Children | Above Poverty | Below Poverty |
| No Children | 98 (97.0%) | 3 (3.0%) |
| 1 or 2 Children | 31 (100.0%) | 0 (0.0%) |
| 3 or 4 Children | 32 (91.4%) | 3 (8.6%) |
| 5 or more Children | 3 (17.6%) | 14 (82.4%) |
| Total | 164 (89.1%) | 20 (10.9%) |
Income Below Poverty Among Single-Parent Households in Duenweg
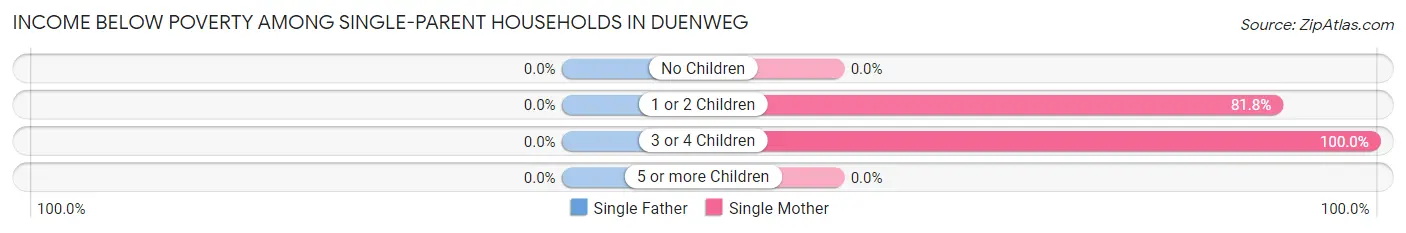
| Children | Single Father | Single Mother |
| No Children | 0 (0.0%) | 0 (0.0%) |
| 1 or 2 Children | 0 (0.0%) | 54 (81.8%) |
| 3 or 4 Children | 0 (0.0%) | 5 (100.0%) |
| 5 or more Children | 0 (0.0%) | 0 (0.0%) |
| Total | 0 (0.0%) | 59 (38.1%) |
Income Below Poverty Among Married-Couple vs Single-Parent Households in Duenweg
The poverty data for Duenweg shows that 20 of the married-couple family households (10.9%) and 59 of the single-parent households (33.9%) are living below the poverty level. Within the married-couple family households, those with 5 or more children have the highest poverty rate, with 14 households (82.4%) falling below the poverty line. Among the single-parent households, those with 3 or 4 children have the highest poverty rate, with 5 household (100.0%) living below poverty.
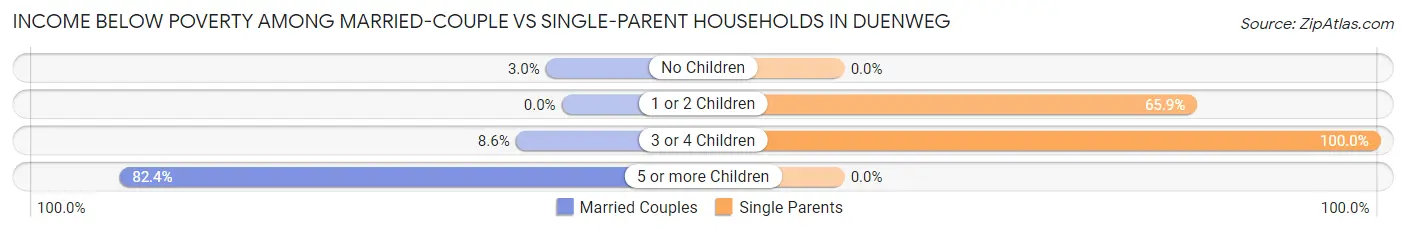
| Children | Married-Couple Families | Single-Parent Households |
| No Children | 3 (3.0%) | 0 (0.0%) |
| 1 or 2 Children | 0 (0.0%) | 54 (65.8%) |
| 3 or 4 Children | 3 (8.6%) | 5 (100.0%) |
| 5 or more Children | 14 (82.4%) | 0 (0.0%) |
| Total | 20 (10.9%) | 59 (33.9%) |
Race in Duenweg
The most populous races in Duenweg are White / Caucasian (1,407 | 87.7%), Hispanic or Latino (157 | 9.8%), and Two or more Races (157 | 9.8%).
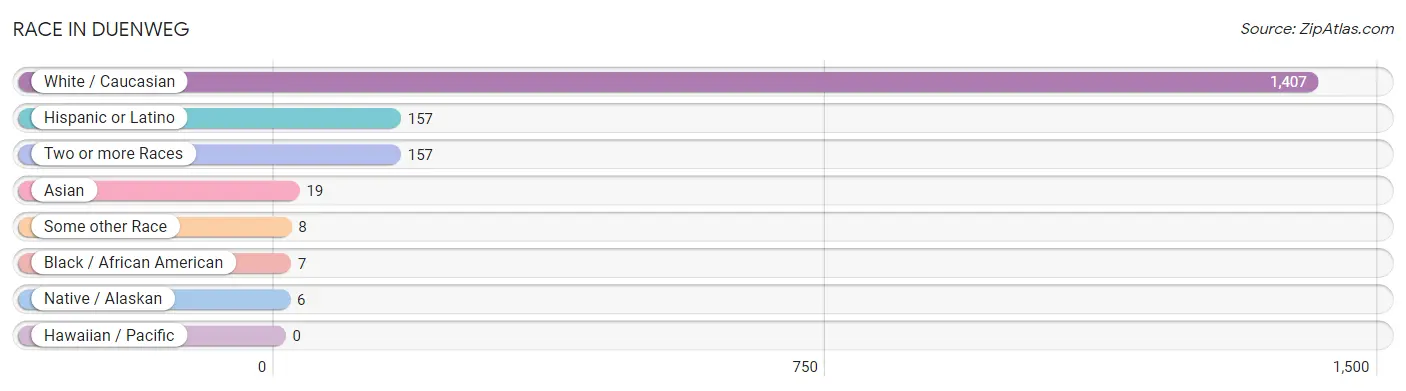
| Race | # Population | % Population |
| Asian | 19 | 1.2% |
| Black / African American | 7 | 0.4% |
| Hawaiian / Pacific | 0 | 0.0% |
| Hispanic or Latino | 157 | 9.8% |
| Native / Alaskan | 6 | 0.4% |
| White / Caucasian | 1,407 | 87.7% |
| Two or more Races | 157 | 9.8% |
| Some other Race | 8 | 0.5% |
| Total | 1,604 | 100.0% |
Ancestry in Duenweg
The most populous ancestries reported in Duenweg are German (262 | 16.3%), Irish (188 | 11.7%), Danish (160 | 10.0%), Swedish (156 | 9.7%), and English (89 | 5.6%), together accounting for 53.3% of all Duenweg residents.
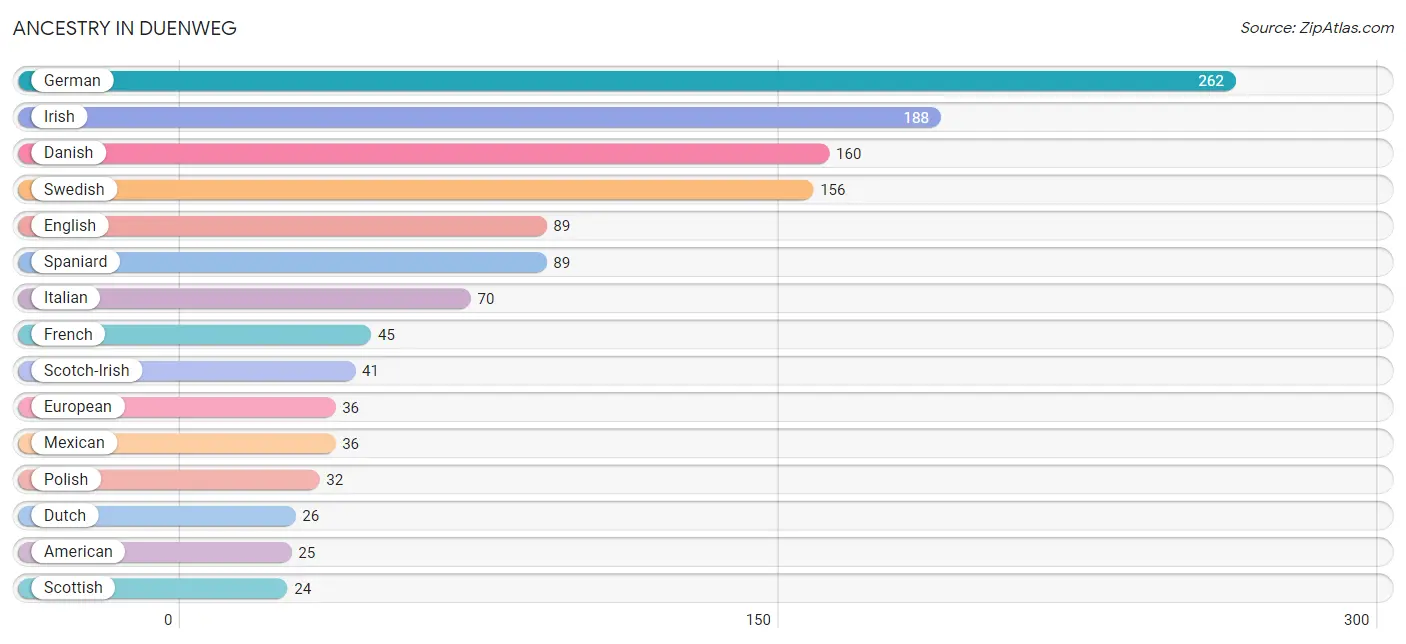
| Ancestry | # Population | % Population |
| American | 25 | 1.6% |
| Austrian | 3 | 0.2% |
| Bangladeshi | 19 | 1.2% |
| Blackfeet | 7 | 0.4% |
| British | 14 | 0.9% |
| Central American | 13 | 0.8% |
| Cherokee | 14 | 0.9% |
| Danish | 160 | 10.0% |
| Dutch | 26 | 1.6% |
| English | 89 | 5.6% |
| European | 36 | 2.2% |
| French | 45 | 2.8% |
| German | 262 | 16.3% |
| Guatemalan | 8 | 0.5% |
| Irish | 188 | 11.7% |
| Italian | 70 | 4.4% |
| Mexican | 36 | 2.2% |
| Northern European | 5 | 0.3% |
| Norwegian | 19 | 1.2% |
| Polish | 32 | 2.0% |
| Portuguese | 23 | 1.4% |
| Potawatomi | 13 | 0.8% |
| Puerto Rican | 19 | 1.2% |
| Russian | 18 | 1.1% |
| Salvadoran | 5 | 0.3% |
| Scandinavian | 9 | 0.6% |
| Scotch-Irish | 41 | 2.6% |
| Scottish | 24 | 1.5% |
| Spaniard | 89 | 5.6% |
| Swedish | 156 | 9.7% | View All 30 Rows |
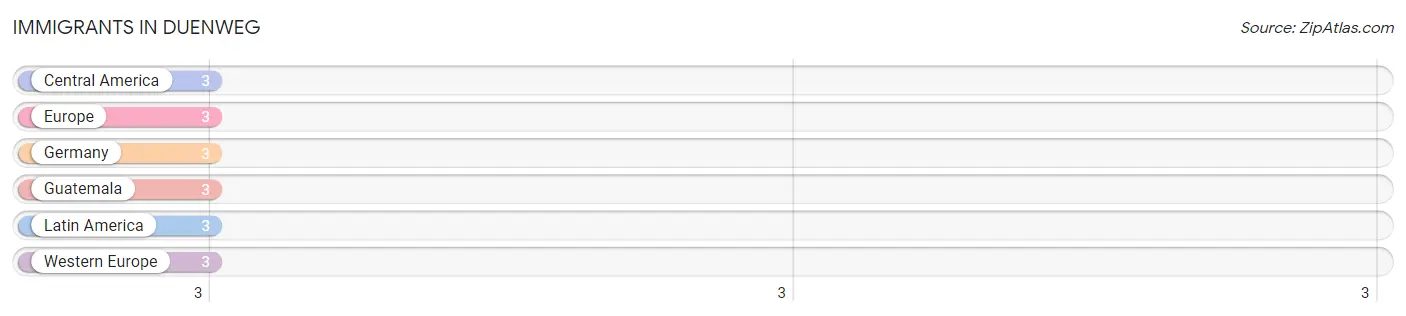
Immigrants in Duenweg
The most numerous immigrant groups reported in Duenweg came from Central America (3 | 0.2%), Europe (3 | 0.2%), Germany (3 | 0.2%), Guatemala (3 | 0.2%), and Latin America (3 | 0.2%), together accounting for 0.9% of all Duenweg residents.
| Immigration Origin | # Population | % Population |
| Central America | 3 | 0.2% |
| Europe | 3 | 0.2% |
| Germany | 3 | 0.2% |
| Guatemala | 3 | 0.2% |
| Latin America | 3 | 0.2% |
| Western Europe | 3 | 0.2% | View All 6 Rows |
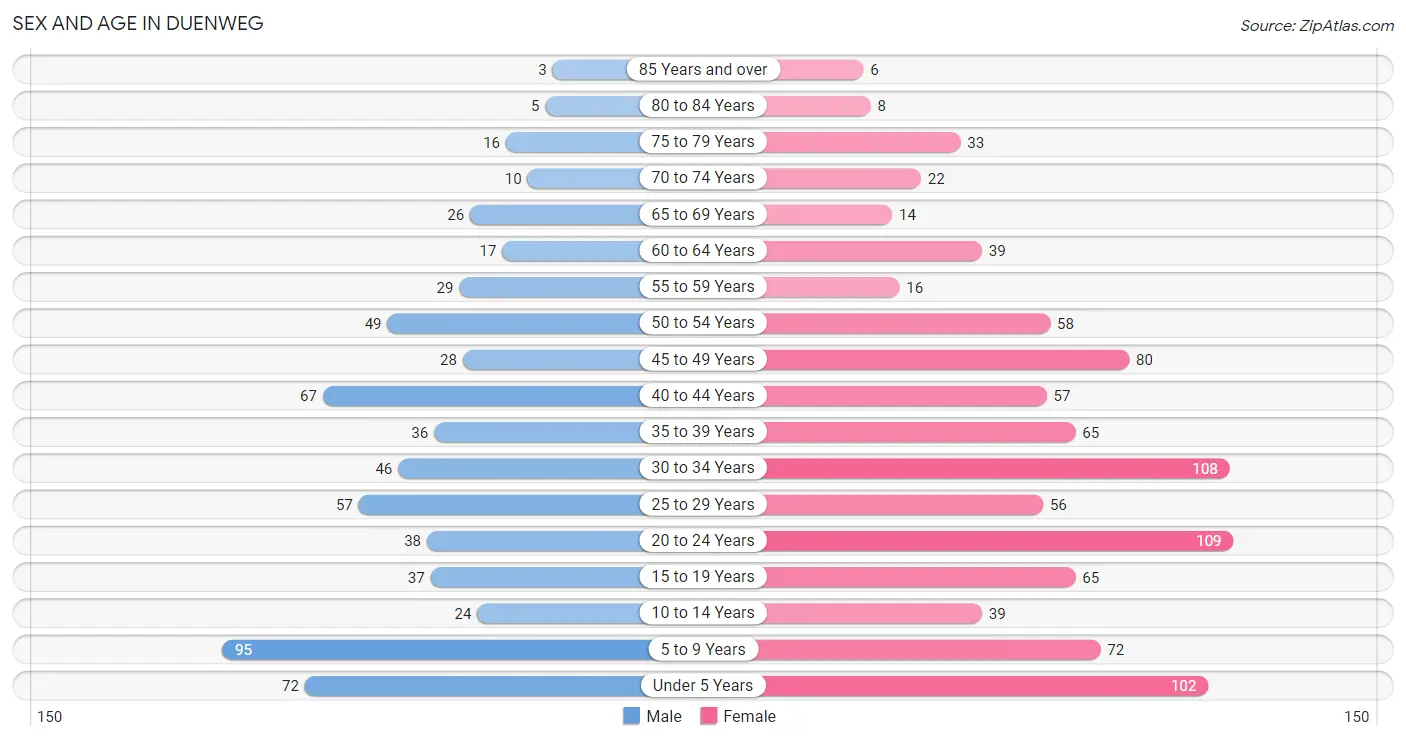
Sex and Age in Duenweg
Sex and Age in Duenweg
The most populous age groups in Duenweg are 5 to 9 Years (95 | 14.5%) for men and 20 to 24 Years (109 | 11.5%) for women.
| Age Bracket | Male | Female |
| Under 5 Years | 72 (11.0%) | 102 (10.7%) |
| 5 to 9 Years | 95 (14.5%) | 72 (7.6%) |
| 10 to 14 Years | 24 (3.7%) | 39 (4.1%) |
| 15 to 19 Years | 37 (5.7%) | 65 (6.9%) |
| 20 to 24 Years | 38 (5.8%) | 109 (11.5%) |
| 25 to 29 Years | 57 (8.7%) | 56 (5.9%) |
| 30 to 34 Years | 46 (7.0%) | 108 (11.4%) |
| 35 to 39 Years | 36 (5.5%) | 65 (6.9%) |
| 40 to 44 Years | 67 (10.2%) | 57 (6.0%) |
| 45 to 49 Years | 28 (4.3%) | 80 (8.4%) |
| 50 to 54 Years | 49 (7.5%) | 58 (6.1%) |
| 55 to 59 Years | 29 (4.4%) | 16 (1.7%) |
| 60 to 64 Years | 17 (2.6%) | 39 (4.1%) |
| 65 to 69 Years | 26 (4.0%) | 14 (1.5%) |
| 70 to 74 Years | 10 (1.5%) | 22 (2.3%) |
| 75 to 79 Years | 16 (2.4%) | 33 (3.5%) |
| 80 to 84 Years | 5 (0.8%) | 8 (0.8%) |
| 85 Years and over | 3 (0.5%) | 6 (0.6%) |
| Total | 655 (100.0%) | 949 (100.0%) |
Families and Households in Duenweg
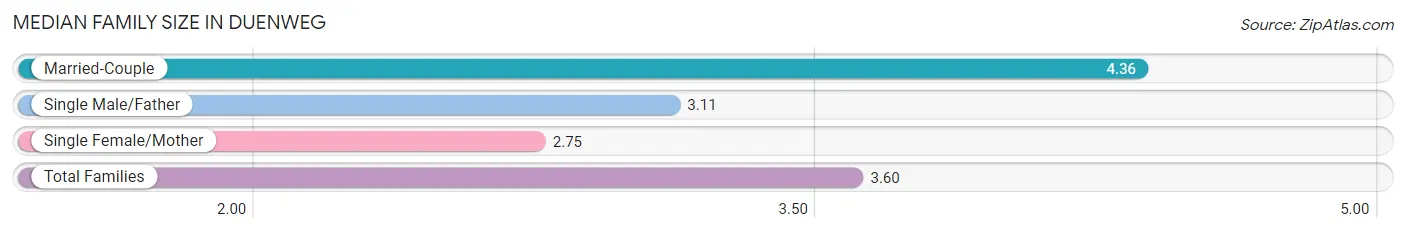
Median Family Size in Duenweg
The median family size in Duenweg is 3.60 persons per family, with married-couple families (184 | 51.4%) accounting for the largest median family size of 4.36 persons per family. On the other hand, single female/mother families (155 | 43.3%) represent the smallest median family size with 2.75 persons per family.
| Family Type | # Families | Family Size |
| Married-Couple | 184 (51.4%) | 4.36 |
| Single Male/Father | 19 (5.3%) | 3.11 |
| Single Female/Mother | 155 (43.3%) | 2.75 |
| Total Families | 358 (100.0%) | 3.60 |
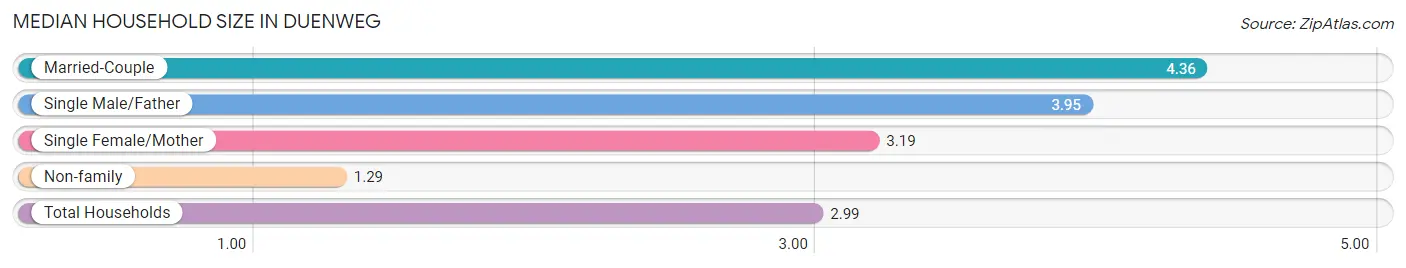
Median Household Size in Duenweg
The median household size in Duenweg is 2.99 persons per household, with married-couple households (184 | 34.3%) accounting for the largest median household size of 4.36 persons per household. non-family households (179 | 33.3%) represent the smallest median household size with 1.29 persons per household.
| Household Type | # Households | Household Size |
| Married-Couple | 184 (34.3%) | 4.36 |
| Single Male/Father | 19 (3.5%) | 3.95 |
| Single Female/Mother | 155 (28.9%) | 3.19 |
| Non-family | 179 (33.3%) | 1.29 |
| Total Households | 537 (100.0%) | 2.99 |
Household Size by Marriage Status in Duenweg
Out of a total of 537 households in Duenweg, 358 (66.7%) are family households, while 179 (33.3%) are nonfamily households. The most numerous type of family households are 2-person households, comprising 125, and the most common type of nonfamily households are 1-person households, comprising 137.
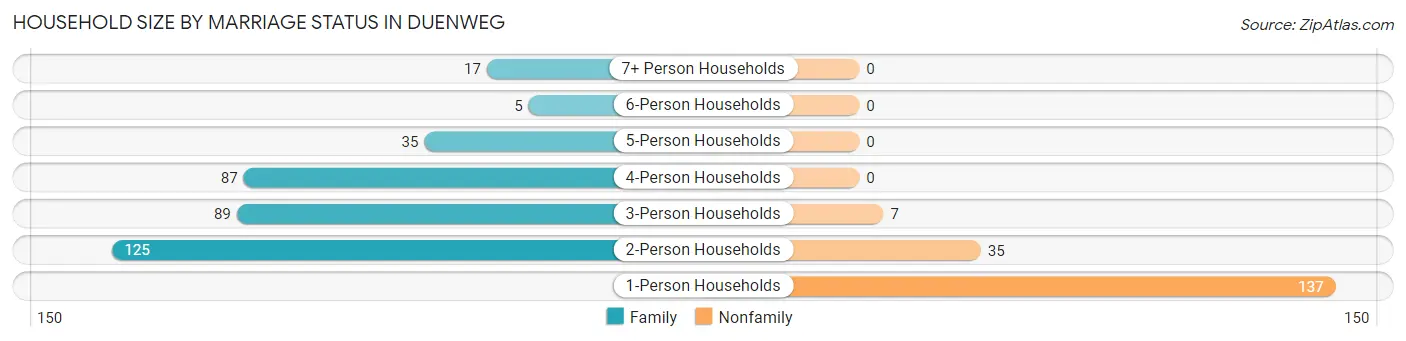
| Household Size | Family Households | Nonfamily Households |
| 1-Person Households | - | 137 (25.5%) |
| 2-Person Households | 125 (23.3%) | 35 (6.5%) |
| 3-Person Households | 89 (16.6%) | 7 (1.3%) |
| 4-Person Households | 87 (16.2%) | 0 (0.0%) |
| 5-Person Households | 35 (6.5%) | 0 (0.0%) |
| 6-Person Households | 5 (0.9%) | 0 (0.0%) |
| 7+ Person Households | 17 (3.2%) | 0 (0.0%) |
| Total | 358 (66.7%) | 179 (33.3%) |
Female Fertility in Duenweg
Fertility by Age in Duenweg
Average fertility rate in Duenweg is 45.0 births per 1,000 women. Women in the age bracket of 20 to 34 years have the highest fertility rate with 59.0 births per 1,000 women. Women in the age bracket of 20 to 34 years acount for 64.0% of all women with births.
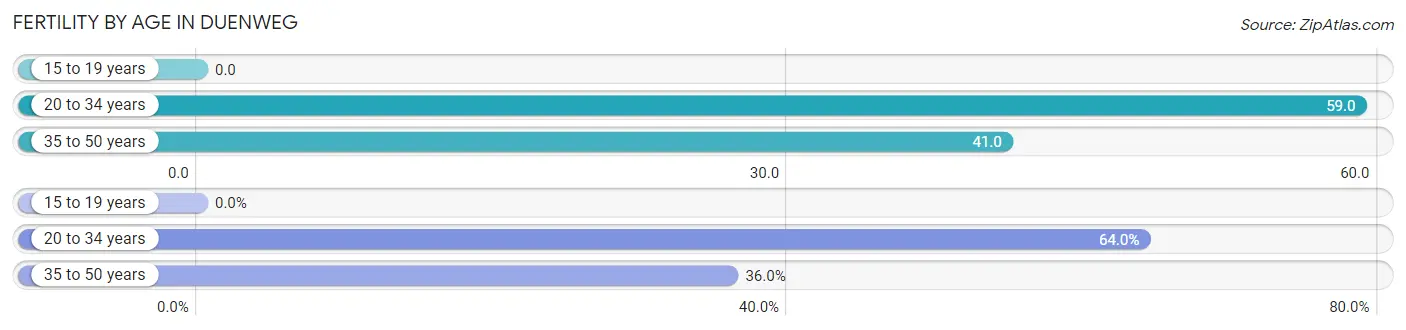
| Age Bracket | Women with Births | Births / 1,000 Women |
| 15 to 19 years | 0 (0.0%) | 0.0 |
| 20 to 34 years | 16 (64.0%) | 59.0 |
| 35 to 50 years | 9 (36.0%) | 41.0 |
| Total | 25 (100.0%) | 45.0 |
Fertility by Age by Marriage Status in Duenweg
20.0% of women with births (25) in Duenweg are married. The highest percentage of unmarried women with births falls into 35 to 50 years age bracket with 100.0% of them unmarried at the time of birth, while the lowest percentage of unmarried women with births belong to 20 to 34 years age bracket with 68.8% of them unmarried.
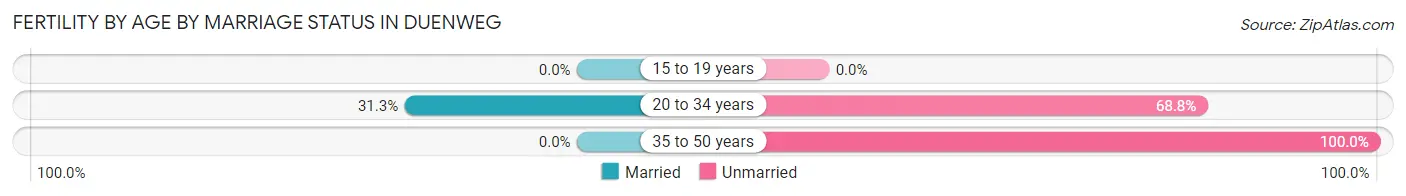
| Age Bracket | Married | Unmarried |
| 15 to 19 years | 0 (0.0%) | 0 (0.0%) |
| 20 to 34 years | 5 (31.2%) | 11 (68.8%) |
| 35 to 50 years | 0 (0.0%) | 9 (100.0%) |
| Total | 5 (20.0%) | 20 (80.0%) |
Fertility by Education in Duenweg
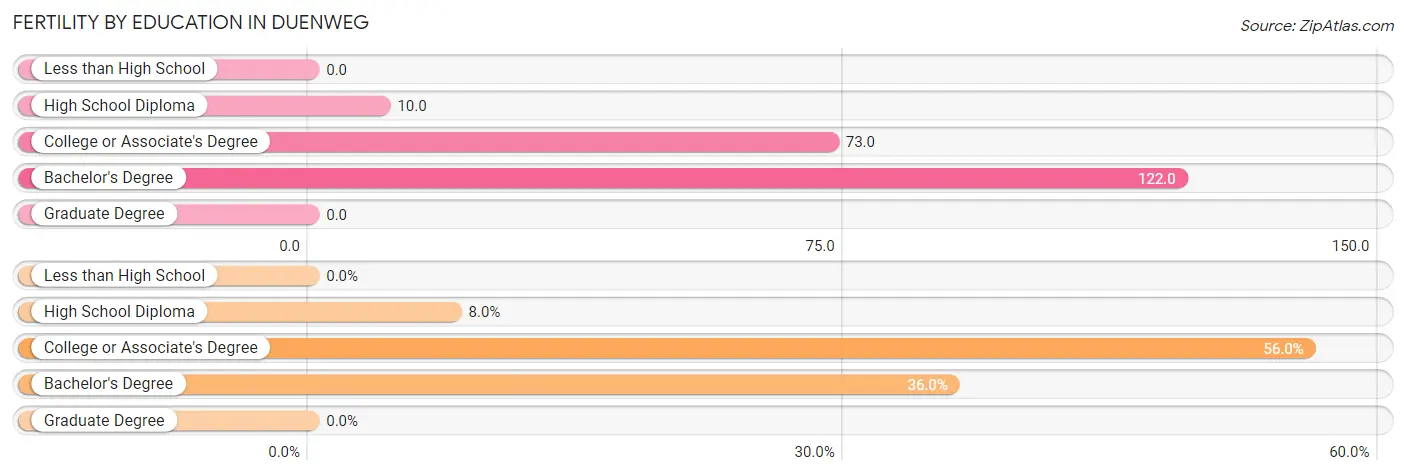
| Educational Attainment | Women with Births | Births / 1,000 Women |
| Less than High School | 0 (0.0%) | 0.0 |
| High School Diploma | 2 (8.0%) | 10.0 |
| College or Associate's Degree | 14 (56.0%) | 73.0 |
| Bachelor's Degree | 9 (36.0%) | 122.0 |
| Graduate Degree | 0 (0.0%) | 0.0 |
| Total | 25 (100.0%) | 45.0 |
Fertility by Education by Marriage Status in Duenweg
80.0% of women with births in Duenweg are unmarried. Women with the educational attainment of college or associate's degree are most likely to be married with 35.7% of them married at childbirth, while women with the educational attainment of high school diploma are least likely to be married with 100.0% of them unmarried at childbirth.
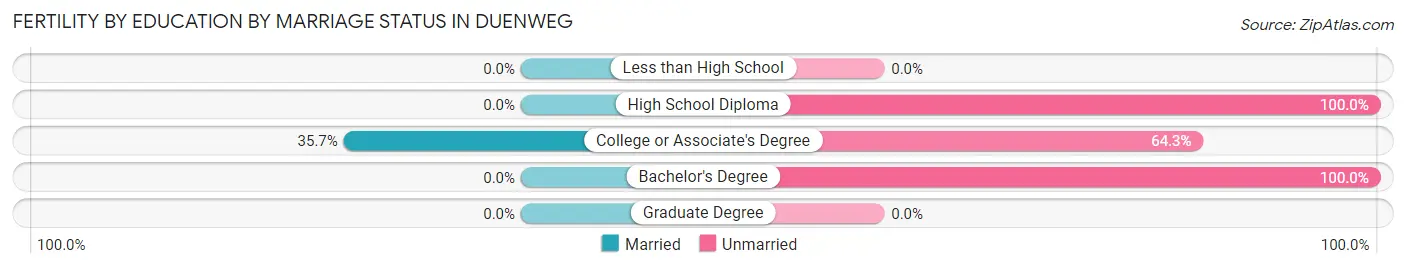
| Educational Attainment | Married | Unmarried |
| Less than High School | 0 (0.0%) | 0 (0.0%) |
| High School Diploma | 0 (0.0%) | 2 (100.0%) |
| College or Associate's Degree | 5 (35.7%) | 9 (64.3%) |
| Bachelor's Degree | 0 (0.0%) | 9 (100.0%) |
| Graduate Degree | 0 (0.0%) | 0 (0.0%) |
| Total | 5 (20.0%) | 20 (80.0%) |
Employment Characteristics in Duenweg
Employment by Class of Employer in Duenweg
Among the 815 employed individuals in Duenweg, private company employees (616 | 75.6%), state government employees (78 | 9.6%), and not-for-profit organizations (48 | 5.9%) make up the most common classes of employment.
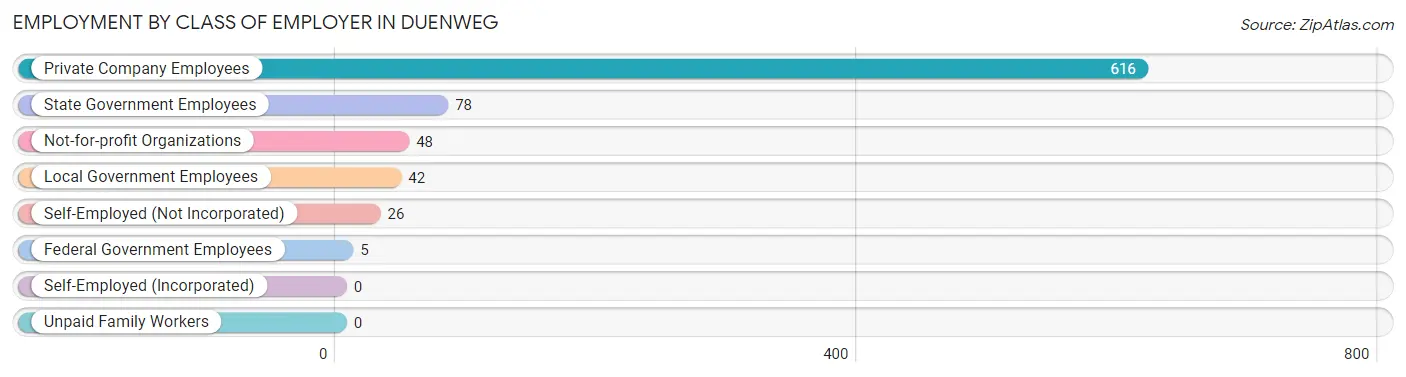
| Employer Class | # Employees | % Employees |
| Private Company Employees | 616 | 75.6% |
| Self-Employed (Incorporated) | 0 | 0.0% |
| Self-Employed (Not Incorporated) | 26 | 3.2% |
| Not-for-profit Organizations | 48 | 5.9% |
| Local Government Employees | 42 | 5.1% |
| State Government Employees | 78 | 9.6% |
| Federal Government Employees | 5 | 0.6% |
| Unpaid Family Workers | 0 | 0.0% |
| Total | 815 | 100.0% |
Employment Status by Age in Duenweg
According to the labor force statistics for Duenweg, out of the total population over 16 years of age (1,163), 73.3% or 852 individuals are in the labor force, with 2.8% or 24 of them unemployed. The age group with the highest labor force participation rate is 20 to 24 years, with 98.0% or 144 individuals in the labor force. Within the labor force, the 60 to 64 years age range has the highest percentage of unemployed individuals, with 20.0% or 5 of them being unemployed.
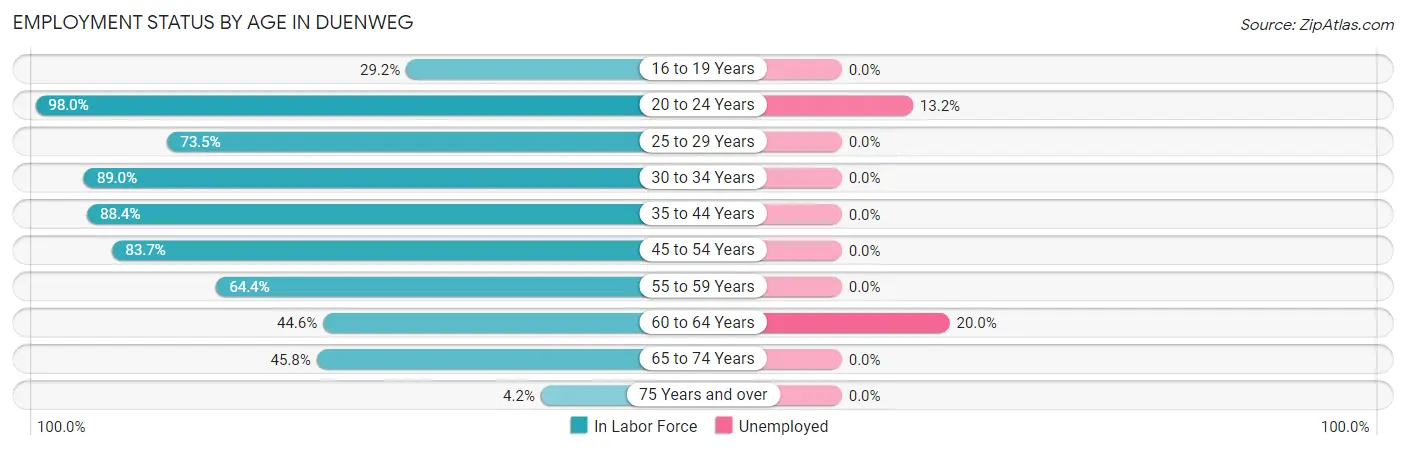
| Age Bracket | In Labor Force | Unemployed |
| 16 to 19 Years | 19 (29.2%) | 0 (0.0%) |
| 20 to 24 Years | 144 (98.0%) | 19 (13.2%) |
| 25 to 29 Years | 83 (73.5%) | 0 (0.0%) |
| 30 to 34 Years | 137 (89.0%) | 0 (0.0%) |
| 35 to 44 Years | 199 (88.4%) | 0 (0.0%) |
| 45 to 54 Years | 180 (83.7%) | 0 (0.0%) |
| 55 to 59 Years | 29 (64.4%) | 0 (0.0%) |
| 60 to 64 Years | 25 (44.6%) | 5 (20.0%) |
| 65 to 74 Years | 33 (45.8%) | 0 (0.0%) |
| 75 Years and over | 3 (4.2%) | 0 (0.0%) |
| Total | 852 (73.3%) | 24 (2.8%) |
Employment Status by Educational Attainment in Duenweg
According to labor force statistics for Duenweg, 80.8% of individuals (653) out of the total population between 25 and 64 years of age (808) are in the labor force, with 0.8% or 5 of them being unemployed. The group with the highest labor force participation rate are those with the educational attainment of bachelor's degree or higher, with 95.7% or 157 individuals in the labor force. Within the labor force, individuals with high school diploma education have the highest percentage of unemployment, with 3.1% or 5 of them being unemployed.
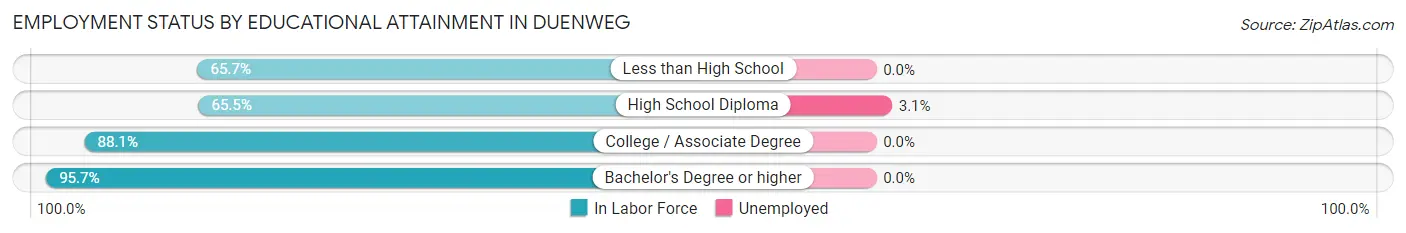
| Educational Attainment | In Labor Force | Unemployed |
| Less than High School | 44 (65.7%) | 0 (0.0%) |
| High School Diploma | 163 (65.5%) | 8 (3.1%) |
| College / Associate Degree | 289 (88.1%) | 0 (0.0%) |
| Bachelor's Degree or higher | 157 (95.7%) | 0 (0.0%) |
| Total | 653 (80.8%) | 6 (0.8%) |
Employment Occupations by Sex in Duenweg
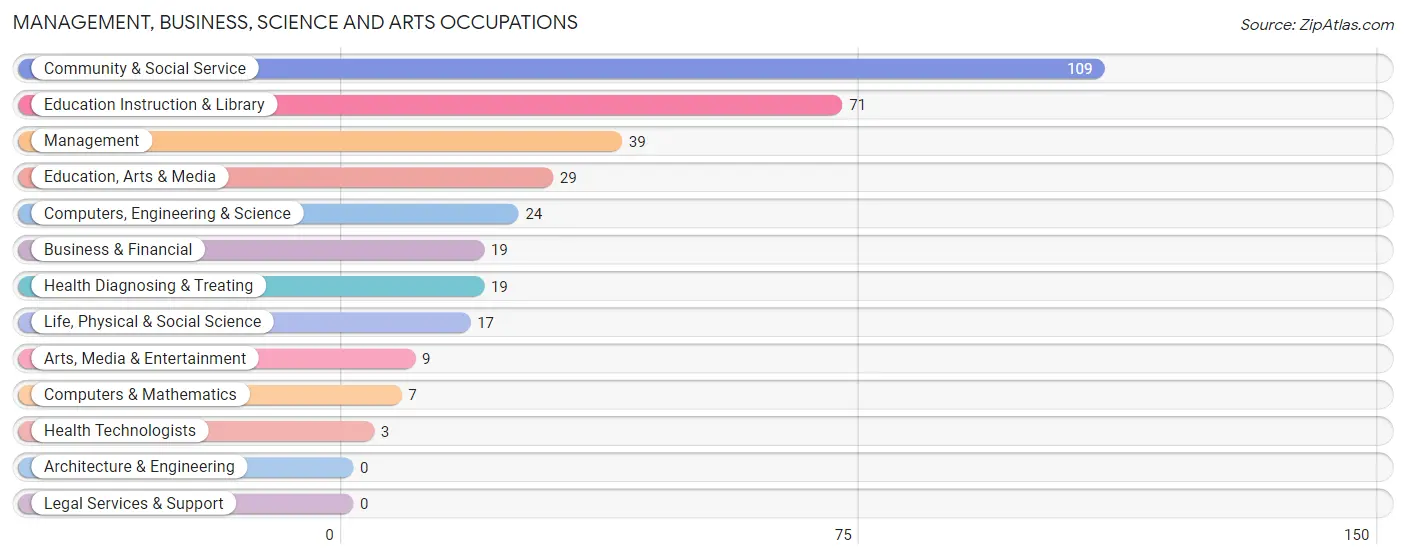
Management, Business, Science and Arts Occupations
The most common Management, Business, Science and Arts occupations in Duenweg are Community & Social Service (109 | 13.2%), Education Instruction & Library (71 | 8.6%), Management (39 | 4.7%), Education, Arts & Media (29 | 3.5%), and Computers, Engineering & Science (24 | 2.9%).
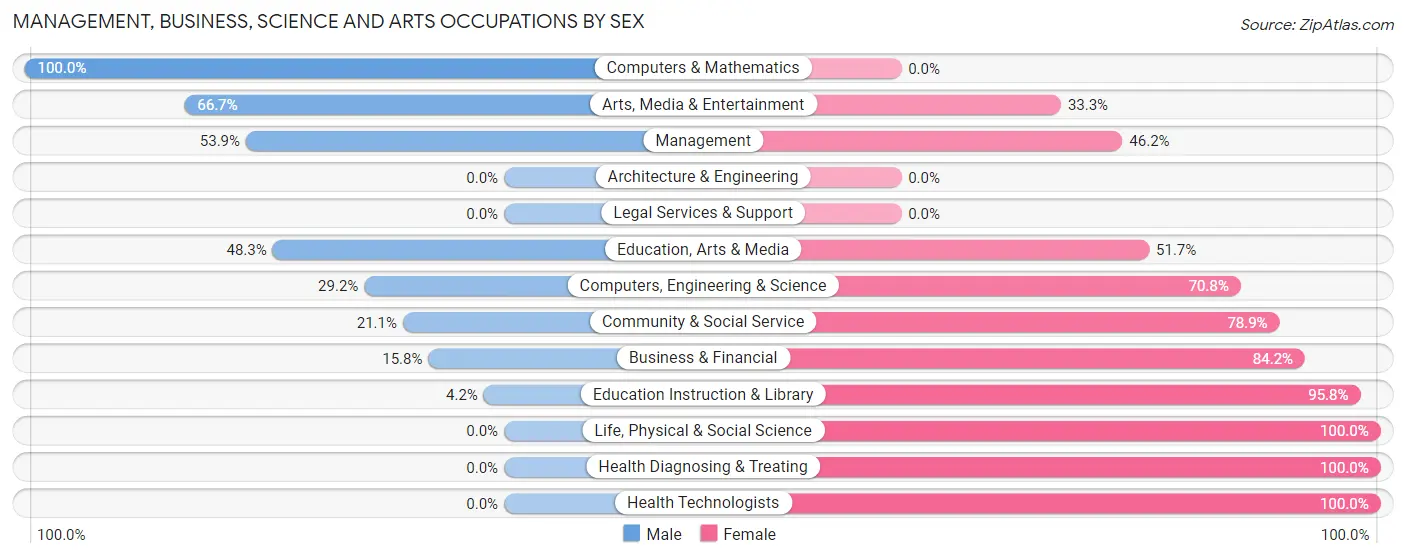
Management, Business, Science and Arts Occupations by Sex
Within the Management, Business, Science and Arts occupations in Duenweg, the most male-oriented occupations are Computers & Mathematics (100.0%), Arts, Media & Entertainment (66.7%), and Management (53.8%), while the most female-oriented occupations are Life, Physical & Social Science (100.0%), Health Diagnosing & Treating (100.0%), and Health Technologists (100.0%).
| Occupation | Male | Female |
| Management | 21 (53.8%) | 18 (46.2%) |
| Business & Financial | 3 (15.8%) | 16 (84.2%) |
| Computers, Engineering & Science | 7 (29.2%) | 17 (70.8%) |
| Computers & Mathematics | 7 (100.0%) | 0 (0.0%) |
| Architecture & Engineering | 0 (0.0%) | 0 (0.0%) |
| Life, Physical & Social Science | 0 (0.0%) | 17 (100.0%) |
| Community & Social Service | 23 (21.1%) | 86 (78.9%) |
| Education, Arts & Media | 14 (48.3%) | 15 (51.7%) |
| Legal Services & Support | 0 (0.0%) | 0 (0.0%) |
| Education Instruction & Library | 3 (4.2%) | 68 (95.8%) |
| Arts, Media & Entertainment | 6 (66.7%) | 3 (33.3%) |
| Health Diagnosing & Treating | 0 (0.0%) | 19 (100.0%) |
| Health Technologists | 0 (0.0%) | 3 (100.0%) |
| Total (Category) | 54 (25.7%) | 156 (74.3%) |
| Total (Overall) | 334 (40.3%) | 494 (59.7%) |
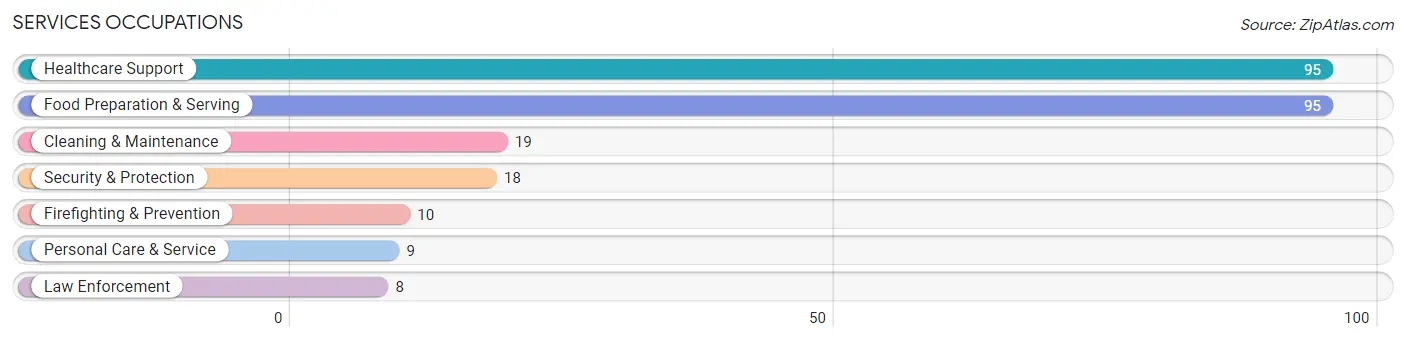
Services Occupations
The most common Services occupations in Duenweg are Healthcare Support (95 | 11.5%), Food Preparation & Serving (95 | 11.5%), Cleaning & Maintenance (19 | 2.3%), Security & Protection (18 | 2.2%), and Firefighting & Prevention (10 | 1.2%).
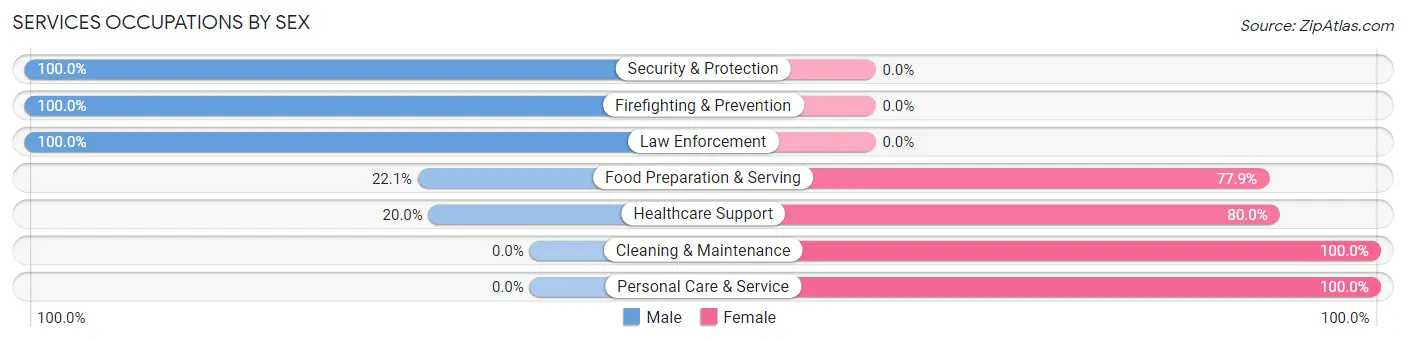
Services Occupations by Sex
Within the Services occupations in Duenweg, the most male-oriented occupations are Security & Protection (100.0%), Firefighting & Prevention (100.0%), and Law Enforcement (100.0%), while the most female-oriented occupations are Cleaning & Maintenance (100.0%), Personal Care & Service (100.0%), and Healthcare Support (80.0%).
| Occupation | Male | Female |
| Healthcare Support | 19 (20.0%) | 76 (80.0%) |
| Security & Protection | 18 (100.0%) | 0 (0.0%) |
| Firefighting & Prevention | 10 (100.0%) | 0 (0.0%) |
| Law Enforcement | 8 (100.0%) | 0 (0.0%) |
| Food Preparation & Serving | 21 (22.1%) | 74 (77.9%) |
| Cleaning & Maintenance | 0 (0.0%) | 19 (100.0%) |
| Personal Care & Service | 0 (0.0%) | 9 (100.0%) |
| Total (Category) | 58 (24.6%) | 178 (75.4%) |
| Total (Overall) | 334 (40.3%) | 494 (59.7%) |
Sales and Office Occupations
The most common Sales and Office occupations in Duenweg are Office & Administration (94 | 11.4%), and Sales & Related (81 | 9.8%).
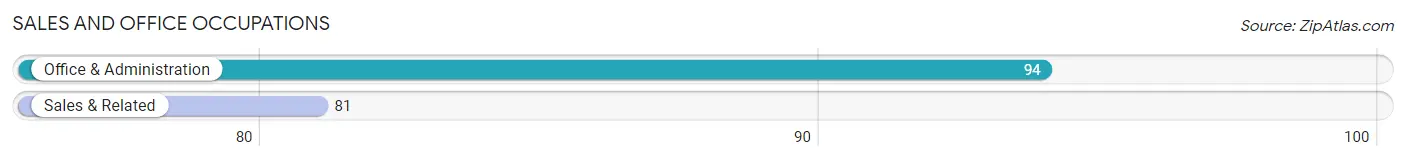
Sales and Office Occupations by Sex
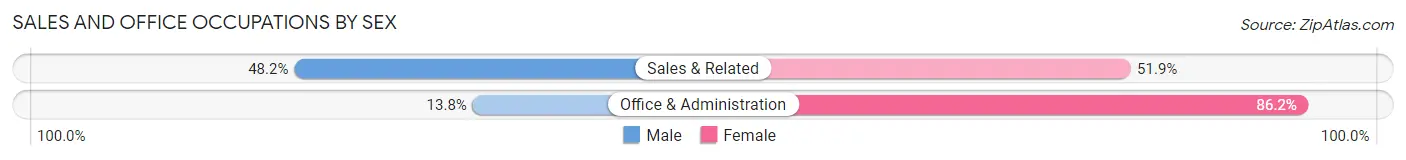
| Occupation | Male | Female |
| Sales & Related | 39 (48.1%) | 42 (51.8%) |
| Office & Administration | 13 (13.8%) | 81 (86.2%) |
| Total (Category) | 52 (29.7%) | 123 (70.3%) |
| Total (Overall) | 334 (40.3%) | 494 (59.7%) |
Natural Resources, Construction and Maintenance Occupations
The most common Natural Resources, Construction and Maintenance occupations in Duenweg are Construction & Extraction (40 | 4.8%), and Installation, Maintenance & Repair (37 | 4.5%).
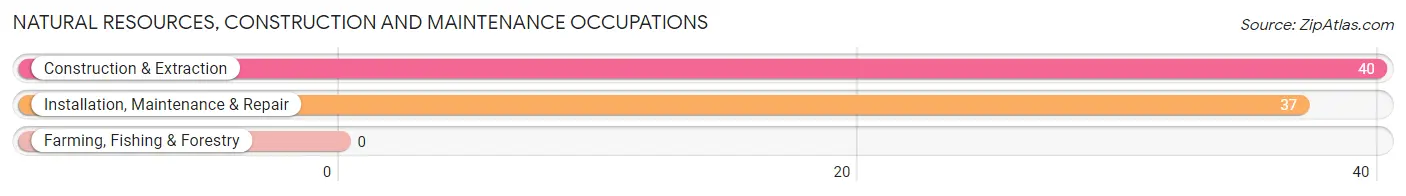
Natural Resources, Construction and Maintenance Occupations by Sex
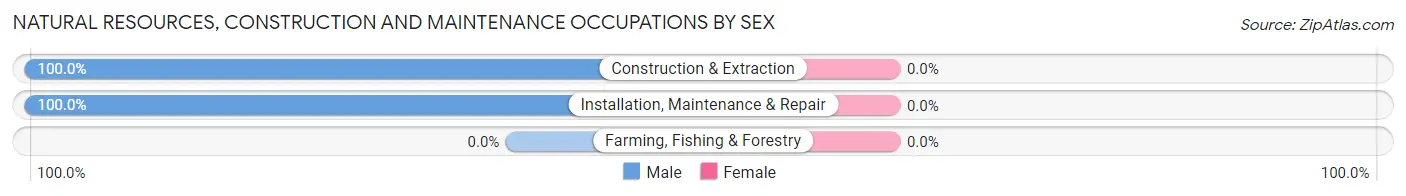
| Occupation | Male | Female |
| Farming, Fishing & Forestry | 0 (0.0%) | 0 (0.0%) |
| Construction & Extraction | 40 (100.0%) | 0 (0.0%) |
| Installation, Maintenance & Repair | 37 (100.0%) | 0 (0.0%) |
| Total (Category) | 77 (100.0%) | 0 (0.0%) |
| Total (Overall) | 334 (40.3%) | 494 (59.7%) |
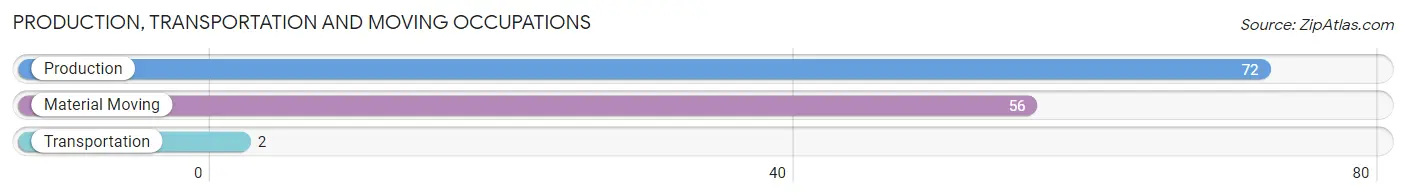
Production, Transportation and Moving Occupations
The most common Production, Transportation and Moving occupations in Duenweg are Production (72 | 8.7%), Material Moving (56 | 6.8%), and Transportation (2 | 0.2%).
Production, Transportation and Moving Occupations by Sex
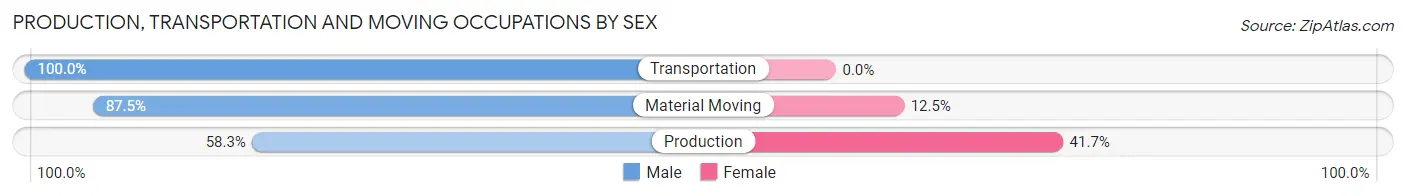
| Occupation | Male | Female |
| Production | 42 (58.3%) | 30 (41.7%) |
| Transportation | 2 (100.0%) | 0 (0.0%) |
| Material Moving | 49 (87.5%) | 7 (12.5%) |
| Total (Category) | 93 (71.5%) | 37 (28.5%) |
| Total (Overall) | 334 (40.3%) | 494 (59.7%) |
Employment Industries by Sex in Duenweg
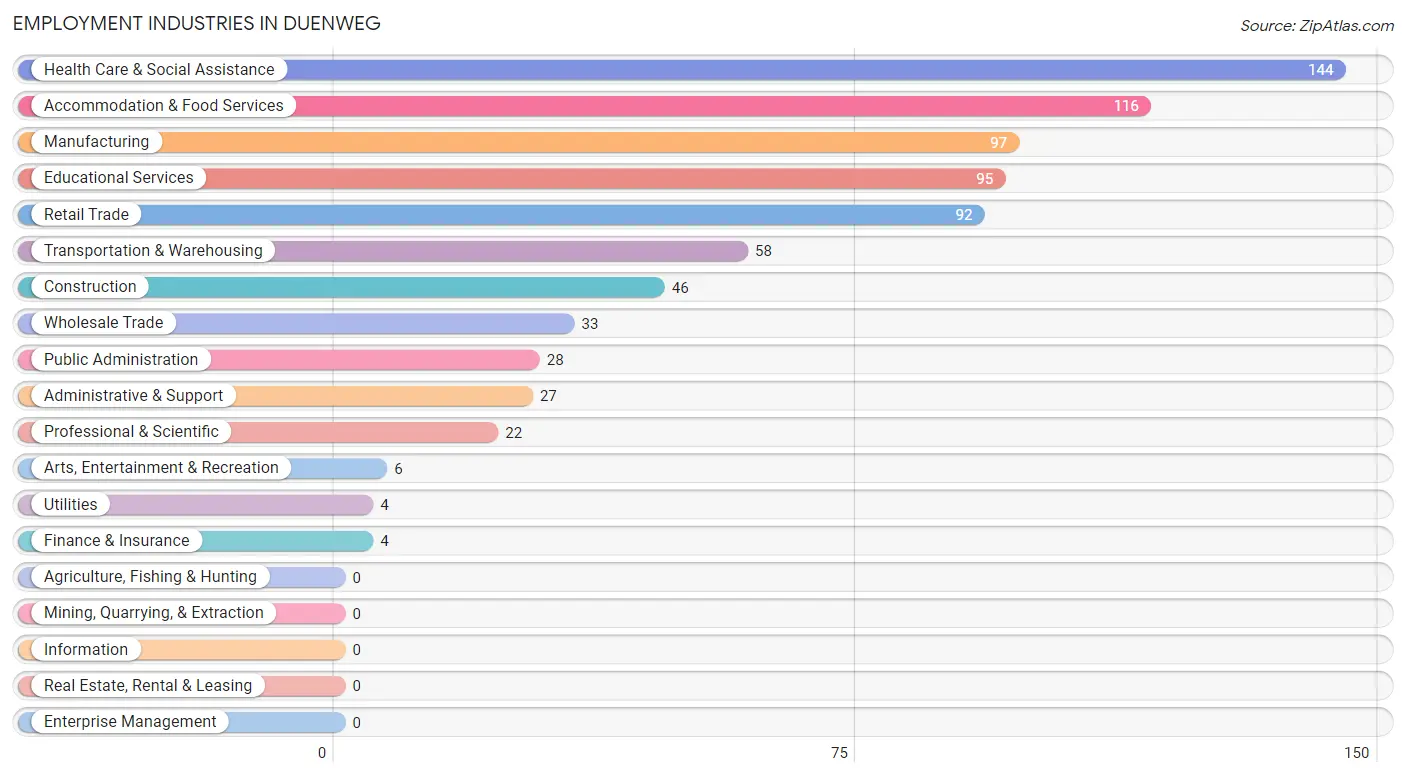
Employment Industries in Duenweg
The major employment industries in Duenweg include Health Care & Social Assistance (144 | 17.4%), Accommodation & Food Services (116 | 14.0%), Manufacturing (97 | 11.7%), Educational Services (95 | 11.5%), and Retail Trade (92 | 11.1%).
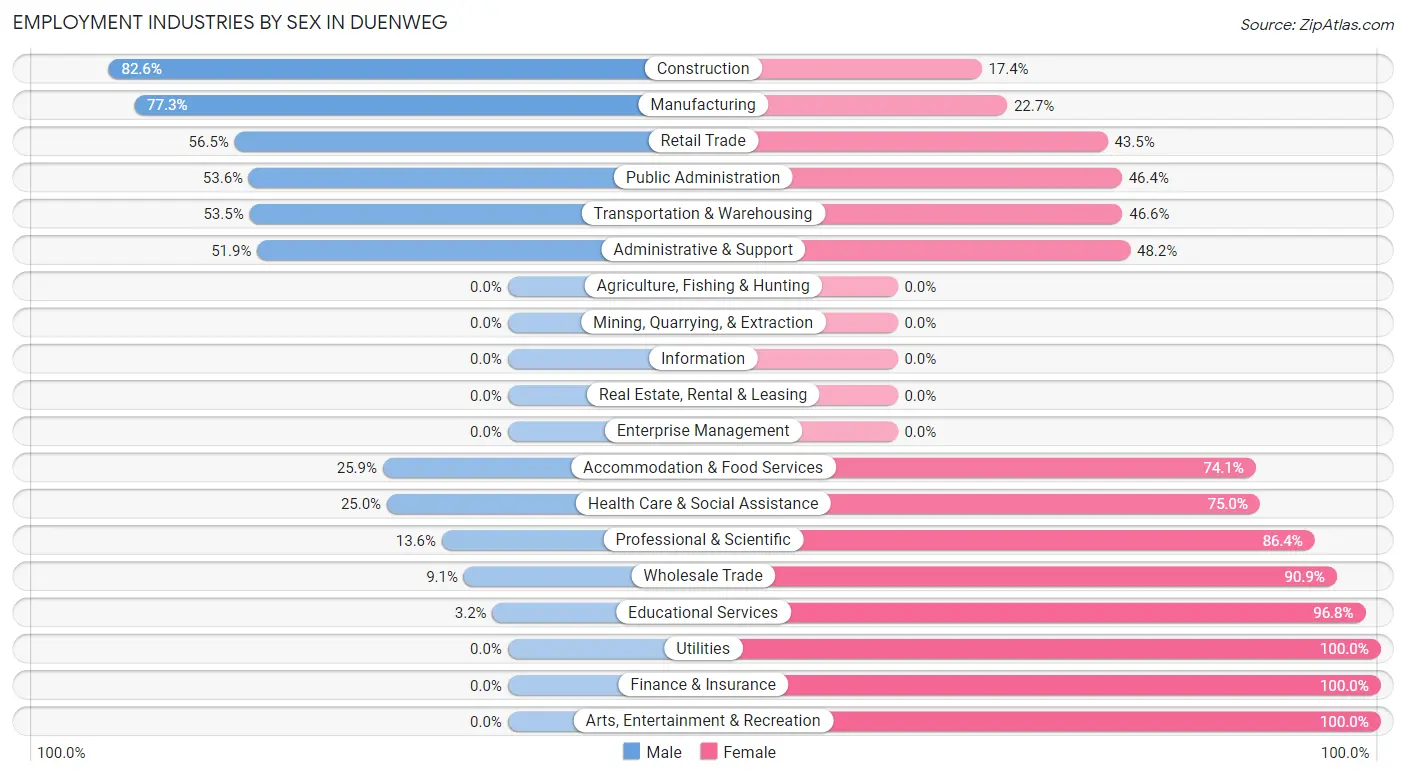
Employment Industries by Sex in Duenweg
The Duenweg industries that see more men than women are Construction (82.6%), Manufacturing (77.3%), and Retail Trade (56.5%), whereas the industries that tend to have a higher number of women are Utilities (100.0%), Finance & Insurance (100.0%), and Arts, Entertainment & Recreation (100.0%).
| Industry | Male | Female |
| Agriculture, Fishing & Hunting | 0 (0.0%) | 0 (0.0%) |
| Mining, Quarrying, & Extraction | 0 (0.0%) | 0 (0.0%) |
| Construction | 38 (82.6%) | 8 (17.4%) |
| Manufacturing | 75 (77.3%) | 22 (22.7%) |
| Wholesale Trade | 3 (9.1%) | 30 (90.9%) |
| Retail Trade | 52 (56.5%) | 40 (43.5%) |
| Transportation & Warehousing | 31 (53.4%) | 27 (46.6%) |
| Utilities | 0 (0.0%) | 4 (100.0%) |
| Information | 0 (0.0%) | 0 (0.0%) |
| Finance & Insurance | 0 (0.0%) | 4 (100.0%) |
| Real Estate, Rental & Leasing | 0 (0.0%) | 0 (0.0%) |
| Professional & Scientific | 3 (13.6%) | 19 (86.4%) |
| Enterprise Management | 0 (0.0%) | 0 (0.0%) |
| Administrative & Support | 14 (51.8%) | 13 (48.1%) |
| Educational Services | 3 (3.2%) | 92 (96.8%) |
| Health Care & Social Assistance | 36 (25.0%) | 108 (75.0%) |
| Arts, Entertainment & Recreation | 0 (0.0%) | 6 (100.0%) |
| Accommodation & Food Services | 30 (25.9%) | 86 (74.1%) |
| Public Administration | 15 (53.6%) | 13 (46.4%) |
| Total | 334 (40.3%) | 494 (59.7%) |
Education in Duenweg
School Enrollment in Duenweg
The most common levels of schooling among the 401 students in Duenweg are elementary school (109 | 27.2%), high school (93 | 23.2%), and nursery / preschool (71 | 17.7%).
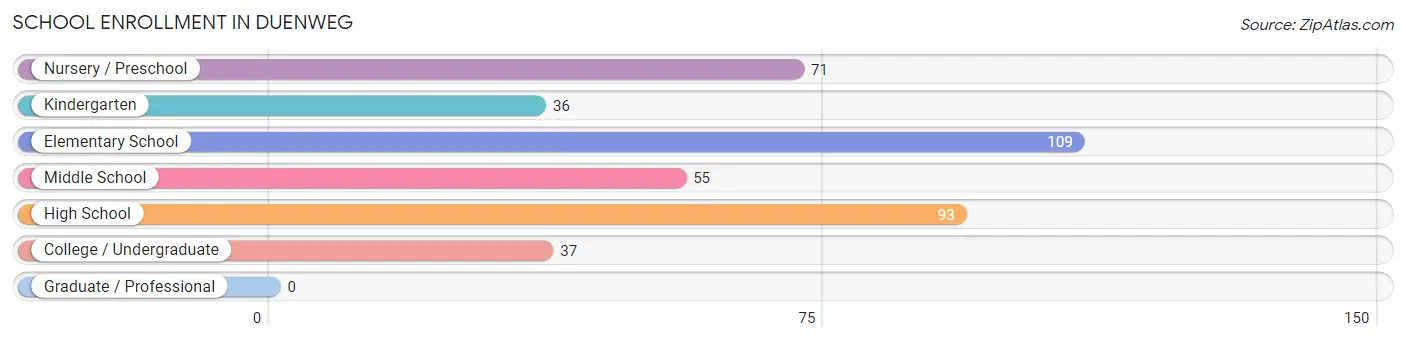
| School Level | # Students | % Students |
| Nursery / Preschool | 71 | 17.7% |
| Kindergarten | 36 | 9.0% |
| Elementary School | 109 | 27.2% |
| Middle School | 55 | 13.7% |
| High School | 93 | 23.2% |
| College / Undergraduate | 37 | 9.2% |
| Graduate / Professional | 0 | 0.0% |
| Total | 401 | 100.0% |
School Enrollment by Age by Funding Source in Duenweg
Out of a total of 401 students who are enrolled in schools in Duenweg, 117 (29.2%) attend a private institution, while the remaining 284 (70.8%) are enrolled in public schools. The age group of 3 to 4 year olds has the highest likelihood of being enrolled in private schools, with 24 (48.0% in the age bracket) enrolled. Conversely, the age group of 10 to 14 year olds has the lowest likelihood of being enrolled in a private school, with 63 (100.0% in the age bracket) attending a public institution.
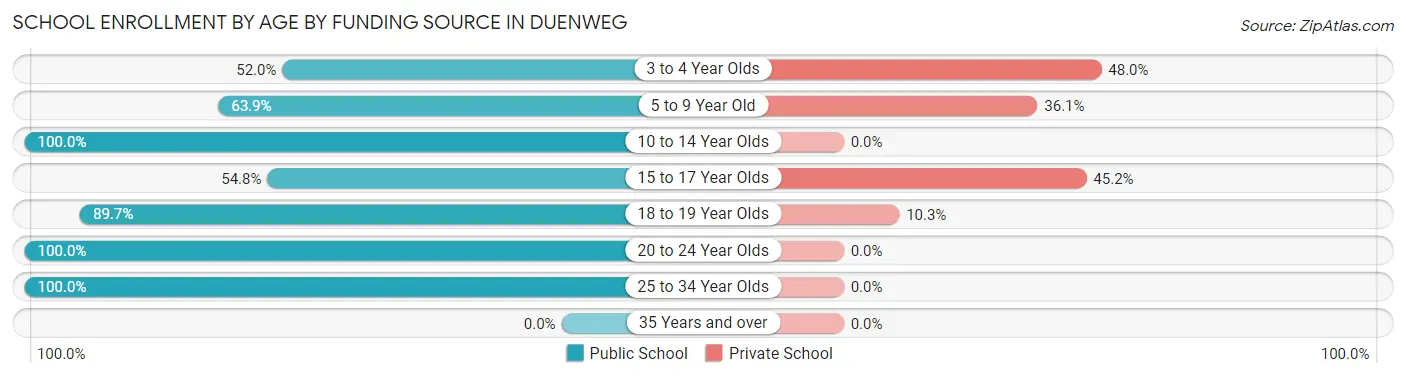
| Age Bracket | Public School | Private School |
| 3 to 4 Year Olds | 26 (52.0%) | 24 (48.0%) |
| 5 to 9 Year Old | 101 (63.9%) | 57 (36.1%) |
| 10 to 14 Year Olds | 63 (100.0%) | 0 (0.0%) |
| 15 to 17 Year Olds | 40 (54.8%) | 33 (45.2%) |
| 18 to 19 Year Olds | 26 (89.7%) | 3 (10.3%) |
| 20 to 24 Year Olds | 19 (100.0%) | 0 (0.0%) |
| 25 to 34 Year Olds | 9 (100.0%) | 0 (0.0%) |
| 35 Years and over | 0 (0.0%) | 0 (0.0%) |
| Total | 284 (70.8%) | 117 (29.2%) |
Educational Attainment by Field of Study in Duenweg
Education (72 | 32.7%), arts & humanities (40 | 18.2%), bio, nature & agricultural (24 | 10.9%), visual & performing arts (24 | 10.9%), and computers & mathematics (20 | 9.1%) are the most common fields of study among 220 individuals in Duenweg who have obtained a bachelor's degree or higher.
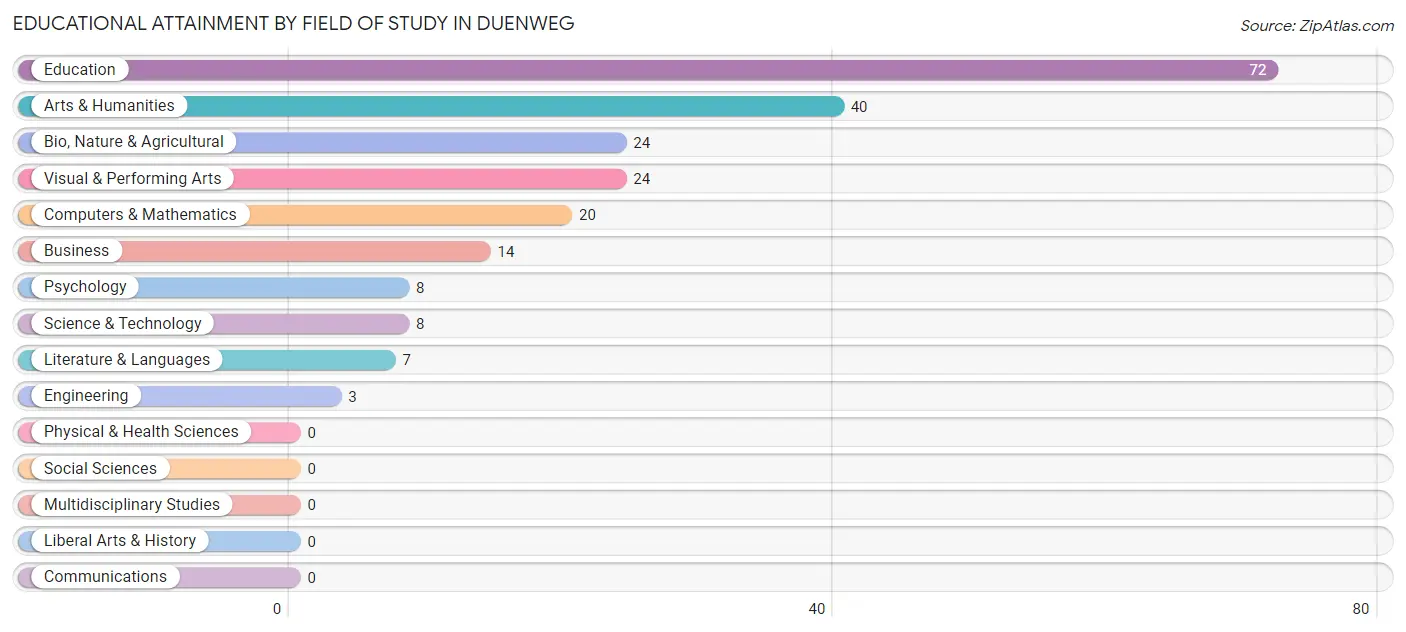
| Field of Study | # Graduates | % Graduates |
| Computers & Mathematics | 20 | 9.1% |
| Bio, Nature & Agricultural | 24 | 10.9% |
| Physical & Health Sciences | 0 | 0.0% |
| Psychology | 8 | 3.6% |
| Social Sciences | 0 | 0.0% |
| Engineering | 3 | 1.4% |
| Multidisciplinary Studies | 0 | 0.0% |
| Science & Technology | 8 | 3.6% |
| Business | 14 | 6.4% |
| Education | 72 | 32.7% |
| Literature & Languages | 7 | 3.2% |
| Liberal Arts & History | 0 | 0.0% |
| Visual & Performing Arts | 24 | 10.9% |
| Communications | 0 | 0.0% |
| Arts & Humanities | 40 | 18.2% |
| Total | 220 | 100.0% |
Transportation & Commute in Duenweg
Vehicle Availability by Sex in Duenweg
The most prevalent vehicle ownership categories in Duenweg are males with 2 vehicles (117, accounting for 36.4%) and females with 2 vehicles (198, making up 23.7%).
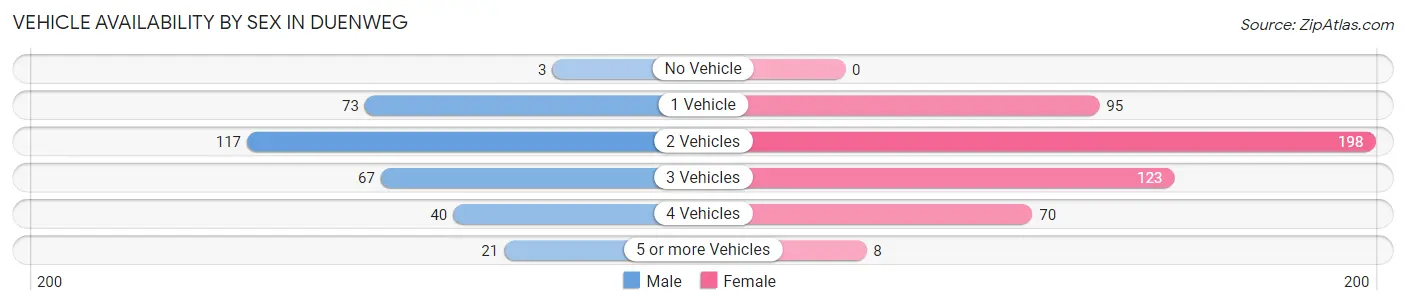
| Vehicles Available | Male | Female |
| No Vehicle | 3 (0.9%) | 0 (0.0%) |
| 1 Vehicle | 73 (22.7%) | 95 (19.2%) |
| 2 Vehicles | 117 (36.4%) | 198 (40.1%) |
| 3 Vehicles | 67 (20.9%) | 123 (24.9%) |
| 4 Vehicles | 40 (12.5%) | 70 (14.2%) |
| 5 or more Vehicles | 21 (6.5%) | 8 (1.6%) |
| Total | 321 (100.0%) | 494 (100.0%) |
Commute Time in Duenweg
The most frequently occuring commute durations in Duenweg are 15 to 19 minutes (307 commuters, 40.2%), 10 to 14 minutes (164 commuters, 21.5%), and 20 to 24 minutes (95 commuters, 12.4%).
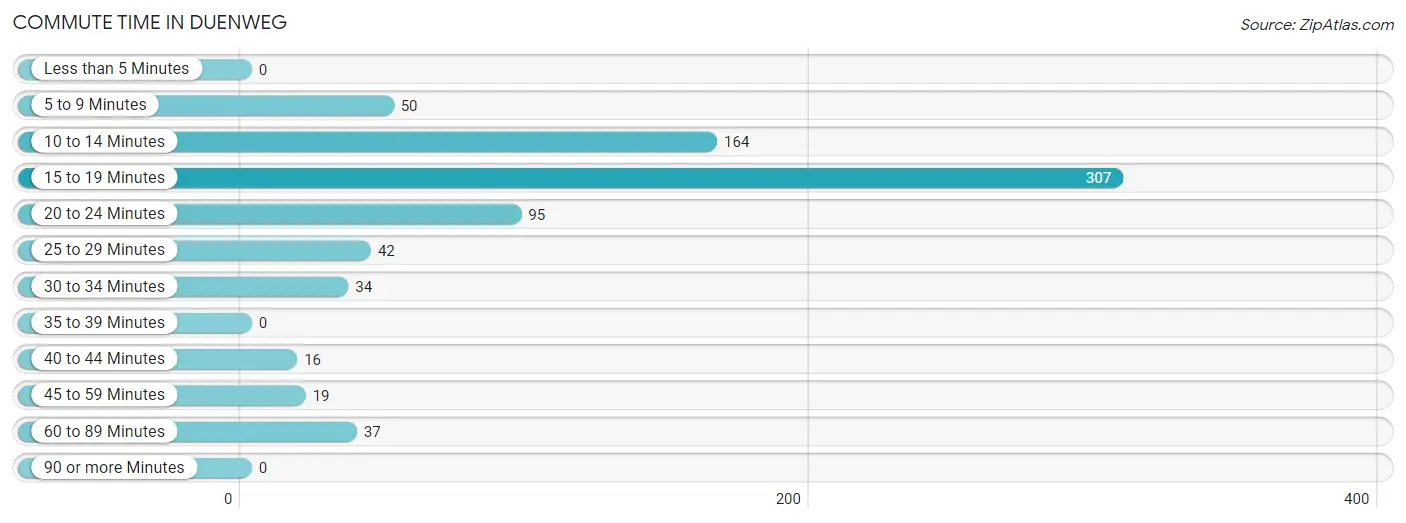
| Commute Time | # Commuters | % Commuters |
| Less than 5 Minutes | 0 | 0.0% |
| 5 to 9 Minutes | 50 | 6.5% |
| 10 to 14 Minutes | 164 | 21.5% |
| 15 to 19 Minutes | 307 | 40.2% |
| 20 to 24 Minutes | 95 | 12.4% |
| 25 to 29 Minutes | 42 | 5.5% |
| 30 to 34 Minutes | 34 | 4.4% |
| 35 to 39 Minutes | 0 | 0.0% |
| 40 to 44 Minutes | 16 | 2.1% |
| 45 to 59 Minutes | 19 | 2.5% |
| 60 to 89 Minutes | 37 | 4.8% |
| 90 or more Minutes | 0 | 0.0% |
Commute Time by Sex in Duenweg
The most common commute times in Duenweg are 15 to 19 minutes (103 commuters, 35.1%) for males and 15 to 19 minutes (204 commuters, 43.3%) for females.
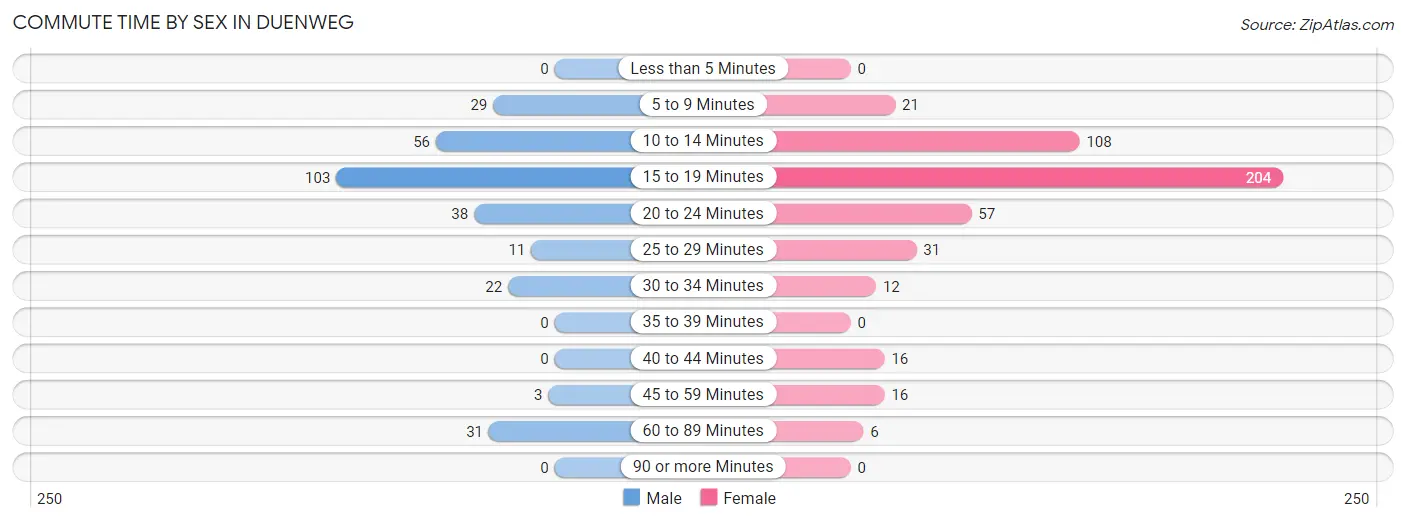
| Commute Time | Male | Female |
| Less than 5 Minutes | 0 (0.0%) | 0 (0.0%) |
| 5 to 9 Minutes | 29 (9.9%) | 21 (4.5%) |
| 10 to 14 Minutes | 56 (19.1%) | 108 (22.9%) |
| 15 to 19 Minutes | 103 (35.1%) | 204 (43.3%) |
| 20 to 24 Minutes | 38 (13.0%) | 57 (12.1%) |
| 25 to 29 Minutes | 11 (3.7%) | 31 (6.6%) |
| 30 to 34 Minutes | 22 (7.5%) | 12 (2.5%) |
| 35 to 39 Minutes | 0 (0.0%) | 0 (0.0%) |
| 40 to 44 Minutes | 0 (0.0%) | 16 (3.4%) |
| 45 to 59 Minutes | 3 (1.0%) | 16 (3.4%) |
| 60 to 89 Minutes | 31 (10.6%) | 6 (1.3%) |
| 90 or more Minutes | 0 (0.0%) | 0 (0.0%) |
Time of Departure to Work by Sex in Duenweg
The most frequent times of departure to work in Duenweg are 7:30 AM to 7:59 AM (69, 23.5%) for males and 7:30 AM to 7:59 AM (71, 15.1%) for females.
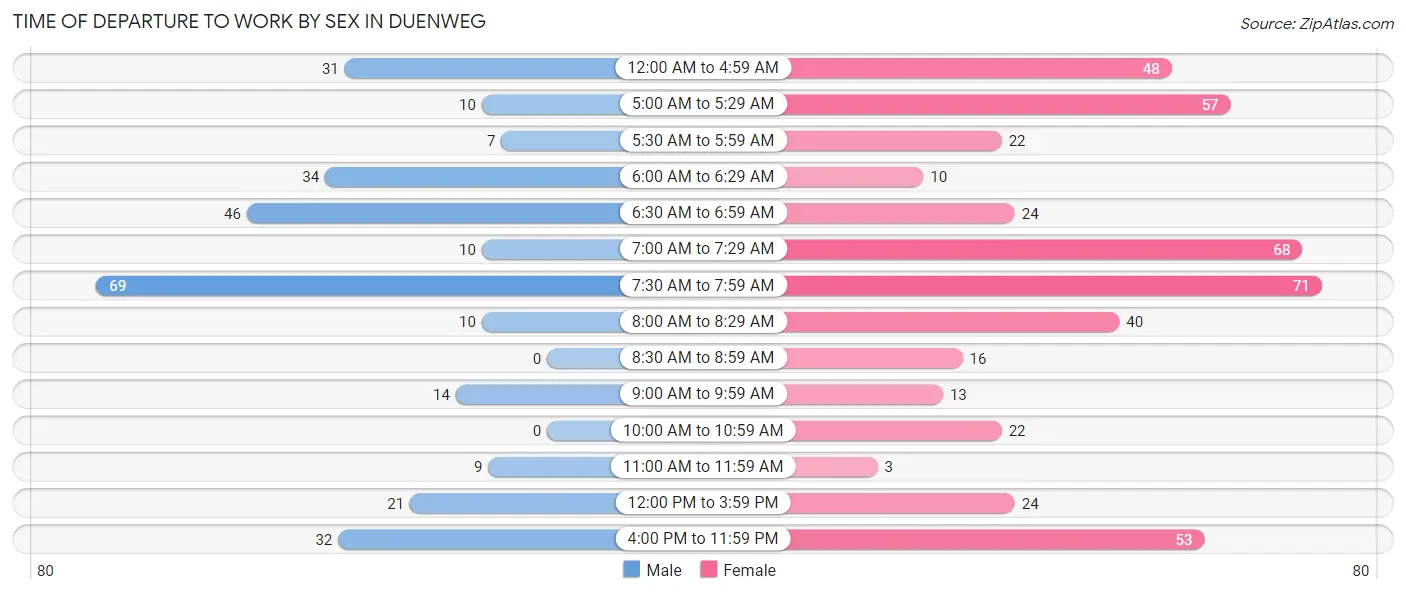
| Time of Departure | Male | Female |
| 12:00 AM to 4:59 AM | 31 (10.6%) | 48 (10.2%) |
| 5:00 AM to 5:29 AM | 10 (3.4%) | 57 (12.1%) |
| 5:30 AM to 5:59 AM | 7 (2.4%) | 22 (4.7%) |
| 6:00 AM to 6:29 AM | 34 (11.6%) | 10 (2.1%) |
| 6:30 AM to 6:59 AM | 46 (15.7%) | 24 (5.1%) |
| 7:00 AM to 7:29 AM | 10 (3.4%) | 68 (14.4%) |
| 7:30 AM to 7:59 AM | 69 (23.5%) | 71 (15.1%) |
| 8:00 AM to 8:29 AM | 10 (3.4%) | 40 (8.5%) |
| 8:30 AM to 8:59 AM | 0 (0.0%) | 16 (3.4%) |
| 9:00 AM to 9:59 AM | 14 (4.8%) | 13 (2.8%) |
| 10:00 AM to 10:59 AM | 0 (0.0%) | 22 (4.7%) |
| 11:00 AM to 11:59 AM | 9 (3.1%) | 3 (0.6%) |
| 12:00 PM to 3:59 PM | 21 (7.2%) | 24 (5.1%) |
| 4:00 PM to 11:59 PM | 32 (10.9%) | 53 (11.3%) |
| Total | 293 (100.0%) | 471 (100.0%) |
Housing Occupancy in Duenweg
Occupancy by Ownership in Duenweg
Of the total 537 dwellings in Duenweg, owner-occupied units account for 297 (55.3%), while renter-occupied units make up 240 (44.7%).
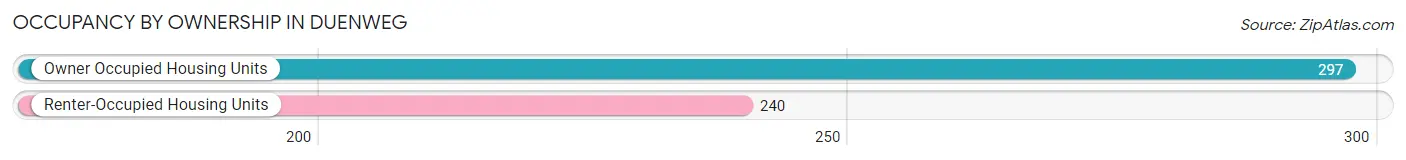
| Occupancy | # Housing Units | % Housing Units |
| Owner Occupied Housing Units | 297 | 55.3% |
| Renter-Occupied Housing Units | 240 | 44.7% |
| Total Occupied Housing Units | 537 | 100.0% |
Occupancy by Household Size in Duenweg
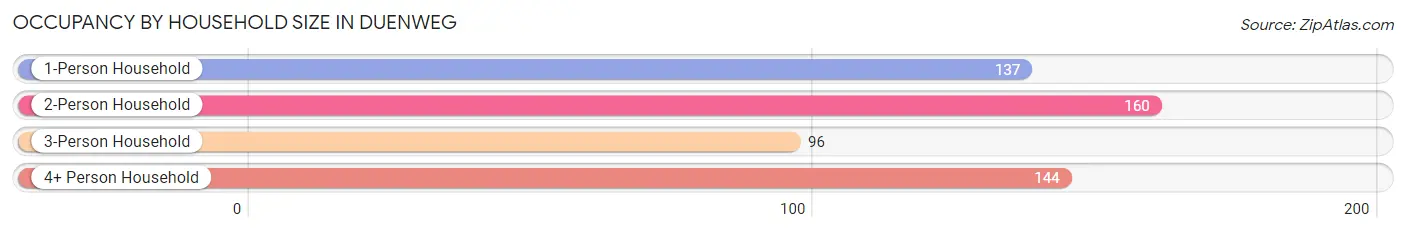
| Household Size | # Housing Units | % Housing Units |
| 1-Person Household | 137 | 25.5% |
| 2-Person Household | 160 | 29.8% |
| 3-Person Household | 96 | 17.9% |
| 4+ Person Household | 144 | 26.8% |
| Total Housing Units | 537 | 100.0% |
Occupancy by Ownership by Household Size in Duenweg
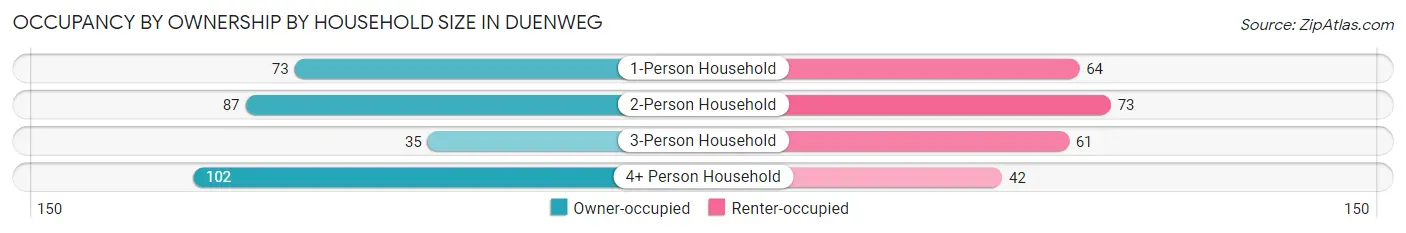
| Household Size | Owner-occupied | Renter-occupied |
| 1-Person Household | 73 (53.3%) | 64 (46.7%) |
| 2-Person Household | 87 (54.4%) | 73 (45.6%) |
| 3-Person Household | 35 (36.5%) | 61 (63.5%) |
| 4+ Person Household | 102 (70.8%) | 42 (29.2%) |
| Total Housing Units | 297 (55.3%) | 240 (44.7%) |
Occupancy by Educational Attainment in Duenweg
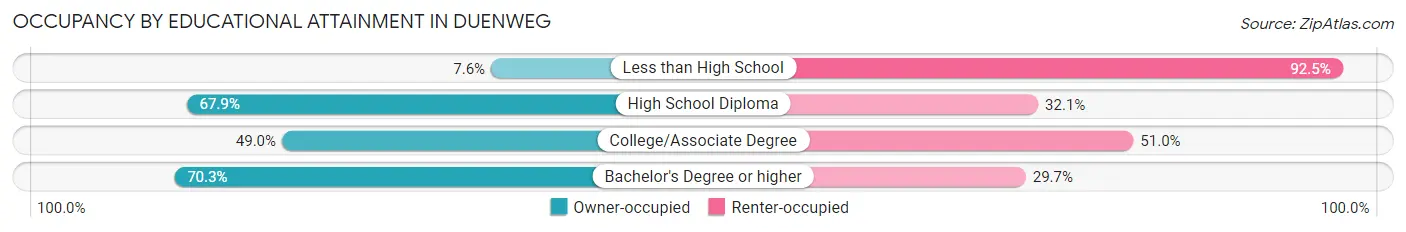
| Household Size | Owner-occupied | Renter-occupied |
| Less than High School | 4 (7.5%) | 49 (92.4%) |
| High School Diploma | 131 (67.9%) | 62 (32.1%) |
| College/Associate Degree | 98 (49.0%) | 102 (51.0%) |
| Bachelor's Degree or higher | 64 (70.3%) | 27 (29.7%) |
Occupancy by Age of Householder in Duenweg
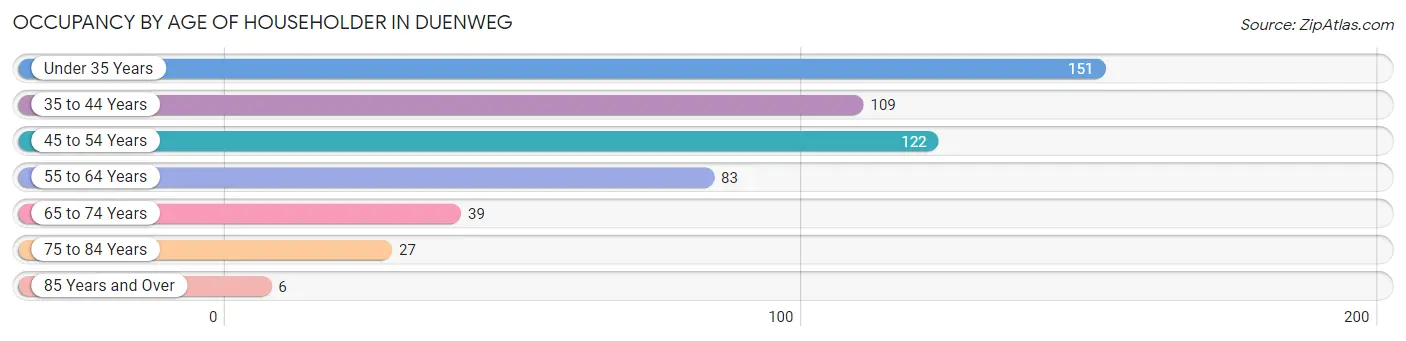
| Age Bracket | # Households | % Households |
| Under 35 Years | 151 | 28.1% |
| 35 to 44 Years | 109 | 20.3% |
| 45 to 54 Years | 122 | 22.7% |
| 55 to 64 Years | 83 | 15.5% |
| 65 to 74 Years | 39 | 7.3% |
| 75 to 84 Years | 27 | 5.0% |
| 85 Years and Over | 6 | 1.1% |
| Total | 537 | 100.0% |
Housing Finances in Duenweg
Median Income by Occupancy in Duenweg
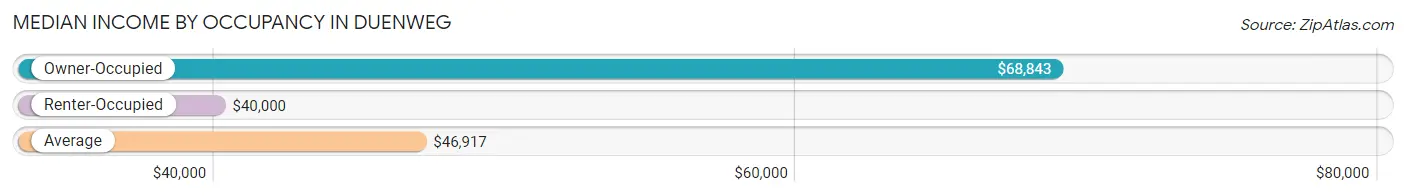
| Occupancy Type | # Households | Median Income |
| Owner-Occupied | 297 (55.3%) | $68,843 |
| Renter-Occupied | 240 (44.7%) | $40,000 |
| Average | 537 (100.0%) | $46,917 |
Occupancy by Householder Income Bracket in Duenweg
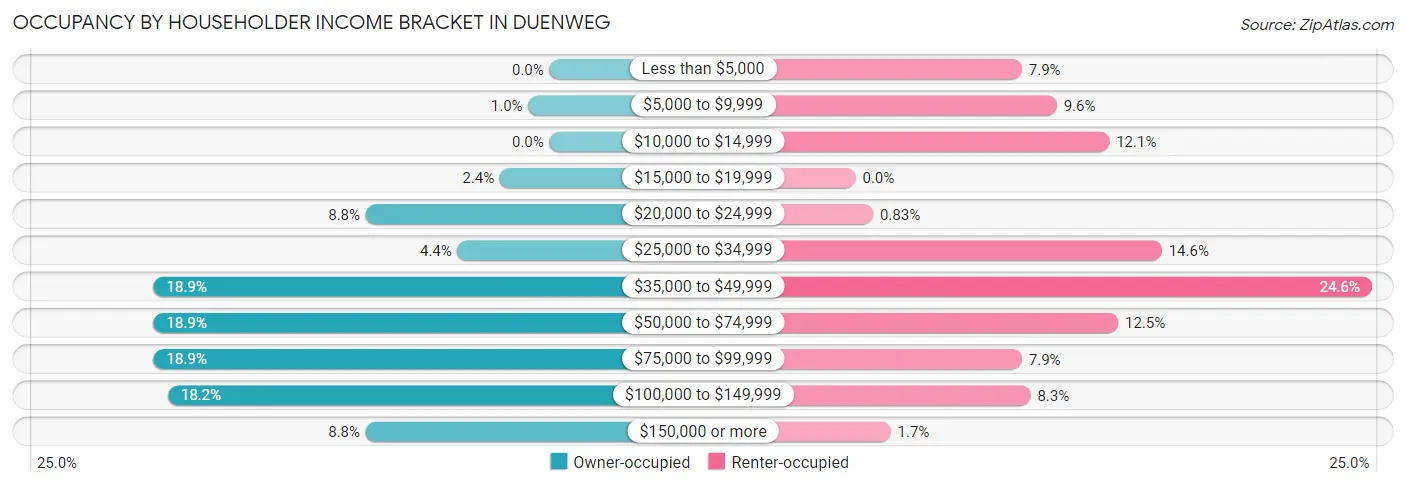
| Income Bracket | Owner-occupied | Renter-occupied |
| Less than $5,000 | 0 (0.0%) | 19 (7.9%) |
| $5,000 to $9,999 | 3 (1.0%) | 23 (9.6%) |
| $10,000 to $14,999 | 0 (0.0%) | 29 (12.1%) |
| $15,000 to $19,999 | 7 (2.4%) | 0 (0.0%) |
| $20,000 to $24,999 | 26 (8.7%) | 2 (0.8%) |
| $25,000 to $34,999 | 13 (4.4%) | 35 (14.6%) |
| $35,000 to $49,999 | 56 (18.9%) | 59 (24.6%) |
| $50,000 to $74,999 | 56 (18.9%) | 30 (12.5%) |
| $75,000 to $99,999 | 56 (18.9%) | 19 (7.9%) |
| $100,000 to $149,999 | 54 (18.2%) | 20 (8.3%) |
| $150,000 or more | 26 (8.7%) | 4 (1.7%) |
| Total | 297 (100.0%) | 240 (100.0%) |
Monthly Housing Cost Tiers in Duenweg
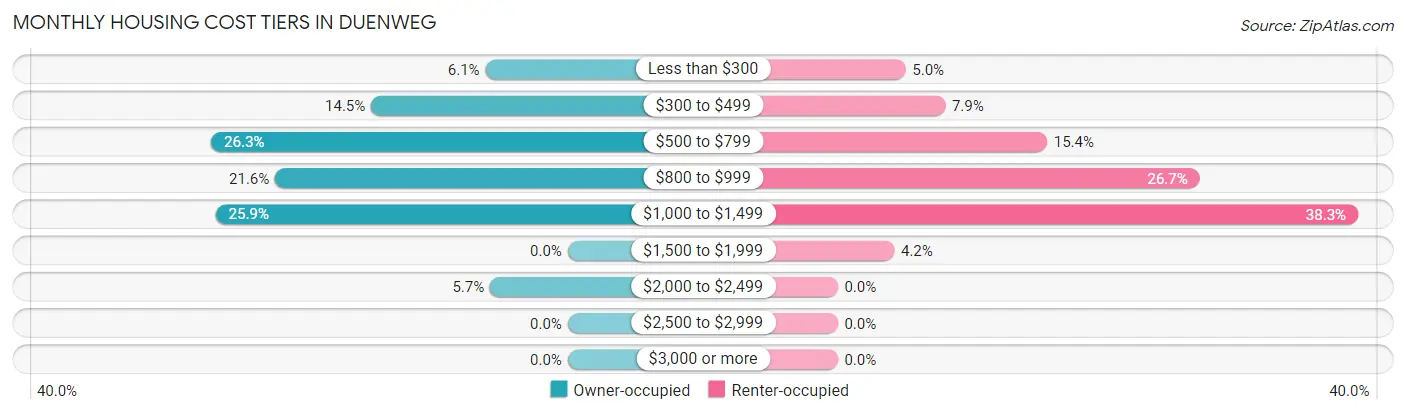
| Monthly Cost | Owner-occupied | Renter-occupied |
| Less than $300 | 18 (6.1%) | 12 (5.0%) |
| $300 to $499 | 43 (14.5%) | 19 (7.9%) |
| $500 to $799 | 78 (26.3%) | 37 (15.4%) |
| $800 to $999 | 64 (21.5%) | 64 (26.7%) |
| $1,000 to $1,499 | 77 (25.9%) | 92 (38.3%) |
| $1,500 to $1,999 | 0 (0.0%) | 10 (4.2%) |
| $2,000 to $2,499 | 17 (5.7%) | 0 (0.0%) |
| $2,500 to $2,999 | 0 (0.0%) | 0 (0.0%) |
| $3,000 or more | 0 (0.0%) | 0 (0.0%) |
| Total | 297 (100.0%) | 240 (100.0%) |
Physical Housing Characteristics in Duenweg
Housing Structures in Duenweg
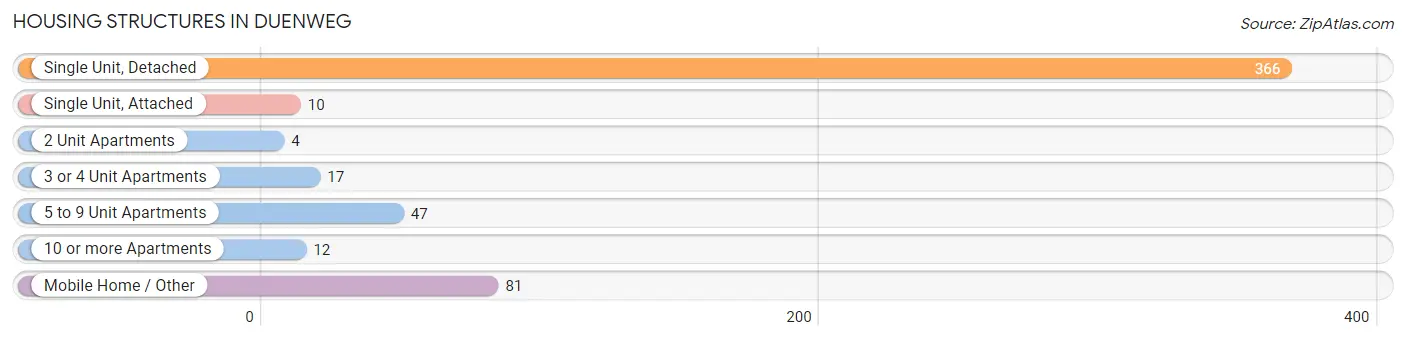
| Structure Type | # Housing Units | % Housing Units |
| Single Unit, Detached | 366 | 68.2% |
| Single Unit, Attached | 10 | 1.9% |
| 2 Unit Apartments | 4 | 0.7% |
| 3 or 4 Unit Apartments | 17 | 3.2% |
| 5 to 9 Unit Apartments | 47 | 8.7% |
| 10 or more Apartments | 12 | 2.2% |
| Mobile Home / Other | 81 | 15.1% |
| Total | 537 | 100.0% |
Housing Structures by Occupancy in Duenweg
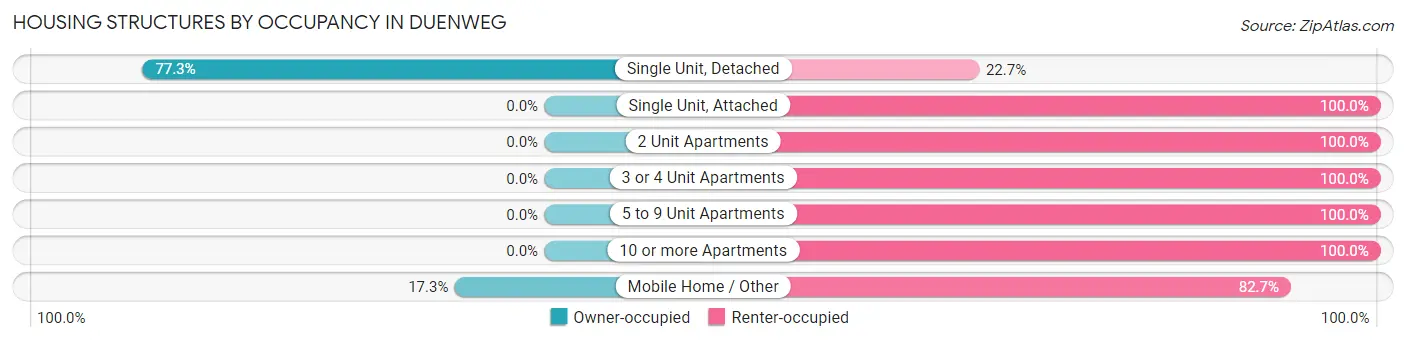
| Structure Type | Owner-occupied | Renter-occupied |
| Single Unit, Detached | 283 (77.3%) | 83 (22.7%) |
| Single Unit, Attached | 0 (0.0%) | 10 (100.0%) |
| 2 Unit Apartments | 0 (0.0%) | 4 (100.0%) |
| 3 or 4 Unit Apartments | 0 (0.0%) | 17 (100.0%) |
| 5 to 9 Unit Apartments | 0 (0.0%) | 47 (100.0%) |
| 10 or more Apartments | 0 (0.0%) | 12 (100.0%) |
| Mobile Home / Other | 14 (17.3%) | 67 (82.7%) |
| Total | 297 (55.3%) | 240 (44.7%) |
Housing Structures by Number of Rooms in Duenweg
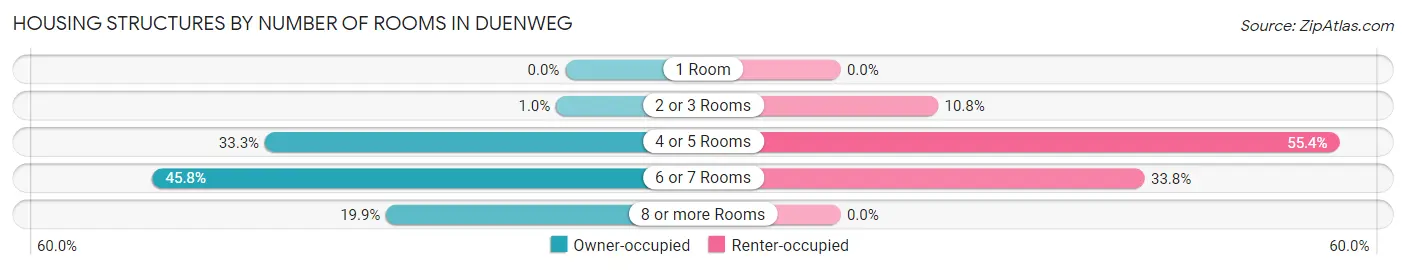
| Number of Rooms | Owner-occupied | Renter-occupied |
| 1 Room | 0 (0.0%) | 0 (0.0%) |
| 2 or 3 Rooms | 3 (1.0%) | 26 (10.8%) |
| 4 or 5 Rooms | 99 (33.3%) | 133 (55.4%) |
| 6 or 7 Rooms | 136 (45.8%) | 81 (33.8%) |
| 8 or more Rooms | 59 (19.9%) | 0 (0.0%) |
| Total | 297 (100.0%) | 240 (100.0%) |
Housing Structure by Heating Type in Duenweg
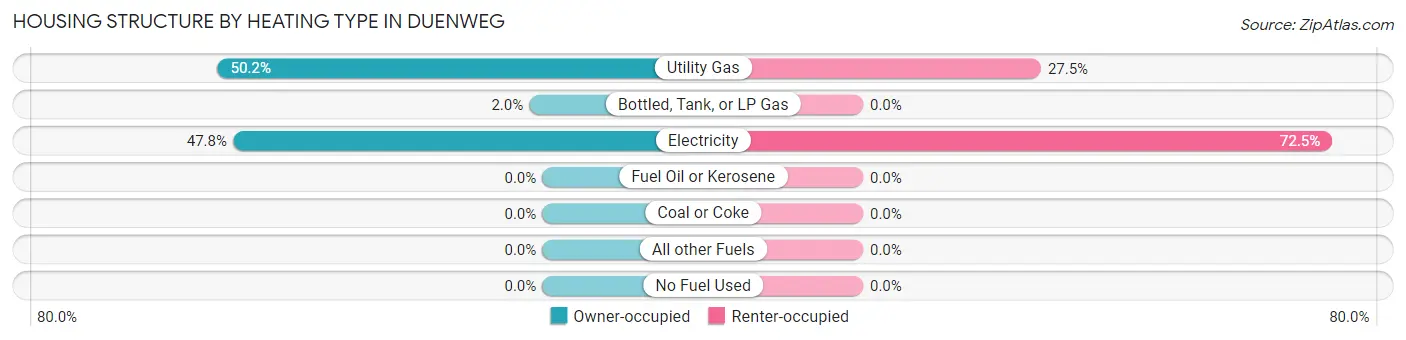
| Heating Type | Owner-occupied | Renter-occupied |
| Utility Gas | 149 (50.2%) | 66 (27.5%) |
| Bottled, Tank, or LP Gas | 6 (2.0%) | 0 (0.0%) |
| Electricity | 142 (47.8%) | 174 (72.5%) |
| Fuel Oil or Kerosene | 0 (0.0%) | 0 (0.0%) |
| Coal or Coke | 0 (0.0%) | 0 (0.0%) |
| All other Fuels | 0 (0.0%) | 0 (0.0%) |
| No Fuel Used | 0 (0.0%) | 0 (0.0%) |
| Total | 297 (100.0%) | 240 (100.0%) |
Household Vehicle Usage in Duenweg
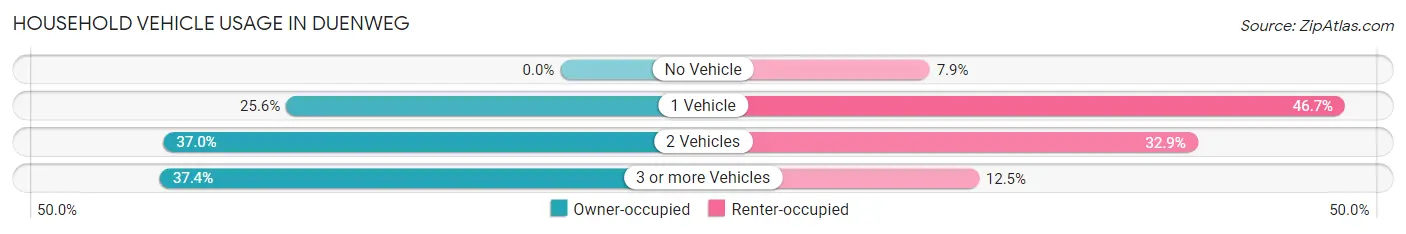
| Vehicles per Household | Owner-occupied | Renter-occupied |
| No Vehicle | 0 (0.0%) | 19 (7.9%) |
| 1 Vehicle | 76 (25.6%) | 112 (46.7%) |
| 2 Vehicles | 110 (37.0%) | 79 (32.9%) |
| 3 or more Vehicles | 111 (37.4%) | 30 (12.5%) |
| Total | 297 (100.0%) | 240 (100.0%) |
Real Estate & Mortgages in Duenweg
Real Estate and Mortgage Overview in Duenweg
| Characteristic | Without Mortgage | With Mortgage |
| Housing Units | 98 | 199 |
| Median Property Value | $99,000 | $100,400 |
| Median Household Income | $51,071 | $19 |
| Monthly Housing Costs | $443 | $0 |
| Real Estate Taxes | $770 | $0 |
Property Value by Mortgage Status in Duenweg
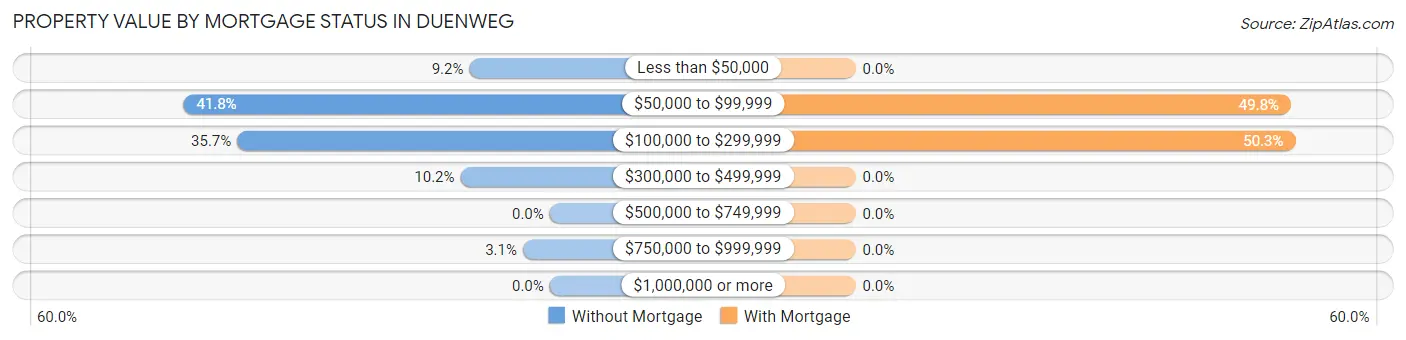
| Property Value | Without Mortgage | With Mortgage |
| Less than $50,000 | 9 (9.2%) | 0 (0.0%) |
| $50,000 to $99,999 | 41 (41.8%) | 99 (49.7%) |
| $100,000 to $299,999 | 35 (35.7%) | 100 (50.2%) |
| $300,000 to $499,999 | 10 (10.2%) | 0 (0.0%) |
| $500,000 to $749,999 | 0 (0.0%) | 0 (0.0%) |
| $750,000 to $999,999 | 3 (3.1%) | 0 (0.0%) |
| $1,000,000 or more | 0 (0.0%) | 0 (0.0%) |
| Total | 98 (100.0%) | 199 (100.0%) |
Household Income by Mortgage Status in Duenweg
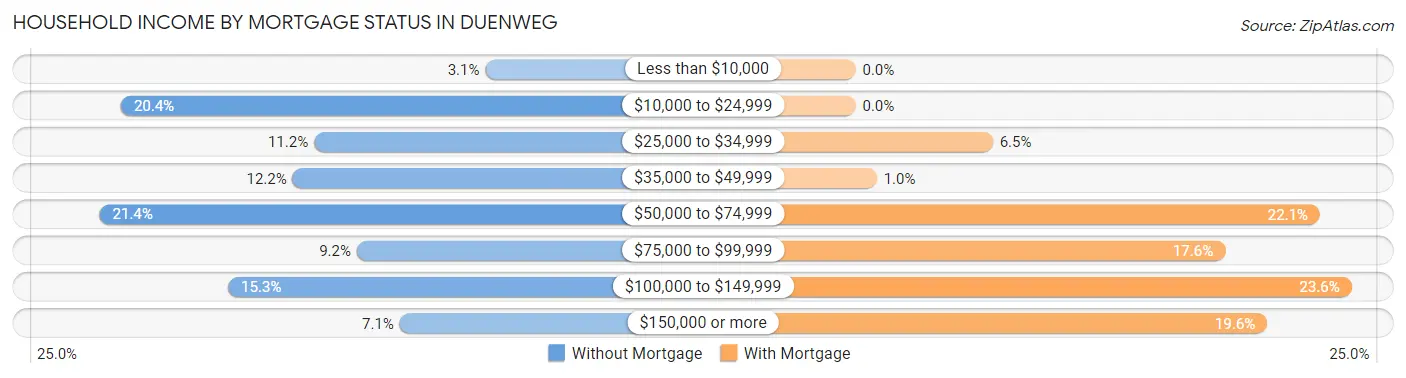
| Household Income | Without Mortgage | With Mortgage |
| Less than $10,000 | 3 (3.1%) | 0 (0.0%) |
| $10,000 to $24,999 | 20 (20.4%) | 0 (0.0%) |
| $25,000 to $34,999 | 11 (11.2%) | 13 (6.5%) |
| $35,000 to $49,999 | 12 (12.2%) | 2 (1.0%) |
| $50,000 to $74,999 | 21 (21.4%) | 44 (22.1%) |
| $75,000 to $99,999 | 9 (9.2%) | 35 (17.6%) |
| $100,000 to $149,999 | 15 (15.3%) | 47 (23.6%) |
| $150,000 or more | 7 (7.1%) | 39 (19.6%) |
| Total | 98 (100.0%) | 199 (100.0%) |
Property Value to Household Income Ratio in Duenweg
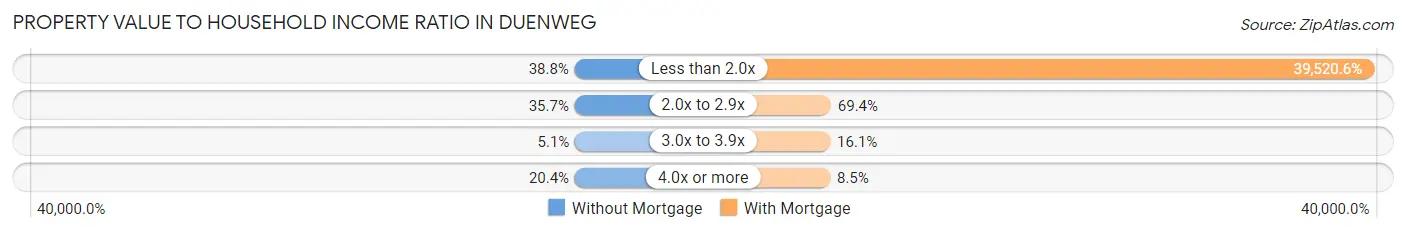
| Value-to-Income Ratio | Without Mortgage | With Mortgage |
| Less than 2.0x | 38 (38.8%) | 78,646 (39,520.6%) |
| 2.0x to 2.9x | 35 (35.7%) | 138 (69.4%) |
| 3.0x to 3.9x | 5 (5.1%) | 32 (16.1%) |
| 4.0x or more | 20 (20.4%) | 17 (8.5%) |
| Total | 98 (100.0%) | 199 (100.0%) |
Real Estate Taxes by Mortgage Status in Duenweg
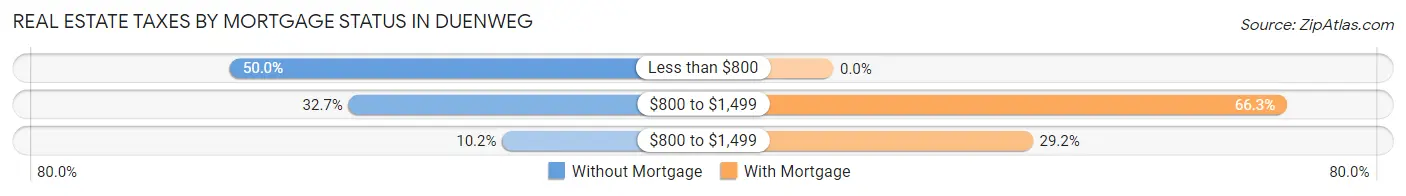
| Property Taxes | Without Mortgage | With Mortgage |
| Less than $800 | 49 (50.0%) | 0 (0.0%) |
| $800 to $1,499 | 32 (32.7%) | 132 (66.3%) |
| $800 to $1,499 | 10 (10.2%) | 58 (29.1%) |
| Total | 98 (100.0%) | 199 (100.0%) |
Health & Disability in Duenweg
Health Insurance Coverage by Age in Duenweg
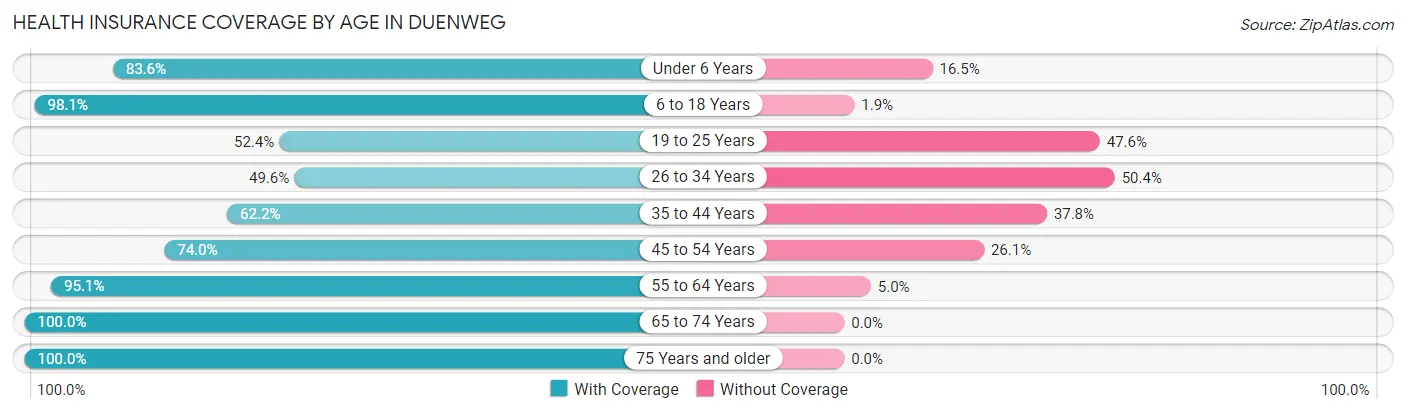
| Age Bracket | With Coverage | Without Coverage |
| Under 6 Years | 193 (83.6%) | 38 (16.5%) |
| 6 to 18 Years | 261 (98.1%) | 5 (1.9%) |
| 19 to 25 Years | 100 (52.4%) | 91 (47.6%) |
| 26 to 34 Years | 115 (49.6%) | 117 (50.4%) |
| 35 to 44 Years | 140 (62.2%) | 85 (37.8%) |
| 45 to 54 Years | 159 (74.0%) | 56 (26.1%) |
| 55 to 64 Years | 96 (95.1%) | 5 (5.0%) |
| 65 to 74 Years | 72 (100.0%) | 0 (0.0%) |
| 75 Years and older | 71 (100.0%) | 0 (0.0%) |
| Total | 1,207 (75.2%) | 397 (24.7%) |
Health Insurance Coverage by Citizenship Status in Duenweg
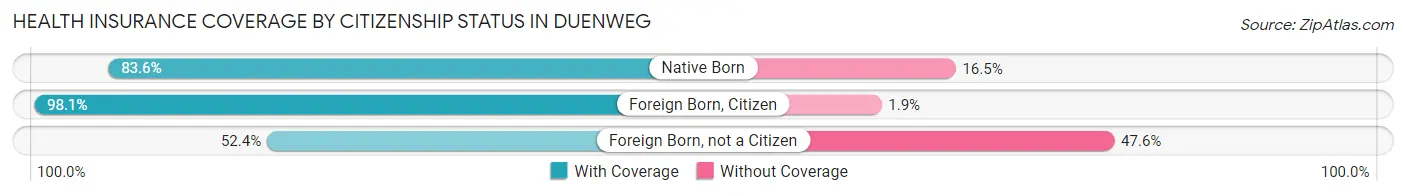
| Citizenship Status | With Coverage | Without Coverage |
| Native Born | 193 (83.6%) | 38 (16.5%) |
| Foreign Born, Citizen | 261 (98.1%) | 5 (1.9%) |
| Foreign Born, not a Citizen | 100 (52.4%) | 91 (47.6%) |
Health Insurance Coverage by Household Income in Duenweg
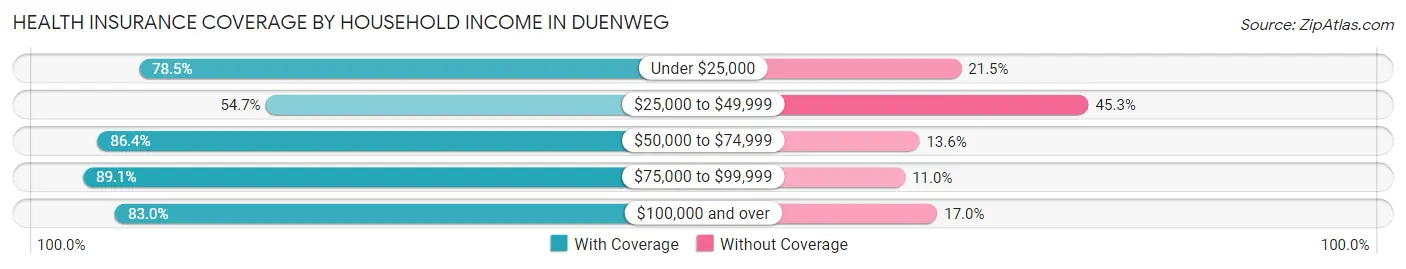
| Household Income | With Coverage | Without Coverage |
| Under $25,000 | 161 (78.5%) | 44 (21.5%) |
| $25,000 to $49,999 | 274 (54.7%) | 227 (45.3%) |
| $50,000 to $74,999 | 241 (86.4%) | 38 (13.6%) |
| $75,000 to $99,999 | 252 (89.0%) | 31 (11.0%) |
| $100,000 and over | 279 (83.0%) | 57 (17.0%) |
Public vs Private Health Insurance Coverage by Age in Duenweg
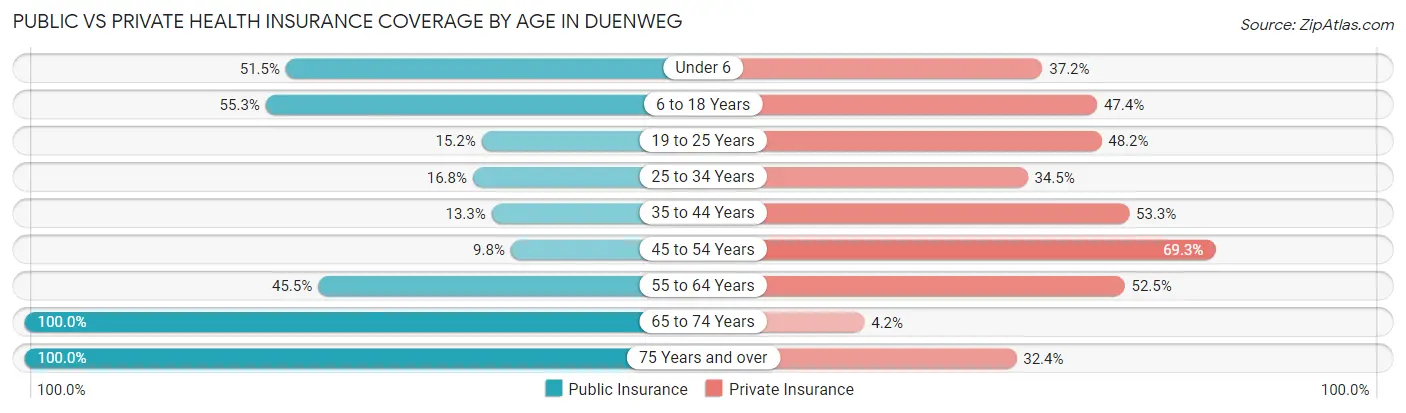
| Age Bracket | Public Insurance | Private Insurance |
| Under 6 | 119 (51.5%) | 86 (37.2%) |
| 6 to 18 Years | 147 (55.3%) | 126 (47.4%) |
| 19 to 25 Years | 29 (15.2%) | 92 (48.2%) |
| 25 to 34 Years | 39 (16.8%) | 80 (34.5%) |
| 35 to 44 Years | 30 (13.3%) | 120 (53.3%) |
| 45 to 54 Years | 21 (9.8%) | 149 (69.3%) |
| 55 to 64 Years | 46 (45.5%) | 53 (52.5%) |
| 65 to 74 Years | 72 (100.0%) | 3 (4.2%) |
| 75 Years and over | 71 (100.0%) | 23 (32.4%) |
| Total | 574 (35.8%) | 732 (45.6%) |
Disability Status by Sex by Age in Duenweg
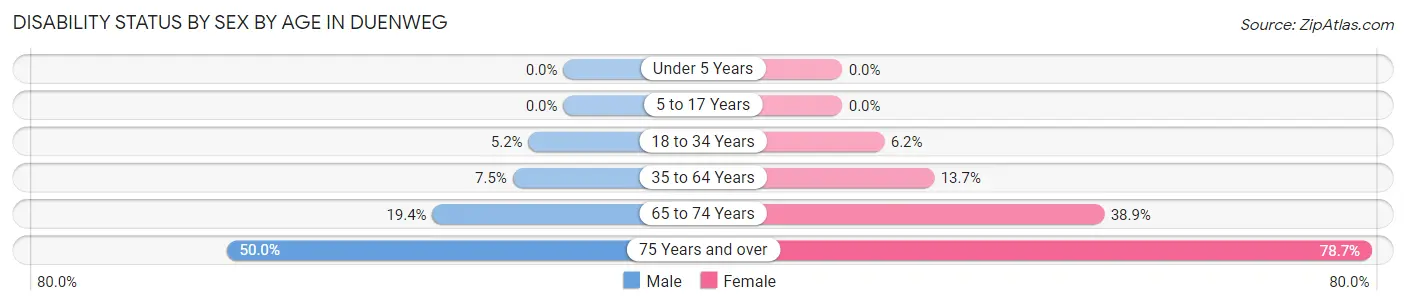
| Age Bracket | Male | Female |
| Under 5 Years | 0 (0.0%) | 0 (0.0%) |
| 5 to 17 Years | 0 (0.0%) | 0 (0.0%) |
| 18 to 34 Years | 8 (5.2%) | 18 (6.2%) |
| 35 to 64 Years | 17 (7.5%) | 43 (13.7%) |
| 65 to 74 Years | 7 (19.4%) | 14 (38.9%) |
| 75 Years and over | 12 (50.0%) | 37 (78.7%) |
Disability Class by Sex by Age in Duenweg
Disability Class: Hearing Difficulty
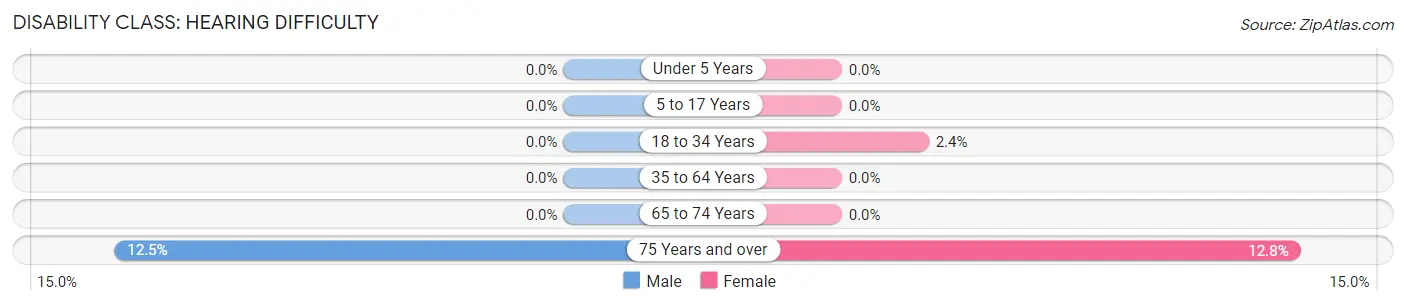
| Age Bracket | Male | Female |
| Under 5 Years | 0 (0.0%) | 0 (0.0%) |
| 5 to 17 Years | 0 (0.0%) | 0 (0.0%) |
| 18 to 34 Years | 0 (0.0%) | 7 (2.4%) |
| 35 to 64 Years | 0 (0.0%) | 0 (0.0%) |
| 65 to 74 Years | 0 (0.0%) | 0 (0.0%) |
| 75 Years and over | 3 (12.5%) | 6 (12.8%) |
Disability Class: Vision Difficulty
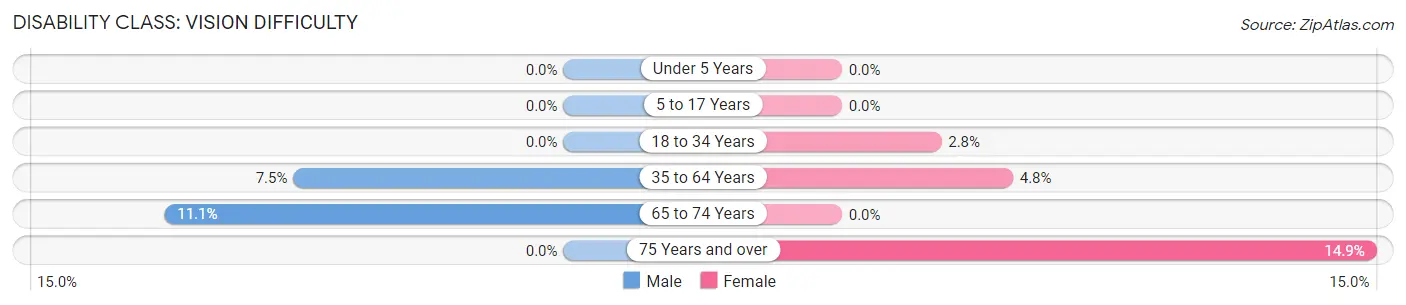
| Age Bracket | Male | Female |
| Under 5 Years | 0 (0.0%) | 0 (0.0%) |
| 5 to 17 Years | 0 (0.0%) | 0 (0.0%) |
| 18 to 34 Years | 0 (0.0%) | 8 (2.8%) |
| 35 to 64 Years | 17 (7.5%) | 15 (4.8%) |
| 65 to 74 Years | 4 (11.1%) | 0 (0.0%) |
| 75 Years and over | 0 (0.0%) | 7 (14.9%) |
Disability Class: Cognitive Difficulty
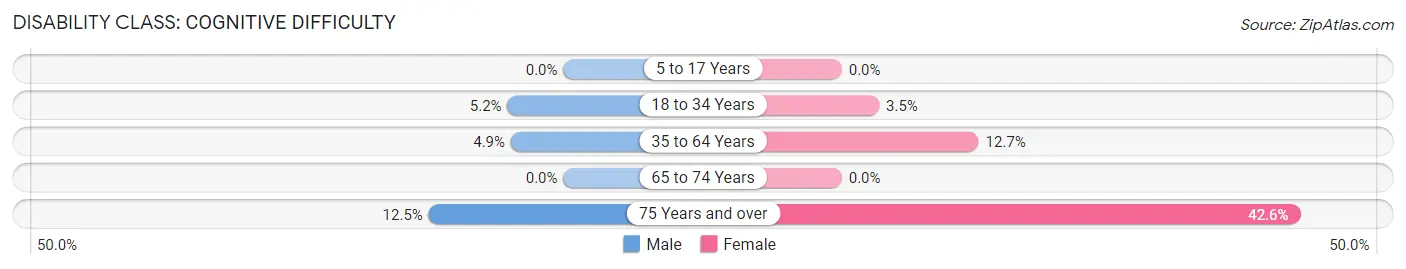
| Age Bracket | Male | Female |
| 5 to 17 Years | 0 (0.0%) | 0 (0.0%) |
| 18 to 34 Years | 8 (5.2%) | 10 (3.5%) |
| 35 to 64 Years | 11 (4.9%) | 40 (12.7%) |
| 65 to 74 Years | 0 (0.0%) | 0 (0.0%) |
| 75 Years and over | 3 (12.5%) | 20 (42.5%) |
Disability Class: Ambulatory Difficulty
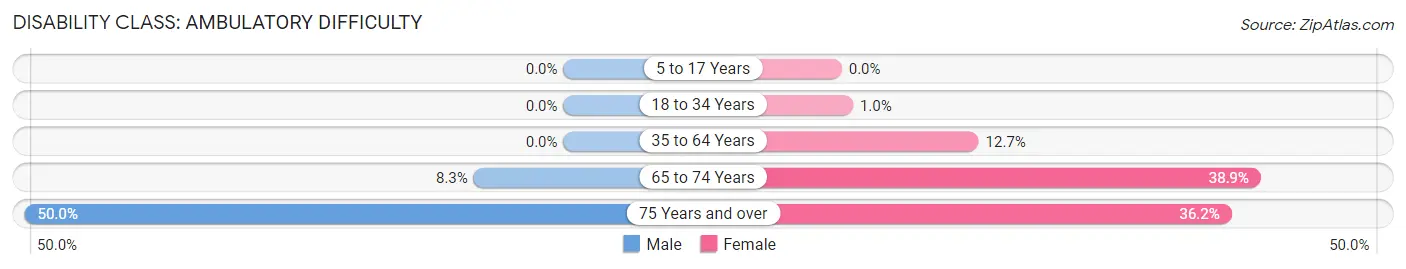
| Age Bracket | Male | Female |
| 5 to 17 Years | 0 (0.0%) | 0 (0.0%) |
| 18 to 34 Years | 0 (0.0%) | 3 (1.0%) |
| 35 to 64 Years | 0 (0.0%) | 40 (12.7%) |
| 65 to 74 Years | 3 (8.3%) | 14 (38.9%) |
| 75 Years and over | 12 (50.0%) | 17 (36.2%) |
Disability Class: Self-Care Difficulty
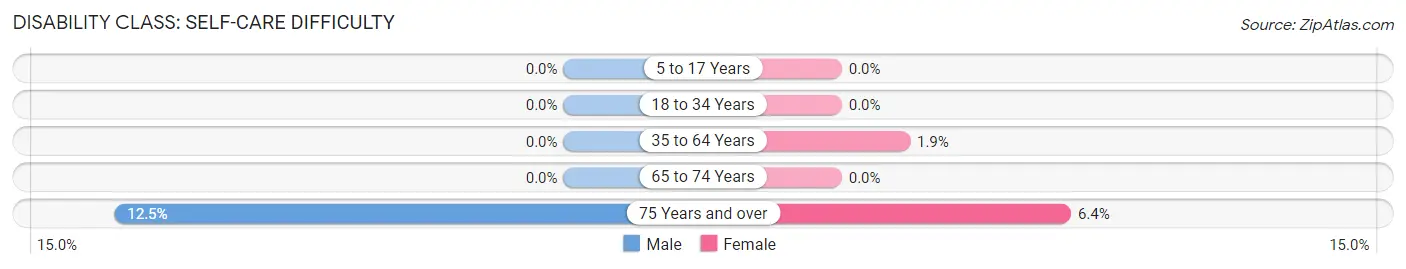
| Age Bracket | Male | Female |
| 5 to 17 Years | 0 (0.0%) | 0 (0.0%) |
| 18 to 34 Years | 0 (0.0%) | 0 (0.0%) |
| 35 to 64 Years | 0 (0.0%) | 6 (1.9%) |
| 65 to 74 Years | 0 (0.0%) | 0 (0.0%) |
| 75 Years and over | 3 (12.5%) | 3 (6.4%) |
Technology Access in Duenweg
Computing Device Access in Duenweg
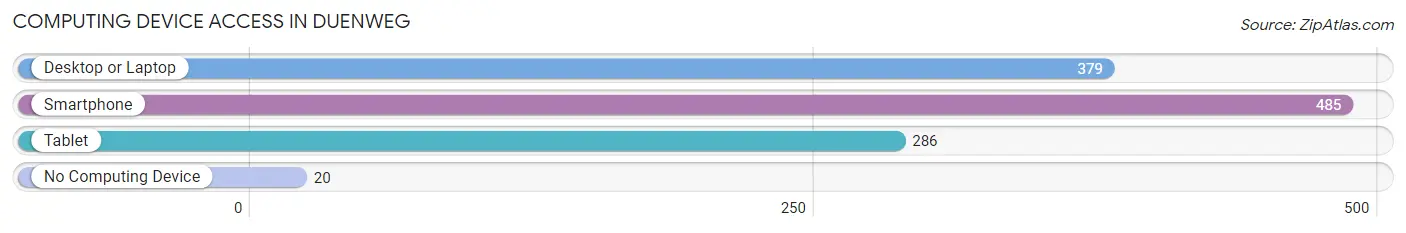
| Device Type | # Households | % Households |
| Desktop or Laptop | 379 | 70.6% |
| Smartphone | 485 | 90.3% |
| Tablet | 286 | 53.3% |
| No Computing Device | 20 | 3.7% |
| Total | 537 | 100.0% |
Internet Access in Duenweg
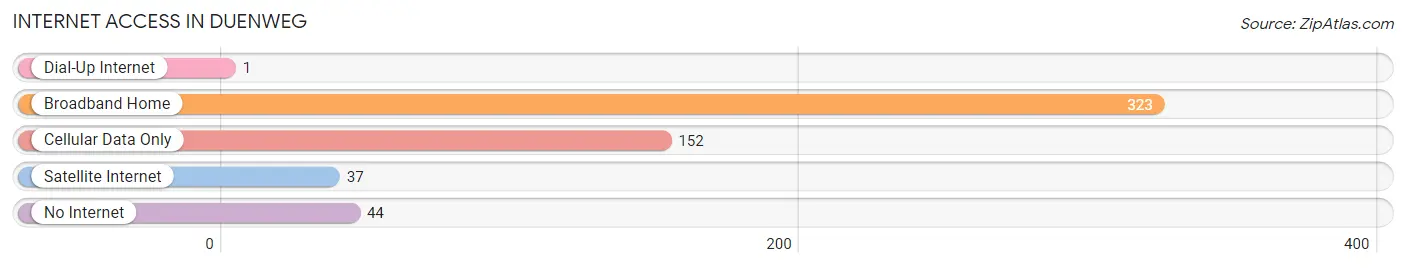
| Internet Type | # Households | % Households |
| Dial-Up Internet | 1 | 0.2% |
| Broadband Home | 323 | 60.2% |
| Cellular Data Only | 152 | 28.3% |
| Satellite Internet | 37 | 6.9% |
| No Internet | 44 | 8.2% |
| Total | 537 | 100.0% |
Duenweg Summary
Duenweg is a small city located in Jasper County, Missouri. It is situated in the southwestern corner of the state, just north of the Arkansas border. The city has a population of 1,845 people, according to the 2010 census.
History
Duenweg was founded in 1883 by German immigrants who had settled in the area. The city was named after a German immigrant, John Duenweg, who had purchased the land from the local Native American tribes. The city was incorporated in 1887 and was the first city in Jasper County to be incorporated.
The city was originally a farming community, but in the early 1900s, the city began to develop into an industrial center. The city was home to several factories, including a brick factory, a flour mill, and a sawmill. The city also had a railroad line that connected it to other cities in the area.
In the 1950s, the city began to decline as the factories closed and the railroad line was abandoned. The city was also affected by the Great Depression and World War II. In the 1960s, the city began to experience a resurgence as new businesses moved into the area.
Geography
Duenweg is located in the southwestern corner of Missouri, just north of the Arkansas border. The city is situated in the Ozark Mountains and is surrounded by rolling hills and forests. The city is located near the James River, which flows through the city.
The city has a total area of 1.2 square miles, all of which is land. The city has a humid subtropical climate, with hot, humid summers and mild winters.
Economy
Duenweg is a small city with a limited economy. The city is home to several small businesses, including a grocery store, a hardware store, and a few restaurants. The city also has a few manufacturing companies, including a furniture factory and a metal fabrication plant.
The city is also home to a few tourist attractions, including a historic museum and a nature center. The city is also home to a few parks, including a city park and a state park.
Demographics
According to the 2010 census, the population of Duenweg was 1,845 people. The city has a population density of 1,521 people per square mile. The median age of the city is 38.7 years, and the median household income is $35,945.
The city is predominantly white, with 87.3% of the population identifying as white. The city also has a small African American population, with 8.2% of the population identifying as African American. The city also has a small Hispanic population, with 2.2% of the population identifying as Hispanic or Latino.
Conclusion
Duenweg is a small city located in Jasper County, Missouri. The city was founded in 1883 by German immigrants and was originally a farming community. In the early 1900s, the city began to develop into an industrial center, but in the 1950s, the city began to decline. In the 1960s, the city began to experience a resurgence as new businesses moved into the area. The city has a population of 1,845 people, according to the 2010 census, and has a limited economy. The city is predominantly white, with 87.3% of the population identifying as white. The city also has a small African American population, with 8.2% of the population identifying as African American, and a small Hispanic population, with 2.2% of the population identifying as Hispanic or Latino.
Common Questions
What is Per Capita Income in Duenweg?
Per Capita income in Duenweg is $22,218.
What is the Median Family Income in Duenweg?
Median Family Income in Duenweg is $53,750.
What is the Median Household income in Duenweg?
Median Household Income in Duenweg is $46,917.
What is Income or Wage Gap in Duenweg?
Income or Wage Gap in Duenweg is 44.2%.
Women in Duenweg earn 55.8 cents for every dollar earned by a man.
What is Family Income Deficit in Duenweg?
Family Income Deficit in Duenweg is $13,289.
Families that are below poverty line in Duenweg earn $13,289 less on average than the poverty threshold level.
What is Inequality or Gini Index in Duenweg?
Inequality or Gini Index in Duenweg is 0.41.
What is the Total Population of Duenweg?
Total Population of Duenweg is 1,604.
What is the Total Male Population of Duenweg?
Total Male Population of Duenweg is 655.
What is the Total Female Population of Duenweg?
Total Female Population of Duenweg is 949.
What is the Ratio of Males per 100 Females in Duenweg?
There are 69.02 Males per 100 Females in Duenweg.
What is the Ratio of Females per 100 Males in Duenweg?
There are 144.89 Females per 100 Males in Duenweg.
What is the Median Population Age in Duenweg?
Median Population Age in Duenweg is 30.8 Years.
What is the Average Family Size in Duenweg
Average Family Size in Duenweg is 3.6 People.
What is the Average Household Size in Duenweg
Average Household Size in Duenweg is 3.0 People.
How Large is the Labor Force in Duenweg?
There are 852 People in the Labor Forcein in Duenweg.
What is the Percentage of People in the Labor Force in Duenweg?
73.3% of People are in the Labor Force in Duenweg.
What is the Unemployment Rate in Duenweg?
Unemployment Rate in Duenweg is 2.8%.