Crystal City, MO Map & Demographics
Crystal City Map
Crystal City Overview
$31,124
PER CAPITA INCOME
$79,128
AVG FAMILY INCOME
$61,818
AVG HOUSEHOLD INCOME
31.3%
WAGE / INCOME GAP [ % ]
68.7¢/ $1
WAGE / INCOME GAP [ $ ]
0.38
INEQUALITY / GINI INDEX
4,721
TOTAL POPULATION
2,314
MALE POPULATION
2,407
FEMALE POPULATION
96.14
MALES / 100 FEMALES
104.02
FEMALES / 100 MALES
41.2
MEDIAN AGE
3.0
AVG FAMILY SIZE
2.4
AVG HOUSEHOLD SIZE
2,391
LABOR FORCE [ PEOPLE ]
60.7%
PERCENT IN LABOR FORCE
5.3%
UNEMPLOYMENT RATE
Crystal City Zip Codes
Crystal City Area Codes
Income in Crystal City
Income Overview in Crystal City
Per Capita Income in Crystal City is $31,124, while median incomes of families and households are $79,128 and $61,818 respectively.
| Characteristic | Number | Measure |
| Per Capita Income | 4,721 | $31,124 |
| Median Family Income | 1,140 | $79,128 |
| Mean Family Income | 1,140 | $87,745 |
| Median Household Income | 1,890 | $61,818 |
| Mean Household Income | 1,890 | $74,277 |
| Income Deficit | 1,140 | $0 |
| Wage / Income Gap (%) | 4,721 | 31.28% |
| Wage / Income Gap ($) | 4,721 | 68.72¢ per $1 |
| Gini / Inequality Index | 4,721 | 0.38 |
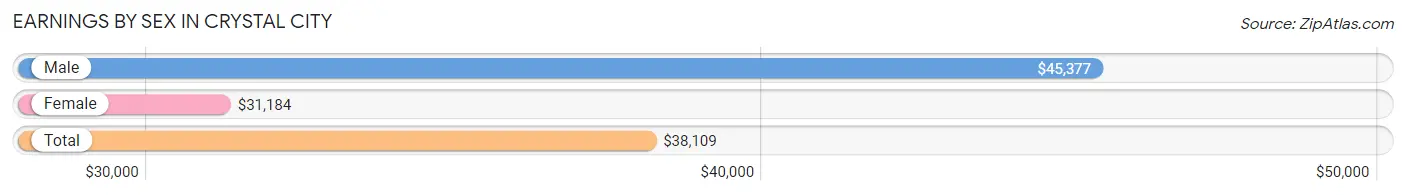
Earnings by Sex in Crystal City
Average Earnings in Crystal City are $38,109, $45,377 for men and $31,184 for women, a difference of 31.3%.
| Sex | Number | Average Earnings |
| Male | 1,198 (48.2%) | $45,377 |
| Female | 1,286 (51.8%) | $31,184 |
| Total | 2,484 (100.0%) | $38,109 |
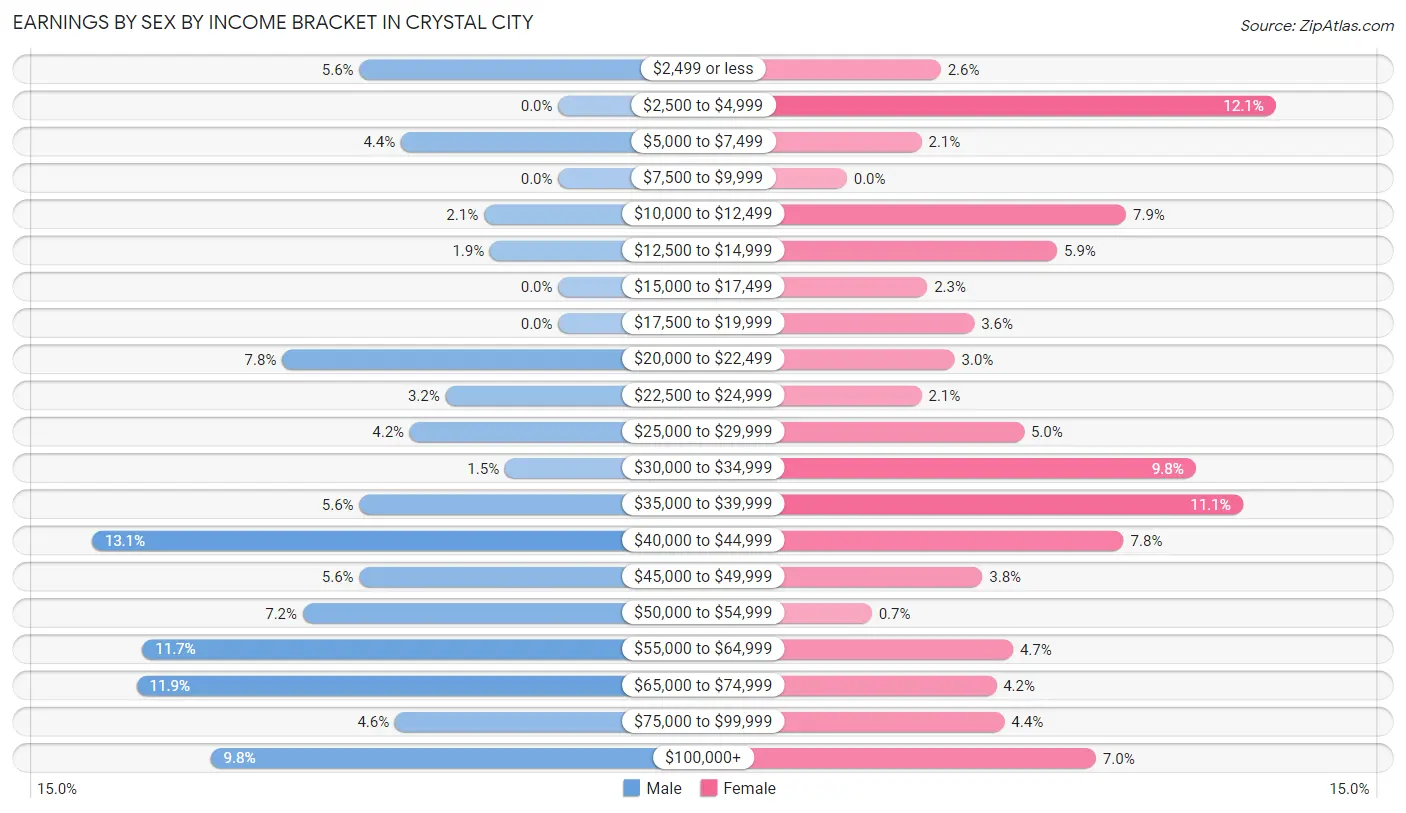
Earnings by Sex by Income Bracket in Crystal City
The most common earnings brackets in Crystal City are $40,000 to $44,999 for men (157 | 13.1%) and $2,500 to $4,999 for women (155 | 12.0%).
| Income | Male | Female |
| $2,499 or less | 67 (5.6%) | 34 (2.6%) |
| $2,500 to $4,999 | 0 (0.0%) | 155 (12.0%) |
| $5,000 to $7,499 | 53 (4.4%) | 27 (2.1%) |
| $7,500 to $9,999 | 0 (0.0%) | 0 (0.0%) |
| $10,000 to $12,499 | 25 (2.1%) | 101 (7.9%) |
| $12,500 to $14,999 | 23 (1.9%) | 76 (5.9%) |
| $15,000 to $17,499 | 0 (0.0%) | 29 (2.3%) |
| $17,500 to $19,999 | 0 (0.0%) | 46 (3.6%) |
| $20,000 to $22,499 | 93 (7.8%) | 39 (3.0%) |
| $22,500 to $24,999 | 38 (3.2%) | 27 (2.1%) |
| $25,000 to $29,999 | 50 (4.2%) | 64 (5.0%) |
| $30,000 to $34,999 | 18 (1.5%) | 126 (9.8%) |
| $35,000 to $39,999 | 67 (5.6%) | 143 (11.1%) |
| $40,000 to $44,999 | 157 (13.1%) | 100 (7.8%) |
| $45,000 to $49,999 | 67 (5.6%) | 49 (3.8%) |
| $50,000 to $54,999 | 86 (7.2%) | 9 (0.7%) |
| $55,000 to $64,999 | 140 (11.7%) | 60 (4.7%) |
| $65,000 to $74,999 | 142 (11.8%) | 54 (4.2%) |
| $75,000 to $99,999 | 55 (4.6%) | 57 (4.4%) |
| $100,000+ | 117 (9.8%) | 90 (7.0%) |
| Total | 1,198 (100.0%) | 1,286 (100.0%) |
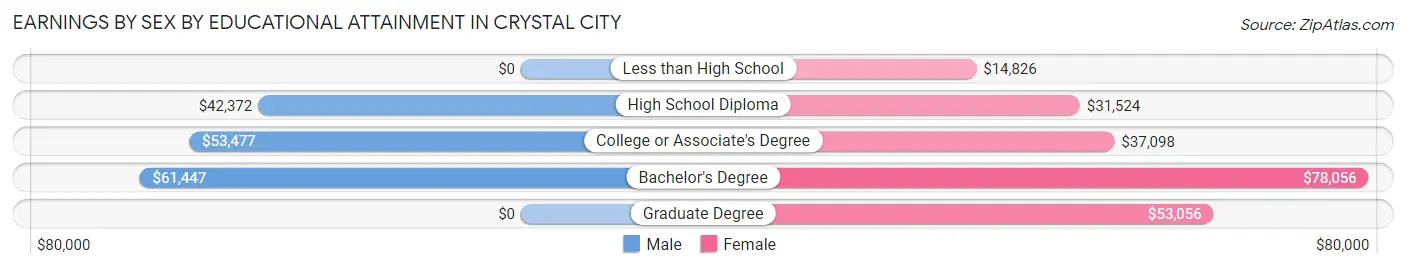
Earnings by Sex by Educational Attainment in Crystal City
Average earnings in Crystal City are $48,304 for men and $36,270 for women, a difference of 24.9%. Men with an educational attainment of bachelor's degree enjoy the highest average annual earnings of $61,447, while those with high school diploma education earn the least with $42,372. Women with an educational attainment of bachelor's degree earn the most with the average annual earnings of $78,056, while those with less than high school education have the smallest earnings of $14,826.
| Educational Attainment | Male Income | Female Income |
| Less than High School | - | - |
| High School Diploma | $42,372 | $31,524 |
| College or Associate's Degree | $53,477 | $37,098 |
| Bachelor's Degree | $61,447 | $78,056 |
| Graduate Degree | - | - |
| Total | $48,304 | $36,270 |
Family Income in Crystal City
Family Income Brackets in Crystal City
According to the Crystal City family income data, there are 280 families falling into the $100,000 to $149,999 income range, which is the most common income bracket and makes up 24.6% of all families. Conversely, the $10,000 to $14,999 income bracket is the least frequent group with only 9 families (0.8%) belonging to this category.
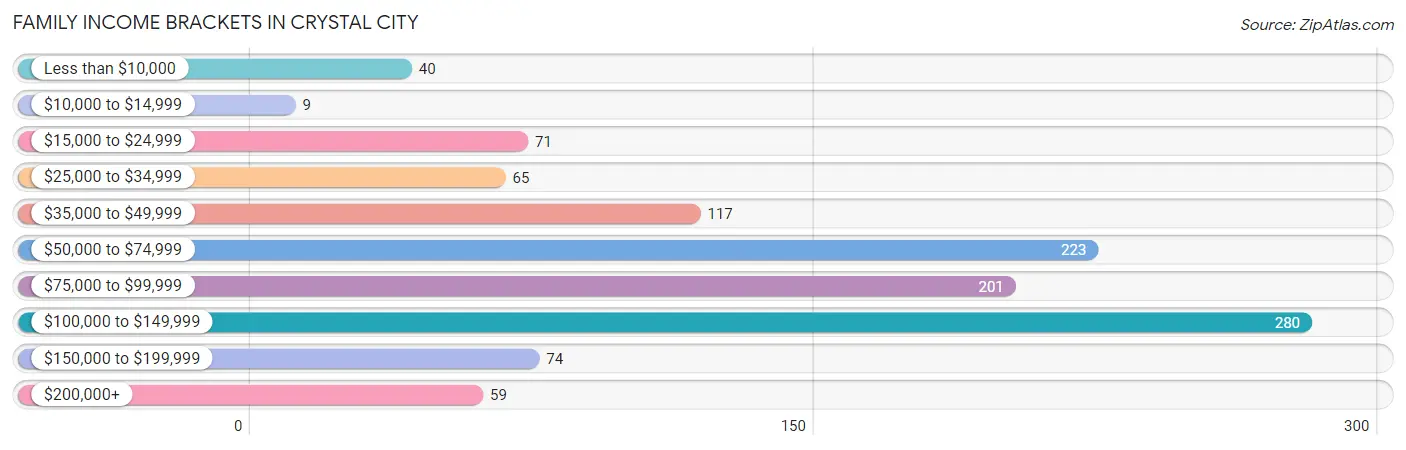
| Income Bracket | # Families | % Families |
| Less than $10,000 | 40 | 3.5% |
| $10,000 to $14,999 | 9 | 0.8% |
| $15,000 to $24,999 | 71 | 6.2% |
| $25,000 to $34,999 | 65 | 5.7% |
| $35,000 to $49,999 | 117 | 10.3% |
| $50,000 to $74,999 | 223 | 19.6% |
| $75,000 to $99,999 | 201 | 17.6% |
| $100,000 to $149,999 | 280 | 24.6% |
| $150,000 to $199,999 | 74 | 6.5% |
| $200,000+ | 59 | 5.2% |
Family Income by Famaliy Size in Crystal City
5-person families (91 | 8.0%) account for the highest median family income in Crystal City with $135,129 per family, while 2-person families (628 | 55.1%) have the highest median income of $31,908 per family member.
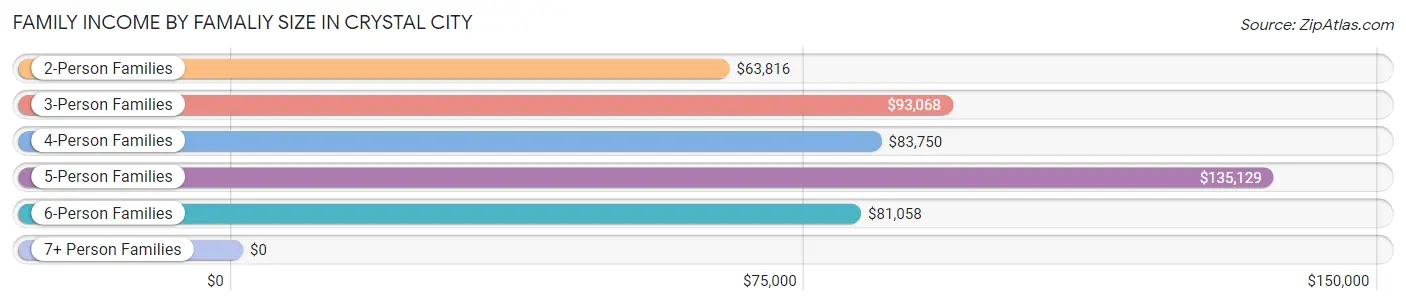
| Income Bracket | # Families | Median Income |
| 2-Person Families | 628 (55.1%) | $63,816 |
| 3-Person Families | 227 (19.9%) | $93,068 |
| 4-Person Families | 134 (11.7%) | $83,750 |
| 5-Person Families | 91 (8.0%) | $135,129 |
| 6-Person Families | 35 (3.1%) | $81,058 |
| 7+ Person Families | 25 (2.2%) | $0 |
| Total | 1,140 (100.0%) | $79,128 |
Family Income by Number of Earners in Crystal City
The median family income in Crystal City is $79,128, with families comprising 3+ earners (85) having the highest median family income of $117,875, while families with no earners (205) have the lowest median family income of $38,875, accounting for 7.5% and 18.0% of families, respectively.
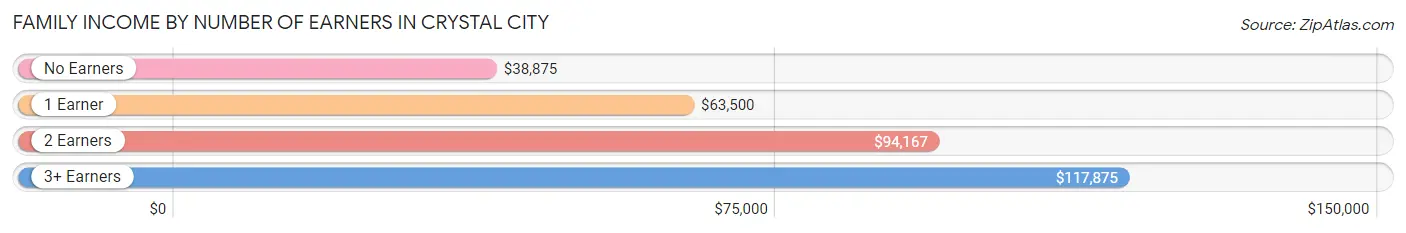
| Number of Earners | # Families | Median Income |
| No Earners | 205 (18.0%) | $38,875 |
| 1 Earner | 380 (33.3%) | $63,500 |
| 2 Earners | 470 (41.2%) | $94,167 |
| 3+ Earners | 85 (7.5%) | $117,875 |
| Total | 1,140 (100.0%) | $79,128 |
Household Income in Crystal City
Household Income Brackets in Crystal City
With 355 households falling in the category, the $35,000 to $49,999 income range is the most frequent in Crystal City, accounting for 18.8% of all households. In contrast, only 47 households (2.5%) fall into the $10,000 to $14,999 income bracket, making it the least populous group.
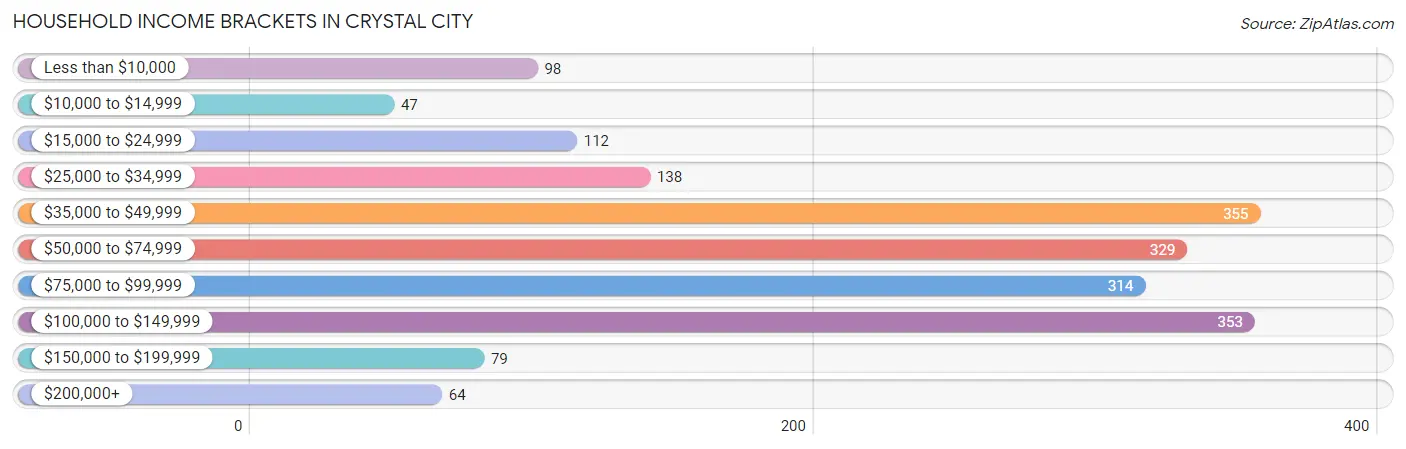
| Income Bracket | # Households | % Households |
| Less than $10,000 | 98 | 5.2% |
| $10,000 to $14,999 | 47 | 2.5% |
| $15,000 to $24,999 | 112 | 5.9% |
| $25,000 to $34,999 | 138 | 7.3% |
| $35,000 to $49,999 | 355 | 18.8% |
| $50,000 to $74,999 | 329 | 17.4% |
| $75,000 to $99,999 | 314 | 16.6% |
| $100,000 to $149,999 | 353 | 18.7% |
| $150,000 to $199,999 | 79 | 4.2% |
| $200,000+ | 64 | 3.4% |
Household Income by Householder Age in Crystal City
The median household income in Crystal City is $61,818, with the highest median household income of $89,250 found in the 25 to 44 years age bracket for the primary householder. A total of 562 households (29.7%) fall into this category. Meanwhile, the 65+ years age bracket for the primary householder has the lowest median household income of $39,952, with 548 households (29.0%) in this group.
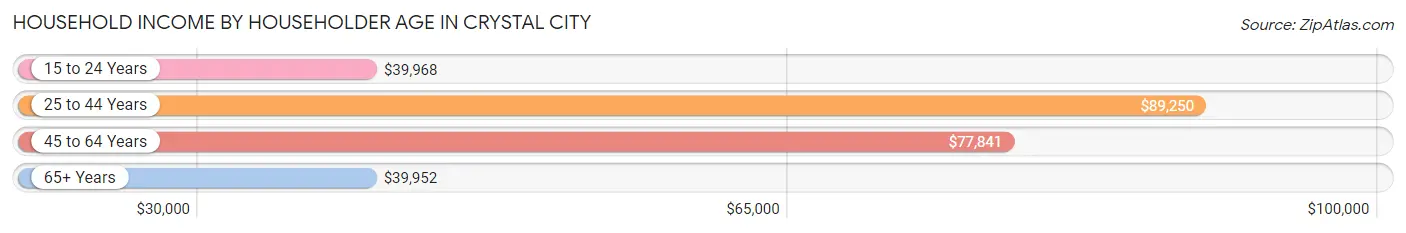
| Income Bracket | # Households | Median Income |
| 15 to 24 Years | 165 (8.7%) | $39,968 |
| 25 to 44 Years | 562 (29.7%) | $89,250 |
| 45 to 64 Years | 615 (32.5%) | $77,841 |
| 65+ Years | 548 (29.0%) | $39,952 |
| Total | 1,890 (100.0%) | $61,818 |
Poverty in Crystal City
Income Below Poverty by Sex and Age in Crystal City
With 14.3% poverty level for males and 13.5% for females among the residents of Crystal City, 15 year old males and 15 year old females are the most vulnerable to poverty, with 38 males (77.5%) and 27 females (50.9%) in their respective age groups living below the poverty level.
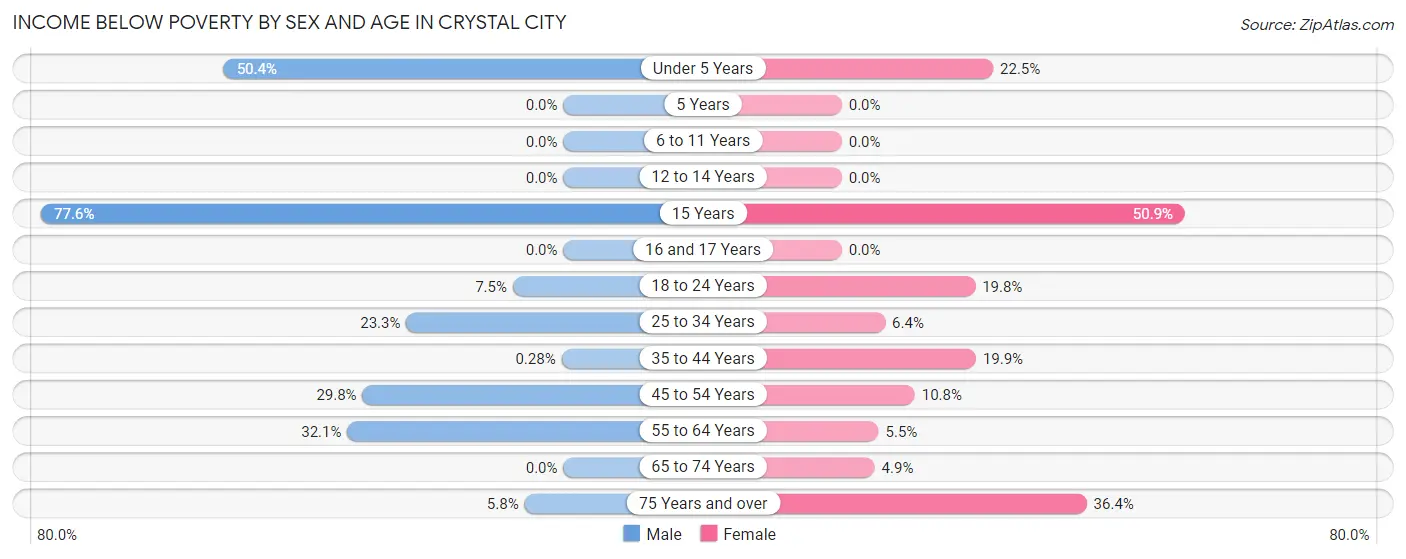
| Age Bracket | Male | Female |
| Under 5 Years | 58 (50.4%) | 20 (22.5%) |
| 5 Years | 0 (0.0%) | 0 (0.0%) |
| 6 to 11 Years | 0 (0.0%) | 0 (0.0%) |
| 12 to 14 Years | 0 (0.0%) | 0 (0.0%) |
| 15 Years | 38 (77.5%) | 27 (50.9%) |
| 16 and 17 Years | 0 (0.0%) | 0 (0.0%) |
| 18 to 24 Years | 19 (7.5%) | 61 (19.8%) |
| 25 to 34 Years | 59 (23.3%) | 15 (6.4%) |
| 35 to 44 Years | 1 (0.3%) | 51 (19.9%) |
| 45 to 54 Years | 71 (29.8%) | 22 (10.8%) |
| 55 to 64 Years | 68 (32.1%) | 22 (5.5%) |
| 65 to 74 Years | 0 (0.0%) | 12 (4.9%) |
| 75 Years and over | 9 (5.8%) | 76 (36.4%) |
| Total | 323 (14.3%) | 306 (13.5%) |
Income Above Poverty by Sex and Age in Crystal City
According to the poverty statistics in Crystal City, males aged 5 years and females aged 6 to 11 years are the age groups that are most secure financially, with 100.0% of males and 100.0% of females in these age groups living above the poverty line.
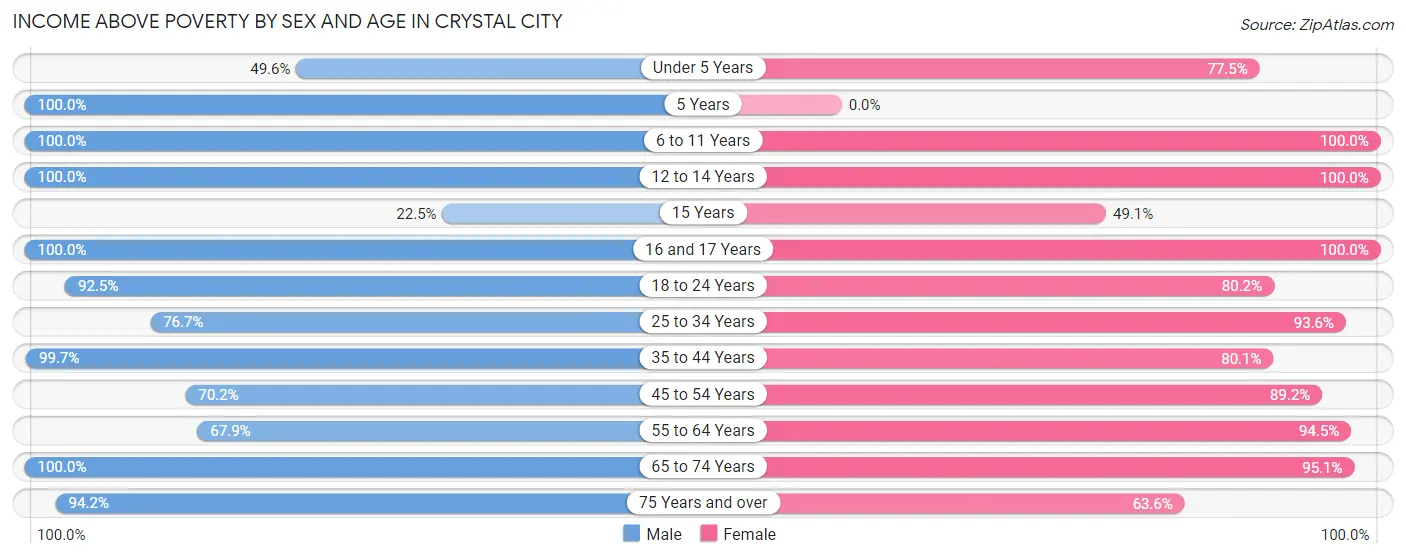
| Age Bracket | Male | Female |
| Under 5 Years | 57 (49.6%) | 69 (77.5%) |
| 5 Years | 71 (100.0%) | 0 (0.0%) |
| 6 to 11 Years | 145 (100.0%) | 76 (100.0%) |
| 12 to 14 Years | 93 (100.0%) | 91 (100.0%) |
| 15 Years | 11 (22.5%) | 26 (49.1%) |
| 16 and 17 Years | 62 (100.0%) | 97 (100.0%) |
| 18 to 24 Years | 234 (92.5%) | 247 (80.2%) |
| 25 to 34 Years | 194 (76.7%) | 218 (93.6%) |
| 35 to 44 Years | 358 (99.7%) | 205 (80.1%) |
| 45 to 54 Years | 167 (70.2%) | 181 (89.2%) |
| 55 to 64 Years | 144 (67.9%) | 381 (94.5%) |
| 65 to 74 Years | 246 (100.0%) | 234 (95.1%) |
| 75 Years and over | 147 (94.2%) | 133 (63.6%) |
| Total | 1,929 (85.7%) | 1,958 (86.5%) |
Income Below Poverty Among Married-Couple Families in Crystal City
The poverty statistics for married-couple families in Crystal City show that 1.2% or 9 of the total 773 families live below the poverty line. Families with no children have the highest poverty rate of 1.9%, comprising of 9 families. On the other hand, families with 1 or 2 children have the lowest poverty rate of 0.0%, which includes 0 families.
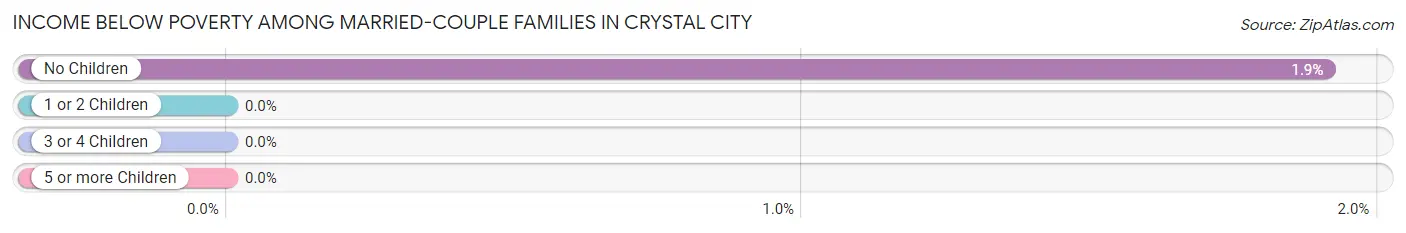
| Children | Above Poverty | Below Poverty |
| No Children | 462 (98.1%) | 9 (1.9%) |
| 1 or 2 Children | 207 (100.0%) | 0 (0.0%) |
| 3 or 4 Children | 70 (100.0%) | 0 (0.0%) |
| 5 or more Children | 25 (100.0%) | 0 (0.0%) |
| Total | 764 (98.8%) | 9 (1.2%) |
Income Below Poverty Among Single-Parent Households in Crystal City
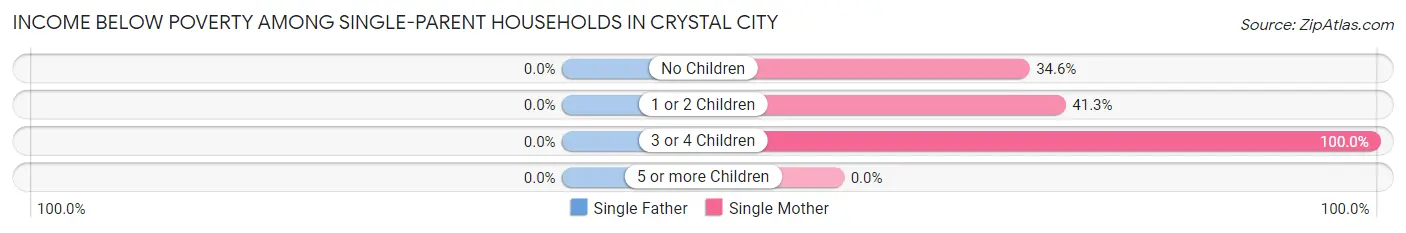
| Children | Single Father | Single Mother |
| No Children | 0 (0.0%) | 47 (34.6%) |
| 1 or 2 Children | 0 (0.0%) | 64 (41.3%) |
| 3 or 4 Children | 0 (0.0%) | 12 (100.0%) |
| 5 or more Children | 0 (0.0%) | 0 (0.0%) |
| Total | 0 (0.0%) | 123 (40.6%) |
Income Below Poverty Among Married-Couple vs Single-Parent Households in Crystal City
The poverty data for Crystal City shows that 9 of the married-couple family households (1.2%) and 123 of the single-parent households (33.5%) are living below the poverty level. Within the married-couple family households, those with no children have the highest poverty rate, with 9 households (1.9%) falling below the poverty line. Among the single-parent households, those with 3 or 4 children have the highest poverty rate, with 12 household (100.0%) living below poverty.
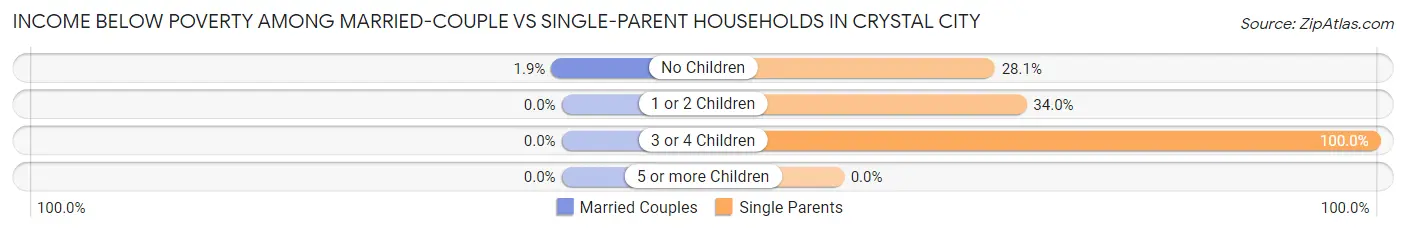
| Children | Married-Couple Families | Single-Parent Households |
| No Children | 9 (1.9%) | 47 (28.1%) |
| 1 or 2 Children | 0 (0.0%) | 64 (34.0%) |
| 3 or 4 Children | 0 (0.0%) | 12 (100.0%) |
| 5 or more Children | 0 (0.0%) | 0 (0.0%) |
| Total | 9 (1.2%) | 123 (33.5%) |
Race in Crystal City
The most populous races in Crystal City are White / Caucasian (4,083 | 86.5%), Two or more Races (451 | 9.6%), and Black / African American (137 | 2.9%).
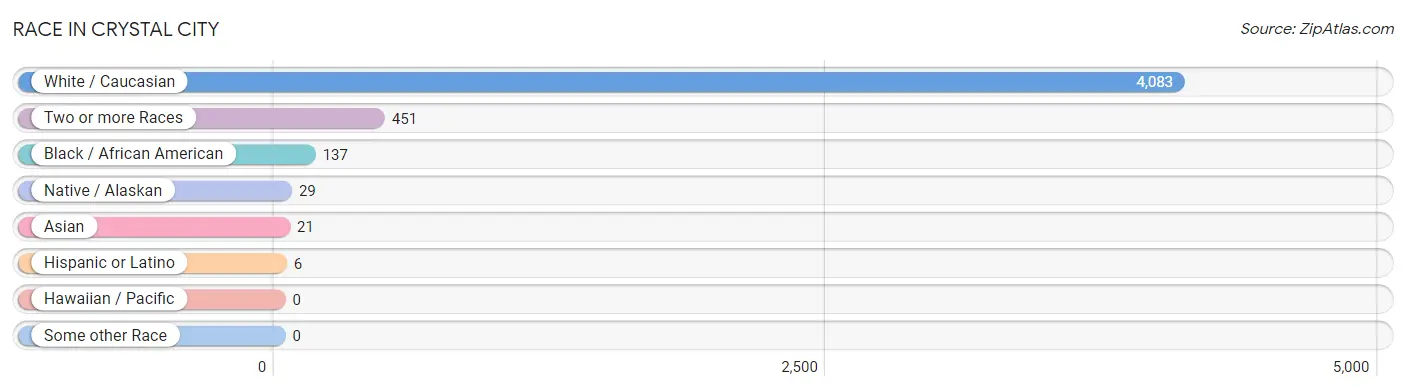
| Race | # Population | % Population |
| Asian | 21 | 0.4% |
| Black / African American | 137 | 2.9% |
| Hawaiian / Pacific | 0 | 0.0% |
| Hispanic or Latino | 6 | 0.1% |
| Native / Alaskan | 29 | 0.6% |
| White / Caucasian | 4,083 | 86.5% |
| Two or more Races | 451 | 9.6% |
| Some other Race | 0 | 0.0% |
| Total | 4,721 | 100.0% |
Ancestry in Crystal City
The most populous ancestries reported in Crystal City are German (956 | 20.3%), Irish (445 | 9.4%), English (402 | 8.5%), American (394 | 8.4%), and French (329 | 7.0%), together accounting for 53.5% of all Crystal City residents.
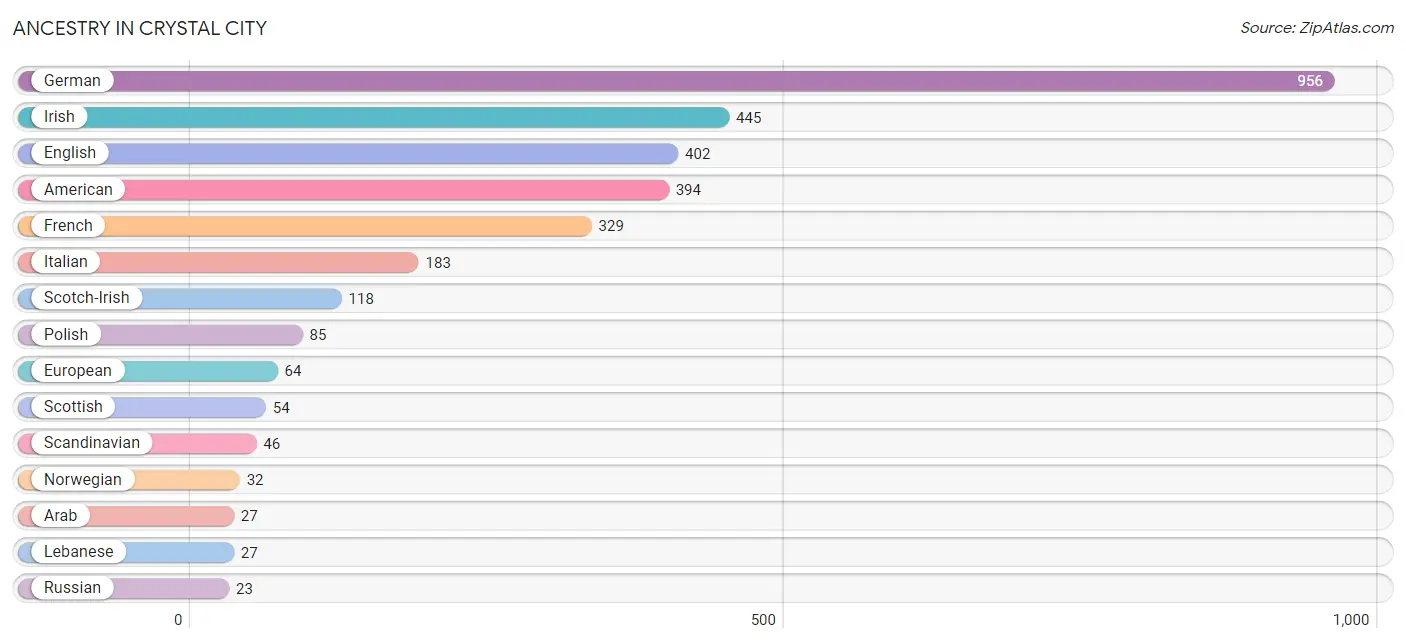
| Ancestry | # Population | % Population |
| American | 394 | 8.4% |
| Arab | 27 | 0.6% |
| Cherokee | 17 | 0.4% |
| Chickasaw | 7 | 0.2% |
| Dutch | 21 | 0.4% |
| English | 402 | 8.5% |
| European | 64 | 1.4% |
| French | 329 | 7.0% |
| French Canadian | 7 | 0.2% |
| German | 956 | 20.3% |
| Hungarian | 12 | 0.3% |
| Irish | 445 | 9.4% |
| Italian | 183 | 3.9% |
| Korean | 21 | 0.4% |
| Lebanese | 27 | 0.6% |
| Mexican | 6 | 0.1% |
| Norwegian | 32 | 0.7% |
| Polish | 85 | 1.8% |
| Russian | 23 | 0.5% |
| Scandinavian | 46 | 1.0% |
| Scotch-Irish | 118 | 2.5% |
| Scottish | 54 | 1.1% |
| Serbian | 9 | 0.2% |
| Slovak | 6 | 0.1% |
| Swedish | 8 | 0.2% |
| Ukrainian | 7 | 0.2% |
| Welsh | 20 | 0.4% | View All 27 Rows |
Immigrants in Crystal City
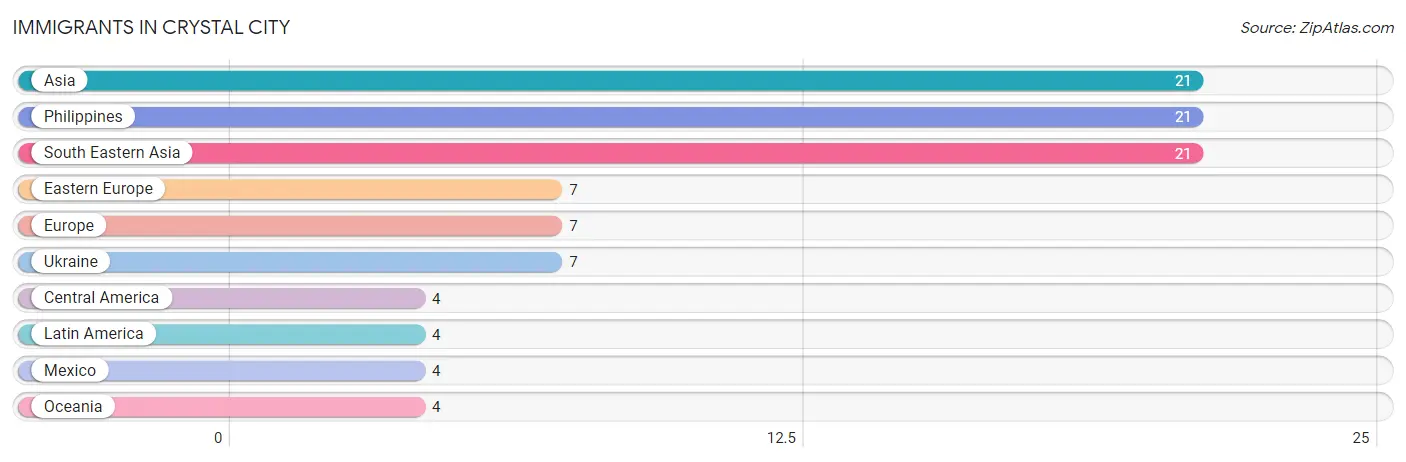
The most numerous immigrant groups reported in Crystal City came from Asia (21 | 0.4%), Philippines (21 | 0.4%), South Eastern Asia (21 | 0.4%), Eastern Europe (7 | 0.2%), and Europe (7 | 0.2%), together accounting for 1.6% of all Crystal City residents.
| Immigration Origin | # Population | % Population |
| Asia | 21 | 0.4% |
| Central America | 4 | 0.1% |
| Eastern Europe | 7 | 0.2% |
| Europe | 7 | 0.2% |
| Latin America | 4 | 0.1% |
| Mexico | 4 | 0.1% |
| Oceania | 4 | 0.1% |
| Philippines | 21 | 0.4% |
| South Eastern Asia | 21 | 0.4% |
| Ukraine | 7 | 0.2% | View All 10 Rows |
Sex and Age in Crystal City
Sex and Age in Crystal City
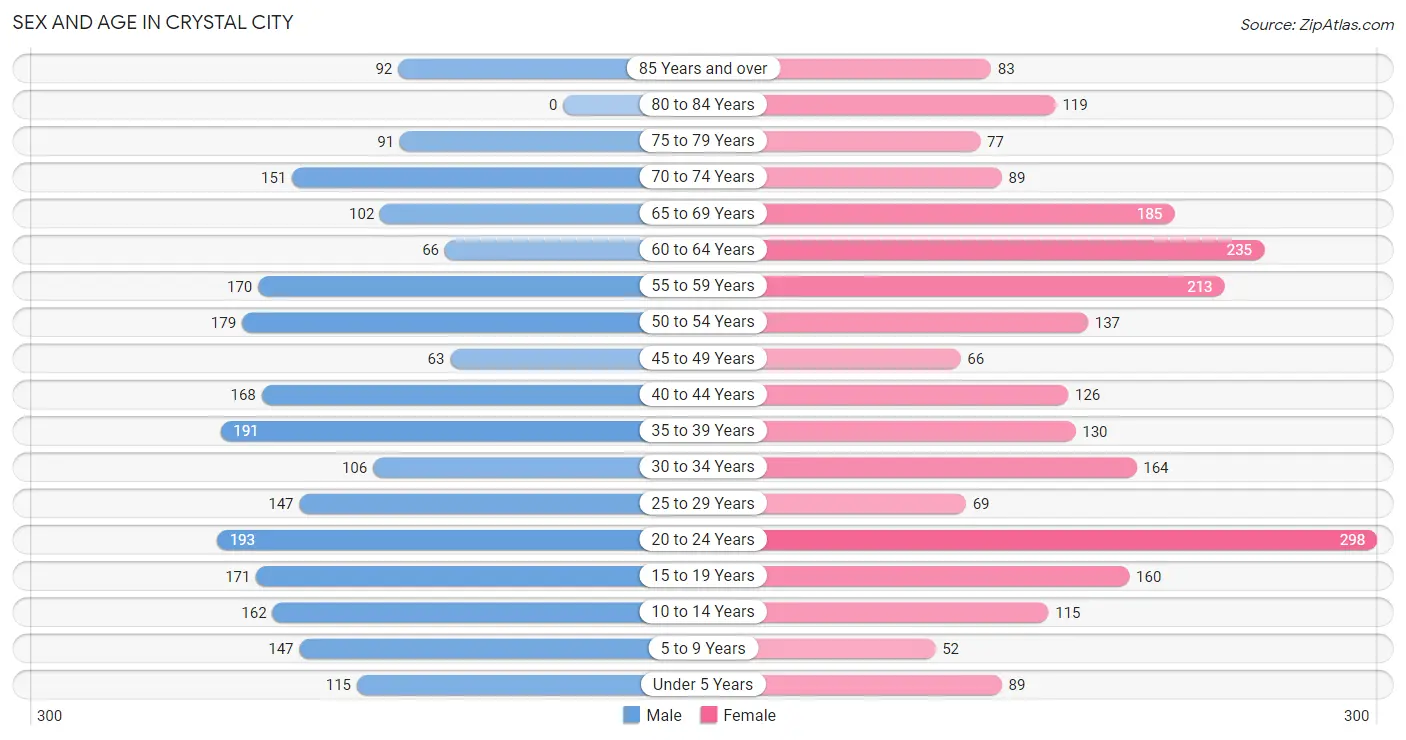
The most populous age groups in Crystal City are 20 to 24 Years (193 | 8.3%) for men and 20 to 24 Years (298 | 12.4%) for women.
| Age Bracket | Male | Female |
| Under 5 Years | 115 (5.0%) | 89 (3.7%) |
| 5 to 9 Years | 147 (6.4%) | 52 (2.2%) |
| 10 to 14 Years | 162 (7.0%) | 115 (4.8%) |
| 15 to 19 Years | 171 (7.4%) | 160 (6.7%) |
| 20 to 24 Years | 193 (8.3%) | 298 (12.4%) |
| 25 to 29 Years | 147 (6.4%) | 69 (2.9%) |
| 30 to 34 Years | 106 (4.6%) | 164 (6.8%) |
| 35 to 39 Years | 191 (8.3%) | 130 (5.4%) |
| 40 to 44 Years | 168 (7.3%) | 126 (5.2%) |
| 45 to 49 Years | 63 (2.7%) | 66 (2.7%) |
| 50 to 54 Years | 179 (7.7%) | 137 (5.7%) |
| 55 to 59 Years | 170 (7.3%) | 213 (8.8%) |
| 60 to 64 Years | 66 (2.9%) | 235 (9.8%) |
| 65 to 69 Years | 102 (4.4%) | 185 (7.7%) |
| 70 to 74 Years | 151 (6.5%) | 89 (3.7%) |
| 75 to 79 Years | 91 (3.9%) | 77 (3.2%) |
| 80 to 84 Years | 0 (0.0%) | 119 (4.9%) |
| 85 Years and over | 92 (4.0%) | 83 (3.5%) |
| Total | 2,314 (100.0%) | 2,407 (100.0%) |
Families and Households in Crystal City
Median Family Size in Crystal City
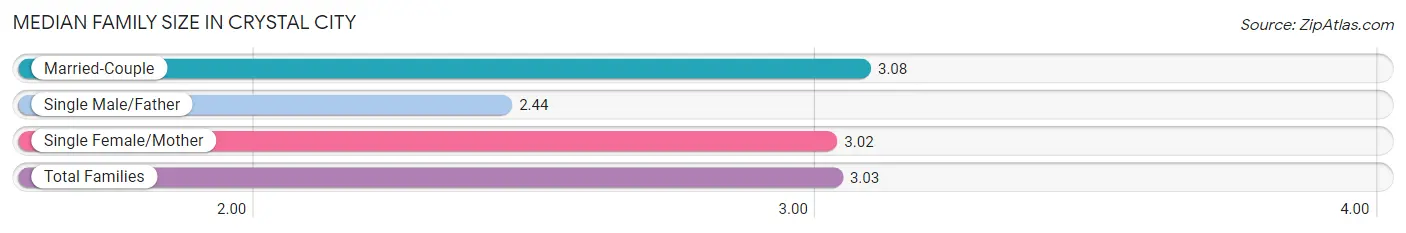
The median family size in Crystal City is 3.03 persons per family, with married-couple families (773 | 67.8%) accounting for the largest median family size of 3.08 persons per family. On the other hand, single male/father families (64 | 5.6%) represent the smallest median family size with 2.44 persons per family.
| Family Type | # Families | Family Size |
| Married-Couple | 773 (67.8%) | 3.08 |
| Single Male/Father | 64 (5.6%) | 2.44 |
| Single Female/Mother | 303 (26.6%) | 3.02 |
| Total Families | 1,140 (100.0%) | 3.03 |
Median Household Size in Crystal City
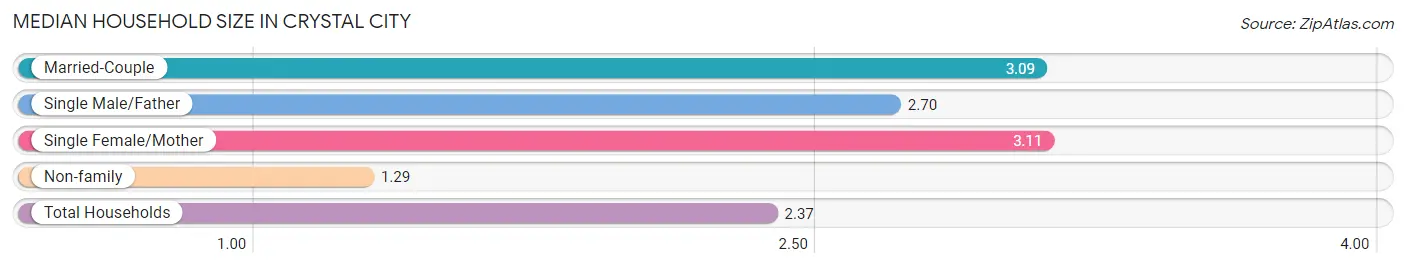
The median household size in Crystal City is 2.37 persons per household, with single female/mother households (303 | 16.0%) accounting for the largest median household size of 3.11 persons per household. non-family households (750 | 39.7%) represent the smallest median household size with 1.29 persons per household.
| Household Type | # Households | Household Size |
| Married-Couple | 773 (40.9%) | 3.09 |
| Single Male/Father | 64 (3.4%) | 2.70 |
| Single Female/Mother | 303 (16.0%) | 3.11 |
| Non-family | 750 (39.7%) | 1.29 |
| Total Households | 1,890 (100.0%) | 2.37 |
Household Size by Marriage Status in Crystal City
Out of a total of 1,890 households in Crystal City, 1,140 (60.3%) are family households, while 750 (39.7%) are nonfamily households. The most numerous type of family households are 2-person households, comprising 595, and the most common type of nonfamily households are 1-person households, comprising 531.
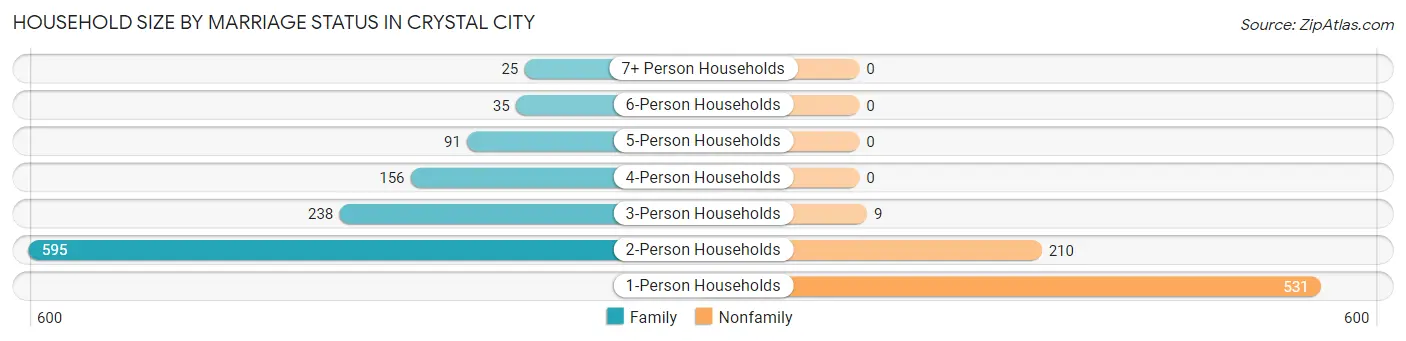
| Household Size | Family Households | Nonfamily Households |
| 1-Person Households | - | 531 (28.1%) |
| 2-Person Households | 595 (31.5%) | 210 (11.1%) |
| 3-Person Households | 238 (12.6%) | 9 (0.5%) |
| 4-Person Households | 156 (8.3%) | 0 (0.0%) |
| 5-Person Households | 91 (4.8%) | 0 (0.0%) |
| 6-Person Households | 35 (1.8%) | 0 (0.0%) |
| 7+ Person Households | 25 (1.3%) | 0 (0.0%) |
| Total | 1,140 (60.3%) | 750 (39.7%) |
Female Fertility in Crystal City
Fertility by Age in Crystal City
Average fertility rate in Crystal City is 30.0 births per 1,000 women. Women in the age bracket of 20 to 34 years have the highest fertility rate with 60.0 births per 1,000 women. Women in the age bracket of 20 to 34 years acount for 100.0% of all women with births.
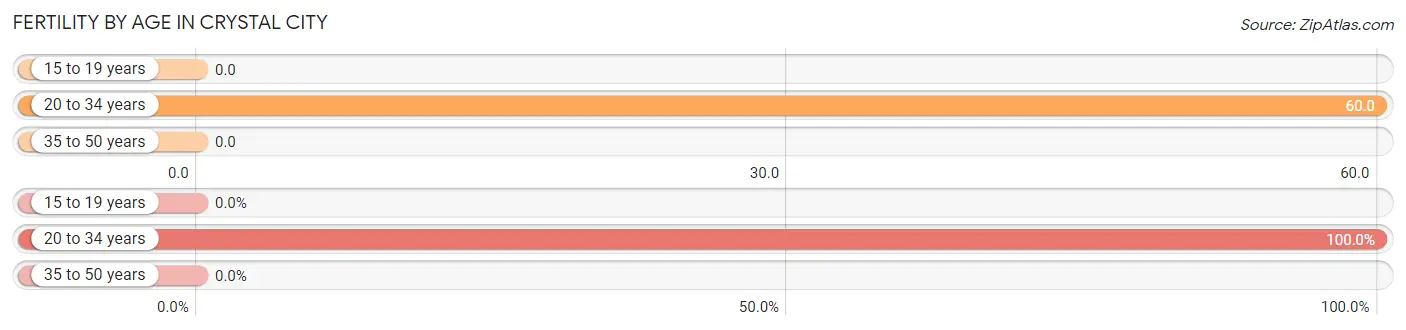
| Age Bracket | Women with Births | Births / 1,000 Women |
| 15 to 19 years | 0 (0.0%) | 0.0 |
| 20 to 34 years | 32 (100.0%) | 60.0 |
| 35 to 50 years | 0 (0.0%) | 0.0 |
| Total | 32 (100.0%) | 30.0 |
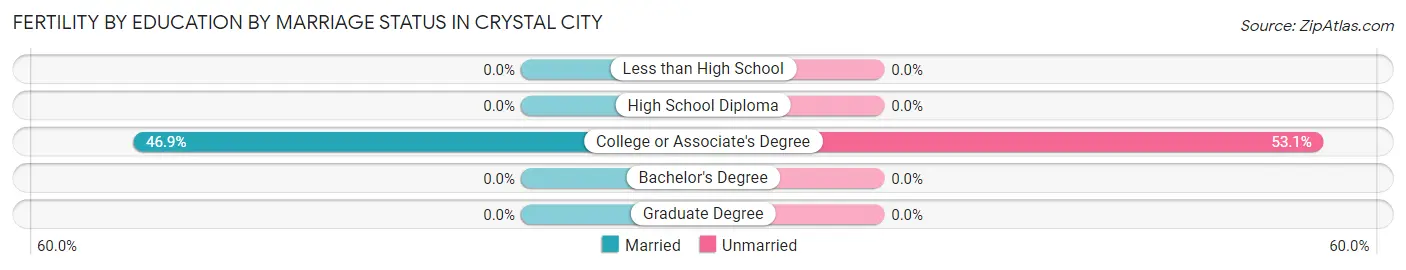
Fertility by Age by Marriage Status in Crystal City
46.9% of women with births (32) in Crystal City are married. The highest percentage of unmarried women with births falls into 20 to 34 years age bracket with 53.1% of them unmarried at the time of birth, while the lowest percentage of unmarried women with births belong to 20 to 34 years age bracket with 53.1% of them unmarried.
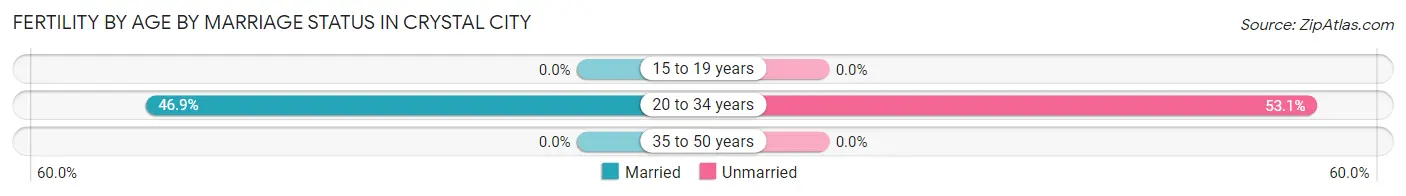
| Age Bracket | Married | Unmarried |
| 15 to 19 years | 0 (0.0%) | 0 (0.0%) |
| 20 to 34 years | 15 (46.9%) | 17 (53.1%) |
| 35 to 50 years | 0 (0.0%) | 0 (0.0%) |
| Total | 15 (46.9%) | 17 (53.1%) |
Fertility by Education in Crystal City
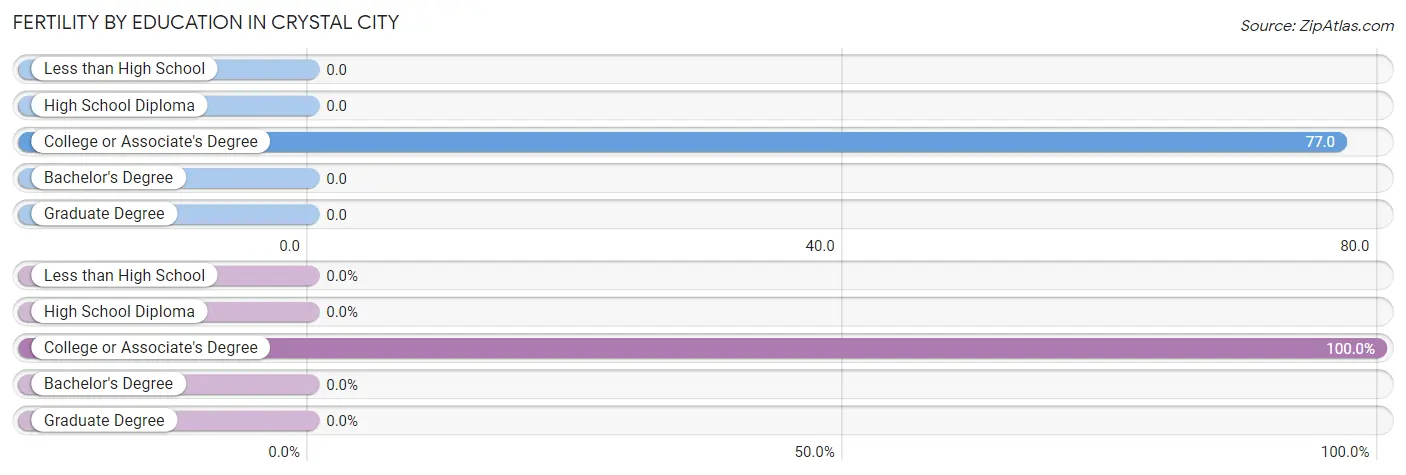
| Educational Attainment | Women with Births | Births / 1,000 Women |
| Less than High School | 0 (0.0%) | 0.0 |
| High School Diploma | 0 (0.0%) | 0.0 |
| College or Associate's Degree | 32 (100.0%) | 77.0 |
| Bachelor's Degree | 0 (0.0%) | 0.0 |
| Graduate Degree | 0 (0.0%) | 0.0 |
| Total | 32 (100.0%) | 30.0 |
Fertility by Education by Marriage Status in Crystal City
53.1% of women with births in Crystal City are unmarried. Women with the educational attainment of college or associate's degree are most likely to be married with 46.9% of them married at childbirth, while women with the educational attainment of college or associate's degree are least likely to be married with 53.1% of them unmarried at childbirth.
| Educational Attainment | Married | Unmarried |
| Less than High School | 0 (0.0%) | 0 (0.0%) |
| High School Diploma | 0 (0.0%) | 0 (0.0%) |
| College or Associate's Degree | 15 (46.9%) | 17 (53.1%) |
| Bachelor's Degree | 0 (0.0%) | 0 (0.0%) |
| Graduate Degree | 0 (0.0%) | 0 (0.0%) |
| Total | 15 (46.9%) | 17 (53.1%) |
Employment Characteristics in Crystal City
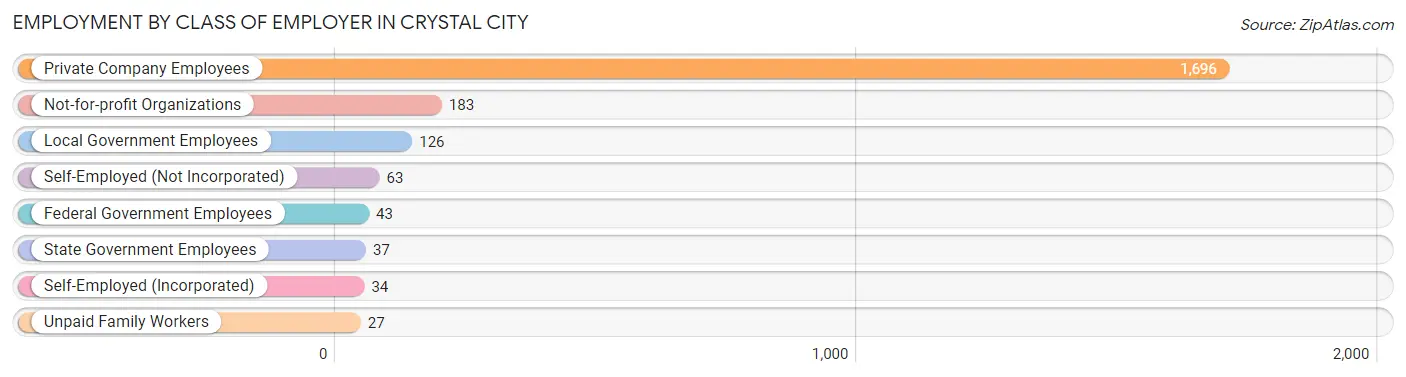
Employment by Class of Employer in Crystal City
Among the 2,209 employed individuals in Crystal City, private company employees (1,696 | 76.8%), not-for-profit organizations (183 | 8.3%), and local government employees (126 | 5.7%) make up the most common classes of employment.
| Employer Class | # Employees | % Employees |
| Private Company Employees | 1,696 | 76.8% |
| Self-Employed (Incorporated) | 34 | 1.5% |
| Self-Employed (Not Incorporated) | 63 | 2.9% |
| Not-for-profit Organizations | 183 | 8.3% |
| Local Government Employees | 126 | 5.7% |
| State Government Employees | 37 | 1.7% |
| Federal Government Employees | 43 | 1.9% |
| Unpaid Family Workers | 27 | 1.2% |
| Total | 2,209 | 100.0% |
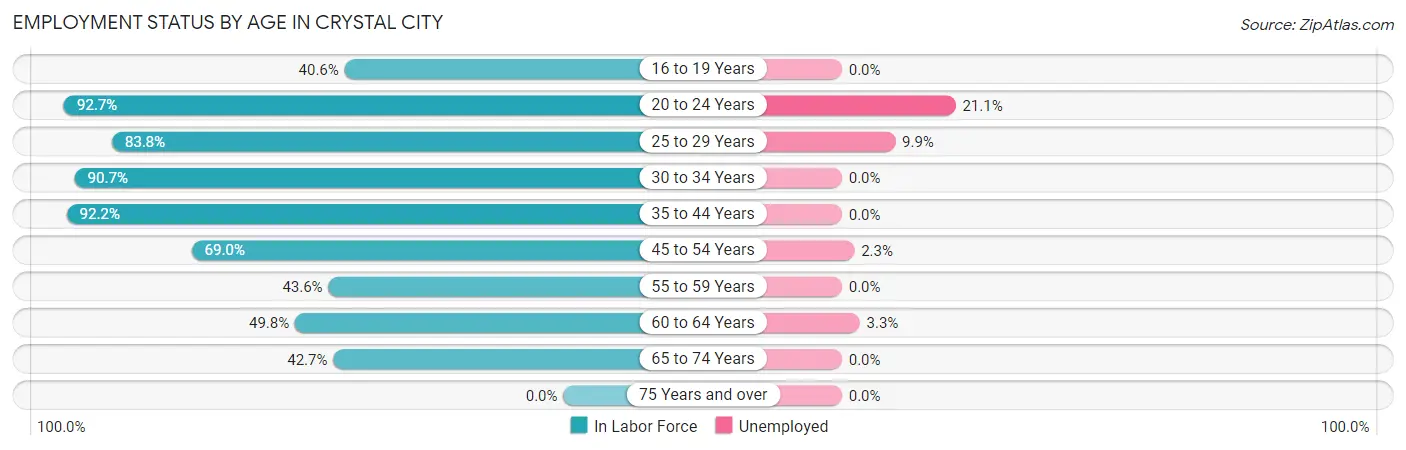
Employment Status by Age in Crystal City
According to the labor force statistics for Crystal City, out of the total population over 16 years of age (3,939), 60.7% or 2,391 individuals are in the labor force, with 5.3% or 127 of them unemployed. The age group with the highest labor force participation rate is 20 to 24 years, with 92.7% or 455 individuals in the labor force. Within the labor force, the 20 to 24 years age range has the highest percentage of unemployed individuals, with 21.1% or 96 of them being unemployed.
| Age Bracket | In Labor Force | Unemployed |
| 16 to 19 Years | 93 (40.6%) | 0 (0.0%) |
| 20 to 24 Years | 455 (92.7%) | 96 (21.1%) |
| 25 to 29 Years | 181 (83.8%) | 18 (9.9%) |
| 30 to 34 Years | 245 (90.7%) | 0 (0.0%) |
| 35 to 44 Years | 567 (92.2%) | 0 (0.0%) |
| 45 to 54 Years | 307 (69.0%) | 7 (2.3%) |
| 55 to 59 Years | 167 (43.6%) | 0 (0.0%) |
| 60 to 64 Years | 150 (49.8%) | 5 (3.3%) |
| 65 to 74 Years | 225 (42.7%) | 0 (0.0%) |
| 75 Years and over | 0 (0.0%) | 0 (0.0%) |
| Total | 2,391 (60.7%) | 127 (5.3%) |
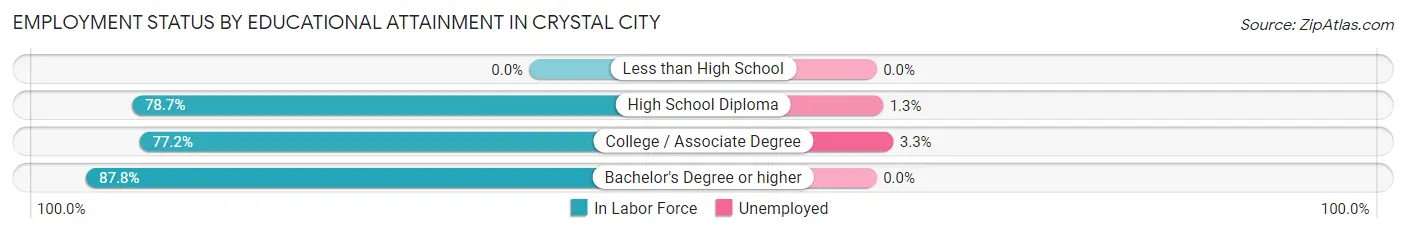
Employment Status by Educational Attainment in Crystal City
According to labor force statistics for Crystal City, 72.5% of individuals (1,617) out of the total population between 25 and 64 years of age (2,230) are in the labor force, with 1.9% or 31 of them being unemployed. The group with the highest labor force participation rate are those with the educational attainment of bachelor's degree or higher, with 87.8% or 381 individuals in the labor force. Within the labor force, individuals with college / associate degree education have the highest percentage of unemployment, with 3.3% or 23 of them being unemployed.
| Educational Attainment | In Labor Force | Unemployed |
| Less than High School | 0 (0.0%) | 0 (0.0%) |
| High School Diploma | 537 (78.7%) | 9 (1.3%) |
| College / Associate Degree | 699 (77.2%) | 30 (3.3%) |
| Bachelor's Degree or higher | 381 (87.8%) | 0 (0.0%) |
| Total | 1,617 (72.5%) | 42 (1.9%) |
Employment Occupations by Sex in Crystal City
Management, Business, Science and Arts Occupations
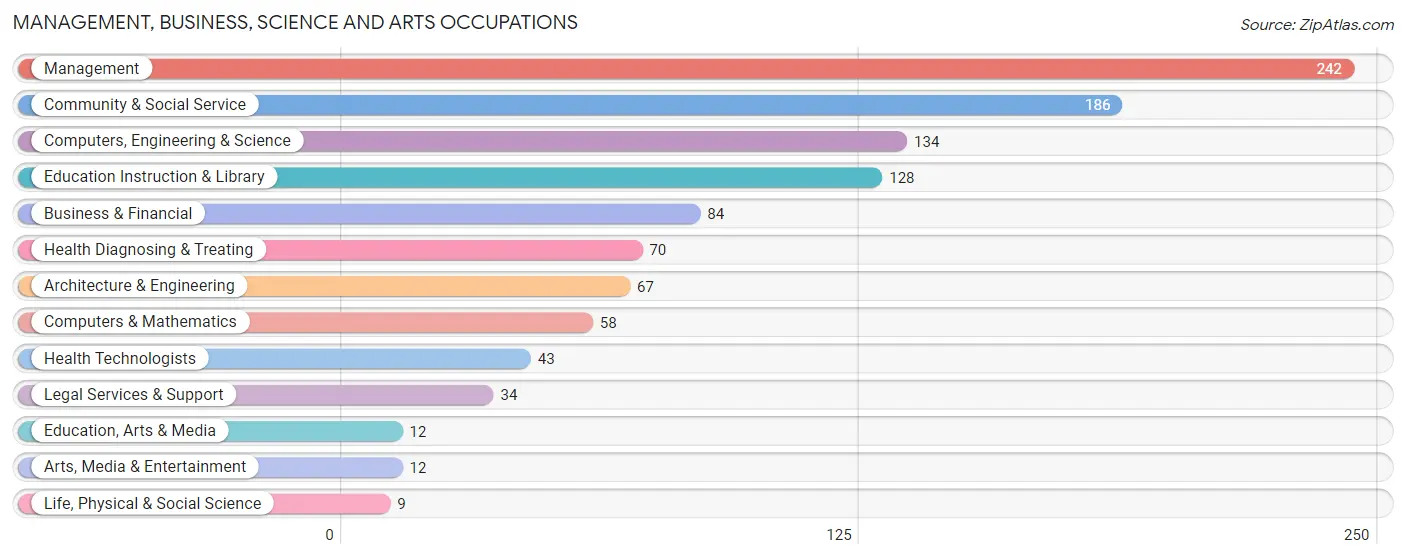
The most common Management, Business, Science and Arts occupations in Crystal City are Management (242 | 10.7%), Community & Social Service (186 | 8.2%), Computers, Engineering & Science (134 | 5.9%), Education Instruction & Library (128 | 5.7%), and Business & Financial (84 | 3.7%).
Management, Business, Science and Arts Occupations by Sex
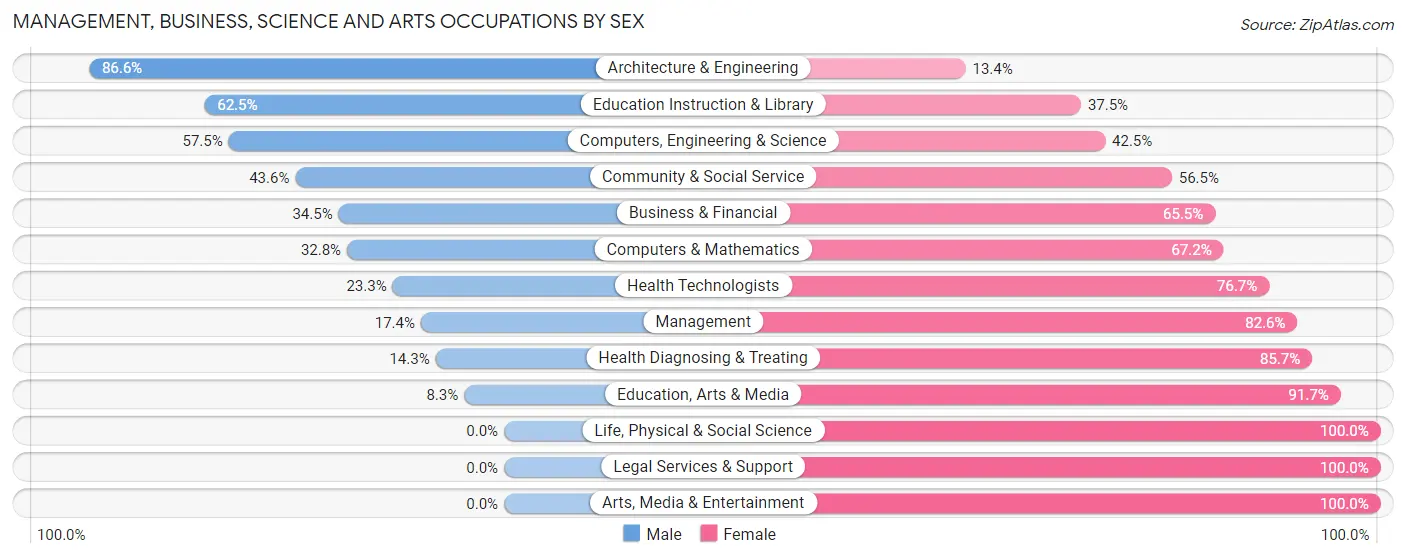
Within the Management, Business, Science and Arts occupations in Crystal City, the most male-oriented occupations are Architecture & Engineering (86.6%), Education Instruction & Library (62.5%), and Computers, Engineering & Science (57.5%), while the most female-oriented occupations are Life, Physical & Social Science (100.0%), Legal Services & Support (100.0%), and Arts, Media & Entertainment (100.0%).
| Occupation | Male | Female |
| Management | 42 (17.4%) | 200 (82.6%) |
| Business & Financial | 29 (34.5%) | 55 (65.5%) |
| Computers, Engineering & Science | 77 (57.5%) | 57 (42.5%) |
| Computers & Mathematics | 19 (32.8%) | 39 (67.2%) |
| Architecture & Engineering | 58 (86.6%) | 9 (13.4%) |
| Life, Physical & Social Science | 0 (0.0%) | 9 (100.0%) |
| Community & Social Service | 81 (43.5%) | 105 (56.5%) |
| Education, Arts & Media | 1 (8.3%) | 11 (91.7%) |
| Legal Services & Support | 0 (0.0%) | 34 (100.0%) |
| Education Instruction & Library | 80 (62.5%) | 48 (37.5%) |
| Arts, Media & Entertainment | 0 (0.0%) | 12 (100.0%) |
| Health Diagnosing & Treating | 10 (14.3%) | 60 (85.7%) |
| Health Technologists | 10 (23.3%) | 33 (76.7%) |
| Total (Category) | 239 (33.4%) | 477 (66.6%) |
| Total (Overall) | 1,134 (50.1%) | 1,130 (49.9%) |
Services Occupations
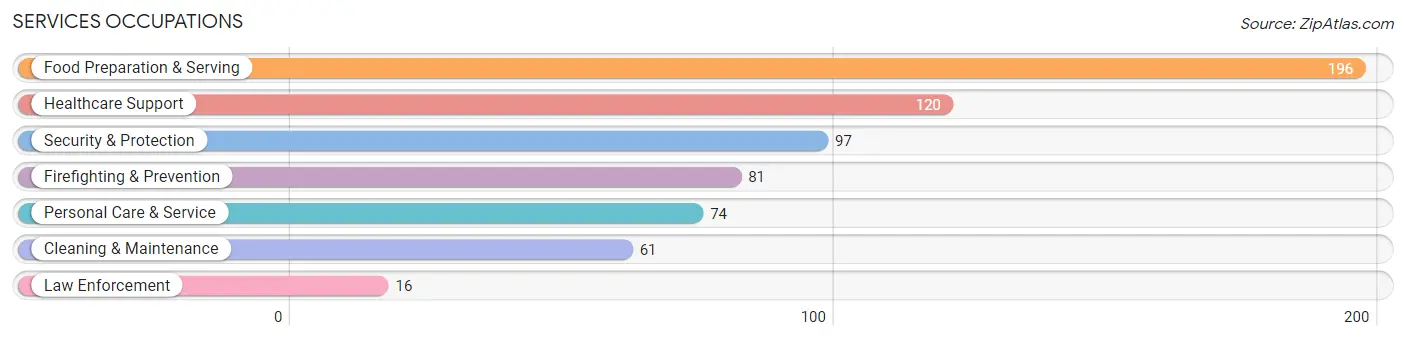
The most common Services occupations in Crystal City are Food Preparation & Serving (196 | 8.7%), Healthcare Support (120 | 5.3%), Security & Protection (97 | 4.3%), Firefighting & Prevention (81 | 3.6%), and Personal Care & Service (74 | 3.3%).
Services Occupations by Sex
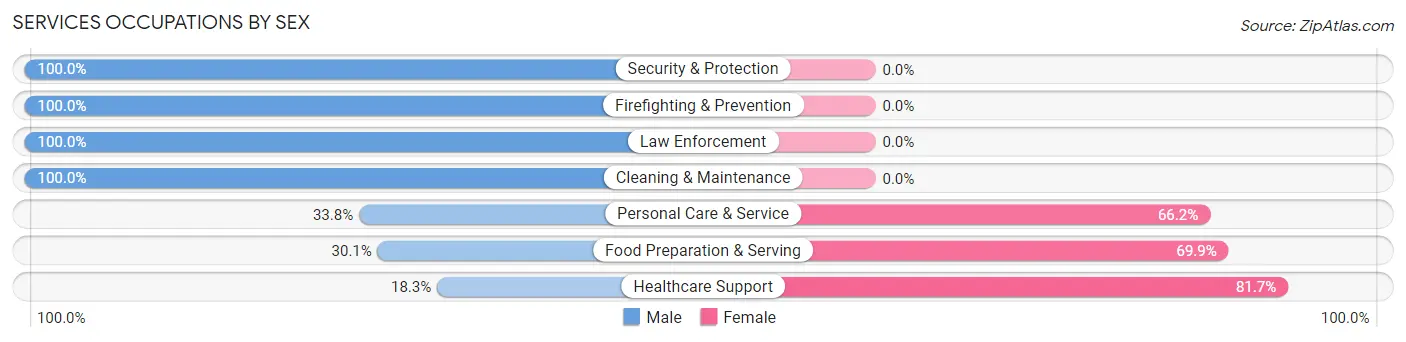
Within the Services occupations in Crystal City, the most male-oriented occupations are Security & Protection (100.0%), Firefighting & Prevention (100.0%), and Law Enforcement (100.0%), while the most female-oriented occupations are Healthcare Support (81.7%), Food Preparation & Serving (69.9%), and Personal Care & Service (66.2%).
| Occupation | Male | Female |
| Healthcare Support | 22 (18.3%) | 98 (81.7%) |
| Security & Protection | 97 (100.0%) | 0 (0.0%) |
| Firefighting & Prevention | 81 (100.0%) | 0 (0.0%) |
| Law Enforcement | 16 (100.0%) | 0 (0.0%) |
| Food Preparation & Serving | 59 (30.1%) | 137 (69.9%) |
| Cleaning & Maintenance | 61 (100.0%) | 0 (0.0%) |
| Personal Care & Service | 25 (33.8%) | 49 (66.2%) |
| Total (Category) | 264 (48.2%) | 284 (51.8%) |
| Total (Overall) | 1,134 (50.1%) | 1,130 (49.9%) |
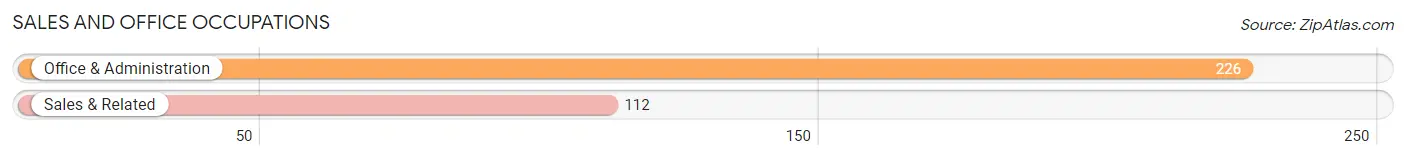
Sales and Office Occupations
The most common Sales and Office occupations in Crystal City are Office & Administration (226 | 10.0%), and Sales & Related (112 | 5.0%).
Sales and Office Occupations by Sex
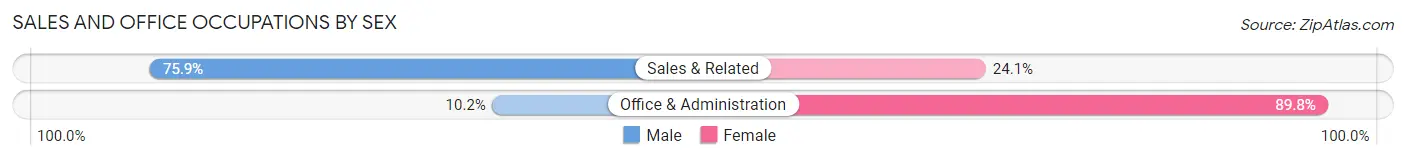
| Occupation | Male | Female |
| Sales & Related | 85 (75.9%) | 27 (24.1%) |
| Office & Administration | 23 (10.2%) | 203 (89.8%) |
| Total (Category) | 108 (32.0%) | 230 (68.0%) |
| Total (Overall) | 1,134 (50.1%) | 1,130 (49.9%) |
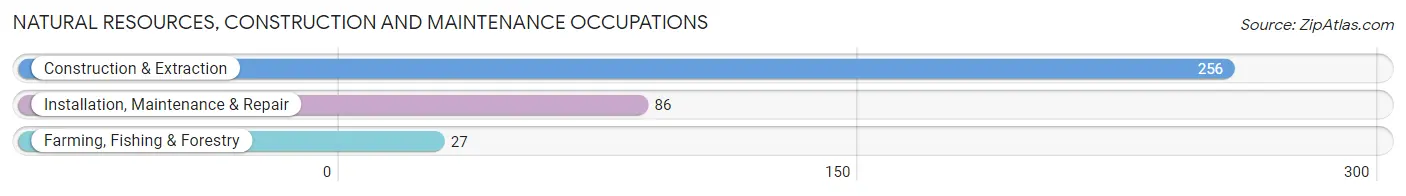
Natural Resources, Construction and Maintenance Occupations
The most common Natural Resources, Construction and Maintenance occupations in Crystal City are Construction & Extraction (256 | 11.3%), Installation, Maintenance & Repair (86 | 3.8%), and Farming, Fishing & Forestry (27 | 1.2%).
Natural Resources, Construction and Maintenance Occupations by Sex
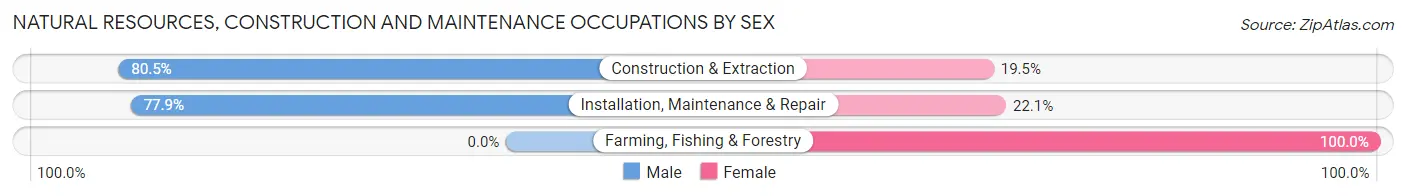
| Occupation | Male | Female |
| Farming, Fishing & Forestry | 0 (0.0%) | 27 (100.0%) |
| Construction & Extraction | 206 (80.5%) | 50 (19.5%) |
| Installation, Maintenance & Repair | 67 (77.9%) | 19 (22.1%) |
| Total (Category) | 273 (74.0%) | 96 (26.0%) |
| Total (Overall) | 1,134 (50.1%) | 1,130 (49.9%) |
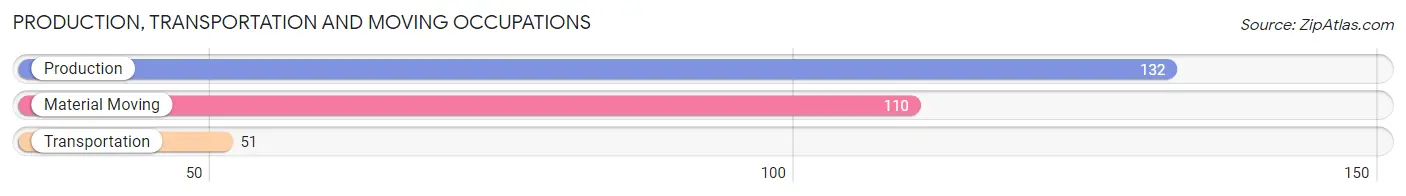
Production, Transportation and Moving Occupations
The most common Production, Transportation and Moving occupations in Crystal City are Production (132 | 5.8%), Material Moving (110 | 4.9%), and Transportation (51 | 2.2%).
Production, Transportation and Moving Occupations by Sex
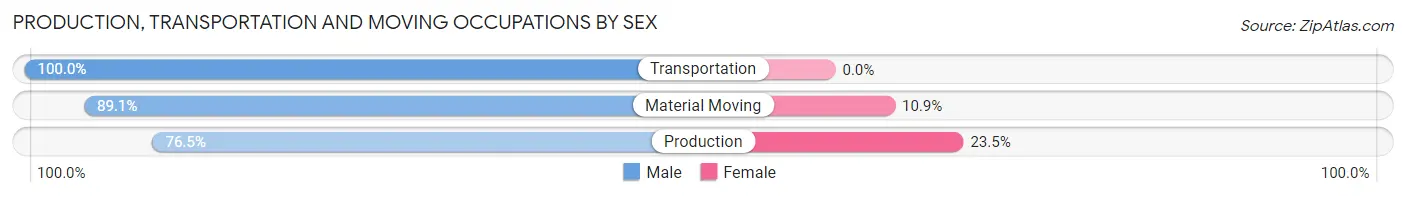
| Occupation | Male | Female |
| Production | 101 (76.5%) | 31 (23.5%) |
| Transportation | 51 (100.0%) | 0 (0.0%) |
| Material Moving | 98 (89.1%) | 12 (10.9%) |
| Total (Category) | 250 (85.3%) | 43 (14.7%) |
| Total (Overall) | 1,134 (50.1%) | 1,130 (49.9%) |
Employment Industries by Sex in Crystal City
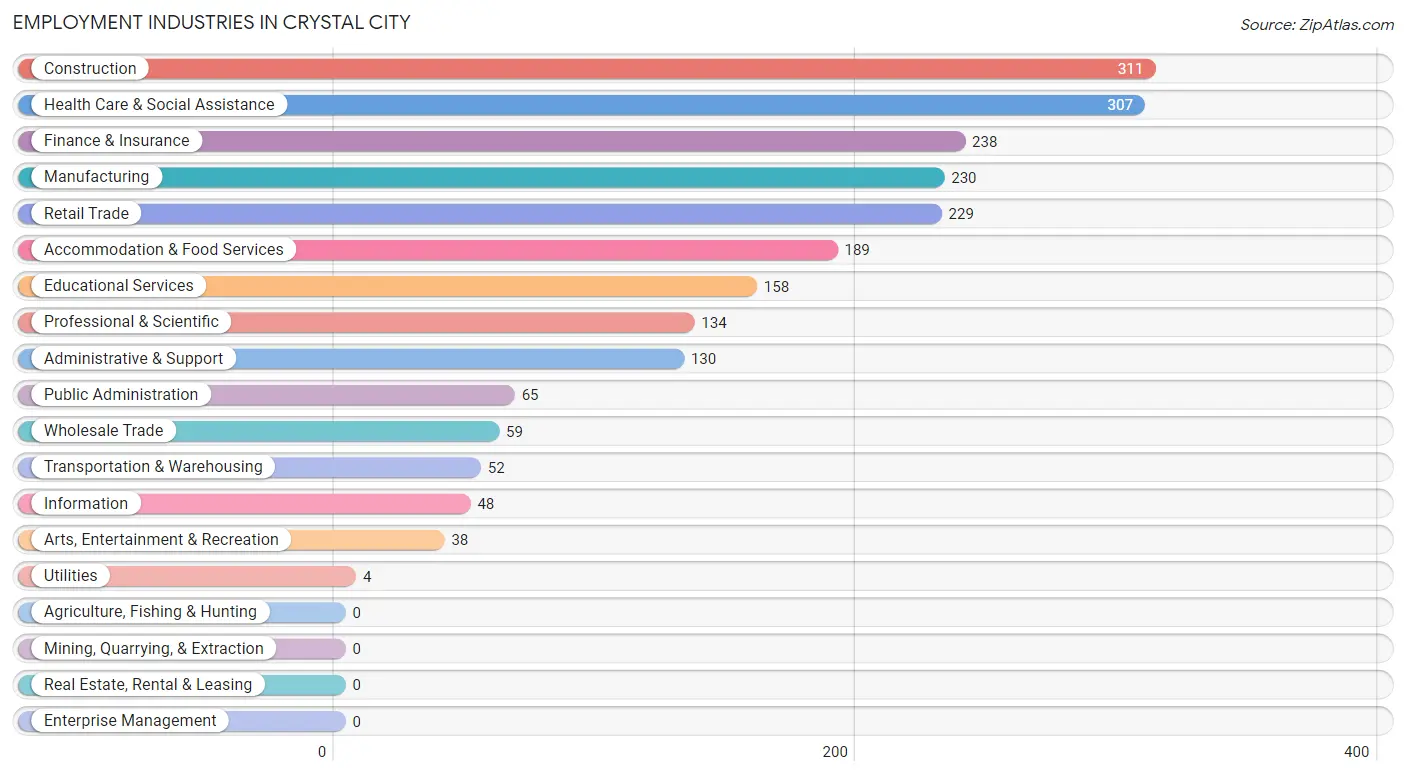
Employment Industries in Crystal City
The major employment industries in Crystal City include Construction (311 | 13.7%), Health Care & Social Assistance (307 | 13.6%), Finance & Insurance (238 | 10.5%), Manufacturing (230 | 10.2%), and Retail Trade (229 | 10.1%).
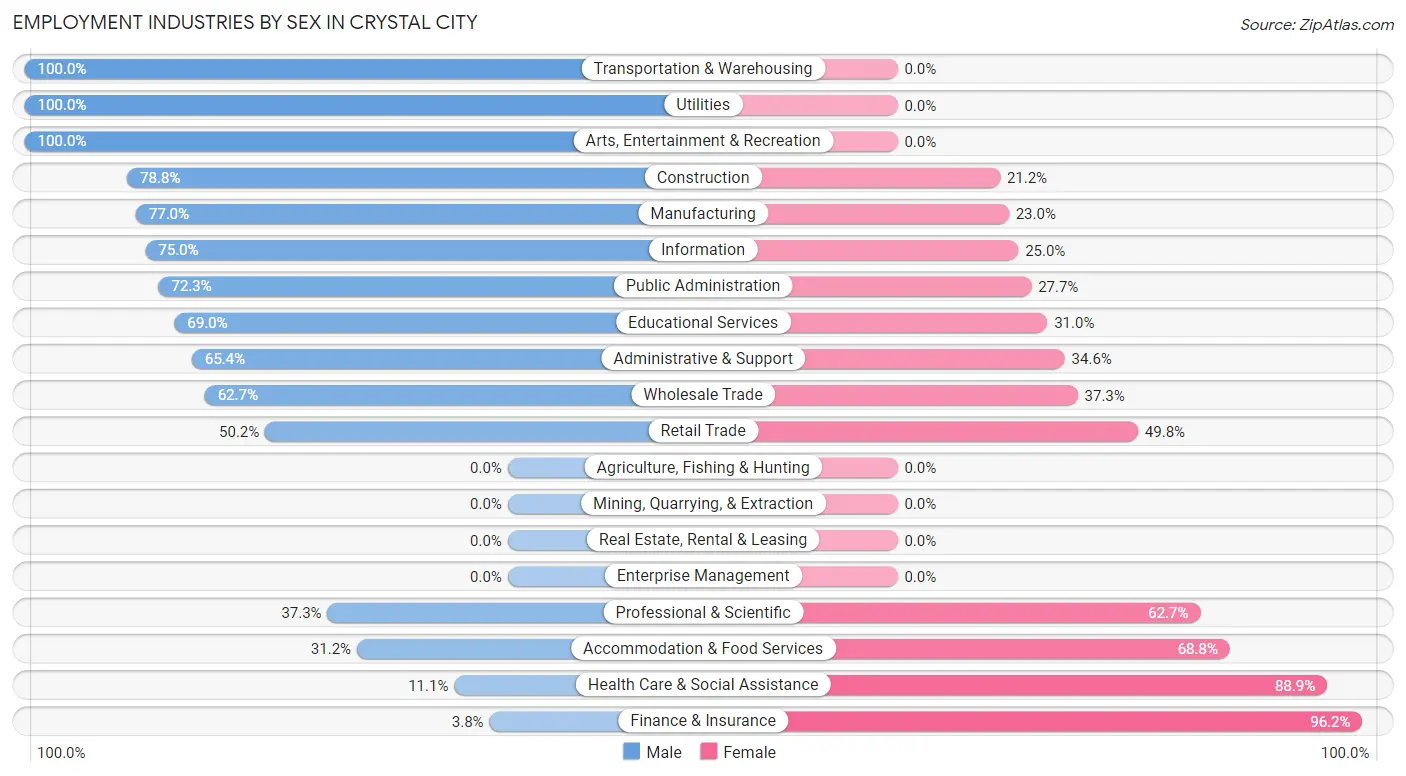
Employment Industries by Sex in Crystal City
The Crystal City industries that see more men than women are Transportation & Warehousing (100.0%), Utilities (100.0%), and Arts, Entertainment & Recreation (100.0%), whereas the industries that tend to have a higher number of women are Finance & Insurance (96.2%), Health Care & Social Assistance (88.9%), and Accommodation & Food Services (68.8%).
| Industry | Male | Female |
| Agriculture, Fishing & Hunting | 0 (0.0%) | 0 (0.0%) |
| Mining, Quarrying, & Extraction | 0 (0.0%) | 0 (0.0%) |
| Construction | 245 (78.8%) | 66 (21.2%) |
| Manufacturing | 177 (77.0%) | 53 (23.0%) |
| Wholesale Trade | 37 (62.7%) | 22 (37.3%) |
| Retail Trade | 115 (50.2%) | 114 (49.8%) |
| Transportation & Warehousing | 52 (100.0%) | 0 (0.0%) |
| Utilities | 4 (100.0%) | 0 (0.0%) |
| Information | 36 (75.0%) | 12 (25.0%) |
| Finance & Insurance | 9 (3.8%) | 229 (96.2%) |
| Real Estate, Rental & Leasing | 0 (0.0%) | 0 (0.0%) |
| Professional & Scientific | 50 (37.3%) | 84 (62.7%) |
| Enterprise Management | 0 (0.0%) | 0 (0.0%) |
| Administrative & Support | 85 (65.4%) | 45 (34.6%) |
| Educational Services | 109 (69.0%) | 49 (31.0%) |
| Health Care & Social Assistance | 34 (11.1%) | 273 (88.9%) |
| Arts, Entertainment & Recreation | 38 (100.0%) | 0 (0.0%) |
| Accommodation & Food Services | 59 (31.2%) | 130 (68.8%) |
| Public Administration | 47 (72.3%) | 18 (27.7%) |
| Total | 1,134 (50.1%) | 1,130 (49.9%) |
Education in Crystal City
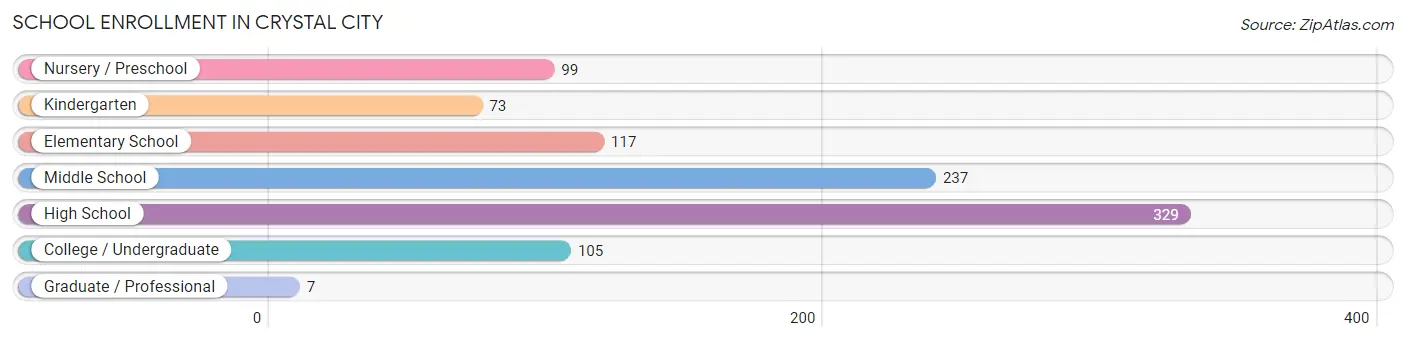
School Enrollment in Crystal City
The most common levels of schooling among the 967 students in Crystal City are high school (329 | 34.0%), middle school (237 | 24.5%), and elementary school (117 | 12.1%).
| School Level | # Students | % Students |
| Nursery / Preschool | 99 | 10.2% |
| Kindergarten | 73 | 7.5% |
| Elementary School | 117 | 12.1% |
| Middle School | 237 | 24.5% |
| High School | 329 | 34.0% |
| College / Undergraduate | 105 | 10.9% |
| Graduate / Professional | 7 | 0.7% |
| Total | 967 | 100.0% |
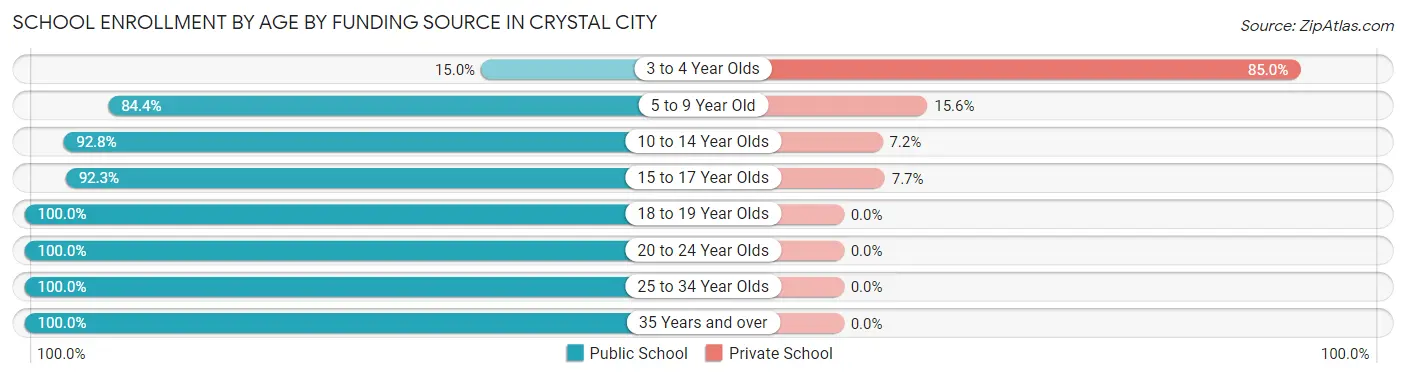
School Enrollment by Age by Funding Source in Crystal City
Out of a total of 967 students who are enrolled in schools in Crystal City, 122 (12.6%) attend a private institution, while the remaining 845 (87.4%) are enrolled in public schools. The age group of 3 to 4 year olds has the highest likelihood of being enrolled in private schools, with 51 (85.0% in the age bracket) enrolled. Conversely, the age group of 18 to 19 year olds has the lowest likelihood of being enrolled in a private school, with 70 (100.0% in the age bracket) attending a public institution.
| Age Bracket | Public School | Private School |
| 3 to 4 Year Olds | 9 (15.0%) | 51 (85.0%) |
| 5 to 9 Year Old | 168 (84.4%) | 31 (15.6%) |
| 10 to 14 Year Olds | 257 (92.8%) | 20 (7.2%) |
| 15 to 17 Year Olds | 241 (92.3%) | 20 (7.7%) |
| 18 to 19 Year Olds | 70 (100.0%) | 0 (0.0%) |
| 20 to 24 Year Olds | 50 (100.0%) | 0 (0.0%) |
| 25 to 34 Year Olds | 33 (100.0%) | 0 (0.0%) |
| 35 Years and over | 17 (100.0%) | 0 (0.0%) |
| Total | 845 (87.4%) | 122 (12.6%) |
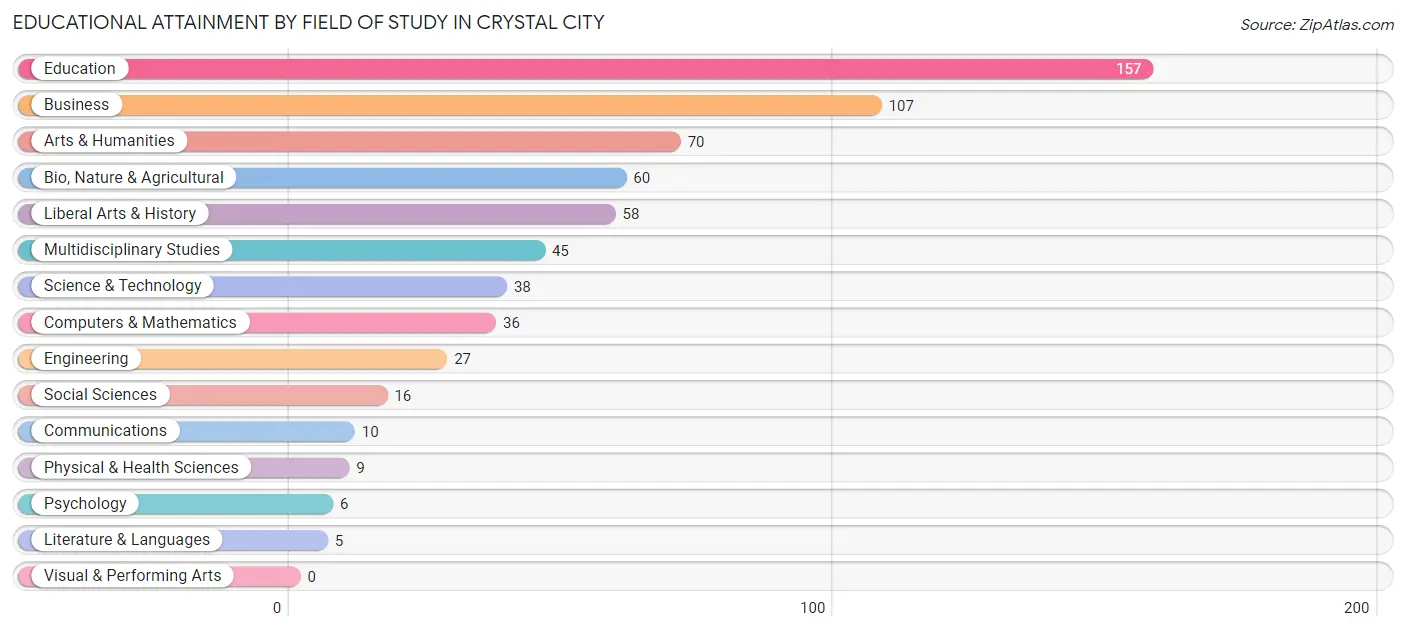
Educational Attainment by Field of Study in Crystal City
Education (157 | 24.4%), business (107 | 16.6%), arts & humanities (70 | 10.9%), bio, nature & agricultural (60 | 9.3%), and liberal arts & history (58 | 9.0%) are the most common fields of study among 644 individuals in Crystal City who have obtained a bachelor's degree or higher.
| Field of Study | # Graduates | % Graduates |
| Computers & Mathematics | 36 | 5.6% |
| Bio, Nature & Agricultural | 60 | 9.3% |
| Physical & Health Sciences | 9 | 1.4% |
| Psychology | 6 | 0.9% |
| Social Sciences | 16 | 2.5% |
| Engineering | 27 | 4.2% |
| Multidisciplinary Studies | 45 | 7.0% |
| Science & Technology | 38 | 5.9% |
| Business | 107 | 16.6% |
| Education | 157 | 24.4% |
| Literature & Languages | 5 | 0.8% |
| Liberal Arts & History | 58 | 9.0% |
| Visual & Performing Arts | 0 | 0.0% |
| Communications | 10 | 1.5% |
| Arts & Humanities | 70 | 10.9% |
| Total | 644 | 100.0% |
Transportation & Commute in Crystal City
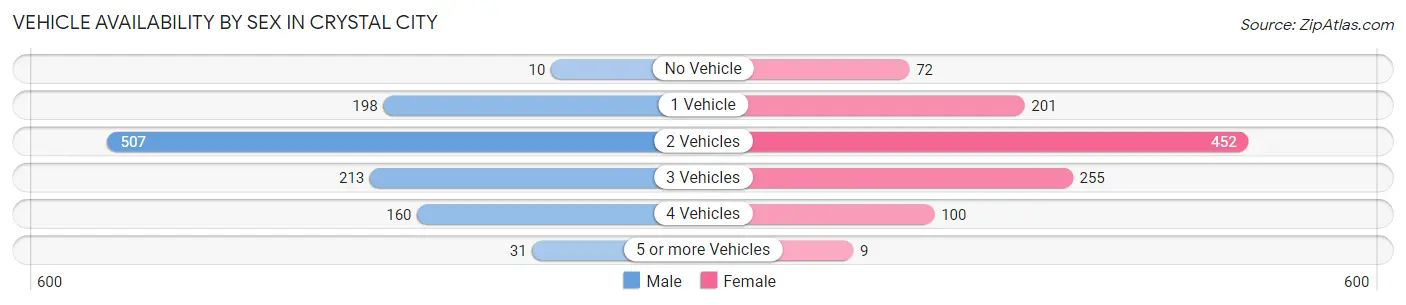
Vehicle Availability by Sex in Crystal City
The most prevalent vehicle ownership categories in Crystal City are males with 2 vehicles (507, accounting for 45.3%) and females with 2 vehicles (452, making up 46.6%).
| Vehicles Available | Male | Female |
| No Vehicle | 10 (0.9%) | 72 (6.6%) |
| 1 Vehicle | 198 (17.7%) | 201 (18.5%) |
| 2 Vehicles | 507 (45.3%) | 452 (41.5%) |
| 3 Vehicles | 213 (19.0%) | 255 (23.4%) |
| 4 Vehicles | 160 (14.3%) | 100 (9.2%) |
| 5 or more Vehicles | 31 (2.8%) | 9 (0.8%) |
| Total | 1,119 (100.0%) | 1,089 (100.0%) |
Commute Time in Crystal City
The most frequently occuring commute durations in Crystal City are 45 to 59 minutes (411 commuters, 19.7%), 5 to 9 minutes (345 commuters, 16.5%), and 10 to 14 minutes (294 commuters, 14.1%).
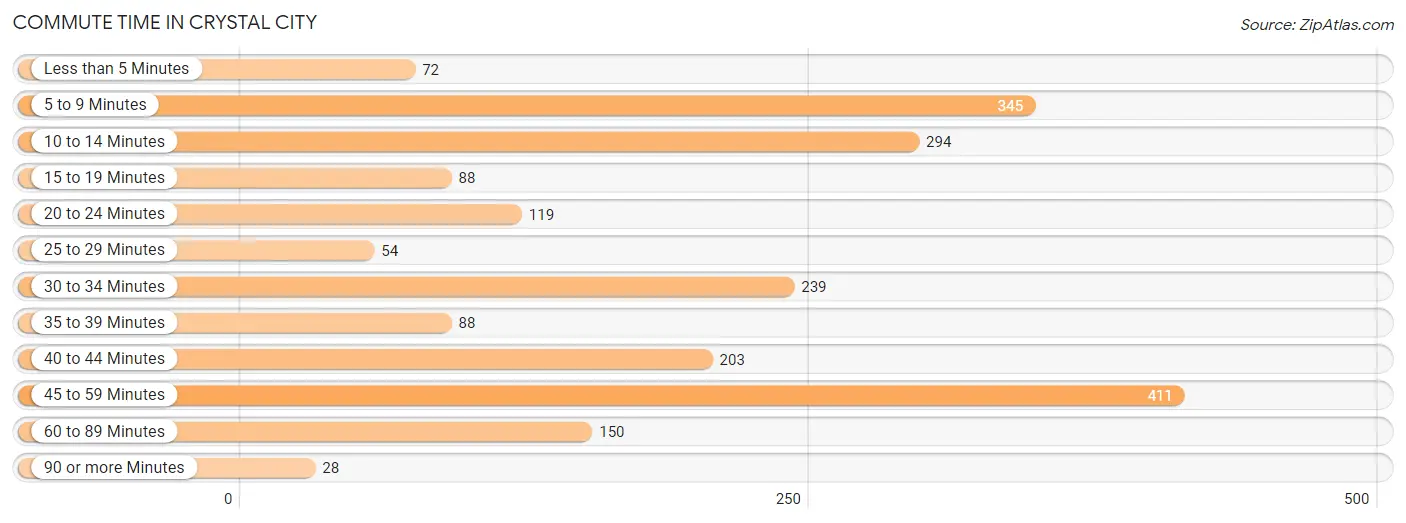
| Commute Time | # Commuters | % Commuters |
| Less than 5 Minutes | 72 | 3.4% |
| 5 to 9 Minutes | 345 | 16.5% |
| 10 to 14 Minutes | 294 | 14.1% |
| 15 to 19 Minutes | 88 | 4.2% |
| 20 to 24 Minutes | 119 | 5.7% |
| 25 to 29 Minutes | 54 | 2.6% |
| 30 to 34 Minutes | 239 | 11.4% |
| 35 to 39 Minutes | 88 | 4.2% |
| 40 to 44 Minutes | 203 | 9.7% |
| 45 to 59 Minutes | 411 | 19.7% |
| 60 to 89 Minutes | 150 | 7.2% |
| 90 or more Minutes | 28 | 1.3% |
Commute Time by Sex in Crystal City
The most common commute times in Crystal City are 45 to 59 minutes (325 commuters, 29.6%) for males and 10 to 14 minutes (213 commuters, 21.4%) for females.
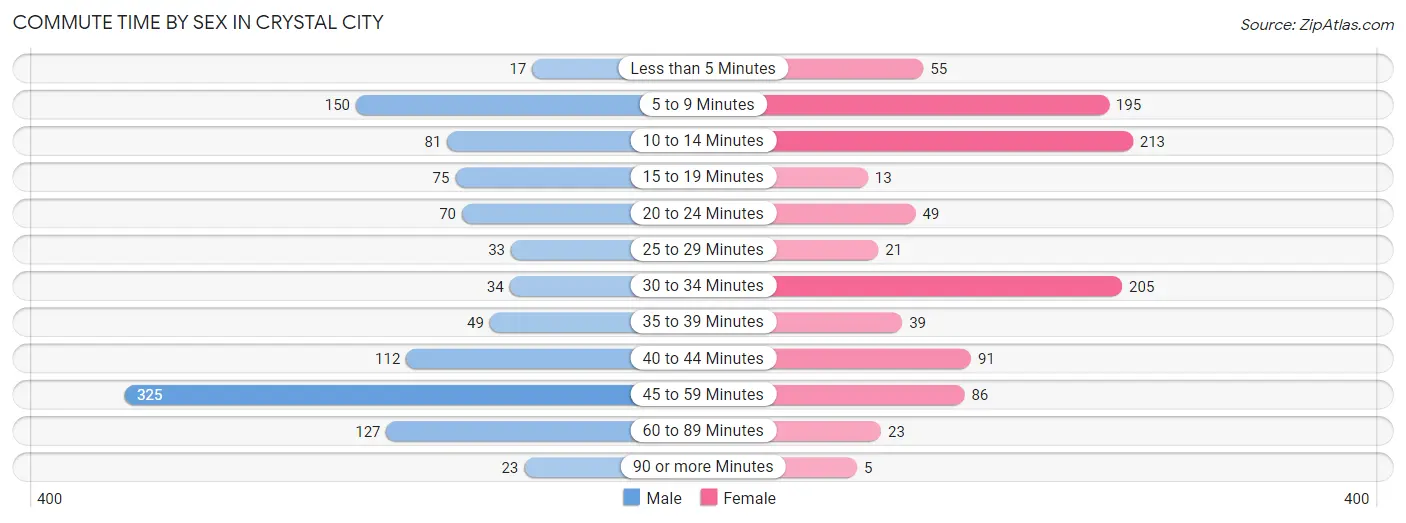
| Commute Time | Male | Female |
| Less than 5 Minutes | 17 (1.5%) | 55 (5.5%) |
| 5 to 9 Minutes | 150 (13.7%) | 195 (19.6%) |
| 10 to 14 Minutes | 81 (7.4%) | 213 (21.4%) |
| 15 to 19 Minutes | 75 (6.8%) | 13 (1.3%) |
| 20 to 24 Minutes | 70 (6.4%) | 49 (4.9%) |
| 25 to 29 Minutes | 33 (3.0%) | 21 (2.1%) |
| 30 to 34 Minutes | 34 (3.1%) | 205 (20.6%) |
| 35 to 39 Minutes | 49 (4.5%) | 39 (3.9%) |
| 40 to 44 Minutes | 112 (10.2%) | 91 (9.1%) |
| 45 to 59 Minutes | 325 (29.6%) | 86 (8.6%) |
| 60 to 89 Minutes | 127 (11.6%) | 23 (2.3%) |
| 90 or more Minutes | 23 (2.1%) | 5 (0.5%) |
Time of Departure to Work by Sex in Crystal City
The most frequent times of departure to work in Crystal City are 7:00 AM to 7:29 AM (244, 22.3%) for males and 7:00 AM to 7:29 AM (196, 19.7%) for females.
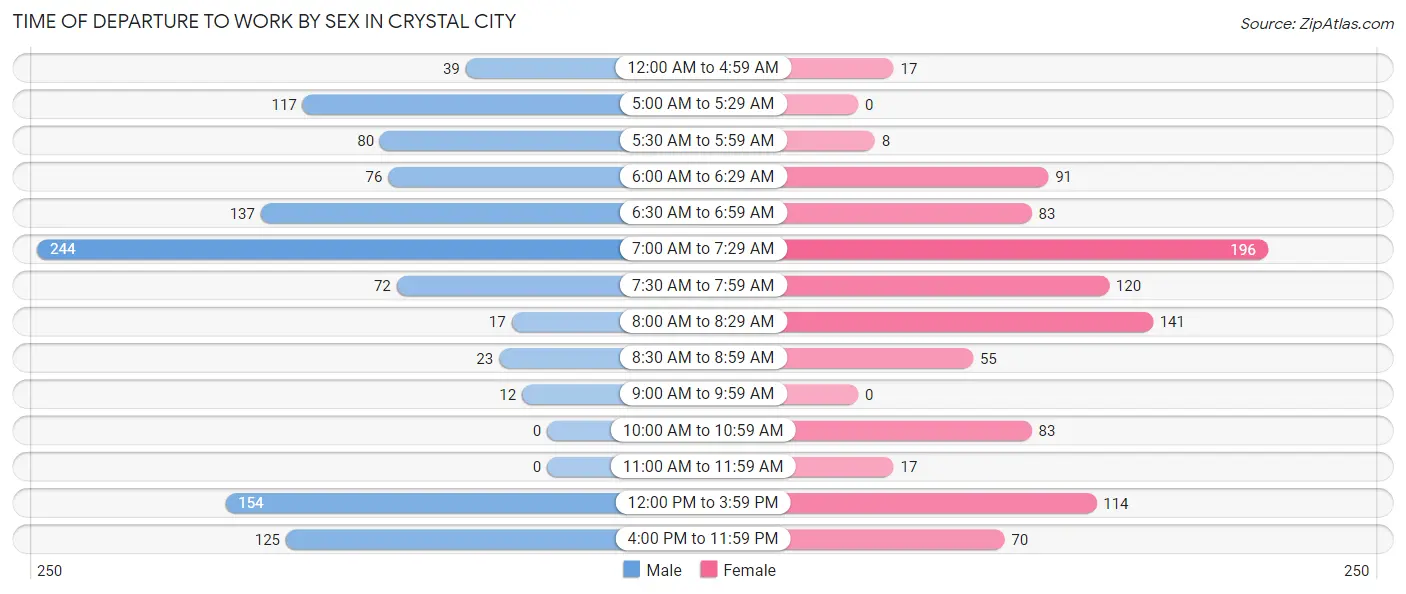
| Time of Departure | Male | Female |
| 12:00 AM to 4:59 AM | 39 (3.6%) | 17 (1.7%) |
| 5:00 AM to 5:29 AM | 117 (10.7%) | 0 (0.0%) |
| 5:30 AM to 5:59 AM | 80 (7.3%) | 8 (0.8%) |
| 6:00 AM to 6:29 AM | 76 (6.9%) | 91 (9.1%) |
| 6:30 AM to 6:59 AM | 137 (12.5%) | 83 (8.3%) |
| 7:00 AM to 7:29 AM | 244 (22.3%) | 196 (19.7%) |
| 7:30 AM to 7:59 AM | 72 (6.6%) | 120 (12.1%) |
| 8:00 AM to 8:29 AM | 17 (1.5%) | 141 (14.2%) |
| 8:30 AM to 8:59 AM | 23 (2.1%) | 55 (5.5%) |
| 9:00 AM to 9:59 AM | 12 (1.1%) | 0 (0.0%) |
| 10:00 AM to 10:59 AM | 0 (0.0%) | 83 (8.3%) |
| 11:00 AM to 11:59 AM | 0 (0.0%) | 17 (1.7%) |
| 12:00 PM to 3:59 PM | 154 (14.1%) | 114 (11.5%) |
| 4:00 PM to 11:59 PM | 125 (11.4%) | 70 (7.0%) |
| Total | 1,096 (100.0%) | 995 (100.0%) |
Housing Occupancy in Crystal City
Occupancy by Ownership in Crystal City
Of the total 1,890 dwellings in Crystal City, owner-occupied units account for 1,384 (73.2%), while renter-occupied units make up 506 (26.8%).
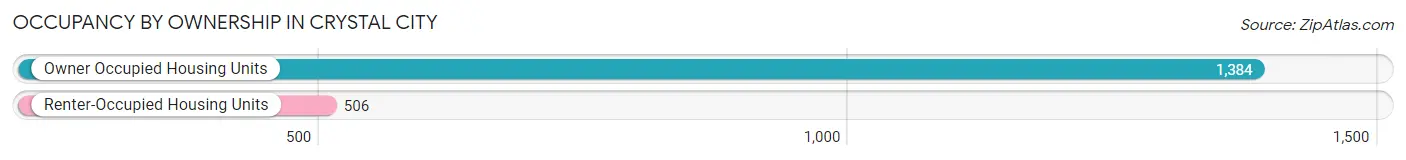
| Occupancy | # Housing Units | % Housing Units |
| Owner Occupied Housing Units | 1,384 | 73.2% |
| Renter-Occupied Housing Units | 506 | 26.8% |
| Total Occupied Housing Units | 1,890 | 100.0% |
Occupancy by Household Size in Crystal City
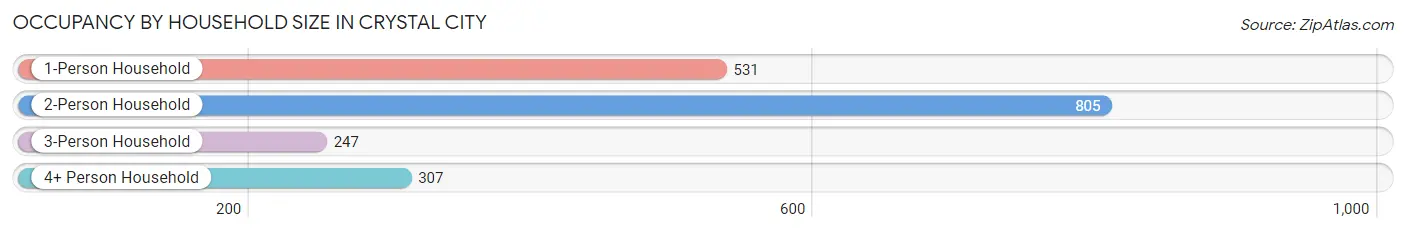
| Household Size | # Housing Units | % Housing Units |
| 1-Person Household | 531 | 28.1% |
| 2-Person Household | 805 | 42.6% |
| 3-Person Household | 247 | 13.1% |
| 4+ Person Household | 307 | 16.2% |
| Total Housing Units | 1,890 | 100.0% |
Occupancy by Ownership by Household Size in Crystal City
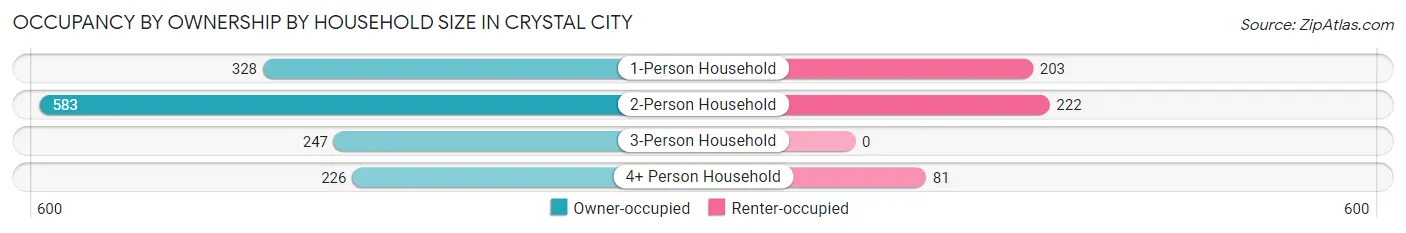
| Household Size | Owner-occupied | Renter-occupied |
| 1-Person Household | 328 (61.8%) | 203 (38.2%) |
| 2-Person Household | 583 (72.4%) | 222 (27.6%) |
| 3-Person Household | 247 (100.0%) | 0 (0.0%) |
| 4+ Person Household | 226 (73.6%) | 81 (26.4%) |
| Total Housing Units | 1,384 (73.2%) | 506 (26.8%) |
Occupancy by Educational Attainment in Crystal City
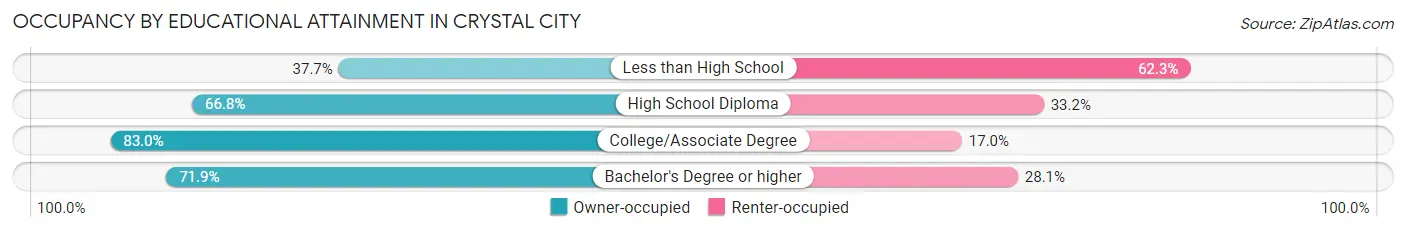
| Household Size | Owner-occupied | Renter-occupied |
| Less than High School | 40 (37.7%) | 66 (62.3%) |
| High School Diploma | 386 (66.8%) | 192 (33.2%) |
| College/Associate Degree | 679 (83.0%) | 139 (17.0%) |
| Bachelor's Degree or higher | 279 (71.9%) | 109 (28.1%) |
Occupancy by Age of Householder in Crystal City
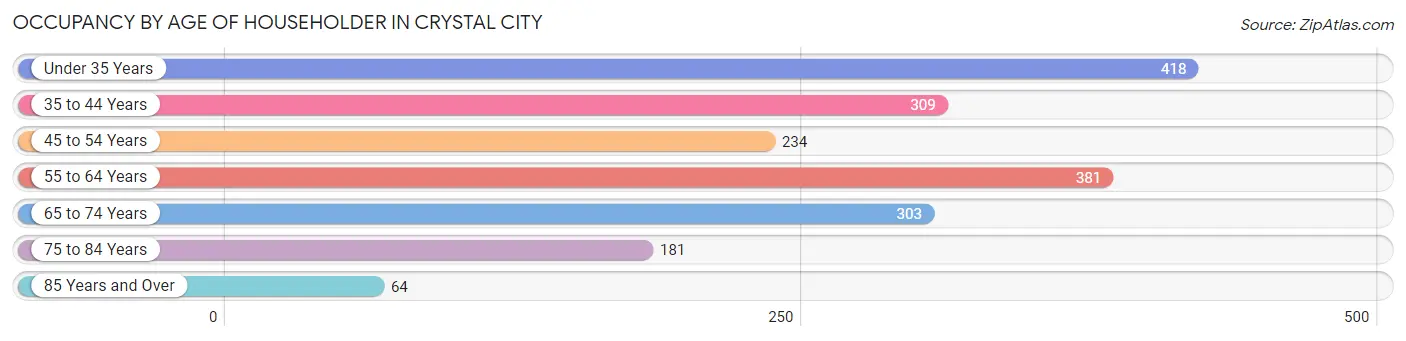
| Age Bracket | # Households | % Households |
| Under 35 Years | 418 | 22.1% |
| 35 to 44 Years | 309 | 16.4% |
| 45 to 54 Years | 234 | 12.4% |
| 55 to 64 Years | 381 | 20.2% |
| 65 to 74 Years | 303 | 16.0% |
| 75 to 84 Years | 181 | 9.6% |
| 85 Years and Over | 64 | 3.4% |
| Total | 1,890 | 100.0% |
Housing Finances in Crystal City
Median Income by Occupancy in Crystal City
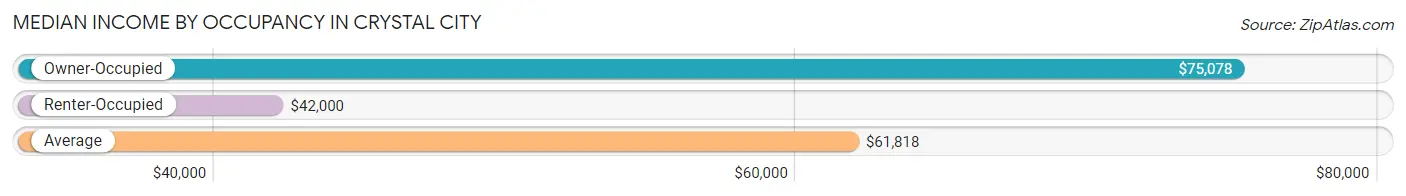
| Occupancy Type | # Households | Median Income |
| Owner-Occupied | 1,384 (73.2%) | $75,078 |
| Renter-Occupied | 506 (26.8%) | $42,000 |
| Average | 1,890 (100.0%) | $61,818 |
Occupancy by Householder Income Bracket in Crystal City
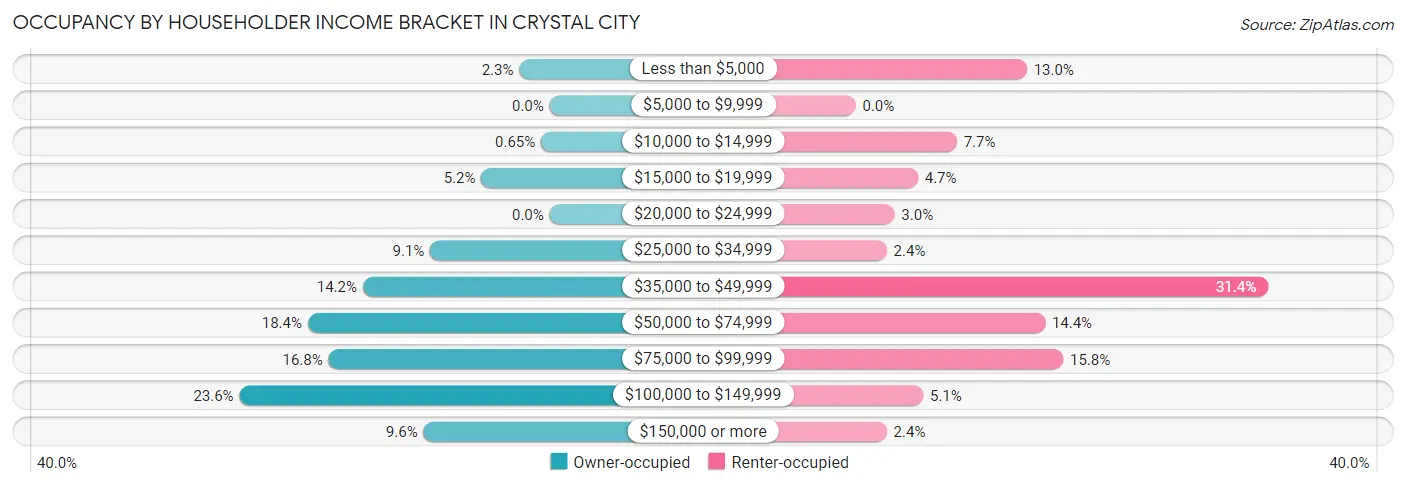
| Income Bracket | Owner-occupied | Renter-occupied |
| Less than $5,000 | 32 (2.3%) | 66 (13.0%) |
| $5,000 to $9,999 | 0 (0.0%) | 0 (0.0%) |
| $10,000 to $14,999 | 9 (0.6%) | 39 (7.7%) |
| $15,000 to $19,999 | 72 (5.2%) | 24 (4.7%) |
| $20,000 to $24,999 | 0 (0.0%) | 15 (3.0%) |
| $25,000 to $34,999 | 126 (9.1%) | 12 (2.4%) |
| $35,000 to $49,999 | 197 (14.2%) | 159 (31.4%) |
| $50,000 to $74,999 | 255 (18.4%) | 73 (14.4%) |
| $75,000 to $99,999 | 233 (16.8%) | 80 (15.8%) |
| $100,000 to $149,999 | 327 (23.6%) | 26 (5.1%) |
| $150,000 or more | 133 (9.6%) | 12 (2.4%) |
| Total | 1,384 (100.0%) | 506 (100.0%) |
Monthly Housing Cost Tiers in Crystal City
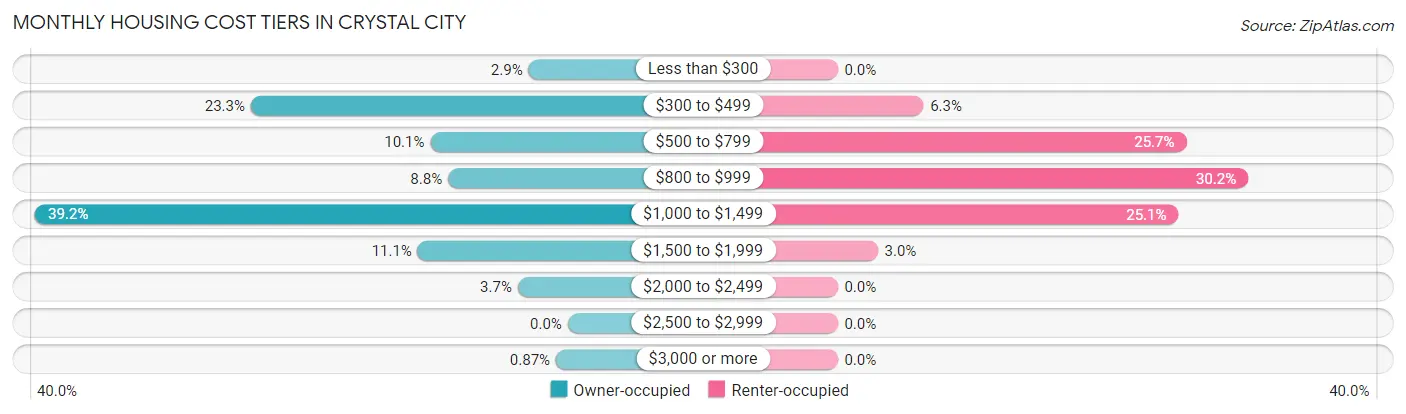
| Monthly Cost | Owner-occupied | Renter-occupied |
| Less than $300 | 40 (2.9%) | 0 (0.0%) |
| $300 to $499 | 323 (23.3%) | 32 (6.3%) |
| $500 to $799 | 140 (10.1%) | 130 (25.7%) |
| $800 to $999 | 122 (8.8%) | 153 (30.2%) |
| $1,000 to $1,499 | 543 (39.2%) | 127 (25.1%) |
| $1,500 to $1,999 | 153 (11.1%) | 15 (3.0%) |
| $2,000 to $2,499 | 51 (3.7%) | 0 (0.0%) |
| $2,500 to $2,999 | 0 (0.0%) | 0 (0.0%) |
| $3,000 or more | 12 (0.9%) | 0 (0.0%) |
| Total | 1,384 (100.0%) | 506 (100.0%) |
Physical Housing Characteristics in Crystal City
Housing Structures in Crystal City
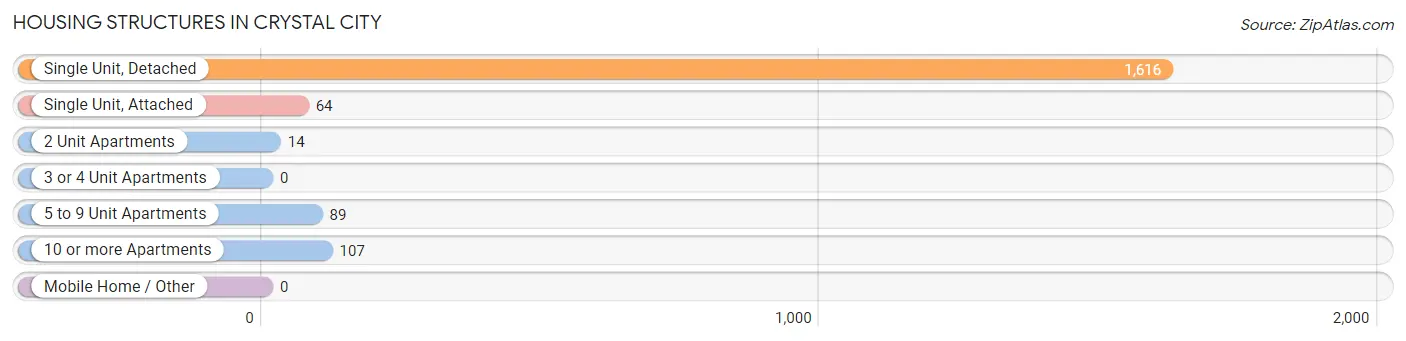
| Structure Type | # Housing Units | % Housing Units |
| Single Unit, Detached | 1,616 | 85.5% |
| Single Unit, Attached | 64 | 3.4% |
| 2 Unit Apartments | 14 | 0.7% |
| 3 or 4 Unit Apartments | 0 | 0.0% |
| 5 to 9 Unit Apartments | 89 | 4.7% |
| 10 or more Apartments | 107 | 5.7% |
| Mobile Home / Other | 0 | 0.0% |
| Total | 1,890 | 100.0% |
Housing Structures by Occupancy in Crystal City
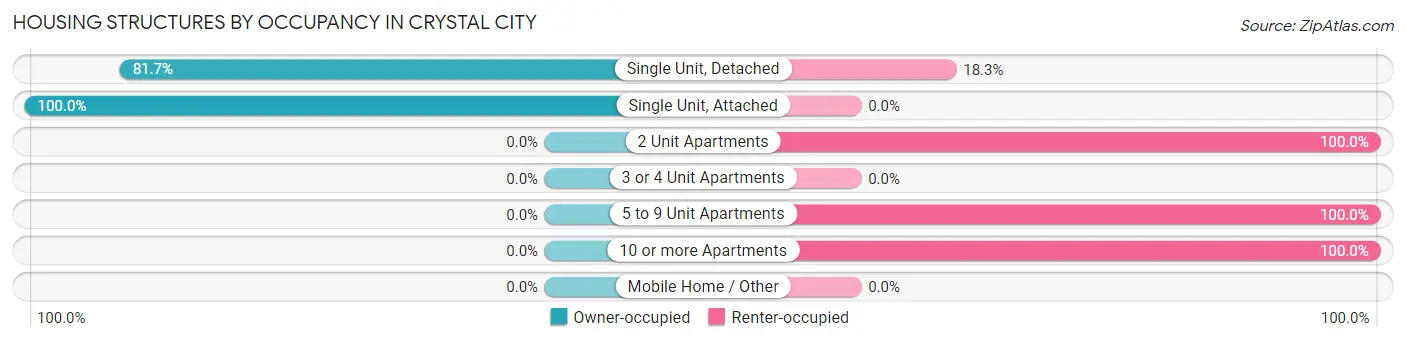
| Structure Type | Owner-occupied | Renter-occupied |
| Single Unit, Detached | 1,320 (81.7%) | 296 (18.3%) |
| Single Unit, Attached | 64 (100.0%) | 0 (0.0%) |
| 2 Unit Apartments | 0 (0.0%) | 14 (100.0%) |
| 3 or 4 Unit Apartments | 0 (0.0%) | 0 (0.0%) |
| 5 to 9 Unit Apartments | 0 (0.0%) | 89 (100.0%) |
| 10 or more Apartments | 0 (0.0%) | 107 (100.0%) |
| Mobile Home / Other | 0 (0.0%) | 0 (0.0%) |
| Total | 1,384 (73.2%) | 506 (26.8%) |
Housing Structures by Number of Rooms in Crystal City
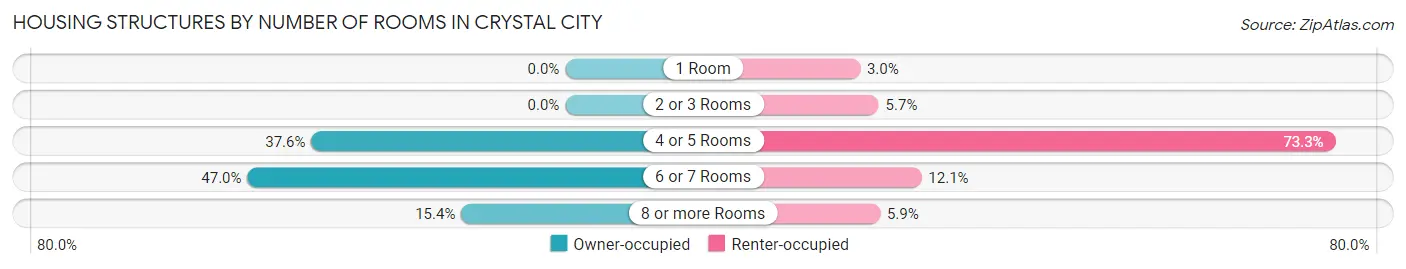
| Number of Rooms | Owner-occupied | Renter-occupied |
| 1 Room | 0 (0.0%) | 15 (3.0%) |
| 2 or 3 Rooms | 0 (0.0%) | 29 (5.7%) |
| 4 or 5 Rooms | 520 (37.6%) | 371 (73.3%) |
| 6 or 7 Rooms | 651 (47.0%) | 61 (12.1%) |
| 8 or more Rooms | 213 (15.4%) | 30 (5.9%) |
| Total | 1,384 (100.0%) | 506 (100.0%) |
Housing Structure by Heating Type in Crystal City
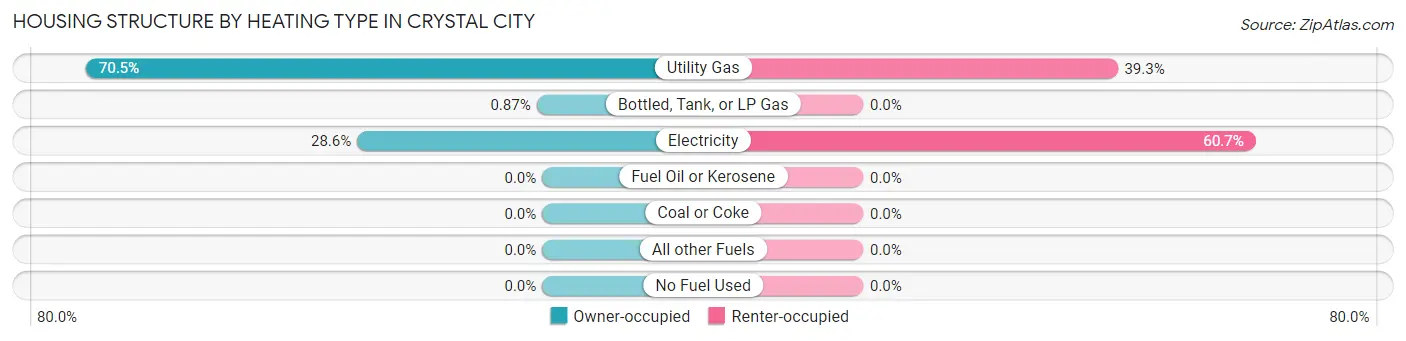
| Heating Type | Owner-occupied | Renter-occupied |
| Utility Gas | 976 (70.5%) | 199 (39.3%) |
| Bottled, Tank, or LP Gas | 12 (0.9%) | 0 (0.0%) |
| Electricity | 396 (28.6%) | 307 (60.7%) |
| Fuel Oil or Kerosene | 0 (0.0%) | 0 (0.0%) |
| Coal or Coke | 0 (0.0%) | 0 (0.0%) |
| All other Fuels | 0 (0.0%) | 0 (0.0%) |
| No Fuel Used | 0 (0.0%) | 0 (0.0%) |
| Total | 1,384 (100.0%) | 506 (100.0%) |
Household Vehicle Usage in Crystal City
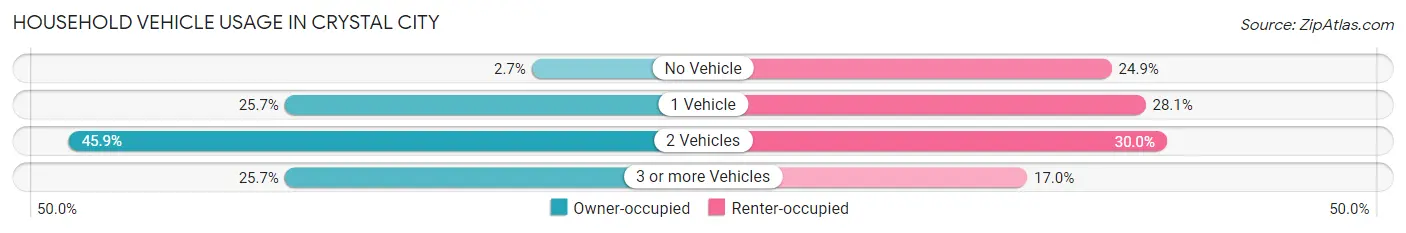
| Vehicles per Household | Owner-occupied | Renter-occupied |
| No Vehicle | 37 (2.7%) | 126 (24.9%) |
| 1 Vehicle | 356 (25.7%) | 142 (28.1%) |
| 2 Vehicles | 635 (45.9%) | 152 (30.0%) |
| 3 or more Vehicles | 356 (25.7%) | 86 (17.0%) |
| Total | 1,384 (100.0%) | 506 (100.0%) |
Real Estate & Mortgages in Crystal City
Real Estate and Mortgage Overview in Crystal City
| Characteristic | Without Mortgage | With Mortgage |
| Housing Units | 467 | 917 |
| Median Property Value | $161,200 | $172,100 |
| Median Household Income | $45,268 | $120 |
| Monthly Housing Costs | $426 | $0 |
| Real Estate Taxes | $1,284 | $0 |
Property Value by Mortgage Status in Crystal City
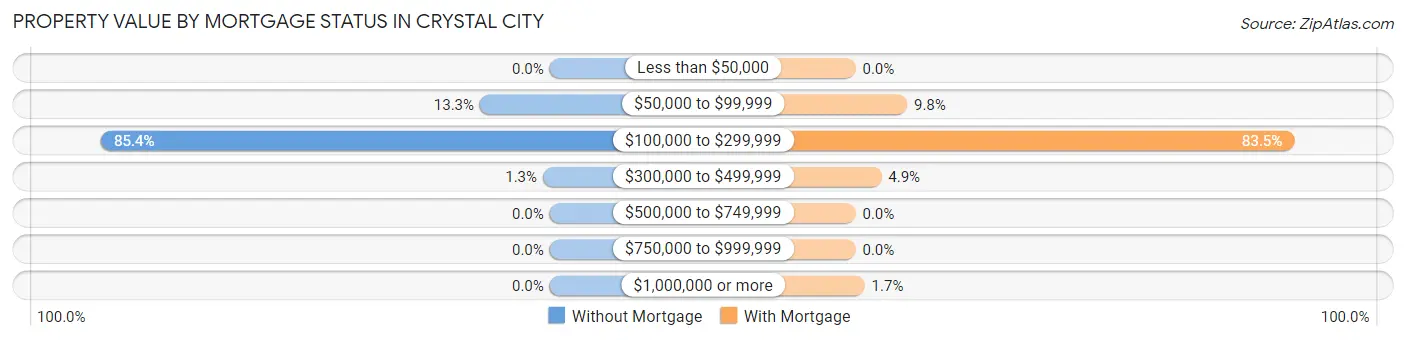
| Property Value | Without Mortgage | With Mortgage |
| Less than $50,000 | 0 (0.0%) | 0 (0.0%) |
| $50,000 to $99,999 | 62 (13.3%) | 90 (9.8%) |
| $100,000 to $299,999 | 399 (85.4%) | 766 (83.5%) |
| $300,000 to $499,999 | 6 (1.3%) | 45 (4.9%) |
| $500,000 to $749,999 | 0 (0.0%) | 0 (0.0%) |
| $750,000 to $999,999 | 0 (0.0%) | 0 (0.0%) |
| $1,000,000 or more | 0 (0.0%) | 16 (1.7%) |
| Total | 467 (100.0%) | 917 (100.0%) |
Household Income by Mortgage Status in Crystal City
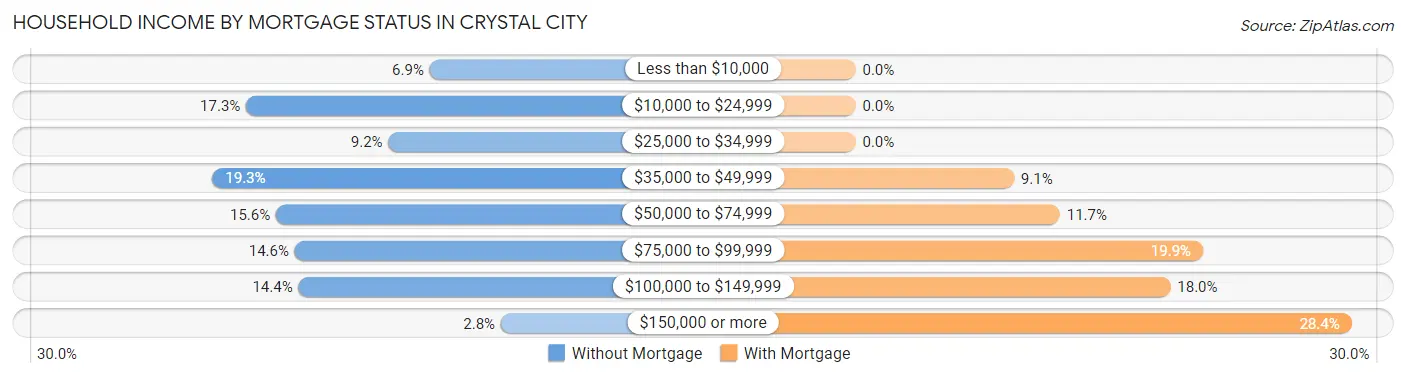
| Household Income | Without Mortgage | With Mortgage |
| Less than $10,000 | 32 (6.9%) | 0 (0.0%) |
| $10,000 to $24,999 | 81 (17.3%) | 0 (0.0%) |
| $25,000 to $34,999 | 43 (9.2%) | 0 (0.0%) |
| $35,000 to $49,999 | 90 (19.3%) | 83 (9.0%) |
| $50,000 to $74,999 | 73 (15.6%) | 107 (11.7%) |
| $75,000 to $99,999 | 68 (14.6%) | 182 (19.9%) |
| $100,000 to $149,999 | 67 (14.3%) | 165 (18.0%) |
| $150,000 or more | 13 (2.8%) | 260 (28.3%) |
| Total | 467 (100.0%) | 917 (100.0%) |
Property Value to Household Income Ratio in Crystal City
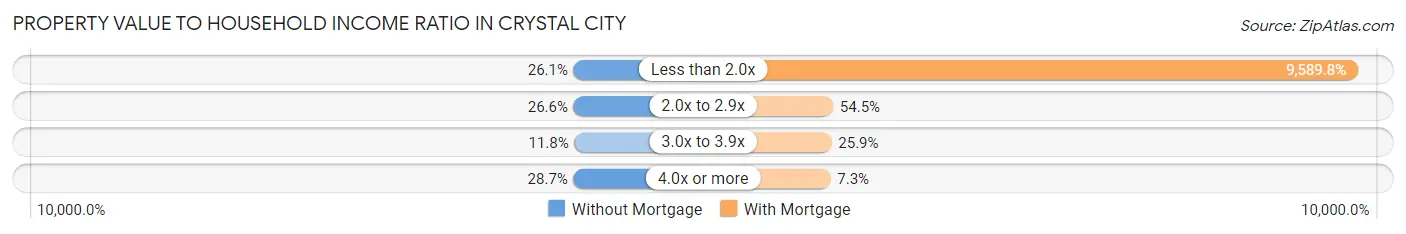
| Value-to-Income Ratio | Without Mortgage | With Mortgage |
| Less than 2.0x | 122 (26.1%) | 87,938 (9,589.7%) |
| 2.0x to 2.9x | 124 (26.6%) | 500 (54.5%) |
| 3.0x to 3.9x | 55 (11.8%) | 237 (25.9%) |
| 4.0x or more | 134 (28.7%) | 67 (7.3%) |
| Total | 467 (100.0%) | 917 (100.0%) |
Real Estate Taxes by Mortgage Status in Crystal City
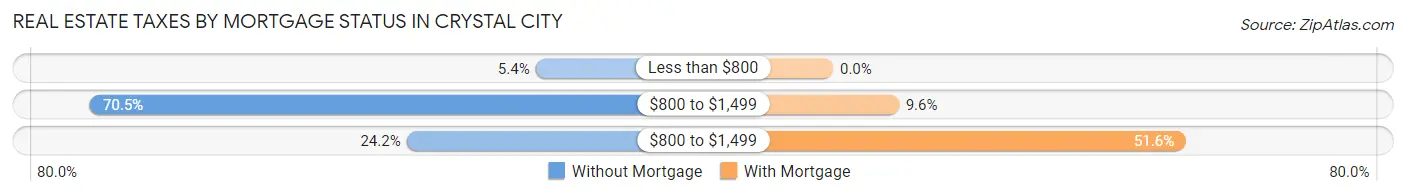
| Property Taxes | Without Mortgage | With Mortgage |
| Less than $800 | 25 (5.3%) | 0 (0.0%) |
| $800 to $1,499 | 329 (70.5%) | 88 (9.6%) |
| $800 to $1,499 | 113 (24.2%) | 473 (51.6%) |
| Total | 467 (100.0%) | 917 (100.0%) |
Health & Disability in Crystal City
Health Insurance Coverage by Age in Crystal City
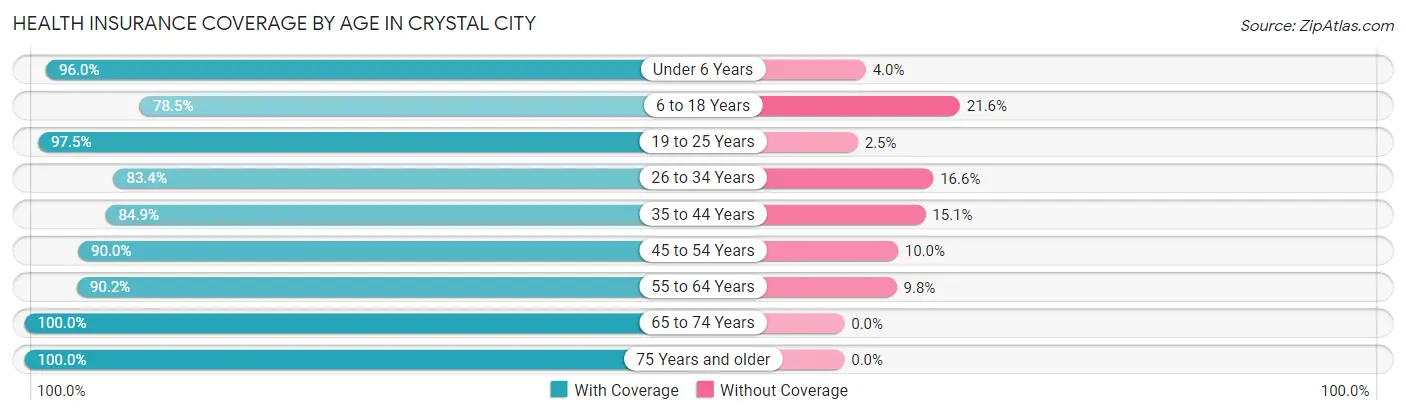
| Age Bracket | With Coverage | Without Coverage |
| Under 6 Years | 264 (96.0%) | 11 (4.0%) |
| 6 to 18 Years | 568 (78.4%) | 156 (21.5%) |
| 19 to 25 Years | 541 (97.5%) | 14 (2.5%) |
| 26 to 34 Years | 362 (83.4%) | 72 (16.6%) |
| 35 to 44 Years | 522 (84.9%) | 93 (15.1%) |
| 45 to 54 Years | 397 (90.0%) | 44 (10.0%) |
| 55 to 64 Years | 555 (90.2%) | 60 (9.8%) |
| 65 to 74 Years | 492 (100.0%) | 0 (0.0%) |
| 75 Years and older | 365 (100.0%) | 0 (0.0%) |
| Total | 4,066 (90.0%) | 450 (10.0%) |
Health Insurance Coverage by Citizenship Status in Crystal City
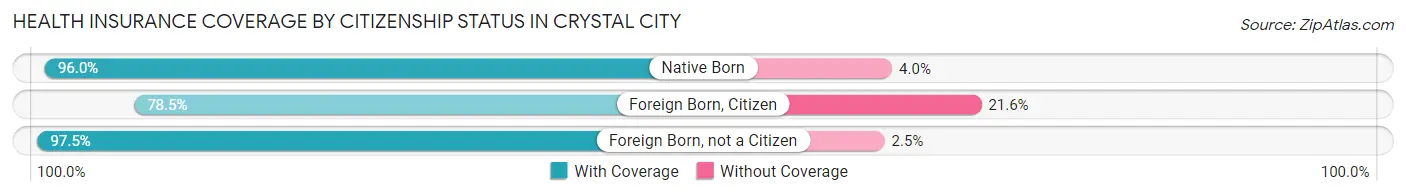
| Citizenship Status | With Coverage | Without Coverage |
| Native Born | 264 (96.0%) | 11 (4.0%) |
| Foreign Born, Citizen | 568 (78.4%) | 156 (21.5%) |
| Foreign Born, not a Citizen | 541 (97.5%) | 14 (2.5%) |
Health Insurance Coverage by Household Income in Crystal City
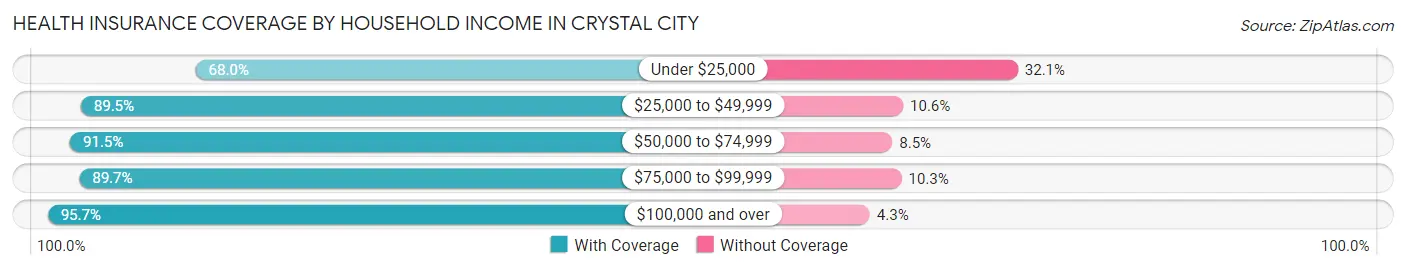
| Household Income | With Coverage | Without Coverage |
| Under $25,000 | 299 (67.9%) | 141 (32.1%) |
| $25,000 to $49,999 | 755 (89.4%) | 89 (10.5%) |
| $50,000 to $74,999 | 654 (91.5%) | 61 (8.5%) |
| $75,000 to $99,999 | 787 (89.7%) | 90 (10.3%) |
| $100,000 and over | 1,525 (95.7%) | 69 (4.3%) |
Public vs Private Health Insurance Coverage by Age in Crystal City
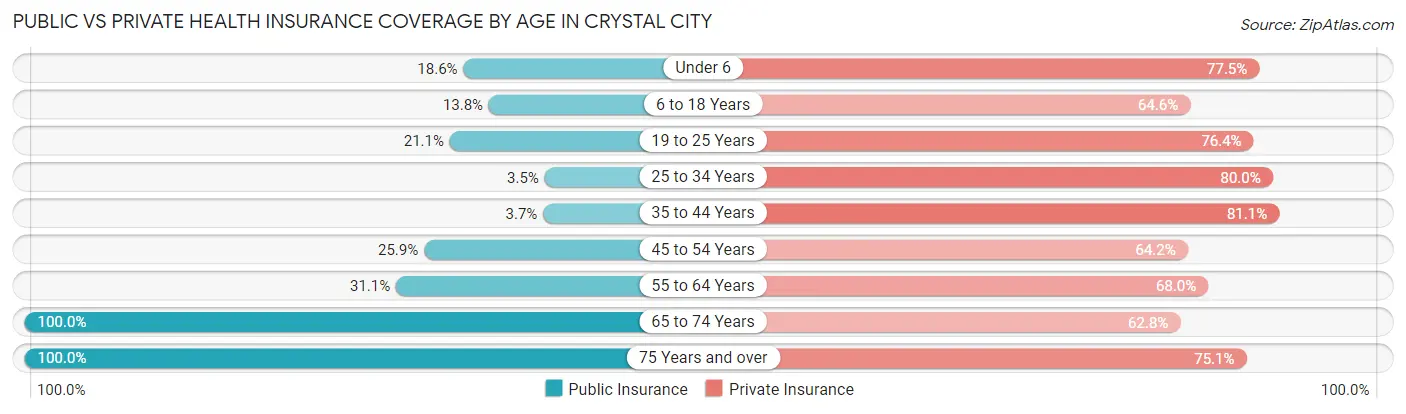
| Age Bracket | Public Insurance | Private Insurance |
| Under 6 | 51 (18.5%) | 213 (77.4%) |
| 6 to 18 Years | 100 (13.8%) | 468 (64.6%) |
| 19 to 25 Years | 117 (21.1%) | 424 (76.4%) |
| 25 to 34 Years | 15 (3.5%) | 347 (79.9%) |
| 35 to 44 Years | 23 (3.7%) | 499 (81.1%) |
| 45 to 54 Years | 114 (25.9%) | 283 (64.2%) |
| 55 to 64 Years | 191 (31.1%) | 418 (68.0%) |
| 65 to 74 Years | 492 (100.0%) | 309 (62.8%) |
| 75 Years and over | 365 (100.0%) | 274 (75.1%) |
| Total | 1,468 (32.5%) | 3,235 (71.6%) |
Disability Status by Sex by Age in Crystal City
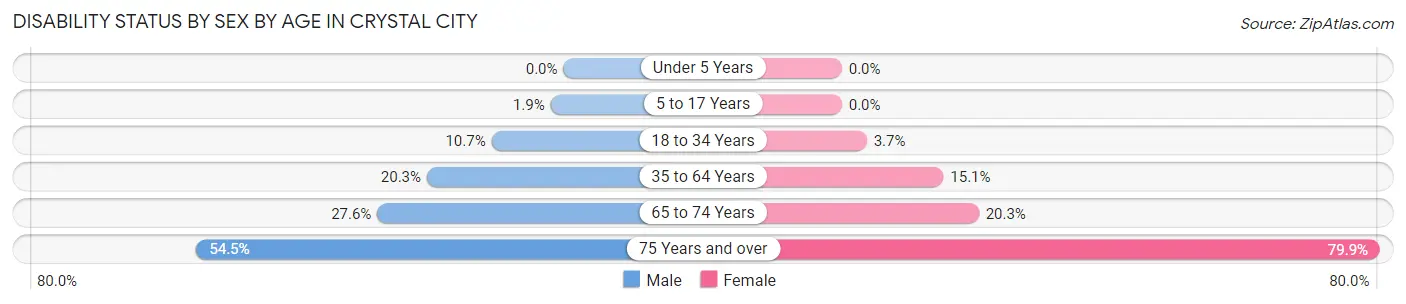
| Age Bracket | Male | Female |
| Under 5 Years | 0 (0.0%) | 0 (0.0%) |
| 5 to 17 Years | 8 (1.9%) | 0 (0.0%) |
| 18 to 34 Years | 54 (10.7%) | 20 (3.7%) |
| 35 to 64 Years | 164 (20.3%) | 130 (15.1%) |
| 65 to 74 Years | 68 (27.6%) | 50 (20.3%) |
| 75 Years and over | 85 (54.5%) | 167 (79.9%) |
Disability Class by Sex by Age in Crystal City
Disability Class: Hearing Difficulty
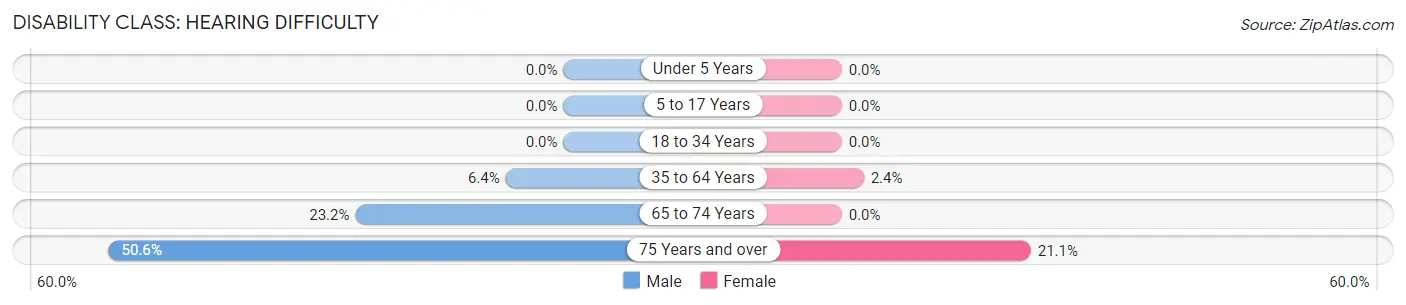
| Age Bracket | Male | Female |
| Under 5 Years | 0 (0.0%) | 0 (0.0%) |
| 5 to 17 Years | 0 (0.0%) | 0 (0.0%) |
| 18 to 34 Years | 0 (0.0%) | 0 (0.0%) |
| 35 to 64 Years | 52 (6.4%) | 21 (2.4%) |
| 65 to 74 Years | 57 (23.2%) | 0 (0.0%) |
| 75 Years and over | 79 (50.6%) | 44 (21.0%) |
Disability Class: Vision Difficulty
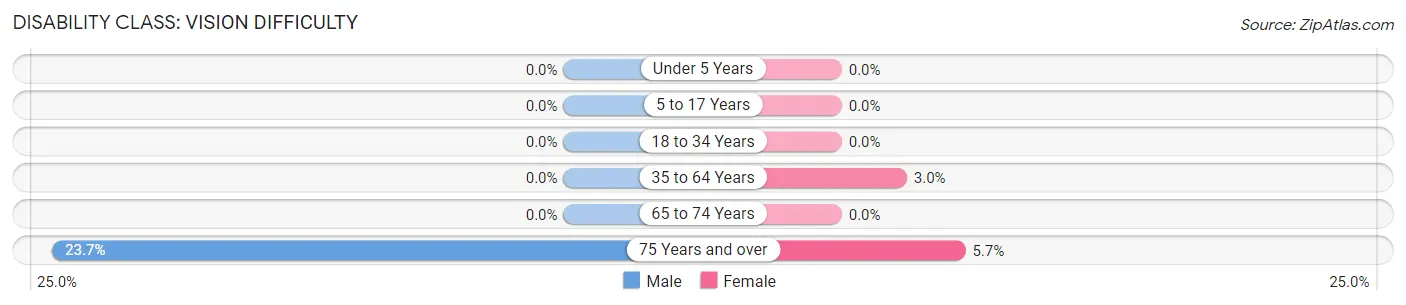
| Age Bracket | Male | Female |
| Under 5 Years | 0 (0.0%) | 0 (0.0%) |
| 5 to 17 Years | 0 (0.0%) | 0 (0.0%) |
| 18 to 34 Years | 0 (0.0%) | 0 (0.0%) |
| 35 to 64 Years | 0 (0.0%) | 26 (3.0%) |
| 65 to 74 Years | 0 (0.0%) | 0 (0.0%) |
| 75 Years and over | 37 (23.7%) | 12 (5.7%) |
Disability Class: Cognitive Difficulty
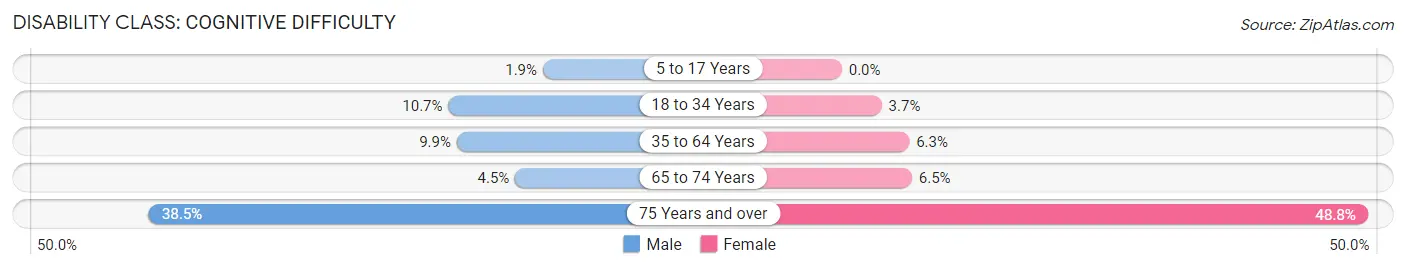
| Age Bracket | Male | Female |
| 5 to 17 Years | 8 (1.9%) | 0 (0.0%) |
| 18 to 34 Years | 54 (10.7%) | 20 (3.7%) |
| 35 to 64 Years | 80 (9.9%) | 54 (6.3%) |
| 65 to 74 Years | 11 (4.5%) | 16 (6.5%) |
| 75 Years and over | 60 (38.5%) | 102 (48.8%) |
Disability Class: Ambulatory Difficulty
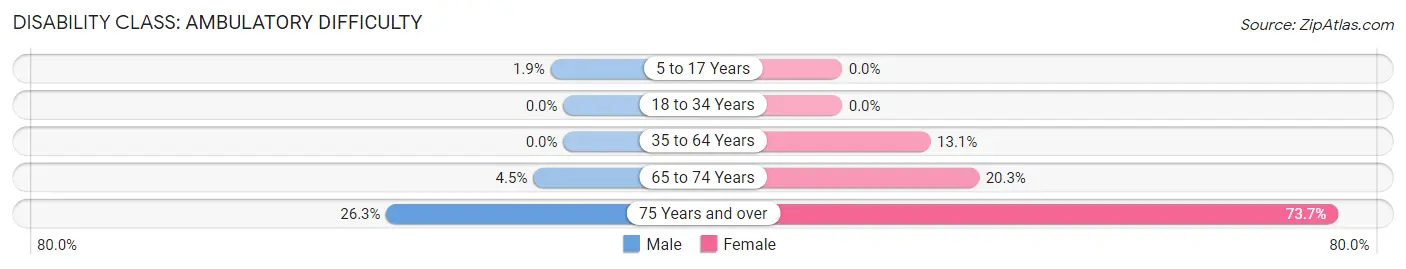
| Age Bracket | Male | Female |
| 5 to 17 Years | 8 (1.9%) | 0 (0.0%) |
| 18 to 34 Years | 0 (0.0%) | 0 (0.0%) |
| 35 to 64 Years | 0 (0.0%) | 113 (13.1%) |
| 65 to 74 Years | 11 (4.5%) | 50 (20.3%) |
| 75 Years and over | 41 (26.3%) | 154 (73.7%) |
Disability Class: Self-Care Difficulty
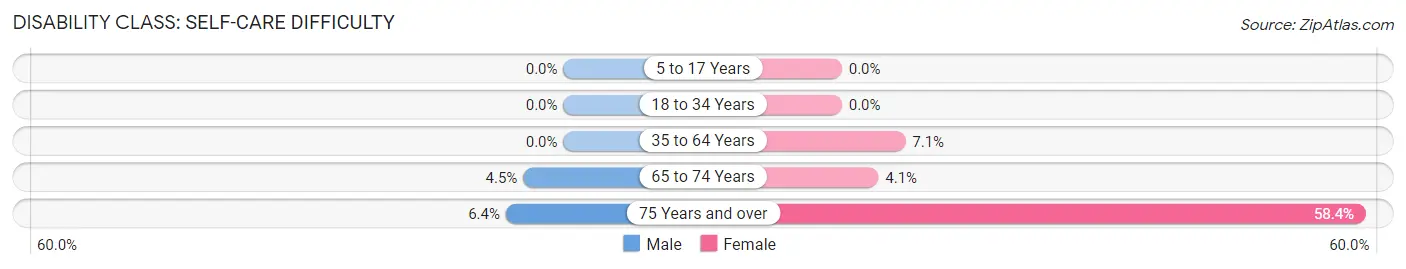
| Age Bracket | Male | Female |
| 5 to 17 Years | 0 (0.0%) | 0 (0.0%) |
| 18 to 34 Years | 0 (0.0%) | 0 (0.0%) |
| 35 to 64 Years | 0 (0.0%) | 61 (7.1%) |
| 65 to 74 Years | 11 (4.5%) | 10 (4.1%) |
| 75 Years and over | 10 (6.4%) | 122 (58.4%) |
Technology Access in Crystal City
Computing Device Access in Crystal City
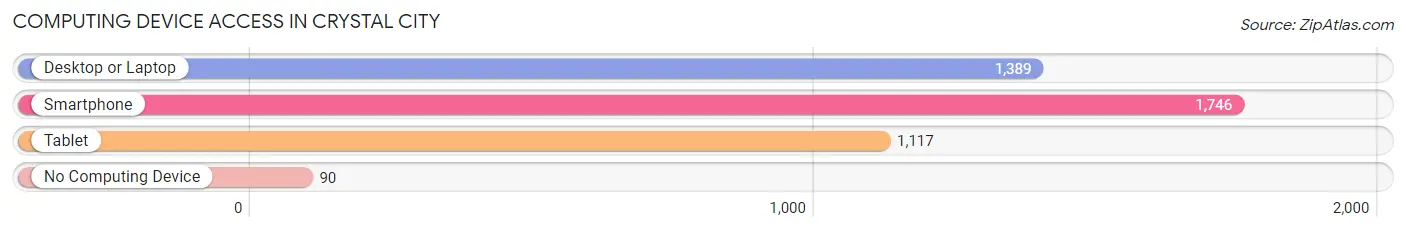
| Device Type | # Households | % Households |
| Desktop or Laptop | 1,389 | 73.5% |
| Smartphone | 1,746 | 92.4% |
| Tablet | 1,117 | 59.1% |
| No Computing Device | 90 | 4.8% |
| Total | 1,890 | 100.0% |
Internet Access in Crystal City
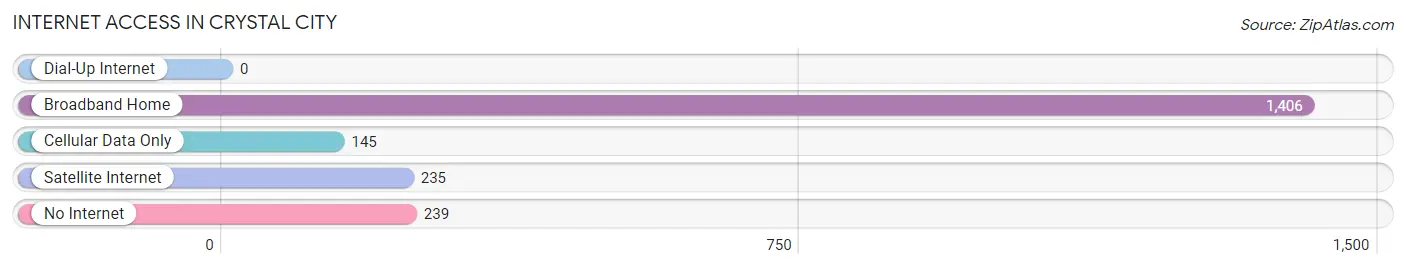
| Internet Type | # Households | % Households |
| Dial-Up Internet | 0 | 0.0% |
| Broadband Home | 1,406 | 74.4% |
| Cellular Data Only | 145 | 7.7% |
| Satellite Internet | 235 | 12.4% |
| No Internet | 239 | 12.7% |
| Total | 1,890 | 100.0% |
Crystal City Summary
City History
The city of Crystal City, Missouri is located in Jefferson County, Missouri, and is part of the St. Louis metropolitan area. The city was founded in 1876 by German immigrants who were looking for a place to settle and start a new life. The city was named after the crystal clear waters of the nearby Meramec River.
The city was originally a farming community, but in the early 1900s, the city began to grow and develop. The city was home to several factories, including a glass factory, a brick factory, and a shoe factory. The city also had a thriving business district, with several stores, restaurants, and other businesses.
In the 1950s, the city began to experience a population boom, as many people moved to the city from other parts of the country. This growth continued into the 1960s and 1970s, and the city became a popular destination for tourists and visitors.
The city has continued to grow and develop over the years, and today it is home to a population of over 8,000 people. The city is home to several parks, a golf course, and a variety of other attractions.
Geography
Crystal City is located in the southeastern corner of Jefferson County, Missouri. The city is situated on the banks of the Meramec River, and is surrounded by rolling hills and wooded areas. The city is located approximately 25 miles south of St. Louis, and is part of the St. Louis metropolitan area.
The city has a total area of 4.2 square miles, all of which is land. The city has a humid continental climate, with hot, humid summers and cold, snowy winters.
Economy
The economy of Crystal City is largely based on manufacturing and tourism. The city is home to several factories, including a glass factory, a brick factory, and a shoe factory. The city also has a thriving business district, with several stores, restaurants, and other businesses.
The city is also a popular tourist destination, with several attractions, including a golf course, a water park, and a variety of other attractions. The city is also home to several festivals and events throughout the year, including the annual Crystal City Festival and the Crystal City Car Show.
Demographics
As of the 2010 census, the population of Crystal City was 8,072. The population is made up of a diverse mix of people, with the largest ethnic group being White (77.3%), followed by African American (14.2%), Hispanic (3.7%), and Asian (2.2%).
The median household income in Crystal City is $45,845, and the median home value is $128,400. The city has a poverty rate of 11.3%, and the unemployment rate is 4.2%.
Conclusion
Crystal City, Missouri is a small city located in Jefferson County, Missouri. The city was founded in 1876 by German immigrants, and has since grown and developed into a thriving city. The city is home to a population of over 8,000 people, and is a popular destination for tourists and visitors. The city has a diverse economy, with manufacturing and tourism being the two main industries. The city also has a diverse population, with the largest ethnic group being White. The city has a median household income of $45,845, and a median home value of $128,400.
Common Questions
What is Per Capita Income in Crystal City?
Per Capita income in Crystal City is $31,124.
What is the Median Family Income in Crystal City?
Median Family Income in Crystal City is $79,128.
What is the Median Household income in Crystal City?
Median Household Income in Crystal City is $61,818.
What is Income or Wage Gap in Crystal City?
Income or Wage Gap in Crystal City is 31.3%.
Women in Crystal City earn 68.7 cents for every dollar earned by a man.
What is Inequality or Gini Index in Crystal City?
Inequality or Gini Index in Crystal City is 0.38.
What is the Total Population of Crystal City?
Total Population of Crystal City is 4,721.
What is the Total Male Population of Crystal City?
Total Male Population of Crystal City is 2,314.
What is the Total Female Population of Crystal City?
Total Female Population of Crystal City is 2,407.
What is the Ratio of Males per 100 Females in Crystal City?
There are 96.14 Males per 100 Females in Crystal City.
What is the Ratio of Females per 100 Males in Crystal City?
There are 104.02 Females per 100 Males in Crystal City.
What is the Median Population Age in Crystal City?
Median Population Age in Crystal City is 41.2 Years.
What is the Average Family Size in Crystal City
Average Family Size in Crystal City is 3.0 People.
What is the Average Household Size in Crystal City
Average Household Size in Crystal City is 2.4 People.
How Large is the Labor Force in Crystal City?
There are 2,391 People in the Labor Forcein in Crystal City.
What is the Percentage of People in the Labor Force in Crystal City?
60.7% of People are in the Labor Force in Crystal City.
What is the Unemployment Rate in Crystal City?
Unemployment Rate in Crystal City is 5.3%.