Clever, MO Map & Demographics
Clever Map
Clever Overview
$26,883
PER CAPITA INCOME
$77,594
AVG FAMILY INCOME
$73,583
AVG HOUSEHOLD INCOME
30.7%
WAGE / INCOME GAP [ % ]
69.3¢/ $1
WAGE / INCOME GAP [ $ ]
0.30
INEQUALITY / GINI INDEX
2,926
TOTAL POPULATION
1,399
MALE POPULATION
1,527
FEMALE POPULATION
91.62
MALES / 100 FEMALES
109.15
FEMALES / 100 MALES
31.3
MEDIAN AGE
3.3
AVG FAMILY SIZE
2.9
AVG HOUSEHOLD SIZE
1,578
LABOR FORCE [ PEOPLE ]
72.3%
PERCENT IN LABOR FORCE
1.9%
UNEMPLOYMENT RATE
Clever Zip Codes
Clever Area Codes
Income in Clever
Income Overview in Clever
Per Capita Income in Clever is $26,883, while median incomes of families and households are $77,594 and $73,583 respectively.
| Characteristic | Number | Measure |
| Per Capita Income | 2,926 | $26,883 |
| Median Family Income | 777 | $77,594 |
| Mean Family Income | 777 | $80,644 |
| Median Household Income | 1,024 | $73,583 |
| Mean Household Income | 1,024 | $75,227 |
| Income Deficit | 777 | $0 |
| Wage / Income Gap (%) | 2,926 | 30.75% |
| Wage / Income Gap ($) | 2,926 | 69.25¢ per $1 |
| Gini / Inequality Index | 2,926 | 0.30 |
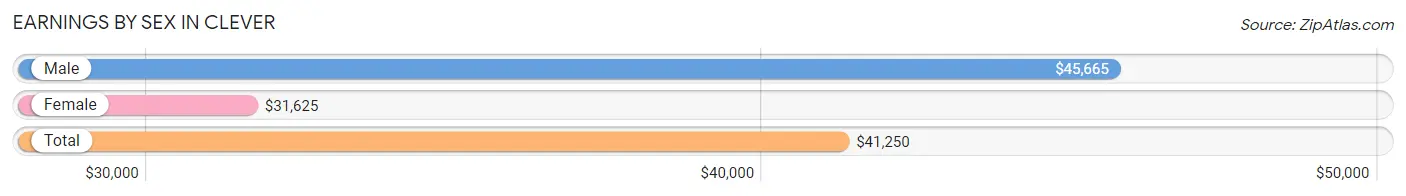
Earnings by Sex in Clever
Average Earnings in Clever are $41,250, $45,665 for men and $31,625 for women, a difference of 30.7%.
| Sex | Number | Average Earnings |
| Male | 894 (53.6%) | $45,665 |
| Female | 774 (46.4%) | $31,625 |
| Total | 1,668 (100.0%) | $41,250 |
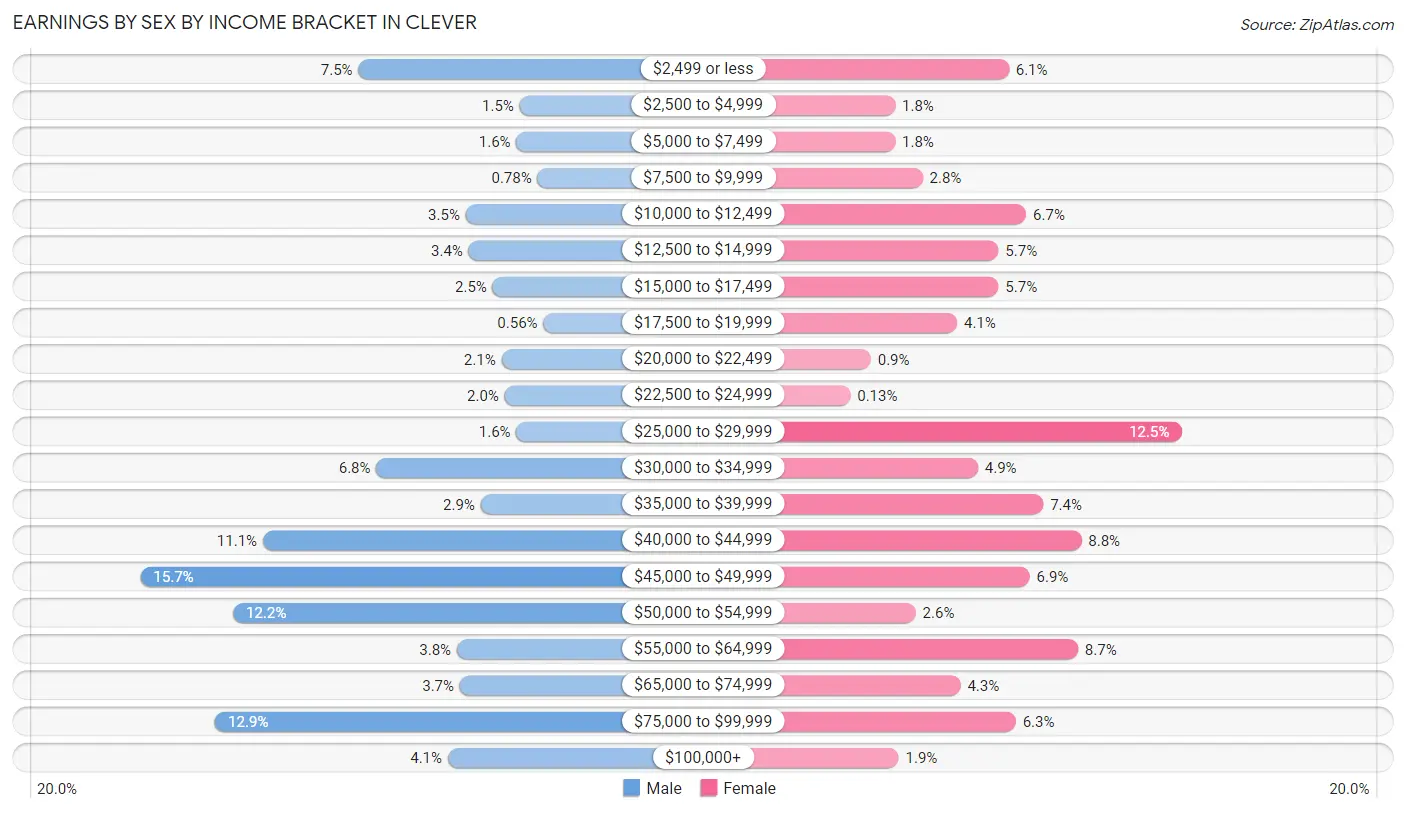
Earnings by Sex by Income Bracket in Clever
The most common earnings brackets in Clever are $45,000 to $49,999 for men (140 | 15.7%) and $25,000 to $29,999 for women (97 | 12.5%).
| Income | Male | Female |
| $2,499 or less | 67 (7.5%) | 47 (6.1%) |
| $2,500 to $4,999 | 13 (1.5%) | 14 (1.8%) |
| $5,000 to $7,499 | 14 (1.6%) | 14 (1.8%) |
| $7,500 to $9,999 | 7 (0.8%) | 22 (2.8%) |
| $10,000 to $12,499 | 31 (3.5%) | 52 (6.7%) |
| $12,500 to $14,999 | 30 (3.4%) | 44 (5.7%) |
| $15,000 to $17,499 | 22 (2.5%) | 44 (5.7%) |
| $17,500 to $19,999 | 5 (0.6%) | 32 (4.1%) |
| $20,000 to $22,499 | 19 (2.1%) | 7 (0.9%) |
| $22,500 to $24,999 | 18 (2.0%) | 1 (0.1%) |
| $25,000 to $29,999 | 14 (1.6%) | 97 (12.5%) |
| $30,000 to $34,999 | 61 (6.8%) | 38 (4.9%) |
| $35,000 to $39,999 | 26 (2.9%) | 57 (7.4%) |
| $40,000 to $44,999 | 99 (11.1%) | 68 (8.8%) |
| $45,000 to $49,999 | 140 (15.7%) | 53 (6.9%) |
| $50,000 to $54,999 | 109 (12.2%) | 20 (2.6%) |
| $55,000 to $64,999 | 34 (3.8%) | 67 (8.7%) |
| $65,000 to $74,999 | 33 (3.7%) | 33 (4.3%) |
| $75,000 to $99,999 | 115 (12.9%) | 49 (6.3%) |
| $100,000+ | 37 (4.1%) | 15 (1.9%) |
| Total | 894 (100.0%) | 774 (100.0%) |
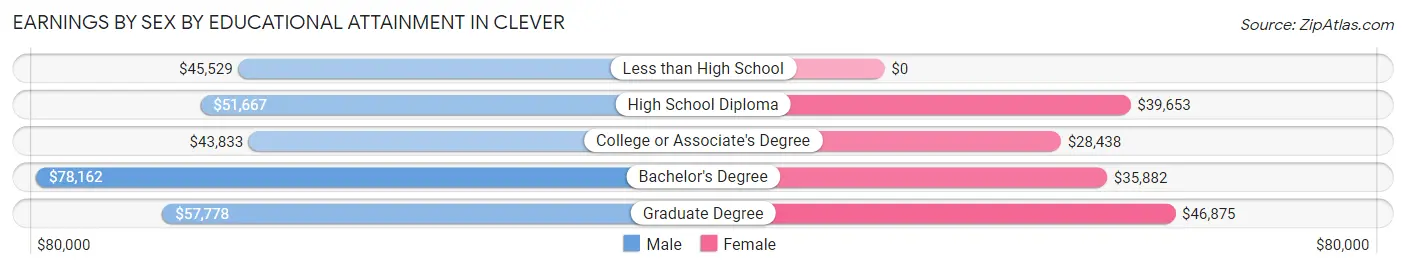
Earnings by Sex by Educational Attainment in Clever
Average earnings in Clever are $47,120 for men and $36,314 for women, a difference of 22.9%. Men with an educational attainment of bachelor's degree enjoy the highest average annual earnings of $78,162, while those with college or associate's degree education earn the least with $43,833. Women with an educational attainment of graduate degree earn the most with the average annual earnings of $46,875, while those with college or associate's degree education have the smallest earnings of $28,438.
| Educational Attainment | Male Income | Female Income |
| Less than High School | $45,529 | $0 |
| High School Diploma | $51,667 | $39,653 |
| College or Associate's Degree | $43,833 | $28,438 |
| Bachelor's Degree | $78,162 | $35,882 |
| Graduate Degree | $57,778 | $46,875 |
| Total | $47,120 | $36,314 |
Family Income in Clever
Family Income Brackets in Clever
According to the Clever family income data, there are 218 families falling into the $50,000 to $74,999 income range, which is the most common income bracket and makes up 28.1% of all families. Conversely, the $200,000+ income bracket is the least frequent group with only 8 families (1.0%) belonging to this category.
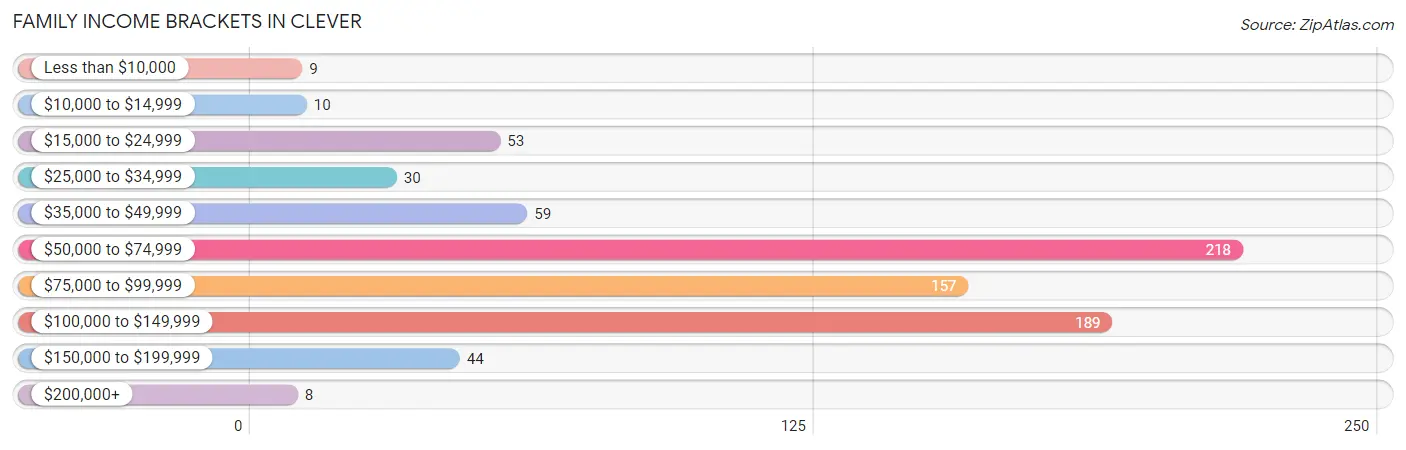
| Income Bracket | # Families | % Families |
| Less than $10,000 | 9 | 1.2% |
| $10,000 to $14,999 | 10 | 1.3% |
| $15,000 to $24,999 | 53 | 6.8% |
| $25,000 to $34,999 | 30 | 3.9% |
| $35,000 to $49,999 | 59 | 7.6% |
| $50,000 to $74,999 | 218 | 28.1% |
| $75,000 to $99,999 | 157 | 20.2% |
| $100,000 to $149,999 | 189 | 24.3% |
| $150,000 to $199,999 | 44 | 5.7% |
| $200,000+ | 8 | 1.0% |
Family Income by Famaliy Size in Clever
3-person families (160 | 20.6%) account for the highest median family income in Clever with $88,500 per family, while 2-person families (281 | 36.2%) have the highest median income of $32,188 per family member.
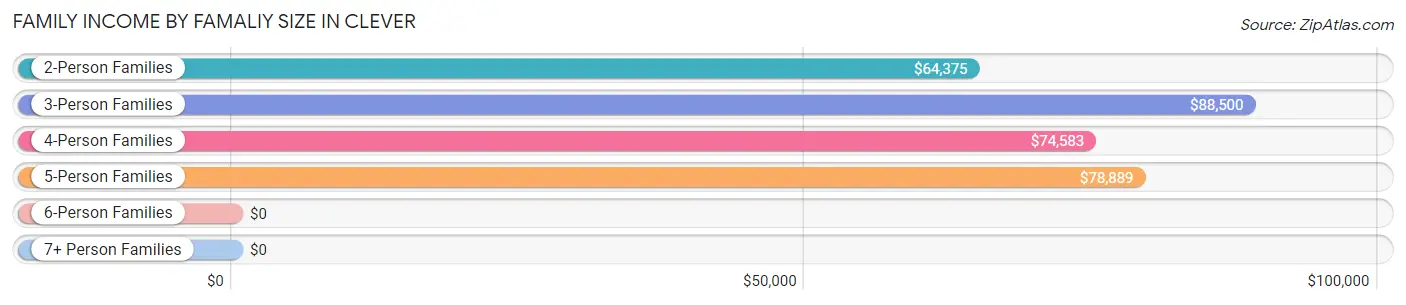
| Income Bracket | # Families | Median Income |
| 2-Person Families | 281 (36.2%) | $64,375 |
| 3-Person Families | 160 (20.6%) | $88,500 |
| 4-Person Families | 219 (28.2%) | $74,583 |
| 5-Person Families | 70 (9.0%) | $78,889 |
| 6-Person Families | 38 (4.9%) | $0 |
| 7+ Person Families | 9 (1.2%) | $0 |
| Total | 777 (100.0%) | $77,594 |
Family Income by Number of Earners in Clever
The median family income in Clever is $77,594, with families comprising 3+ earners (101) having the highest median family income of $117,375, while families with no earners (73) have the lowest median family income of $24,485, accounting for 13.0% and 9.4% of families, respectively.

| Number of Earners | # Families | Median Income |
| No Earners | 73 (9.4%) | $24,485 |
| 1 Earner | 187 (24.1%) | $54,055 |
| 2 Earners | 416 (53.5%) | $85,600 |
| 3+ Earners | 101 (13.0%) | $117,375 |
| Total | 777 (100.0%) | $77,594 |
Household Income in Clever
Household Income Brackets in Clever
With 233 households falling in the category, the $50,000 to $74,999 income range is the most frequent in Clever, accounting for 22.8% of all households. In contrast, only 7 households (0.7%) fall into the less than $10,000 income bracket, making it the least populous group.
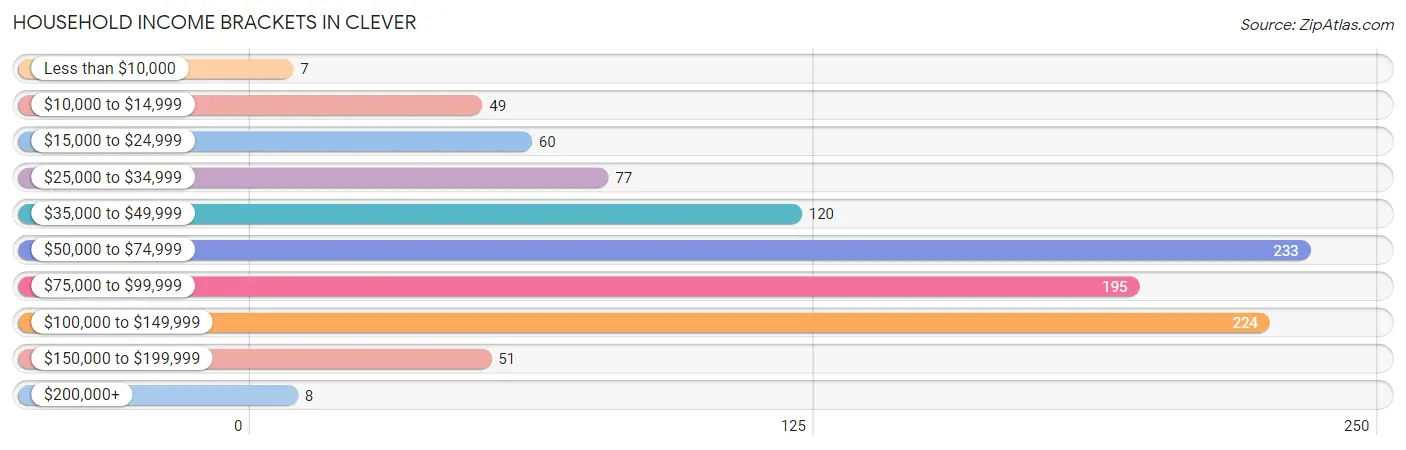
| Income Bracket | # Households | % Households |
| Less than $10,000 | 7 | 0.7% |
| $10,000 to $14,999 | 49 | 4.8% |
| $15,000 to $24,999 | 60 | 5.9% |
| $25,000 to $34,999 | 77 | 7.5% |
| $35,000 to $49,999 | 120 | 11.7% |
| $50,000 to $74,999 | 233 | 22.8% |
| $75,000 to $99,999 | 195 | 19.0% |
| $100,000 to $149,999 | 224 | 21.9% |
| $150,000 to $199,999 | 51 | 5.0% |
| $200,000+ | 8 | 0.8% |
Household Income by Householder Age in Clever
The median household income in Clever is $73,583, with the highest median household income of $87,813 found in the 15 to 24 years age bracket for the primary householder. A total of 44 households (4.3%) fall into this category. Meanwhile, the 65+ years age bracket for the primary householder has the lowest median household income of $33,125, with 175 households (17.1%) in this group.
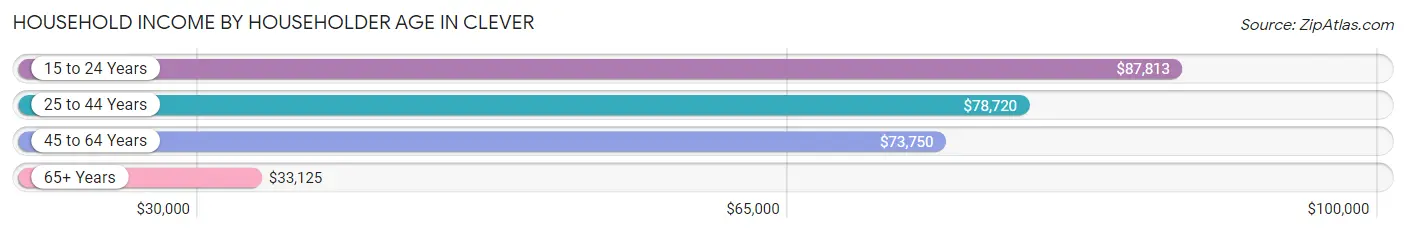
| Income Bracket | # Households | Median Income |
| 15 to 24 Years | 44 (4.3%) | $87,813 |
| 25 to 44 Years | 555 (54.2%) | $78,720 |
| 45 to 64 Years | 250 (24.4%) | $73,750 |
| 65+ Years | 175 (17.1%) | $33,125 |
| Total | 1,024 (100.0%) | $73,583 |
Poverty in Clever
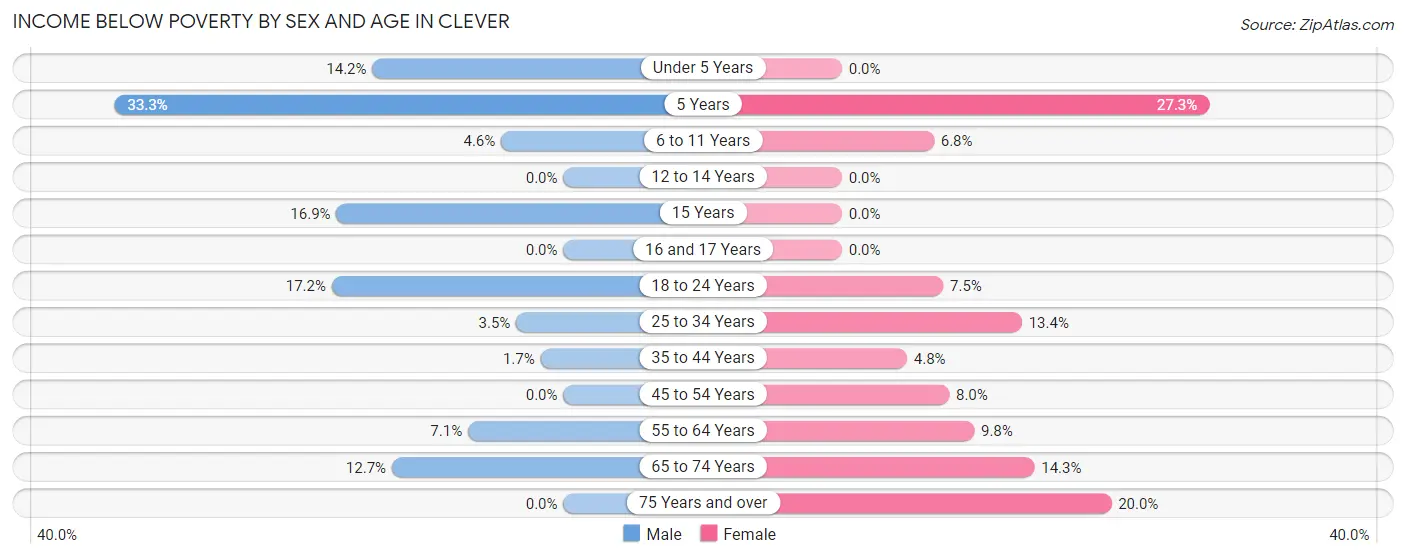
Income Below Poverty by Sex and Age in Clever
With 6.2% poverty level for males and 8.1% for females among the residents of Clever, 5 year old males and 5 year old females are the most vulnerable to poverty, with 5 males (33.3%) and 6 females (27.3%) in their respective age groups living below the poverty level.
| Age Bracket | Male | Female |
| Under 5 Years | 20 (14.2%) | 0 (0.0%) |
| 5 Years | 5 (33.3%) | 6 (27.3%) |
| 6 to 11 Years | 6 (4.6%) | 11 (6.8%) |
| 12 to 14 Years | 0 (0.0%) | 0 (0.0%) |
| 15 Years | 15 (16.9%) | 0 (0.0%) |
| 16 and 17 Years | 0 (0.0%) | 0 (0.0%) |
| 18 to 24 Years | 11 (17.2%) | 10 (7.5%) |
| 25 to 34 Years | 11 (3.5%) | 37 (13.4%) |
| 35 to 44 Years | 4 (1.7%) | 14 (4.8%) |
| 45 to 54 Years | 0 (0.0%) | 9 (8.0%) |
| 55 to 64 Years | 8 (7.1%) | 11 (9.8%) |
| 65 to 74 Years | 7 (12.7%) | 10 (14.3%) |
| 75 Years and over | 0 (0.0%) | 16 (20.0%) |
| Total | 87 (6.2%) | 124 (8.1%) |
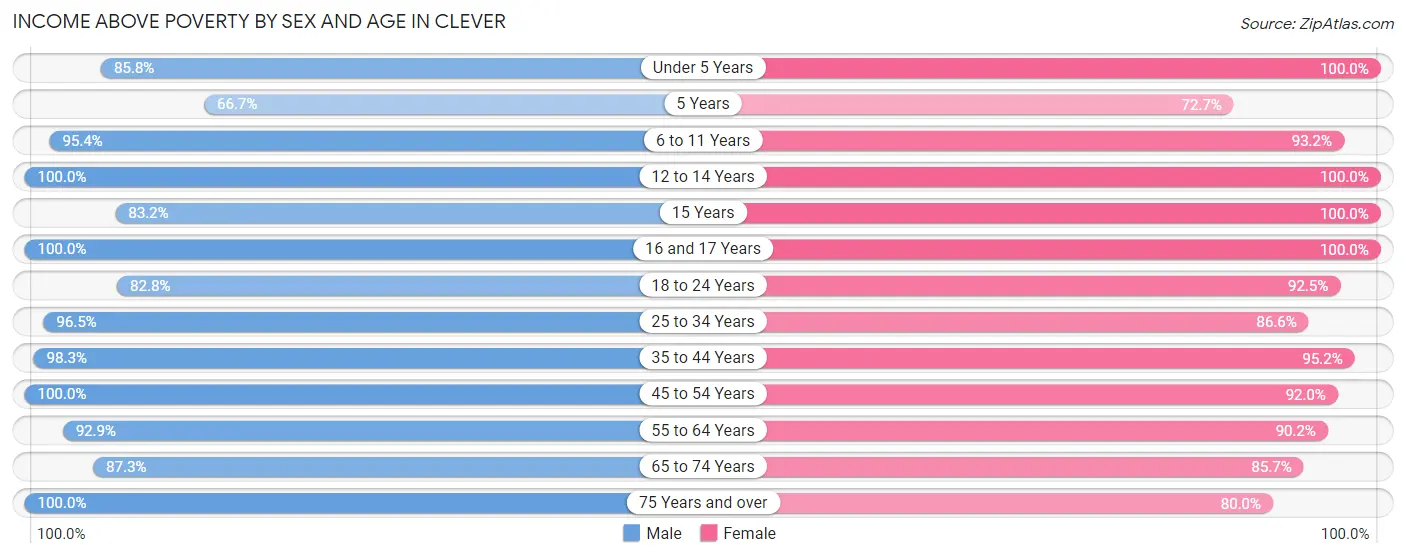
Income Above Poverty by Sex and Age in Clever
According to the poverty statistics in Clever, males aged 12 to 14 years and females aged under 5 years are the age groups that are most secure financially, with 100.0% of males and 100.0% of females in these age groups living above the poverty line.
| Age Bracket | Male | Female |
| Under 5 Years | 121 (85.8%) | 116 (100.0%) |
| 5 Years | 10 (66.7%) | 16 (72.7%) |
| 6 to 11 Years | 124 (95.4%) | 150 (93.2%) |
| 12 to 14 Years | 14 (100.0%) | 30 (100.0%) |
| 15 Years | 74 (83.2%) | 17 (100.0%) |
| 16 and 17 Years | 49 (100.0%) | 104 (100.0%) |
| 18 to 24 Years | 53 (82.8%) | 123 (92.5%) |
| 25 to 34 Years | 303 (96.5%) | 240 (86.6%) |
| 35 to 44 Years | 233 (98.3%) | 276 (95.2%) |
| 45 to 54 Years | 132 (100.0%) | 104 (92.0%) |
| 55 to 64 Years | 105 (92.9%) | 101 (90.2%) |
| 65 to 74 Years | 48 (87.3%) | 60 (85.7%) |
| 75 Years and over | 39 (100.0%) | 64 (80.0%) |
| Total | 1,305 (93.8%) | 1,401 (91.9%) |
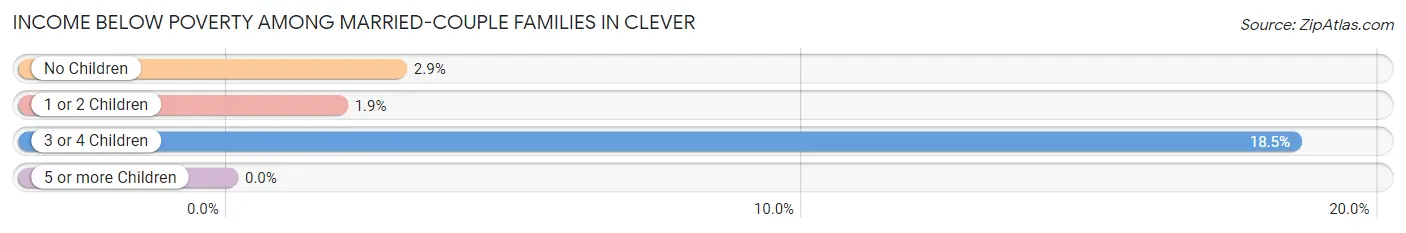
Income Below Poverty Among Married-Couple Families in Clever
The poverty statistics for married-couple families in Clever show that 4.4% or 28 of the total 633 families live below the poverty line. Families with 3 or 4 children have the highest poverty rate of 18.5%, comprising of 15 families. On the other hand, families with 1 or 2 children have the lowest poverty rate of 1.9%, which includes 6 families.
| Children | Above Poverty | Below Poverty |
| No Children | 231 (97.1%) | 7 (2.9%) |
| 1 or 2 Children | 308 (98.1%) | 6 (1.9%) |
| 3 or 4 Children | 66 (81.5%) | 15 (18.5%) |
| 5 or more Children | 0 (0.0%) | 0 (0.0%) |
| Total | 605 (95.6%) | 28 (4.4%) |
Income Below Poverty Among Single-Parent Households in Clever
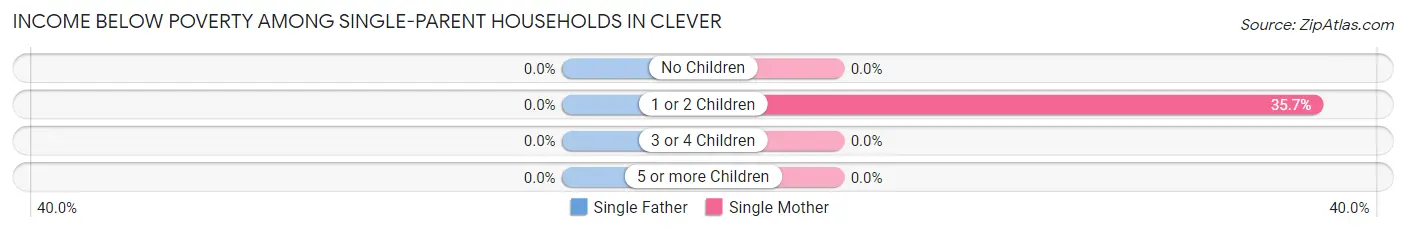
| Children | Single Father | Single Mother |
| No Children | 0 (0.0%) | 0 (0.0%) |
| 1 or 2 Children | 0 (0.0%) | 15 (35.7%) |
| 3 or 4 Children | 0 (0.0%) | 0 (0.0%) |
| 5 or more Children | 0 (0.0%) | 0 (0.0%) |
| Total | 0 (0.0%) | 15 (18.8%) |
Income Below Poverty Among Married-Couple vs Single-Parent Households in Clever
The poverty data for Clever shows that 28 of the married-couple family households (4.4%) and 15 of the single-parent households (10.4%) are living below the poverty level. Within the married-couple family households, those with 3 or 4 children have the highest poverty rate, with 15 households (18.5%) falling below the poverty line. Among the single-parent households, those with 1 or 2 children have the highest poverty rate, with 15 household (24.2%) living below poverty.
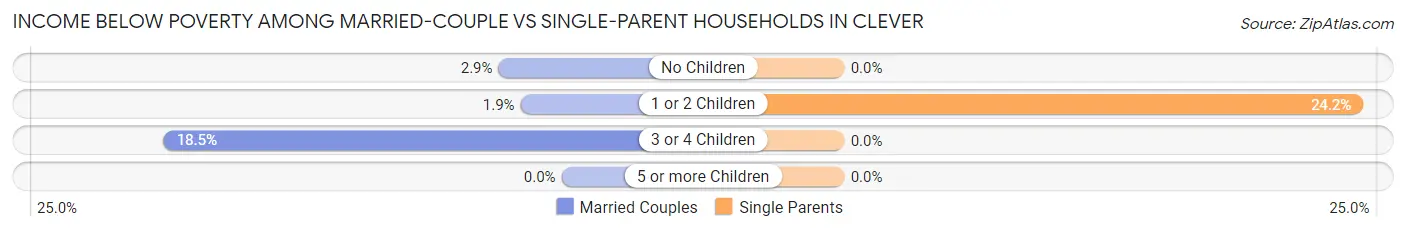
| Children | Married-Couple Families | Single-Parent Households |
| No Children | 7 (2.9%) | 0 (0.0%) |
| 1 or 2 Children | 6 (1.9%) | 15 (24.2%) |
| 3 or 4 Children | 15 (18.5%) | 0 (0.0%) |
| 5 or more Children | 0 (0.0%) | 0 (0.0%) |
| Total | 28 (4.4%) | 15 (10.4%) |
Race in Clever
The most populous races in Clever are White / Caucasian (2,653 | 90.7%), Two or more Races (142 | 4.9%), and Native / Alaskan (68 | 2.3%).
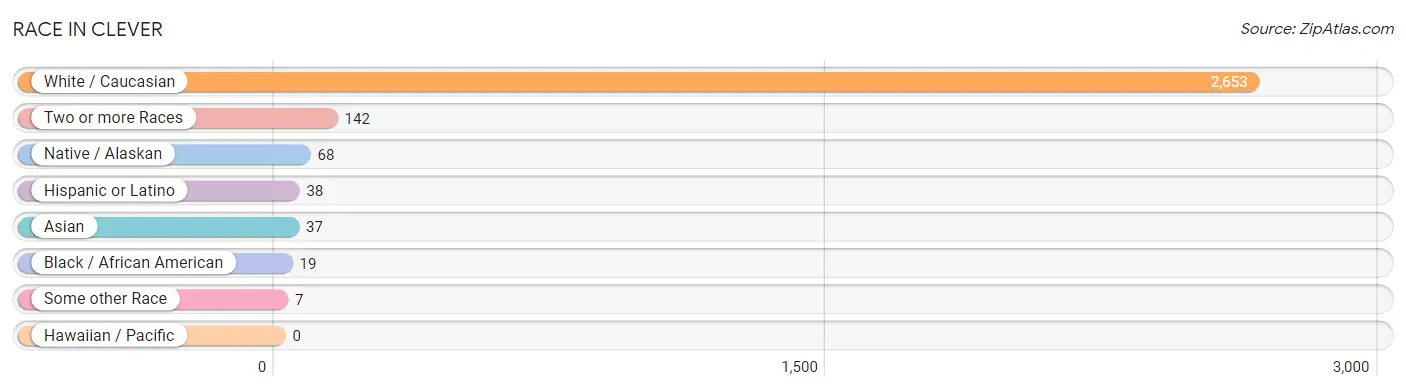
| Race | # Population | % Population |
| Asian | 37 | 1.3% |
| Black / African American | 19 | 0.6% |
| Hawaiian / Pacific | 0 | 0.0% |
| Hispanic or Latino | 38 | 1.3% |
| Native / Alaskan | 68 | 2.3% |
| White / Caucasian | 2,653 | 90.7% |
| Two or more Races | 142 | 4.9% |
| Some other Race | 7 | 0.2% |
| Total | 2,926 | 100.0% |
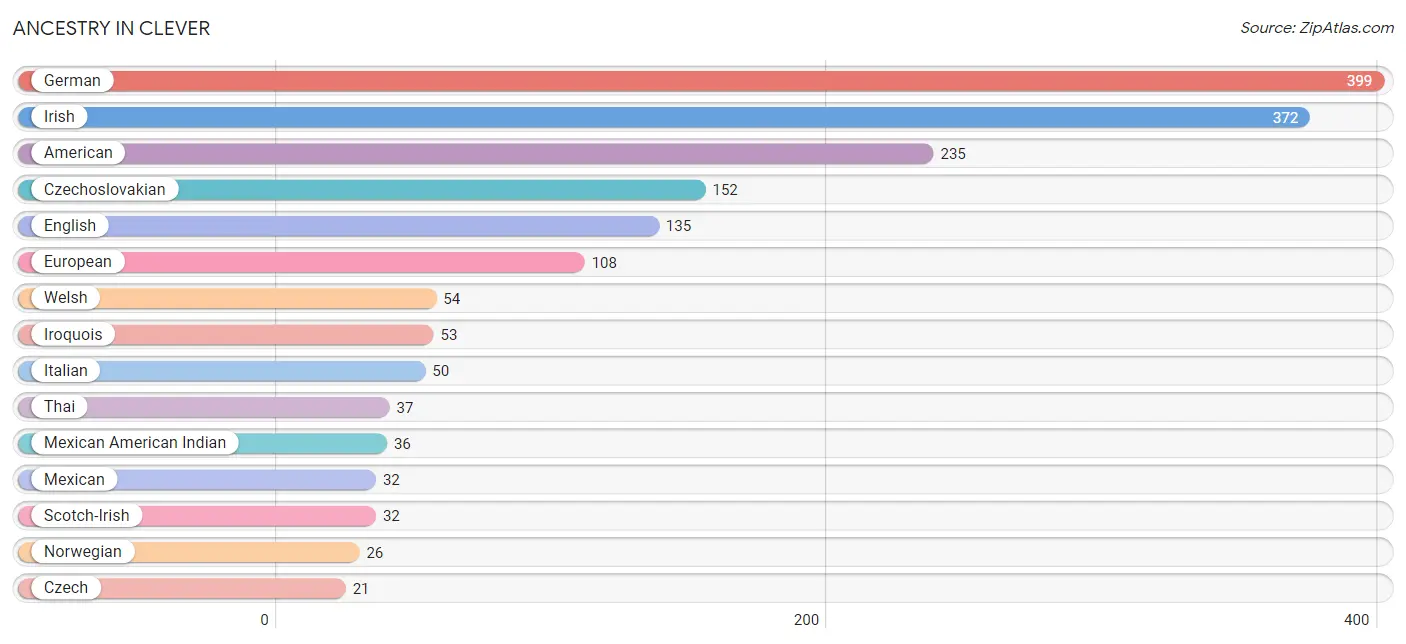
Ancestry in Clever
The most populous ancestries reported in Clever are German (399 | 13.6%), Irish (372 | 12.7%), American (235 | 8.0%), Czechoslovakian (152 | 5.2%), and English (135 | 4.6%), together accounting for 44.2% of all Clever residents.
| Ancestry | # Population | % Population |
| American | 235 | 8.0% |
| Arab | 19 | 0.6% |
| Austrian | 7 | 0.2% |
| Canadian | 4 | 0.1% |
| Creek | 15 | 0.5% |
| Czech | 21 | 0.7% |
| Czechoslovakian | 152 | 5.2% |
| Danish | 12 | 0.4% |
| Dutch | 18 | 0.6% |
| Dutch West Indian | 5 | 0.2% |
| English | 135 | 4.6% |
| European | 108 | 3.7% |
| Finnish | 5 | 0.2% |
| German | 399 | 13.6% |
| Irish | 372 | 12.7% |
| Iroquois | 53 | 1.8% |
| Italian | 50 | 1.7% |
| Mexican | 32 | 1.1% |
| Mexican American Indian | 36 | 1.2% |
| Norwegian | 26 | 0.9% |
| Polish | 8 | 0.3% |
| Puerto Rican | 6 | 0.2% |
| Scandinavian | 3 | 0.1% |
| Scotch-Irish | 32 | 1.1% |
| Scottish | 19 | 0.6% |
| Swedish | 19 | 0.6% |
| Swiss | 18 | 0.6% |
| Thai | 37 | 1.3% |
| Welsh | 54 | 1.8% |
| Yugoslavian | 6 | 0.2% | View All 30 Rows |
Immigrants in Clever
The most numerous immigrant groups reported in Clever came from Asia (37 | 1.3%), Israel (19 | 0.6%), Western Asia (19 | 0.6%), India (18 | 0.6%), and South Central Asia (18 | 0.6%), together accounting for 3.8% of all Clever residents.
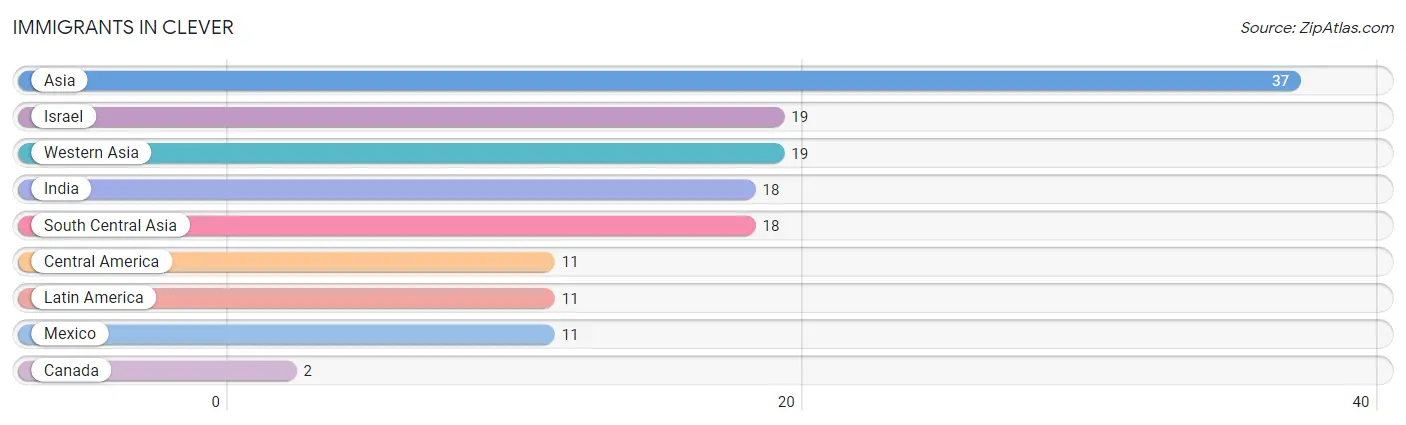
| Immigration Origin | # Population | % Population |
| Asia | 37 | 1.3% |
| Canada | 2 | 0.1% |
| Central America | 11 | 0.4% |
| India | 18 | 0.6% |
| Israel | 19 | 0.6% |
| Latin America | 11 | 0.4% |
| Mexico | 11 | 0.4% |
| South Central Asia | 18 | 0.6% |
| Western Asia | 19 | 0.6% | View All 9 Rows |
Sex and Age in Clever
Sex and Age in Clever
The most populous age groups in Clever are 35 to 39 Years (194 | 13.9%) for men and 15 to 19 Years (171 | 11.2%) for women.
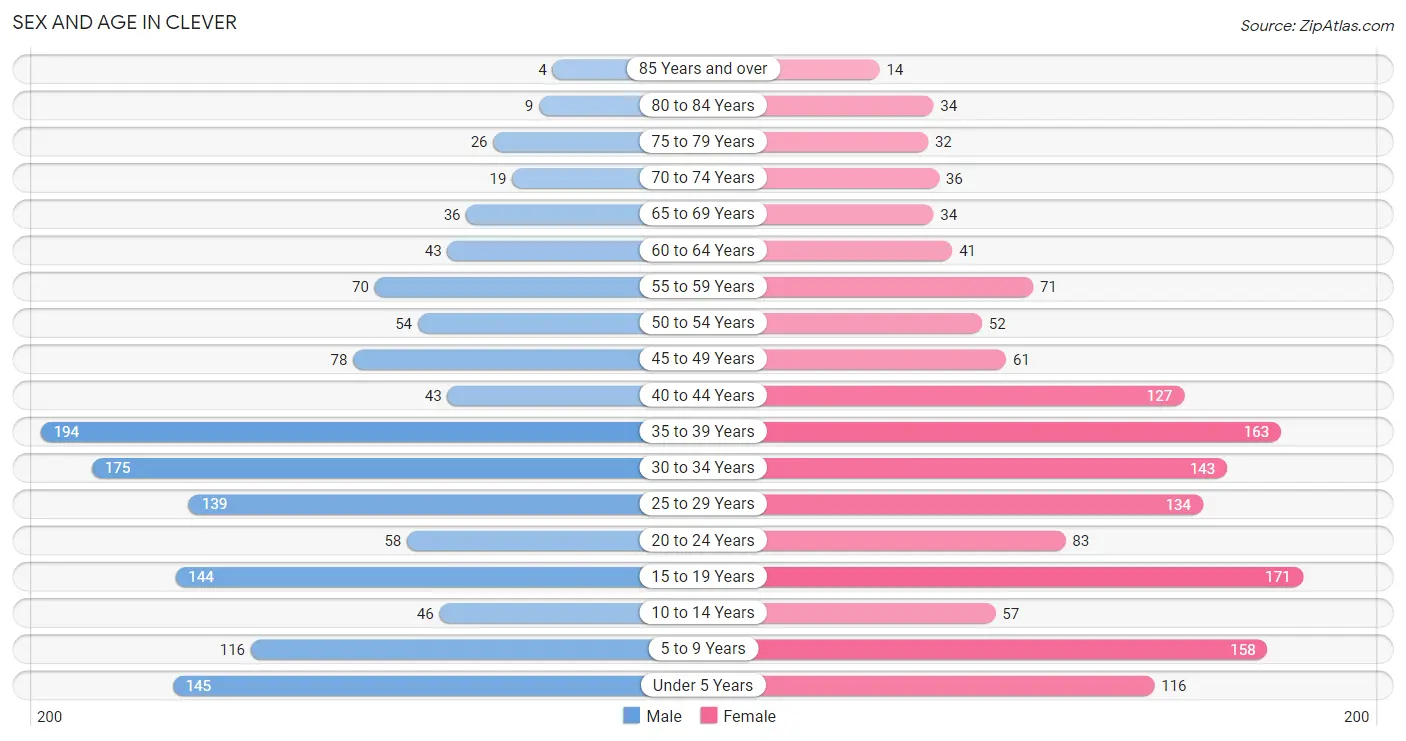
| Age Bracket | Male | Female |
| Under 5 Years | 145 (10.4%) | 116 (7.6%) |
| 5 to 9 Years | 116 (8.3%) | 158 (10.3%) |
| 10 to 14 Years | 46 (3.3%) | 57 (3.7%) |
| 15 to 19 Years | 144 (10.3%) | 171 (11.2%) |
| 20 to 24 Years | 58 (4.2%) | 83 (5.4%) |
| 25 to 29 Years | 139 (9.9%) | 134 (8.8%) |
| 30 to 34 Years | 175 (12.5%) | 143 (9.4%) |
| 35 to 39 Years | 194 (13.9%) | 163 (10.7%) |
| 40 to 44 Years | 43 (3.1%) | 127 (8.3%) |
| 45 to 49 Years | 78 (5.6%) | 61 (4.0%) |
| 50 to 54 Years | 54 (3.9%) | 52 (3.4%) |
| 55 to 59 Years | 70 (5.0%) | 71 (4.6%) |
| 60 to 64 Years | 43 (3.1%) | 41 (2.7%) |
| 65 to 69 Years | 36 (2.6%) | 34 (2.2%) |
| 70 to 74 Years | 19 (1.4%) | 36 (2.4%) |
| 75 to 79 Years | 26 (1.9%) | 32 (2.1%) |
| 80 to 84 Years | 9 (0.6%) | 34 (2.2%) |
| 85 Years and over | 4 (0.3%) | 14 (0.9%) |
| Total | 1,399 (100.0%) | 1,527 (100.0%) |
Families and Households in Clever
Median Family Size in Clever
The median family size in Clever is 3.28 persons per family, with married-couple families (633 | 81.5%) accounting for the largest median family size of 3.38 persons per family. On the other hand, single male/father families (64 | 8.2%) represent the smallest median family size with 2.34 persons per family.
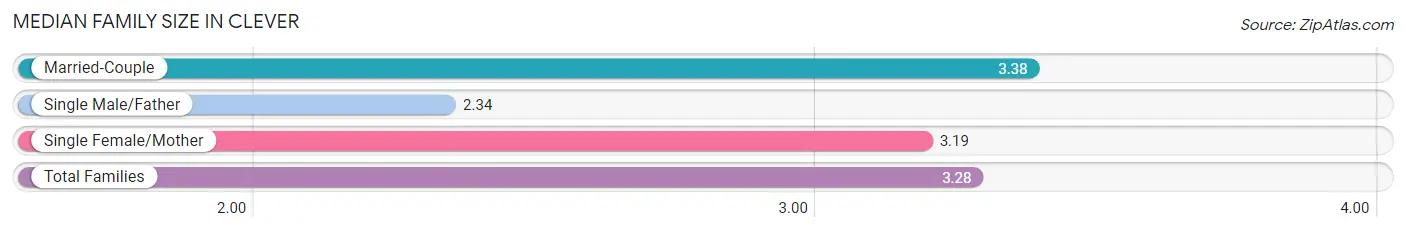
| Family Type | # Families | Family Size |
| Married-Couple | 633 (81.5%) | 3.38 |
| Single Male/Father | 64 (8.2%) | 2.34 |
| Single Female/Mother | 80 (10.3%) | 3.19 |
| Total Families | 777 (100.0%) | 3.28 |
Median Household Size in Clever
The median household size in Clever is 2.86 persons per household, with single female/mother households (80 | 7.8%) accounting for the largest median household size of 3.55 persons per household. non-family households (247 | 24.1%) represent the smallest median household size with 1.33 persons per household.
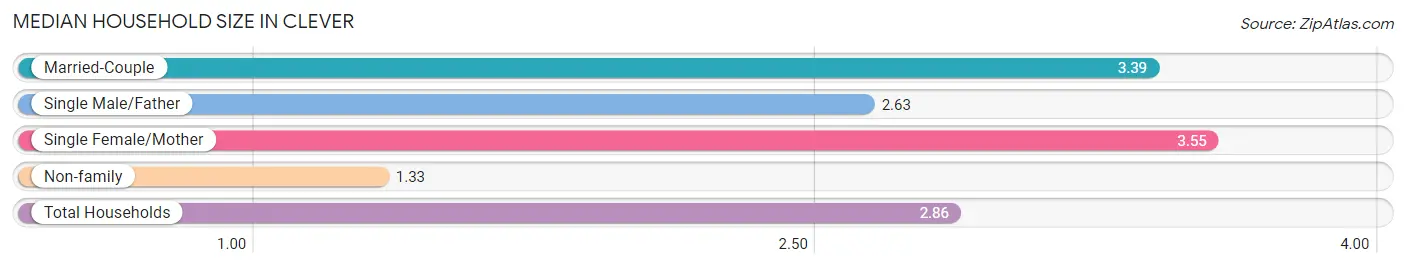
| Household Type | # Households | Household Size |
| Married-Couple | 633 (61.8%) | 3.39 |
| Single Male/Father | 64 (6.2%) | 2.63 |
| Single Female/Mother | 80 (7.8%) | 3.55 |
| Non-family | 247 (24.1%) | 1.33 |
| Total Households | 1,024 (100.0%) | 2.86 |
Household Size by Marriage Status in Clever
Out of a total of 1,024 households in Clever, 777 (75.9%) are family households, while 247 (24.1%) are nonfamily households. The most numerous type of family households are 2-person households, comprising 254, and the most common type of nonfamily households are 1-person households, comprising 180.
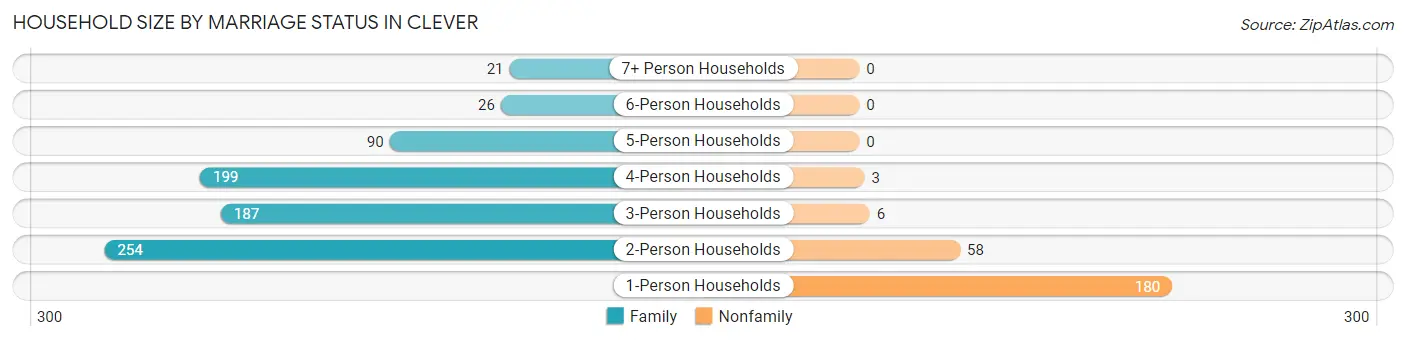
| Household Size | Family Households | Nonfamily Households |
| 1-Person Households | - | 180 (17.6%) |
| 2-Person Households | 254 (24.8%) | 58 (5.7%) |
| 3-Person Households | 187 (18.3%) | 6 (0.6%) |
| 4-Person Households | 199 (19.4%) | 3 (0.3%) |
| 5-Person Households | 90 (8.8%) | 0 (0.0%) |
| 6-Person Households | 26 (2.5%) | 0 (0.0%) |
| 7+ Person Households | 21 (2.1%) | 0 (0.0%) |
| Total | 777 (75.9%) | 247 (24.1%) |
Female Fertility in Clever
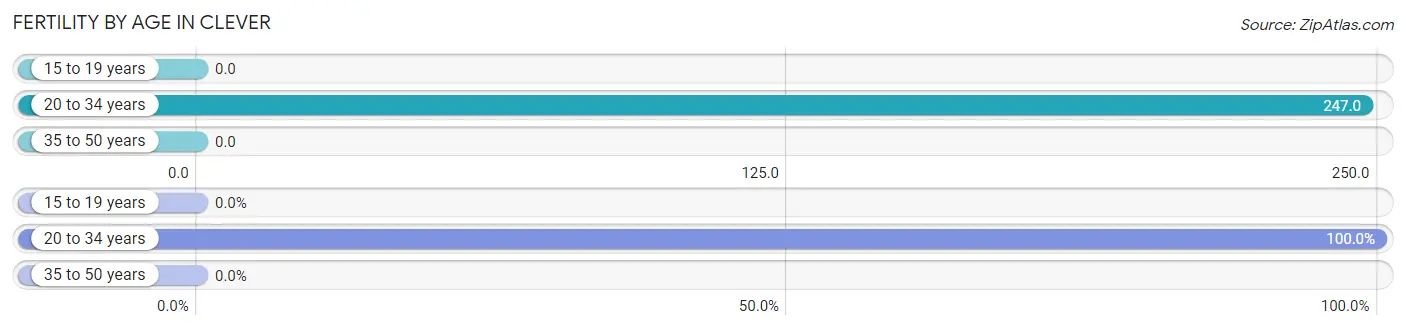
Fertility by Age in Clever
Average fertility rate in Clever is 100.0 births per 1,000 women. Women in the age bracket of 20 to 34 years have the highest fertility rate with 247.0 births per 1,000 women. Women in the age bracket of 20 to 34 years acount for 100.0% of all women with births.
| Age Bracket | Women with Births | Births / 1,000 Women |
| 15 to 19 years | 0 (0.0%) | 0.0 |
| 20 to 34 years | 89 (100.0%) | 247.0 |
| 35 to 50 years | 0 (0.0%) | 0.0 |
| Total | 89 (100.0%) | 100.0 |
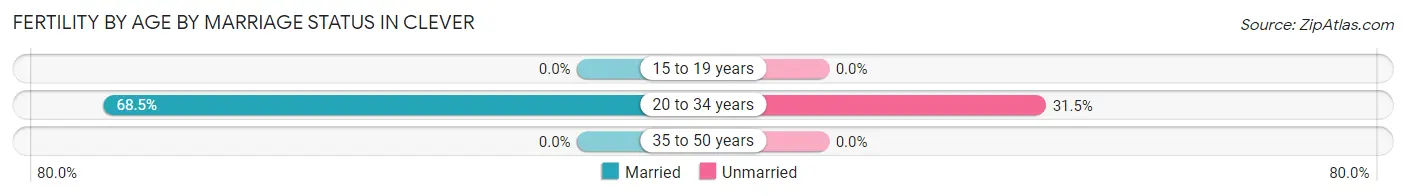
Fertility by Age by Marriage Status in Clever
68.5% of women with births (89) in Clever are married. The highest percentage of unmarried women with births falls into 20 to 34 years age bracket with 31.5% of them unmarried at the time of birth, while the lowest percentage of unmarried women with births belong to 20 to 34 years age bracket with 31.5% of them unmarried.
| Age Bracket | Married | Unmarried |
| 15 to 19 years | 0 (0.0%) | 0 (0.0%) |
| 20 to 34 years | 61 (68.5%) | 28 (31.5%) |
| 35 to 50 years | 0 (0.0%) | 0 (0.0%) |
| Total | 61 (68.5%) | 28 (31.5%) |
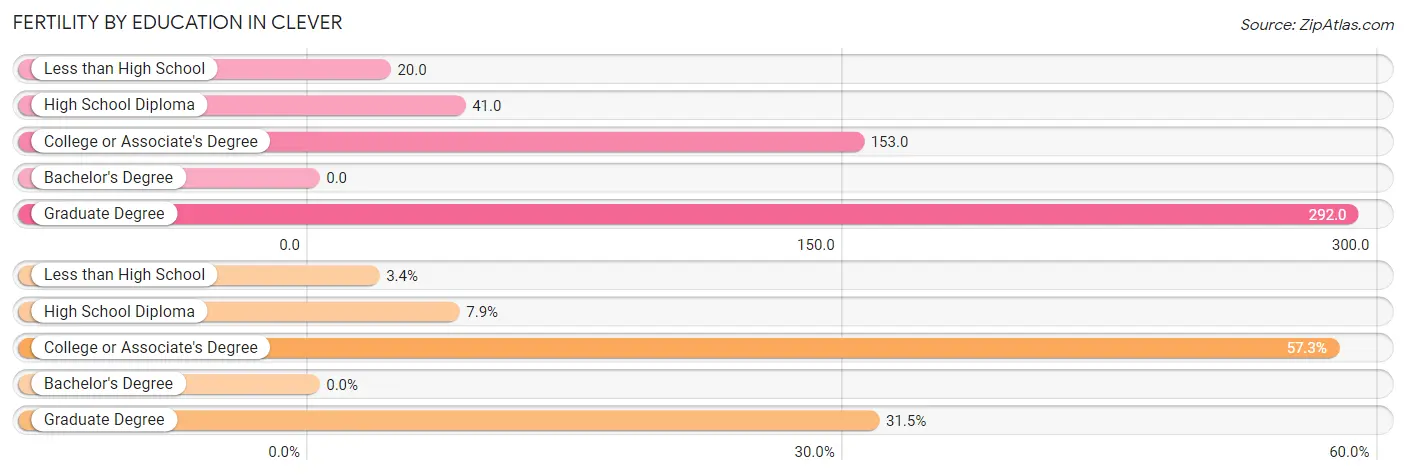
Fertility by Education in Clever
| Educational Attainment | Women with Births | Births / 1,000 Women |
| Less than High School | 3 (3.4%) | 20.0 |
| High School Diploma | 7 (7.9%) | 41.0 |
| College or Associate's Degree | 51 (57.3%) | 153.0 |
| Bachelor's Degree | 0 (0.0%) | 0.0 |
| Graduate Degree | 28 (31.5%) | 292.0 |
| Total | 89 (100.0%) | 100.0 |
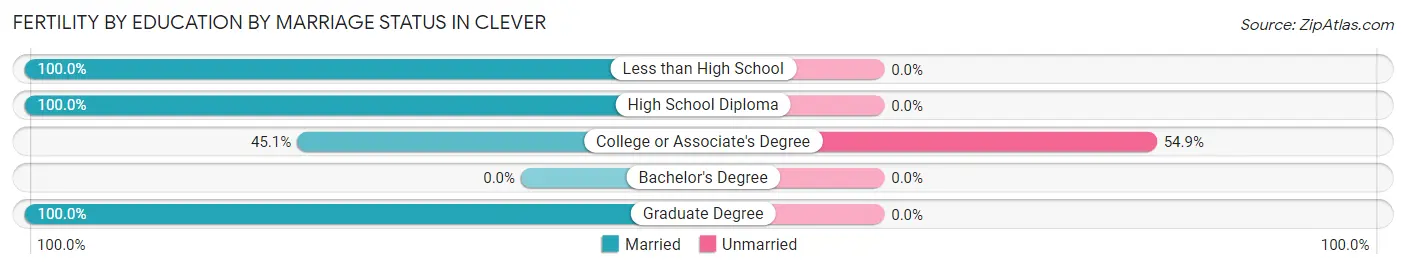
Fertility by Education by Marriage Status in Clever
31.5% of women with births in Clever are unmarried. Women with the educational attainment of less than high school are most likely to be married with 100.0% of them married at childbirth, while women with the educational attainment of college or associate's degree are least likely to be married with 54.9% of them unmarried at childbirth.
| Educational Attainment | Married | Unmarried |
| Less than High School | 3 (100.0%) | 0 (0.0%) |
| High School Diploma | 7 (100.0%) | 0 (0.0%) |
| College or Associate's Degree | 23 (45.1%) | 28 (54.9%) |
| Bachelor's Degree | 0 (0.0%) | 0 (0.0%) |
| Graduate Degree | 28 (100.0%) | 0 (0.0%) |
| Total | 61 (68.5%) | 28 (31.5%) |
Employment Characteristics in Clever
Employment by Class of Employer in Clever
Among the 1,516 employed individuals in Clever, private company employees (1,031 | 68.0%), not-for-profit organizations (174 | 11.5%), and local government employees (124 | 8.2%) make up the most common classes of employment.
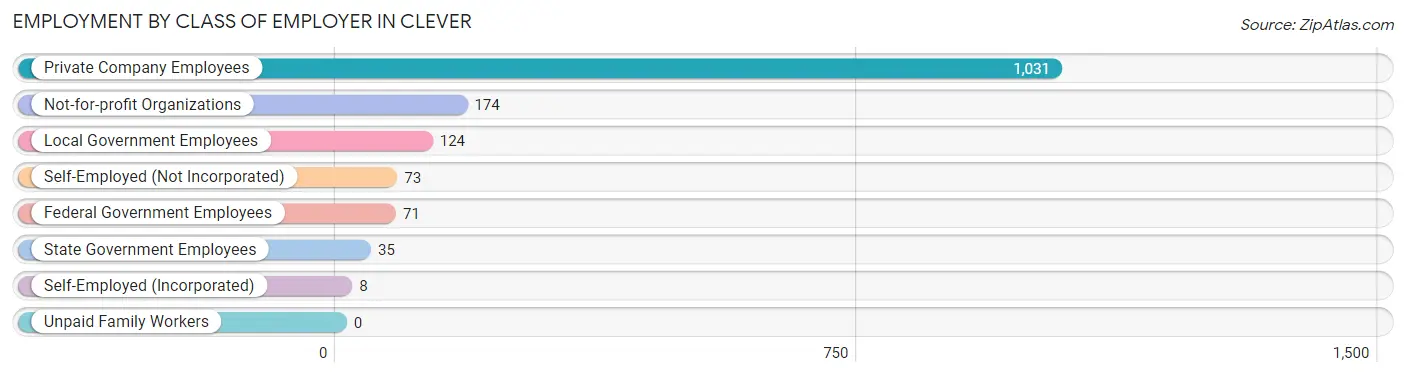
| Employer Class | # Employees | % Employees |
| Private Company Employees | 1,031 | 68.0% |
| Self-Employed (Incorporated) | 8 | 0.5% |
| Self-Employed (Not Incorporated) | 73 | 4.8% |
| Not-for-profit Organizations | 174 | 11.5% |
| Local Government Employees | 124 | 8.2% |
| State Government Employees | 35 | 2.3% |
| Federal Government Employees | 71 | 4.7% |
| Unpaid Family Workers | 0 | 0.0% |
| Total | 1,516 | 100.0% |
Employment Status by Age in Clever
According to the labor force statistics for Clever, out of the total population over 16 years of age (2,182), 72.3% or 1,578 individuals are in the labor force, with 1.9% or 30 of them unemployed. The age group with the highest labor force participation rate is 30 to 34 years, with 91.2% or 290 individuals in the labor force. Within the labor force, the 65 to 74 years age range has the highest percentage of unemployed individuals, with 33.3% or 12 of them being unemployed.
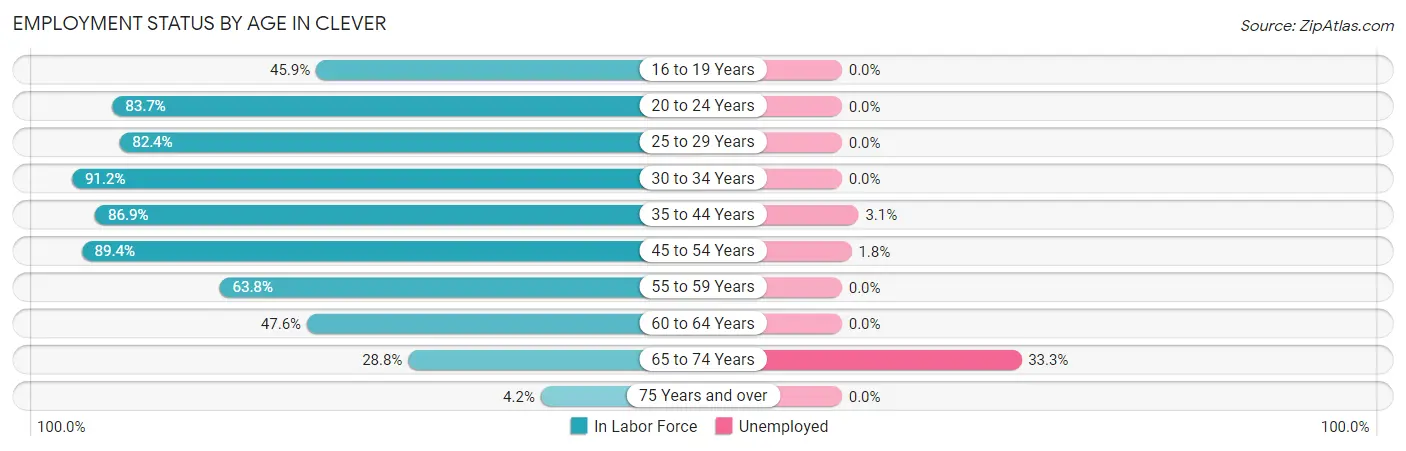
| Age Bracket | In Labor Force | Unemployed |
| 16 to 19 Years | 96 (45.9%) | 0 (0.0%) |
| 20 to 24 Years | 118 (83.7%) | 0 (0.0%) |
| 25 to 29 Years | 225 (82.4%) | 0 (0.0%) |
| 30 to 34 Years | 290 (91.2%) | 0 (0.0%) |
| 35 to 44 Years | 458 (86.9%) | 14 (3.1%) |
| 45 to 54 Years | 219 (89.4%) | 4 (1.8%) |
| 55 to 59 Years | 90 (63.8%) | 0 (0.0%) |
| 60 to 64 Years | 40 (47.6%) | 0 (0.0%) |
| 65 to 74 Years | 36 (28.8%) | 12 (33.3%) |
| 75 Years and over | 5 (4.2%) | 0 (0.0%) |
| Total | 1,578 (72.3%) | 30 (1.9%) |
Employment Status by Educational Attainment in Clever
According to labor force statistics for Clever, 83.2% of individuals (1,321) out of the total population between 25 and 64 years of age (1,588) are in the labor force, with 1.4% or 18 of them being unemployed. The group with the highest labor force participation rate are those with the educational attainment of college / associate degree, with 88.4% or 539 individuals in the labor force. Within the labor force, individuals with less than high school education have the highest percentage of unemployment, with 5.0% or 4 of them being unemployed.
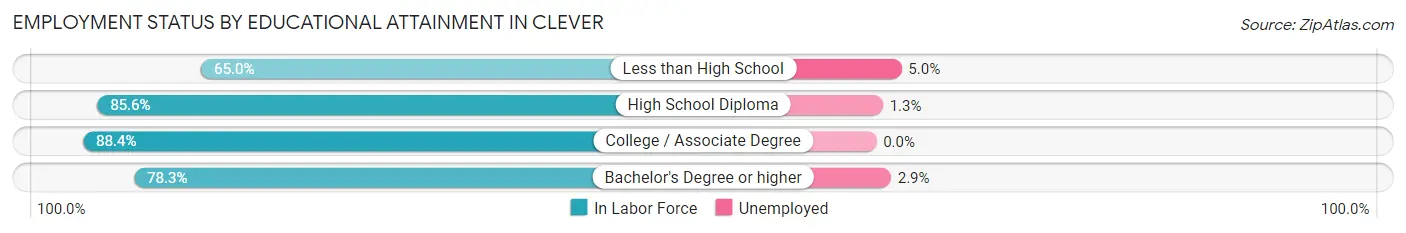
| Educational Attainment | In Labor Force | Unemployed |
| Less than High School | 80 (65.0%) | 6 (5.0%) |
| High School Diploma | 397 (85.6%) | 6 (1.3%) |
| College / Associate Degree | 539 (88.4%) | 0 (0.0%) |
| Bachelor's Degree or higher | 306 (78.3%) | 11 (2.9%) |
| Total | 1,321 (83.2%) | 22 (1.4%) |
Employment Occupations by Sex in Clever
Management, Business, Science and Arts Occupations
The most common Management, Business, Science and Arts occupations in Clever are Community & Social Service (142 | 9.2%), Health Diagnosing & Treating (134 | 8.7%), Management (127 | 8.2%), Education Instruction & Library (127 | 8.2%), and Health Technologists (67 | 4.3%).
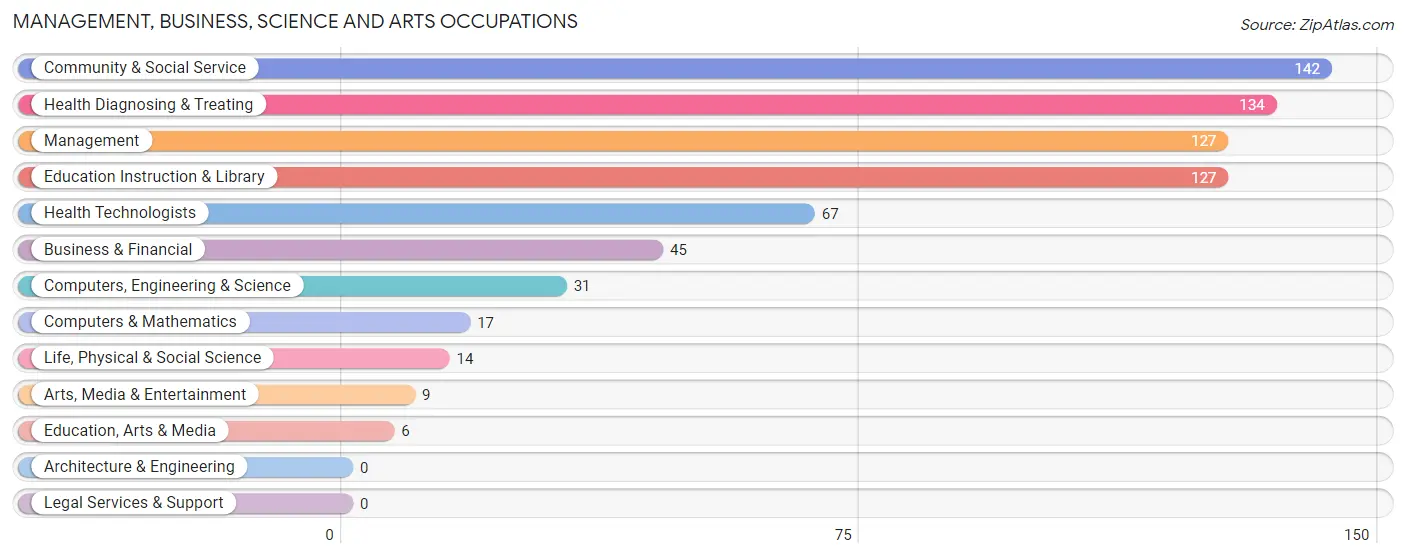
Management, Business, Science and Arts Occupations by Sex
Within the Management, Business, Science and Arts occupations in Clever, the most male-oriented occupations are Computers & Mathematics (100.0%), Arts, Media & Entertainment (100.0%), and Computers, Engineering & Science (54.8%), while the most female-oriented occupations are Life, Physical & Social Science (100.0%), Education, Arts & Media (100.0%), and Health Technologists (88.1%).
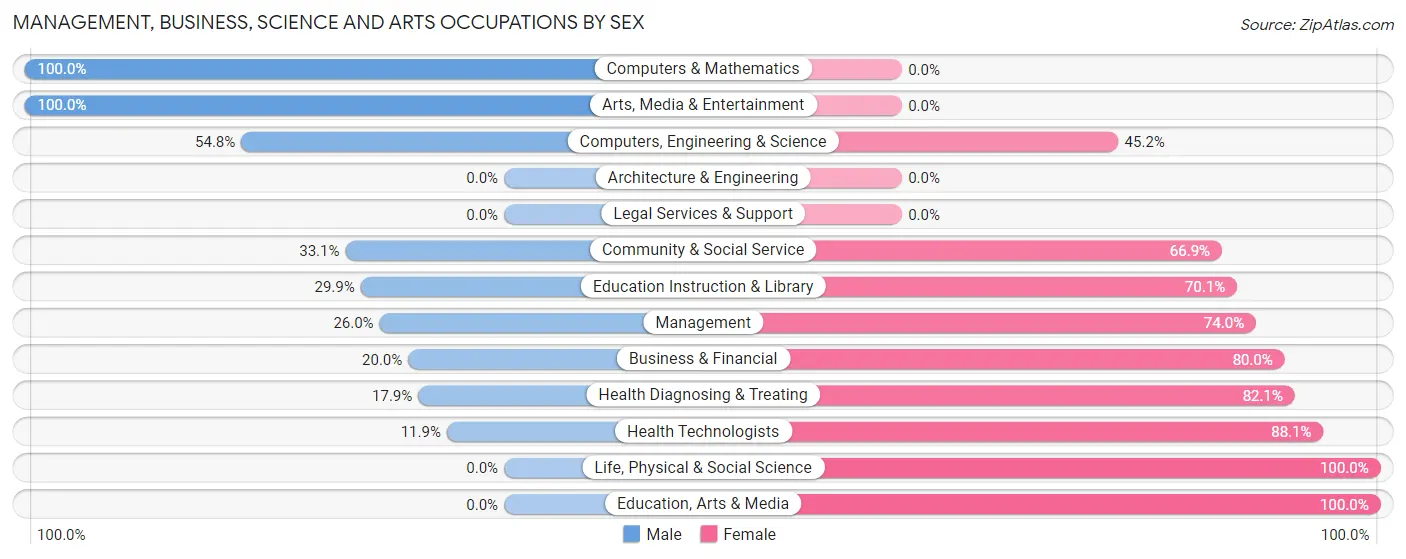
| Occupation | Male | Female |
| Management | 33 (26.0%) | 94 (74.0%) |
| Business & Financial | 9 (20.0%) | 36 (80.0%) |
| Computers, Engineering & Science | 17 (54.8%) | 14 (45.2%) |
| Computers & Mathematics | 17 (100.0%) | 0 (0.0%) |
| Architecture & Engineering | 0 (0.0%) | 0 (0.0%) |
| Life, Physical & Social Science | 0 (0.0%) | 14 (100.0%) |
| Community & Social Service | 47 (33.1%) | 95 (66.9%) |
| Education, Arts & Media | 0 (0.0%) | 6 (100.0%) |
| Legal Services & Support | 0 (0.0%) | 0 (0.0%) |
| Education Instruction & Library | 38 (29.9%) | 89 (70.1%) |
| Arts, Media & Entertainment | 9 (100.0%) | 0 (0.0%) |
| Health Diagnosing & Treating | 24 (17.9%) | 110 (82.1%) |
| Health Technologists | 8 (11.9%) | 59 (88.1%) |
| Total (Category) | 130 (27.1%) | 349 (72.9%) |
| Total (Overall) | 839 (54.2%) | 708 (45.8%) |
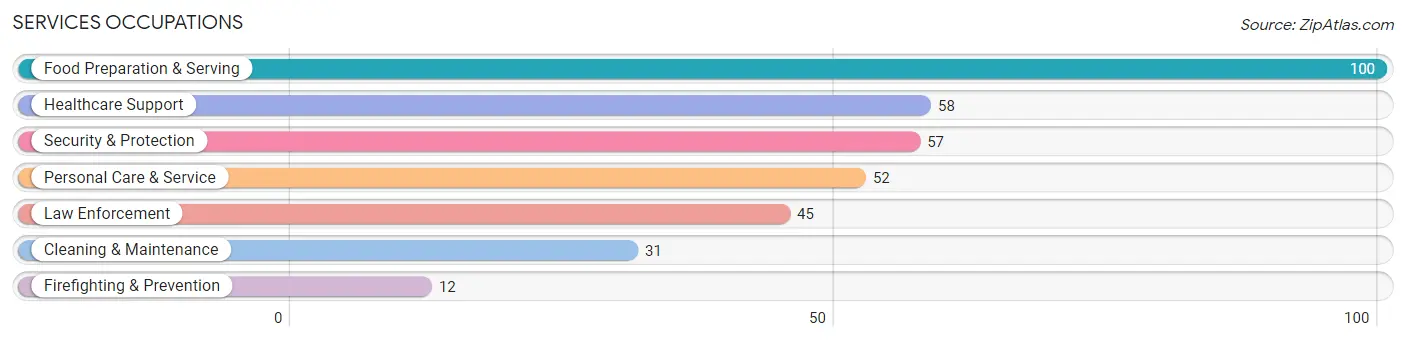
Services Occupations
The most common Services occupations in Clever are Food Preparation & Serving (100 | 6.5%), Healthcare Support (58 | 3.7%), Security & Protection (57 | 3.7%), Personal Care & Service (52 | 3.4%), and Law Enforcement (45 | 2.9%).
Services Occupations by Sex
Within the Services occupations in Clever, the most male-oriented occupations are Security & Protection (100.0%), Firefighting & Prevention (100.0%), and Law Enforcement (100.0%), while the most female-oriented occupations are Personal Care & Service (100.0%), Healthcare Support (69.0%), and Food Preparation & Serving (54.0%).
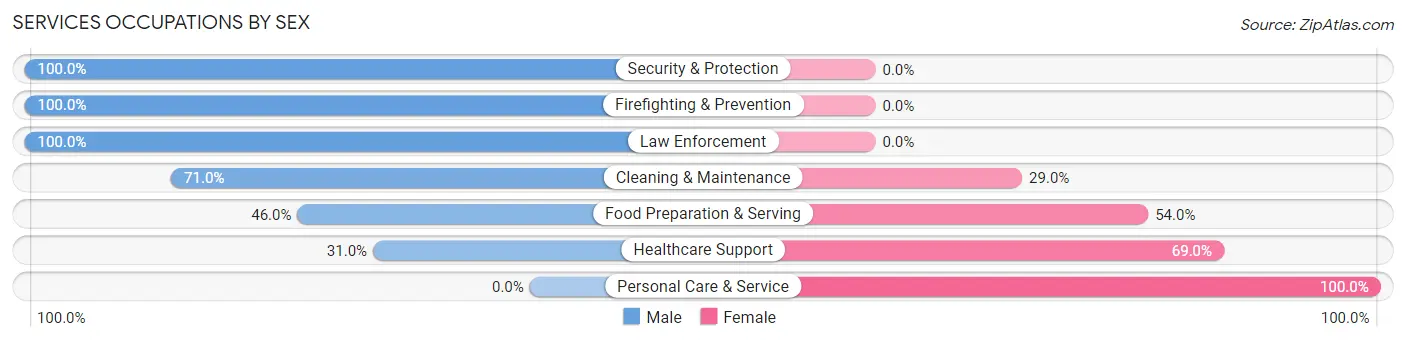
| Occupation | Male | Female |
| Healthcare Support | 18 (31.0%) | 40 (69.0%) |
| Security & Protection | 57 (100.0%) | 0 (0.0%) |
| Firefighting & Prevention | 12 (100.0%) | 0 (0.0%) |
| Law Enforcement | 45 (100.0%) | 0 (0.0%) |
| Food Preparation & Serving | 46 (46.0%) | 54 (54.0%) |
| Cleaning & Maintenance | 22 (71.0%) | 9 (29.0%) |
| Personal Care & Service | 0 (0.0%) | 52 (100.0%) |
| Total (Category) | 143 (48.0%) | 155 (52.0%) |
| Total (Overall) | 839 (54.2%) | 708 (45.8%) |
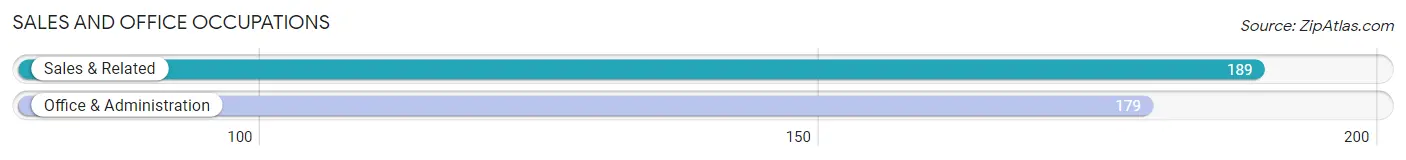
Sales and Office Occupations
The most common Sales and Office occupations in Clever are Sales & Related (189 | 12.2%), and Office & Administration (179 | 11.6%).
Sales and Office Occupations by Sex
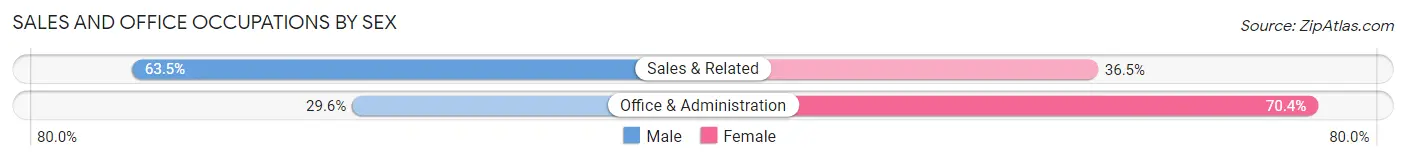
| Occupation | Male | Female |
| Sales & Related | 120 (63.5%) | 69 (36.5%) |
| Office & Administration | 53 (29.6%) | 126 (70.4%) |
| Total (Category) | 173 (47.0%) | 195 (53.0%) |
| Total (Overall) | 839 (54.2%) | 708 (45.8%) |
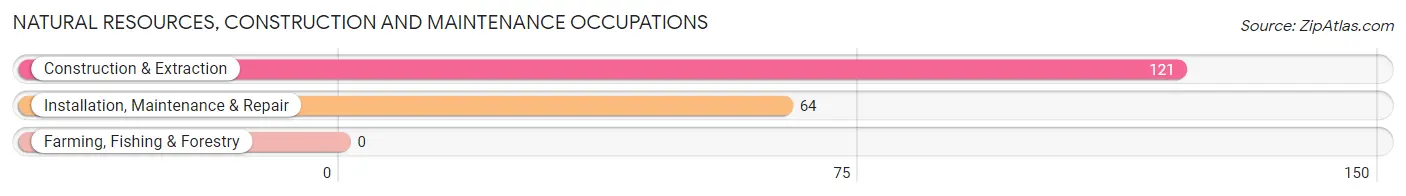
Natural Resources, Construction and Maintenance Occupations
The most common Natural Resources, Construction and Maintenance occupations in Clever are Construction & Extraction (121 | 7.8%), and Installation, Maintenance & Repair (64 | 4.1%).
Natural Resources, Construction and Maintenance Occupations by Sex
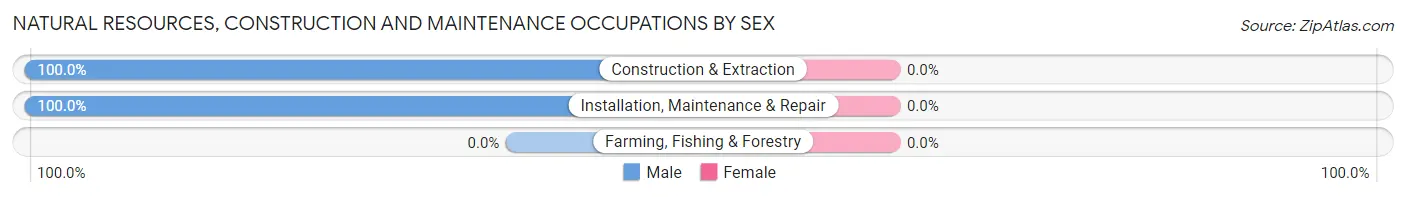
| Occupation | Male | Female |
| Farming, Fishing & Forestry | 0 (0.0%) | 0 (0.0%) |
| Construction & Extraction | 121 (100.0%) | 0 (0.0%) |
| Installation, Maintenance & Repair | 64 (100.0%) | 0 (0.0%) |
| Total (Category) | 185 (100.0%) | 0 (0.0%) |
| Total (Overall) | 839 (54.2%) | 708 (45.8%) |
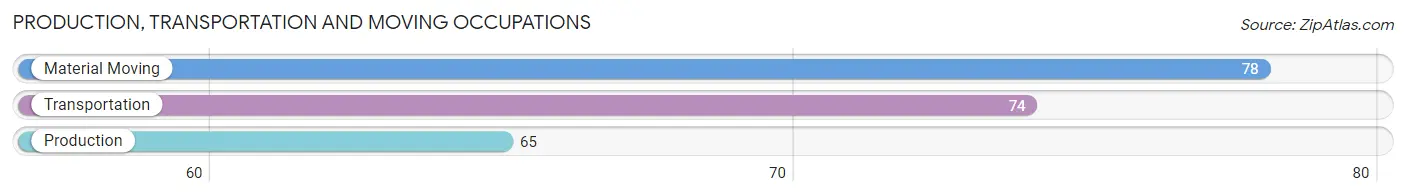
Production, Transportation and Moving Occupations
The most common Production, Transportation and Moving occupations in Clever are Material Moving (78 | 5.0%), Transportation (74 | 4.8%), and Production (65 | 4.2%).
Production, Transportation and Moving Occupations by Sex
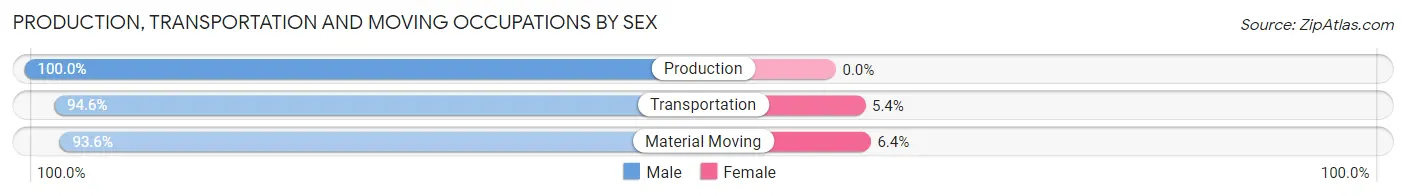
| Occupation | Male | Female |
| Production | 65 (100.0%) | 0 (0.0%) |
| Transportation | 70 (94.6%) | 4 (5.4%) |
| Material Moving | 73 (93.6%) | 5 (6.4%) |
| Total (Category) | 208 (95.9%) | 9 (4.2%) |
| Total (Overall) | 839 (54.2%) | 708 (45.8%) |
Employment Industries by Sex in Clever
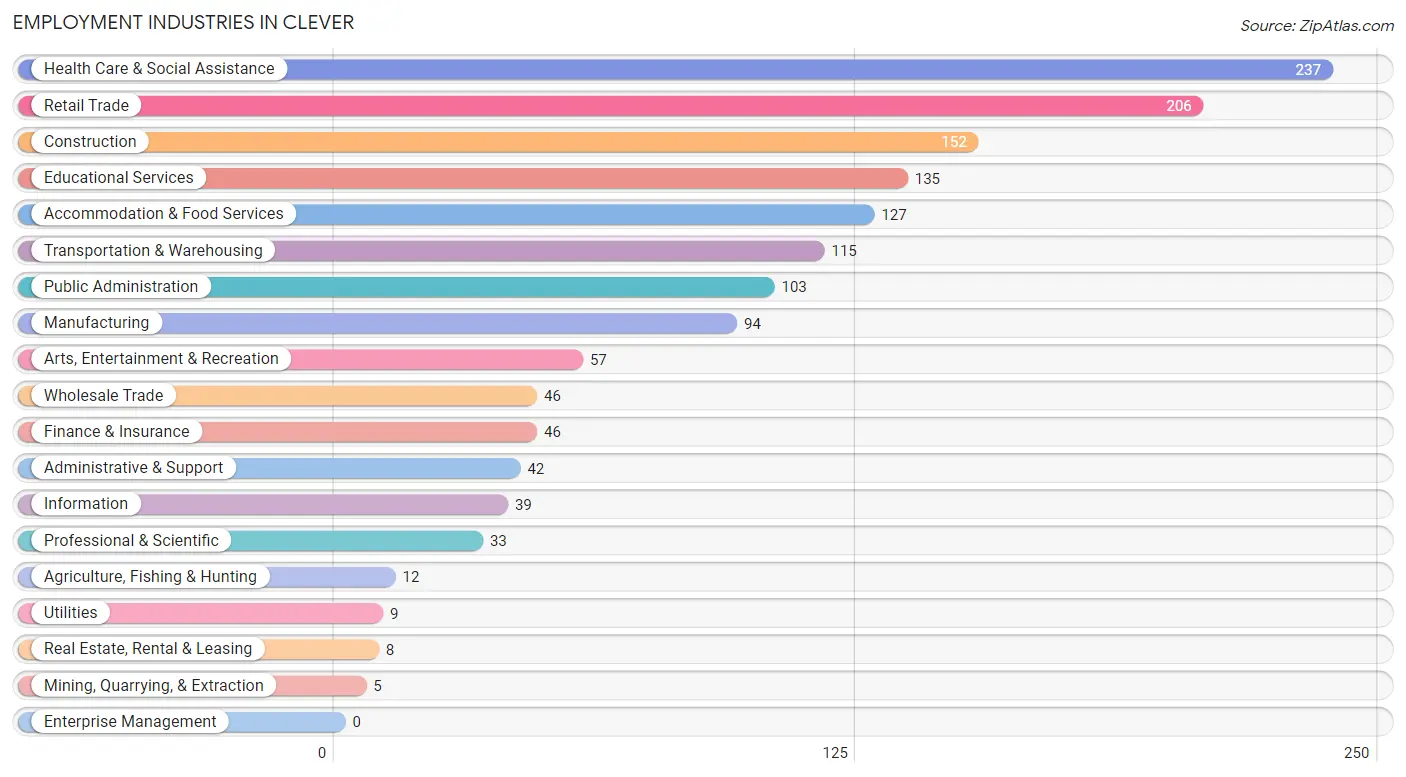
Employment Industries in Clever
The major employment industries in Clever include Health Care & Social Assistance (237 | 15.3%), Retail Trade (206 | 13.3%), Construction (152 | 9.8%), Educational Services (135 | 8.7%), and Accommodation & Food Services (127 | 8.2%).
Employment Industries by Sex in Clever
The Clever industries that see more men than women are Agriculture, Fishing & Hunting (100.0%), Utilities (100.0%), and Real Estate, Rental & Leasing (100.0%), whereas the industries that tend to have a higher number of women are Mining, Quarrying, & Extraction (100.0%), Arts, Entertainment & Recreation (84.2%), and Health Care & Social Assistance (82.3%).
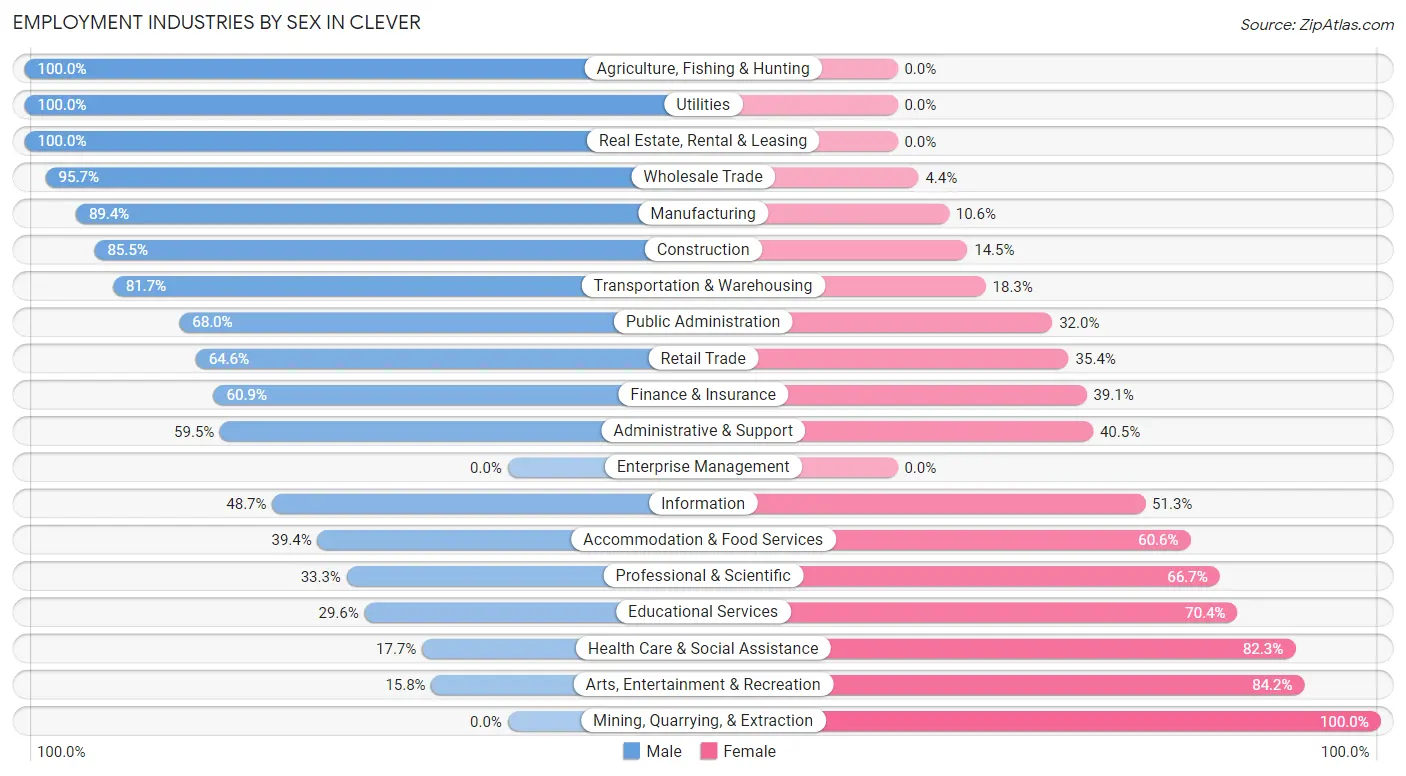
| Industry | Male | Female |
| Agriculture, Fishing & Hunting | 12 (100.0%) | 0 (0.0%) |
| Mining, Quarrying, & Extraction | 0 (0.0%) | 5 (100.0%) |
| Construction | 130 (85.5%) | 22 (14.5%) |
| Manufacturing | 84 (89.4%) | 10 (10.6%) |
| Wholesale Trade | 44 (95.7%) | 2 (4.3%) |
| Retail Trade | 133 (64.6%) | 73 (35.4%) |
| Transportation & Warehousing | 94 (81.7%) | 21 (18.3%) |
| Utilities | 9 (100.0%) | 0 (0.0%) |
| Information | 19 (48.7%) | 20 (51.3%) |
| Finance & Insurance | 28 (60.9%) | 18 (39.1%) |
| Real Estate, Rental & Leasing | 8 (100.0%) | 0 (0.0%) |
| Professional & Scientific | 11 (33.3%) | 22 (66.7%) |
| Enterprise Management | 0 (0.0%) | 0 (0.0%) |
| Administrative & Support | 25 (59.5%) | 17 (40.5%) |
| Educational Services | 40 (29.6%) | 95 (70.4%) |
| Health Care & Social Assistance | 42 (17.7%) | 195 (82.3%) |
| Arts, Entertainment & Recreation | 9 (15.8%) | 48 (84.2%) |
| Accommodation & Food Services | 50 (39.4%) | 77 (60.6%) |
| Public Administration | 70 (68.0%) | 33 (32.0%) |
| Total | 839 (54.2%) | 708 (45.8%) |
Education in Clever
School Enrollment in Clever
The most common levels of schooling among the 796 students in Clever are high school (265 | 33.3%), elementary school (224 | 28.1%), and middle school (91 | 11.4%).
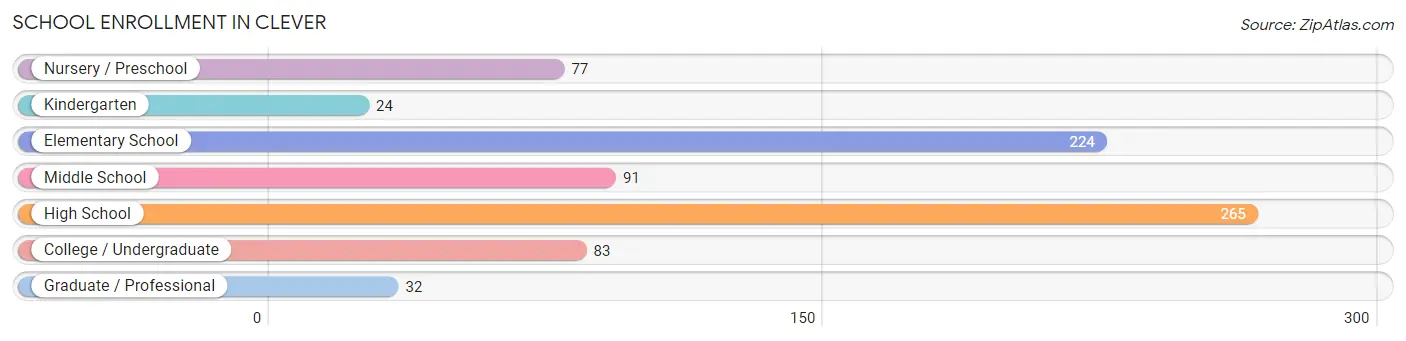
| School Level | # Students | % Students |
| Nursery / Preschool | 77 | 9.7% |
| Kindergarten | 24 | 3.0% |
| Elementary School | 224 | 28.1% |
| Middle School | 91 | 11.4% |
| High School | 265 | 33.3% |
| College / Undergraduate | 83 | 10.4% |
| Graduate / Professional | 32 | 4.0% |
| Total | 796 | 100.0% |
School Enrollment by Age by Funding Source in Clever
Out of a total of 796 students who are enrolled in schools in Clever, 90 (11.3%) attend a private institution, while the remaining 706 (88.7%) are enrolled in public schools. The age group of 20 to 24 year olds has the highest likelihood of being enrolled in private schools, with 30 (57.7% in the age bracket) enrolled. Conversely, the age group of 3 to 4 year olds has the lowest likelihood of being enrolled in a private school, with 55 (100.0% in the age bracket) attending a public institution.
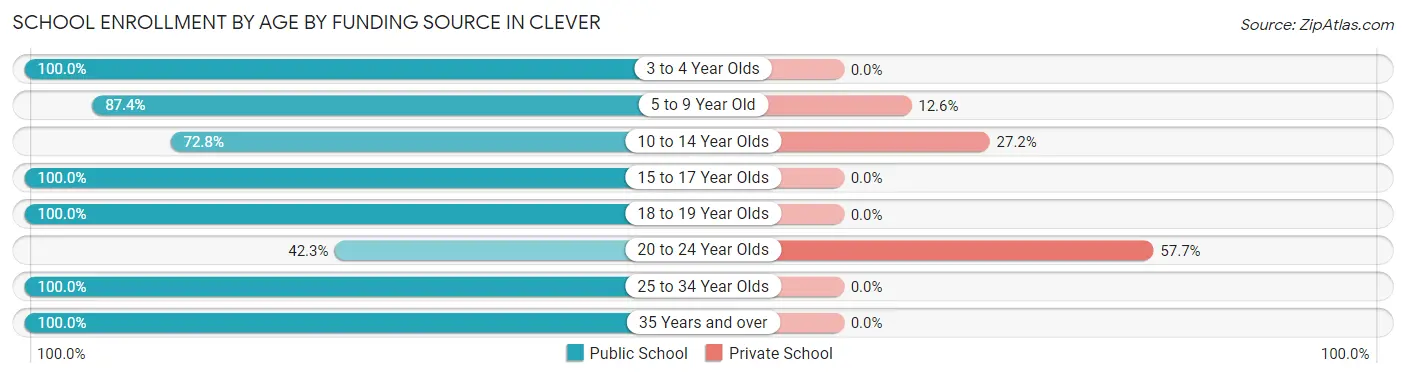
| Age Bracket | Public School | Private School |
| 3 to 4 Year Olds | 55 (100.0%) | 0 (0.0%) |
| 5 to 9 Year Old | 222 (87.4%) | 32 (12.6%) |
| 10 to 14 Year Olds | 75 (72.8%) | 28 (27.2%) |
| 15 to 17 Year Olds | 259 (100.0%) | 0 (0.0%) |
| 18 to 19 Year Olds | 6 (100.0%) | 0 (0.0%) |
| 20 to 24 Year Olds | 22 (42.3%) | 30 (57.7%) |
| 25 to 34 Year Olds | 48 (100.0%) | 0 (0.0%) |
| 35 Years and over | 19 (100.0%) | 0 (0.0%) |
| Total | 706 (88.7%) | 90 (11.3%) |
Educational Attainment by Field of Study in Clever
Education (96 | 22.6%), science & technology (78 | 18.3%), business (71 | 16.7%), arts & humanities (40 | 9.4%), and bio, nature & agricultural (31 | 7.3%) are the most common fields of study among 425 individuals in Clever who have obtained a bachelor's degree or higher.
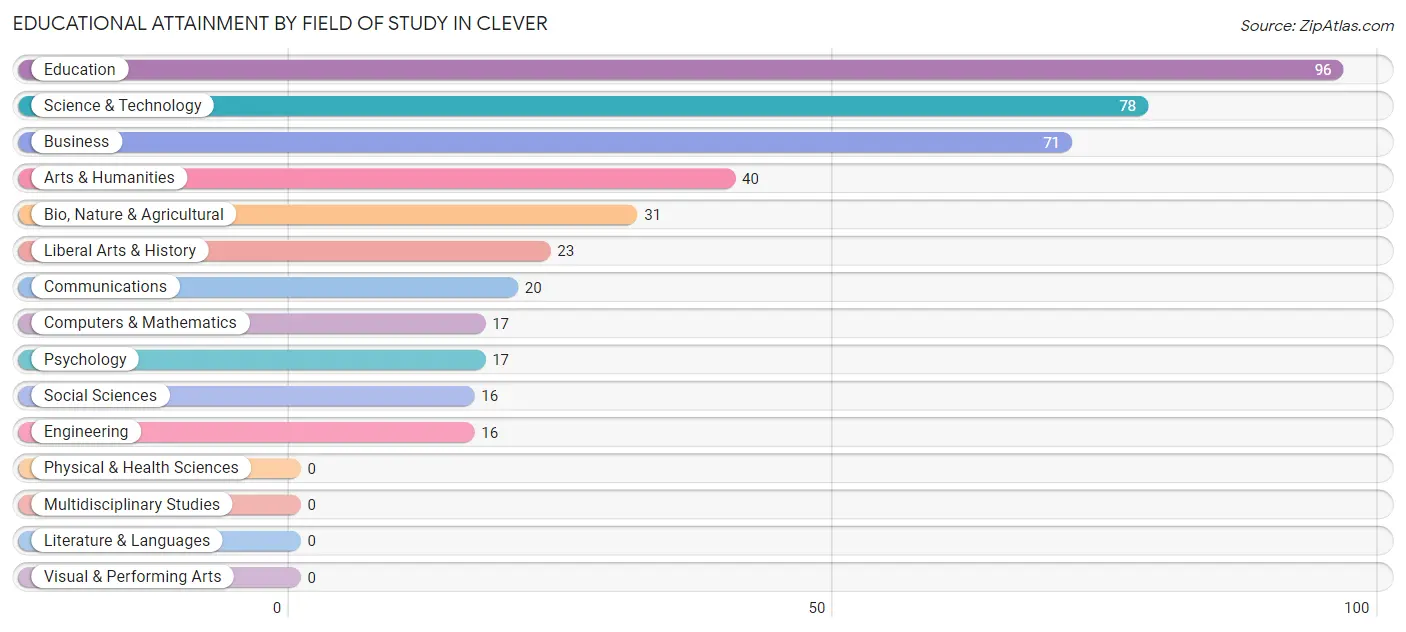
| Field of Study | # Graduates | % Graduates |
| Computers & Mathematics | 17 | 4.0% |
| Bio, Nature & Agricultural | 31 | 7.3% |
| Physical & Health Sciences | 0 | 0.0% |
| Psychology | 17 | 4.0% |
| Social Sciences | 16 | 3.8% |
| Engineering | 16 | 3.8% |
| Multidisciplinary Studies | 0 | 0.0% |
| Science & Technology | 78 | 18.3% |
| Business | 71 | 16.7% |
| Education | 96 | 22.6% |
| Literature & Languages | 0 | 0.0% |
| Liberal Arts & History | 23 | 5.4% |
| Visual & Performing Arts | 0 | 0.0% |
| Communications | 20 | 4.7% |
| Arts & Humanities | 40 | 9.4% |
| Total | 425 | 100.0% |
Transportation & Commute in Clever
Vehicle Availability by Sex in Clever
The most prevalent vehicle ownership categories in Clever are males with 2 vehicles (541, accounting for 65.5%) and females with 2 vehicles (322, making up 78.4%).
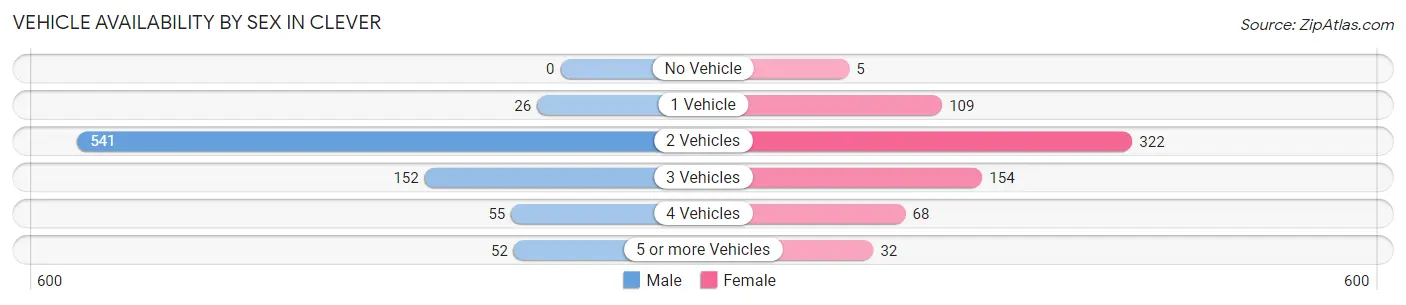
| Vehicles Available | Male | Female |
| No Vehicle | 0 (0.0%) | 5 (0.7%) |
| 1 Vehicle | 26 (3.2%) | 109 (15.8%) |
| 2 Vehicles | 541 (65.5%) | 322 (46.7%) |
| 3 Vehicles | 152 (18.4%) | 154 (22.3%) |
| 4 Vehicles | 55 (6.7%) | 68 (9.9%) |
| 5 or more Vehicles | 52 (6.3%) | 32 (4.6%) |
| Total | 826 (100.0%) | 690 (100.0%) |
Commute Time in Clever
The most frequently occuring commute durations in Clever are 30 to 34 minutes (420 commuters, 28.2%), 25 to 29 minutes (164 commuters, 11.0%), and 20 to 24 minutes (148 commuters, 9.9%).
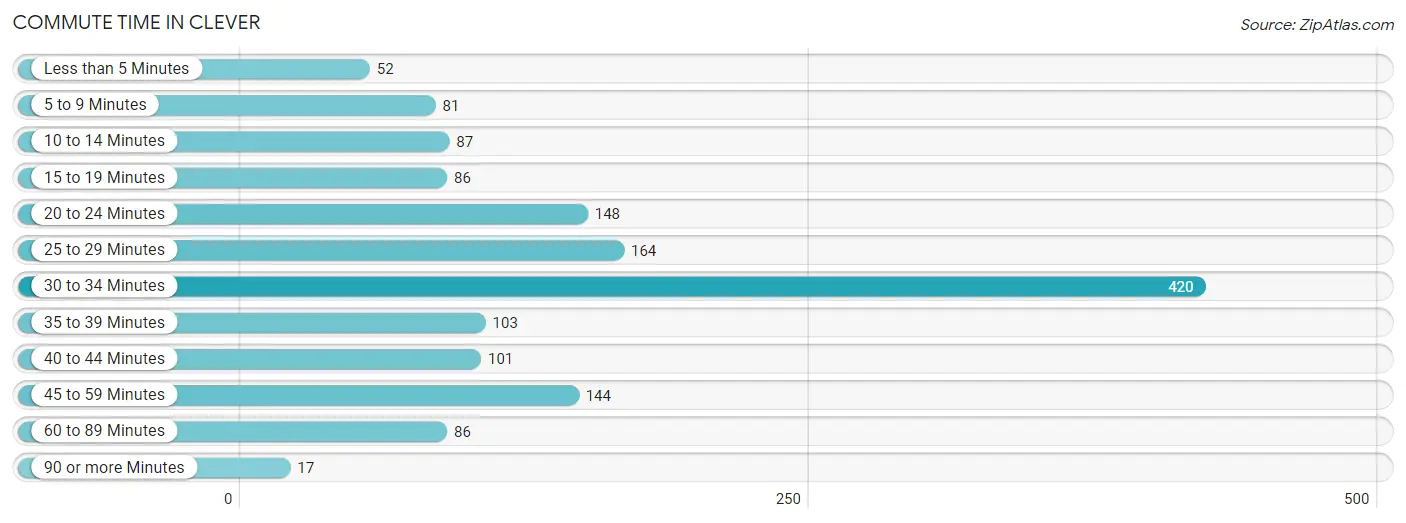
| Commute Time | # Commuters | % Commuters |
| Less than 5 Minutes | 52 | 3.5% |
| 5 to 9 Minutes | 81 | 5.4% |
| 10 to 14 Minutes | 87 | 5.8% |
| 15 to 19 Minutes | 86 | 5.8% |
| 20 to 24 Minutes | 148 | 9.9% |
| 25 to 29 Minutes | 164 | 11.0% |
| 30 to 34 Minutes | 420 | 28.2% |
| 35 to 39 Minutes | 103 | 6.9% |
| 40 to 44 Minutes | 101 | 6.8% |
| 45 to 59 Minutes | 144 | 9.7% |
| 60 to 89 Minutes | 86 | 5.8% |
| 90 or more Minutes | 17 | 1.1% |
Commute Time by Sex in Clever
The most common commute times in Clever are 30 to 34 minutes (240 commuters, 29.1%) for males and 30 to 34 minutes (180 commuters, 27.2%) for females.
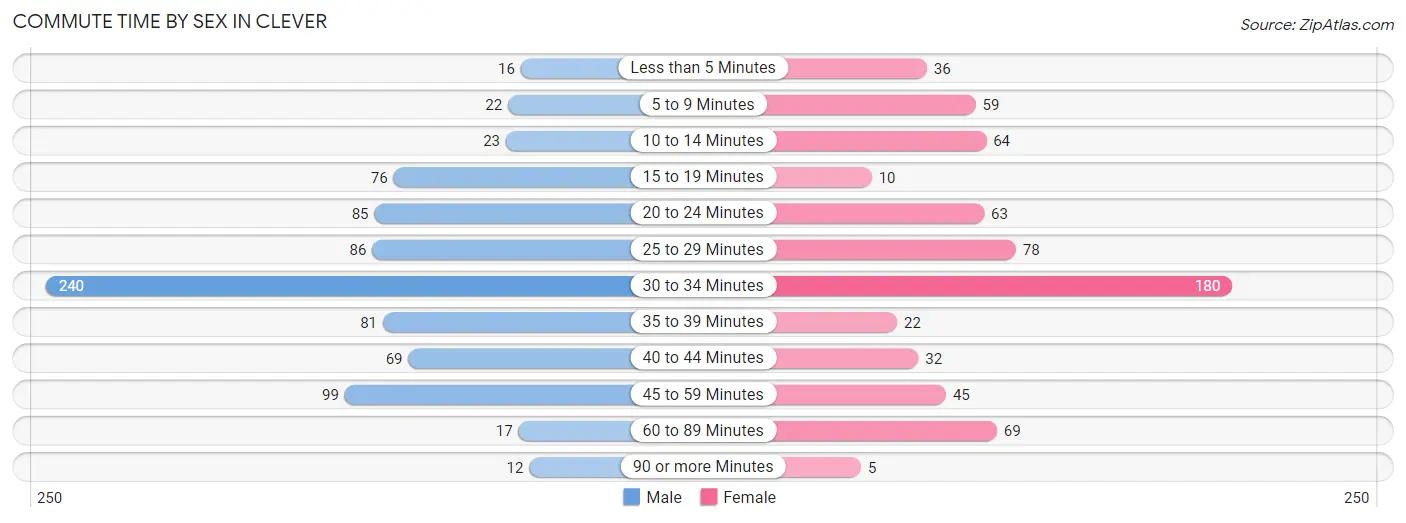
| Commute Time | Male | Female |
| Less than 5 Minutes | 16 (1.9%) | 36 (5.4%) |
| 5 to 9 Minutes | 22 (2.7%) | 59 (8.9%) |
| 10 to 14 Minutes | 23 (2.8%) | 64 (9.7%) |
| 15 to 19 Minutes | 76 (9.2%) | 10 (1.5%) |
| 20 to 24 Minutes | 85 (10.3%) | 63 (9.5%) |
| 25 to 29 Minutes | 86 (10.4%) | 78 (11.8%) |
| 30 to 34 Minutes | 240 (29.1%) | 180 (27.2%) |
| 35 to 39 Minutes | 81 (9.8%) | 22 (3.3%) |
| 40 to 44 Minutes | 69 (8.4%) | 32 (4.8%) |
| 45 to 59 Minutes | 99 (12.0%) | 45 (6.8%) |
| 60 to 89 Minutes | 17 (2.1%) | 69 (10.4%) |
| 90 or more Minutes | 12 (1.5%) | 5 (0.7%) |
Time of Departure to Work by Sex in Clever
The most frequent times of departure to work in Clever are 7:00 AM to 7:29 AM (99, 12.0%) for males and 7:00 AM to 7:29 AM (128, 19.3%) for females.
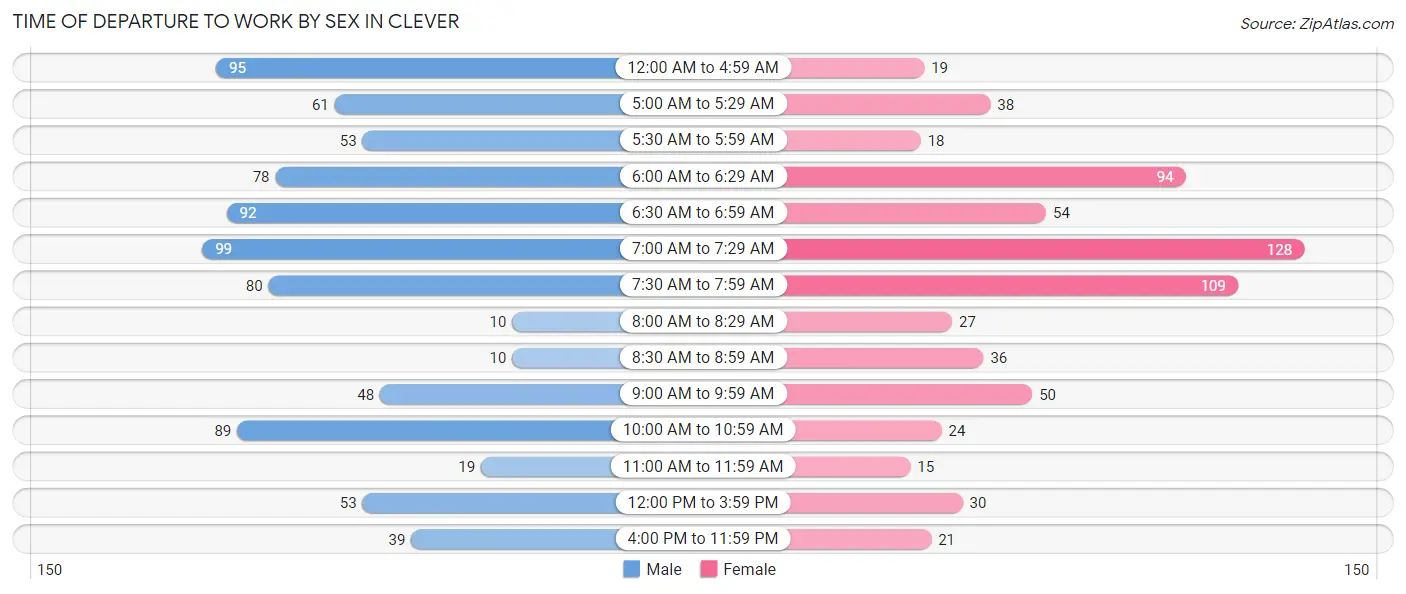
| Time of Departure | Male | Female |
| 12:00 AM to 4:59 AM | 95 (11.5%) | 19 (2.9%) |
| 5:00 AM to 5:29 AM | 61 (7.4%) | 38 (5.7%) |
| 5:30 AM to 5:59 AM | 53 (6.4%) | 18 (2.7%) |
| 6:00 AM to 6:29 AM | 78 (9.4%) | 94 (14.2%) |
| 6:30 AM to 6:59 AM | 92 (11.1%) | 54 (8.1%) |
| 7:00 AM to 7:29 AM | 99 (12.0%) | 128 (19.3%) |
| 7:30 AM to 7:59 AM | 80 (9.7%) | 109 (16.4%) |
| 8:00 AM to 8:29 AM | 10 (1.2%) | 27 (4.1%) |
| 8:30 AM to 8:59 AM | 10 (1.2%) | 36 (5.4%) |
| 9:00 AM to 9:59 AM | 48 (5.8%) | 50 (7.5%) |
| 10:00 AM to 10:59 AM | 89 (10.8%) | 24 (3.6%) |
| 11:00 AM to 11:59 AM | 19 (2.3%) | 15 (2.3%) |
| 12:00 PM to 3:59 PM | 53 (6.4%) | 30 (4.5%) |
| 4:00 PM to 11:59 PM | 39 (4.7%) | 21 (3.2%) |
| Total | 826 (100.0%) | 663 (100.0%) |
Housing Occupancy in Clever
Occupancy by Ownership in Clever
Of the total 1,024 dwellings in Clever, owner-occupied units account for 747 (73.0%), while renter-occupied units make up 277 (27.1%).
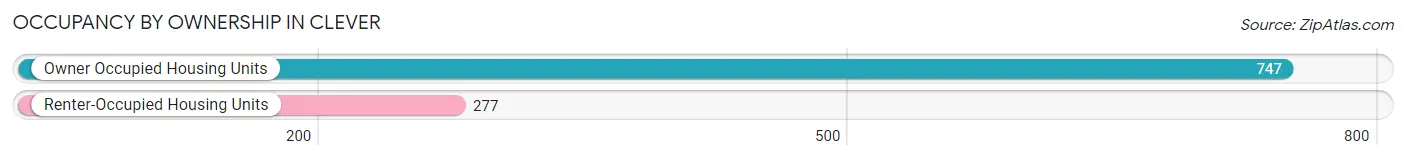
| Occupancy | # Housing Units | % Housing Units |
| Owner Occupied Housing Units | 747 | 73.0% |
| Renter-Occupied Housing Units | 277 | 27.1% |
| Total Occupied Housing Units | 1,024 | 100.0% |
Occupancy by Household Size in Clever
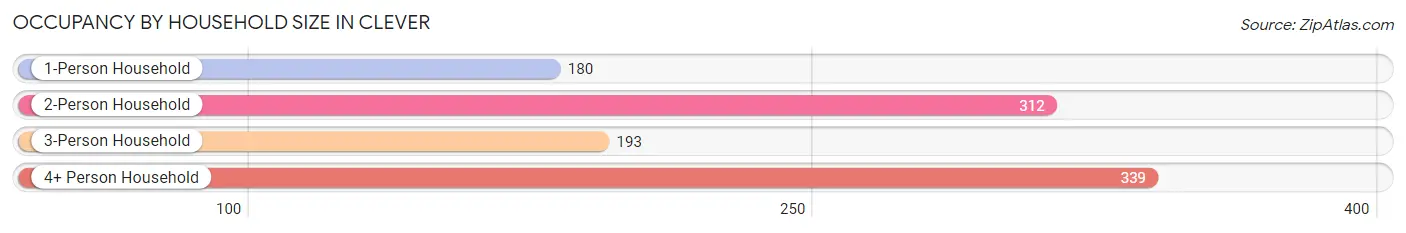
| Household Size | # Housing Units | % Housing Units |
| 1-Person Household | 180 | 17.6% |
| 2-Person Household | 312 | 30.5% |
| 3-Person Household | 193 | 18.9% |
| 4+ Person Household | 339 | 33.1% |
| Total Housing Units | 1,024 | 100.0% |
Occupancy by Ownership by Household Size in Clever
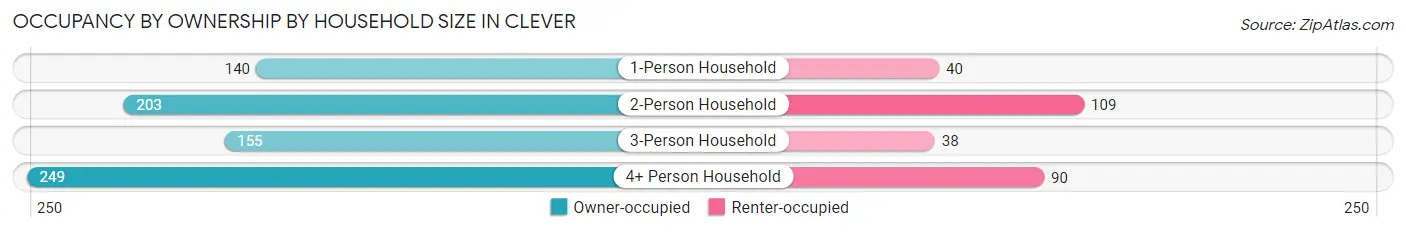
| Household Size | Owner-occupied | Renter-occupied |
| 1-Person Household | 140 (77.8%) | 40 (22.2%) |
| 2-Person Household | 203 (65.1%) | 109 (34.9%) |
| 3-Person Household | 155 (80.3%) | 38 (19.7%) |
| 4+ Person Household | 249 (73.5%) | 90 (26.6%) |
| Total Housing Units | 747 (73.0%) | 277 (27.1%) |
Occupancy by Educational Attainment in Clever
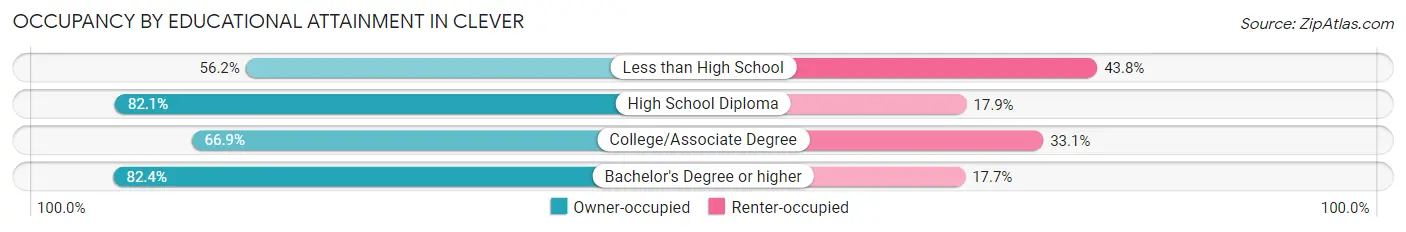
| Household Size | Owner-occupied | Renter-occupied |
| Less than High School | 50 (56.2%) | 39 (43.8%) |
| High School Diploma | 188 (82.1%) | 41 (17.9%) |
| College/Associate Degree | 313 (66.9%) | 155 (33.1%) |
| Bachelor's Degree or higher | 196 (82.4%) | 42 (17.6%) |
Occupancy by Age of Householder in Clever
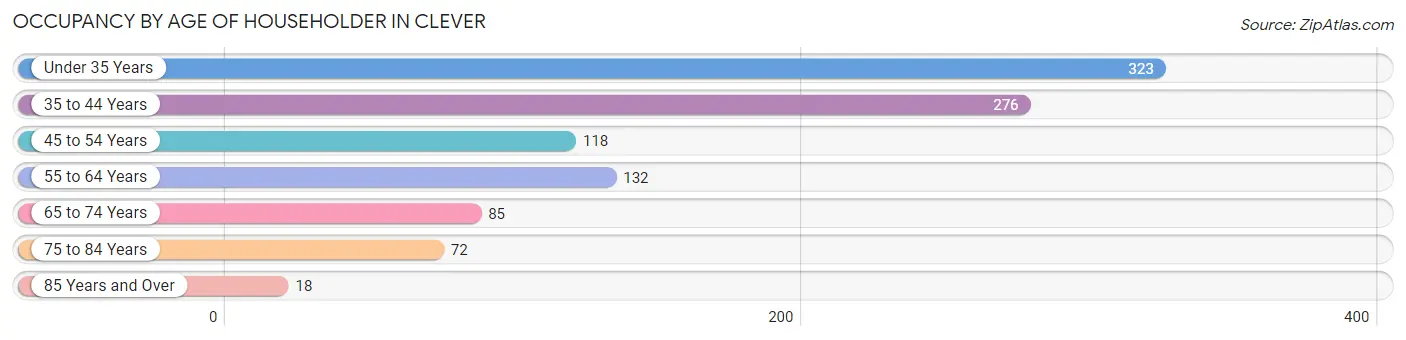
| Age Bracket | # Households | % Households |
| Under 35 Years | 323 | 31.5% |
| 35 to 44 Years | 276 | 27.0% |
| 45 to 54 Years | 118 | 11.5% |
| 55 to 64 Years | 132 | 12.9% |
| 65 to 74 Years | 85 | 8.3% |
| 75 to 84 Years | 72 | 7.0% |
| 85 Years and Over | 18 | 1.8% |
| Total | 1,024 | 100.0% |
Housing Finances in Clever
Median Income by Occupancy in Clever
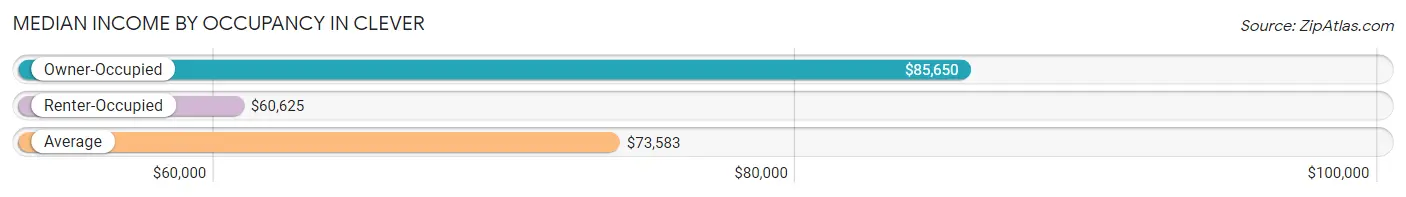
| Occupancy Type | # Households | Median Income |
| Owner-Occupied | 747 (73.0%) | $85,650 |
| Renter-Occupied | 277 (27.1%) | $60,625 |
| Average | 1,024 (100.0%) | $73,583 |
Occupancy by Householder Income Bracket in Clever
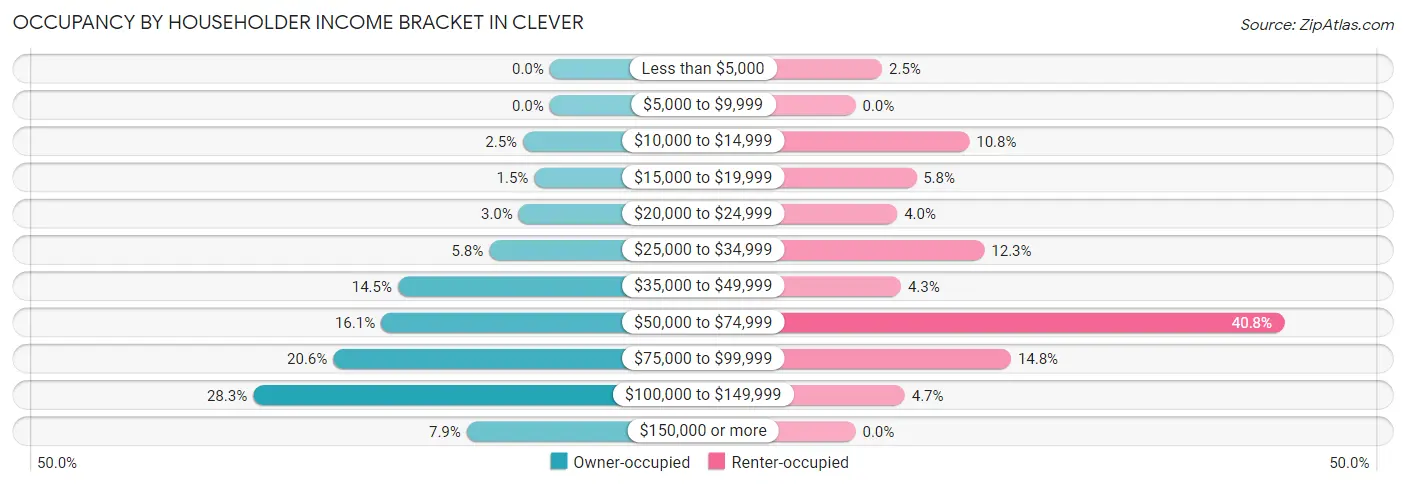
| Income Bracket | Owner-occupied | Renter-occupied |
| Less than $5,000 | 0 (0.0%) | 7 (2.5%) |
| $5,000 to $9,999 | 0 (0.0%) | 0 (0.0%) |
| $10,000 to $14,999 | 19 (2.5%) | 30 (10.8%) |
| $15,000 to $19,999 | 11 (1.5%) | 16 (5.8%) |
| $20,000 to $24,999 | 22 (2.9%) | 11 (4.0%) |
| $25,000 to $34,999 | 43 (5.8%) | 34 (12.3%) |
| $35,000 to $49,999 | 108 (14.5%) | 12 (4.3%) |
| $50,000 to $74,999 | 120 (16.1%) | 113 (40.8%) |
| $75,000 to $99,999 | 154 (20.6%) | 41 (14.8%) |
| $100,000 to $149,999 | 211 (28.2%) | 13 (4.7%) |
| $150,000 or more | 59 (7.9%) | 0 (0.0%) |
| Total | 747 (100.0%) | 277 (100.0%) |
Monthly Housing Cost Tiers in Clever
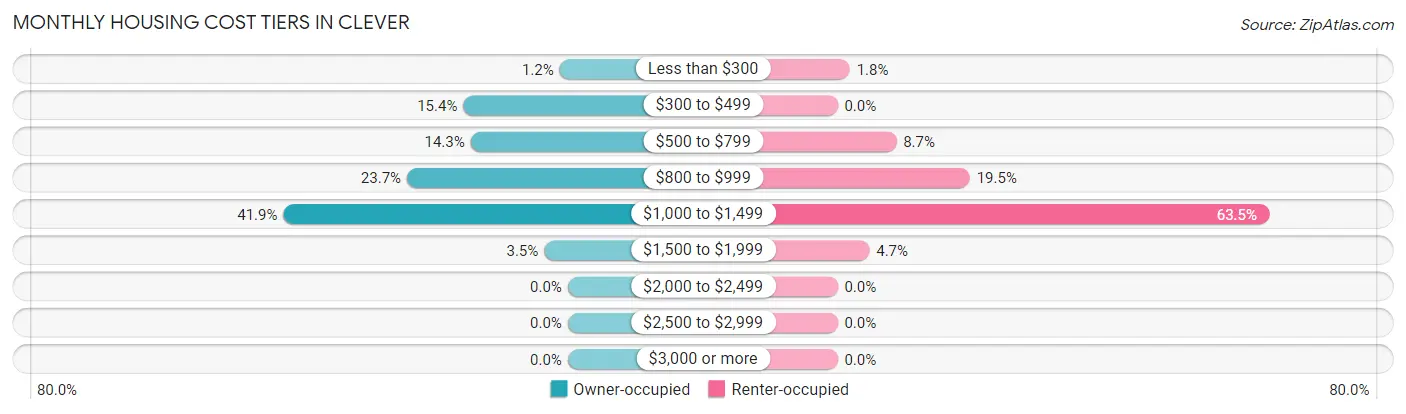
| Monthly Cost | Owner-occupied | Renter-occupied |
| Less than $300 | 9 (1.2%) | 5 (1.8%) |
| $300 to $499 | 115 (15.4%) | 0 (0.0%) |
| $500 to $799 | 107 (14.3%) | 24 (8.7%) |
| $800 to $999 | 177 (23.7%) | 54 (19.5%) |
| $1,000 to $1,499 | 313 (41.9%) | 176 (63.5%) |
| $1,500 to $1,999 | 26 (3.5%) | 13 (4.7%) |
| $2,000 to $2,499 | 0 (0.0%) | 0 (0.0%) |
| $2,500 to $2,999 | 0 (0.0%) | 0 (0.0%) |
| $3,000 or more | 0 (0.0%) | 0 (0.0%) |
| Total | 747 (100.0%) | 277 (100.0%) |
Physical Housing Characteristics in Clever
Housing Structures in Clever
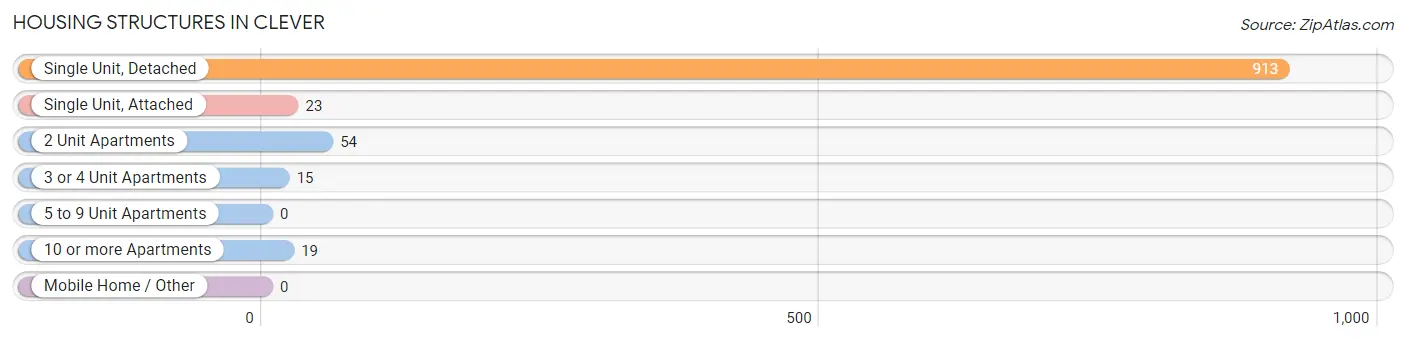
| Structure Type | # Housing Units | % Housing Units |
| Single Unit, Detached | 913 | 89.2% |
| Single Unit, Attached | 23 | 2.2% |
| 2 Unit Apartments | 54 | 5.3% |
| 3 or 4 Unit Apartments | 15 | 1.5% |
| 5 to 9 Unit Apartments | 0 | 0.0% |
| 10 or more Apartments | 19 | 1.9% |
| Mobile Home / Other | 0 | 0.0% |
| Total | 1,024 | 100.0% |
Housing Structures by Occupancy in Clever
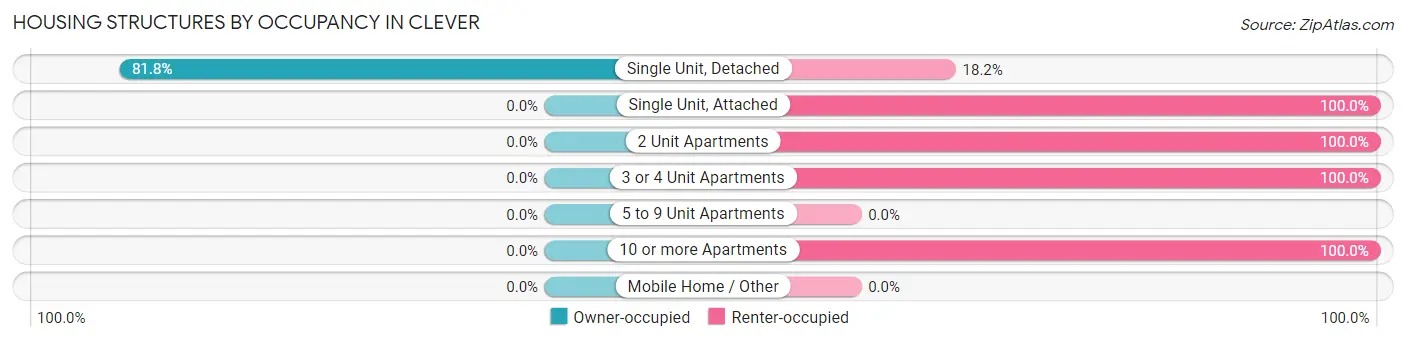
| Structure Type | Owner-occupied | Renter-occupied |
| Single Unit, Detached | 747 (81.8%) | 166 (18.2%) |
| Single Unit, Attached | 0 (0.0%) | 23 (100.0%) |
| 2 Unit Apartments | 0 (0.0%) | 54 (100.0%) |
| 3 or 4 Unit Apartments | 0 (0.0%) | 15 (100.0%) |
| 5 to 9 Unit Apartments | 0 (0.0%) | 0 (0.0%) |
| 10 or more Apartments | 0 (0.0%) | 19 (100.0%) |
| Mobile Home / Other | 0 (0.0%) | 0 (0.0%) |
| Total | 747 (73.0%) | 277 (27.1%) |
Housing Structures by Number of Rooms in Clever
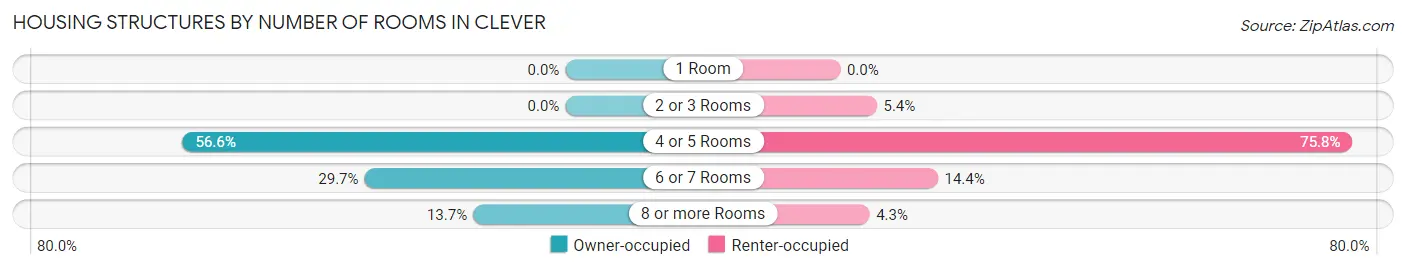
| Number of Rooms | Owner-occupied | Renter-occupied |
| 1 Room | 0 (0.0%) | 0 (0.0%) |
| 2 or 3 Rooms | 0 (0.0%) | 15 (5.4%) |
| 4 or 5 Rooms | 423 (56.6%) | 210 (75.8%) |
| 6 or 7 Rooms | 222 (29.7%) | 40 (14.4%) |
| 8 or more Rooms | 102 (13.7%) | 12 (4.3%) |
| Total | 747 (100.0%) | 277 (100.0%) |
Housing Structure by Heating Type in Clever
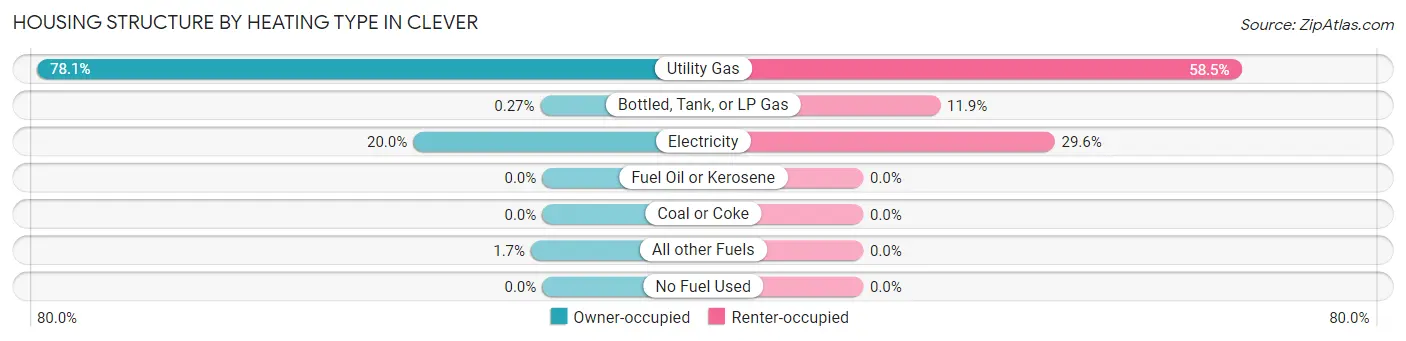
| Heating Type | Owner-occupied | Renter-occupied |
| Utility Gas | 583 (78.0%) | 162 (58.5%) |
| Bottled, Tank, or LP Gas | 2 (0.3%) | 33 (11.9%) |
| Electricity | 149 (20.0%) | 82 (29.6%) |
| Fuel Oil or Kerosene | 0 (0.0%) | 0 (0.0%) |
| Coal or Coke | 0 (0.0%) | 0 (0.0%) |
| All other Fuels | 13 (1.7%) | 0 (0.0%) |
| No Fuel Used | 0 (0.0%) | 0 (0.0%) |
| Total | 747 (100.0%) | 277 (100.0%) |
Household Vehicle Usage in Clever
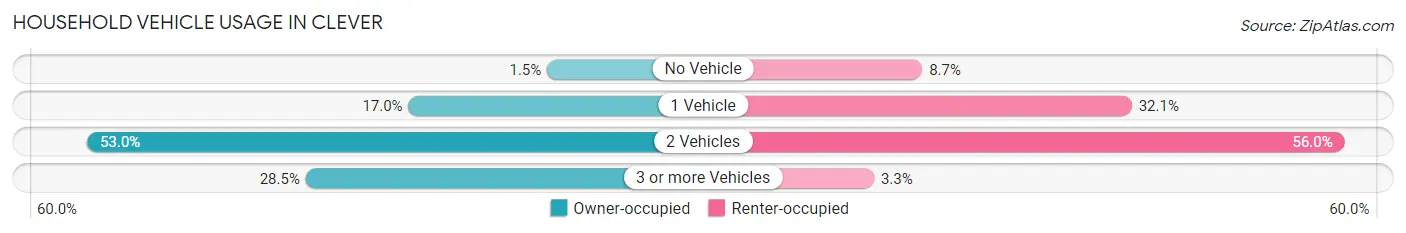
| Vehicles per Household | Owner-occupied | Renter-occupied |
| No Vehicle | 11 (1.5%) | 24 (8.7%) |
| 1 Vehicle | 127 (17.0%) | 89 (32.1%) |
| 2 Vehicles | 396 (53.0%) | 155 (56.0%) |
| 3 or more Vehicles | 213 (28.5%) | 9 (3.3%) |
| Total | 747 (100.0%) | 277 (100.0%) |
Real Estate & Mortgages in Clever
Real Estate and Mortgage Overview in Clever
| Characteristic | Without Mortgage | With Mortgage |
| Housing Units | 165 | 582 |
| Median Property Value | $140,800 | $151,300 |
| Median Household Income | - | - |
| Monthly Housing Costs | $439 | $0 |
| Real Estate Taxes | $1,279 | $29 |
Property Value by Mortgage Status in Clever
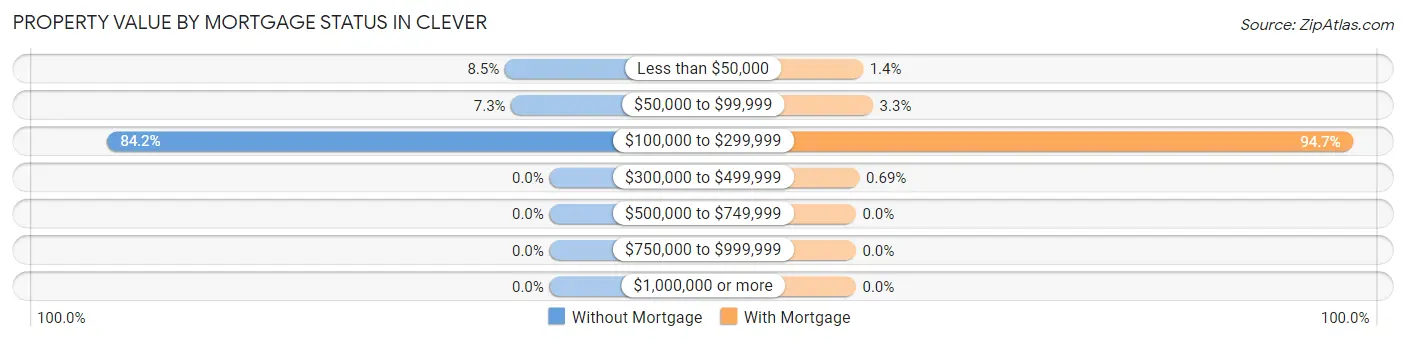
| Property Value | Without Mortgage | With Mortgage |
| Less than $50,000 | 14 (8.5%) | 8 (1.4%) |
| $50,000 to $99,999 | 12 (7.3%) | 19 (3.3%) |
| $100,000 to $299,999 | 139 (84.2%) | 551 (94.7%) |
| $300,000 to $499,999 | 0 (0.0%) | 4 (0.7%) |
| $500,000 to $749,999 | 0 (0.0%) | 0 (0.0%) |
| $750,000 to $999,999 | 0 (0.0%) | 0 (0.0%) |
| $1,000,000 or more | 0 (0.0%) | 0 (0.0%) |
| Total | 165 (100.0%) | 582 (100.0%) |
Household Income by Mortgage Status in Clever
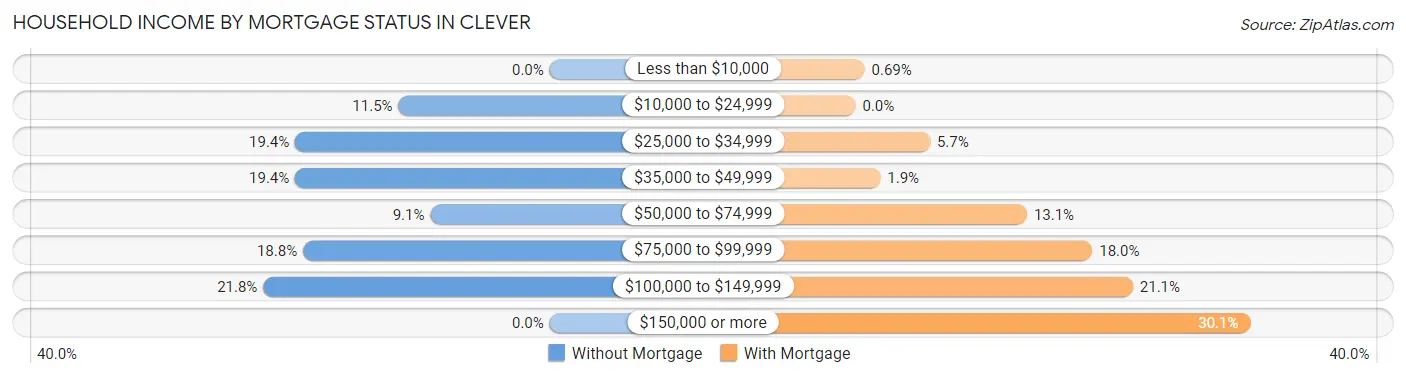
| Household Income | Without Mortgage | With Mortgage |
| Less than $10,000 | 0 (0.0%) | 4 (0.7%) |
| $10,000 to $24,999 | 19 (11.5%) | 0 (0.0%) |
| $25,000 to $34,999 | 32 (19.4%) | 33 (5.7%) |
| $35,000 to $49,999 | 32 (19.4%) | 11 (1.9%) |
| $50,000 to $74,999 | 15 (9.1%) | 76 (13.1%) |
| $75,000 to $99,999 | 31 (18.8%) | 105 (18.0%) |
| $100,000 to $149,999 | 36 (21.8%) | 123 (21.1%) |
| $150,000 or more | 0 (0.0%) | 175 (30.1%) |
| Total | 165 (100.0%) | 582 (100.0%) |
Property Value to Household Income Ratio in Clever
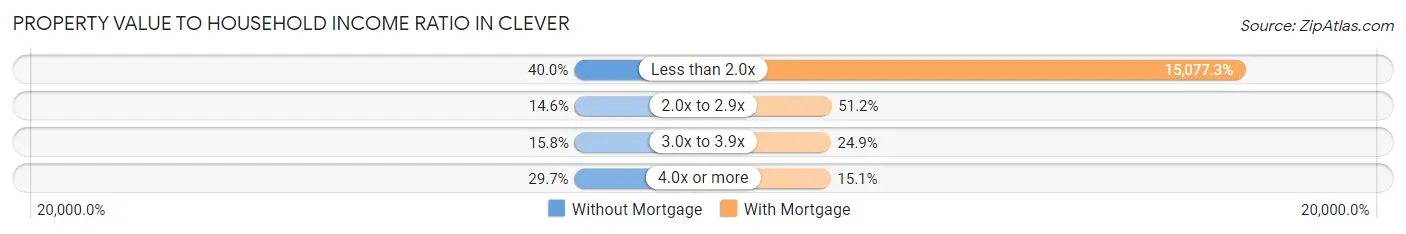
| Value-to-Income Ratio | Without Mortgage | With Mortgage |
| Less than 2.0x | 66 (40.0%) | 87,750 (15,077.3%) |
| 2.0x to 2.9x | 24 (14.5%) | 298 (51.2%) |
| 3.0x to 3.9x | 26 (15.8%) | 145 (24.9%) |
| 4.0x or more | 49 (29.7%) | 88 (15.1%) |
| Total | 165 (100.0%) | 582 (100.0%) |
Real Estate Taxes by Mortgage Status in Clever
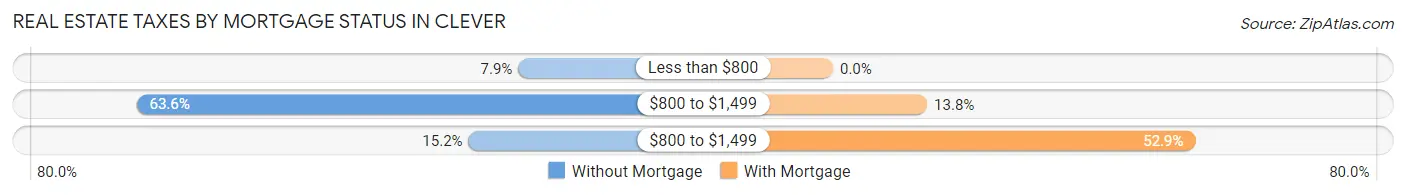
| Property Taxes | Without Mortgage | With Mortgage |
| Less than $800 | 13 (7.9%) | 0 (0.0%) |
| $800 to $1,499 | 105 (63.6%) | 80 (13.8%) |
| $800 to $1,499 | 25 (15.1%) | 308 (52.9%) |
| Total | 165 (100.0%) | 582 (100.0%) |
Health & Disability in Clever
Health Insurance Coverage by Age in Clever
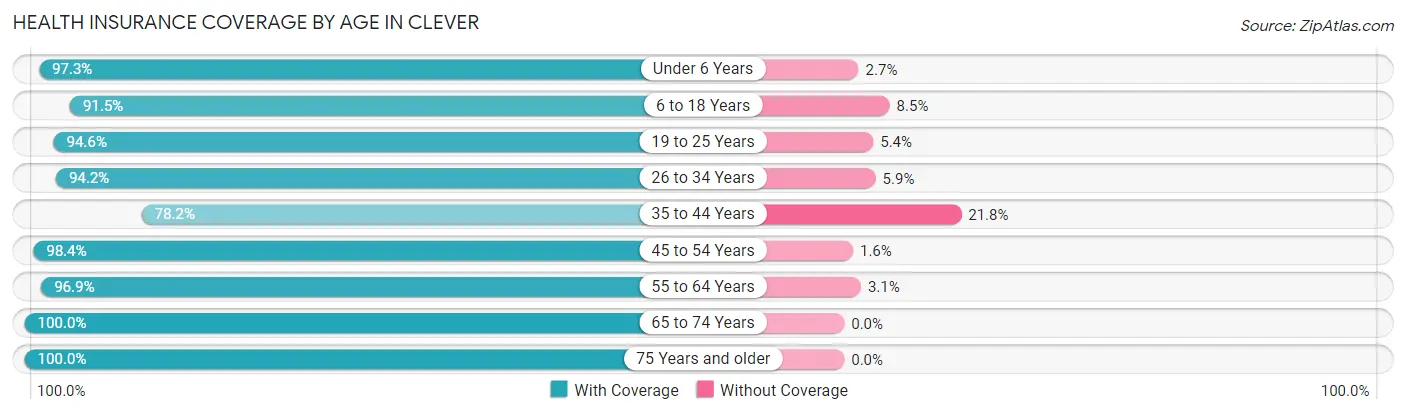
| Age Bracket | With Coverage | Without Coverage |
| Under 6 Years | 290 (97.3%) | 8 (2.7%) |
| 6 to 18 Years | 563 (91.5%) | 52 (8.5%) |
| 19 to 25 Years | 245 (94.6%) | 14 (5.4%) |
| 26 to 34 Years | 483 (94.2%) | 30 (5.9%) |
| 35 to 44 Years | 412 (78.2%) | 115 (21.8%) |
| 45 to 54 Years | 241 (98.4%) | 4 (1.6%) |
| 55 to 64 Years | 218 (96.9%) | 7 (3.1%) |
| 65 to 74 Years | 125 (100.0%) | 0 (0.0%) |
| 75 Years and older | 119 (100.0%) | 0 (0.0%) |
| Total | 2,696 (92.1%) | 230 (7.9%) |
Health Insurance Coverage by Citizenship Status in Clever
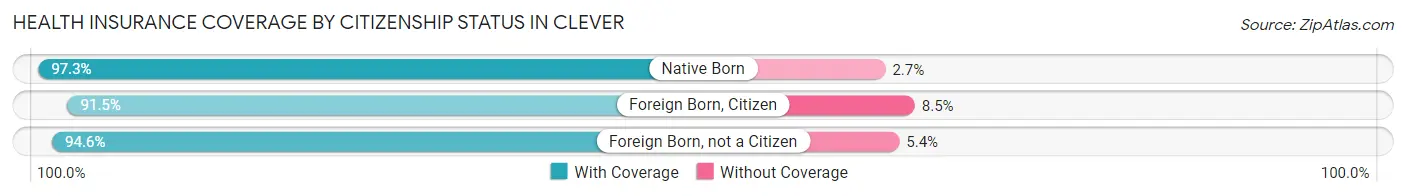
| Citizenship Status | With Coverage | Without Coverage |
| Native Born | 290 (97.3%) | 8 (2.7%) |
| Foreign Born, Citizen | 563 (91.5%) | 52 (8.5%) |
| Foreign Born, not a Citizen | 245 (94.6%) | 14 (5.4%) |
Health Insurance Coverage by Household Income in Clever
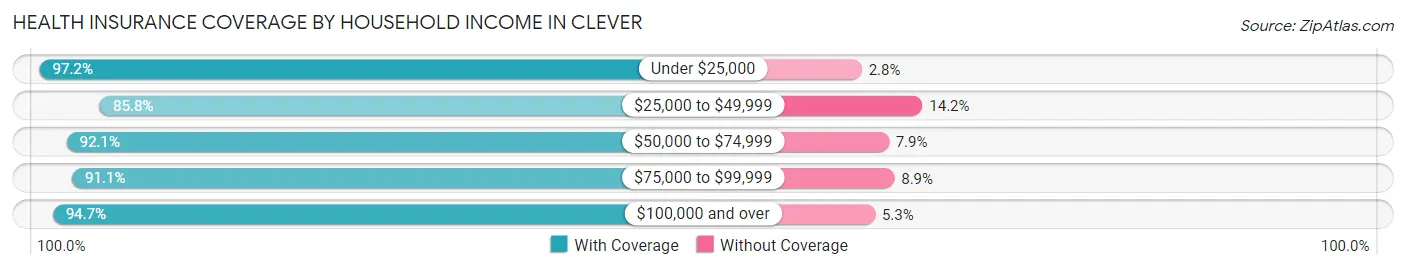
| Household Income | With Coverage | Without Coverage |
| Under $25,000 | 208 (97.2%) | 6 (2.8%) |
| $25,000 to $49,999 | 406 (85.8%) | 67 (14.2%) |
| $50,000 to $74,999 | 645 (92.1%) | 55 (7.9%) |
| $75,000 to $99,999 | 522 (91.1%) | 51 (8.9%) |
| $100,000 and over | 915 (94.7%) | 51 (5.3%) |
Public vs Private Health Insurance Coverage by Age in Clever
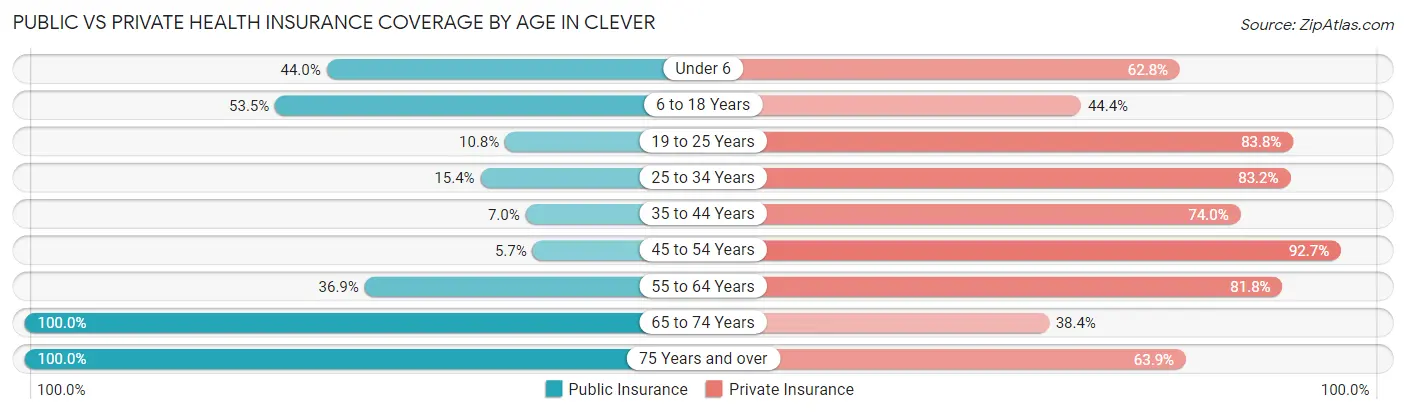
| Age Bracket | Public Insurance | Private Insurance |
| Under 6 | 131 (44.0%) | 187 (62.7%) |
| 6 to 18 Years | 329 (53.5%) | 273 (44.4%) |
| 19 to 25 Years | 28 (10.8%) | 217 (83.8%) |
| 25 to 34 Years | 79 (15.4%) | 427 (83.2%) |
| 35 to 44 Years | 37 (7.0%) | 390 (74.0%) |
| 45 to 54 Years | 14 (5.7%) | 227 (92.6%) |
| 55 to 64 Years | 83 (36.9%) | 184 (81.8%) |
| 65 to 74 Years | 125 (100.0%) | 48 (38.4%) |
| 75 Years and over | 119 (100.0%) | 76 (63.9%) |
| Total | 945 (32.3%) | 2,029 (69.3%) |
Disability Status by Sex by Age in Clever
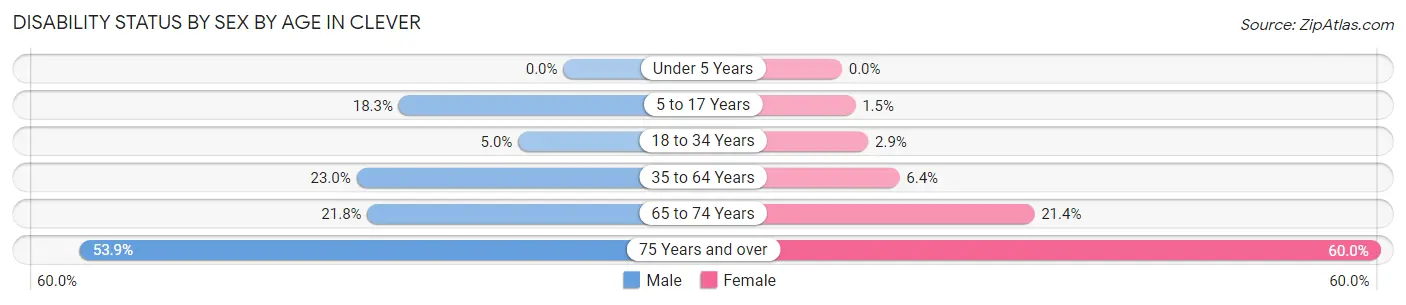
| Age Bracket | Male | Female |
| Under 5 Years | 0 (0.0%) | 0 (0.0%) |
| 5 to 17 Years | 55 (18.3%) | 5 (1.5%) |
| 18 to 34 Years | 19 (5.0%) | 12 (2.9%) |
| 35 to 64 Years | 111 (23.0%) | 33 (6.4%) |
| 65 to 74 Years | 12 (21.8%) | 15 (21.4%) |
| 75 Years and over | 21 (53.8%) | 48 (60.0%) |
Disability Class by Sex by Age in Clever
Disability Class: Hearing Difficulty
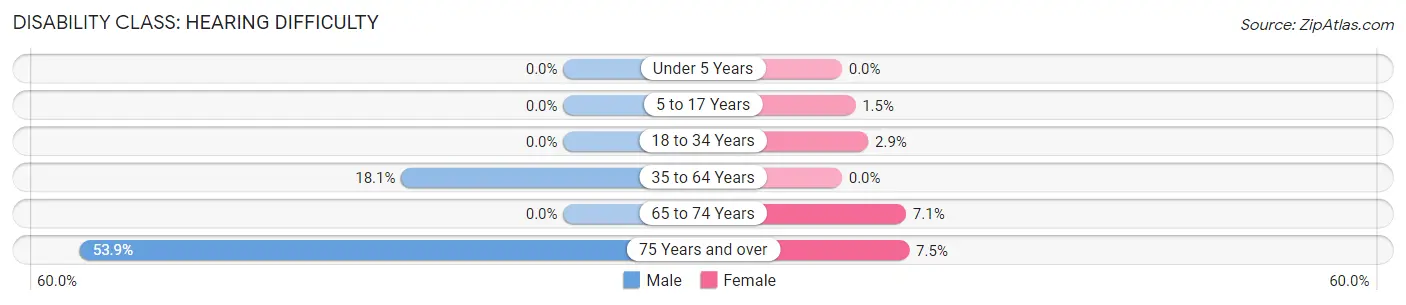
| Age Bracket | Male | Female |
| Under 5 Years | 0 (0.0%) | 0 (0.0%) |
| 5 to 17 Years | 0 (0.0%) | 5 (1.5%) |
| 18 to 34 Years | 0 (0.0%) | 12 (2.9%) |
| 35 to 64 Years | 87 (18.0%) | 0 (0.0%) |
| 65 to 74 Years | 0 (0.0%) | 5 (7.1%) |
| 75 Years and over | 21 (53.8%) | 6 (7.5%) |
Disability Class: Vision Difficulty
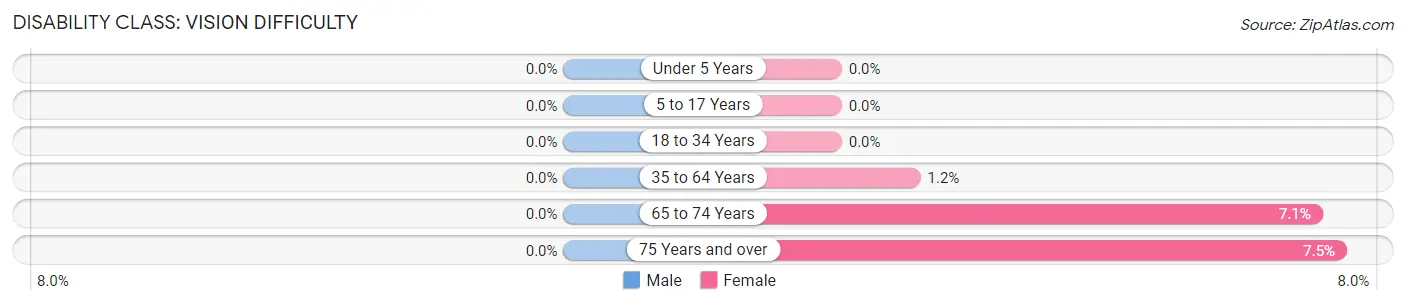
| Age Bracket | Male | Female |
| Under 5 Years | 0 (0.0%) | 0 (0.0%) |
| 5 to 17 Years | 0 (0.0%) | 0 (0.0%) |
| 18 to 34 Years | 0 (0.0%) | 0 (0.0%) |
| 35 to 64 Years | 0 (0.0%) | 6 (1.2%) |
| 65 to 74 Years | 0 (0.0%) | 5 (7.1%) |
| 75 Years and over | 0 (0.0%) | 6 (7.5%) |
Disability Class: Cognitive Difficulty
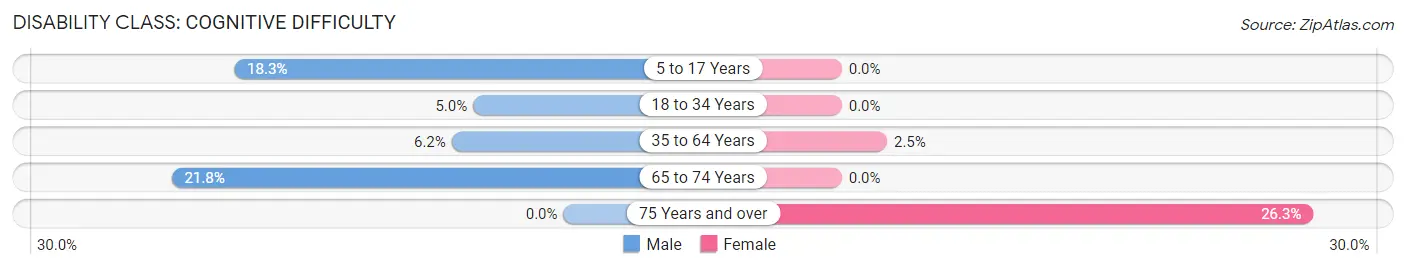
| Age Bracket | Male | Female |
| 5 to 17 Years | 55 (18.3%) | 0 (0.0%) |
| 18 to 34 Years | 19 (5.0%) | 0 (0.0%) |
| 35 to 64 Years | 30 (6.2%) | 13 (2.5%) |
| 65 to 74 Years | 12 (21.8%) | 0 (0.0%) |
| 75 Years and over | 0 (0.0%) | 21 (26.3%) |
Disability Class: Ambulatory Difficulty
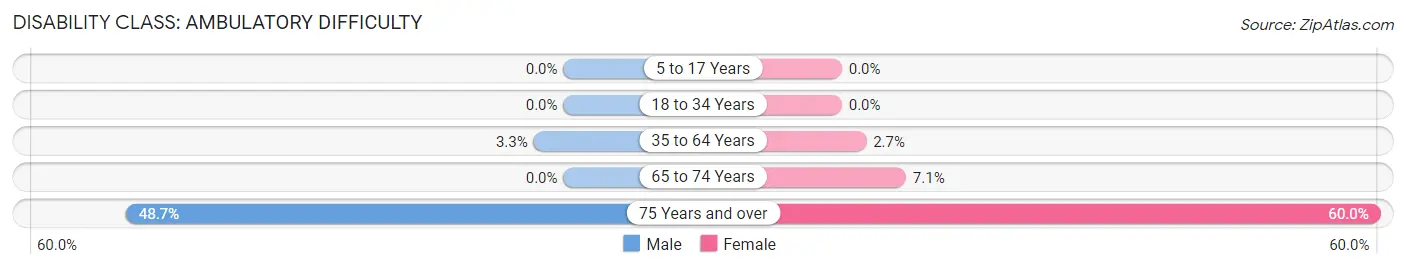
| Age Bracket | Male | Female |
| 5 to 17 Years | 0 (0.0%) | 0 (0.0%) |
| 18 to 34 Years | 0 (0.0%) | 0 (0.0%) |
| 35 to 64 Years | 16 (3.3%) | 14 (2.7%) |
| 65 to 74 Years | 0 (0.0%) | 5 (7.1%) |
| 75 Years and over | 19 (48.7%) | 48 (60.0%) |
Disability Class: Self-Care Difficulty
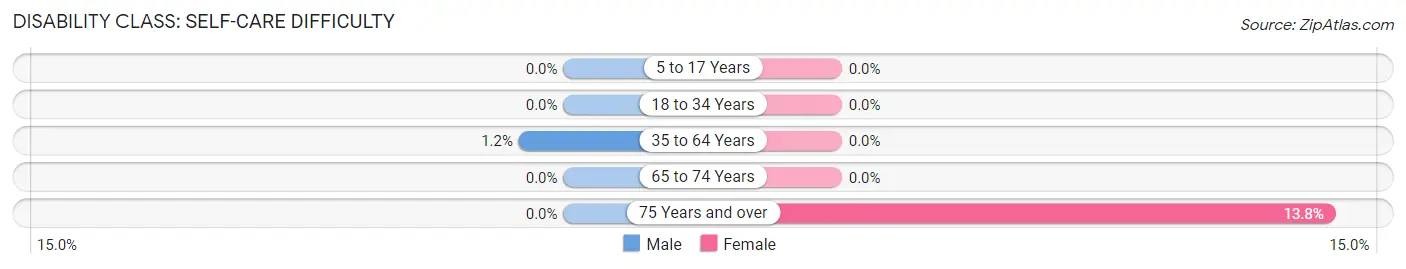
| Age Bracket | Male | Female |
| 5 to 17 Years | 0 (0.0%) | 0 (0.0%) |
| 18 to 34 Years | 0 (0.0%) | 0 (0.0%) |
| 35 to 64 Years | 6 (1.2%) | 0 (0.0%) |
| 65 to 74 Years | 0 (0.0%) | 0 (0.0%) |
| 75 Years and over | 0 (0.0%) | 11 (13.8%) |
Technology Access in Clever
Computing Device Access in Clever
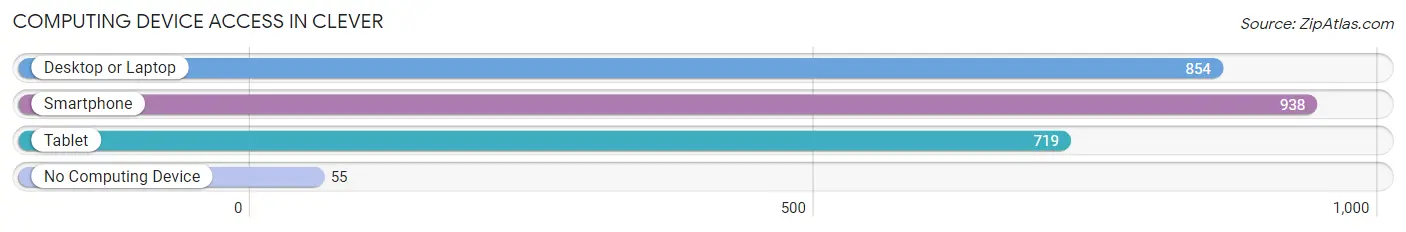
| Device Type | # Households | % Households |
| Desktop or Laptop | 854 | 83.4% |
| Smartphone | 938 | 91.6% |
| Tablet | 719 | 70.2% |
| No Computing Device | 55 | 5.4% |
| Total | 1,024 | 100.0% |
Internet Access in Clever
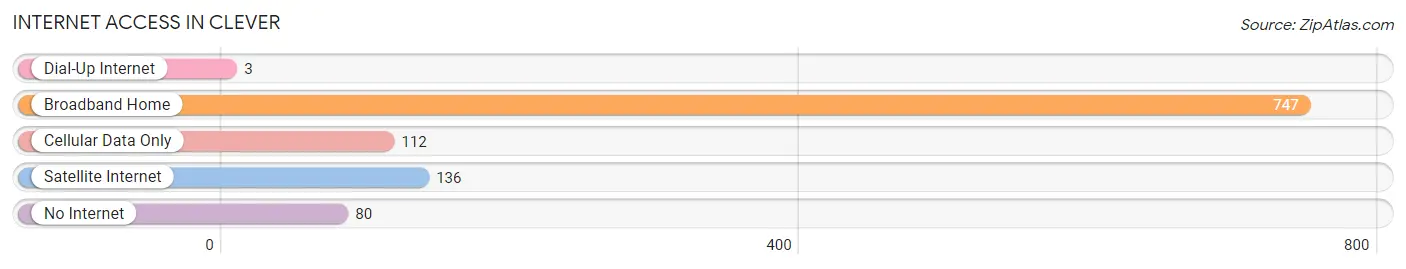
| Internet Type | # Households | % Households |
| Dial-Up Internet | 3 | 0.3% |
| Broadband Home | 747 | 73.0% |
| Cellular Data Only | 112 | 10.9% |
| Satellite Internet | 136 | 13.3% |
| No Internet | 80 | 7.8% |
| Total | 1,024 | 100.0% |
Clever Summary
Clever, Missouri is a small town located in Christian County, Missouri. It is situated in the Ozark Mountains, approximately 20 miles north of Springfield. The town was founded in 1883 and has a population of approximately 2,000 people.
History
Clever was founded in 1883 by a group of settlers from the nearby town of Ozark. The town was named after a local Native American chief, Chief Clever. The settlers were attracted to the area due to its fertile soil and abundant natural resources.
The town quickly grew and by the early 1900s, it had become a thriving agricultural community. The town was home to several businesses, including a general store, a blacksmith shop, a grist mill, and a sawmill.
In the 1920s, the town began to experience a decline in population as many of the residents moved away to larger cities. However, the town was able to remain a viable community due to its proximity to Springfield and the presence of several small businesses.
Geography
Clever is located in the Ozark Mountains, approximately 20 miles north of Springfield. The town is situated in a valley surrounded by rolling hills and is home to several creeks and streams. The town is located in a temperate climate, with hot summers and mild winters.
The town is located near several state parks, including Mark Twain National Forest, Table Rock Lake, and Bull Shoals Lake. These parks provide a variety of recreational activities, including camping, fishing, and hiking.
Economy
The economy of Clever is largely based on agriculture. The town is home to several farms, which produce a variety of crops, including corn, soybeans, and wheat. The town is also home to several small businesses, including a general store, a hardware store, and a restaurant.
The town is also home to several manufacturing companies, including a furniture factory and a plastics factory. These companies provide employment opportunities for many of the town’s residents.
Demographics
As of the 2010 census, the population of Clever was 2,000. The town is predominantly white, with approximately 95% of the population being Caucasian. The town is also home to a small Hispanic population, as well as a small African American population.
The median household income in Clever is approximately $35,000, which is slightly lower than the national average. The town has a poverty rate of approximately 15%, which is slightly higher than the national average.
Conclusion
Clever, Missouri is a small town located in Christian County, Missouri. It is situated in the Ozark Mountains, approximately 20 miles north of Springfield. The town was founded in 1883 and has a population of approximately 2,000 people. The town’s economy is largely based on agriculture, with several small businesses and manufacturing companies providing employment opportunities for many of the town’s residents. The town is predominantly white, with a small Hispanic and African American population. The median household income in Clever is approximately $35,000, which is slightly lower than the national average.
Common Questions
What is Per Capita Income in Clever?
Per Capita income in Clever is $26,883.
What is the Median Family Income in Clever?
Median Family Income in Clever is $77,594.
What is the Median Household income in Clever?
Median Household Income in Clever is $73,583.
What is Income or Wage Gap in Clever?
Income or Wage Gap in Clever is 30.7%.
Women in Clever earn 69.3 cents for every dollar earned by a man.
What is Inequality or Gini Index in Clever?
Inequality or Gini Index in Clever is 0.30.
What is the Total Population of Clever?
Total Population of Clever is 2,926.
What is the Total Male Population of Clever?
Total Male Population of Clever is 1,399.
What is the Total Female Population of Clever?
Total Female Population of Clever is 1,527.
What is the Ratio of Males per 100 Females in Clever?
There are 91.62 Males per 100 Females in Clever.
What is the Ratio of Females per 100 Males in Clever?
There are 109.15 Females per 100 Males in Clever.
What is the Median Population Age in Clever?
Median Population Age in Clever is 31.3 Years.
What is the Average Family Size in Clever
Average Family Size in Clever is 3.3 People.
What is the Average Household Size in Clever
Average Household Size in Clever is 2.9 People.
How Large is the Labor Force in Clever?
There are 1,578 People in the Labor Forcein in Clever.
What is the Percentage of People in the Labor Force in Clever?
72.3% of People are in the Labor Force in Clever.
What is the Unemployment Rate in Clever?
Unemployment Rate in Clever is 1.9%.