Cleveland, MO Map & Demographics
Cleveland Map
Cleveland Overview
$35,285
PER CAPITA INCOME
$73,281
AVG FAMILY INCOME
$74,514
AVG HOUSEHOLD INCOME
30.1%
WAGE / INCOME GAP [ % ]
69.9¢/ $1
WAGE / INCOME GAP [ $ ]
0.37
INEQUALITY / GINI INDEX
923
TOTAL POPULATION
444
MALE POPULATION
479
FEMALE POPULATION
92.69
MALES / 100 FEMALES
107.88
FEMALES / 100 MALES
42.8
MEDIAN AGE
2.9
AVG FAMILY SIZE
2.6
AVG HOUSEHOLD SIZE
447
LABOR FORCE [ PEOPLE ]
59.7%
PERCENT IN LABOR FORCE
2.5%
UNEMPLOYMENT RATE
Cleveland Zip Codes
Cleveland Area Codes
Income in Cleveland
Income Overview in Cleveland
Per Capita Income in Cleveland is $35,285, while median incomes of families and households are $73,281 and $74,514 respectively.
| Characteristic | Number | Measure |
| Per Capita Income | 923 | $35,285 |
| Median Family Income | 274 | $73,281 |
| Mean Family Income | 274 | $85,375 |
| Median Household Income | 349 | $74,514 |
| Mean Household Income | 349 | $90,052 |
| Income Deficit | 274 | $0 |
| Wage / Income Gap (%) | 923 | 30.08% |
| Wage / Income Gap ($) | 923 | 69.92¢ per $1 |
| Gini / Inequality Index | 923 | 0.37 |
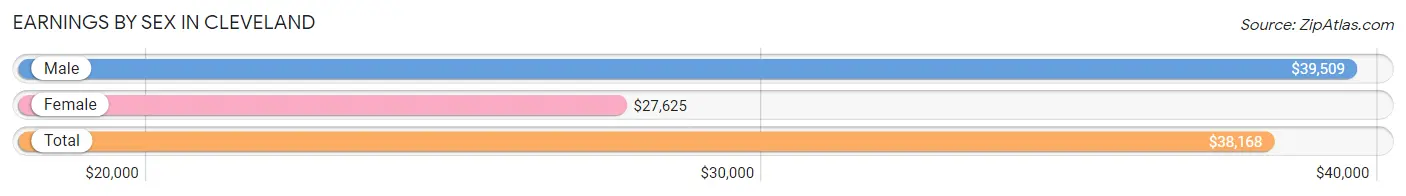
Earnings by Sex in Cleveland
Average Earnings in Cleveland are $38,168, $39,509 for men and $27,625 for women, a difference of 30.1%.
| Sex | Number | Average Earnings |
| Male | 262 (50.9%) | $39,509 |
| Female | 253 (49.1%) | $27,625 |
| Total | 515 (100.0%) | $38,168 |
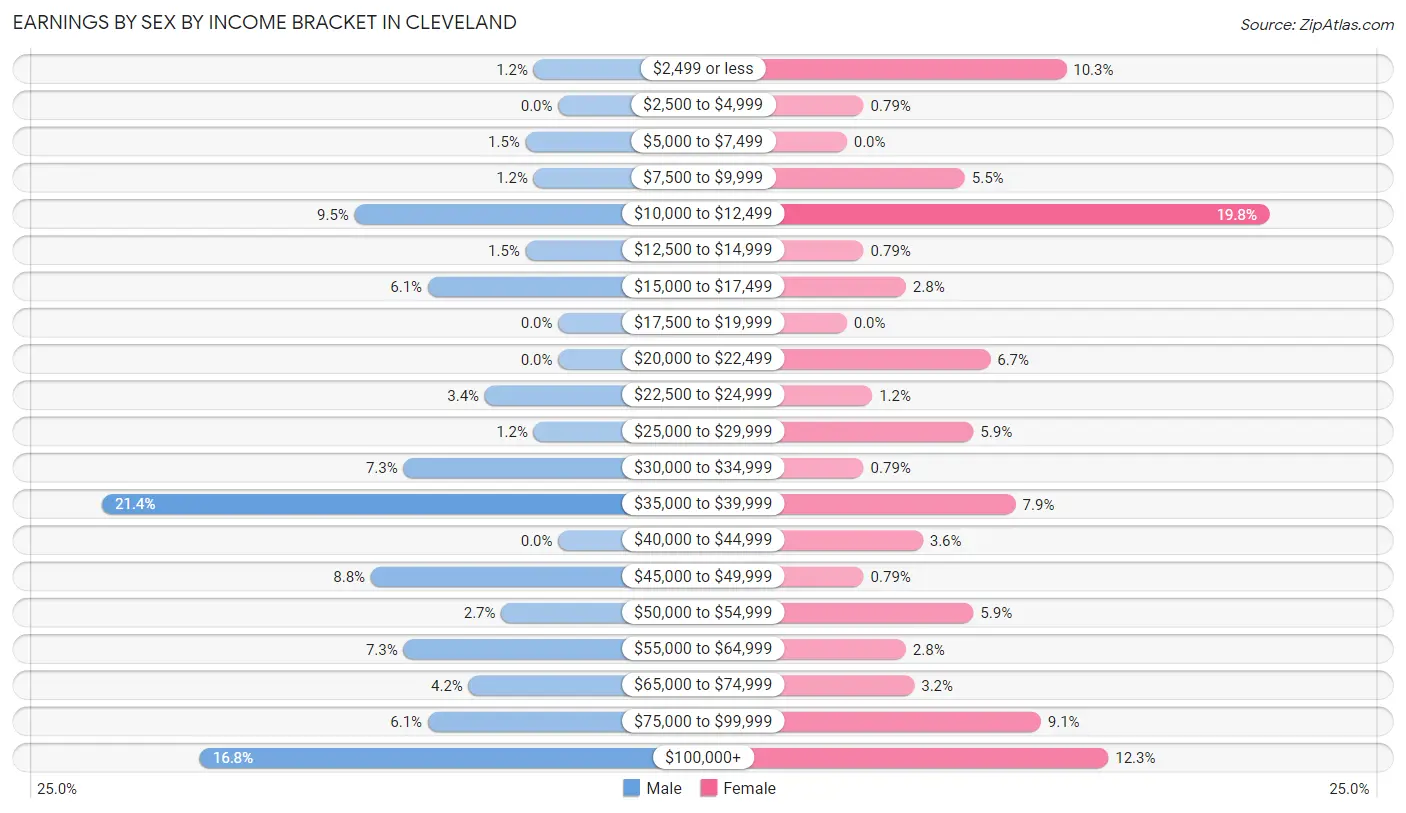
Earnings by Sex by Income Bracket in Cleveland
The most common earnings brackets in Cleveland are $35,000 to $39,999 for men (56 | 21.4%) and $10,000 to $12,499 for women (50 | 19.8%).
| Income | Male | Female |
| $2,499 or less | 3 (1.1%) | 26 (10.3%) |
| $2,500 to $4,999 | 0 (0.0%) | 2 (0.8%) |
| $5,000 to $7,499 | 4 (1.5%) | 0 (0.0%) |
| $7,500 to $9,999 | 3 (1.1%) | 14 (5.5%) |
| $10,000 to $12,499 | 25 (9.5%) | 50 (19.8%) |
| $12,500 to $14,999 | 4 (1.5%) | 2 (0.8%) |
| $15,000 to $17,499 | 16 (6.1%) | 7 (2.8%) |
| $17,500 to $19,999 | 0 (0.0%) | 0 (0.0%) |
| $20,000 to $22,499 | 0 (0.0%) | 17 (6.7%) |
| $22,500 to $24,999 | 9 (3.4%) | 3 (1.2%) |
| $25,000 to $29,999 | 3 (1.1%) | 15 (5.9%) |
| $30,000 to $34,999 | 19 (7.2%) | 2 (0.8%) |
| $35,000 to $39,999 | 56 (21.4%) | 20 (7.9%) |
| $40,000 to $44,999 | 0 (0.0%) | 9 (3.6%) |
| $45,000 to $49,999 | 23 (8.8%) | 2 (0.8%) |
| $50,000 to $54,999 | 7 (2.7%) | 15 (5.9%) |
| $55,000 to $64,999 | 19 (7.2%) | 7 (2.8%) |
| $65,000 to $74,999 | 11 (4.2%) | 8 (3.2%) |
| $75,000 to $99,999 | 16 (6.1%) | 23 (9.1%) |
| $100,000+ | 44 (16.8%) | 31 (12.2%) |
| Total | 262 (100.0%) | 253 (100.0%) |
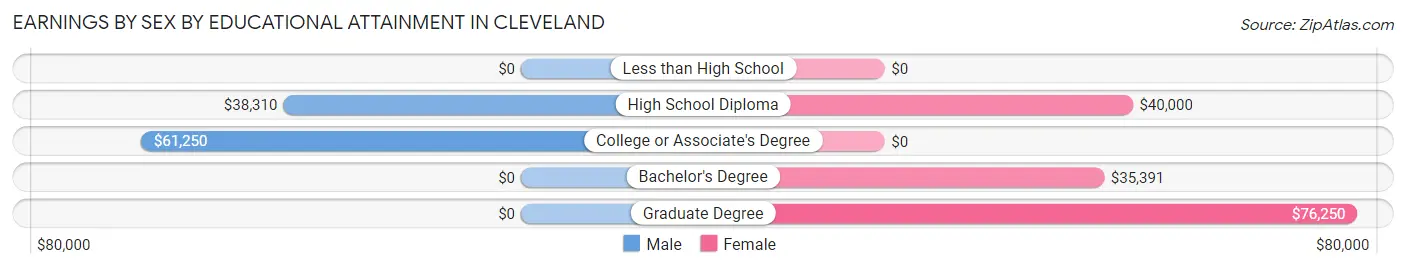
Earnings by Sex by Educational Attainment in Cleveland
Average earnings in Cleveland are $39,933 for men and $37,153 for women, a difference of 7.0%. Men with an educational attainment of college or associate's degree enjoy the highest average annual earnings of $61,250, while those with high school diploma education earn the least with $38,310. Women with an educational attainment of graduate degree earn the most with the average annual earnings of $76,250, while those with bachelor's degree education have the smallest earnings of $35,391.
| Educational Attainment | Male Income | Female Income |
| Less than High School | - | - |
| High School Diploma | $38,310 | $40,000 |
| College or Associate's Degree | $61,250 | $0 |
| Bachelor's Degree | - | - |
| Graduate Degree | - | - |
| Total | $39,933 | $37,153 |
Family Income in Cleveland
Family Income Brackets in Cleveland
According to the Cleveland family income data, there are 98 families falling into the $50,000 to $74,999 income range, which is the most common income bracket and makes up 35.8% of all families. Conversely, the $35,000 to $49,999 income bracket is the least frequent group with only 8 families (2.9%) belonging to this category.
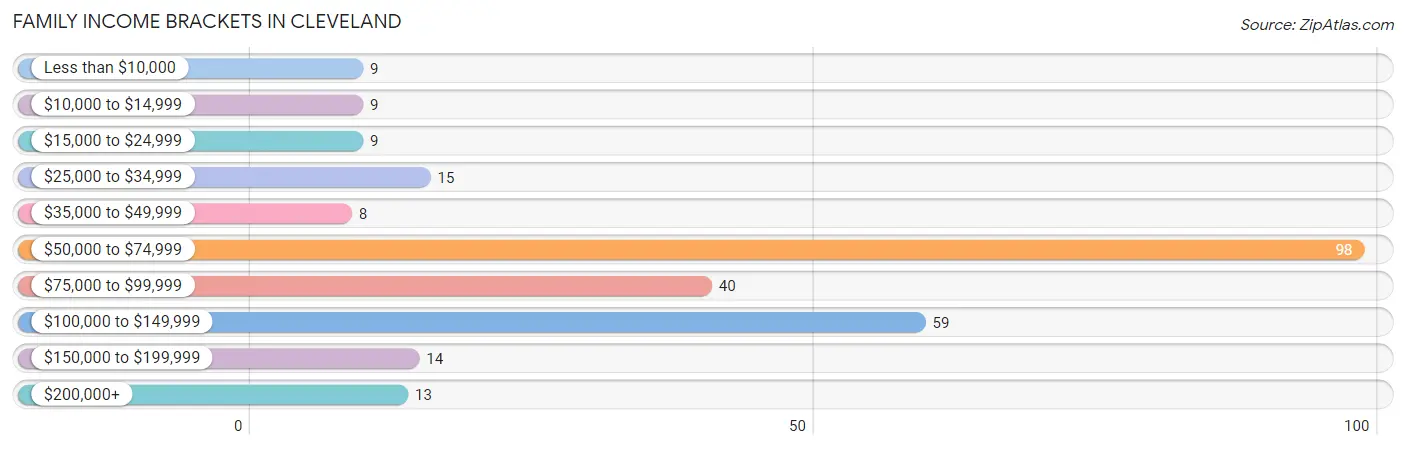
| Income Bracket | # Families | % Families |
| Less than $10,000 | 9 | 3.3% |
| $10,000 to $14,999 | 9 | 3.3% |
| $15,000 to $24,999 | 9 | 3.3% |
| $25,000 to $34,999 | 15 | 5.5% |
| $35,000 to $49,999 | 8 | 2.9% |
| $50,000 to $74,999 | 98 | 35.8% |
| $75,000 to $99,999 | 40 | 14.6% |
| $100,000 to $149,999 | 59 | 21.5% |
| $150,000 to $199,999 | 14 | 5.1% |
| $200,000+ | 13 | 4.7% |
Family Income by Famaliy Size in Cleveland
4-person families (13 | 4.7%) account for the highest median family income in Cleveland with $115,625 per family, while 4-person families (13 | 4.7%) have the highest median income of $28,906 per family member.
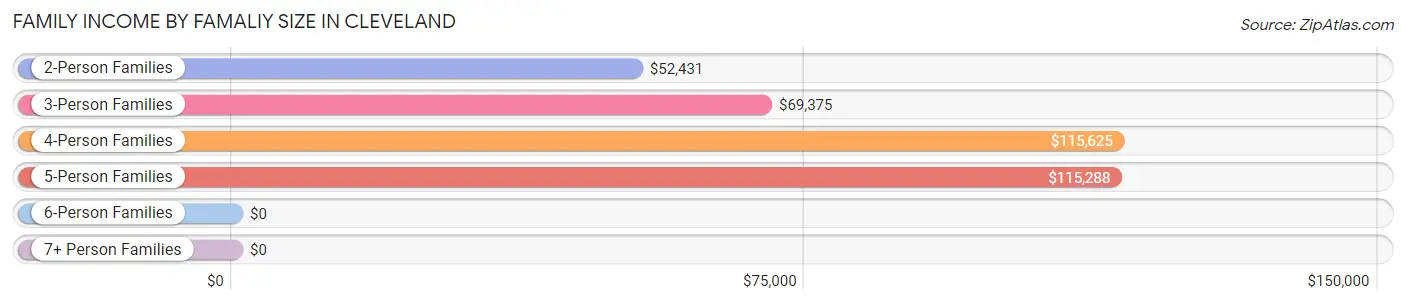
| Income Bracket | # Families | Median Income |
| 2-Person Families | 139 (50.7%) | $52,431 |
| 3-Person Families | 73 (26.6%) | $69,375 |
| 4-Person Families | 13 (4.7%) | $115,625 |
| 5-Person Families | 33 (12.0%) | $115,288 |
| 6-Person Families | 16 (5.8%) | $0 |
| 7+ Person Families | 0 (0.0%) | $0 |
| Total | 274 (100.0%) | $73,281 |
Family Income by Number of Earners in Cleveland
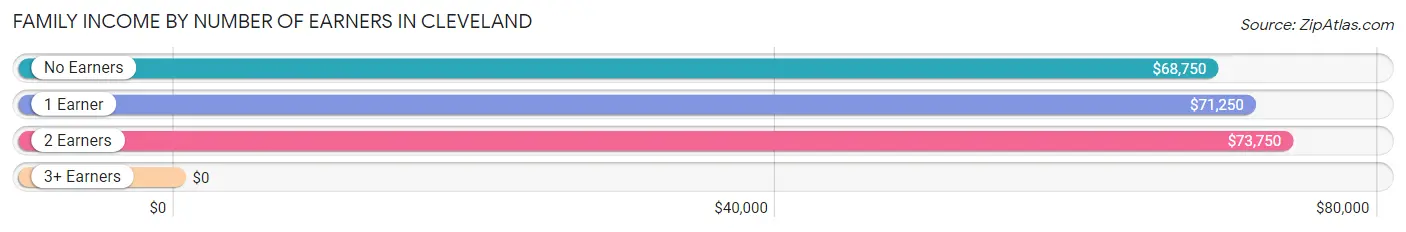
| Number of Earners | # Families | Median Income |
| No Earners | 40 (14.6%) | $68,750 |
| 1 Earner | 57 (20.8%) | $71,250 |
| 2 Earners | 158 (57.7%) | $73,750 |
| 3+ Earners | 19 (6.9%) | $0 |
| Total | 274 (100.0%) | $73,281 |
Household Income in Cleveland
Household Income Brackets in Cleveland
With 104 households falling in the category, the $50,000 to $74,999 income range is the most frequent in Cleveland, accounting for 29.8% of all households. In contrast, only 11 households (3.2%) fall into the less than $10,000 income bracket, making it the least populous group.
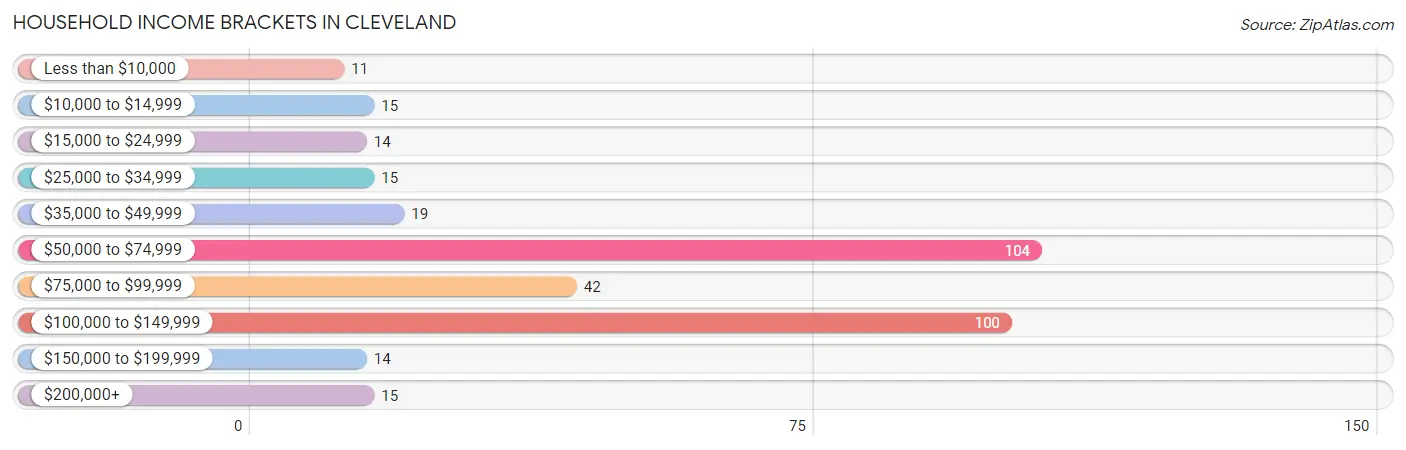
| Income Bracket | # Households | % Households |
| Less than $10,000 | 11 | 3.2% |
| $10,000 to $14,999 | 15 | 4.3% |
| $15,000 to $24,999 | 14 | 4.0% |
| $25,000 to $34,999 | 15 | 4.3% |
| $35,000 to $49,999 | 19 | 5.4% |
| $50,000 to $74,999 | 104 | 29.8% |
| $75,000 to $99,999 | 42 | 12.0% |
| $100,000 to $149,999 | 100 | 28.7% |
| $150,000 to $199,999 | 14 | 4.0% |
| $200,000+ | 15 | 4.3% |
Household Income by Householder Age in Cleveland
The median household income in Cleveland is $74,514, with the highest median household income of $82,153 found in the 25 to 44 years age bracket for the primary householder. A total of 91 households (26.1%) fall into this category. Meanwhile, the 15 to 24 years age bracket for the primary householder has the lowest median household income of $0, with 4 households (1.1%) in this group.
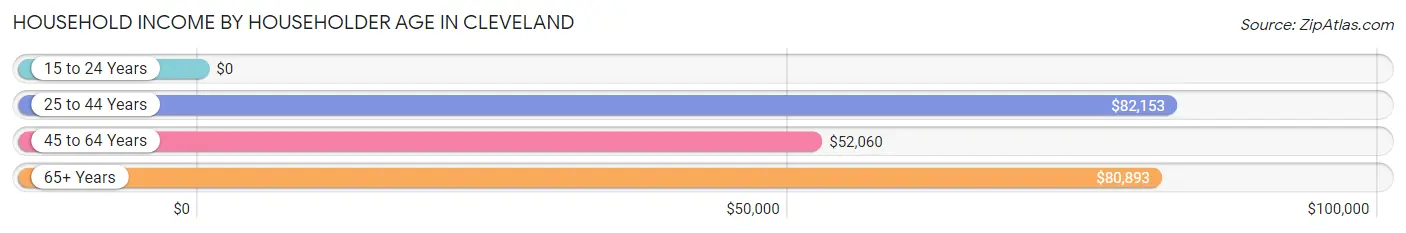
| Income Bracket | # Households | Median Income |
| 15 to 24 Years | 4 (1.1%) | $0 |
| 25 to 44 Years | 91 (26.1%) | $82,153 |
| 45 to 64 Years | 151 (43.3%) | $52,060 |
| 65+ Years | 103 (29.5%) | $80,893 |
| Total | 349 (100.0%) | $74,514 |
Poverty in Cleveland
Income Below Poverty by Sex and Age in Cleveland
With 11.9% poverty level for males and 10.0% for females among the residents of Cleveland, 15 year old males and 5 year old females are the most vulnerable to poverty, with 6 males (75.0%) and 3 females (60.0%) in their respective age groups living below the poverty level.
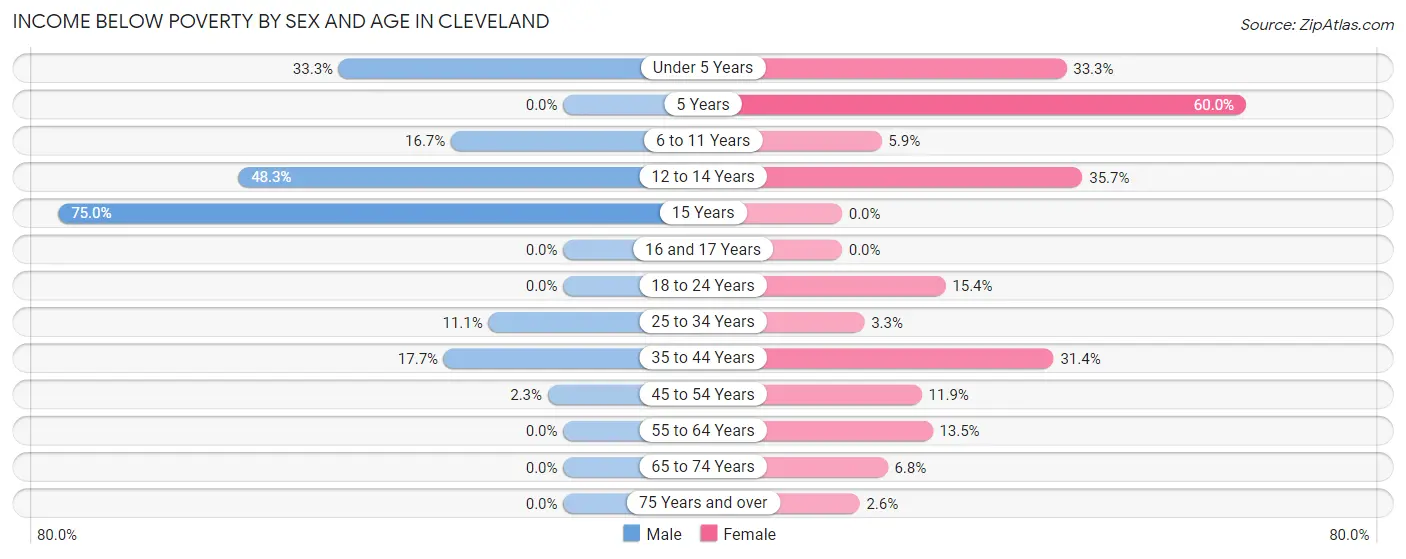
| Age Bracket | Male | Female |
| Under 5 Years | 8 (33.3%) | 2 (33.3%) |
| 5 Years | 0 (0.0%) | 3 (60.0%) |
| 6 to 11 Years | 5 (16.7%) | 3 (5.9%) |
| 12 to 14 Years | 14 (48.3%) | 5 (35.7%) |
| 15 Years | 6 (75.0%) | 0 (0.0%) |
| 16 and 17 Years | 0 (0.0%) | 0 (0.0%) |
| 18 to 24 Years | 0 (0.0%) | 2 (15.4%) |
| 25 to 34 Years | 7 (11.1%) | 2 (3.3%) |
| 35 to 44 Years | 11 (17.7%) | 11 (31.4%) |
| 45 to 54 Years | 2 (2.3%) | 7 (11.9%) |
| 55 to 64 Years | 0 (0.0%) | 7 (13.5%) |
| 65 to 74 Years | 0 (0.0%) | 4 (6.8%) |
| 75 Years and over | 0 (0.0%) | 2 (2.6%) |
| Total | 53 (11.9%) | 48 (10.0%) |
Income Above Poverty by Sex and Age in Cleveland
According to the poverty statistics in Cleveland, males aged 5 years and females aged 16 and 17 years are the age groups that are most secure financially, with 100.0% of males and 100.0% of females in these age groups living above the poverty line.
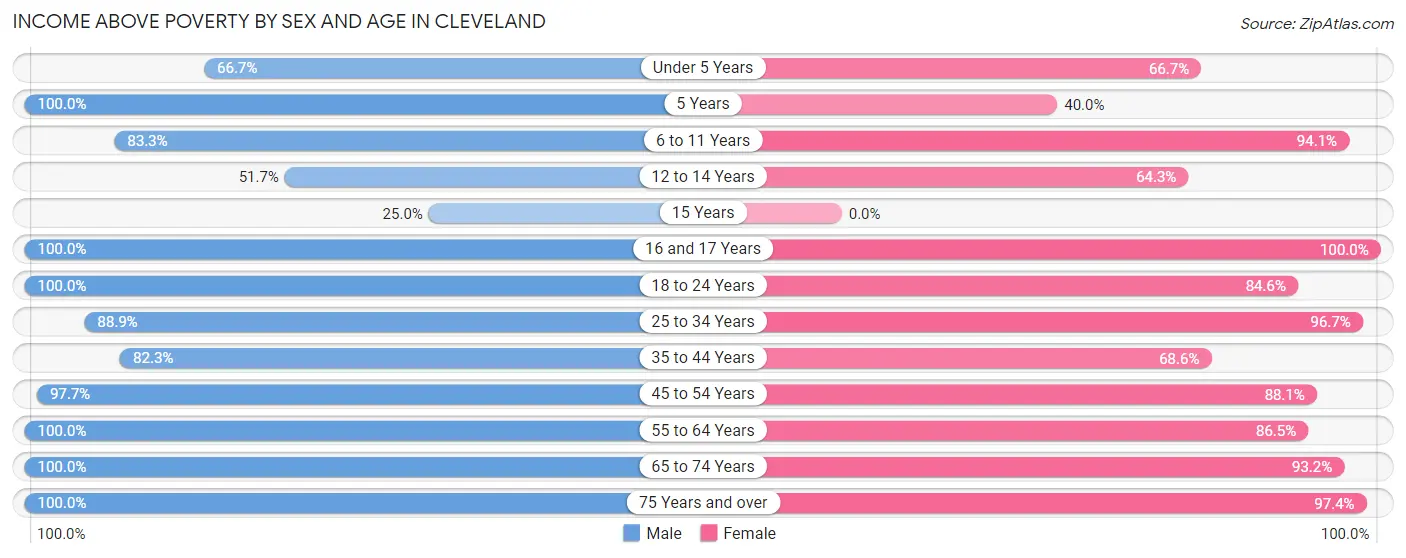
| Age Bracket | Male | Female |
| Under 5 Years | 16 (66.7%) | 4 (66.7%) |
| 5 Years | 7 (100.0%) | 2 (40.0%) |
| 6 to 11 Years | 25 (83.3%) | 48 (94.1%) |
| 12 to 14 Years | 15 (51.7%) | 9 (64.3%) |
| 15 Years | 2 (25.0%) | 0 (0.0%) |
| 16 and 17 Years | 2 (100.0%) | 49 (100.0%) |
| 18 to 24 Years | 19 (100.0%) | 11 (84.6%) |
| 25 to 34 Years | 56 (88.9%) | 58 (96.7%) |
| 35 to 44 Years | 51 (82.3%) | 24 (68.6%) |
| 45 to 54 Years | 85 (97.7%) | 52 (88.1%) |
| 55 to 64 Years | 31 (100.0%) | 45 (86.5%) |
| 65 to 74 Years | 45 (100.0%) | 55 (93.2%) |
| 75 Years and over | 37 (100.0%) | 74 (97.4%) |
| Total | 391 (88.1%) | 431 (90.0%) |
Income Below Poverty Among Married-Couple Families in Cleveland
The poverty statistics for married-couple families in Cleveland show that 1.2% or 2 of the total 162 families live below the poverty line. Families with 3 or 4 children have the highest poverty rate of 5.9%, comprising of 2 families. On the other hand, families with no children have the lowest poverty rate of 0.0%, which includes 0 families.
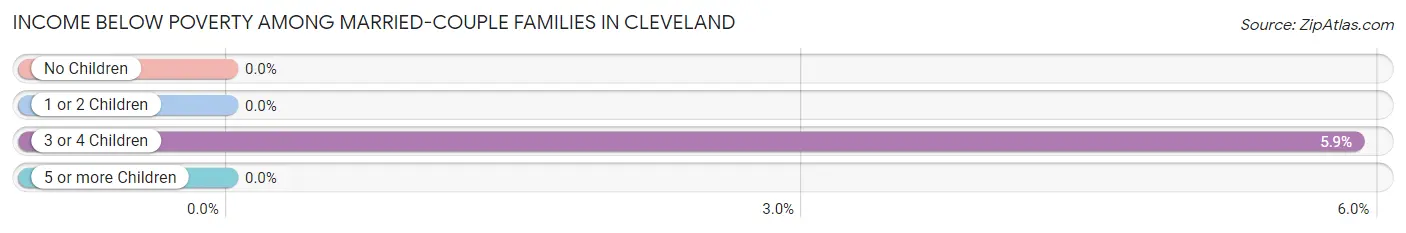
| Children | Above Poverty | Below Poverty |
| No Children | 96 (100.0%) | 0 (0.0%) |
| 1 or 2 Children | 32 (100.0%) | 0 (0.0%) |
| 3 or 4 Children | 32 (94.1%) | 2 (5.9%) |
| 5 or more Children | 0 (0.0%) | 0 (0.0%) |
| Total | 160 (98.8%) | 2 (1.2%) |
Income Below Poverty Among Single-Parent Households in Cleveland
According to the poverty data in Cleveland, 11.1% or 7 single-father households and 36.7% or 18 single-mother households are living below the poverty line. Among single-father households, those with 1 or 2 children have the highest poverty rate, with 7 households (11.5%) experiencing poverty. Likewise, among single-mother households, those with 3 or 4 children have the highest poverty rate, with 7 households (100.0%) falling below the poverty line.
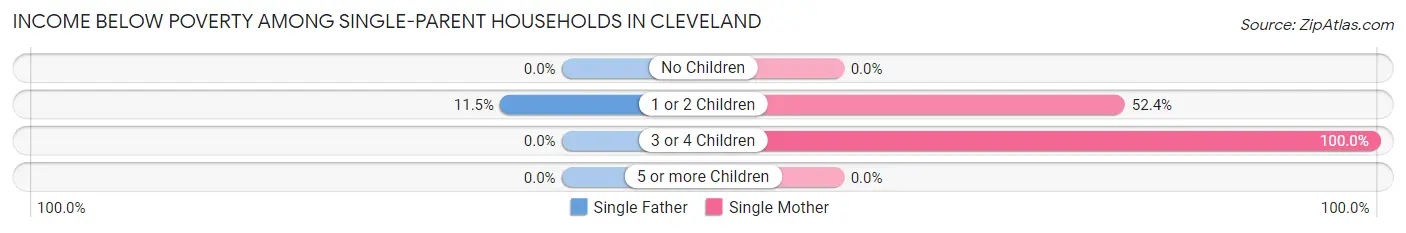
| Children | Single Father | Single Mother |
| No Children | 0 (0.0%) | 0 (0.0%) |
| 1 or 2 Children | 7 (11.5%) | 11 (52.4%) |
| 3 or 4 Children | 0 (0.0%) | 7 (100.0%) |
| 5 or more Children | 0 (0.0%) | 0 (0.0%) |
| Total | 7 (11.1%) | 18 (36.7%) |
Income Below Poverty Among Married-Couple vs Single-Parent Households in Cleveland
The poverty data for Cleveland shows that 2 of the married-couple family households (1.2%) and 25 of the single-parent households (22.3%) are living below the poverty level. Within the married-couple family households, those with 3 or 4 children have the highest poverty rate, with 2 households (5.9%) falling below the poverty line. Among the single-parent households, those with 3 or 4 children have the highest poverty rate, with 7 household (100.0%) living below poverty.
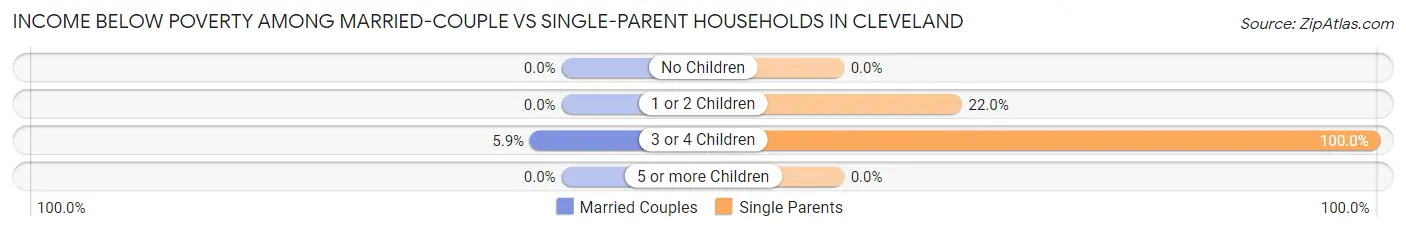
| Children | Married-Couple Families | Single-Parent Households |
| No Children | 0 (0.0%) | 0 (0.0%) |
| 1 or 2 Children | 0 (0.0%) | 18 (22.0%) |
| 3 or 4 Children | 2 (5.9%) | 7 (100.0%) |
| 5 or more Children | 0 (0.0%) | 0 (0.0%) |
| Total | 2 (1.2%) | 25 (22.3%) |
Race in Cleveland
The most populous races in Cleveland are White / Caucasian (841 | 91.1%), Hispanic or Latino (98 | 10.6%), and Some other Race (73 | 7.9%).
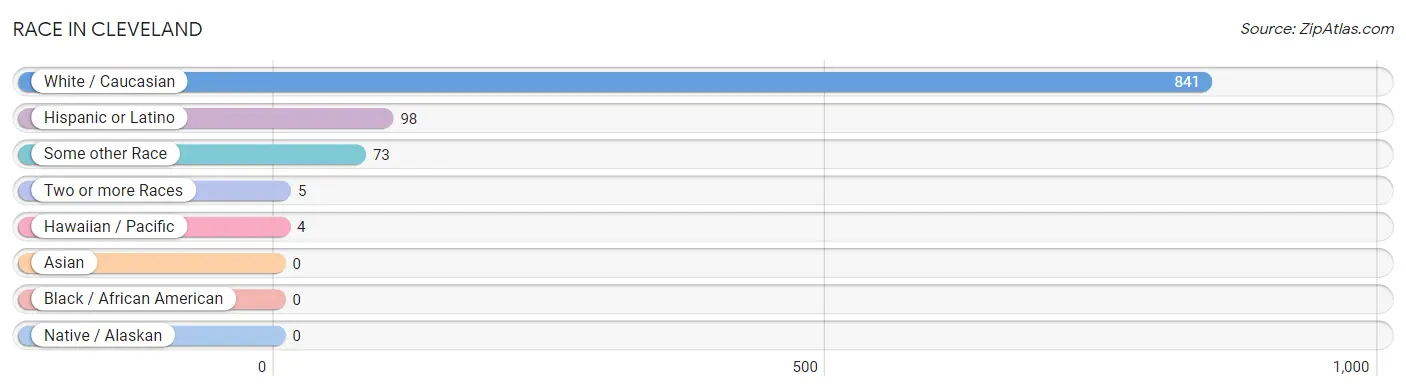
| Race | # Population | % Population |
| Asian | 0 | 0.0% |
| Black / African American | 0 | 0.0% |
| Hawaiian / Pacific | 4 | 0.4% |
| Hispanic or Latino | 98 | 10.6% |
| Native / Alaskan | 0 | 0.0% |
| White / Caucasian | 841 | 91.1% |
| Two or more Races | 5 | 0.5% |
| Some other Race | 73 | 7.9% |
| Total | 923 | 100.0% |
Ancestry in Cleveland
The most populous ancestries reported in Cleveland are American (171 | 18.5%), German (161 | 17.4%), English (153 | 16.6%), Mexican (93 | 10.1%), and Irish (84 | 9.1%), together accounting for 71.7% of all Cleveland residents.
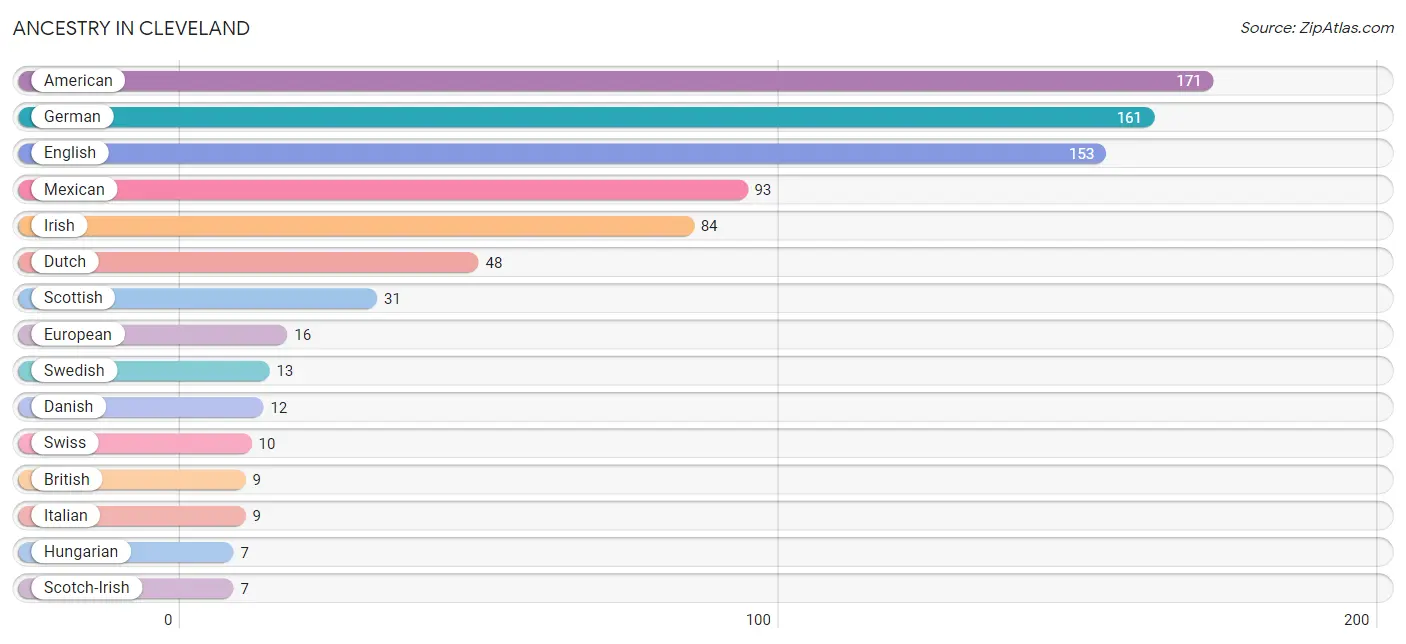
| Ancestry | # Population | % Population |
| American | 171 | 18.5% |
| British | 9 | 1.0% |
| Central American | 5 | 0.5% |
| Czechoslovakian | 3 | 0.3% |
| Danish | 12 | 1.3% |
| Dutch | 48 | 5.2% |
| English | 153 | 16.6% |
| European | 16 | 1.7% |
| French | 6 | 0.6% |
| French Canadian | 2 | 0.2% |
| German | 161 | 17.4% |
| Greek | 3 | 0.3% |
| Hungarian | 7 | 0.8% |
| Irish | 84 | 9.1% |
| Italian | 9 | 1.0% |
| Mexican | 93 | 10.1% |
| Norwegian | 3 | 0.3% |
| Panamanian | 5 | 0.5% |
| Polish | 2 | 0.2% |
| Portuguese | 4 | 0.4% |
| Scandinavian | 2 | 0.2% |
| Scotch-Irish | 7 | 0.8% |
| Scottish | 31 | 3.4% |
| Swedish | 13 | 1.4% |
| Swiss | 10 | 1.1% |
| Welsh | 5 | 0.5% | View All 26 Rows |
Immigrants in Cleveland
The most numerous immigrant groups reported in Cleveland came from , and Canada (2 | 0.2%), together accounting for 0.2% of all Cleveland residents.

| Immigration Origin | # Population | % Population |
| Canada | 2 | 0.2% | View All 1 Rows |
Sex and Age in Cleveland
Sex and Age in Cleveland
The most populous age groups in Cleveland are 45 to 49 Years (70 | 15.8%) for men and 15 to 19 Years (51 | 10.6%) for women.
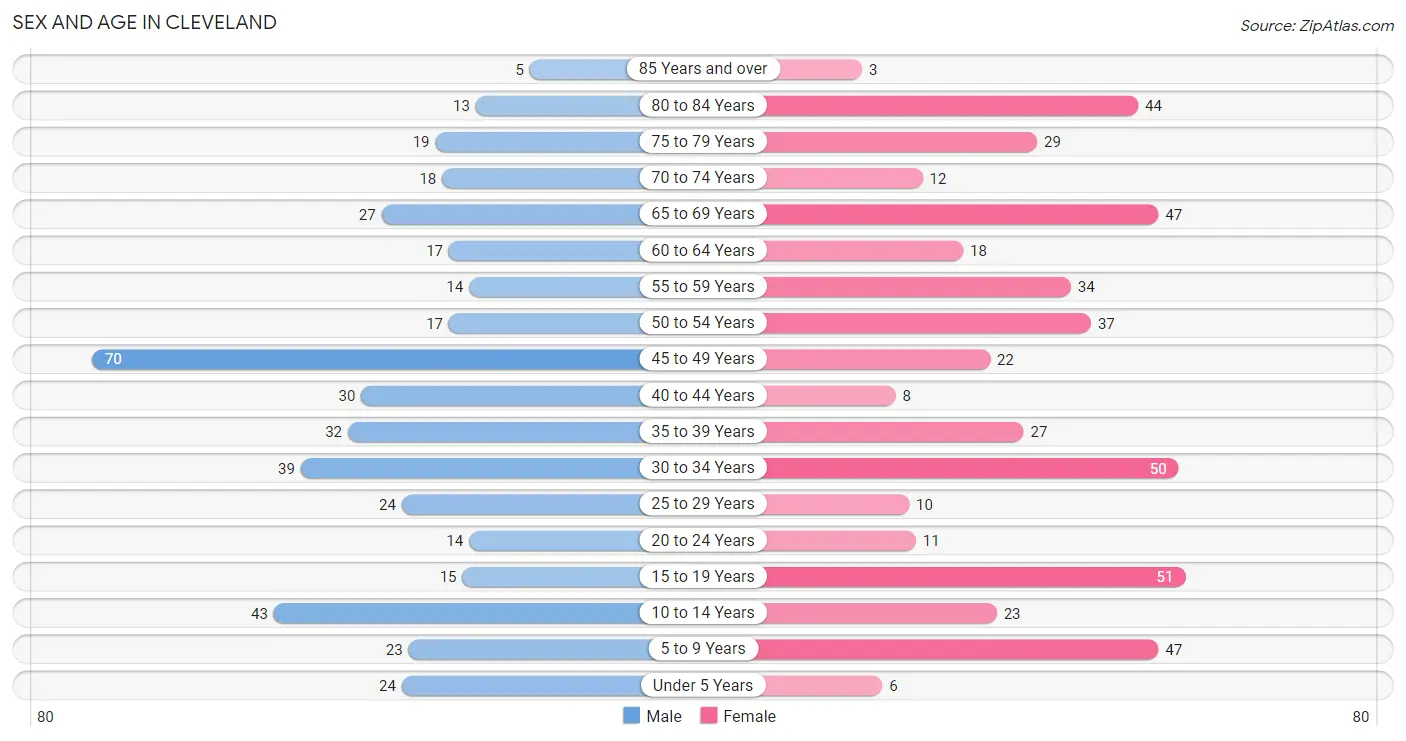
| Age Bracket | Male | Female |
| Under 5 Years | 24 (5.4%) | 6 (1.3%) |
| 5 to 9 Years | 23 (5.2%) | 47 (9.8%) |
| 10 to 14 Years | 43 (9.7%) | 23 (4.8%) |
| 15 to 19 Years | 15 (3.4%) | 51 (10.6%) |
| 20 to 24 Years | 14 (3.2%) | 11 (2.3%) |
| 25 to 29 Years | 24 (5.4%) | 10 (2.1%) |
| 30 to 34 Years | 39 (8.8%) | 50 (10.4%) |
| 35 to 39 Years | 32 (7.2%) | 27 (5.6%) |
| 40 to 44 Years | 30 (6.8%) | 8 (1.7%) |
| 45 to 49 Years | 70 (15.8%) | 22 (4.6%) |
| 50 to 54 Years | 17 (3.8%) | 37 (7.7%) |
| 55 to 59 Years | 14 (3.2%) | 34 (7.1%) |
| 60 to 64 Years | 17 (3.8%) | 18 (3.8%) |
| 65 to 69 Years | 27 (6.1%) | 47 (9.8%) |
| 70 to 74 Years | 18 (4.1%) | 12 (2.5%) |
| 75 to 79 Years | 19 (4.3%) | 29 (6.0%) |
| 80 to 84 Years | 13 (2.9%) | 44 (9.2%) |
| 85 Years and over | 5 (1.1%) | 3 (0.6%) |
| Total | 444 (100.0%) | 479 (100.0%) |
Families and Households in Cleveland
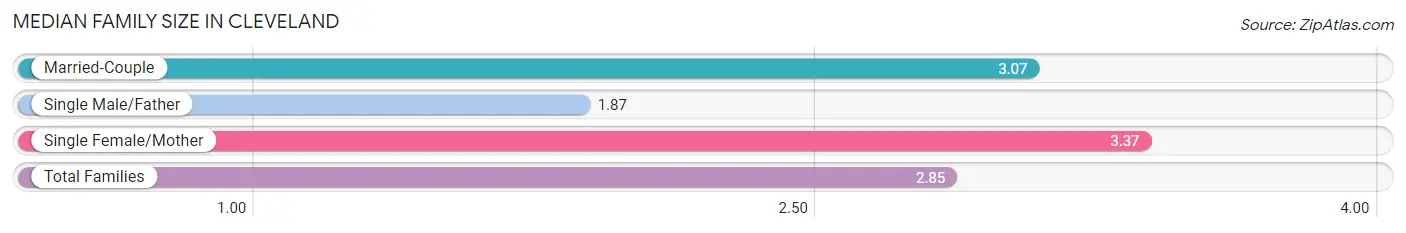
Median Family Size in Cleveland
The median family size in Cleveland is 2.85 persons per family, with single female/mother families (49 | 17.9%) accounting for the largest median family size of 3.37 persons per family. On the other hand, single male/father families (63 | 23.0%) represent the smallest median family size with 1.87 persons per family.
| Family Type | # Families | Family Size |
| Married-Couple | 162 (59.1%) | 3.07 |
| Single Male/Father | 63 (23.0%) | 1.87 |
| Single Female/Mother | 49 (17.9%) | 3.37 |
| Total Families | 274 (100.0%) | 2.85 |
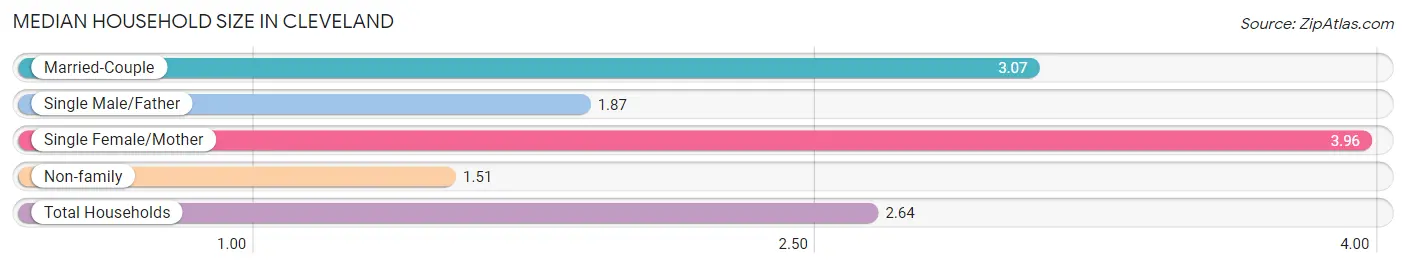
Median Household Size in Cleveland
The median household size in Cleveland is 2.64 persons per household, with single female/mother households (49 | 14.0%) accounting for the largest median household size of 3.96 persons per household. non-family households (75 | 21.5%) represent the smallest median household size with 1.51 persons per household.
| Household Type | # Households | Household Size |
| Married-Couple | 162 (46.4%) | 3.07 |
| Single Male/Father | 63 (18.0%) | 1.87 |
| Single Female/Mother | 49 (14.0%) | 3.96 |
| Non-family | 75 (21.5%) | 1.51 |
| Total Households | 349 (100.0%) | 2.64 |
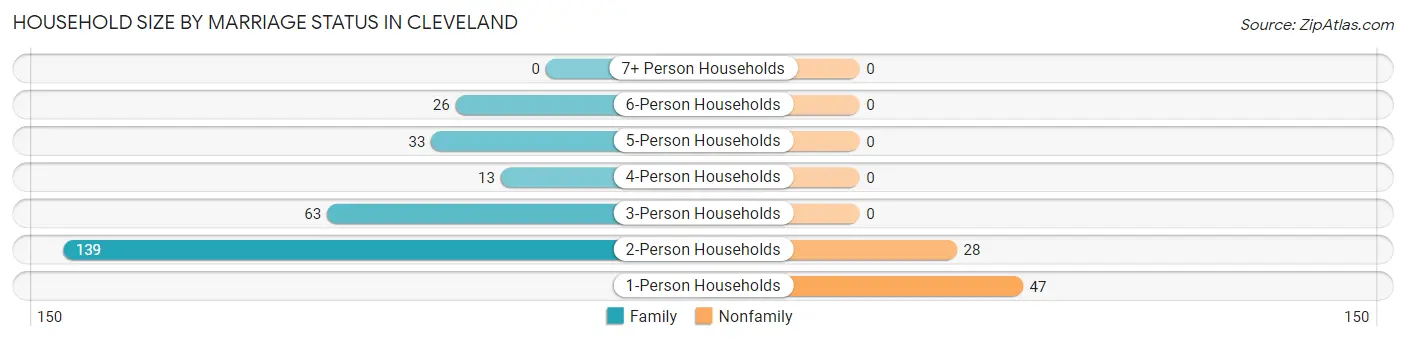
Household Size by Marriage Status in Cleveland
Out of a total of 349 households in Cleveland, 274 (78.5%) are family households, while 75 (21.5%) are nonfamily households. The most numerous type of family households are 2-person households, comprising 139, and the most common type of nonfamily households are 1-person households, comprising 47.
| Household Size | Family Households | Nonfamily Households |
| 1-Person Households | - | 47 (13.5%) |
| 2-Person Households | 139 (39.8%) | 28 (8.0%) |
| 3-Person Households | 63 (18.0%) | 0 (0.0%) |
| 4-Person Households | 13 (3.7%) | 0 (0.0%) |
| 5-Person Households | 33 (9.5%) | 0 (0.0%) |
| 6-Person Households | 26 (7.4%) | 0 (0.0%) |
| 7+ Person Households | 0 (0.0%) | 0 (0.0%) |
| Total | 274 (78.5%) | 75 (21.5%) |
Female Fertility in Cleveland
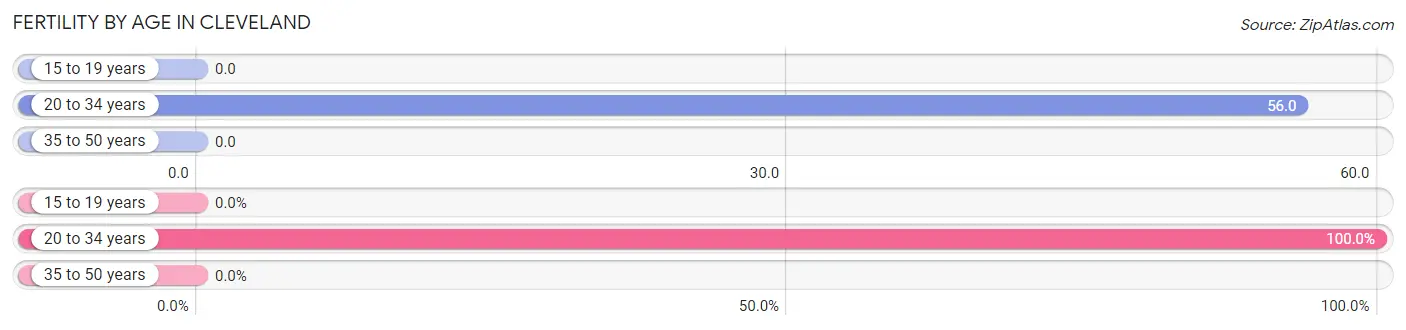
Fertility by Age in Cleveland
Average fertility rate in Cleveland is 21.0 births per 1,000 women. Women in the age bracket of 20 to 34 years have the highest fertility rate with 56.0 births per 1,000 women. Women in the age bracket of 20 to 34 years acount for 100.0% of all women with births.
| Age Bracket | Women with Births | Births / 1,000 Women |
| 15 to 19 years | 0 (0.0%) | 0.0 |
| 20 to 34 years | 4 (100.0%) | 56.0 |
| 35 to 50 years | 0 (0.0%) | 0.0 |
| Total | 4 (100.0%) | 21.0 |
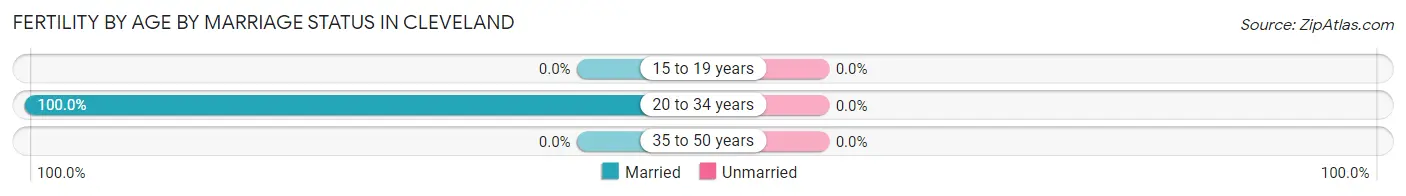
Fertility by Age by Marriage Status in Cleveland
| Age Bracket | Married | Unmarried |
| 15 to 19 years | 0 (0.0%) | 0 (0.0%) |
| 20 to 34 years | 4 (100.0%) | 0 (0.0%) |
| 35 to 50 years | 0 (0.0%) | 0 (0.0%) |
| Total | 4 (100.0%) | 0 (0.0%) |
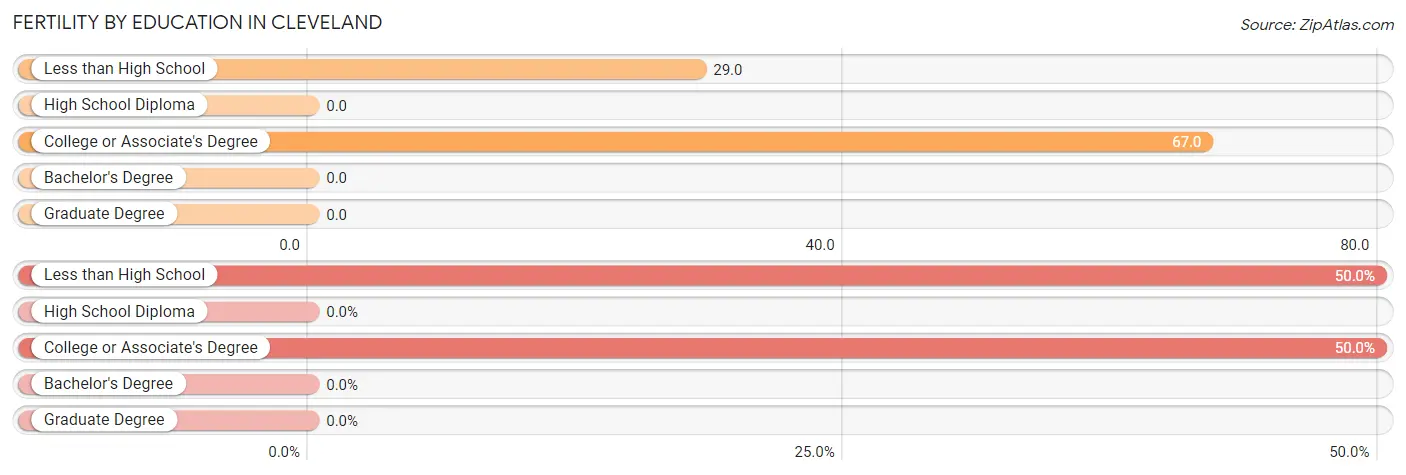
Fertility by Education in Cleveland
| Educational Attainment | Women with Births | Births / 1,000 Women |
| Less than High School | 2 (50.0%) | 29.0 |
| High School Diploma | 0 (0.0%) | 0.0 |
| College or Associate's Degree | 2 (50.0%) | 67.0 |
| Bachelor's Degree | 0 (0.0%) | 0.0 |
| Graduate Degree | 0 (0.0%) | 0.0 |
| Total | 4 (100.0%) | 21.0 |
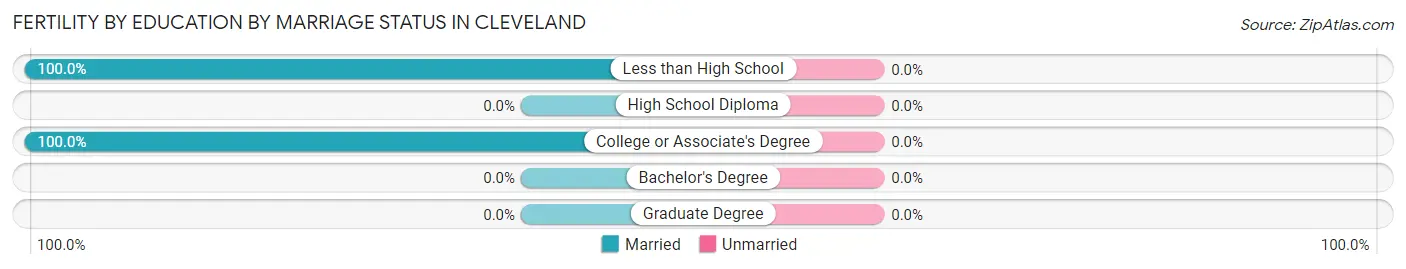
Fertility by Education by Marriage Status in Cleveland
| Educational Attainment | Married | Unmarried |
| Less than High School | 2 (100.0%) | 0 (0.0%) |
| High School Diploma | 0 (0.0%) | 0 (0.0%) |
| College or Associate's Degree | 2 (100.0%) | 0 (0.0%) |
| Bachelor's Degree | 0 (0.0%) | 0 (0.0%) |
| Graduate Degree | 0 (0.0%) | 0 (0.0%) |
| Total | 4 (100.0%) | 0 (0.0%) |
Employment Characteristics in Cleveland
Employment by Class of Employer in Cleveland
Among the 419 employed individuals in Cleveland, private company employees (329 | 78.5%), self-employed (not incorporated) (29 | 6.9%), and not-for-profit organizations (28 | 6.7%) make up the most common classes of employment.
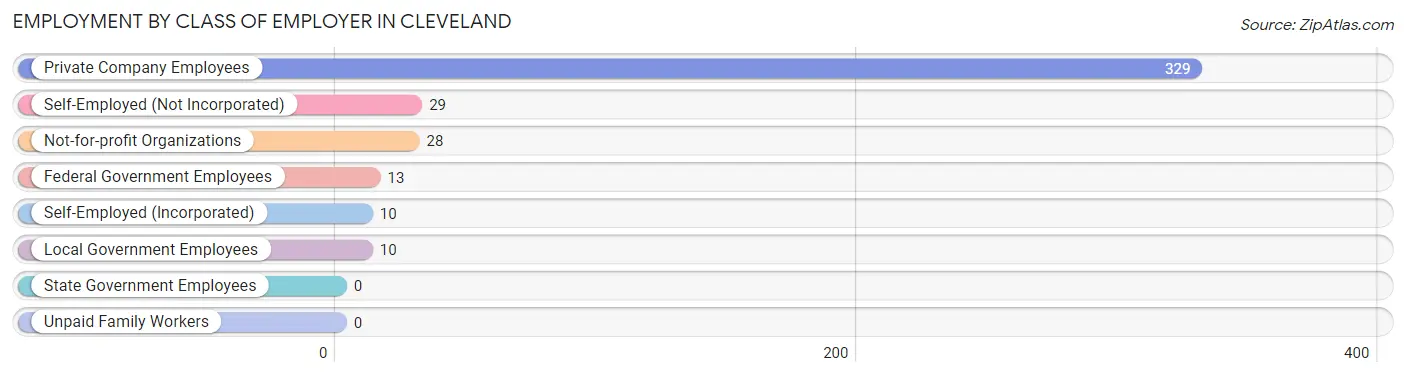
| Employer Class | # Employees | % Employees |
| Private Company Employees | 329 | 78.5% |
| Self-Employed (Incorporated) | 10 | 2.4% |
| Self-Employed (Not Incorporated) | 29 | 6.9% |
| Not-for-profit Organizations | 28 | 6.7% |
| Local Government Employees | 10 | 2.4% |
| State Government Employees | 0 | 0.0% |
| Federal Government Employees | 13 | 3.1% |
| Unpaid Family Workers | 0 | 0.0% |
| Total | 419 | 100.0% |
Employment Status by Age in Cleveland
According to the labor force statistics for Cleveland, out of the total population over 16 years of age (749), 59.7% or 447 individuals are in the labor force, with 2.5% or 11 of them unemployed. The age group with the highest labor force participation rate is 16 to 19 years, with 93.1% or 54 individuals in the labor force. Within the labor force, the 20 to 24 years age range has the highest percentage of unemployed individuals, with 17.4% or 4 of them being unemployed.
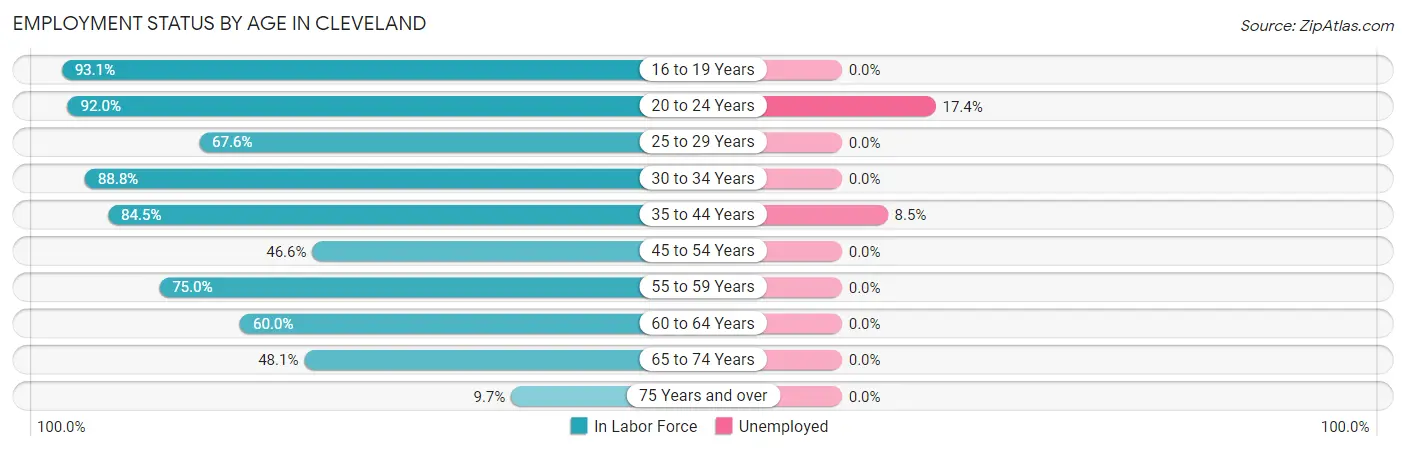
| Age Bracket | In Labor Force | Unemployed |
| 16 to 19 Years | 54 (93.1%) | 0 (0.0%) |
| 20 to 24 Years | 23 (92.0%) | 4 (17.4%) |
| 25 to 29 Years | 23 (67.6%) | 0 (0.0%) |
| 30 to 34 Years | 79 (88.8%) | 0 (0.0%) |
| 35 to 44 Years | 82 (84.5%) | 7 (8.5%) |
| 45 to 54 Years | 68 (46.6%) | 0 (0.0%) |
| 55 to 59 Years | 36 (75.0%) | 0 (0.0%) |
| 60 to 64 Years | 21 (60.0%) | 0 (0.0%) |
| 65 to 74 Years | 50 (48.1%) | 0 (0.0%) |
| 75 Years and over | 11 (9.7%) | 0 (0.0%) |
| Total | 447 (59.7%) | 11 (2.5%) |
Employment Status by Educational Attainment in Cleveland
According to labor force statistics for Cleveland, 68.8% of individuals (309) out of the total population between 25 and 64 years of age (449) are in the labor force, with 2.3% or 7 of them being unemployed. The group with the highest labor force participation rate are those with the educational attainment of college / associate degree, with 84.6% or 115 individuals in the labor force. Within the labor force, individuals with high school diploma education have the highest percentage of unemployment, with 8.0% or 7 of them being unemployed.
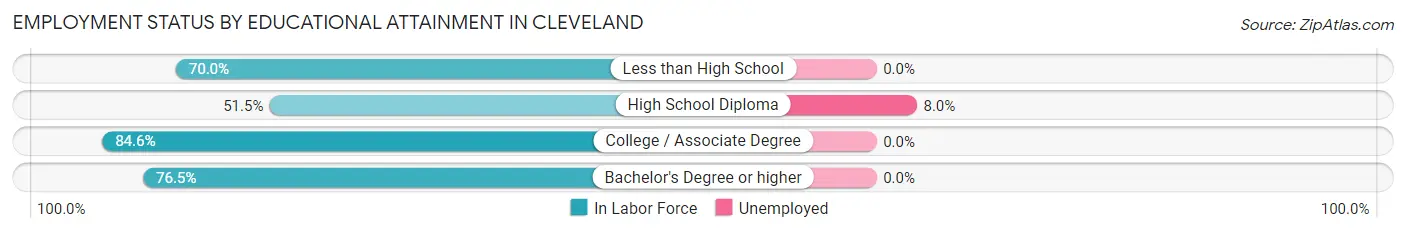
| Educational Attainment | In Labor Force | Unemployed |
| Less than High School | 28 (70.0%) | 0 (0.0%) |
| High School Diploma | 88 (51.5%) | 14 (8.0%) |
| College / Associate Degree | 115 (84.6%) | 0 (0.0%) |
| Bachelor's Degree or higher | 78 (76.5%) | 0 (0.0%) |
| Total | 309 (68.8%) | 10 (2.3%) |
Employment Occupations by Sex in Cleveland
Management, Business, Science and Arts Occupations
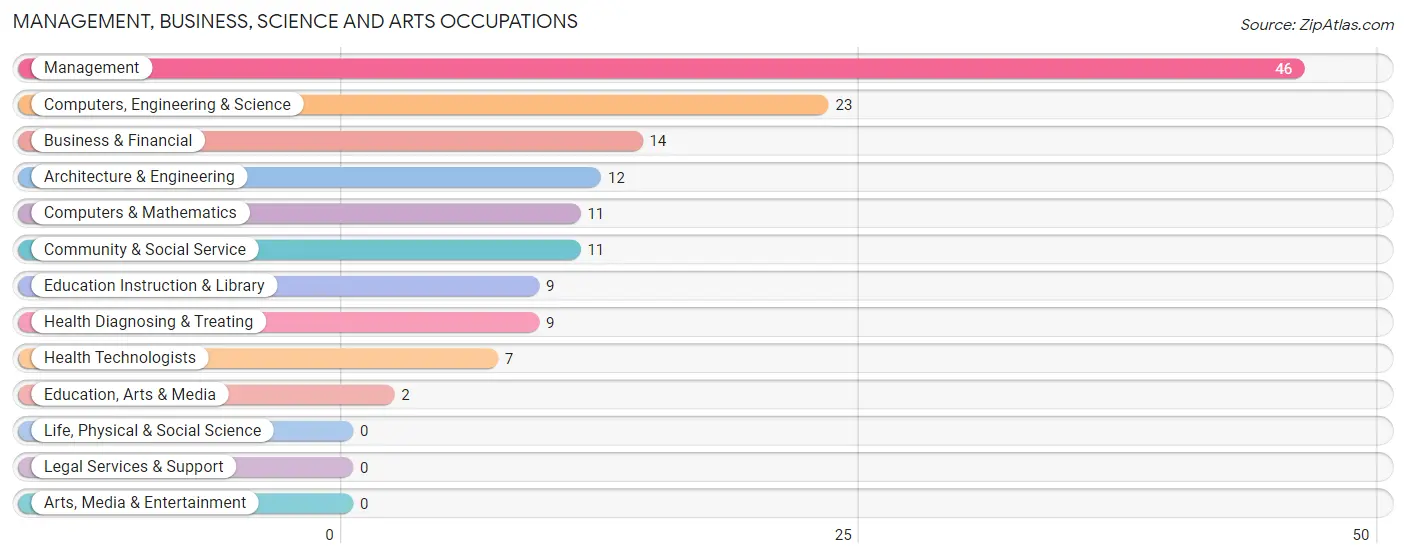
The most common Management, Business, Science and Arts occupations in Cleveland are Management (46 | 10.5%), Computers, Engineering & Science (23 | 5.3%), Business & Financial (14 | 3.2%), Architecture & Engineering (12 | 2.8%), and Computers & Mathematics (11 | 2.5%).
Management, Business, Science and Arts Occupations by Sex
Within the Management, Business, Science and Arts occupations in Cleveland, the most male-oriented occupations are Architecture & Engineering (50.0%), Computers, Engineering & Science (47.8%), and Computers & Mathematics (45.5%), while the most female-oriented occupations are Education, Arts & Media (100.0%), Community & Social Service (90.9%), and Education Instruction & Library (88.9%).
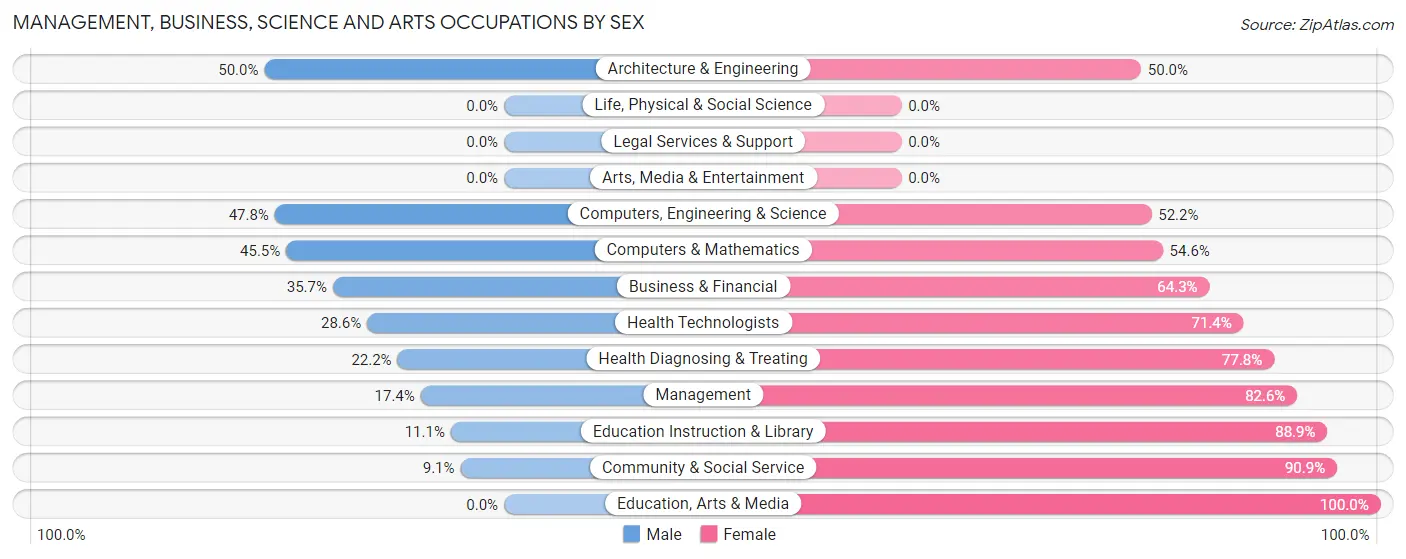
| Occupation | Male | Female |
| Management | 8 (17.4%) | 38 (82.6%) |
| Business & Financial | 5 (35.7%) | 9 (64.3%) |
| Computers, Engineering & Science | 11 (47.8%) | 12 (52.2%) |
| Computers & Mathematics | 5 (45.5%) | 6 (54.5%) |
| Architecture & Engineering | 6 (50.0%) | 6 (50.0%) |
| Life, Physical & Social Science | 0 (0.0%) | 0 (0.0%) |
| Community & Social Service | 1 (9.1%) | 10 (90.9%) |
| Education, Arts & Media | 0 (0.0%) | 2 (100.0%) |
| Legal Services & Support | 0 (0.0%) | 0 (0.0%) |
| Education Instruction & Library | 1 (11.1%) | 8 (88.9%) |
| Arts, Media & Entertainment | 0 (0.0%) | 0 (0.0%) |
| Health Diagnosing & Treating | 2 (22.2%) | 7 (77.8%) |
| Health Technologists | 2 (28.6%) | 5 (71.4%) |
| Total (Category) | 27 (26.2%) | 76 (73.8%) |
| Total (Overall) | 199 (45.6%) | 237 (54.4%) |
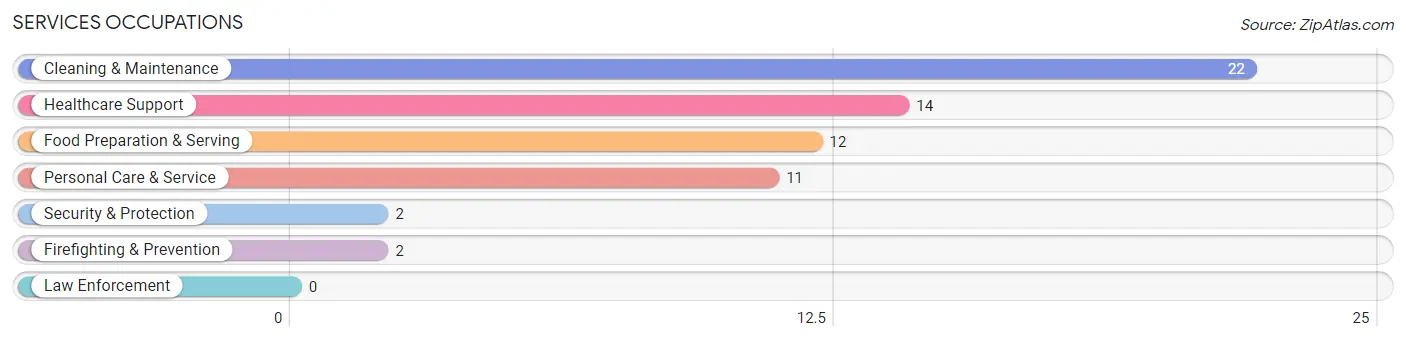
Services Occupations
The most common Services occupations in Cleveland are Cleaning & Maintenance (22 | 5.1%), Healthcare Support (14 | 3.2%), Food Preparation & Serving (12 | 2.8%), Personal Care & Service (11 | 2.5%), and Security & Protection (2 | 0.5%).
Services Occupations by Sex
Within the Services occupations in Cleveland, the most male-oriented occupations are Security & Protection (100.0%), Firefighting & Prevention (100.0%), and Cleaning & Maintenance (100.0%), while the most female-oriented occupations are Healthcare Support (100.0%), Food Preparation & Serving (100.0%), and Personal Care & Service (100.0%).
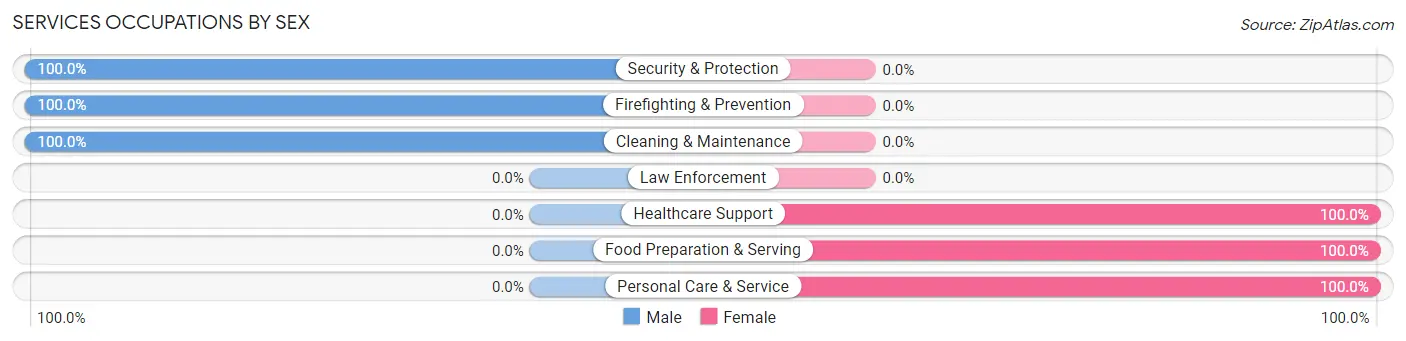
| Occupation | Male | Female |
| Healthcare Support | 0 (0.0%) | 14 (100.0%) |
| Security & Protection | 2 (100.0%) | 0 (0.0%) |
| Firefighting & Prevention | 2 (100.0%) | 0 (0.0%) |
| Law Enforcement | 0 (0.0%) | 0 (0.0%) |
| Food Preparation & Serving | 0 (0.0%) | 12 (100.0%) |
| Cleaning & Maintenance | 22 (100.0%) | 0 (0.0%) |
| Personal Care & Service | 0 (0.0%) | 11 (100.0%) |
| Total (Category) | 24 (39.3%) | 37 (60.7%) |
| Total (Overall) | 199 (45.6%) | 237 (54.4%) |
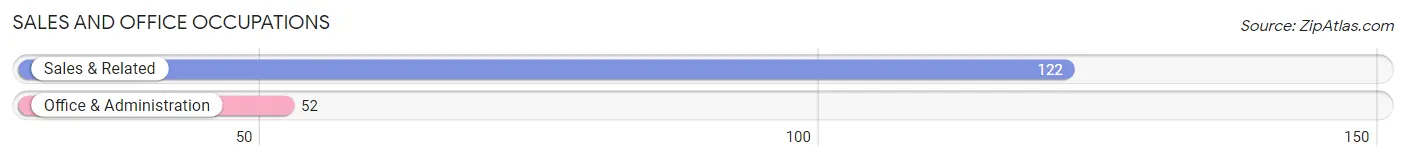
Sales and Office Occupations
The most common Sales and Office occupations in Cleveland are Sales & Related (122 | 28.0%), and Office & Administration (52 | 11.9%).
Sales and Office Occupations by Sex
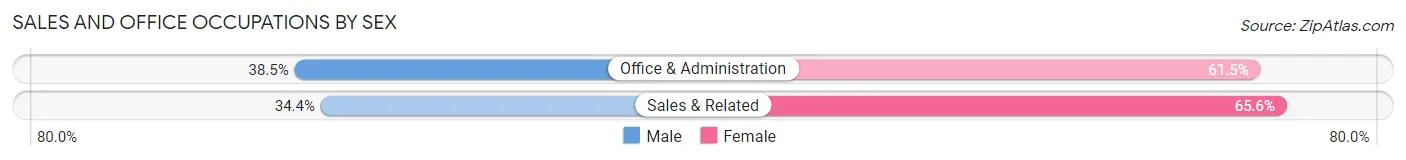
| Occupation | Male | Female |
| Sales & Related | 42 (34.4%) | 80 (65.6%) |
| Office & Administration | 20 (38.5%) | 32 (61.5%) |
| Total (Category) | 62 (35.6%) | 112 (64.4%) |
| Total (Overall) | 199 (45.6%) | 237 (54.4%) |
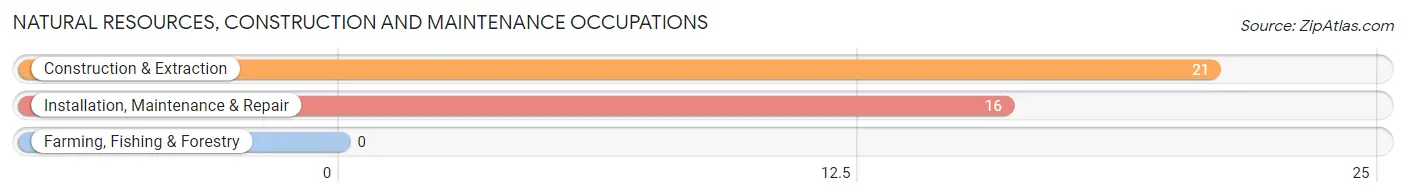
Natural Resources, Construction and Maintenance Occupations
The most common Natural Resources, Construction and Maintenance occupations in Cleveland are Construction & Extraction (21 | 4.8%), and Installation, Maintenance & Repair (16 | 3.7%).
Natural Resources, Construction and Maintenance Occupations by Sex
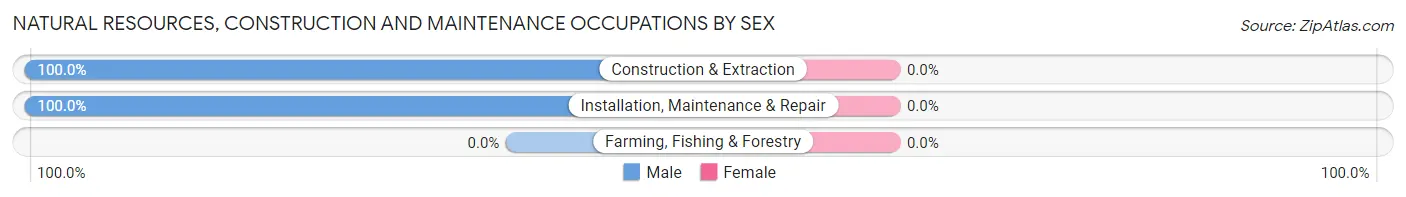
| Occupation | Male | Female |
| Farming, Fishing & Forestry | 0 (0.0%) | 0 (0.0%) |
| Construction & Extraction | 21 (100.0%) | 0 (0.0%) |
| Installation, Maintenance & Repair | 16 (100.0%) | 0 (0.0%) |
| Total (Category) | 37 (100.0%) | 0 (0.0%) |
| Total (Overall) | 199 (45.6%) | 237 (54.4%) |
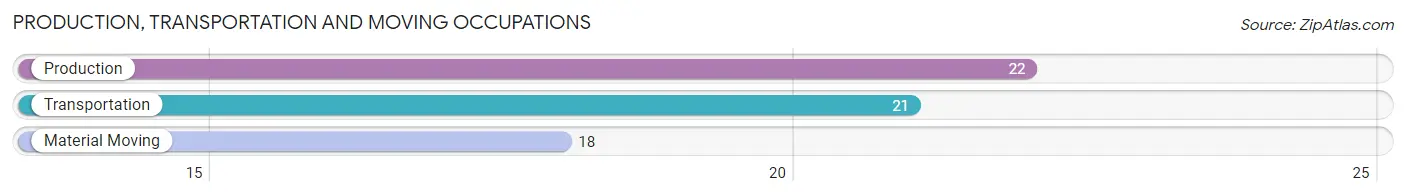
Production, Transportation and Moving Occupations
The most common Production, Transportation and Moving occupations in Cleveland are Production (22 | 5.1%), Transportation (21 | 4.8%), and Material Moving (18 | 4.1%).
Production, Transportation and Moving Occupations by Sex
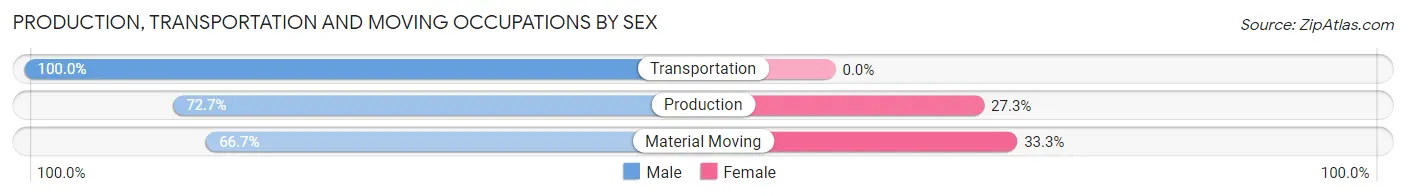
| Occupation | Male | Female |
| Production | 16 (72.7%) | 6 (27.3%) |
| Transportation | 21 (100.0%) | 0 (0.0%) |
| Material Moving | 12 (66.7%) | 6 (33.3%) |
| Total (Category) | 49 (80.3%) | 12 (19.7%) |
| Total (Overall) | 199 (45.6%) | 237 (54.4%) |
Employment Industries by Sex in Cleveland
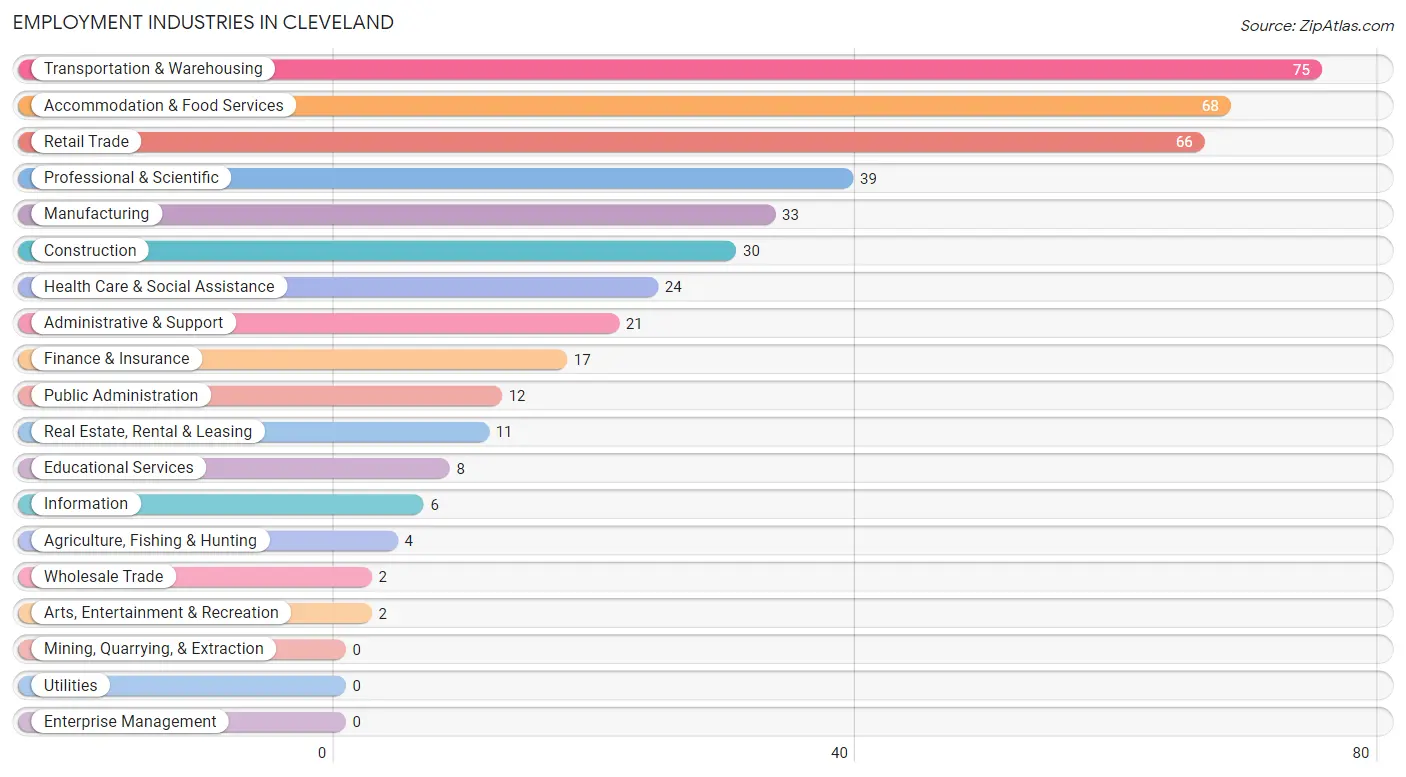
Employment Industries in Cleveland
The major employment industries in Cleveland include Transportation & Warehousing (75 | 17.2%), Accommodation & Food Services (68 | 15.6%), Retail Trade (66 | 15.1%), Professional & Scientific (39 | 8.9%), and Manufacturing (33 | 7.6%).
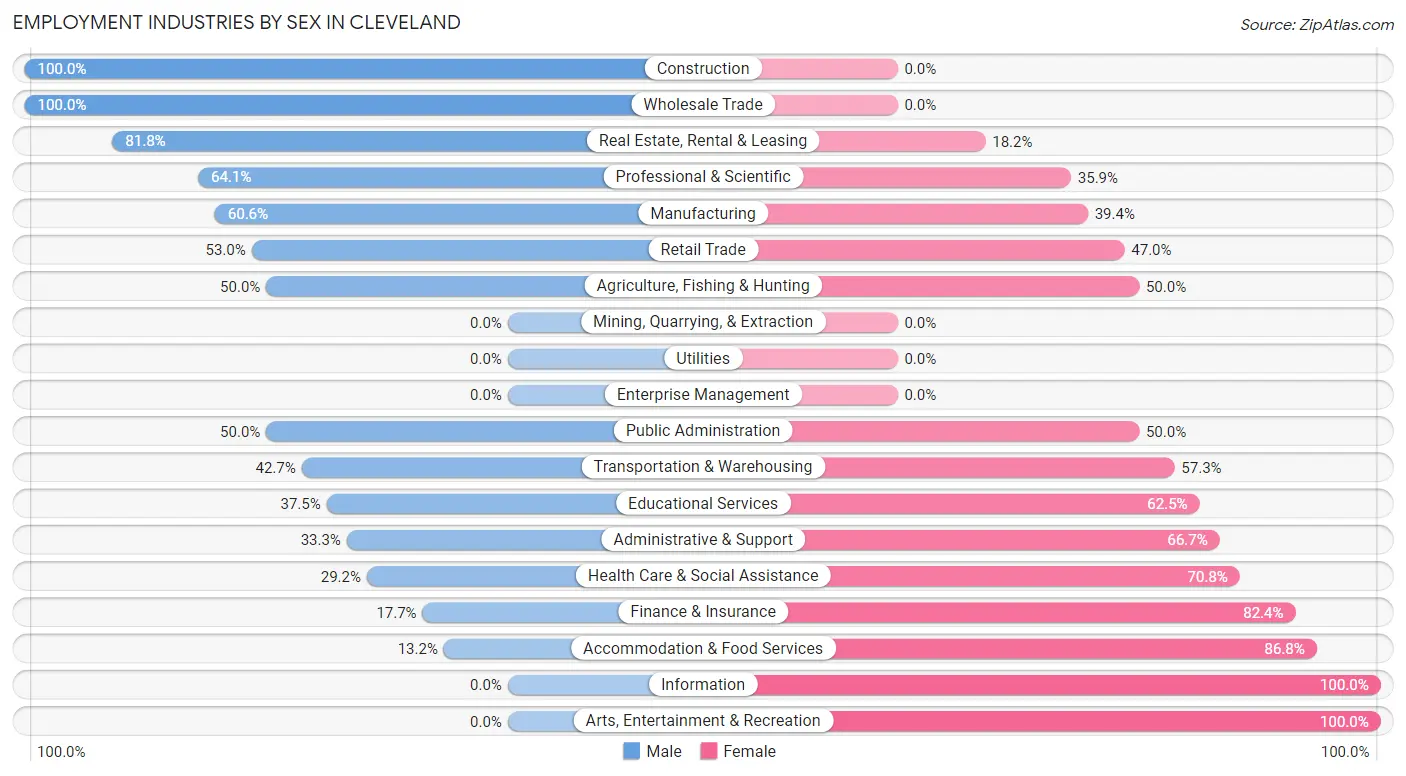
Employment Industries by Sex in Cleveland
The Cleveland industries that see more men than women are Construction (100.0%), Wholesale Trade (100.0%), and Real Estate, Rental & Leasing (81.8%), whereas the industries that tend to have a higher number of women are Information (100.0%), Arts, Entertainment & Recreation (100.0%), and Accommodation & Food Services (86.8%).
| Industry | Male | Female |
| Agriculture, Fishing & Hunting | 2 (50.0%) | 2 (50.0%) |
| Mining, Quarrying, & Extraction | 0 (0.0%) | 0 (0.0%) |
| Construction | 30 (100.0%) | 0 (0.0%) |
| Manufacturing | 20 (60.6%) | 13 (39.4%) |
| Wholesale Trade | 2 (100.0%) | 0 (0.0%) |
| Retail Trade | 35 (53.0%) | 31 (47.0%) |
| Transportation & Warehousing | 32 (42.7%) | 43 (57.3%) |
| Utilities | 0 (0.0%) | 0 (0.0%) |
| Information | 0 (0.0%) | 6 (100.0%) |
| Finance & Insurance | 3 (17.6%) | 14 (82.4%) |
| Real Estate, Rental & Leasing | 9 (81.8%) | 2 (18.2%) |
| Professional & Scientific | 25 (64.1%) | 14 (35.9%) |
| Enterprise Management | 0 (0.0%) | 0 (0.0%) |
| Administrative & Support | 7 (33.3%) | 14 (66.7%) |
| Educational Services | 3 (37.5%) | 5 (62.5%) |
| Health Care & Social Assistance | 7 (29.2%) | 17 (70.8%) |
| Arts, Entertainment & Recreation | 0 (0.0%) | 2 (100.0%) |
| Accommodation & Food Services | 9 (13.2%) | 59 (86.8%) |
| Public Administration | 6 (50.0%) | 6 (50.0%) |
| Total | 199 (45.6%) | 237 (54.4%) |
Education in Cleveland
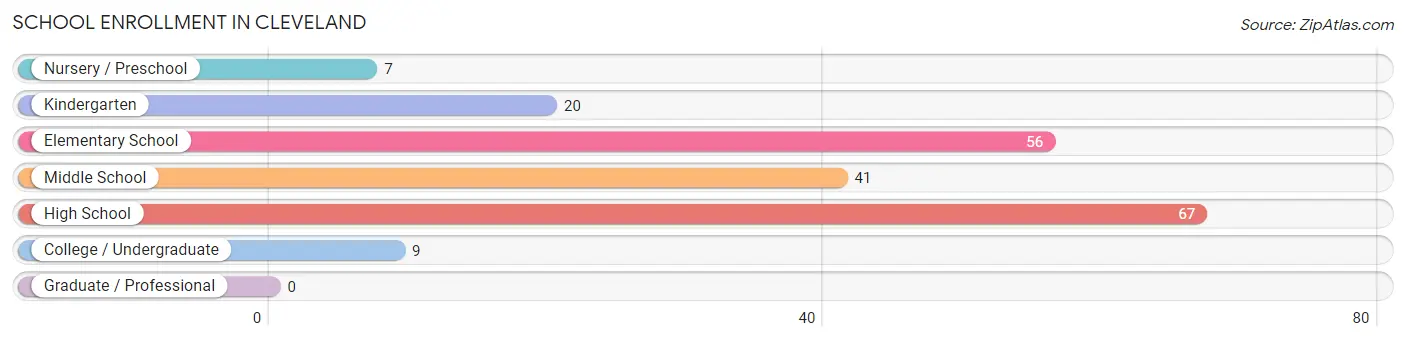
School Enrollment in Cleveland
The most common levels of schooling among the 200 students in Cleveland are high school (67 | 33.5%), elementary school (56 | 28.0%), and middle school (41 | 20.5%).
| School Level | # Students | % Students |
| Nursery / Preschool | 7 | 3.5% |
| Kindergarten | 20 | 10.0% |
| Elementary School | 56 | 28.0% |
| Middle School | 41 | 20.5% |
| High School | 67 | 33.5% |
| College / Undergraduate | 9 | 4.5% |
| Graduate / Professional | 0 | 0.0% |
| Total | 200 | 100.0% |
School Enrollment by Age by Funding Source in Cleveland
Out of a total of 200 students who are enrolled in schools in Cleveland, 7 (3.5%) attend a private institution, while the remaining 193 (96.5%) are enrolled in public schools. The age group of 3 to 4 year olds has the highest likelihood of being enrolled in private schools, with 2 (100.0% in the age bracket) enrolled. Conversely, the age group of 10 to 14 year olds has the lowest likelihood of being enrolled in a private school, with 63 (100.0% in the age bracket) attending a public institution.
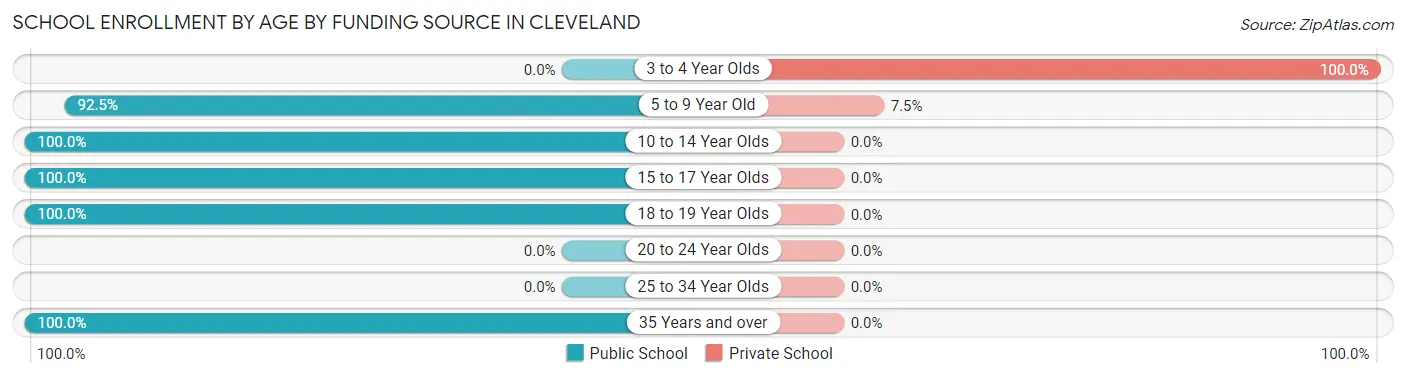
| Age Bracket | Public School | Private School |
| 3 to 4 Year Olds | 0 (0.0%) | 2 (100.0%) |
| 5 to 9 Year Old | 62 (92.5%) | 5 (7.5%) |
| 10 to 14 Year Olds | 63 (100.0%) | 0 (0.0%) |
| 15 to 17 Year Olds | 59 (100.0%) | 0 (0.0%) |
| 18 to 19 Year Olds | 4 (100.0%) | 0 (0.0%) |
| 20 to 24 Year Olds | 0 (0.0%) | 0 (0.0%) |
| 25 to 34 Year Olds | 0 (0.0%) | 0 (0.0%) |
| 35 Years and over | 5 (100.0%) | 0 (0.0%) |
| Total | 193 (96.5%) | 7 (3.5%) |
Educational Attainment by Field of Study in Cleveland
Business (26 | 18.2%), engineering (25 | 17.5%), science & technology (19 | 13.3%), education (19 | 13.3%), and communications (16 | 11.2%) are the most common fields of study among 143 individuals in Cleveland who have obtained a bachelor's degree or higher.
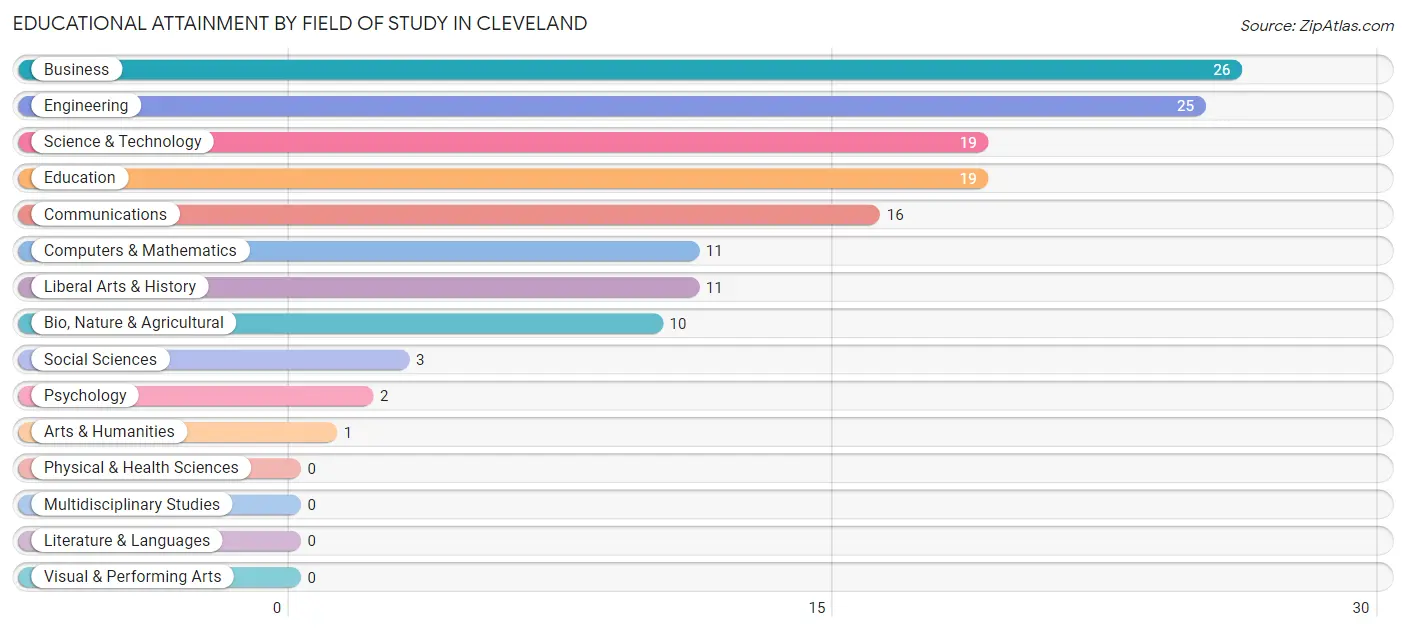
| Field of Study | # Graduates | % Graduates |
| Computers & Mathematics | 11 | 7.7% |
| Bio, Nature & Agricultural | 10 | 7.0% |
| Physical & Health Sciences | 0 | 0.0% |
| Psychology | 2 | 1.4% |
| Social Sciences | 3 | 2.1% |
| Engineering | 25 | 17.5% |
| Multidisciplinary Studies | 0 | 0.0% |
| Science & Technology | 19 | 13.3% |
| Business | 26 | 18.2% |
| Education | 19 | 13.3% |
| Literature & Languages | 0 | 0.0% |
| Liberal Arts & History | 11 | 7.7% |
| Visual & Performing Arts | 0 | 0.0% |
| Communications | 16 | 11.2% |
| Arts & Humanities | 1 | 0.7% |
| Total | 143 | 100.0% |
Transportation & Commute in Cleveland
Vehicle Availability by Sex in Cleveland
The most prevalent vehicle ownership categories in Cleveland are males with 2 vehicles (68, accounting for 35.6%) and females with 2 vehicles (134, making up 29.8%).
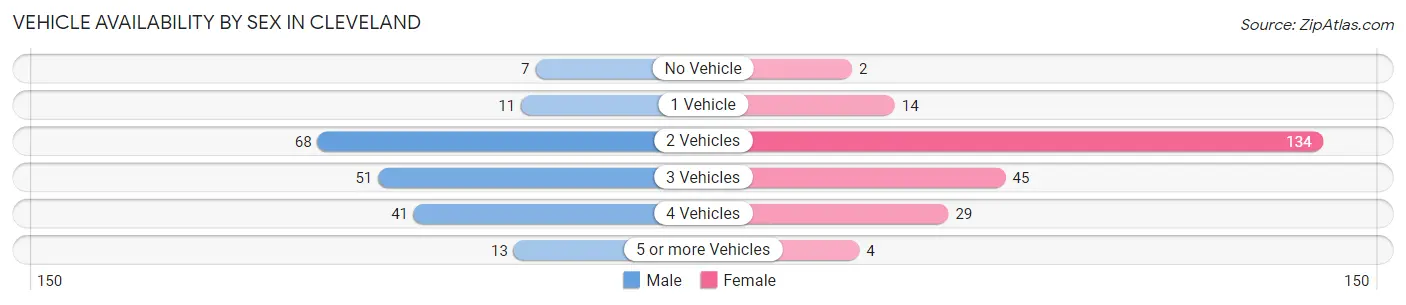
| Vehicles Available | Male | Female |
| No Vehicle | 7 (3.7%) | 2 (0.9%) |
| 1 Vehicle | 11 (5.8%) | 14 (6.1%) |
| 2 Vehicles | 68 (35.6%) | 134 (58.8%) |
| 3 Vehicles | 51 (26.7%) | 45 (19.7%) |
| 4 Vehicles | 41 (21.5%) | 29 (12.7%) |
| 5 or more Vehicles | 13 (6.8%) | 4 (1.8%) |
| Total | 191 (100.0%) | 228 (100.0%) |
Commute Time in Cleveland
The most frequently occuring commute durations in Cleveland are 30 to 34 minutes (141 commuters, 35.8%), 45 to 59 minutes (85 commuters, 21.6%), and 15 to 19 minutes (39 commuters, 9.9%).
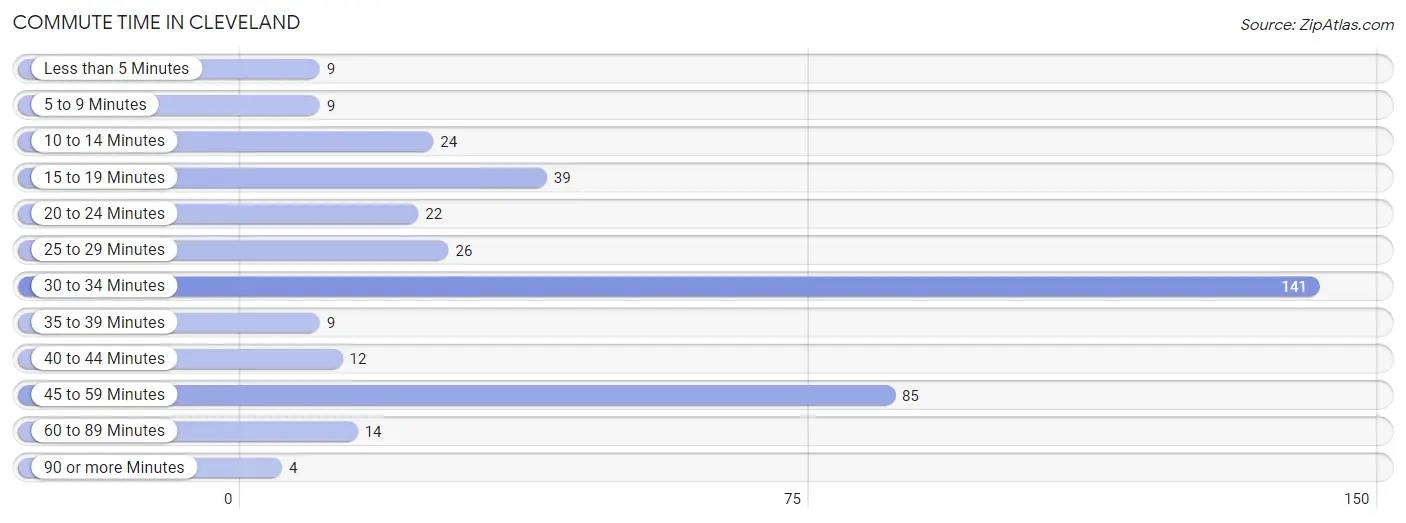
| Commute Time | # Commuters | % Commuters |
| Less than 5 Minutes | 9 | 2.3% |
| 5 to 9 Minutes | 9 | 2.3% |
| 10 to 14 Minutes | 24 | 6.1% |
| 15 to 19 Minutes | 39 | 9.9% |
| 20 to 24 Minutes | 22 | 5.6% |
| 25 to 29 Minutes | 26 | 6.6% |
| 30 to 34 Minutes | 141 | 35.8% |
| 35 to 39 Minutes | 9 | 2.3% |
| 40 to 44 Minutes | 12 | 3.0% |
| 45 to 59 Minutes | 85 | 21.6% |
| 60 to 89 Minutes | 14 | 3.5% |
| 90 or more Minutes | 4 | 1.0% |
Commute Time by Sex in Cleveland
The most common commute times in Cleveland are 30 to 34 minutes (72 commuters, 40.0%) for males and 30 to 34 minutes (69 commuters, 32.2%) for females.
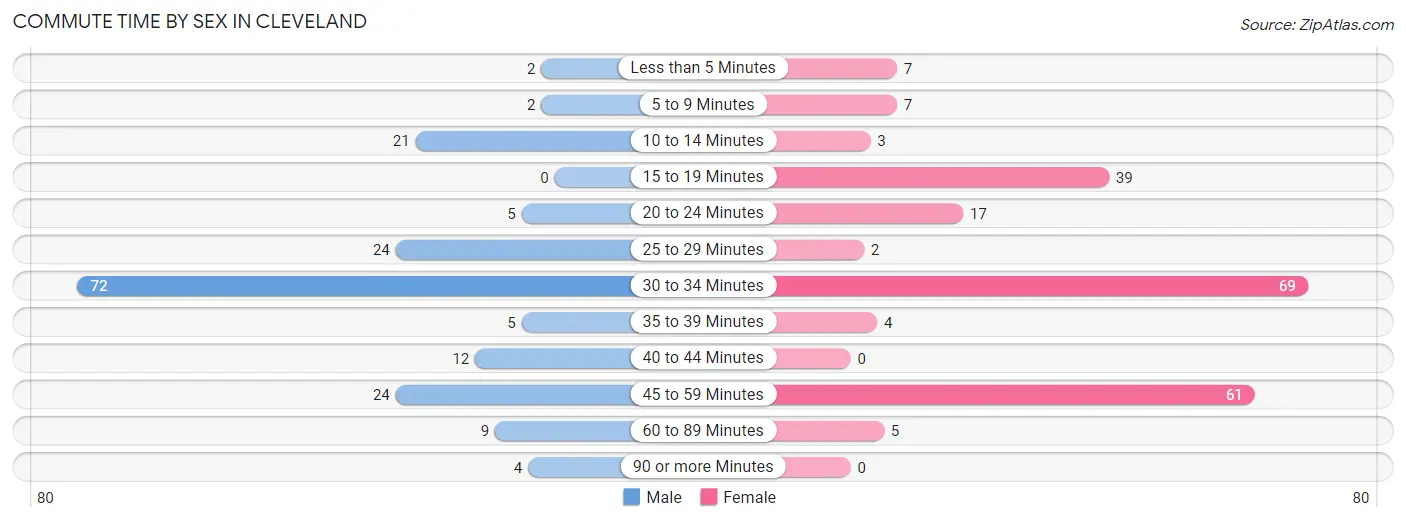
| Commute Time | Male | Female |
| Less than 5 Minutes | 2 (1.1%) | 7 (3.3%) |
| 5 to 9 Minutes | 2 (1.1%) | 7 (3.3%) |
| 10 to 14 Minutes | 21 (11.7%) | 3 (1.4%) |
| 15 to 19 Minutes | 0 (0.0%) | 39 (18.2%) |
| 20 to 24 Minutes | 5 (2.8%) | 17 (7.9%) |
| 25 to 29 Minutes | 24 (13.3%) | 2 (0.9%) |
| 30 to 34 Minutes | 72 (40.0%) | 69 (32.2%) |
| 35 to 39 Minutes | 5 (2.8%) | 4 (1.9%) |
| 40 to 44 Minutes | 12 (6.7%) | 0 (0.0%) |
| 45 to 59 Minutes | 24 (13.3%) | 61 (28.5%) |
| 60 to 89 Minutes | 9 (5.0%) | 5 (2.3%) |
| 90 or more Minutes | 4 (2.2%) | 0 (0.0%) |
Time of Departure to Work by Sex in Cleveland
The most frequent times of departure to work in Cleveland are 6:00 AM to 6:29 AM (29, 16.1%) for males and 4:00 PM to 11:59 PM (67, 31.3%) for females.
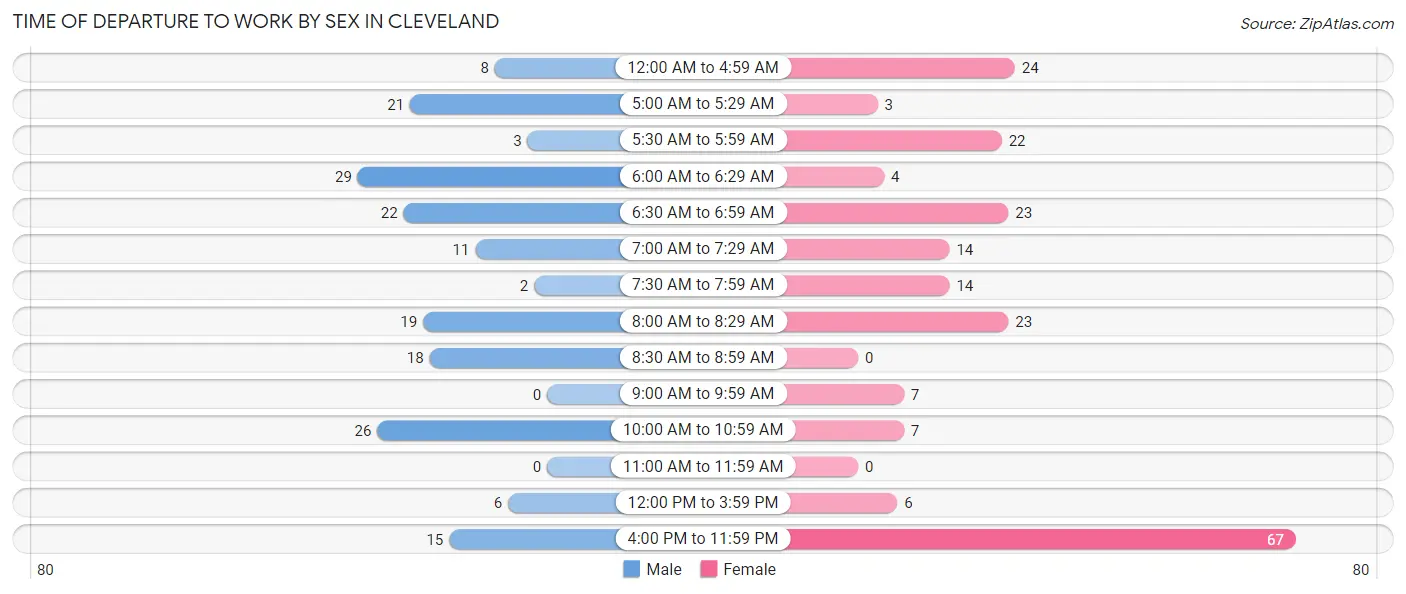
| Time of Departure | Male | Female |
| 12:00 AM to 4:59 AM | 8 (4.4%) | 24 (11.2%) |
| 5:00 AM to 5:29 AM | 21 (11.7%) | 3 (1.4%) |
| 5:30 AM to 5:59 AM | 3 (1.7%) | 22 (10.3%) |
| 6:00 AM to 6:29 AM | 29 (16.1%) | 4 (1.9%) |
| 6:30 AM to 6:59 AM | 22 (12.2%) | 23 (10.7%) |
| 7:00 AM to 7:29 AM | 11 (6.1%) | 14 (6.5%) |
| 7:30 AM to 7:59 AM | 2 (1.1%) | 14 (6.5%) |
| 8:00 AM to 8:29 AM | 19 (10.6%) | 23 (10.7%) |
| 8:30 AM to 8:59 AM | 18 (10.0%) | 0 (0.0%) |
| 9:00 AM to 9:59 AM | 0 (0.0%) | 7 (3.3%) |
| 10:00 AM to 10:59 AM | 26 (14.4%) | 7 (3.3%) |
| 11:00 AM to 11:59 AM | 0 (0.0%) | 0 (0.0%) |
| 12:00 PM to 3:59 PM | 6 (3.3%) | 6 (2.8%) |
| 4:00 PM to 11:59 PM | 15 (8.3%) | 67 (31.3%) |
| Total | 180 (100.0%) | 214 (100.0%) |
Housing Occupancy in Cleveland
Occupancy by Ownership in Cleveland
Of the total 349 dwellings in Cleveland, owner-occupied units account for 221 (63.3%), while renter-occupied units make up 128 (36.7%).
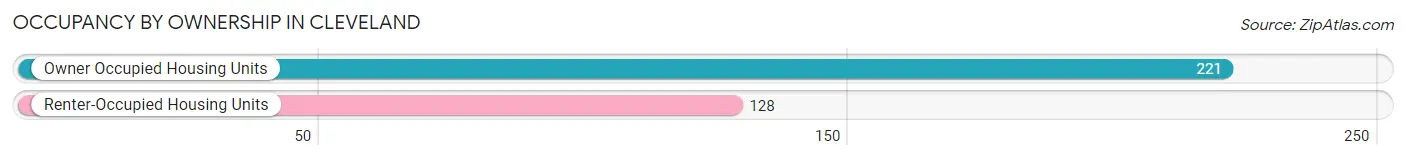
| Occupancy | # Housing Units | % Housing Units |
| Owner Occupied Housing Units | 221 | 63.3% |
| Renter-Occupied Housing Units | 128 | 36.7% |
| Total Occupied Housing Units | 349 | 100.0% |
Occupancy by Household Size in Cleveland
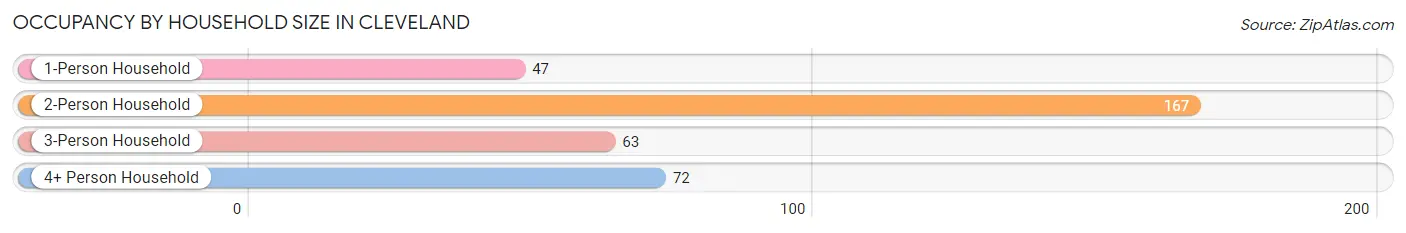
| Household Size | # Housing Units | % Housing Units |
| 1-Person Household | 47 | 13.5% |
| 2-Person Household | 167 | 47.8% |
| 3-Person Household | 63 | 18.0% |
| 4+ Person Household | 72 | 20.6% |
| Total Housing Units | 349 | 100.0% |
Occupancy by Ownership by Household Size in Cleveland
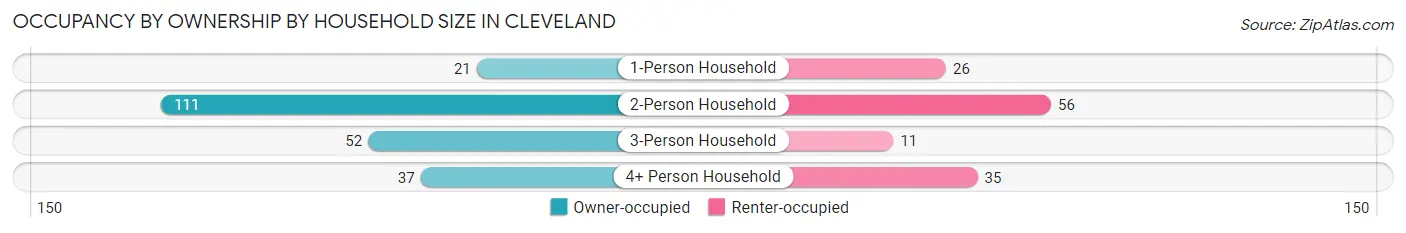
| Household Size | Owner-occupied | Renter-occupied |
| 1-Person Household | 21 (44.7%) | 26 (55.3%) |
| 2-Person Household | 111 (66.5%) | 56 (33.5%) |
| 3-Person Household | 52 (82.5%) | 11 (17.5%) |
| 4+ Person Household | 37 (51.4%) | 35 (48.6%) |
| Total Housing Units | 221 (63.3%) | 128 (36.7%) |
Occupancy by Educational Attainment in Cleveland
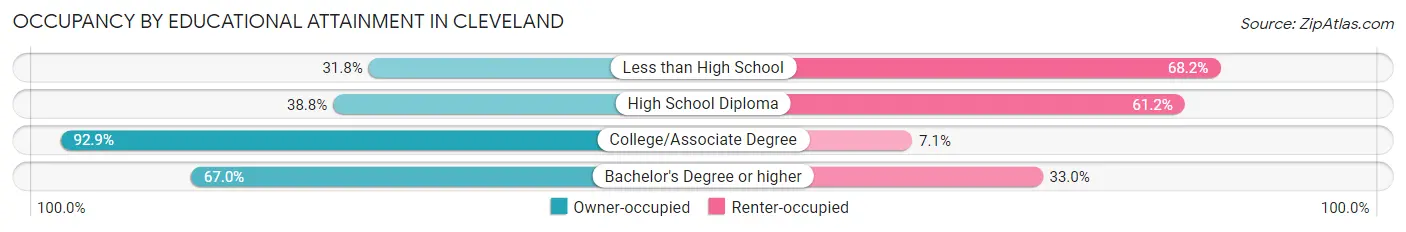
| Household Size | Owner-occupied | Renter-occupied |
| Less than High School | 7 (31.8%) | 15 (68.2%) |
| High School Diploma | 47 (38.8%) | 74 (61.2%) |
| College/Associate Degree | 104 (92.9%) | 8 (7.1%) |
| Bachelor's Degree or higher | 63 (67.0%) | 31 (33.0%) |
Occupancy by Age of Householder in Cleveland
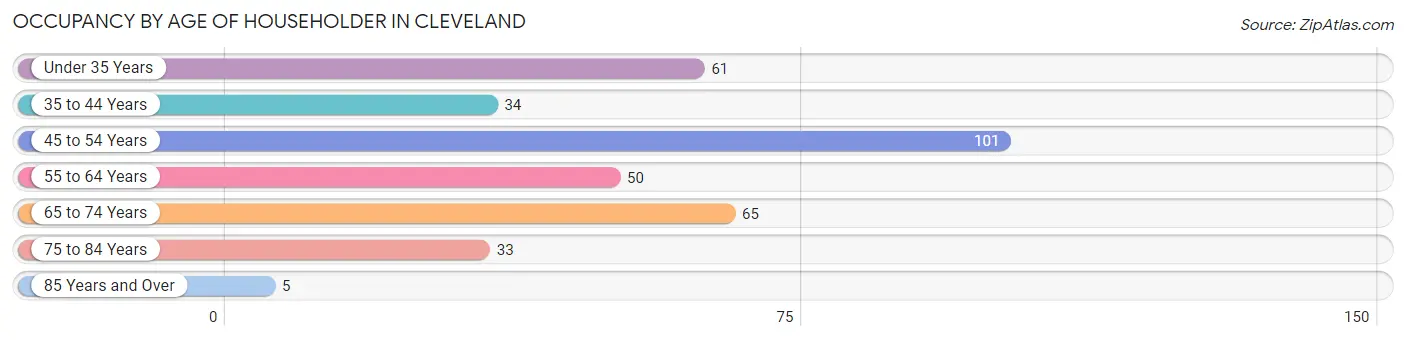
| Age Bracket | # Households | % Households |
| Under 35 Years | 61 | 17.5% |
| 35 to 44 Years | 34 | 9.7% |
| 45 to 54 Years | 101 | 28.9% |
| 55 to 64 Years | 50 | 14.3% |
| 65 to 74 Years | 65 | 18.6% |
| 75 to 84 Years | 33 | 9.5% |
| 85 Years and Over | 5 | 1.4% |
| Total | 349 | 100.0% |
Housing Finances in Cleveland
Median Income by Occupancy in Cleveland
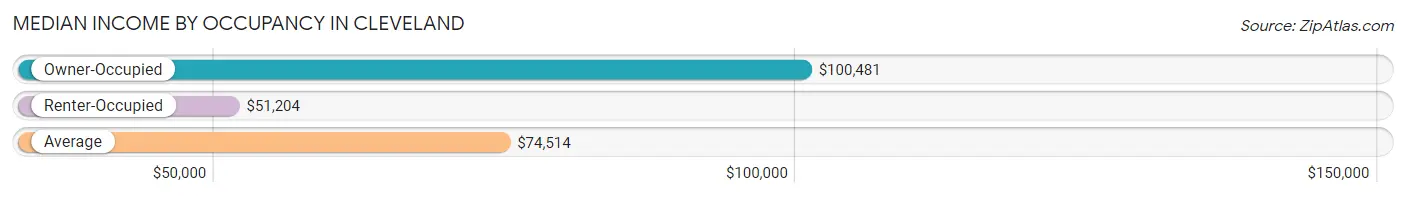
| Occupancy Type | # Households | Median Income |
| Owner-Occupied | 221 (63.3%) | $100,481 |
| Renter-Occupied | 128 (36.7%) | $51,204 |
| Average | 349 (100.0%) | $74,514 |
Occupancy by Householder Income Bracket in Cleveland
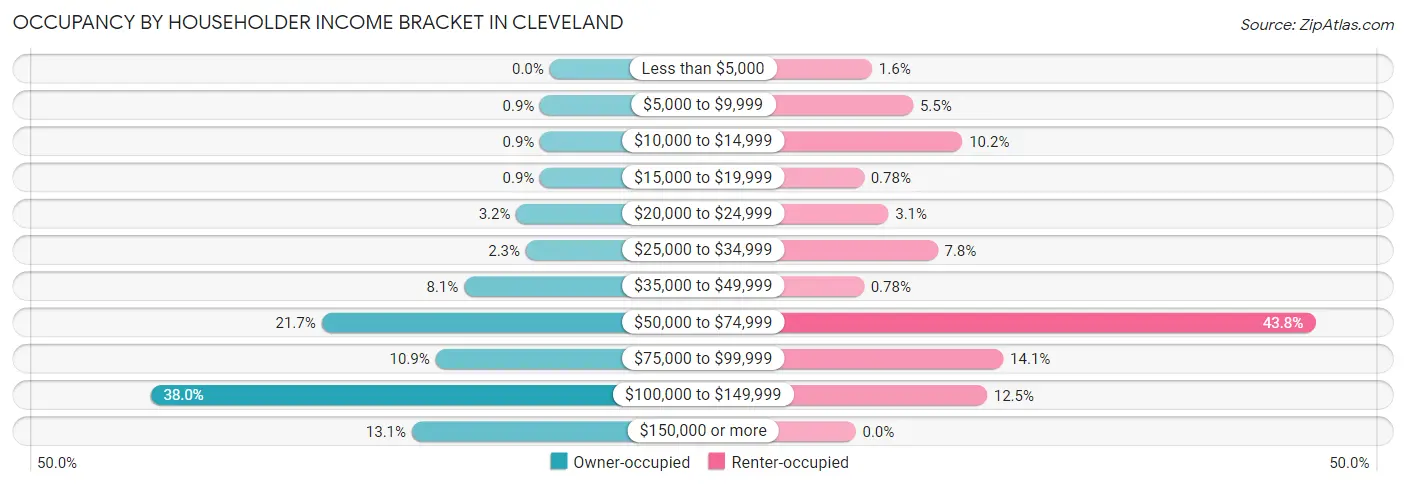
| Income Bracket | Owner-occupied | Renter-occupied |
| Less than $5,000 | 0 (0.0%) | 2 (1.6%) |
| $5,000 to $9,999 | 2 (0.9%) | 7 (5.5%) |
| $10,000 to $14,999 | 2 (0.9%) | 13 (10.2%) |
| $15,000 to $19,999 | 2 (0.9%) | 1 (0.8%) |
| $20,000 to $24,999 | 7 (3.2%) | 4 (3.1%) |
| $25,000 to $34,999 | 5 (2.3%) | 10 (7.8%) |
| $35,000 to $49,999 | 18 (8.1%) | 1 (0.8%) |
| $50,000 to $74,999 | 48 (21.7%) | 56 (43.8%) |
| $75,000 to $99,999 | 24 (10.9%) | 18 (14.1%) |
| $100,000 to $149,999 | 84 (38.0%) | 16 (12.5%) |
| $150,000 or more | 29 (13.1%) | 0 (0.0%) |
| Total | 221 (100.0%) | 128 (100.0%) |
Monthly Housing Cost Tiers in Cleveland
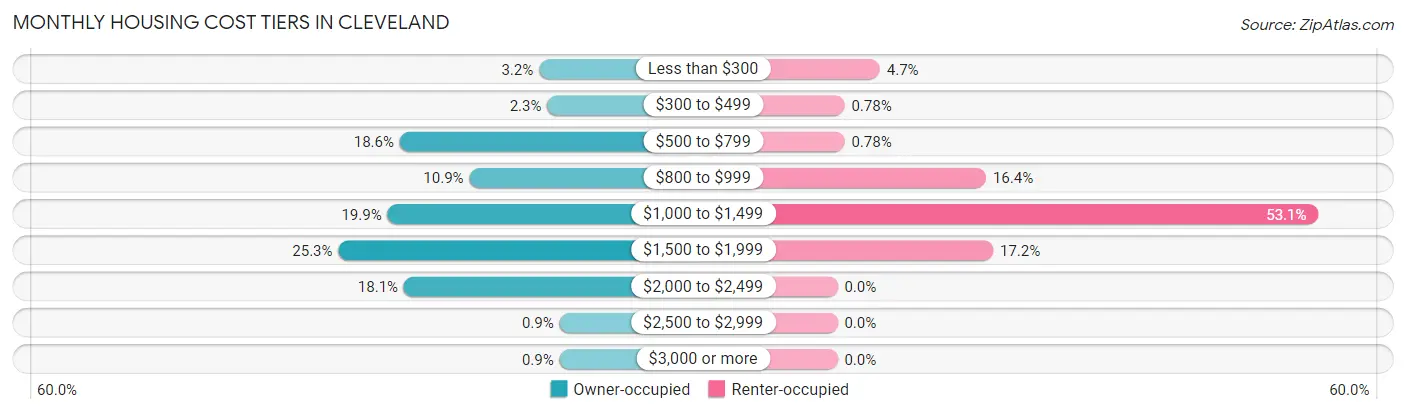
| Monthly Cost | Owner-occupied | Renter-occupied |
| Less than $300 | 7 (3.2%) | 6 (4.7%) |
| $300 to $499 | 5 (2.3%) | 1 (0.8%) |
| $500 to $799 | 41 (18.5%) | 1 (0.8%) |
| $800 to $999 | 24 (10.9%) | 21 (16.4%) |
| $1,000 to $1,499 | 44 (19.9%) | 68 (53.1%) |
| $1,500 to $1,999 | 56 (25.3%) | 22 (17.2%) |
| $2,000 to $2,499 | 40 (18.1%) | 0 (0.0%) |
| $2,500 to $2,999 | 2 (0.9%) | 0 (0.0%) |
| $3,000 or more | 2 (0.9%) | 0 (0.0%) |
| Total | 221 (100.0%) | 128 (100.0%) |
Physical Housing Characteristics in Cleveland
Housing Structures in Cleveland
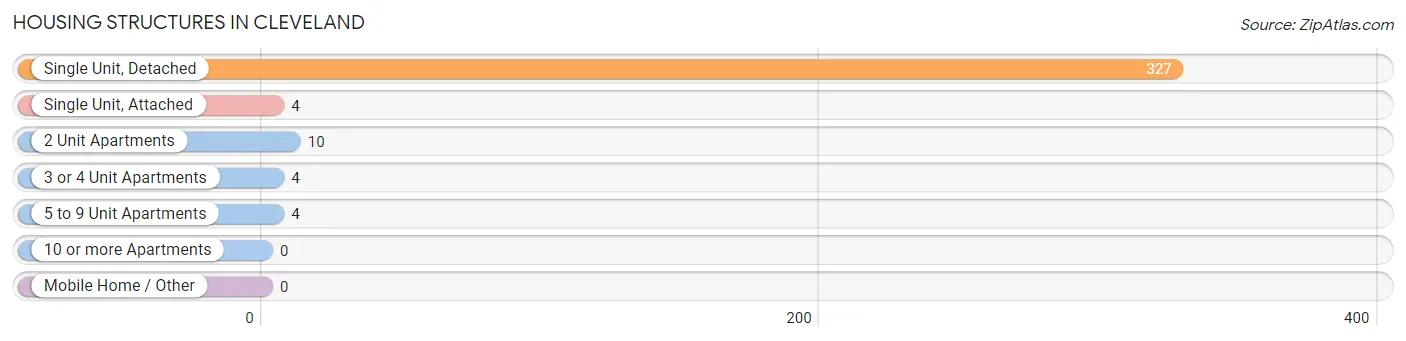
| Structure Type | # Housing Units | % Housing Units |
| Single Unit, Detached | 327 | 93.7% |
| Single Unit, Attached | 4 | 1.1% |
| 2 Unit Apartments | 10 | 2.9% |
| 3 or 4 Unit Apartments | 4 | 1.1% |
| 5 to 9 Unit Apartments | 4 | 1.1% |
| 10 or more Apartments | 0 | 0.0% |
| Mobile Home / Other | 0 | 0.0% |
| Total | 349 | 100.0% |
Housing Structures by Occupancy in Cleveland
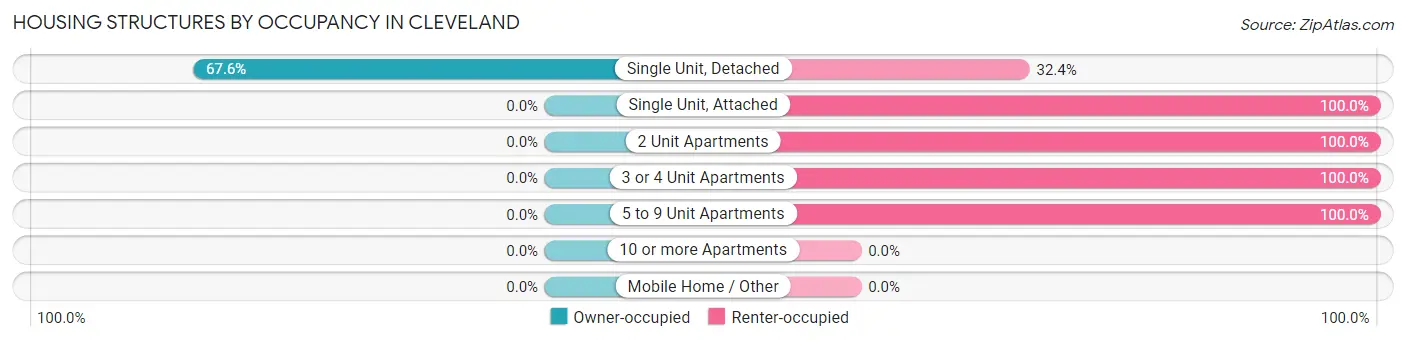
| Structure Type | Owner-occupied | Renter-occupied |
| Single Unit, Detached | 221 (67.6%) | 106 (32.4%) |
| Single Unit, Attached | 0 (0.0%) | 4 (100.0%) |
| 2 Unit Apartments | 0 (0.0%) | 10 (100.0%) |
| 3 or 4 Unit Apartments | 0 (0.0%) | 4 (100.0%) |
| 5 to 9 Unit Apartments | 0 (0.0%) | 4 (100.0%) |
| 10 or more Apartments | 0 (0.0%) | 0 (0.0%) |
| Mobile Home / Other | 0 (0.0%) | 0 (0.0%) |
| Total | 221 (63.3%) | 128 (36.7%) |
Housing Structures by Number of Rooms in Cleveland
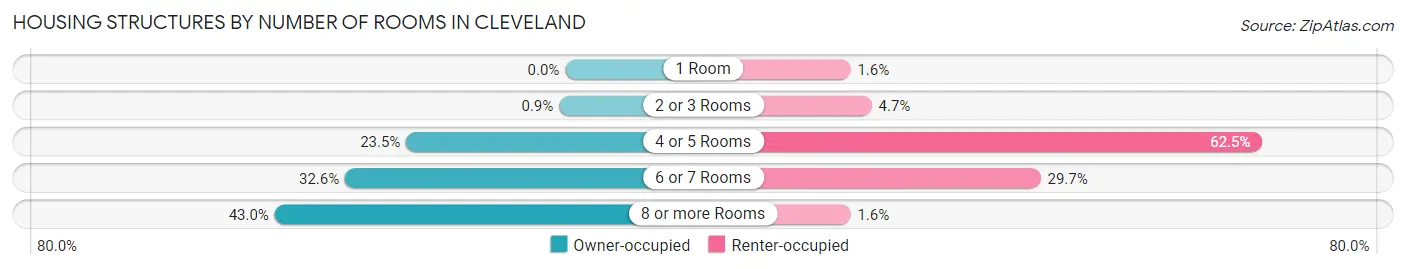
| Number of Rooms | Owner-occupied | Renter-occupied |
| 1 Room | 0 (0.0%) | 2 (1.6%) |
| 2 or 3 Rooms | 2 (0.9%) | 6 (4.7%) |
| 4 or 5 Rooms | 52 (23.5%) | 80 (62.5%) |
| 6 or 7 Rooms | 72 (32.6%) | 38 (29.7%) |
| 8 or more Rooms | 95 (43.0%) | 2 (1.6%) |
| Total | 221 (100.0%) | 128 (100.0%) |
Housing Structure by Heating Type in Cleveland
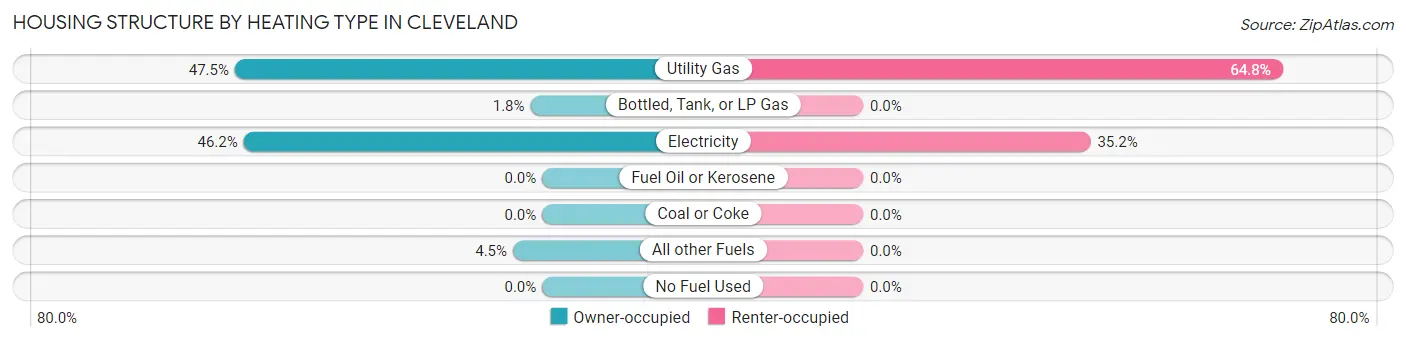
| Heating Type | Owner-occupied | Renter-occupied |
| Utility Gas | 105 (47.5%) | 83 (64.8%) |
| Bottled, Tank, or LP Gas | 4 (1.8%) | 0 (0.0%) |
| Electricity | 102 (46.2%) | 45 (35.2%) |
| Fuel Oil or Kerosene | 0 (0.0%) | 0 (0.0%) |
| Coal or Coke | 0 (0.0%) | 0 (0.0%) |
| All other Fuels | 10 (4.5%) | 0 (0.0%) |
| No Fuel Used | 0 (0.0%) | 0 (0.0%) |
| Total | 221 (100.0%) | 128 (100.0%) |
Household Vehicle Usage in Cleveland
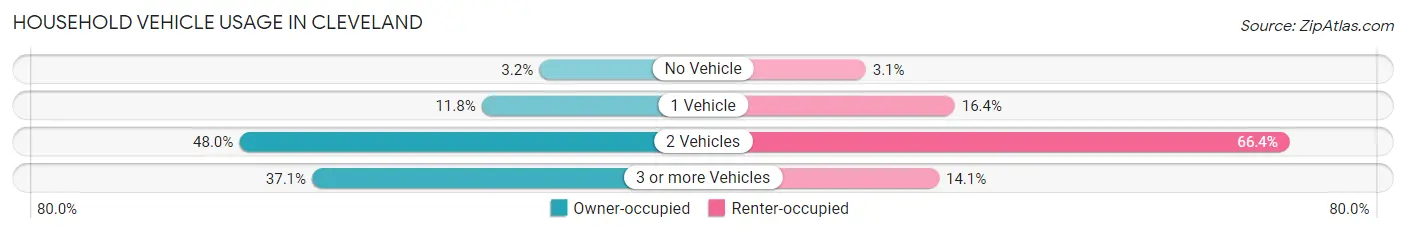
| Vehicles per Household | Owner-occupied | Renter-occupied |
| No Vehicle | 7 (3.2%) | 4 (3.1%) |
| 1 Vehicle | 26 (11.8%) | 21 (16.4%) |
| 2 Vehicles | 106 (48.0%) | 85 (66.4%) |
| 3 or more Vehicles | 82 (37.1%) | 18 (14.1%) |
| Total | 221 (100.0%) | 128 (100.0%) |
Real Estate & Mortgages in Cleveland
Real Estate and Mortgage Overview in Cleveland
| Characteristic | Without Mortgage | With Mortgage |
| Housing Units | 60 | 161 |
| Median Property Value | $235,000 | $264,500 |
| Median Household Income | $83,750 | $17 |
| Monthly Housing Costs | $665 | $2 |
| Real Estate Taxes | $2,304 | $2 |
Property Value by Mortgage Status in Cleveland
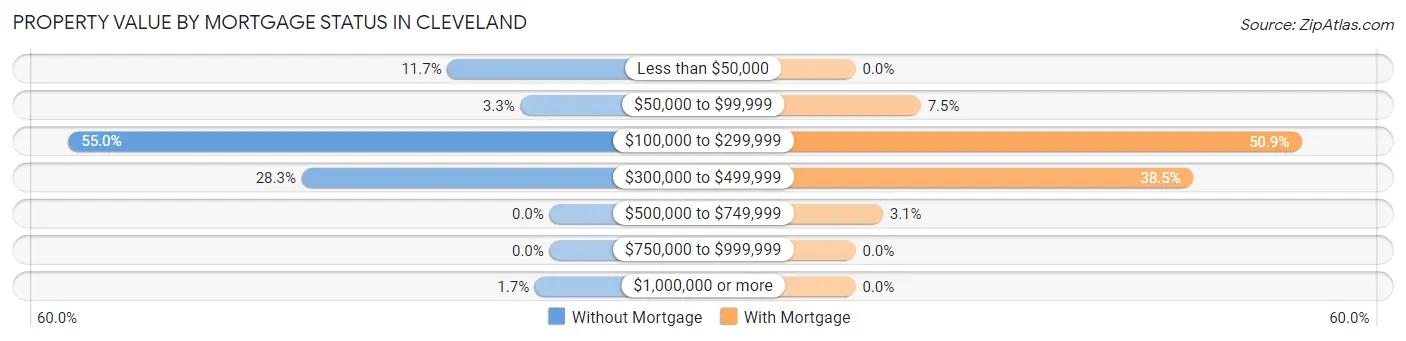
| Property Value | Without Mortgage | With Mortgage |
| Less than $50,000 | 7 (11.7%) | 0 (0.0%) |
| $50,000 to $99,999 | 2 (3.3%) | 12 (7.4%) |
| $100,000 to $299,999 | 33 (55.0%) | 82 (50.9%) |
| $300,000 to $499,999 | 17 (28.3%) | 62 (38.5%) |
| $500,000 to $749,999 | 0 (0.0%) | 5 (3.1%) |
| $750,000 to $999,999 | 0 (0.0%) | 0 (0.0%) |
| $1,000,000 or more | 1 (1.7%) | 0 (0.0%) |
| Total | 60 (100.0%) | 161 (100.0%) |
Household Income by Mortgage Status in Cleveland
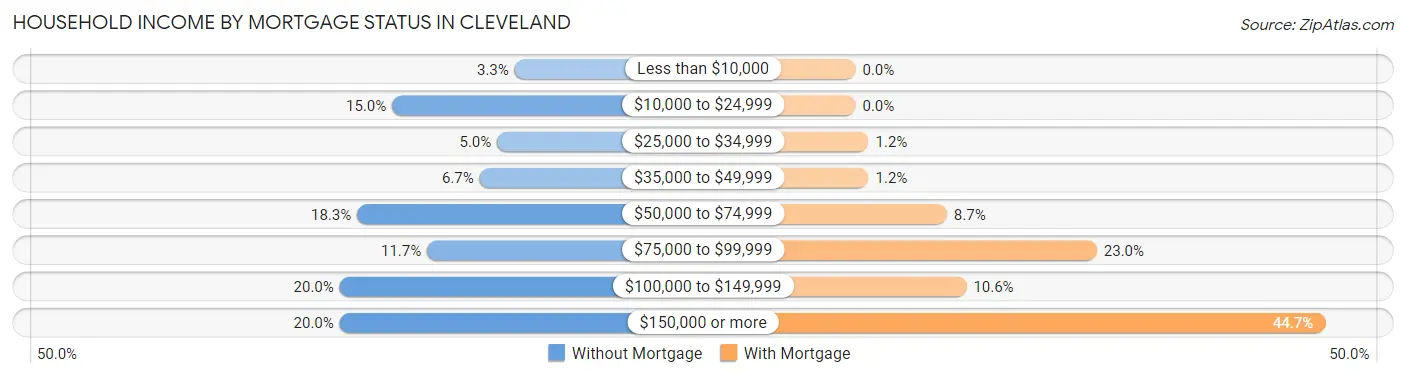
| Household Income | Without Mortgage | With Mortgage |
| Less than $10,000 | 2 (3.3%) | 0 (0.0%) |
| $10,000 to $24,999 | 9 (15.0%) | 0 (0.0%) |
| $25,000 to $34,999 | 3 (5.0%) | 2 (1.2%) |
| $35,000 to $49,999 | 4 (6.7%) | 2 (1.2%) |
| $50,000 to $74,999 | 11 (18.3%) | 14 (8.7%) |
| $75,000 to $99,999 | 7 (11.7%) | 37 (23.0%) |
| $100,000 to $149,999 | 12 (20.0%) | 17 (10.6%) |
| $150,000 or more | 12 (20.0%) | 72 (44.7%) |
| Total | 60 (100.0%) | 161 (100.0%) |
Property Value to Household Income Ratio in Cleveland
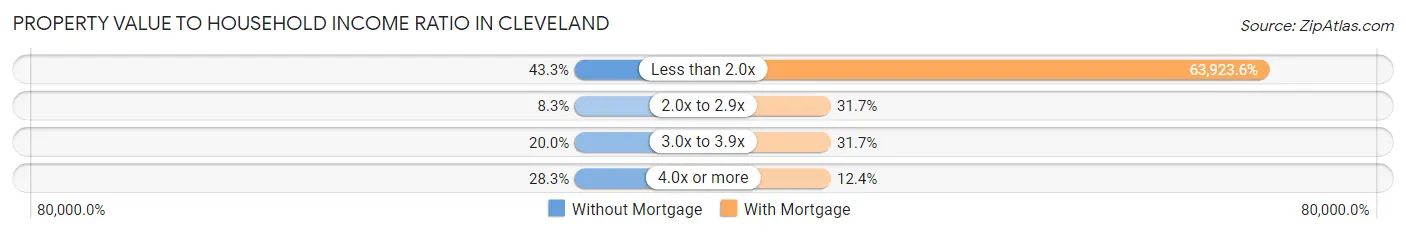
| Value-to-Income Ratio | Without Mortgage | With Mortgage |
| Less than 2.0x | 26 (43.3%) | 102,917 (63,923.6%) |
| 2.0x to 2.9x | 5 (8.3%) | 51 (31.7%) |
| 3.0x to 3.9x | 12 (20.0%) | 51 (31.7%) |
| 4.0x or more | 17 (28.3%) | 20 (12.4%) |
| Total | 60 (100.0%) | 161 (100.0%) |
Real Estate Taxes by Mortgage Status in Cleveland
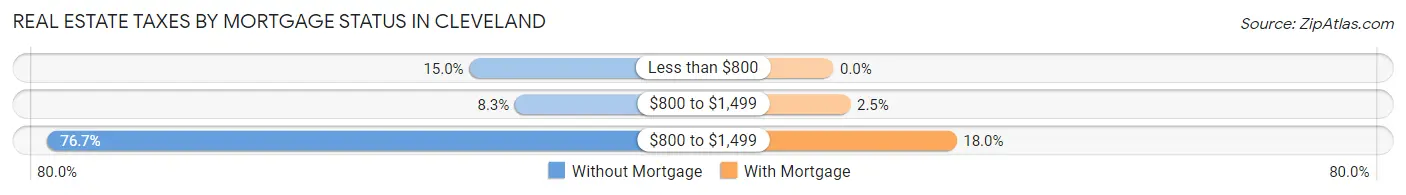
| Property Taxes | Without Mortgage | With Mortgage |
| Less than $800 | 9 (15.0%) | 0 (0.0%) |
| $800 to $1,499 | 5 (8.3%) | 4 (2.5%) |
| $800 to $1,499 | 46 (76.7%) | 29 (18.0%) |
| Total | 60 (100.0%) | 161 (100.0%) |
Health & Disability in Cleveland
Health Insurance Coverage by Age in Cleveland
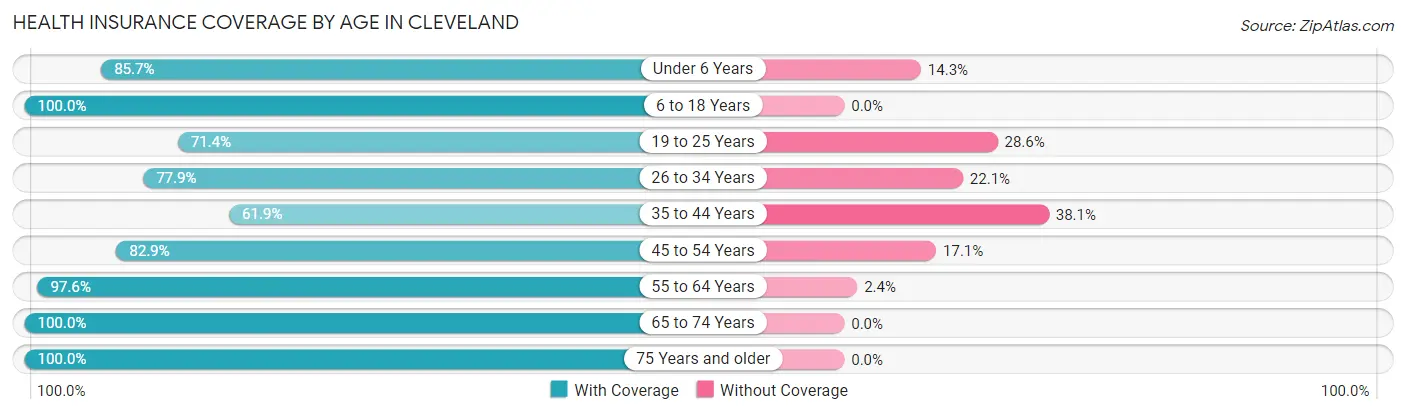
| Age Bracket | With Coverage | Without Coverage |
| Under 6 Years | 36 (85.7%) | 6 (14.3%) |
| 6 to 18 Years | 183 (100.0%) | 0 (0.0%) |
| 19 to 25 Years | 30 (71.4%) | 12 (28.6%) |
| 26 to 34 Years | 88 (77.9%) | 25 (22.1%) |
| 35 to 44 Years | 60 (61.9%) | 37 (38.1%) |
| 45 to 54 Years | 121 (82.9%) | 25 (17.1%) |
| 55 to 64 Years | 81 (97.6%) | 2 (2.4%) |
| 65 to 74 Years | 104 (100.0%) | 0 (0.0%) |
| 75 Years and older | 113 (100.0%) | 0 (0.0%) |
| Total | 816 (88.4%) | 107 (11.6%) |
Health Insurance Coverage by Citizenship Status in Cleveland
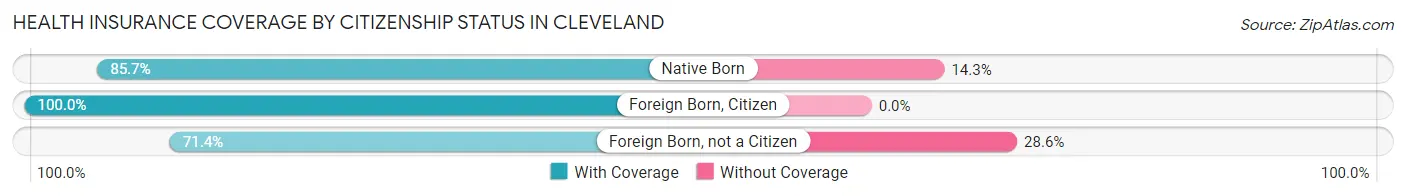
| Citizenship Status | With Coverage | Without Coverage |
| Native Born | 36 (85.7%) | 6 (14.3%) |
| Foreign Born, Citizen | 183 (100.0%) | 0 (0.0%) |
| Foreign Born, not a Citizen | 30 (71.4%) | 12 (28.6%) |
Health Insurance Coverage by Household Income in Cleveland
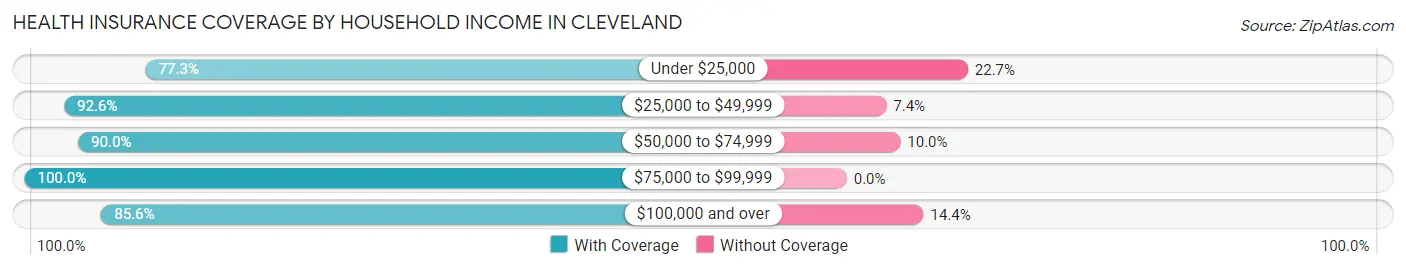
| Household Income | With Coverage | Without Coverage |
| Under $25,000 | 75 (77.3%) | 22 (22.7%) |
| $25,000 to $49,999 | 50 (92.6%) | 4 (7.4%) |
| $50,000 to $74,999 | 206 (90.0%) | 23 (10.0%) |
| $75,000 to $99,999 | 140 (100.0%) | 0 (0.0%) |
| $100,000 and over | 345 (85.6%) | 58 (14.4%) |
Public vs Private Health Insurance Coverage by Age in Cleveland
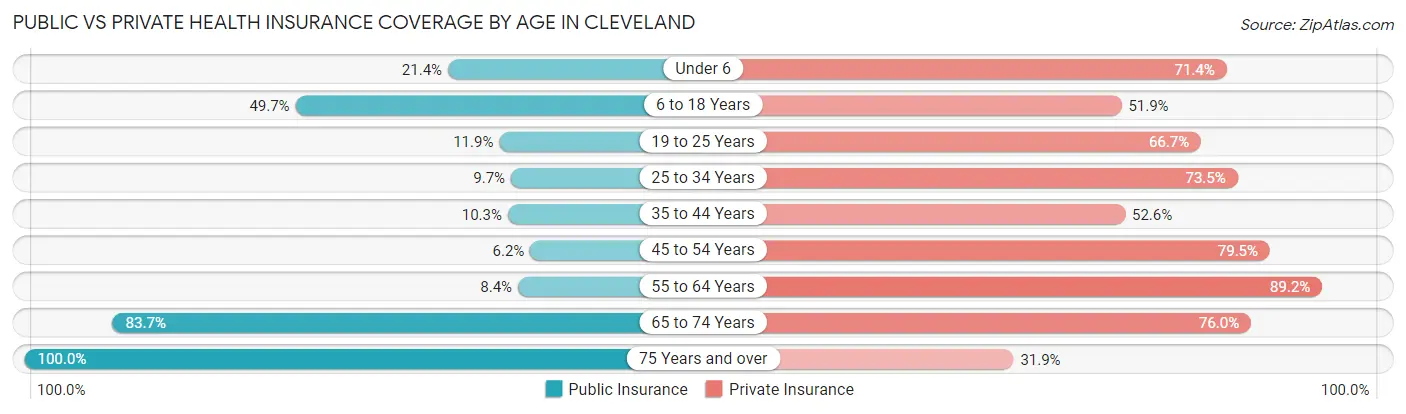
| Age Bracket | Public Insurance | Private Insurance |
| Under 6 | 9 (21.4%) | 30 (71.4%) |
| 6 to 18 Years | 91 (49.7%) | 95 (51.9%) |
| 19 to 25 Years | 5 (11.9%) | 28 (66.7%) |
| 25 to 34 Years | 11 (9.7%) | 83 (73.5%) |
| 35 to 44 Years | 10 (10.3%) | 51 (52.6%) |
| 45 to 54 Years | 9 (6.2%) | 116 (79.4%) |
| 55 to 64 Years | 7 (8.4%) | 74 (89.2%) |
| 65 to 74 Years | 87 (83.7%) | 79 (76.0%) |
| 75 Years and over | 113 (100.0%) | 36 (31.9%) |
| Total | 342 (37.0%) | 592 (64.1%) |
Disability Status by Sex by Age in Cleveland
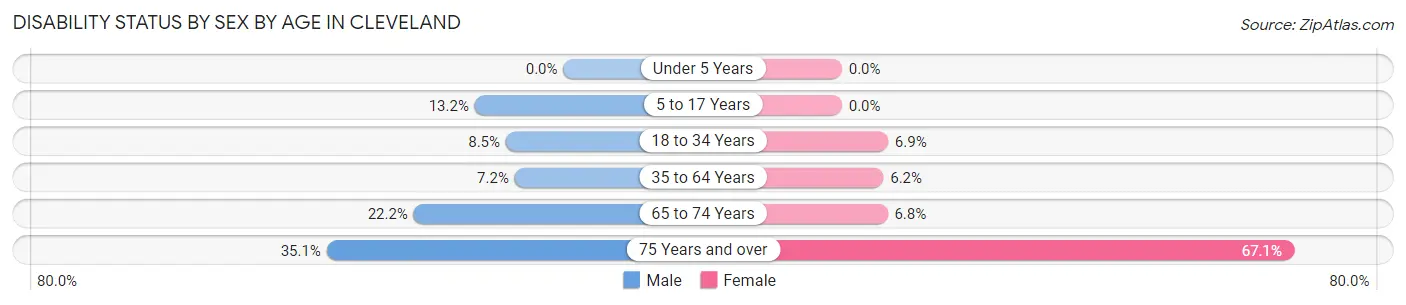
| Age Bracket | Male | Female |
| Under 5 Years | 0 (0.0%) | 0 (0.0%) |
| 5 to 17 Years | 10 (13.2%) | 0 (0.0%) |
| 18 to 34 Years | 7 (8.5%) | 5 (6.9%) |
| 35 to 64 Years | 13 (7.2%) | 9 (6.2%) |
| 65 to 74 Years | 10 (22.2%) | 4 (6.8%) |
| 75 Years and over | 13 (35.1%) | 51 (67.1%) |
Disability Class by Sex by Age in Cleveland
Disability Class: Hearing Difficulty
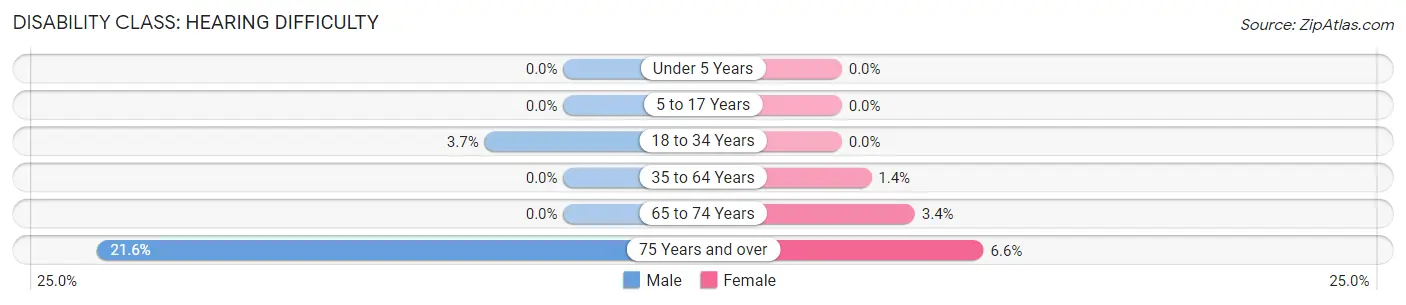
| Age Bracket | Male | Female |
| Under 5 Years | 0 (0.0%) | 0 (0.0%) |
| 5 to 17 Years | 0 (0.0%) | 0 (0.0%) |
| 18 to 34 Years | 3 (3.7%) | 0 (0.0%) |
| 35 to 64 Years | 0 (0.0%) | 2 (1.4%) |
| 65 to 74 Years | 0 (0.0%) | 2 (3.4%) |
| 75 Years and over | 8 (21.6%) | 5 (6.6%) |
Disability Class: Vision Difficulty
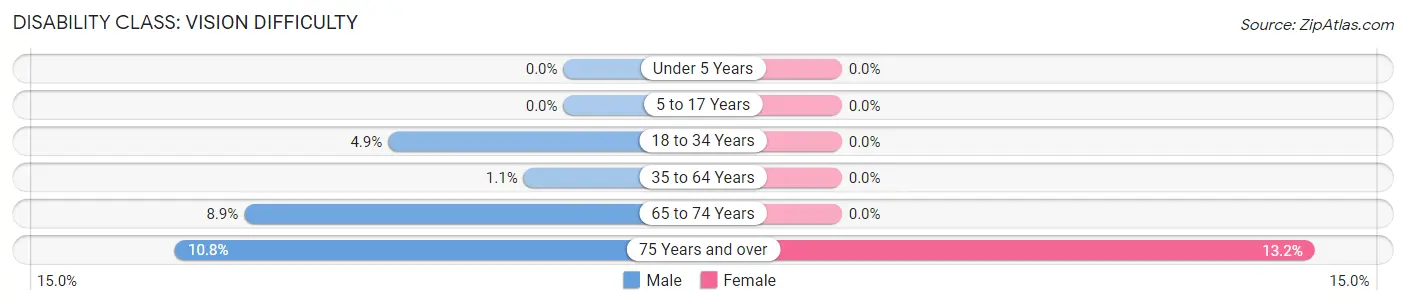
| Age Bracket | Male | Female |
| Under 5 Years | 0 (0.0%) | 0 (0.0%) |
| 5 to 17 Years | 0 (0.0%) | 0 (0.0%) |
| 18 to 34 Years | 4 (4.9%) | 0 (0.0%) |
| 35 to 64 Years | 2 (1.1%) | 0 (0.0%) |
| 65 to 74 Years | 4 (8.9%) | 0 (0.0%) |
| 75 Years and over | 4 (10.8%) | 10 (13.2%) |
Disability Class: Cognitive Difficulty
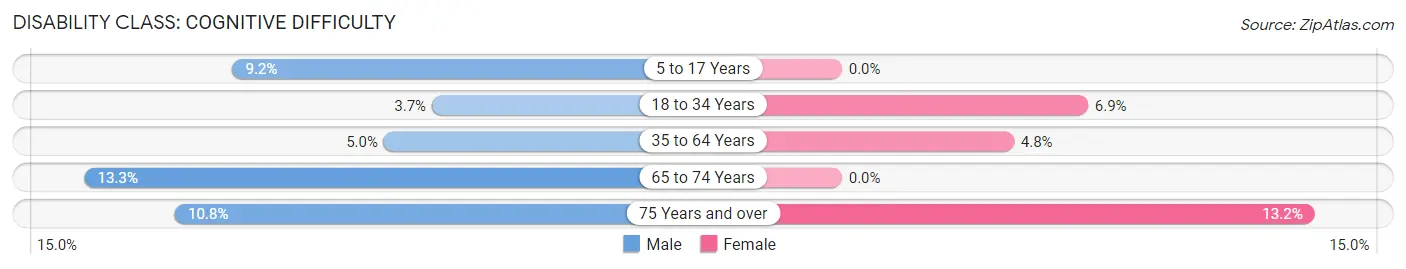
| Age Bracket | Male | Female |
| 5 to 17 Years | 7 (9.2%) | 0 (0.0%) |
| 18 to 34 Years | 3 (3.7%) | 5 (6.9%) |
| 35 to 64 Years | 9 (5.0%) | 7 (4.8%) |
| 65 to 74 Years | 6 (13.3%) | 0 (0.0%) |
| 75 Years and over | 4 (10.8%) | 10 (13.2%) |
Disability Class: Ambulatory Difficulty
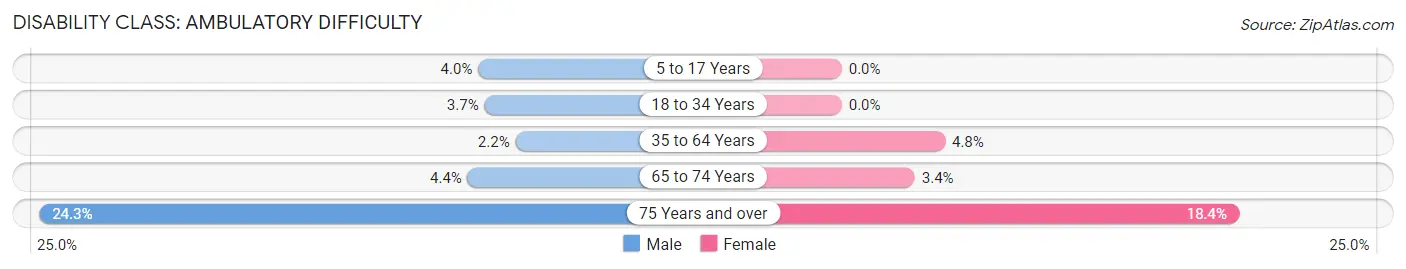
| Age Bracket | Male | Female |
| 5 to 17 Years | 3 (4.0%) | 0 (0.0%) |
| 18 to 34 Years | 3 (3.7%) | 0 (0.0%) |
| 35 to 64 Years | 4 (2.2%) | 7 (4.8%) |
| 65 to 74 Years | 2 (4.4%) | 2 (3.4%) |
| 75 Years and over | 9 (24.3%) | 14 (18.4%) |
Disability Class: Self-Care Difficulty
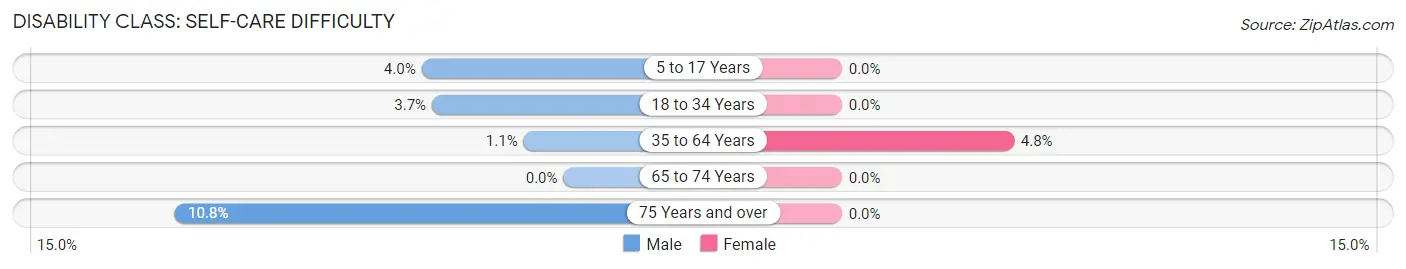
| Age Bracket | Male | Female |
| 5 to 17 Years | 3 (4.0%) | 0 (0.0%) |
| 18 to 34 Years | 3 (3.7%) | 0 (0.0%) |
| 35 to 64 Years | 2 (1.1%) | 7 (4.8%) |
| 65 to 74 Years | 0 (0.0%) | 0 (0.0%) |
| 75 Years and over | 4 (10.8%) | 0 (0.0%) |
Technology Access in Cleveland
Computing Device Access in Cleveland
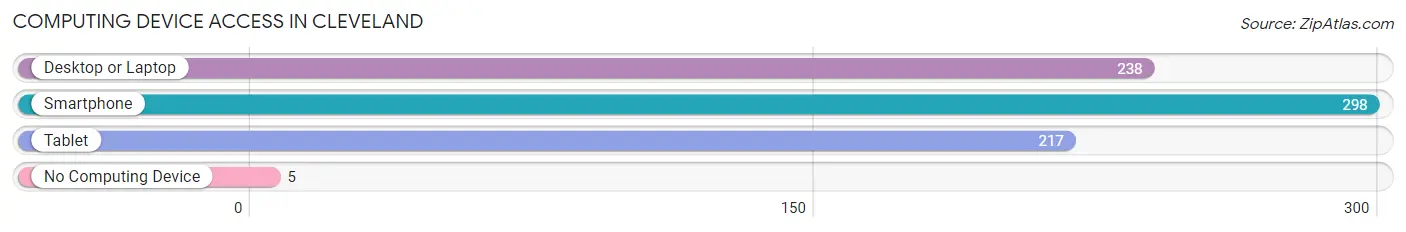
| Device Type | # Households | % Households |
| Desktop or Laptop | 238 | 68.2% |
| Smartphone | 298 | 85.4% |
| Tablet | 217 | 62.2% |
| No Computing Device | 5 | 1.4% |
| Total | 349 | 100.0% |
Internet Access in Cleveland
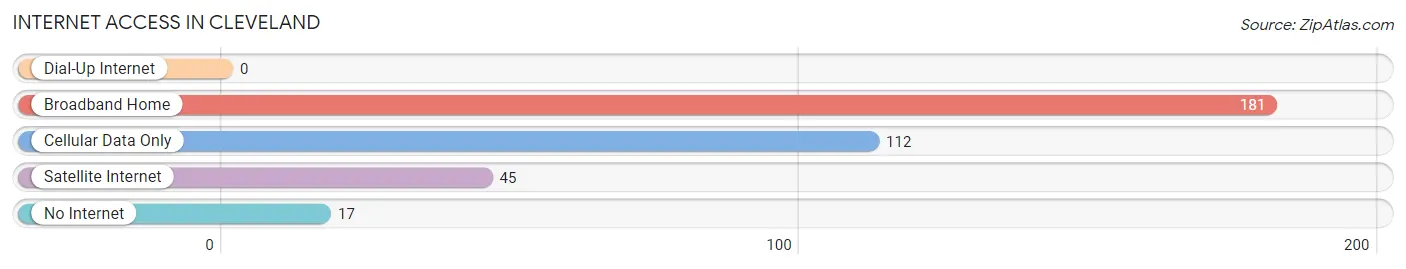
| Internet Type | # Households | % Households |
| Dial-Up Internet | 0 | 0.0% |
| Broadband Home | 181 | 51.9% |
| Cellular Data Only | 112 | 32.1% |
| Satellite Internet | 45 | 12.9% |
| No Internet | 17 | 4.9% |
| Total | 349 | 100.0% |
Cleveland Summary
Cleveland is a small town located in the northwest corner of Missouri, in the United States. It is situated in the northwest corner of the state, near the Iowa border. The town is located in the county of Clinton, and is part of the Kansas City metropolitan area. The population of Cleveland was estimated to be 1,093 in the year 2020.
Geography
Cleveland is located in the northwest corner of Missouri, near the Iowa border. It is situated in the county of Clinton, and is part of the Kansas City metropolitan area. The town is located in the Missouri River Valley, and is surrounded by rolling hills and wooded areas. The town is located at an elevation of 890 feet above sea level.
The climate in Cleveland is classified as humid continental, with hot summers and cold winters. The average annual temperature is around 54 degrees Fahrenheit, with an average high of around 79 degrees Fahrenheit in the summer and an average low of around 28 degrees Fahrenheit in the winter. The average annual precipitation is around 40 inches.
Economy
Cleveland’s economy is largely based on agriculture and manufacturing. The town is home to several small businesses, including a feed mill, a lumber yard, and a grain elevator. The town also has a few small retail stores, including a grocery store, a hardware store, and a few restaurants.
The town is also home to a few small manufacturing companies, including a plastics manufacturer and a metal fabrication shop. The town is also home to a few small farms, which produce corn, soybeans, and hay.
Demographics
As of the 2020 census, the population of Cleveland was estimated to be 1,093. The racial makeup of the town was 97.3% White, 0.7% African American, 0.3% Native American, 0.2% Asian, 0.1% Pacific Islander, 0.2% from other races, and 1.3% from two or more races. Hispanic or Latino of any race were 1.3% of the population.
The median household income in Cleveland was estimated to be $41,250 in 2020. The per capita income was estimated to be $20,945. The median age of the population was estimated to be 41.7 years.
Conclusion
Cleveland is a small town located in the northwest corner of Missouri, in the United States. It is situated in the county of Clinton, and is part of the Kansas City metropolitan area. The town is located in the Missouri River Valley, and is surrounded by rolling hills and wooded areas. The population of Cleveland was estimated to be 1,093 in the year 2020. The town’s economy is largely based on agriculture and manufacturing, and the town is home to several small businesses. The racial makeup of the town was 97.3% White, 0.7% African American, 0.3% Native American, 0.2% Asian, 0.1% Pacific Islander, 0.2% from other races, and 1.3% from two or more races. The median household income in Cleveland was estimated to be $41,250 in 2020.
Common Questions
What is Per Capita Income in Cleveland?
Per Capita income in Cleveland is $35,285.
What is the Median Family Income in Cleveland?
Median Family Income in Cleveland is $73,281.
What is the Median Household income in Cleveland?
Median Household Income in Cleveland is $74,514.
What is Income or Wage Gap in Cleveland?
Income or Wage Gap in Cleveland is 30.1%.
Women in Cleveland earn 69.9 cents for every dollar earned by a man.
What is Inequality or Gini Index in Cleveland?
Inequality or Gini Index in Cleveland is 0.37.
What is the Total Population of Cleveland?
Total Population of Cleveland is 923.
What is the Total Male Population of Cleveland?
Total Male Population of Cleveland is 444.
What is the Total Female Population of Cleveland?
Total Female Population of Cleveland is 479.
What is the Ratio of Males per 100 Females in Cleveland?
There are 92.69 Males per 100 Females in Cleveland.
What is the Ratio of Females per 100 Males in Cleveland?
There are 107.88 Females per 100 Males in Cleveland.
What is the Median Population Age in Cleveland?
Median Population Age in Cleveland is 42.8 Years.
What is the Average Family Size in Cleveland
Average Family Size in Cleveland is 2.9 People.
What is the Average Household Size in Cleveland
Average Household Size in Cleveland is 2.6 People.
How Large is the Labor Force in Cleveland?
There are 447 People in the Labor Forcein in Cleveland.
What is the Percentage of People in the Labor Force in Cleveland?
59.7% of People are in the Labor Force in Cleveland.
What is the Unemployment Rate in Cleveland?
Unemployment Rate in Cleveland is 2.5%.