Chilhowee, MO Map & Demographics
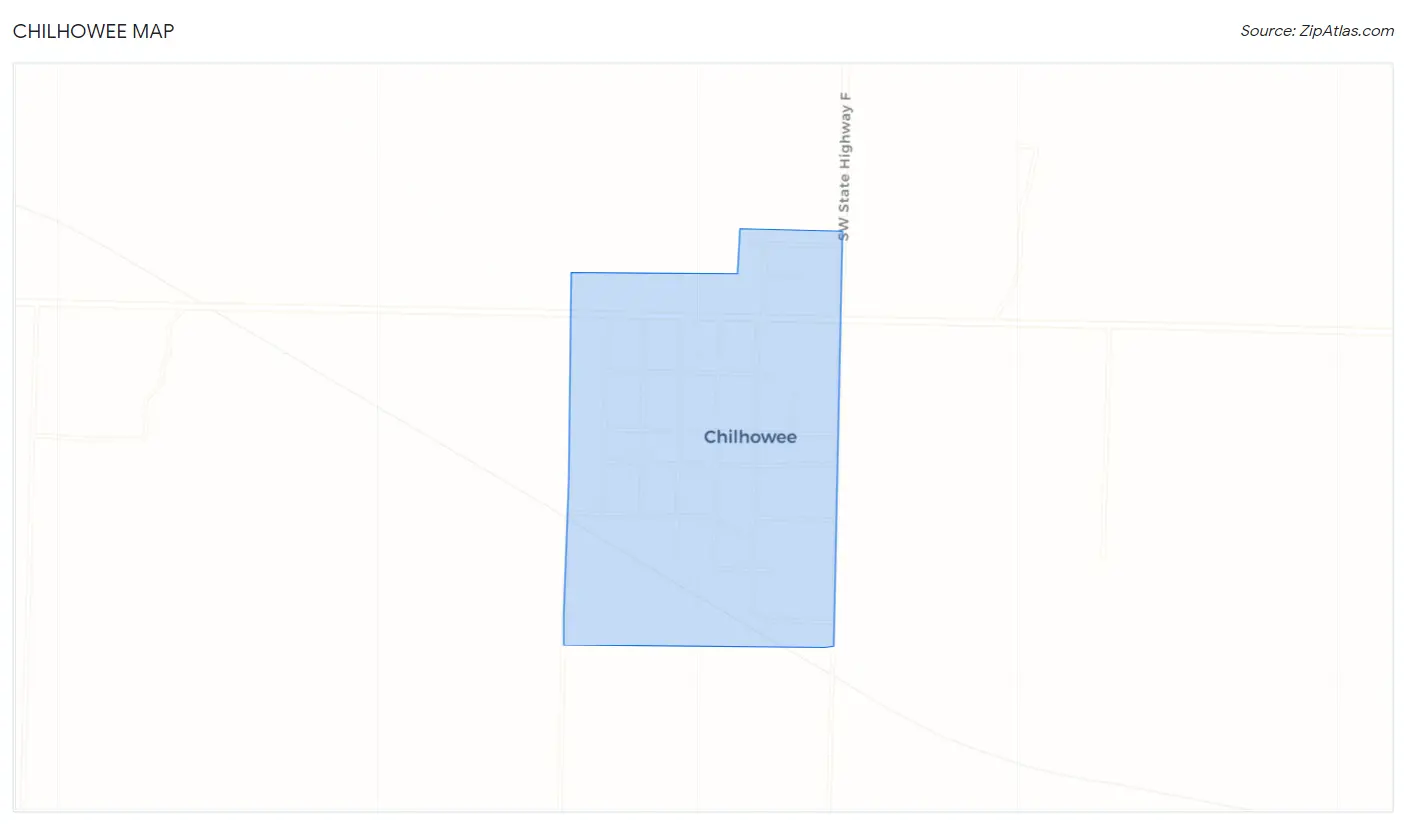
Chilhowee Map
Chilhowee Overview
$16,447
PER CAPITA INCOME
$50,208
AVG FAMILY INCOME
$40,417
AVG HOUSEHOLD INCOME
23.1%
WAGE / INCOME GAP [ % ]
76.9¢/ $1
WAGE / INCOME GAP [ $ ]
$15,900
FAMILY INCOME DEFICIT
0.40
INEQUALITY / GINI INDEX
267
TOTAL POPULATION
121
MALE POPULATION
146
FEMALE POPULATION
82.88
MALES / 100 FEMALES
120.66
FEMALES / 100 MALES
34.4
MEDIAN AGE
3.2
AVG FAMILY SIZE
2.6
AVG HOUSEHOLD SIZE
96
LABOR FORCE [ PEOPLE ]
50.8%
PERCENT IN LABOR FORCE
8.3%
UNEMPLOYMENT RATE
Chilhowee Zip Codes
Income in Chilhowee
Income Overview in Chilhowee
Per Capita Income in Chilhowee is $16,447, while median incomes of families and households are $50,208 and $40,417 respectively.
| Characteristic | Number | Measure |
| Per Capita Income | 267 | $16,447 |
| Median Family Income | 59 | $50,208 |
| Mean Family Income | 59 | $51,710 |
| Median Household Income | 101 | $40,417 |
| Mean Household Income | 101 | $42,458 |
| Income Deficit | 59 | $15,900 |
| Wage / Income Gap (%) | 267 | 23.14% |
| Wage / Income Gap ($) | 267 | 76.86¢ per $1 |
| Gini / Inequality Index | 267 | 0.40 |
Earnings by Sex in Chilhowee
Average Earnings in Chilhowee are $28,125, $31,875 for men and $24,500 for women, a difference of 23.1%.
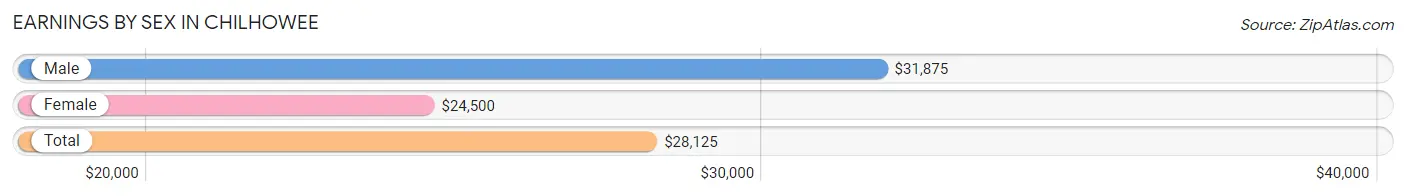
| Sex | Number | Average Earnings |
| Male | 58 (53.7%) | $31,875 |
| Female | 50 (46.3%) | $24,500 |
| Total | 108 (100.0%) | $28,125 |
Earnings by Sex by Income Bracket in Chilhowee
The most common earnings brackets in Chilhowee are $40,000 to $44,999 for men (10 | 17.2%) and $30,000 to $34,999 for women (13 | 26.0%).
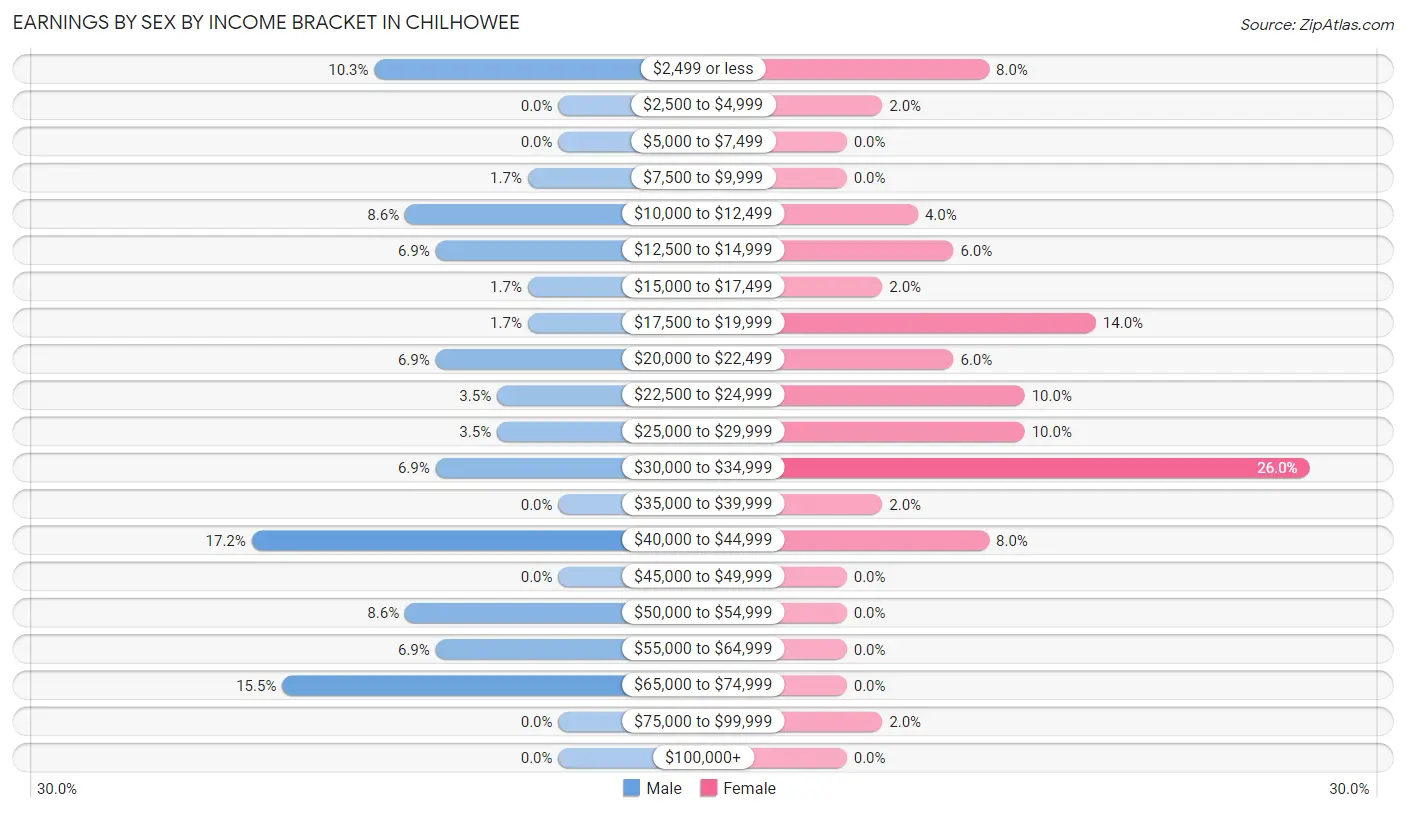
| Income | Male | Female |
| $2,499 or less | 6 (10.3%) | 4 (8.0%) |
| $2,500 to $4,999 | 0 (0.0%) | 1 (2.0%) |
| $5,000 to $7,499 | 0 (0.0%) | 0 (0.0%) |
| $7,500 to $9,999 | 1 (1.7%) | 0 (0.0%) |
| $10,000 to $12,499 | 5 (8.6%) | 2 (4.0%) |
| $12,500 to $14,999 | 4 (6.9%) | 3 (6.0%) |
| $15,000 to $17,499 | 1 (1.7%) | 1 (2.0%) |
| $17,500 to $19,999 | 1 (1.7%) | 7 (14.0%) |
| $20,000 to $22,499 | 4 (6.9%) | 3 (6.0%) |
| $22,500 to $24,999 | 2 (3.5%) | 5 (10.0%) |
| $25,000 to $29,999 | 2 (3.5%) | 5 (10.0%) |
| $30,000 to $34,999 | 4 (6.9%) | 13 (26.0%) |
| $35,000 to $39,999 | 0 (0.0%) | 1 (2.0%) |
| $40,000 to $44,999 | 10 (17.2%) | 4 (8.0%) |
| $45,000 to $49,999 | 0 (0.0%) | 0 (0.0%) |
| $50,000 to $54,999 | 5 (8.6%) | 0 (0.0%) |
| $55,000 to $64,999 | 4 (6.9%) | 0 (0.0%) |
| $65,000 to $74,999 | 9 (15.5%) | 0 (0.0%) |
| $75,000 to $99,999 | 0 (0.0%) | 1 (2.0%) |
| $100,000+ | 0 (0.0%) | 0 (0.0%) |
| Total | 58 (100.0%) | 50 (100.0%) |
Earnings by Sex by Educational Attainment in Chilhowee
Average earnings in Chilhowee are $42,500 for men and $28,125 for women, a difference of 33.8%. Men with an educational attainment of bachelor's degree enjoy the highest average annual earnings of $60,625, while those with less than high school education earn the least with $14,688. Women with an educational attainment of college or associate's degree earn the most with the average annual earnings of $31,250, while those with high school diploma education have the smallest earnings of $24,583.
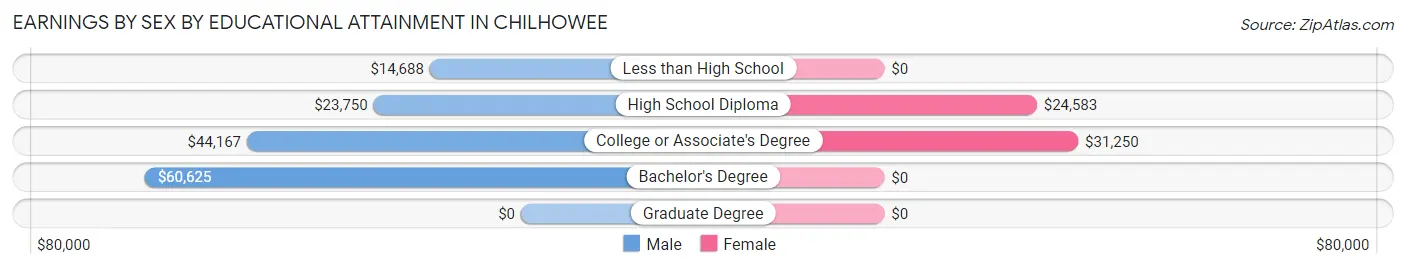
| Educational Attainment | Male Income | Female Income |
| Less than High School | $14,688 | $0 |
| High School Diploma | $23,750 | $24,583 |
| College or Associate's Degree | $44,167 | $31,250 |
| Bachelor's Degree | $60,625 | $0 |
| Graduate Degree | - | - |
| Total | $42,500 | $28,125 |
Family Income in Chilhowee
Family Income Brackets in Chilhowee
According to the Chilhowee family income data, there are 19 families falling into the $50,000 to $74,999 income range, which is the most common income bracket and makes up 32.2% of all families.
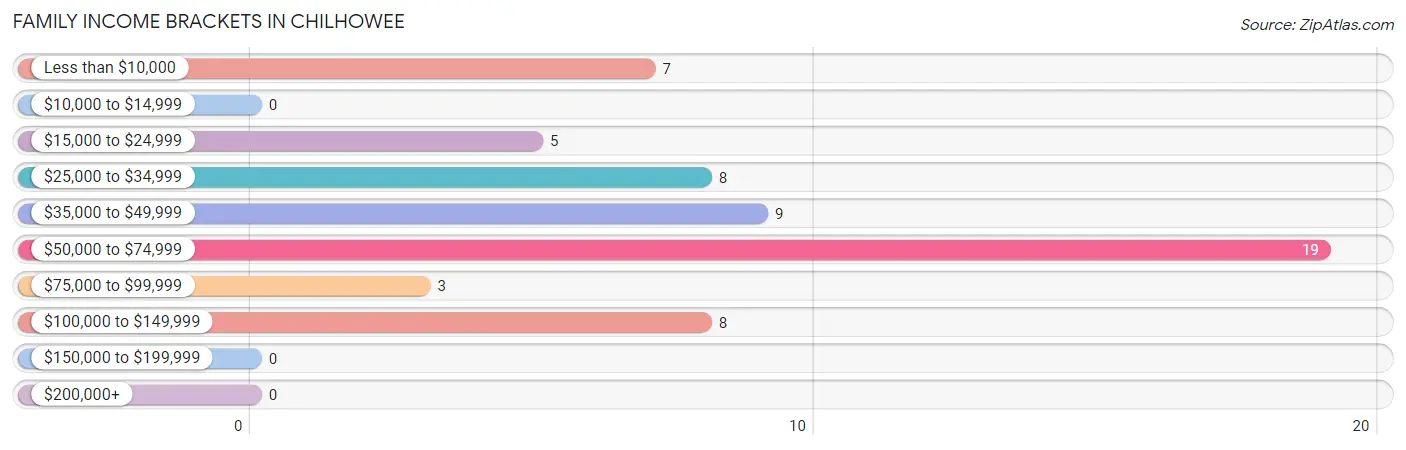
| Income Bracket | # Families | % Families |
| Less than $10,000 | 7 | 11.9% |
| $10,000 to $14,999 | 0 | 0.0% |
| $15,000 to $24,999 | 5 | 8.5% |
| $25,000 to $34,999 | 8 | 13.6% |
| $35,000 to $49,999 | 9 | 15.3% |
| $50,000 to $74,999 | 19 | 32.2% |
| $75,000 to $99,999 | 3 | 5.1% |
| $100,000 to $149,999 | 8 | 13.6% |
| $150,000 to $199,999 | 0 | 0.0% |
| $200,000+ | 0 | 0.0% |
Family Income by Famaliy Size in Chilhowee
4-person families (10 | 17.0%) account for the highest median family income in Chilhowee with $68,125 per family, while 2-person families (29 | 49.1%) have the highest median income of $21,042 per family member.
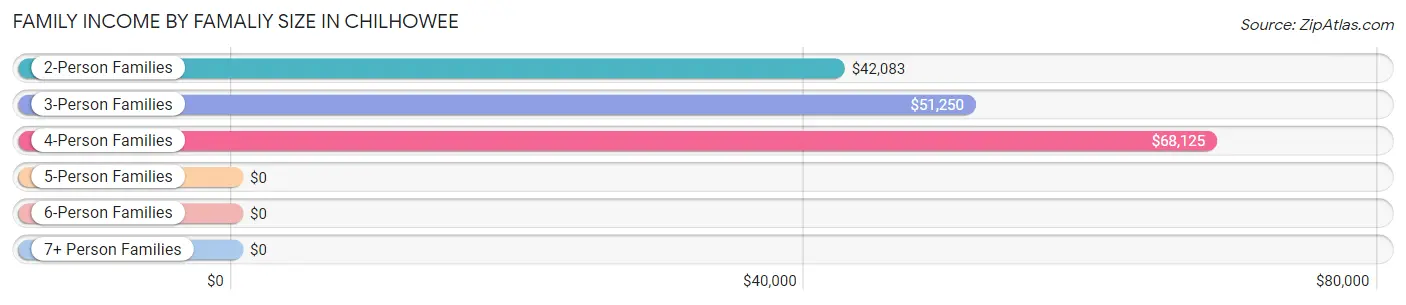
| Income Bracket | # Families | Median Income |
| 2-Person Families | 29 (49.1%) | $42,083 |
| 3-Person Families | 6 (10.2%) | $51,250 |
| 4-Person Families | 10 (17.0%) | $68,125 |
| 5-Person Families | 12 (20.3%) | $0 |
| 6-Person Families | 2 (3.4%) | $0 |
| 7+ Person Families | 0 (0.0%) | $0 |
| Total | 59 (100.0%) | $50,208 |
Family Income by Number of Earners in Chilhowee
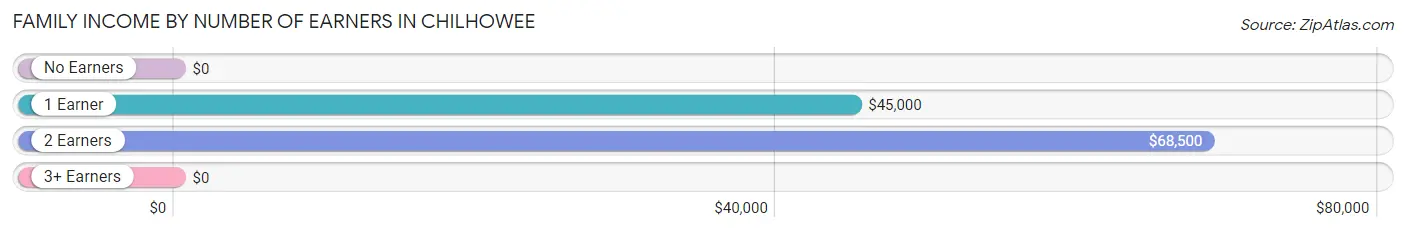
| Number of Earners | # Families | Median Income |
| No Earners | 13 (22.0%) | $0 |
| 1 Earner | 22 (37.3%) | $45,000 |
| 2 Earners | 22 (37.3%) | $68,500 |
| 3+ Earners | 2 (3.4%) | $0 |
| Total | 59 (100.0%) | $50,208 |
Household Income in Chilhowee
Household Income Brackets in Chilhowee
With 23 households falling in the category, the $50,000 to $74,999 income range is the most frequent in Chilhowee, accounting for 22.8% of all households.
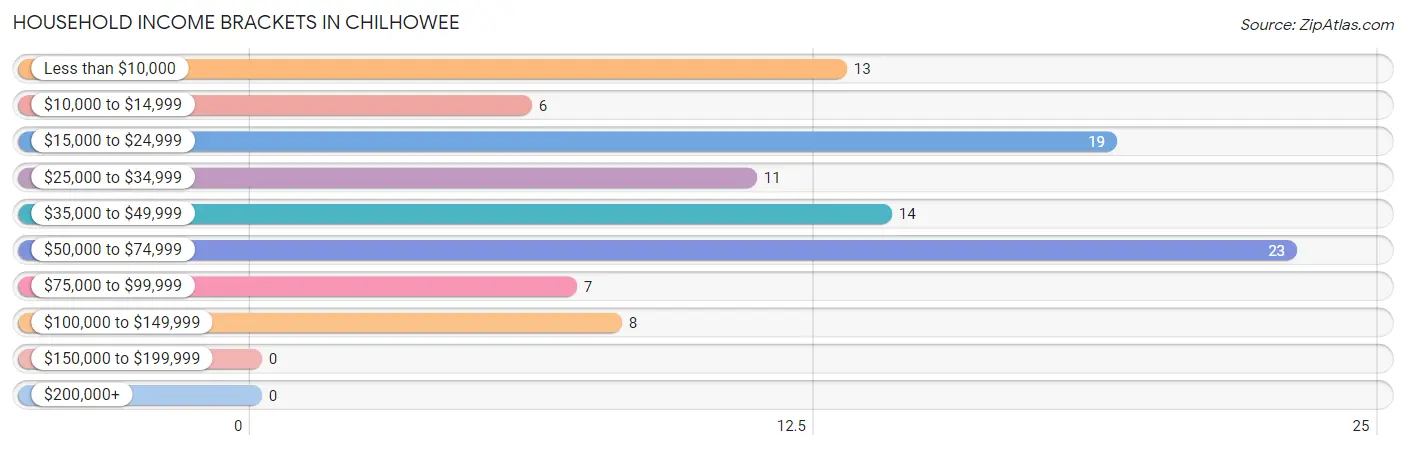
| Income Bracket | # Households | % Households |
| Less than $10,000 | 13 | 12.9% |
| $10,000 to $14,999 | 6 | 5.9% |
| $15,000 to $24,999 | 19 | 18.8% |
| $25,000 to $34,999 | 11 | 10.9% |
| $35,000 to $49,999 | 14 | 13.9% |
| $50,000 to $74,999 | 23 | 22.8% |
| $75,000 to $99,999 | 7 | 6.9% |
| $100,000 to $149,999 | 8 | 7.9% |
| $150,000 to $199,999 | 0 | 0.0% |
| $200,000+ | 0 | 0.0% |
Household Income by Householder Age in Chilhowee
The median household income in Chilhowee is $40,417, with the highest median household income of $51,667 found in the 25 to 44 years age bracket for the primary householder. A total of 42 households (41.6%) fall into this category. Meanwhile, the 15 to 24 years age bracket for the primary householder has the lowest median household income of $0, with 5 households (5.0%) in this group.
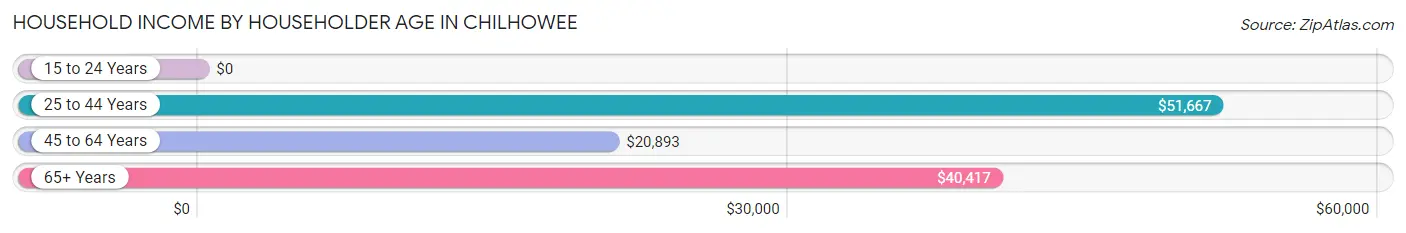
| Income Bracket | # Households | Median Income |
| 15 to 24 Years | 5 (5.0%) | $0 |
| 25 to 44 Years | 42 (41.6%) | $51,667 |
| 45 to 64 Years | 29 (28.7%) | $20,893 |
| 65+ Years | 25 (24.7%) | $40,417 |
| Total | 101 (100.0%) | $40,417 |
Poverty in Chilhowee
Income Below Poverty by Sex and Age in Chilhowee
With 28.1% poverty level for males and 38.4% for females among the residents of Chilhowee, 45 to 54 year old males and under 5 year old females are the most vulnerable to poverty, with 11 males (68.8%) and 16 females (94.1%) in their respective age groups living below the poverty level.
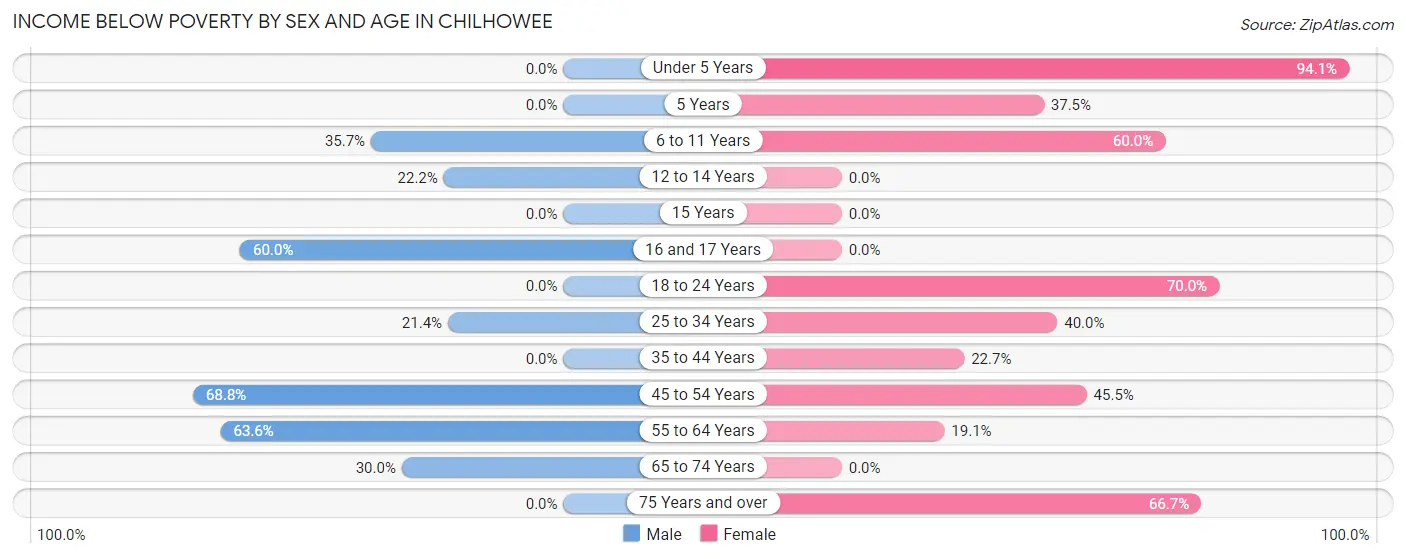
| Age Bracket | Male | Female |
| Under 5 Years | 0 (0.0%) | 16 (94.1%) |
| 5 Years | 0 (0.0%) | 3 (37.5%) |
| 6 to 11 Years | 5 (35.7%) | 6 (60.0%) |
| 12 to 14 Years | 2 (22.2%) | 0 (0.0%) |
| 15 Years | 0 (0.0%) | 0 (0.0%) |
| 16 and 17 Years | 3 (60.0%) | 0 (0.0%) |
| 18 to 24 Years | 0 (0.0%) | 7 (70.0%) |
| 25 to 34 Years | 3 (21.4%) | 8 (40.0%) |
| 35 to 44 Years | 0 (0.0%) | 5 (22.7%) |
| 45 to 54 Years | 11 (68.8%) | 5 (45.5%) |
| 55 to 64 Years | 7 (63.6%) | 4 (19.1%) |
| 65 to 74 Years | 3 (30.0%) | 0 (0.0%) |
| 75 Years and over | 0 (0.0%) | 2 (66.7%) |
| Total | 34 (28.1%) | 56 (38.4%) |
Income Above Poverty by Sex and Age in Chilhowee
According to the poverty statistics in Chilhowee, males aged under 5 years and females aged 12 to 14 years are the age groups that are most secure financially, with 100.0% of males and 100.0% of females in these age groups living above the poverty line.
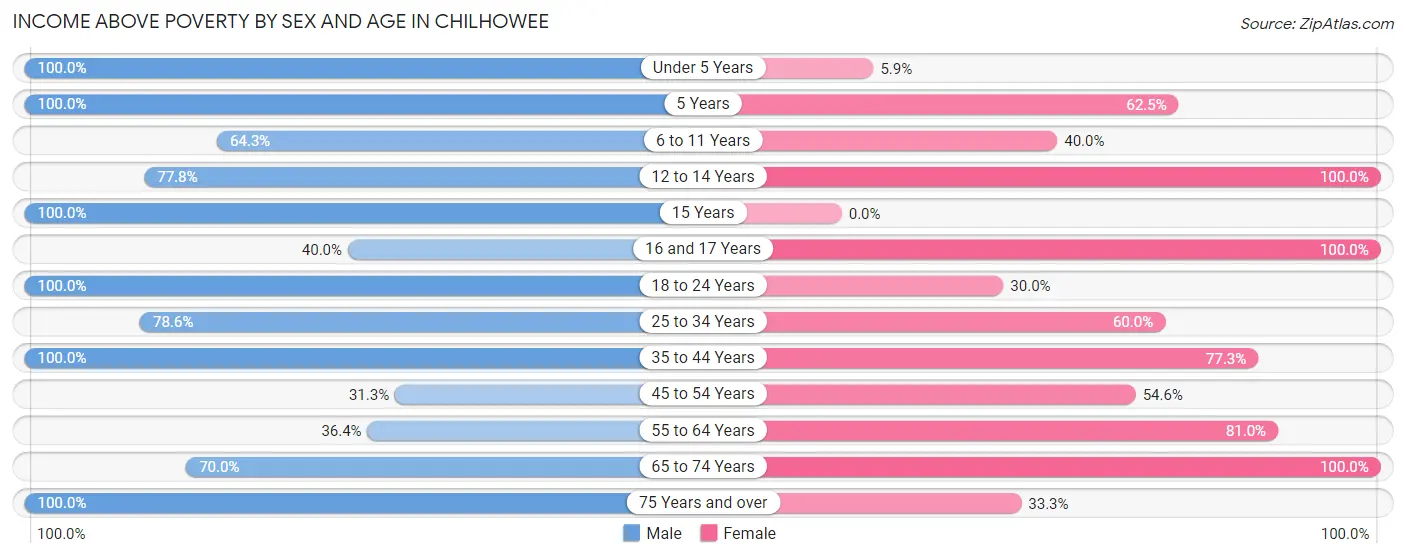
| Age Bracket | Male | Female |
| Under 5 Years | 4 (100.0%) | 1 (5.9%) |
| 5 Years | 1 (100.0%) | 5 (62.5%) |
| 6 to 11 Years | 9 (64.3%) | 4 (40.0%) |
| 12 to 14 Years | 7 (77.8%) | 10 (100.0%) |
| 15 Years | 5 (100.0%) | 0 (0.0%) |
| 16 and 17 Years | 2 (40.0%) | 3 (100.0%) |
| 18 to 24 Years | 8 (100.0%) | 3 (30.0%) |
| 25 to 34 Years | 11 (78.6%) | 12 (60.0%) |
| 35 to 44 Years | 19 (100.0%) | 17 (77.3%) |
| 45 to 54 Years | 5 (31.2%) | 6 (54.5%) |
| 55 to 64 Years | 4 (36.4%) | 17 (80.9%) |
| 65 to 74 Years | 7 (70.0%) | 11 (100.0%) |
| 75 Years and over | 5 (100.0%) | 1 (33.3%) |
| Total | 87 (71.9%) | 90 (61.6%) |
Income Below Poverty Among Married-Couple Families in Chilhowee
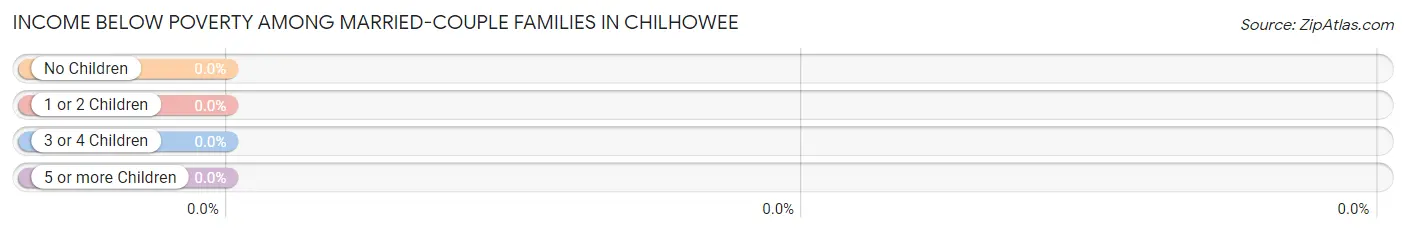
| Children | Above Poverty | Below Poverty |
| No Children | 18 (100.0%) | 0 (0.0%) |
| 1 or 2 Children | 4 (100.0%) | 0 (0.0%) |
| 3 or 4 Children | 9 (100.0%) | 0 (0.0%) |
| 5 or more Children | 0 (0.0%) | 0 (0.0%) |
| Total | 31 (100.0%) | 0 (0.0%) |
Income Below Poverty Among Single-Parent Households in Chilhowee
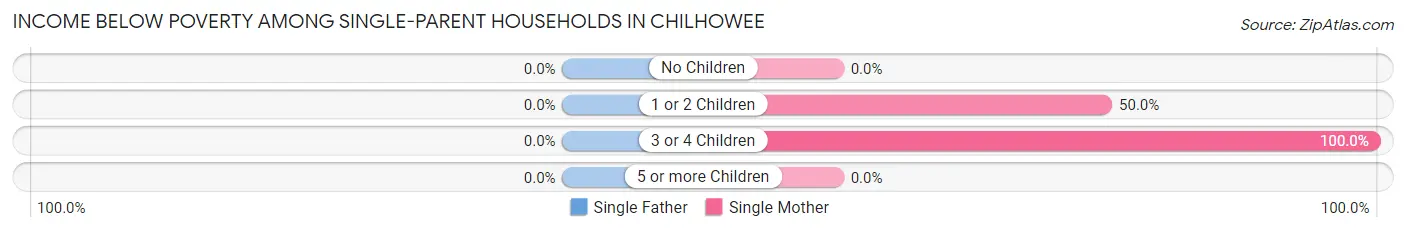
| Children | Single Father | Single Mother |
| No Children | 0 (0.0%) | 0 (0.0%) |
| 1 or 2 Children | 0 (0.0%) | 6 (50.0%) |
| 3 or 4 Children | 0 (0.0%) | 4 (100.0%) |
| 5 or more Children | 0 (0.0%) | 0 (0.0%) |
| Total | 0 (0.0%) | 10 (52.6%) |
Income Below Poverty Among Married-Couple vs Single-Parent Households in Chilhowee
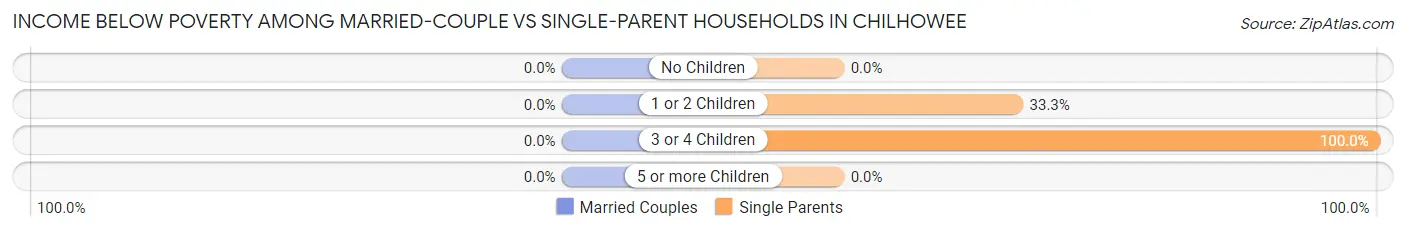
| Children | Married-Couple Families | Single-Parent Households |
| No Children | 0 (0.0%) | 0 (0.0%) |
| 1 or 2 Children | 0 (0.0%) | 6 (33.3%) |
| 3 or 4 Children | 0 (0.0%) | 4 (100.0%) |
| 5 or more Children | 0 (0.0%) | 0 (0.0%) |
| Total | 0 (0.0%) | 10 (35.7%) |
Race in Chilhowee
The most populous races in Chilhowee are White / Caucasian (234 | 87.6%), Two or more Races (32 | 12.0%), and Hispanic or Latino (10 | 3.7%).
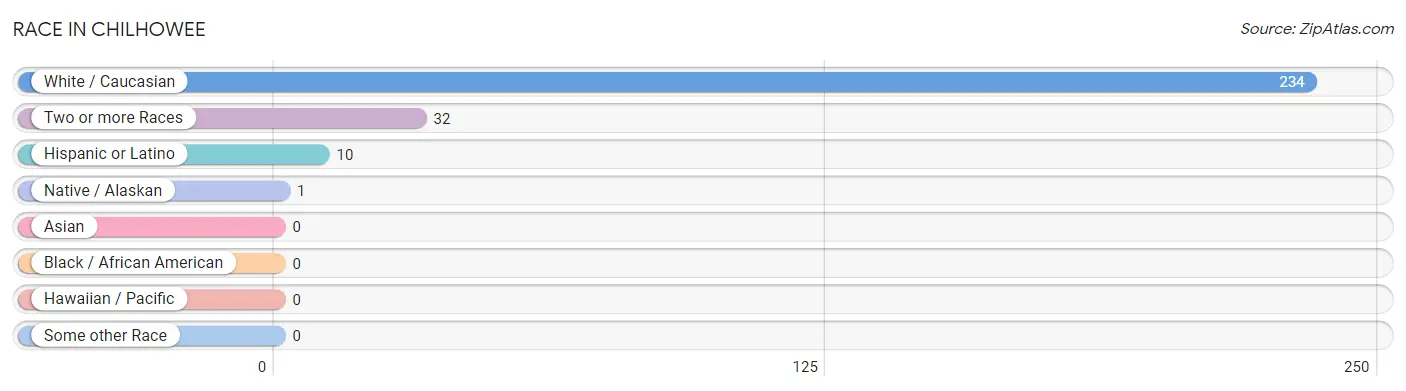
| Race | # Population | % Population |
| Asian | 0 | 0.0% |
| Black / African American | 0 | 0.0% |
| Hawaiian / Pacific | 0 | 0.0% |
| Hispanic or Latino | 10 | 3.7% |
| Native / Alaskan | 1 | 0.4% |
| White / Caucasian | 234 | 87.6% |
| Two or more Races | 32 | 12.0% |
| Some other Race | 0 | 0.0% |
| Total | 267 | 100.0% |
Ancestry in Chilhowee
The most populous ancestries reported in Chilhowee are American (42 | 15.7%), German (34 | 12.7%), English (24 | 9.0%), Irish (20 | 7.5%), and Italian (18 | 6.7%), together accounting for 51.7% of all Chilhowee residents.
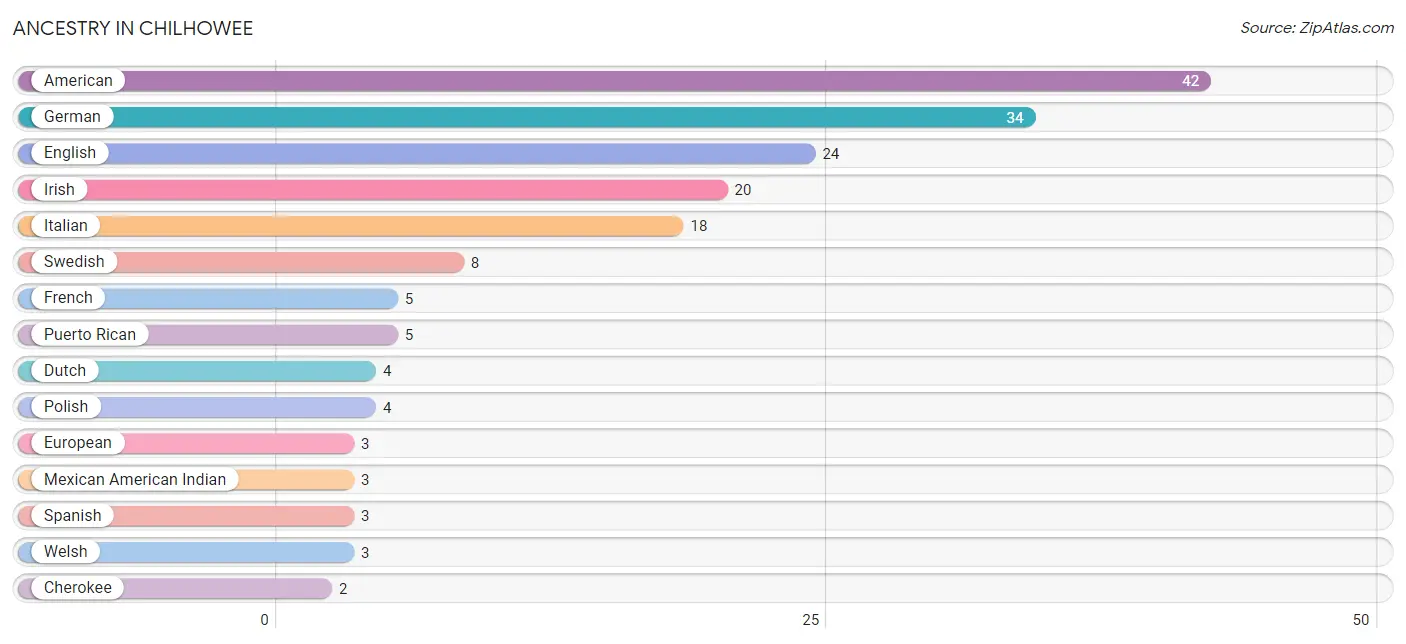
| Ancestry | # Population | % Population |
| American | 42 | 15.7% |
| Cherokee | 2 | 0.7% |
| Colombian | 2 | 0.7% |
| Czech | 1 | 0.4% |
| Dutch | 4 | 1.5% |
| English | 24 | 9.0% |
| European | 3 | 1.1% |
| French | 5 | 1.9% |
| German | 34 | 12.7% |
| Irish | 20 | 7.5% |
| Italian | 18 | 6.7% |
| Mexican American Indian | 3 | 1.1% |
| Polish | 4 | 1.5% |
| Puerto Rican | 5 | 1.9% |
| Scottish | 2 | 0.7% |
| South American | 2 | 0.7% |
| Spanish | 3 | 1.1% |
| Swedish | 8 | 3.0% |
| Welsh | 3 | 1.1% | View All 19 Rows |
Immigrants in Chilhowee

| Immigration Origin | # Population | % Population | View All 0 Rows |
Sex and Age in Chilhowee
Sex and Age in Chilhowee
The most populous age groups in Chilhowee are 5 to 9 Years (15 | 12.4%) for men and Under 5 Years (17 | 11.6%) for women.
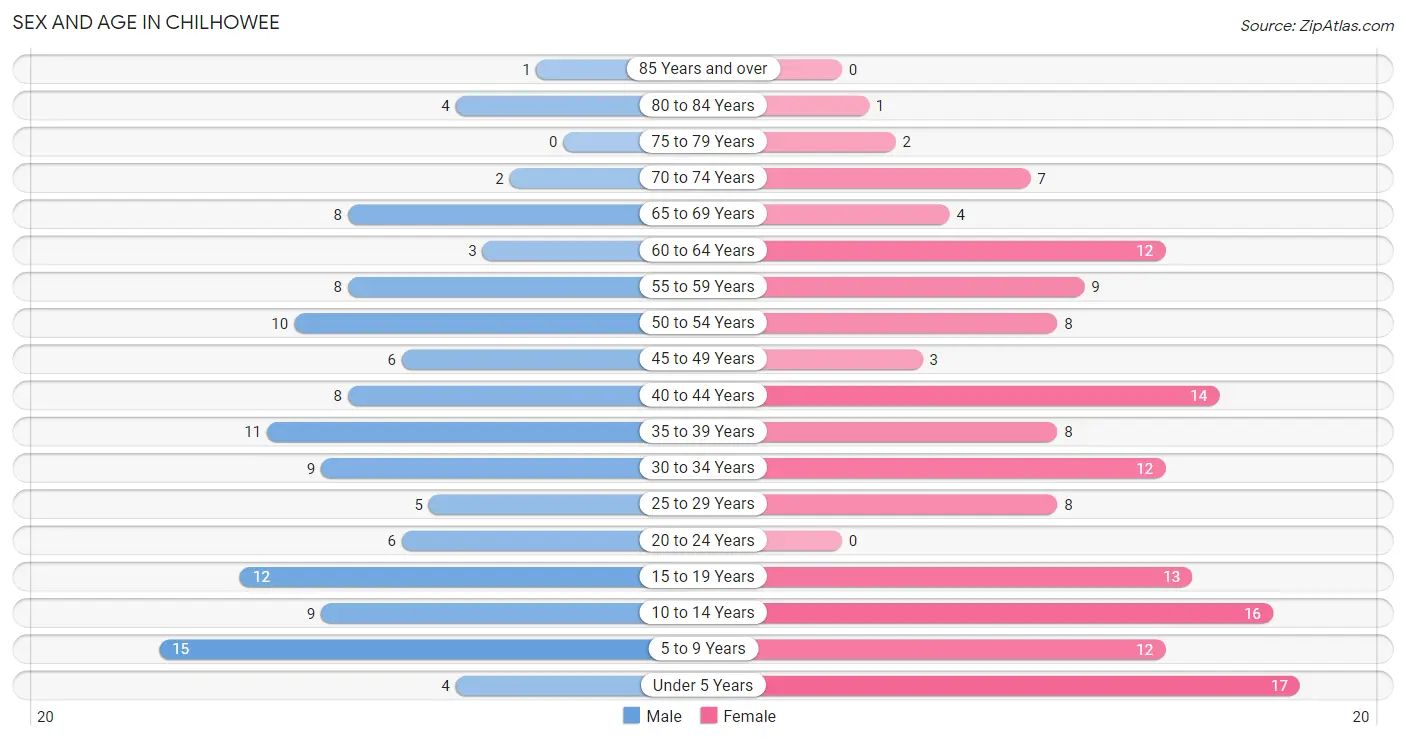
| Age Bracket | Male | Female |
| Under 5 Years | 4 (3.3%) | 17 (11.6%) |
| 5 to 9 Years | 15 (12.4%) | 12 (8.2%) |
| 10 to 14 Years | 9 (7.4%) | 16 (11.0%) |
| 15 to 19 Years | 12 (9.9%) | 13 (8.9%) |
| 20 to 24 Years | 6 (5.0%) | 0 (0.0%) |
| 25 to 29 Years | 5 (4.1%) | 8 (5.5%) |
| 30 to 34 Years | 9 (7.4%) | 12 (8.2%) |
| 35 to 39 Years | 11 (9.1%) | 8 (5.5%) |
| 40 to 44 Years | 8 (6.6%) | 14 (9.6%) |
| 45 to 49 Years | 6 (5.0%) | 3 (2.1%) |
| 50 to 54 Years | 10 (8.3%) | 8 (5.5%) |
| 55 to 59 Years | 8 (6.6%) | 9 (6.2%) |
| 60 to 64 Years | 3 (2.5%) | 12 (8.2%) |
| 65 to 69 Years | 8 (6.6%) | 4 (2.7%) |
| 70 to 74 Years | 2 (1.7%) | 7 (4.8%) |
| 75 to 79 Years | 0 (0.0%) | 2 (1.4%) |
| 80 to 84 Years | 4 (3.3%) | 1 (0.7%) |
| 85 Years and over | 1 (0.8%) | 0 (0.0%) |
| Total | 121 (100.0%) | 146 (100.0%) |
Families and Households in Chilhowee
Median Family Size in Chilhowee
The median family size in Chilhowee is 3.25 persons per family, with single female/mother families (19 | 32.2%) accounting for the largest median family size of 3.89 persons per family. On the other hand, single male/father families (9 | 15.2%) represent the smallest median family size with 2.44 persons per family.
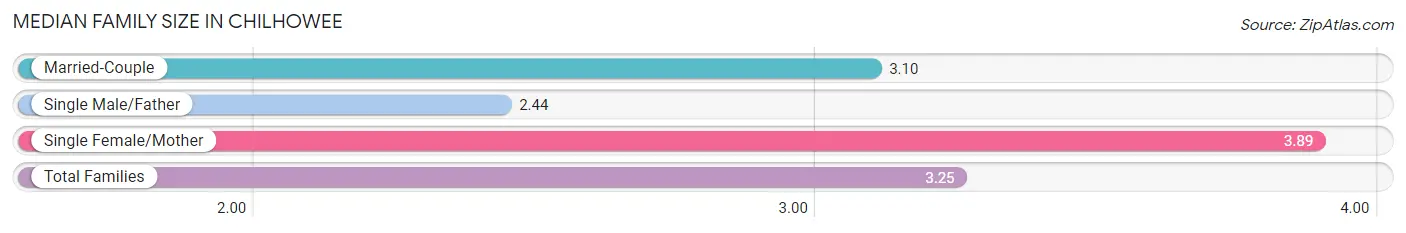
| Family Type | # Families | Family Size |
| Married-Couple | 31 (52.5%) | 3.10 |
| Single Male/Father | 9 (15.2%) | 2.44 |
| Single Female/Mother | 19 (32.2%) | 3.89 |
| Total Families | 59 (100.0%) | 3.25 |
Median Household Size in Chilhowee
The median household size in Chilhowee is 2.64 persons per household, with single female/mother households (19 | 18.8%) accounting for the largest median household size of 4.53 persons per household. non-family households (42 | 41.6%) represent the smallest median household size with 1.33 persons per household.
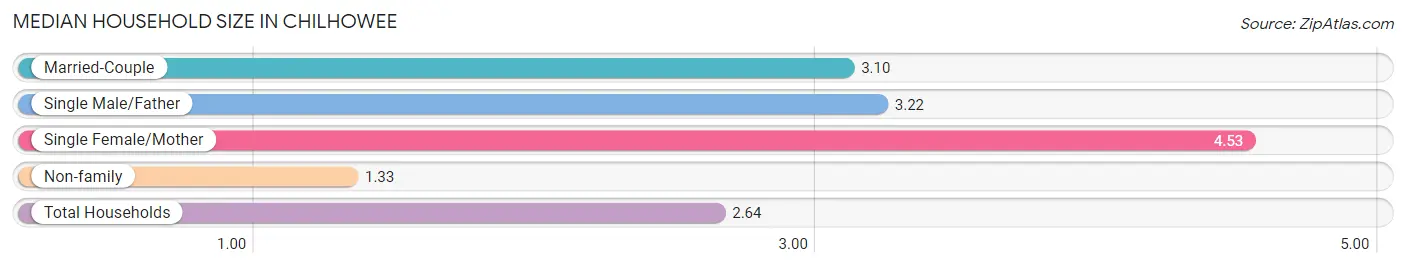
| Household Type | # Households | Household Size |
| Married-Couple | 31 (30.7%) | 3.10 |
| Single Male/Father | 9 (8.9%) | 3.22 |
| Single Female/Mother | 19 (18.8%) | 4.53 |
| Non-family | 42 (41.6%) | 1.33 |
| Total Households | 101 (100.0%) | 2.64 |
Household Size by Marriage Status in Chilhowee
Out of a total of 101 households in Chilhowee, 59 (58.4%) are family households, while 42 (41.6%) are nonfamily households. The most numerous type of family households are 2-person households, comprising 22, and the most common type of nonfamily households are 1-person households, comprising 28.
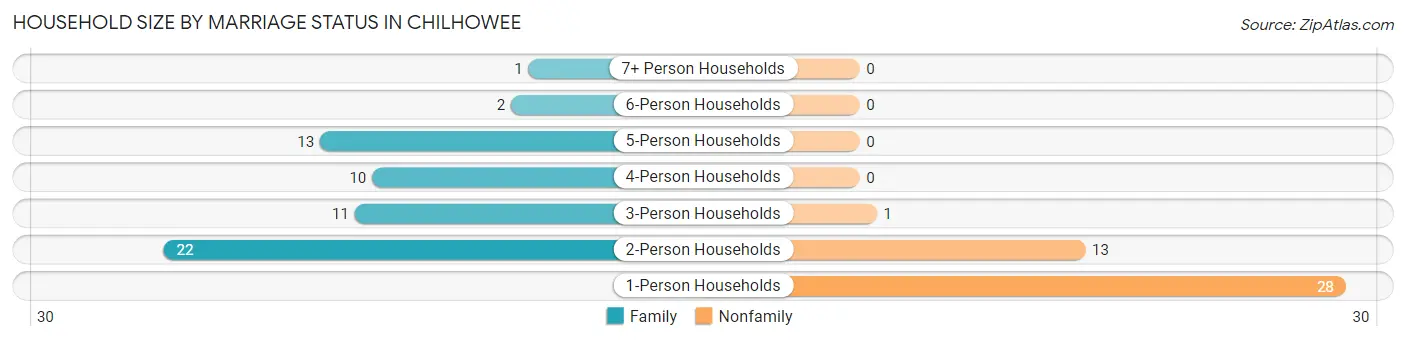
| Household Size | Family Households | Nonfamily Households |
| 1-Person Households | - | 28 (27.7%) |
| 2-Person Households | 22 (21.8%) | 13 (12.9%) |
| 3-Person Households | 11 (10.9%) | 1 (1.0%) |
| 4-Person Households | 10 (9.9%) | 0 (0.0%) |
| 5-Person Households | 13 (12.9%) | 0 (0.0%) |
| 6-Person Households | 2 (2.0%) | 0 (0.0%) |
| 7+ Person Households | 1 (1.0%) | 0 (0.0%) |
| Total | 59 (58.4%) | 42 (41.6%) |
Female Fertility in Chilhowee
Fertility by Age in Chilhowee
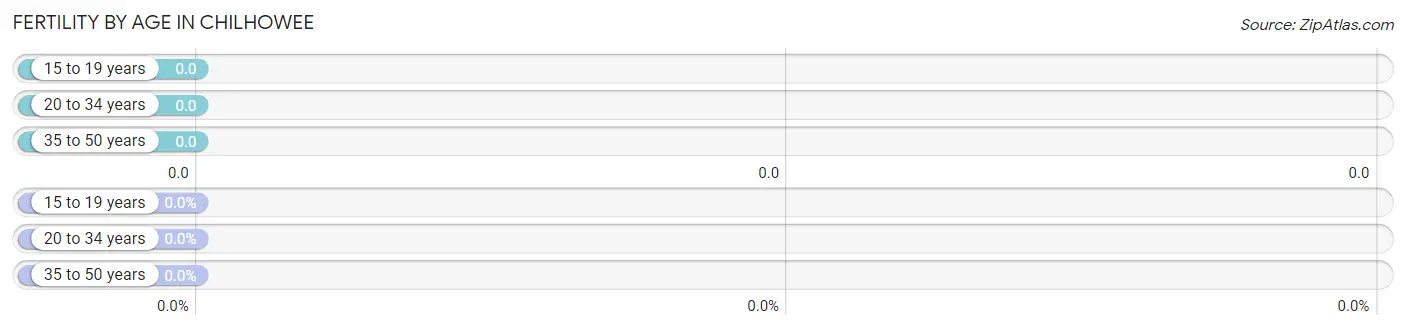
| Age Bracket | Women with Births | Births / 1,000 Women |
| 15 to 19 years | 0 (0.0%) | 0.0 |
| 20 to 34 years | 0 (0.0%) | 0.0 |
| 35 to 50 years | 0 (0.0%) | 0.0 |
| Total | 0 (0.0%) | 0.0 |
Fertility by Age by Marriage Status in Chilhowee
| Age Bracket | Married | Unmarried |
| 15 to 19 years | 0 (0.0%) | 0 (0.0%) |
| 20 to 34 years | 0 (0.0%) | 0 (0.0%) |
| 35 to 50 years | 0 (0.0%) | 0 (0.0%) |
| Total | 0 (0.0%) | 0 (0.0%) |
Fertility by Education in Chilhowee
| Educational Attainment | Women with Births | Births / 1,000 Women |
| Less than High School | 0 (0.0%) | 0.0 |
| High School Diploma | 0 (0.0%) | 0.0 |
| College or Associate's Degree | 0 (0.0%) | 0.0 |
| Bachelor's Degree | 0 (0.0%) | 0.0 |
| Graduate Degree | 0 (0.0%) | 0.0 |
| Total | 0 (0.0%) | 0.0 |
Fertility by Education by Marriage Status in Chilhowee
| Educational Attainment | Married | Unmarried |
| Less than High School | 0 (0.0%) | 0 (0.0%) |
| High School Diploma | 0 (0.0%) | 0 (0.0%) |
| College or Associate's Degree | 0 (0.0%) | 0 (0.0%) |
| Bachelor's Degree | 0 (0.0%) | 0 (0.0%) |
| Graduate Degree | 0 (0.0%) | 0 (0.0%) |
| Total | 0 (0.0%) | 0 (0.0%) |
Employment Characteristics in Chilhowee
Employment by Class of Employer in Chilhowee
Among the 88 employed individuals in Chilhowee, private company employees (59 | 67.0%), not-for-profit organizations (8 | 9.1%), and local government employees (7 | 8.0%) make up the most common classes of employment.
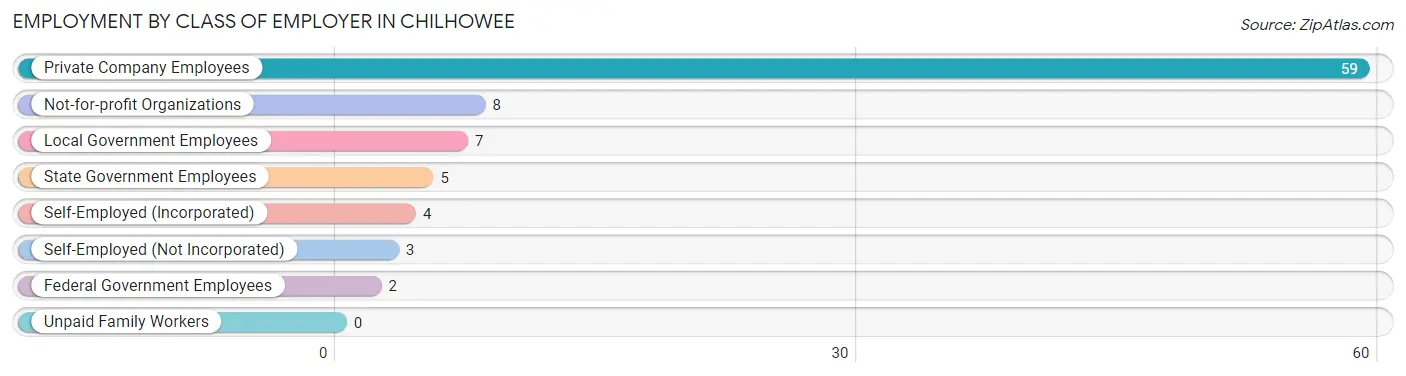
| Employer Class | # Employees | % Employees |
| Private Company Employees | 59 | 67.0% |
| Self-Employed (Incorporated) | 4 | 4.5% |
| Self-Employed (Not Incorporated) | 3 | 3.4% |
| Not-for-profit Organizations | 8 | 9.1% |
| Local Government Employees | 7 | 8.0% |
| State Government Employees | 5 | 5.7% |
| Federal Government Employees | 2 | 2.3% |
| Unpaid Family Workers | 0 | 0.0% |
| Total | 88 | 100.0% |
Employment Status by Age in Chilhowee
According to the labor force statistics for Chilhowee, out of the total population over 16 years of age (189), 50.8% or 96 individuals are in the labor force, with 8.3% or 8 of them unemployed. The age group with the highest labor force participation rate is 20 to 24 years, with 100.0% or 6 individuals in the labor force. Within the labor force, the 16 to 19 years age range has the highest percentage of unemployed individuals, with 42.9% or 3 of them being unemployed.
| Age Bracket | In Labor Force | Unemployed |
| 16 to 19 Years | 7 (35.0%) | 3 (42.9%) |
| 20 to 24 Years | 6 (100.0%) | 0 (0.0%) |
| 25 to 29 Years | 9 (69.2%) | 0 (0.0%) |
| 30 to 34 Years | 11 (52.4%) | 0 (0.0%) |
| 35 to 44 Years | 34 (82.9%) | 3 (8.8%) |
| 45 to 54 Years | 11 (40.7%) | 2 (18.2%) |
| 55 to 59 Years | 9 (52.9%) | 0 (0.0%) |
| 60 to 64 Years | 3 (20.0%) | 0 (0.0%) |
| 65 to 74 Years | 6 (28.6%) | 0 (0.0%) |
| 75 Years and over | 0 (0.0%) | 0 (0.0%) |
| Total | 96 (50.8%) | 8 (8.3%) |
Employment Status by Educational Attainment in Chilhowee
According to labor force statistics for Chilhowee, 57.5% of individuals (77) out of the total population between 25 and 64 years of age (134) are in the labor force, with 6.5% or 5 of them being unemployed. The group with the highest labor force participation rate are those with the educational attainment of bachelor's degree or higher, with 100.0% or 10 individuals in the labor force. Within the labor force, individuals with less than high school education have the highest percentage of unemployment, with 12.5% or 1 of them being unemployed.
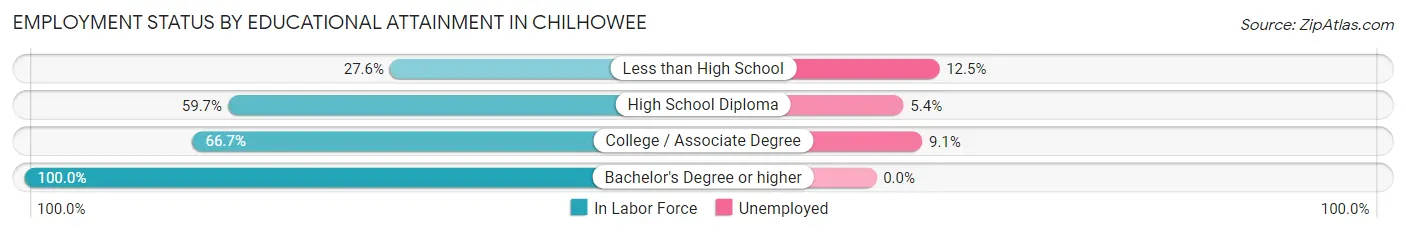
| Educational Attainment | In Labor Force | Unemployed |
| Less than High School | 8 (27.6%) | 4 (12.5%) |
| High School Diploma | 37 (59.7%) | 3 (5.4%) |
| College / Associate Degree | 22 (66.7%) | 3 (9.1%) |
| Bachelor's Degree or higher | 10 (100.0%) | 0 (0.0%) |
| Total | 77 (57.5%) | 9 (6.5%) |
Employment Occupations by Sex in Chilhowee
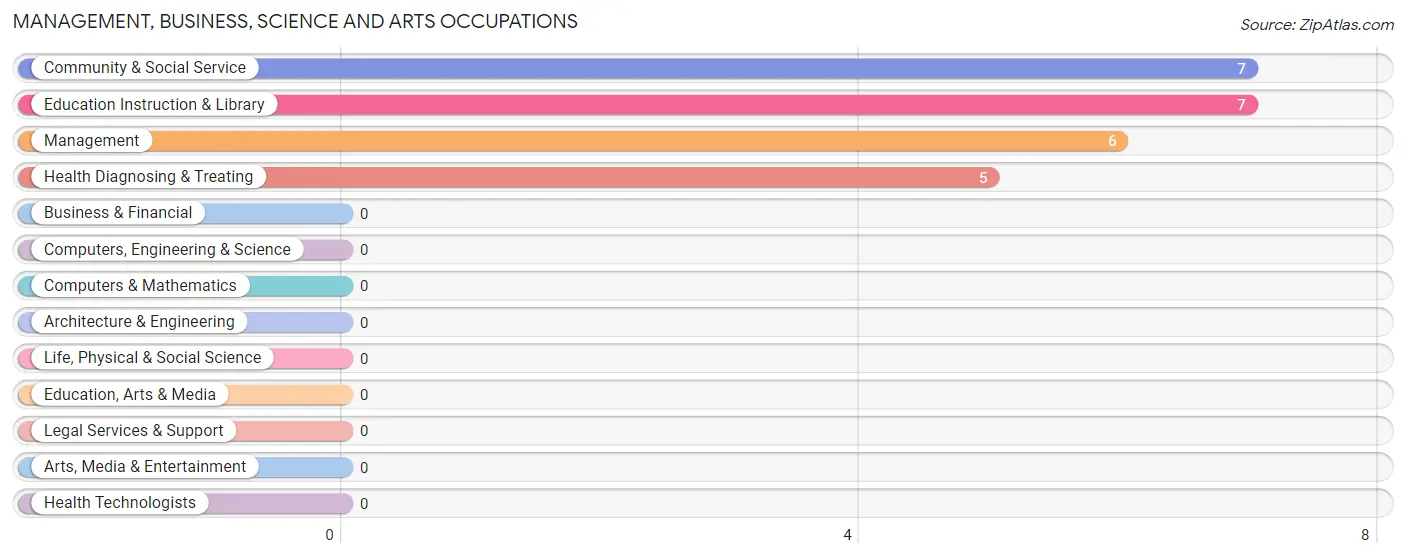
Management, Business, Science and Arts Occupations
The most common Management, Business, Science and Arts occupations in Chilhowee are Community & Social Service (7 | 8.0%), Education Instruction & Library (7 | 8.0%), Management (6 | 6.8%), and Health Diagnosing & Treating (5 | 5.7%).
Management, Business, Science and Arts Occupations by Sex
Within the Management, Business, Science and Arts occupations in Chilhowee, the most male-oriented occupations are Community & Social Service (85.7%), Education Instruction & Library (85.7%), and Management (83.3%), while the most female-oriented occupations are Health Diagnosing & Treating (100.0%), Management (16.7%), and Community & Social Service (14.3%).
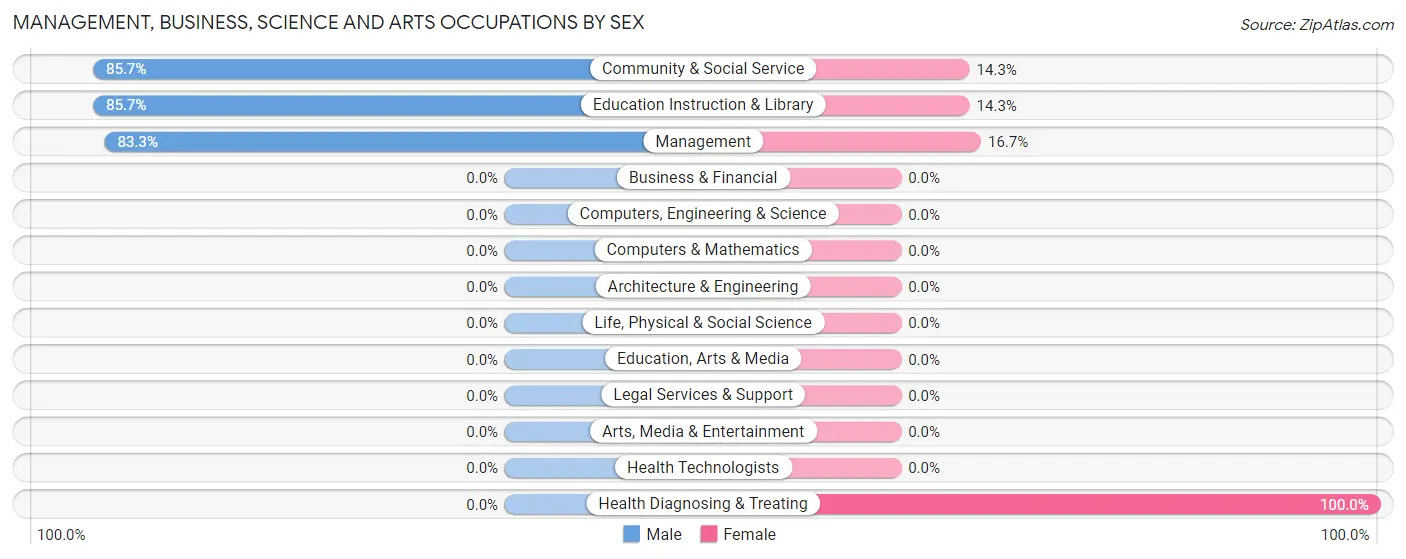
| Occupation | Male | Female |
| Management | 5 (83.3%) | 1 (16.7%) |
| Business & Financial | 0 (0.0%) | 0 (0.0%) |
| Computers, Engineering & Science | 0 (0.0%) | 0 (0.0%) |
| Computers & Mathematics | 0 (0.0%) | 0 (0.0%) |
| Architecture & Engineering | 0 (0.0%) | 0 (0.0%) |
| Life, Physical & Social Science | 0 (0.0%) | 0 (0.0%) |
| Community & Social Service | 6 (85.7%) | 1 (14.3%) |
| Education, Arts & Media | 0 (0.0%) | 0 (0.0%) |
| Legal Services & Support | 0 (0.0%) | 0 (0.0%) |
| Education Instruction & Library | 6 (85.7%) | 1 (14.3%) |
| Arts, Media & Entertainment | 0 (0.0%) | 0 (0.0%) |
| Health Diagnosing & Treating | 0 (0.0%) | 5 (100.0%) |
| Health Technologists | 0 (0.0%) | 0 (0.0%) |
| Total (Category) | 11 (61.1%) | 7 (38.9%) |
| Total (Overall) | 49 (55.7%) | 39 (44.3%) |
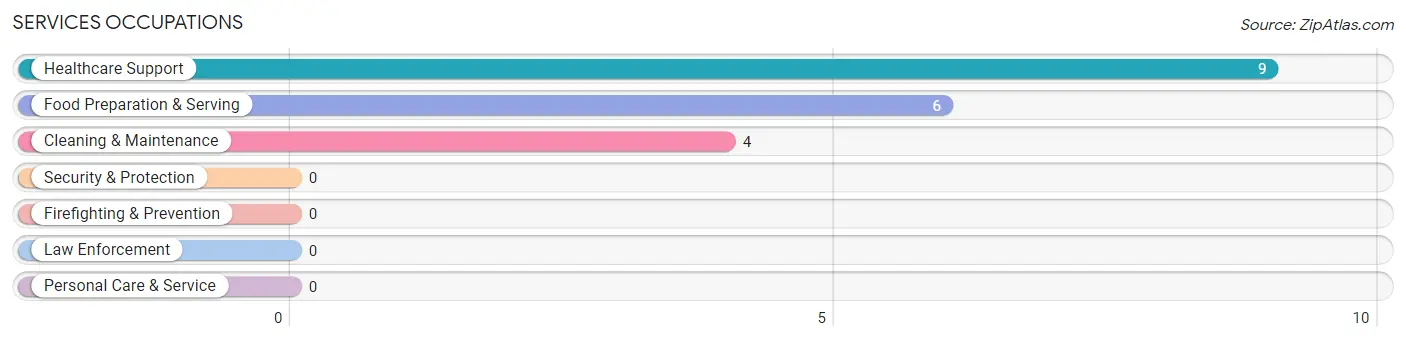
Services Occupations
The most common Services occupations in Chilhowee are Healthcare Support (9 | 10.2%), Food Preparation & Serving (6 | 6.8%), and Cleaning & Maintenance (4 | 4.5%).
Services Occupations by Sex
Within the Services occupations in Chilhowee, the most male-oriented occupations are Cleaning & Maintenance (75.0%), and Healthcare Support (44.4%), while the most female-oriented occupations are Food Preparation & Serving (100.0%), Healthcare Support (55.6%), and Cleaning & Maintenance (25.0%).
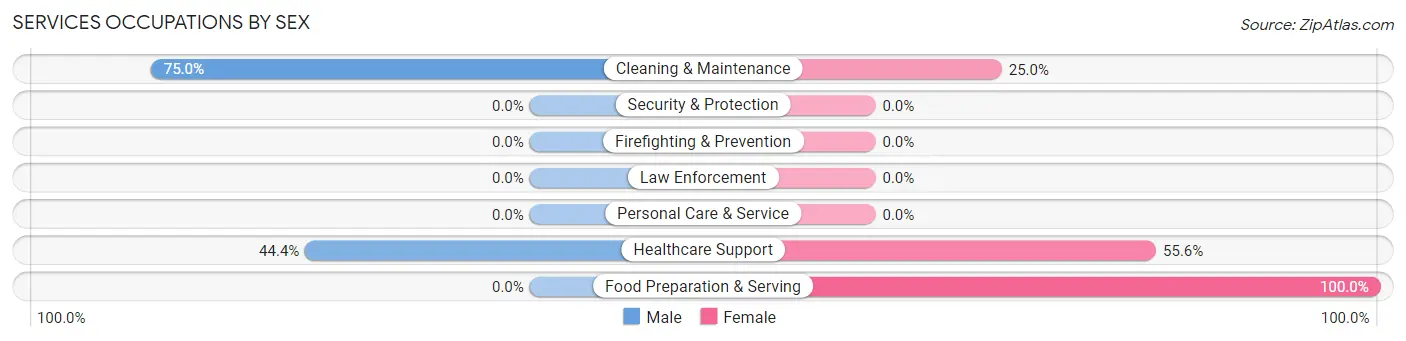
| Occupation | Male | Female |
| Healthcare Support | 4 (44.4%) | 5 (55.6%) |
| Security & Protection | 0 (0.0%) | 0 (0.0%) |
| Firefighting & Prevention | 0 (0.0%) | 0 (0.0%) |
| Law Enforcement | 0 (0.0%) | 0 (0.0%) |
| Food Preparation & Serving | 0 (0.0%) | 6 (100.0%) |
| Cleaning & Maintenance | 3 (75.0%) | 1 (25.0%) |
| Personal Care & Service | 0 (0.0%) | 0 (0.0%) |
| Total (Category) | 7 (36.8%) | 12 (63.2%) |
| Total (Overall) | 49 (55.7%) | 39 (44.3%) |
Sales and Office Occupations
The most common Sales and Office occupations in Chilhowee are Office & Administration (12 | 13.6%), and Sales & Related (4 | 4.5%).

Sales and Office Occupations by Sex
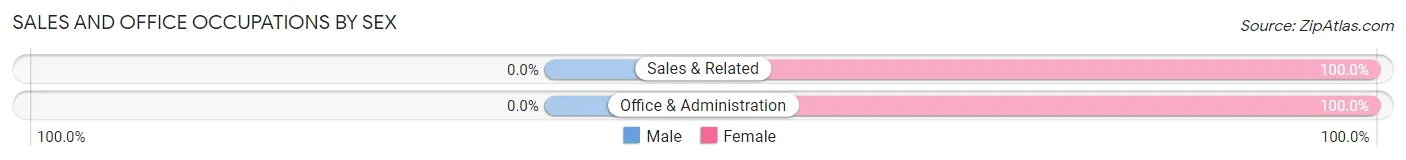
| Occupation | Male | Female |
| Sales & Related | 0 (0.0%) | 4 (100.0%) |
| Office & Administration | 0 (0.0%) | 12 (100.0%) |
| Total (Category) | 0 (0.0%) | 16 (100.0%) |
| Total (Overall) | 49 (55.7%) | 39 (44.3%) |
Natural Resources, Construction and Maintenance Occupations
The most common Natural Resources, Construction and Maintenance occupations in Chilhowee are Construction & Extraction (14 | 15.9%), Installation, Maintenance & Repair (4 | 4.5%), and Farming, Fishing & Forestry (1 | 1.1%).
Natural Resources, Construction and Maintenance Occupations by Sex
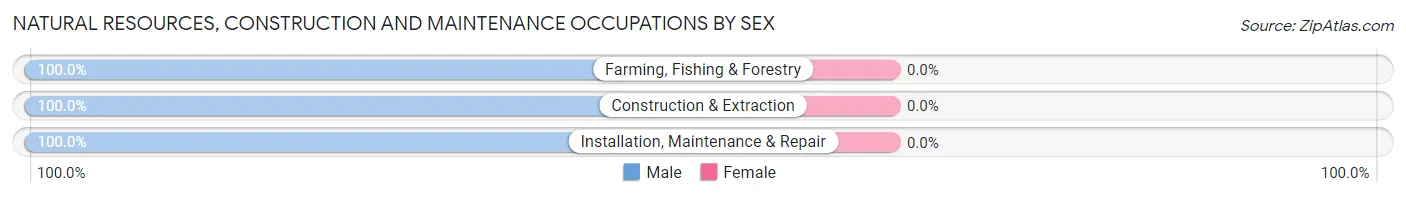
| Occupation | Male | Female |
| Farming, Fishing & Forestry | 1 (100.0%) | 0 (0.0%) |
| Construction & Extraction | 14 (100.0%) | 0 (0.0%) |
| Installation, Maintenance & Repair | 4 (100.0%) | 0 (0.0%) |
| Total (Category) | 19 (100.0%) | 0 (0.0%) |
| Total (Overall) | 49 (55.7%) | 39 (44.3%) |
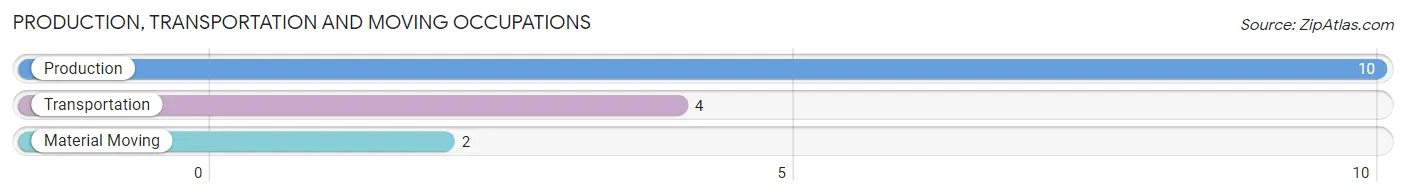
Production, Transportation and Moving Occupations
The most common Production, Transportation and Moving occupations in Chilhowee are Production (10 | 11.4%), Transportation (4 | 4.5%), and Material Moving (2 | 2.3%).
Production, Transportation and Moving Occupations by Sex
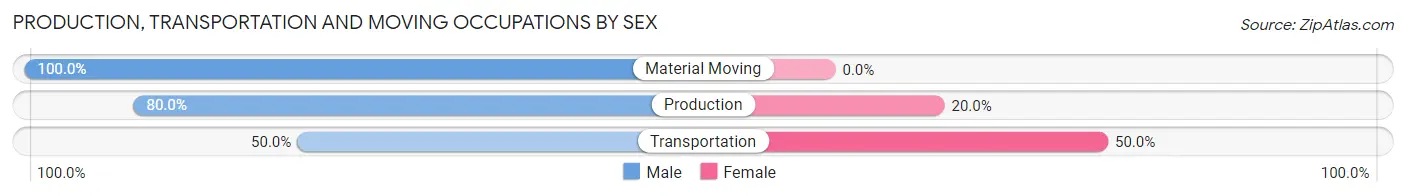
| Occupation | Male | Female |
| Production | 8 (80.0%) | 2 (20.0%) |
| Transportation | 2 (50.0%) | 2 (50.0%) |
| Material Moving | 2 (100.0%) | 0 (0.0%) |
| Total (Category) | 12 (75.0%) | 4 (25.0%) |
| Total (Overall) | 49 (55.7%) | 39 (44.3%) |
Employment Industries by Sex in Chilhowee
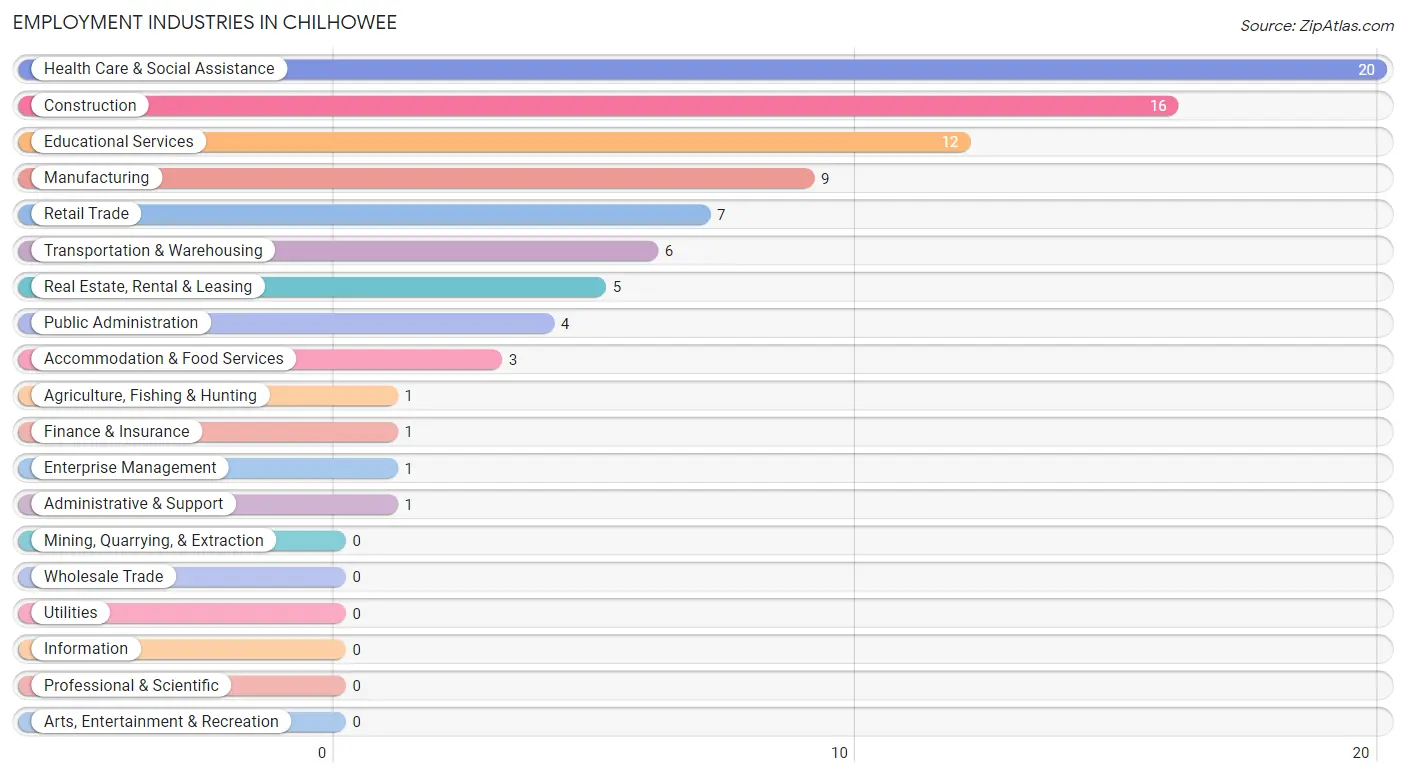
Employment Industries in Chilhowee
The major employment industries in Chilhowee include Health Care & Social Assistance (20 | 22.7%), Construction (16 | 18.2%), Educational Services (12 | 13.6%), Manufacturing (9 | 10.2%), and Retail Trade (7 | 8.0%).
Employment Industries by Sex in Chilhowee
The Chilhowee industries that see more men than women are Agriculture, Fishing & Hunting (100.0%), Construction (100.0%), and Finance & Insurance (100.0%), whereas the industries that tend to have a higher number of women are Real Estate, Rental & Leasing (100.0%), Enterprise Management (100.0%), and Accommodation & Food Services (100.0%).
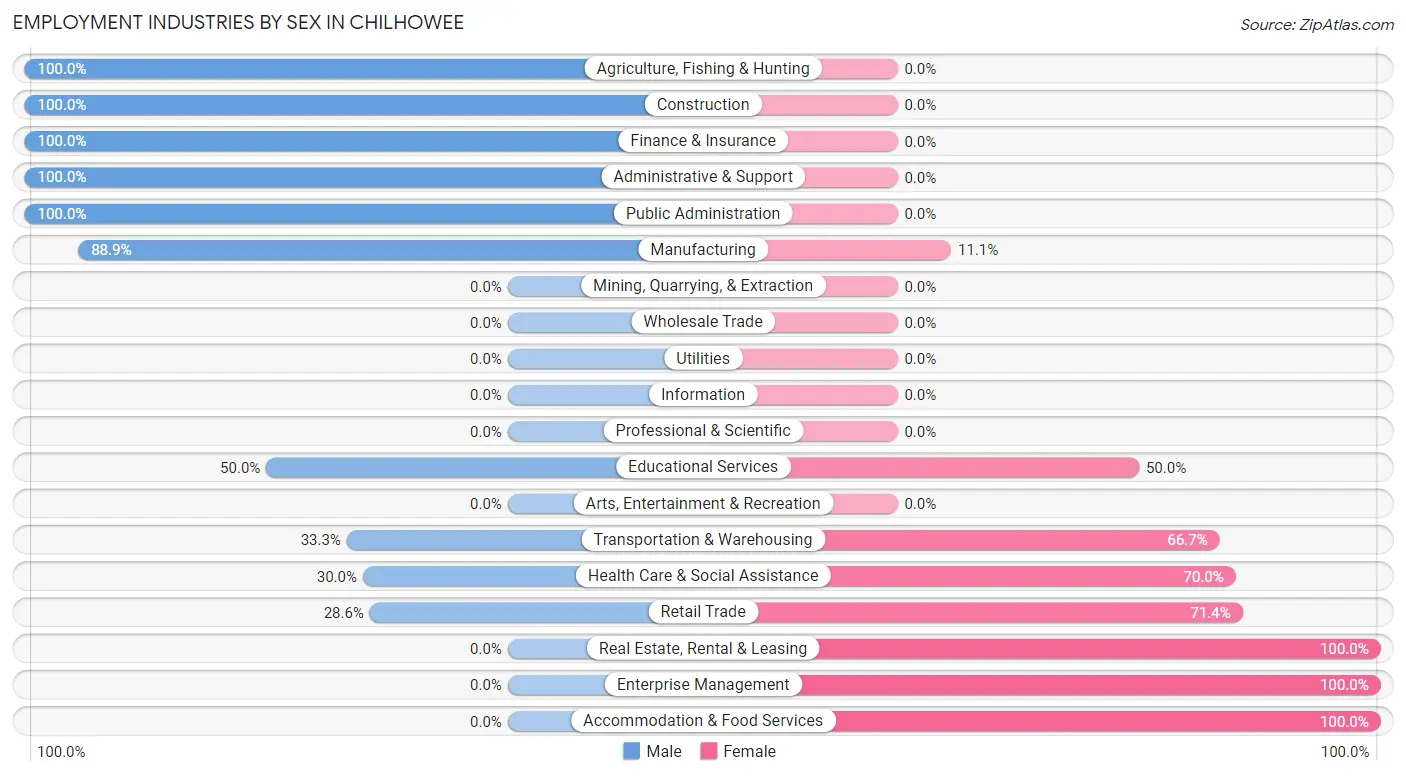
| Industry | Male | Female |
| Agriculture, Fishing & Hunting | 1 (100.0%) | 0 (0.0%) |
| Mining, Quarrying, & Extraction | 0 (0.0%) | 0 (0.0%) |
| Construction | 16 (100.0%) | 0 (0.0%) |
| Manufacturing | 8 (88.9%) | 1 (11.1%) |
| Wholesale Trade | 0 (0.0%) | 0 (0.0%) |
| Retail Trade | 2 (28.6%) | 5 (71.4%) |
| Transportation & Warehousing | 2 (33.3%) | 4 (66.7%) |
| Utilities | 0 (0.0%) | 0 (0.0%) |
| Information | 0 (0.0%) | 0 (0.0%) |
| Finance & Insurance | 1 (100.0%) | 0 (0.0%) |
| Real Estate, Rental & Leasing | 0 (0.0%) | 5 (100.0%) |
| Professional & Scientific | 0 (0.0%) | 0 (0.0%) |
| Enterprise Management | 0 (0.0%) | 1 (100.0%) |
| Administrative & Support | 1 (100.0%) | 0 (0.0%) |
| Educational Services | 6 (50.0%) | 6 (50.0%) |
| Health Care & Social Assistance | 6 (30.0%) | 14 (70.0%) |
| Arts, Entertainment & Recreation | 0 (0.0%) | 0 (0.0%) |
| Accommodation & Food Services | 0 (0.0%) | 3 (100.0%) |
| Public Administration | 4 (100.0%) | 0 (0.0%) |
| Total | 49 (55.7%) | 39 (44.3%) |
Education in Chilhowee
School Enrollment in Chilhowee
The most common levels of schooling among the 66 students in Chilhowee are middle school (23 | 34.8%), high school (19 | 28.8%), and elementary school (16 | 24.2%).
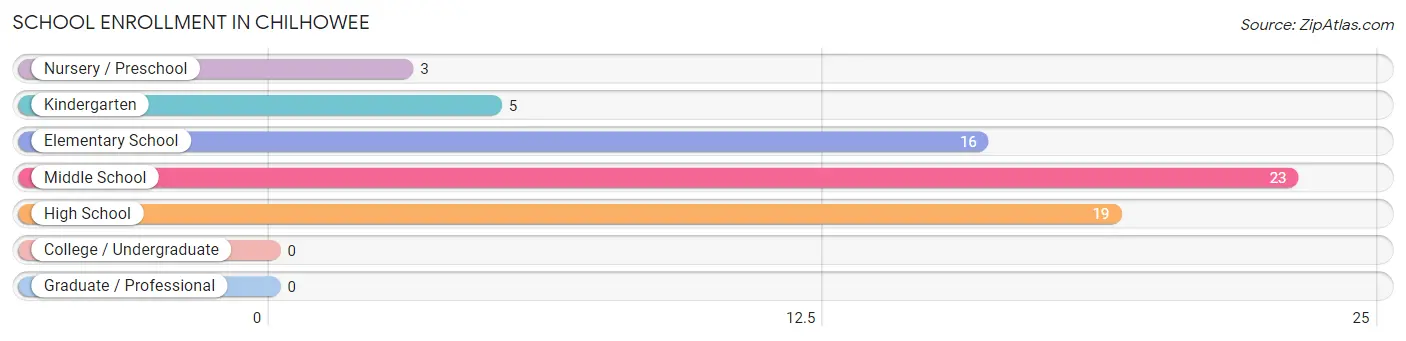
| School Level | # Students | % Students |
| Nursery / Preschool | 3 | 4.5% |
| Kindergarten | 5 | 7.6% |
| Elementary School | 16 | 24.2% |
| Middle School | 23 | 34.8% |
| High School | 19 | 28.8% |
| College / Undergraduate | 0 | 0.0% |
| Graduate / Professional | 0 | 0.0% |
| Total | 66 | 100.0% |
School Enrollment by Age by Funding Source in Chilhowee
Out of a total of 66 students who are enrolled in schools in Chilhowee, 3 (4.5%) attend a private institution, while the remaining 63 (95.5%) are enrolled in public schools. The age group of 5 to 9 year old has the highest likelihood of being enrolled in private schools, with 3 (12.5% in the age bracket) enrolled. Conversely, the age group of 10 to 14 year olds has the lowest likelihood of being enrolled in a private school, with 25 (100.0% in the age bracket) attending a public institution.
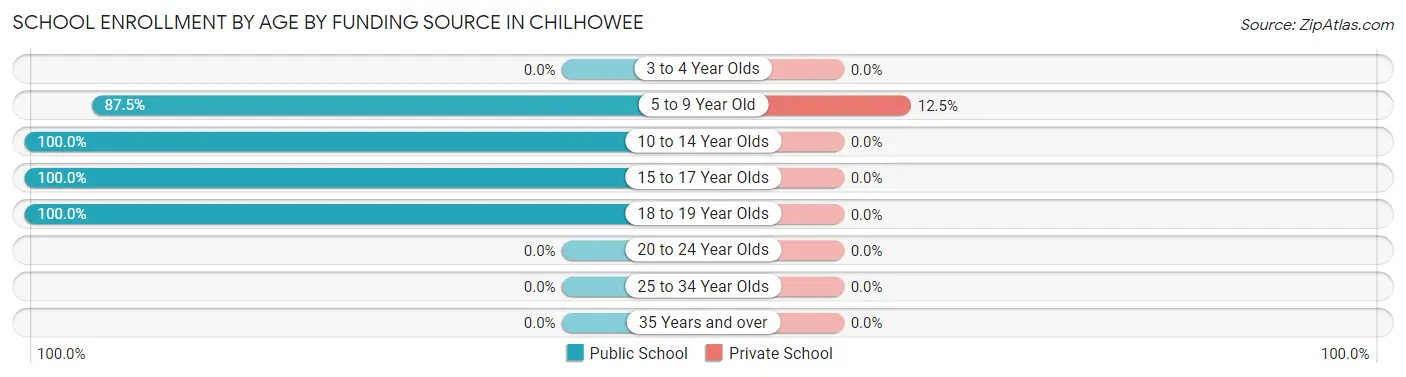
| Age Bracket | Public School | Private School |
| 3 to 4 Year Olds | 0 (0.0%) | 0 (0.0%) |
| 5 to 9 Year Old | 21 (87.5%) | 3 (12.5%) |
| 10 to 14 Year Olds | 25 (100.0%) | 0 (0.0%) |
| 15 to 17 Year Olds | 10 (100.0%) | 0 (0.0%) |
| 18 to 19 Year Olds | 7 (100.0%) | 0 (0.0%) |
| 20 to 24 Year Olds | 0 (0.0%) | 0 (0.0%) |
| 25 to 34 Year Olds | 0 (0.0%) | 0 (0.0%) |
| 35 Years and over | 0 (0.0%) | 0 (0.0%) |
| Total | 63 (95.5%) | 3 (4.5%) |
Educational Attainment by Field of Study in Chilhowee
Psychology (4 | 21.0%), business (4 | 21.0%), liberal arts & history (4 | 21.0%), education (3 | 15.8%), and computers & mathematics (2 | 10.5%) are the most common fields of study among 19 individuals in Chilhowee who have obtained a bachelor's degree or higher.
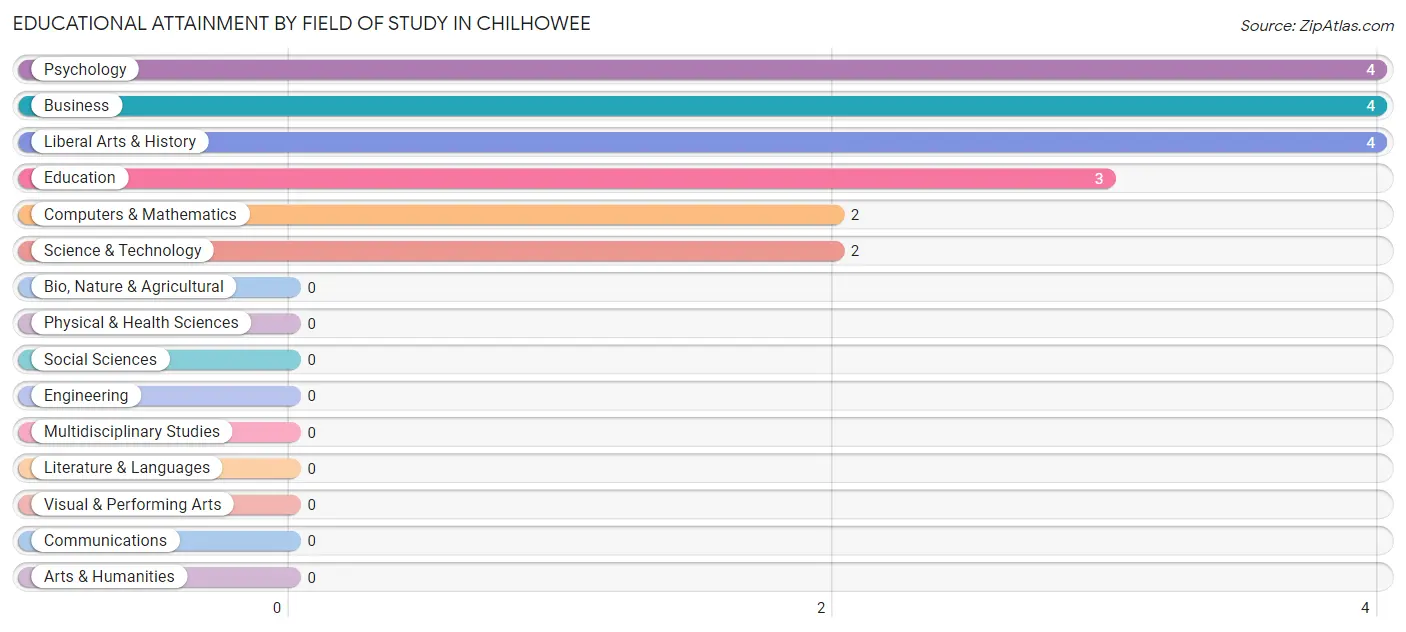
| Field of Study | # Graduates | % Graduates |
| Computers & Mathematics | 2 | 10.5% |
| Bio, Nature & Agricultural | 0 | 0.0% |
| Physical & Health Sciences | 0 | 0.0% |
| Psychology | 4 | 21.0% |
| Social Sciences | 0 | 0.0% |
| Engineering | 0 | 0.0% |
| Multidisciplinary Studies | 0 | 0.0% |
| Science & Technology | 2 | 10.5% |
| Business | 4 | 21.0% |
| Education | 3 | 15.8% |
| Literature & Languages | 0 | 0.0% |
| Liberal Arts & History | 4 | 21.0% |
| Visual & Performing Arts | 0 | 0.0% |
| Communications | 0 | 0.0% |
| Arts & Humanities | 0 | 0.0% |
| Total | 19 | 100.0% |
Transportation & Commute in Chilhowee
Vehicle Availability by Sex in Chilhowee
The most prevalent vehicle ownership categories in Chilhowee are males with 1 vehicle (16, accounting for 32.7%) and females with 1 vehicle (8, making up 41.0%).
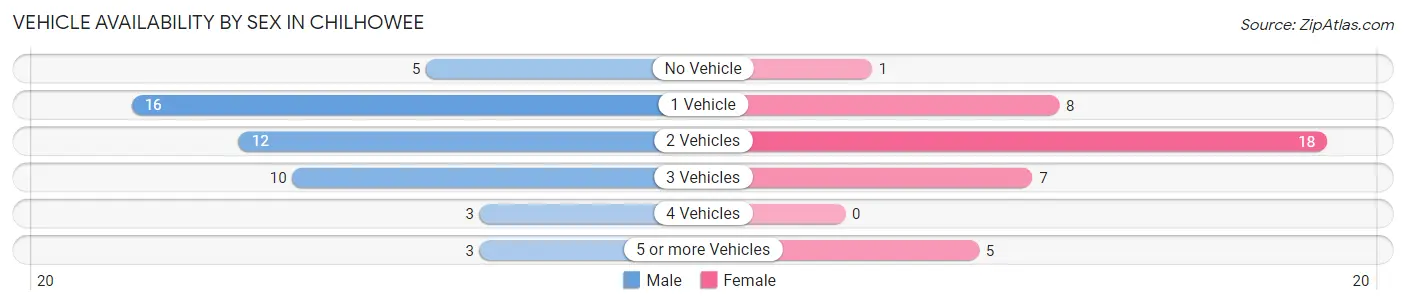
| Vehicles Available | Male | Female |
| No Vehicle | 5 (10.2%) | 1 (2.6%) |
| 1 Vehicle | 16 (32.7%) | 8 (20.5%) |
| 2 Vehicles | 12 (24.5%) | 18 (46.2%) |
| 3 Vehicles | 10 (20.4%) | 7 (17.9%) |
| 4 Vehicles | 3 (6.1%) | 0 (0.0%) |
| 5 or more Vehicles | 3 (6.1%) | 5 (12.8%) |
| Total | 49 (100.0%) | 39 (100.0%) |
Commute Time in Chilhowee
The most frequently occuring commute durations in Chilhowee are 30 to 34 minutes (15 commuters, 18.5%), 15 to 19 minutes (12 commuters, 14.8%), and 25 to 29 minutes (11 commuters, 13.6%).
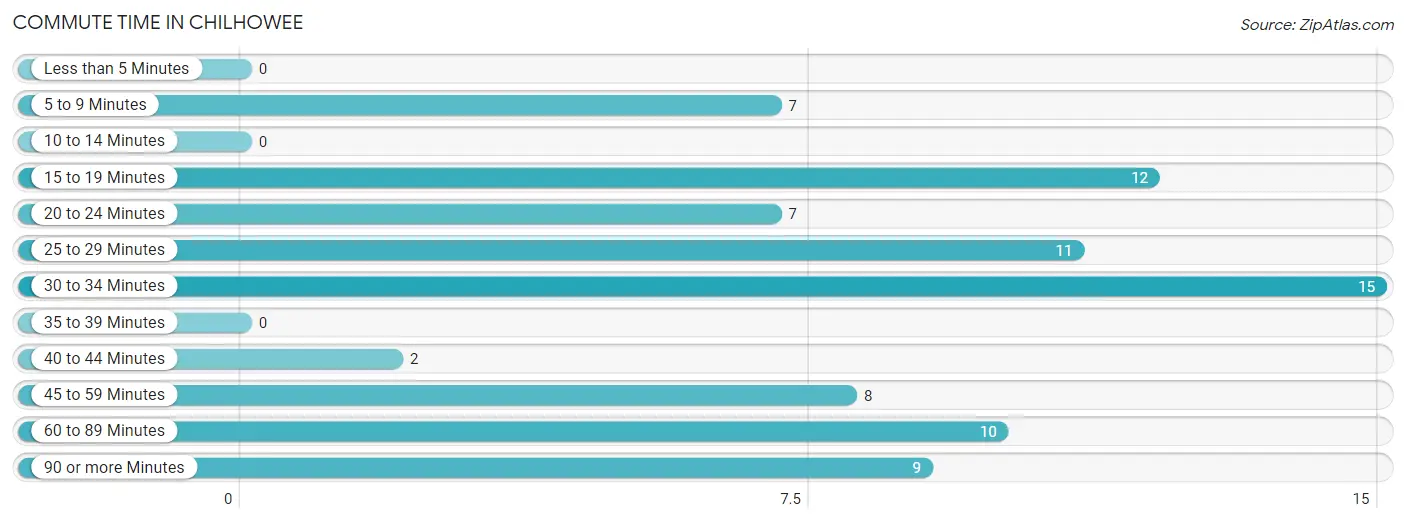
| Commute Time | # Commuters | % Commuters |
| Less than 5 Minutes | 0 | 0.0% |
| 5 to 9 Minutes | 7 | 8.6% |
| 10 to 14 Minutes | 0 | 0.0% |
| 15 to 19 Minutes | 12 | 14.8% |
| 20 to 24 Minutes | 7 | 8.6% |
| 25 to 29 Minutes | 11 | 13.6% |
| 30 to 34 Minutes | 15 | 18.5% |
| 35 to 39 Minutes | 0 | 0.0% |
| 40 to 44 Minutes | 2 | 2.5% |
| 45 to 59 Minutes | 8 | 9.9% |
| 60 to 89 Minutes | 10 | 12.3% |
| 90 or more Minutes | 9 | 11.1% |
Commute Time by Sex in Chilhowee
The most common commute times in Chilhowee are 30 to 34 minutes (12 commuters, 25.5%) for males and 25 to 29 minutes (8 commuters, 23.5%) for females.
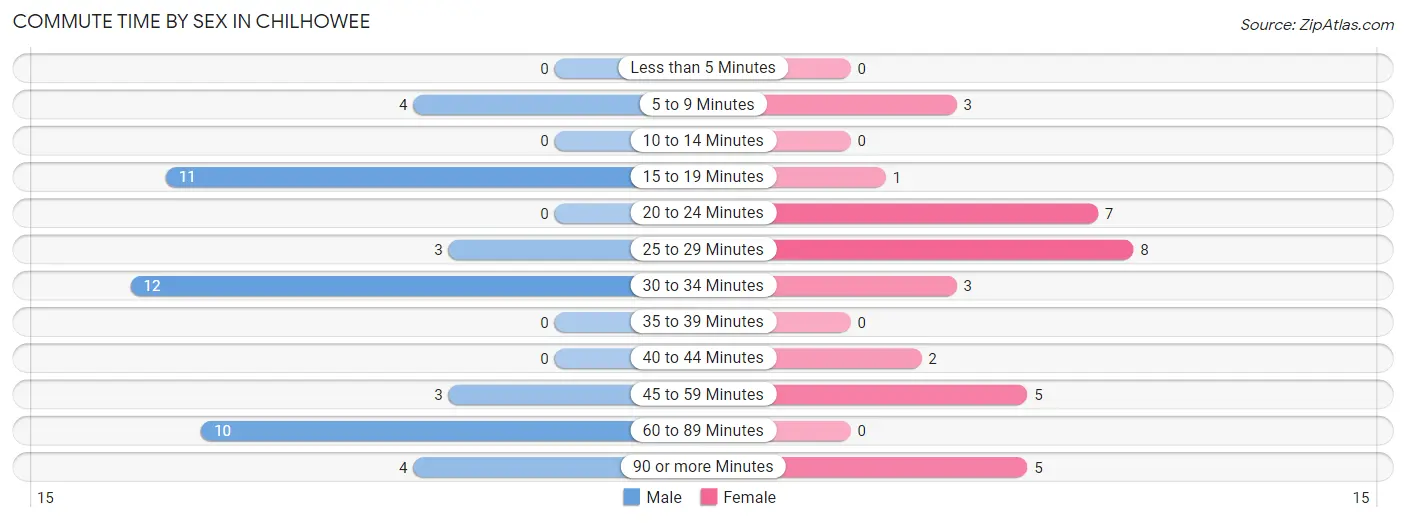
| Commute Time | Male | Female |
| Less than 5 Minutes | 0 (0.0%) | 0 (0.0%) |
| 5 to 9 Minutes | 4 (8.5%) | 3 (8.8%) |
| 10 to 14 Minutes | 0 (0.0%) | 0 (0.0%) |
| 15 to 19 Minutes | 11 (23.4%) | 1 (2.9%) |
| 20 to 24 Minutes | 0 (0.0%) | 7 (20.6%) |
| 25 to 29 Minutes | 3 (6.4%) | 8 (23.5%) |
| 30 to 34 Minutes | 12 (25.5%) | 3 (8.8%) |
| 35 to 39 Minutes | 0 (0.0%) | 0 (0.0%) |
| 40 to 44 Minutes | 0 (0.0%) | 2 (5.9%) |
| 45 to 59 Minutes | 3 (6.4%) | 5 (14.7%) |
| 60 to 89 Minutes | 10 (21.3%) | 0 (0.0%) |
| 90 or more Minutes | 4 (8.5%) | 5 (14.7%) |
Time of Departure to Work by Sex in Chilhowee
The most frequent times of departure to work in Chilhowee are 12:00 PM to 3:59 PM (11, 23.4%) for males and 7:00 AM to 7:29 AM (11, 32.4%) for females.
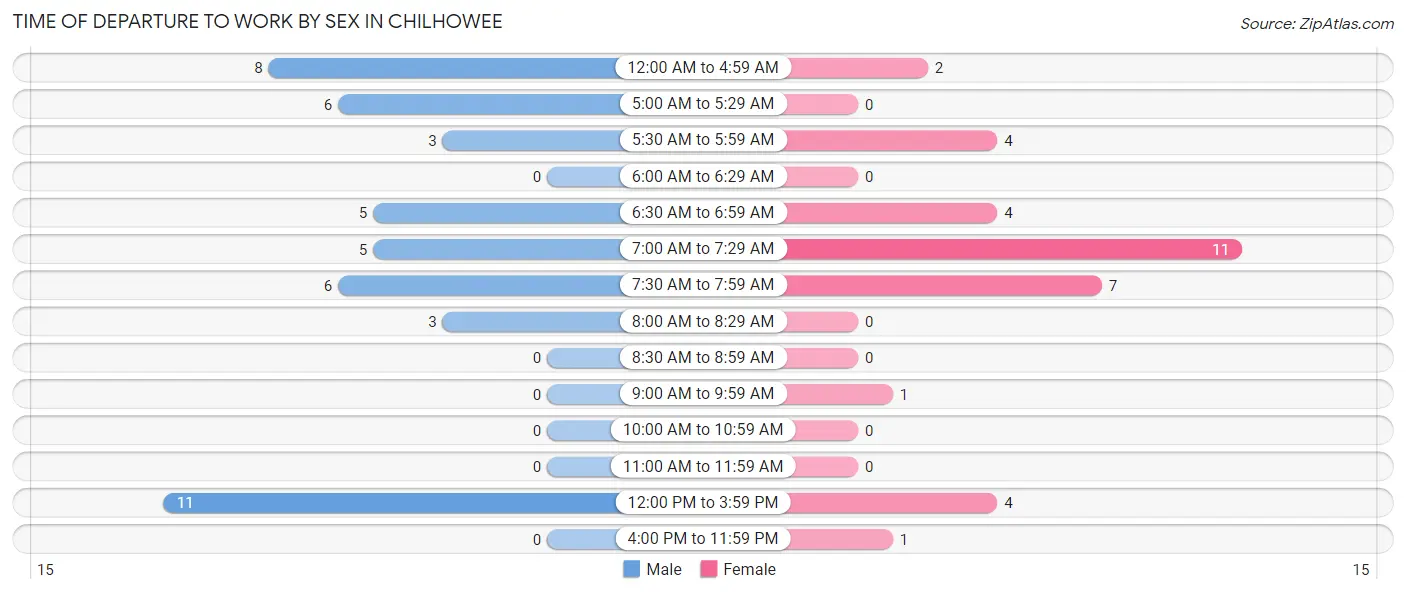
| Time of Departure | Male | Female |
| 12:00 AM to 4:59 AM | 8 (17.0%) | 2 (5.9%) |
| 5:00 AM to 5:29 AM | 6 (12.8%) | 0 (0.0%) |
| 5:30 AM to 5:59 AM | 3 (6.4%) | 4 (11.8%) |
| 6:00 AM to 6:29 AM | 0 (0.0%) | 0 (0.0%) |
| 6:30 AM to 6:59 AM | 5 (10.6%) | 4 (11.8%) |
| 7:00 AM to 7:29 AM | 5 (10.6%) | 11 (32.4%) |
| 7:30 AM to 7:59 AM | 6 (12.8%) | 7 (20.6%) |
| 8:00 AM to 8:29 AM | 3 (6.4%) | 0 (0.0%) |
| 8:30 AM to 8:59 AM | 0 (0.0%) | 0 (0.0%) |
| 9:00 AM to 9:59 AM | 0 (0.0%) | 1 (2.9%) |
| 10:00 AM to 10:59 AM | 0 (0.0%) | 0 (0.0%) |
| 11:00 AM to 11:59 AM | 0 (0.0%) | 0 (0.0%) |
| 12:00 PM to 3:59 PM | 11 (23.4%) | 4 (11.8%) |
| 4:00 PM to 11:59 PM | 0 (0.0%) | 1 (2.9%) |
| Total | 47 (100.0%) | 34 (100.0%) |
Housing Occupancy in Chilhowee
Occupancy by Ownership in Chilhowee
Of the total 101 dwellings in Chilhowee, owner-occupied units account for 53 (52.5%), while renter-occupied units make up 48 (47.5%).
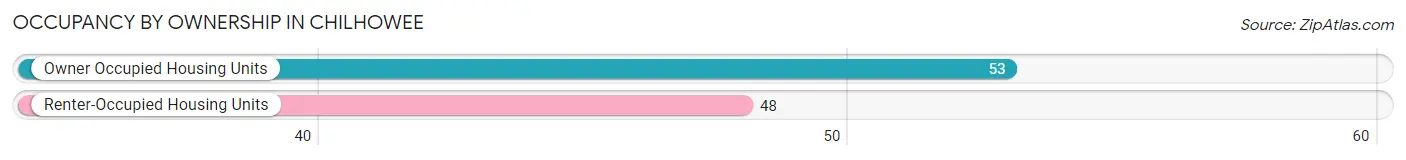
| Occupancy | # Housing Units | % Housing Units |
| Owner Occupied Housing Units | 53 | 52.5% |
| Renter-Occupied Housing Units | 48 | 47.5% |
| Total Occupied Housing Units | 101 | 100.0% |
Occupancy by Household Size in Chilhowee
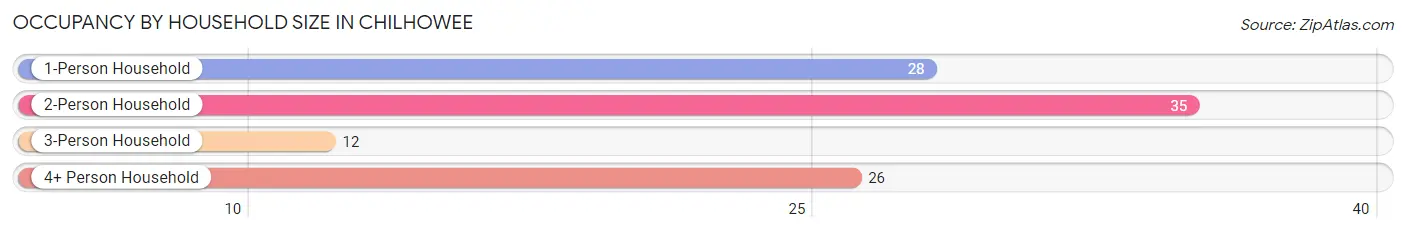
| Household Size | # Housing Units | % Housing Units |
| 1-Person Household | 28 | 27.7% |
| 2-Person Household | 35 | 34.6% |
| 3-Person Household | 12 | 11.9% |
| 4+ Person Household | 26 | 25.7% |
| Total Housing Units | 101 | 100.0% |
Occupancy by Ownership by Household Size in Chilhowee
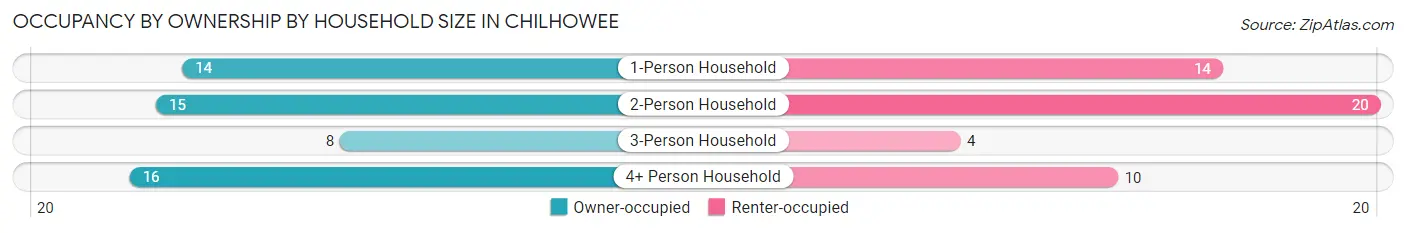
| Household Size | Owner-occupied | Renter-occupied |
| 1-Person Household | 14 (50.0%) | 14 (50.0%) |
| 2-Person Household | 15 (42.9%) | 20 (57.1%) |
| 3-Person Household | 8 (66.7%) | 4 (33.3%) |
| 4+ Person Household | 16 (61.5%) | 10 (38.5%) |
| Total Housing Units | 53 (52.5%) | 48 (47.5%) |
Occupancy by Educational Attainment in Chilhowee
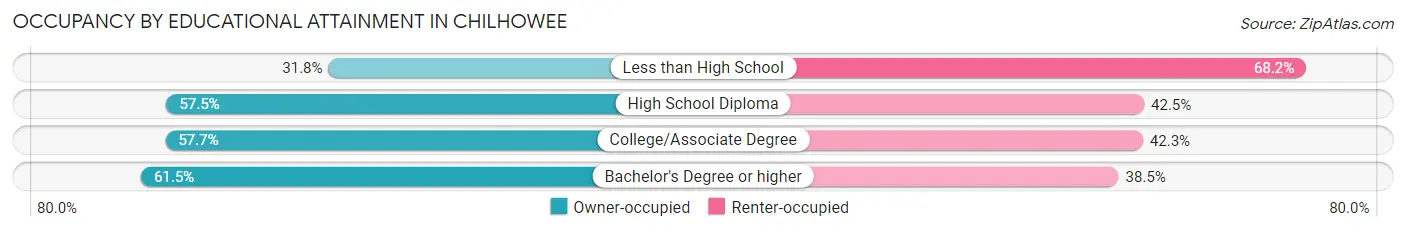
| Household Size | Owner-occupied | Renter-occupied |
| Less than High School | 7 (31.8%) | 15 (68.2%) |
| High School Diploma | 23 (57.5%) | 17 (42.5%) |
| College/Associate Degree | 15 (57.7%) | 11 (42.3%) |
| Bachelor's Degree or higher | 8 (61.5%) | 5 (38.5%) |
Occupancy by Age of Householder in Chilhowee
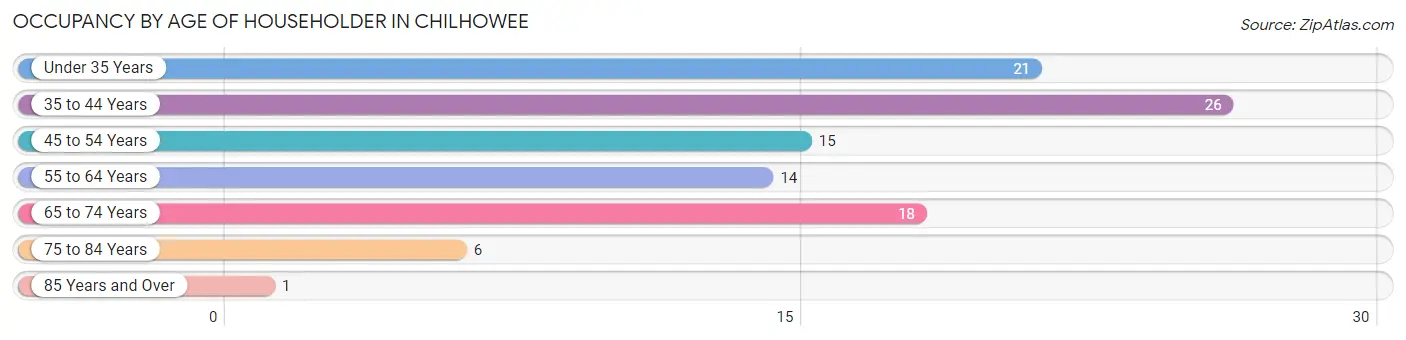
| Age Bracket | # Households | % Households |
| Under 35 Years | 21 | 20.8% |
| 35 to 44 Years | 26 | 25.7% |
| 45 to 54 Years | 15 | 14.8% |
| 55 to 64 Years | 14 | 13.9% |
| 65 to 74 Years | 18 | 17.8% |
| 75 to 84 Years | 6 | 5.9% |
| 85 Years and Over | 1 | 1.0% |
| Total | 101 | 100.0% |
Housing Finances in Chilhowee
Median Income by Occupancy in Chilhowee
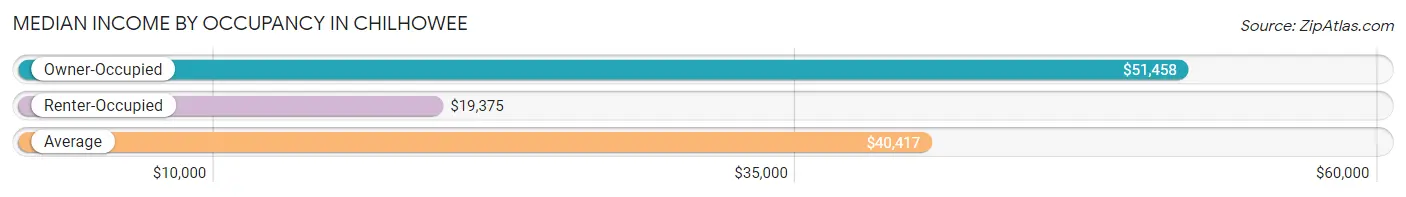
| Occupancy Type | # Households | Median Income |
| Owner-Occupied | 53 (52.5%) | $51,458 |
| Renter-Occupied | 48 (47.5%) | $19,375 |
| Average | 101 (100.0%) | $40,417 |
Occupancy by Householder Income Bracket in Chilhowee
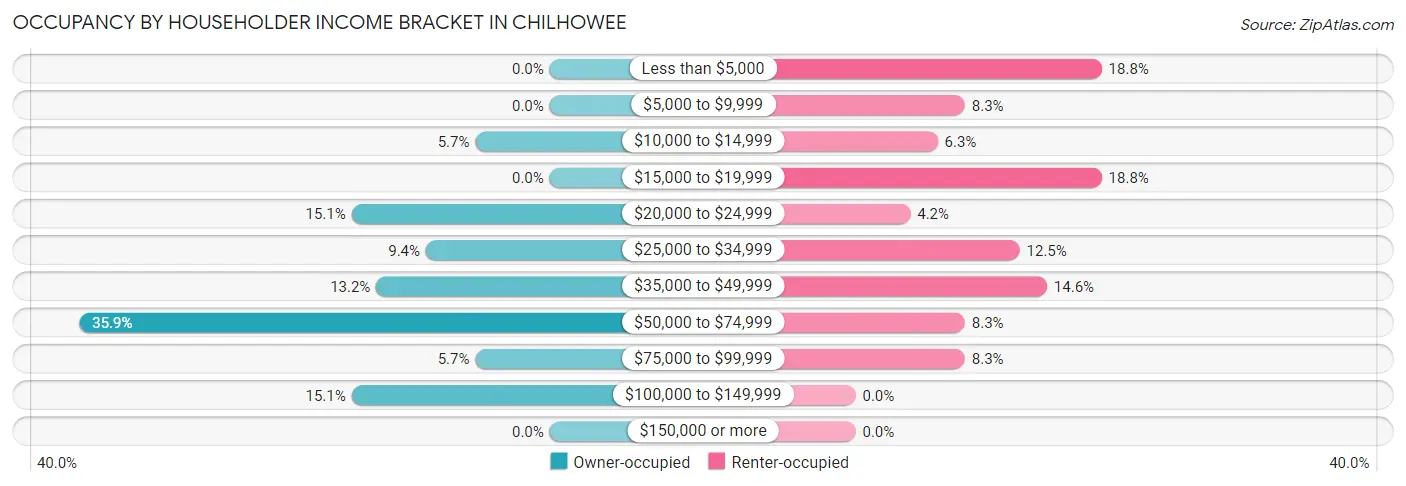
| Income Bracket | Owner-occupied | Renter-occupied |
| Less than $5,000 | 0 (0.0%) | 9 (18.8%) |
| $5,000 to $9,999 | 0 (0.0%) | 4 (8.3%) |
| $10,000 to $14,999 | 3 (5.7%) | 3 (6.2%) |
| $15,000 to $19,999 | 0 (0.0%) | 9 (18.8%) |
| $20,000 to $24,999 | 8 (15.1%) | 2 (4.2%) |
| $25,000 to $34,999 | 5 (9.4%) | 6 (12.5%) |
| $35,000 to $49,999 | 7 (13.2%) | 7 (14.6%) |
| $50,000 to $74,999 | 19 (35.8%) | 4 (8.3%) |
| $75,000 to $99,999 | 3 (5.7%) | 4 (8.3%) |
| $100,000 to $149,999 | 8 (15.1%) | 0 (0.0%) |
| $150,000 or more | 0 (0.0%) | 0 (0.0%) |
| Total | 53 (100.0%) | 48 (100.0%) |
Monthly Housing Cost Tiers in Chilhowee
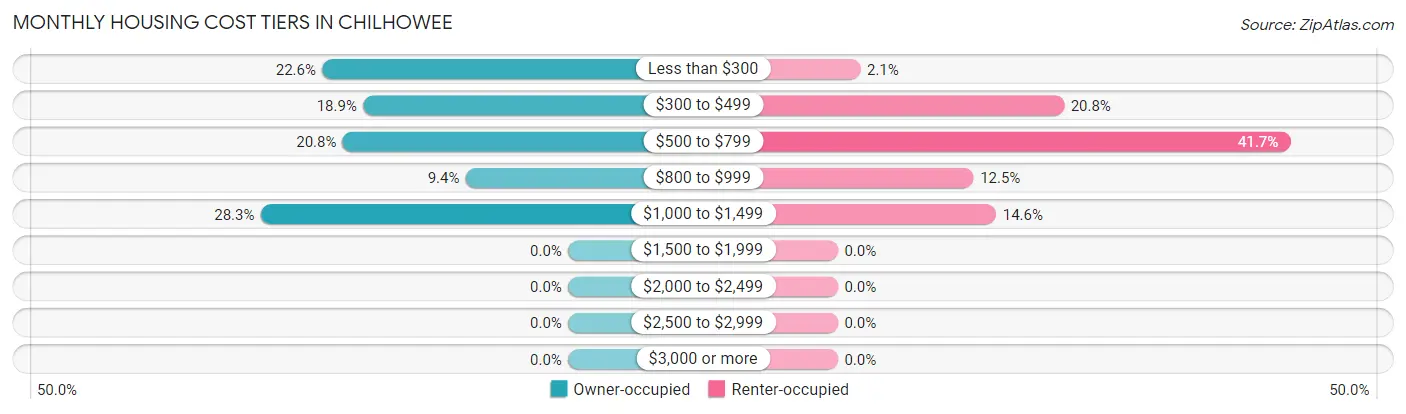
| Monthly Cost | Owner-occupied | Renter-occupied |
| Less than $300 | 12 (22.6%) | 1 (2.1%) |
| $300 to $499 | 10 (18.9%) | 10 (20.8%) |
| $500 to $799 | 11 (20.7%) | 20 (41.7%) |
| $800 to $999 | 5 (9.4%) | 6 (12.5%) |
| $1,000 to $1,499 | 15 (28.3%) | 7 (14.6%) |
| $1,500 to $1,999 | 0 (0.0%) | 0 (0.0%) |
| $2,000 to $2,499 | 0 (0.0%) | 0 (0.0%) |
| $2,500 to $2,999 | 0 (0.0%) | 0 (0.0%) |
| $3,000 or more | 0 (0.0%) | 0 (0.0%) |
| Total | 53 (100.0%) | 48 (100.0%) |
Physical Housing Characteristics in Chilhowee
Housing Structures in Chilhowee
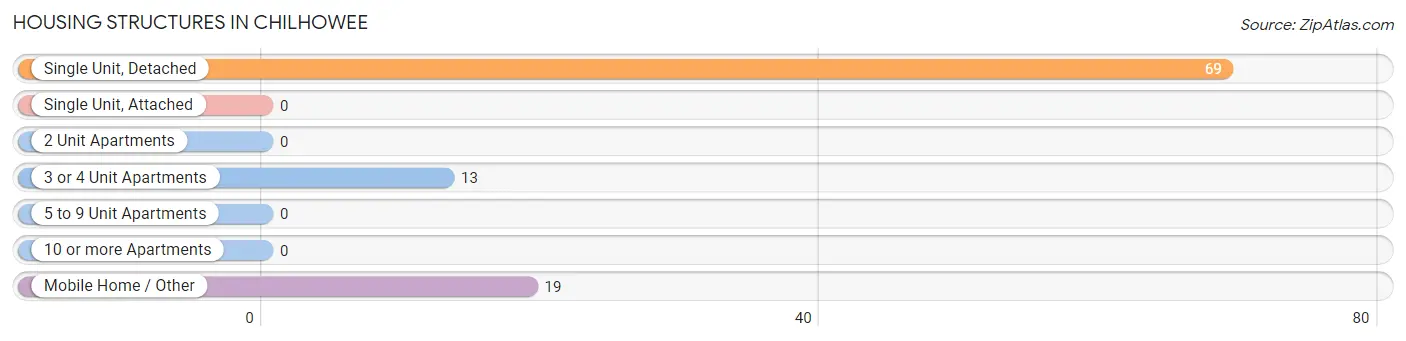
| Structure Type | # Housing Units | % Housing Units |
| Single Unit, Detached | 69 | 68.3% |
| Single Unit, Attached | 0 | 0.0% |
| 2 Unit Apartments | 0 | 0.0% |
| 3 or 4 Unit Apartments | 13 | 12.9% |
| 5 to 9 Unit Apartments | 0 | 0.0% |
| 10 or more Apartments | 0 | 0.0% |
| Mobile Home / Other | 19 | 18.8% |
| Total | 101 | 100.0% |
Housing Structures by Occupancy in Chilhowee
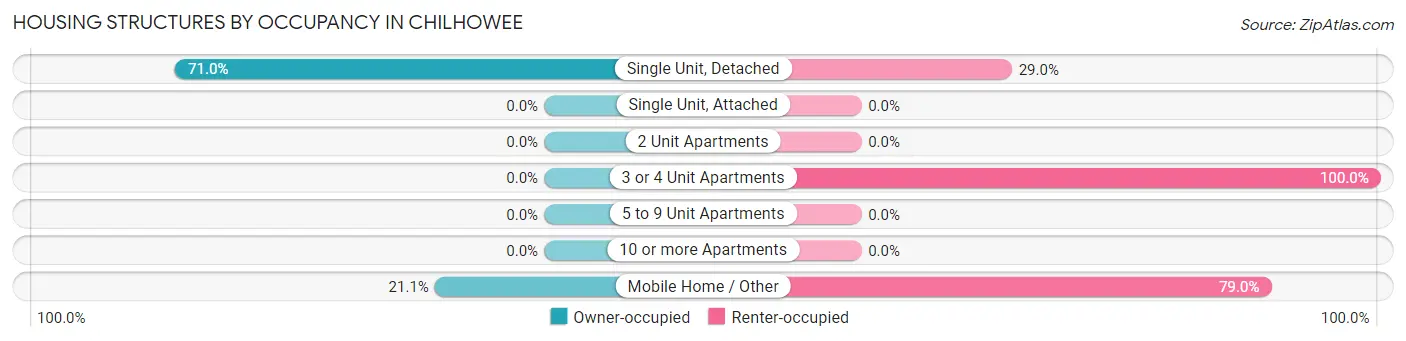
| Structure Type | Owner-occupied | Renter-occupied |
| Single Unit, Detached | 49 (71.0%) | 20 (29.0%) |
| Single Unit, Attached | 0 (0.0%) | 0 (0.0%) |
| 2 Unit Apartments | 0 (0.0%) | 0 (0.0%) |
| 3 or 4 Unit Apartments | 0 (0.0%) | 13 (100.0%) |
| 5 to 9 Unit Apartments | 0 (0.0%) | 0 (0.0%) |
| 10 or more Apartments | 0 (0.0%) | 0 (0.0%) |
| Mobile Home / Other | 4 (21.0%) | 15 (78.9%) |
| Total | 53 (52.5%) | 48 (47.5%) |
Housing Structures by Number of Rooms in Chilhowee
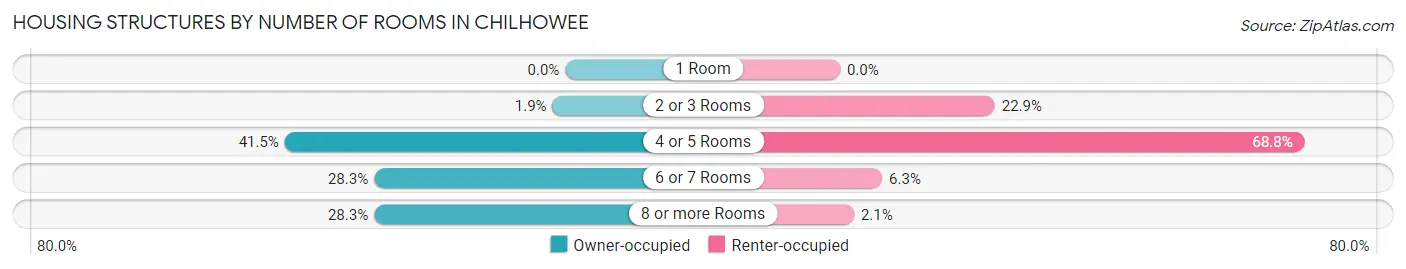
| Number of Rooms | Owner-occupied | Renter-occupied |
| 1 Room | 0 (0.0%) | 0 (0.0%) |
| 2 or 3 Rooms | 1 (1.9%) | 11 (22.9%) |
| 4 or 5 Rooms | 22 (41.5%) | 33 (68.8%) |
| 6 or 7 Rooms | 15 (28.3%) | 3 (6.2%) |
| 8 or more Rooms | 15 (28.3%) | 1 (2.1%) |
| Total | 53 (100.0%) | 48 (100.0%) |
Housing Structure by Heating Type in Chilhowee
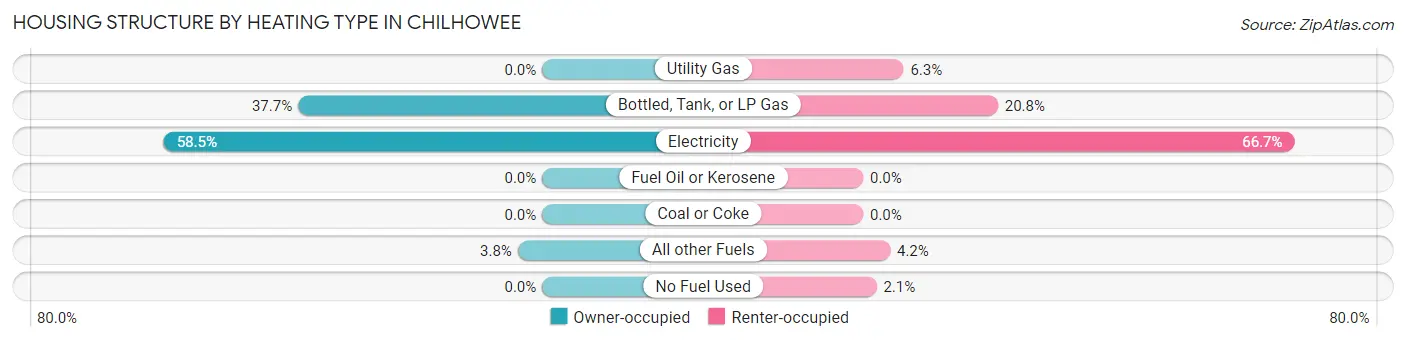
| Heating Type | Owner-occupied | Renter-occupied |
| Utility Gas | 0 (0.0%) | 3 (6.2%) |
| Bottled, Tank, or LP Gas | 20 (37.7%) | 10 (20.8%) |
| Electricity | 31 (58.5%) | 32 (66.7%) |
| Fuel Oil or Kerosene | 0 (0.0%) | 0 (0.0%) |
| Coal or Coke | 0 (0.0%) | 0 (0.0%) |
| All other Fuels | 2 (3.8%) | 2 (4.2%) |
| No Fuel Used | 0 (0.0%) | 1 (2.1%) |
| Total | 53 (100.0%) | 48 (100.0%) |
Household Vehicle Usage in Chilhowee
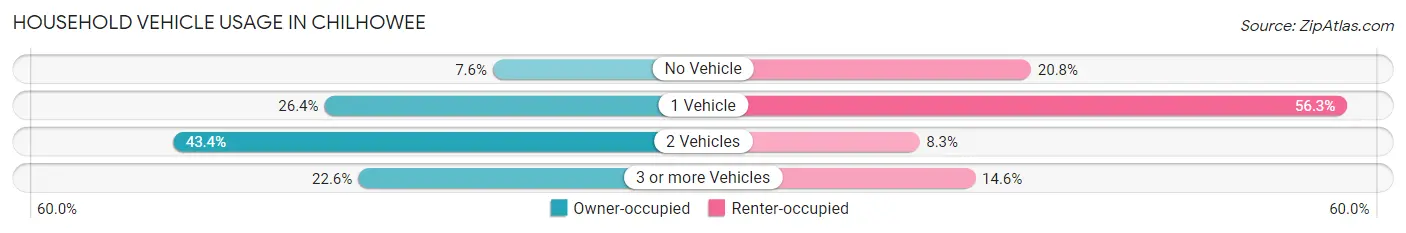
| Vehicles per Household | Owner-occupied | Renter-occupied |
| No Vehicle | 4 (7.5%) | 10 (20.8%) |
| 1 Vehicle | 14 (26.4%) | 27 (56.2%) |
| 2 Vehicles | 23 (43.4%) | 4 (8.3%) |
| 3 or more Vehicles | 12 (22.6%) | 7 (14.6%) |
| Total | 53 (100.0%) | 48 (100.0%) |
Real Estate & Mortgages in Chilhowee
Real Estate and Mortgage Overview in Chilhowee
| Characteristic | Without Mortgage | With Mortgage |
| Housing Units | 28 | 25 |
| Median Property Value | - | - |
| Median Household Income | $43,750 | $0 |
| Monthly Housing Costs | $383 | $0 |
| Real Estate Taxes | $331 | $2 |
Property Value by Mortgage Status in Chilhowee
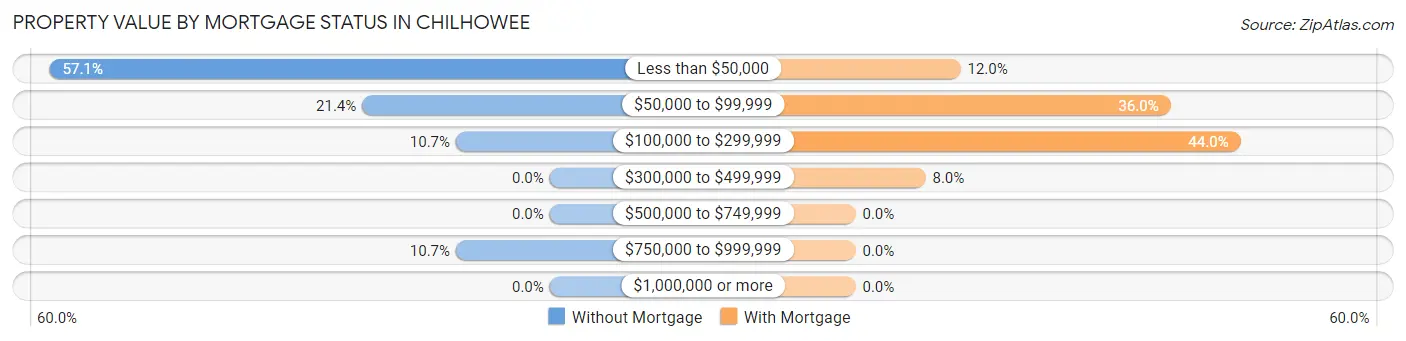
| Property Value | Without Mortgage | With Mortgage |
| Less than $50,000 | 16 (57.1%) | 3 (12.0%) |
| $50,000 to $99,999 | 6 (21.4%) | 9 (36.0%) |
| $100,000 to $299,999 | 3 (10.7%) | 11 (44.0%) |
| $300,000 to $499,999 | 0 (0.0%) | 2 (8.0%) |
| $500,000 to $749,999 | 0 (0.0%) | 0 (0.0%) |
| $750,000 to $999,999 | 3 (10.7%) | 0 (0.0%) |
| $1,000,000 or more | 0 (0.0%) | 0 (0.0%) |
| Total | 28 (100.0%) | 25 (100.0%) |
Household Income by Mortgage Status in Chilhowee
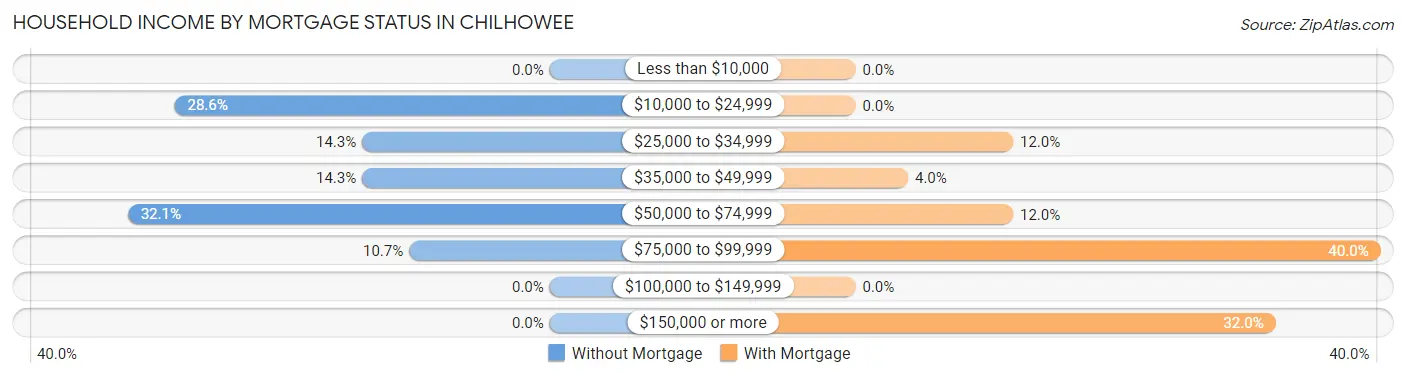
| Household Income | Without Mortgage | With Mortgage |
| Less than $10,000 | 0 (0.0%) | 0 (0.0%) |
| $10,000 to $24,999 | 8 (28.6%) | 0 (0.0%) |
| $25,000 to $34,999 | 4 (14.3%) | 3 (12.0%) |
| $35,000 to $49,999 | 4 (14.3%) | 1 (4.0%) |
| $50,000 to $74,999 | 9 (32.1%) | 3 (12.0%) |
| $75,000 to $99,999 | 3 (10.7%) | 10 (40.0%) |
| $100,000 to $149,999 | 0 (0.0%) | 0 (0.0%) |
| $150,000 or more | 0 (0.0%) | 8 (32.0%) |
| Total | 28 (100.0%) | 25 (100.0%) |
Property Value to Household Income Ratio in Chilhowee
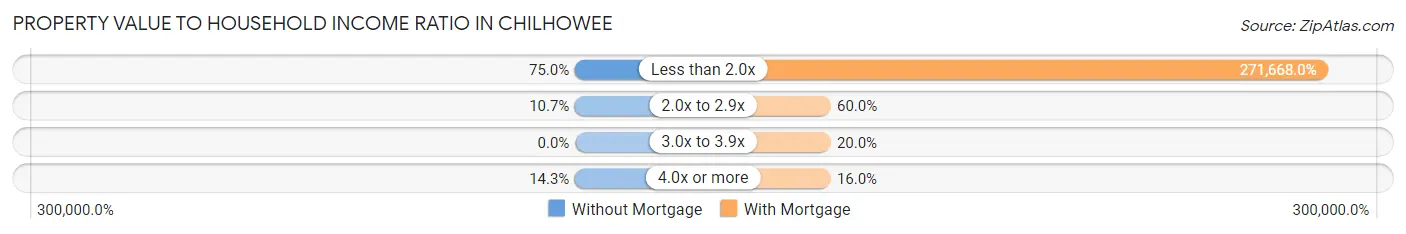
| Value-to-Income Ratio | Without Mortgage | With Mortgage |
| Less than 2.0x | 21 (75.0%) | 67,917 (271,668.0%) |
| 2.0x to 2.9x | 3 (10.7%) | 15 (60.0%) |
| 3.0x to 3.9x | 0 (0.0%) | 5 (20.0%) |
| 4.0x or more | 4 (14.3%) | 4 (16.0%) |
| Total | 28 (100.0%) | 25 (100.0%) |
Real Estate Taxes by Mortgage Status in Chilhowee
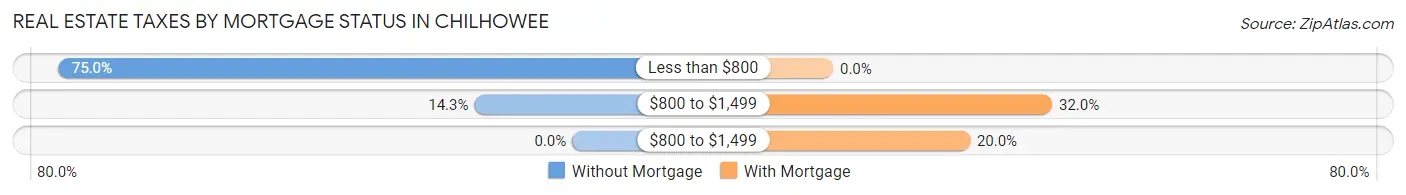
| Property Taxes | Without Mortgage | With Mortgage |
| Less than $800 | 21 (75.0%) | 0 (0.0%) |
| $800 to $1,499 | 4 (14.3%) | 8 (32.0%) |
| $800 to $1,499 | 0 (0.0%) | 5 (20.0%) |
| Total | 28 (100.0%) | 25 (100.0%) |
Health & Disability in Chilhowee
Health Insurance Coverage by Age in Chilhowee
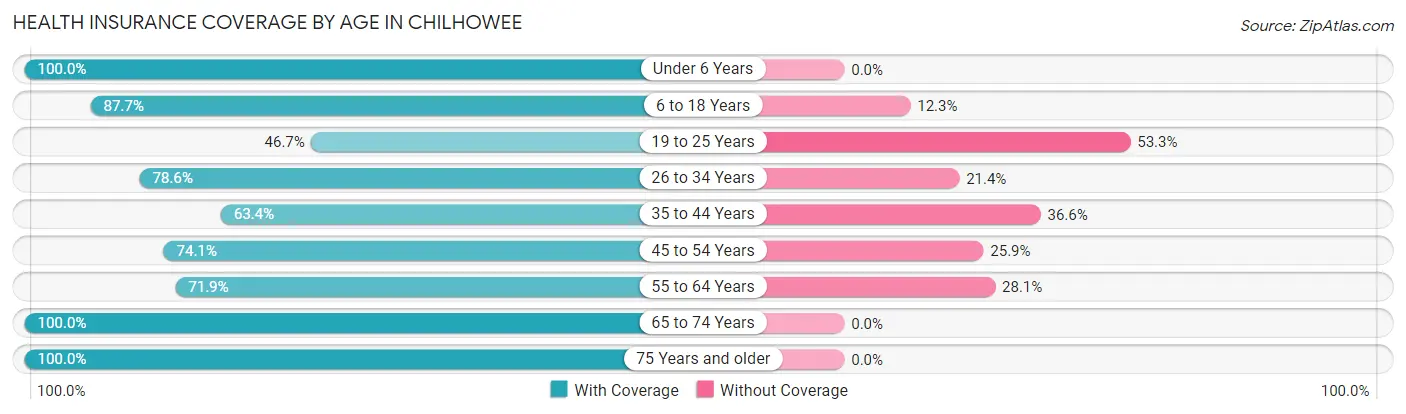
| Age Bracket | With Coverage | Without Coverage |
| Under 6 Years | 30 (100.0%) | 0 (0.0%) |
| 6 to 18 Years | 57 (87.7%) | 8 (12.3%) |
| 19 to 25 Years | 7 (46.7%) | 8 (53.3%) |
| 26 to 34 Years | 22 (78.6%) | 6 (21.4%) |
| 35 to 44 Years | 26 (63.4%) | 15 (36.6%) |
| 45 to 54 Years | 20 (74.1%) | 7 (25.9%) |
| 55 to 64 Years | 23 (71.9%) | 9 (28.1%) |
| 65 to 74 Years | 21 (100.0%) | 0 (0.0%) |
| 75 Years and older | 8 (100.0%) | 0 (0.0%) |
| Total | 214 (80.1%) | 53 (19.9%) |
Health Insurance Coverage by Citizenship Status in Chilhowee
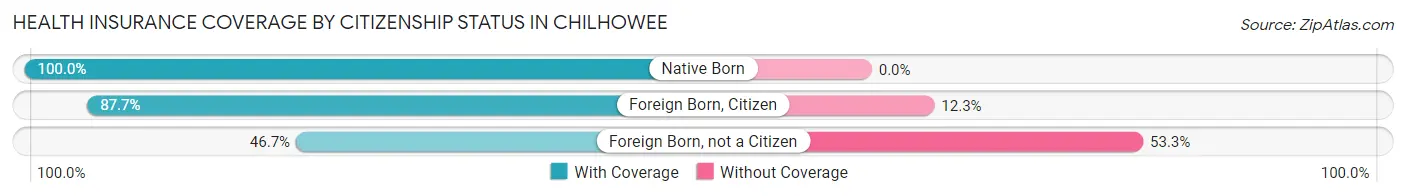
| Citizenship Status | With Coverage | Without Coverage |
| Native Born | 30 (100.0%) | 0 (0.0%) |
| Foreign Born, Citizen | 57 (87.7%) | 8 (12.3%) |
| Foreign Born, not a Citizen | 7 (46.7%) | 8 (53.3%) |
Health Insurance Coverage by Household Income in Chilhowee
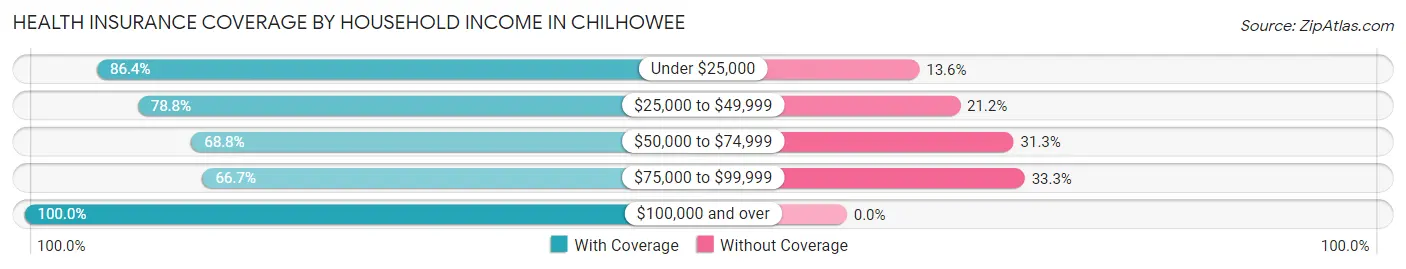
| Household Income | With Coverage | Without Coverage |
| Under $25,000 | 70 (86.4%) | 11 (13.6%) |
| $25,000 to $49,999 | 52 (78.8%) | 14 (21.2%) |
| $50,000 to $74,999 | 44 (68.8%) | 20 (31.2%) |
| $75,000 to $99,999 | 16 (66.7%) | 8 (33.3%) |
| $100,000 and over | 32 (100.0%) | 0 (0.0%) |
Public vs Private Health Insurance Coverage by Age in Chilhowee
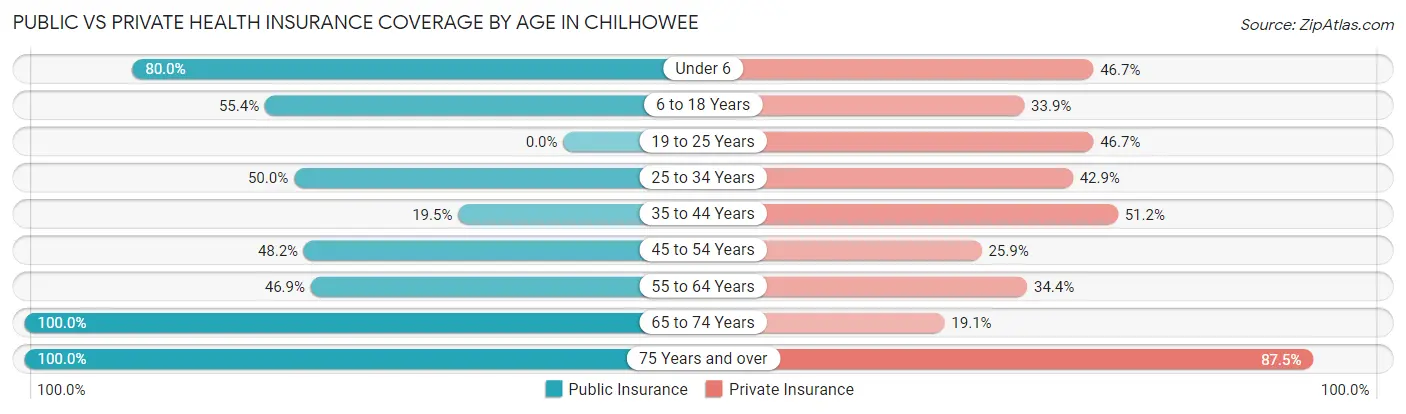
| Age Bracket | Public Insurance | Private Insurance |
| Under 6 | 24 (80.0%) | 14 (46.7%) |
| 6 to 18 Years | 36 (55.4%) | 22 (33.9%) |
| 19 to 25 Years | 0 (0.0%) | 7 (46.7%) |
| 25 to 34 Years | 14 (50.0%) | 12 (42.9%) |
| 35 to 44 Years | 8 (19.5%) | 21 (51.2%) |
| 45 to 54 Years | 13 (48.1%) | 7 (25.9%) |
| 55 to 64 Years | 15 (46.9%) | 11 (34.4%) |
| 65 to 74 Years | 21 (100.0%) | 4 (19.1%) |
| 75 Years and over | 8 (100.0%) | 7 (87.5%) |
| Total | 139 (52.1%) | 105 (39.3%) |
Disability Status by Sex by Age in Chilhowee
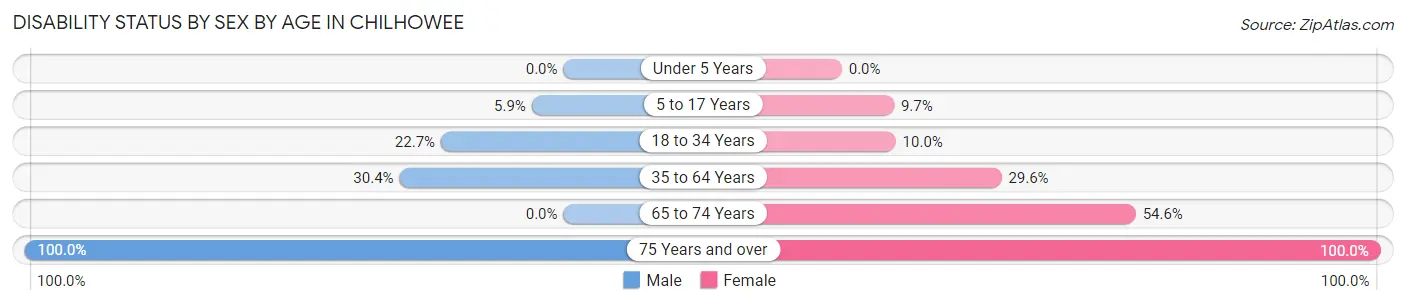
| Age Bracket | Male | Female |
| Under 5 Years | 0 (0.0%) | 0 (0.0%) |
| 5 to 17 Years | 2 (5.9%) | 3 (9.7%) |
| 18 to 34 Years | 5 (22.7%) | 3 (10.0%) |
| 35 to 64 Years | 14 (30.4%) | 16 (29.6%) |
| 65 to 74 Years | 0 (0.0%) | 6 (54.5%) |
| 75 Years and over | 5 (100.0%) | 3 (100.0%) |
Disability Class by Sex by Age in Chilhowee
Disability Class: Hearing Difficulty
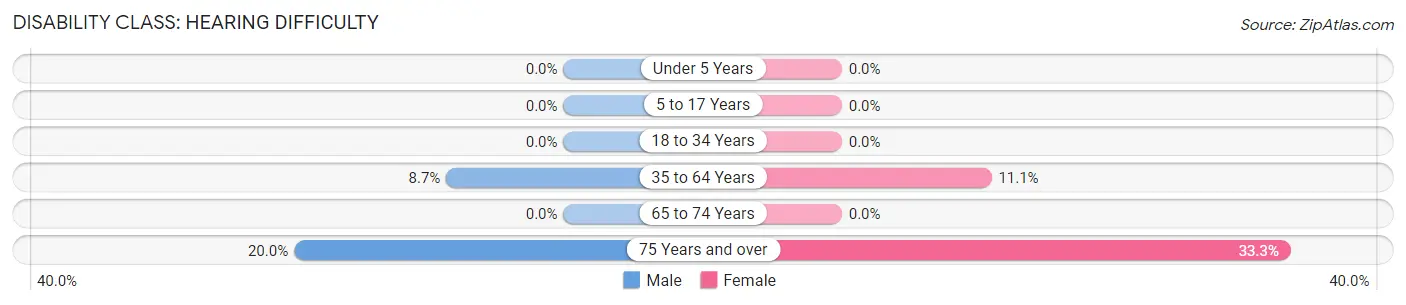
| Age Bracket | Male | Female |
| Under 5 Years | 0 (0.0%) | 0 (0.0%) |
| 5 to 17 Years | 0 (0.0%) | 0 (0.0%) |
| 18 to 34 Years | 0 (0.0%) | 0 (0.0%) |
| 35 to 64 Years | 4 (8.7%) | 6 (11.1%) |
| 65 to 74 Years | 0 (0.0%) | 0 (0.0%) |
| 75 Years and over | 1 (20.0%) | 1 (33.3%) |
Disability Class: Vision Difficulty
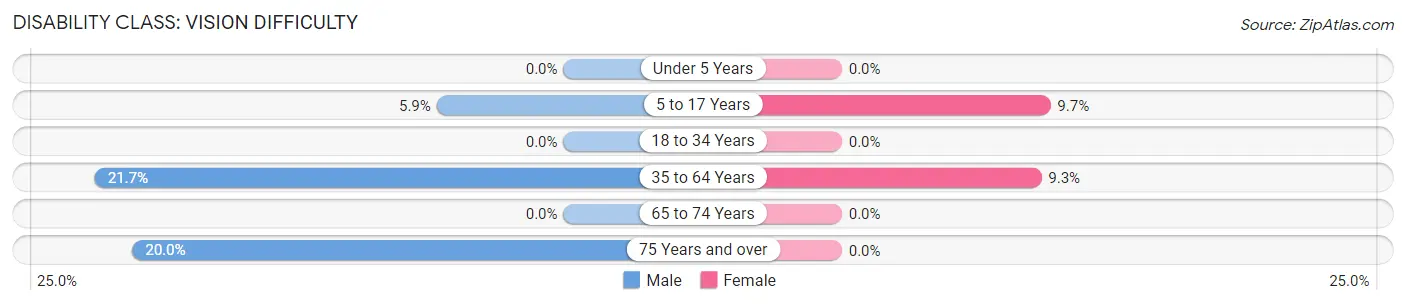
| Age Bracket | Male | Female |
| Under 5 Years | 0 (0.0%) | 0 (0.0%) |
| 5 to 17 Years | 2 (5.9%) | 3 (9.7%) |
| 18 to 34 Years | 0 (0.0%) | 0 (0.0%) |
| 35 to 64 Years | 10 (21.7%) | 5 (9.3%) |
| 65 to 74 Years | 0 (0.0%) | 0 (0.0%) |
| 75 Years and over | 1 (20.0%) | 0 (0.0%) |
Disability Class: Cognitive Difficulty
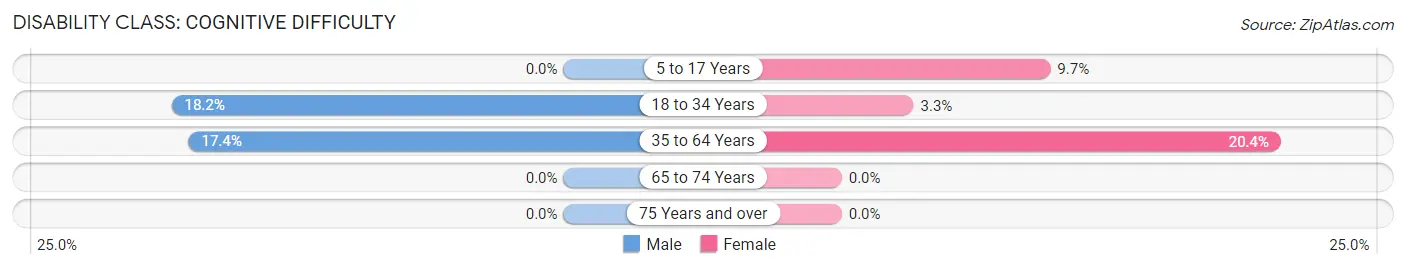
| Age Bracket | Male | Female |
| 5 to 17 Years | 0 (0.0%) | 3 (9.7%) |
| 18 to 34 Years | 4 (18.2%) | 1 (3.3%) |
| 35 to 64 Years | 8 (17.4%) | 11 (20.4%) |
| 65 to 74 Years | 0 (0.0%) | 0 (0.0%) |
| 75 Years and over | 0 (0.0%) | 0 (0.0%) |
Disability Class: Ambulatory Difficulty
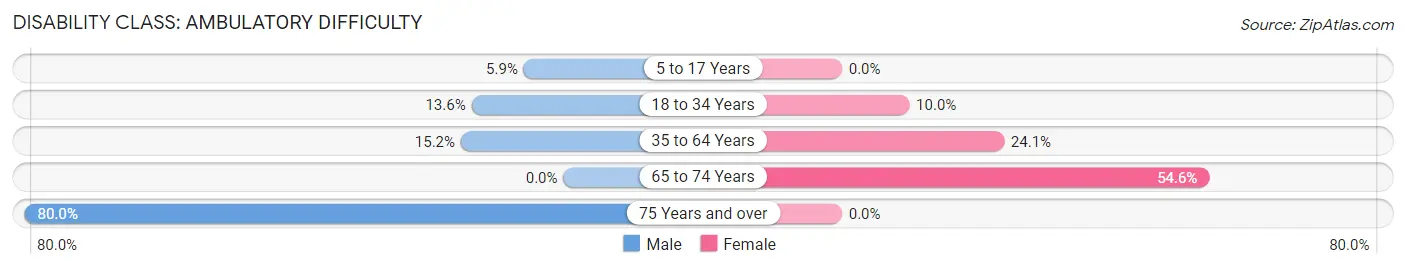
| Age Bracket | Male | Female |
| 5 to 17 Years | 2 (5.9%) | 0 (0.0%) |
| 18 to 34 Years | 3 (13.6%) | 3 (10.0%) |
| 35 to 64 Years | 7 (15.2%) | 13 (24.1%) |
| 65 to 74 Years | 0 (0.0%) | 6 (54.5%) |
| 75 Years and over | 4 (80.0%) | 0 (0.0%) |
Disability Class: Self-Care Difficulty
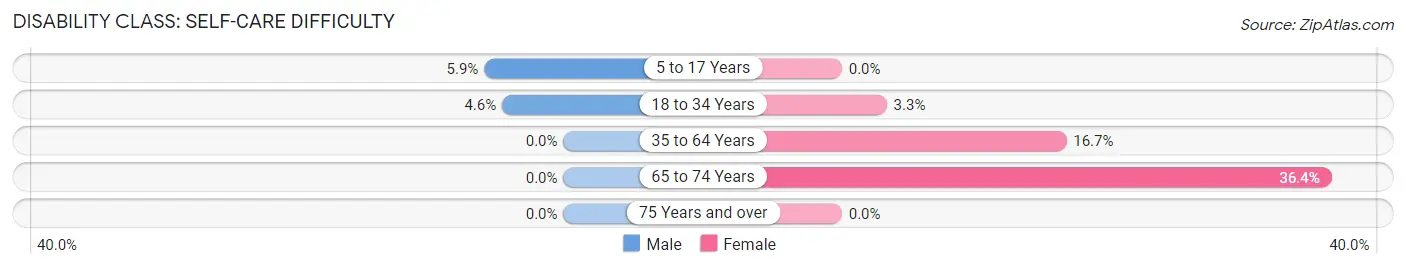
| Age Bracket | Male | Female |
| 5 to 17 Years | 2 (5.9%) | 0 (0.0%) |
| 18 to 34 Years | 1 (4.5%) | 1 (3.3%) |
| 35 to 64 Years | 0 (0.0%) | 9 (16.7%) |
| 65 to 74 Years | 0 (0.0%) | 4 (36.4%) |
| 75 Years and over | 0 (0.0%) | 0 (0.0%) |
Technology Access in Chilhowee
Computing Device Access in Chilhowee
| Device Type | # Households | % Households |
| Desktop or Laptop | 52 | 51.5% |
| Smartphone | 87 | 86.1% |
| Tablet | 48 | 47.5% |
| No Computing Device | 9 | 8.9% |
| Total | 101 | 100.0% |
Internet Access in Chilhowee
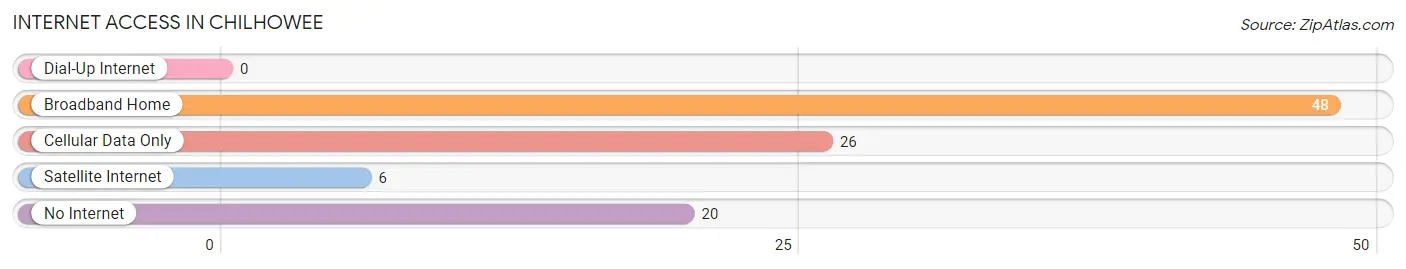
| Internet Type | # Households | % Households |
| Dial-Up Internet | 0 | 0.0% |
| Broadband Home | 48 | 47.5% |
| Cellular Data Only | 26 | 25.7% |
| Satellite Internet | 6 | 5.9% |
| No Internet | 20 | 19.8% |
| Total | 101 | 100.0% |
Chilhowee Summary
Chilhowee is a small unincorporated community located in Johnson County, Missouri, United States. It is situated in the northwest corner of the county, approximately 10 miles south of Warrensburg and 15 miles east of Knob Noster. The population of Chilhowee was estimated to be around 200 in 2020.
History
Chilhowee was founded in 1871 by a group of settlers from Tennessee. The town was named after the nearby Chilhowee Mountain, which was named after the Cherokee word for “red”. The town was originally a farming community, but it soon became a center for timber and coal mining. The town was also home to a number of businesses, including a general store, a blacksmith shop, a hotel, and a post office.
In the early 1900s, Chilhowee experienced a period of growth and prosperity. The town was home to several churches, a school, and a number of businesses. However, the Great Depression of the 1930s caused the town to decline. The coal mines closed, and many of the businesses moved away. By the 1950s, the population of Chilhowee had dropped to around 200.
Geography
Chilhowee is located in the northwest corner of Johnson County, Missouri. It is situated in the Ozark Plateau region of the state, and is surrounded by rolling hills and forests. The town is located near the Chilhowee Mountain, which is part of the Ozark Mountains. The nearest major city is Warrensburg, which is located approximately 10 miles to the north.
The climate in Chilhowee is humid subtropical, with hot summers and mild winters. The average annual temperature is around 60°F, and the average annual precipitation is around 40 inches.
Economy
The economy of Chilhowee is largely based on agriculture. The town is home to several farms, which produce a variety of crops, including corn, soybeans, and hay. The town is also home to a number of small businesses, including a general store, a hardware store, and a restaurant.
Demographics
As of the 2010 census, the population of Chilhowee was estimated to be around 200. The racial makeup of the town was 97.5% White, 0.5% African American, 0.5% Native American, and 1.5% from other races. The median household income was estimated to be around $35,000. The median age was estimated to be around 40 years.
Conclusion
Chilhowee is a small unincorporated community located in Johnson County, Missouri. It was founded in 1871 by a group of settlers from Tennessee, and was originally a farming community. The town experienced a period of growth and prosperity in the early 1900s, but declined during the Great Depression. Today, the economy of Chilhowee is largely based on agriculture, and the population is estimated to be around 200.
Common Questions
What is Per Capita Income in Chilhowee?
Per Capita income in Chilhowee is $16,447.
What is the Median Family Income in Chilhowee?
Median Family Income in Chilhowee is $50,208.
What is the Median Household income in Chilhowee?
Median Household Income in Chilhowee is $40,417.
What is Income or Wage Gap in Chilhowee?
Income or Wage Gap in Chilhowee is 23.1%.
Women in Chilhowee earn 76.9 cents for every dollar earned by a man.
What is Family Income Deficit in Chilhowee?
Family Income Deficit in Chilhowee is $15,900.
Families that are below poverty line in Chilhowee earn $15,900 less on average than the poverty threshold level.
What is Inequality or Gini Index in Chilhowee?
Inequality or Gini Index in Chilhowee is 0.40.
What is the Total Population of Chilhowee?
Total Population of Chilhowee is 267.
What is the Total Male Population of Chilhowee?
Total Male Population of Chilhowee is 121.
What is the Total Female Population of Chilhowee?
Total Female Population of Chilhowee is 146.
What is the Ratio of Males per 100 Females in Chilhowee?
There are 82.88 Males per 100 Females in Chilhowee.
What is the Ratio of Females per 100 Males in Chilhowee?
There are 120.66 Females per 100 Males in Chilhowee.
What is the Median Population Age in Chilhowee?
Median Population Age in Chilhowee is 34.4 Years.
What is the Average Family Size in Chilhowee
Average Family Size in Chilhowee is 3.2 People.
What is the Average Household Size in Chilhowee
Average Household Size in Chilhowee is 2.6 People.
How Large is the Labor Force in Chilhowee?
There are 96 People in the Labor Forcein in Chilhowee.
What is the Percentage of People in the Labor Force in Chilhowee?
50.8% of People are in the Labor Force in Chilhowee.
What is the Unemployment Rate in Chilhowee?
Unemployment Rate in Chilhowee is 8.3%.