Zip Codes with the Highest Percentage of Population Employed in Agriculture, Fishing & Hunting in Chesterfield, MO
RELATED REPORTS & OPTIONS
Agriculture, Fishing & Hunting
Chesterfield
Compare Zip Codes
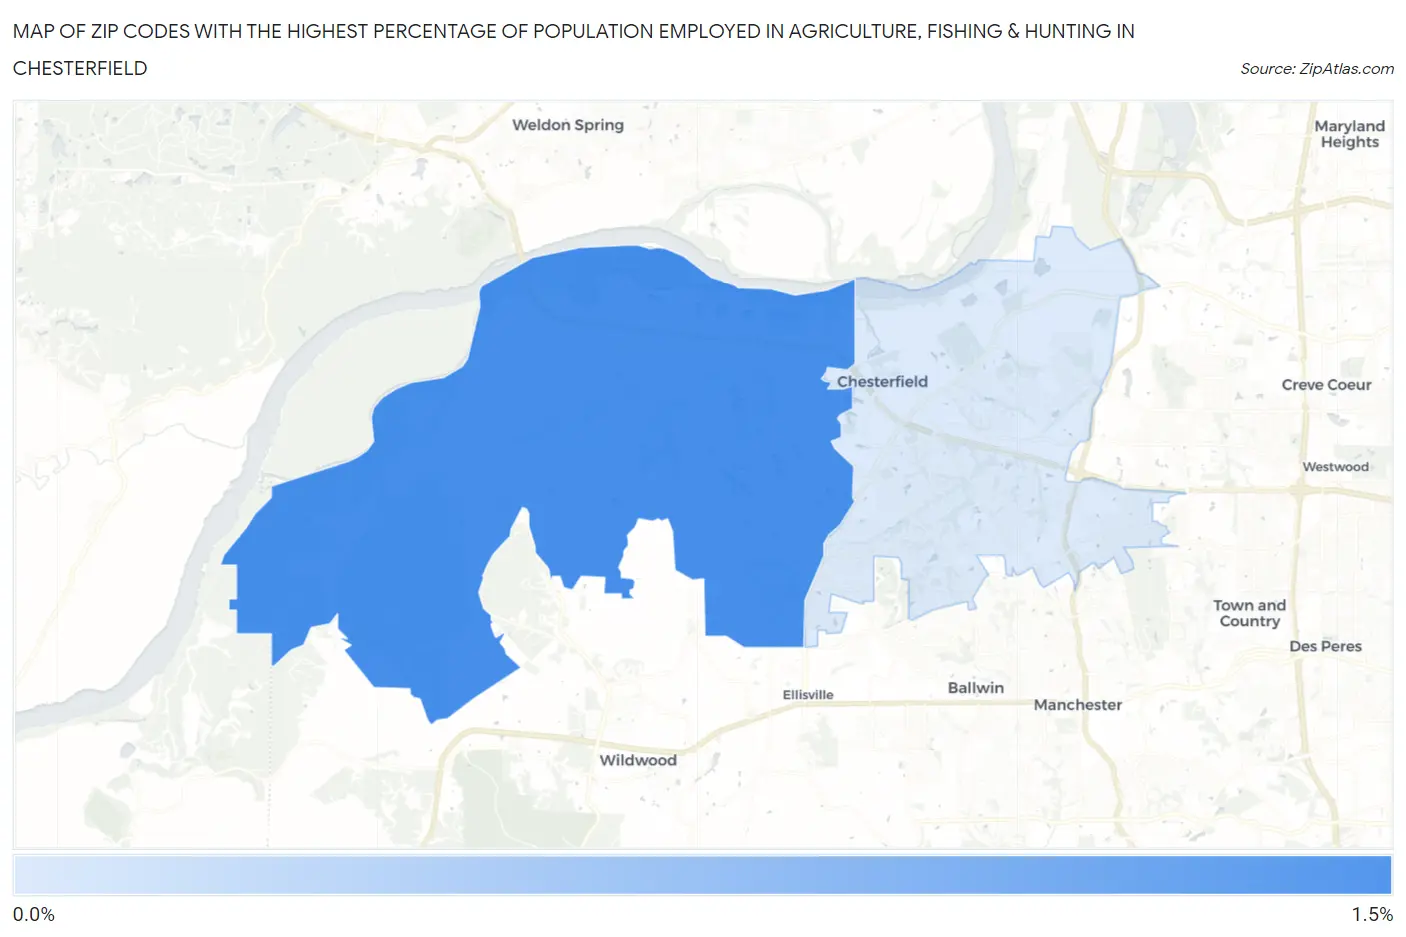
Map of Zip Codes with the Highest Percentage of Population Employed in Agriculture, Fishing & Hunting in Chesterfield
0.0%
1.5%
Zip Codes with the Highest Percentage of Population Employed in Agriculture, Fishing & Hunting in Chesterfield, MO
| Zip Code | % Employed | vs State | vs National | |
| 1. | 63005 | 1.3% | 1.4%(-0.174)#598 | 1.2%(+0.070)#15,142 |
| 2. | 63017 | 0.28% | 1.4%(-1.16)#768 | 1.2%(-0.917)#21,378 |
1
Common Questions
What are the Top Zip Codes with the Highest Percentage of Population Employed in Agriculture, Fishing & Hunting in Chesterfield, MO?
Top Zip Codes with the Highest Percentage of Population Employed in Agriculture, Fishing & Hunting in Chesterfield, MO are:
What zip code has the Highest Percentage of Population Employed in Agriculture, Fishing & Hunting in Chesterfield, MO?
63005 has the Highest Percentage of Population Employed in Agriculture, Fishing & Hunting in Chesterfield, MO with 1.3%.
What is the Percentage of Population Employed in Agriculture, Fishing & Hunting in Chesterfield, MO?
Percentage of Population Employed in Agriculture, Fishing & Hunting in Chesterfield is 0.66%.
What is the Percentage of Population Employed in Agriculture, Fishing & Hunting in Missouri?
Percentage of Population Employed in Agriculture, Fishing & Hunting in Missouri is 1.4%.
What is the Percentage of Population Employed in Agriculture, Fishing & Hunting in the United States?
Percentage of Population Employed in Agriculture, Fishing & Hunting in the United States is 1.2%.