Cedar Hill, MO Map & Demographics
Cedar Hill Map
Cedar Hill Overview
$32,870
PER CAPITA INCOME
$62,981
AVG FAMILY INCOME
$77,774
AVG HOUSEHOLD INCOME
46.1%
WAGE / INCOME GAP [ % ]
53.9¢/ $1
WAGE / INCOME GAP [ $ ]
0.33
INEQUALITY / GINI INDEX
1,453
TOTAL POPULATION
719
MALE POPULATION
734
FEMALE POPULATION
97.96
MALES / 100 FEMALES
102.09
FEMALES / 100 MALES
32.1
MEDIAN AGE
3.0
AVG FAMILY SIZE
2.6
AVG HOUSEHOLD SIZE
820
LABOR FORCE [ PEOPLE ]
69.5%
PERCENT IN LABOR FORCE
3.8%
UNEMPLOYMENT RATE
Cedar Hill Zip Codes
Cedar Hill Area Codes
Income in Cedar Hill
Income Overview in Cedar Hill
Per Capita Income in Cedar Hill is $32,870, while median incomes of families and households are $62,981 and $77,774 respectively.
| Characteristic | Number | Measure |
| Per Capita Income | 1,453 | $32,870 |
| Median Family Income | 384 | $62,981 |
| Mean Family Income | 384 | $82,013 |
| Median Household Income | 565 | $77,774 |
| Mean Household Income | 565 | $82,188 |
| Income Deficit | 384 | $0 |
| Wage / Income Gap (%) | 1,453 | 46.12% |
| Wage / Income Gap ($) | 1,453 | 53.88¢ per $1 |
| Gini / Inequality Index | 1,453 | 0.33 |
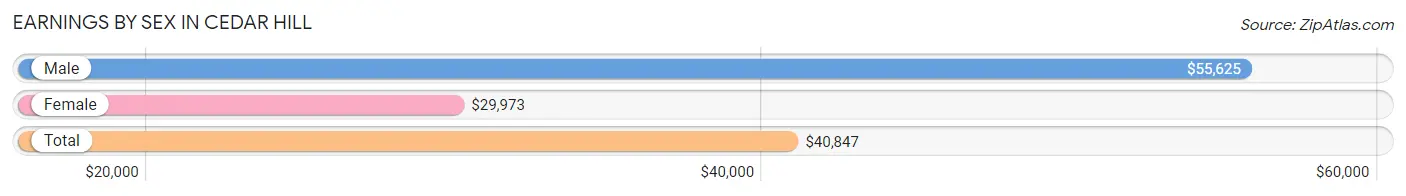
Earnings by Sex in Cedar Hill
Average Earnings in Cedar Hill are $40,847, $55,625 for men and $29,973 for women, a difference of 46.1%.
| Sex | Number | Average Earnings |
| Male | 412 (47.2%) | $55,625 |
| Female | 461 (52.8%) | $29,973 |
| Total | 873 (100.0%) | $40,847 |
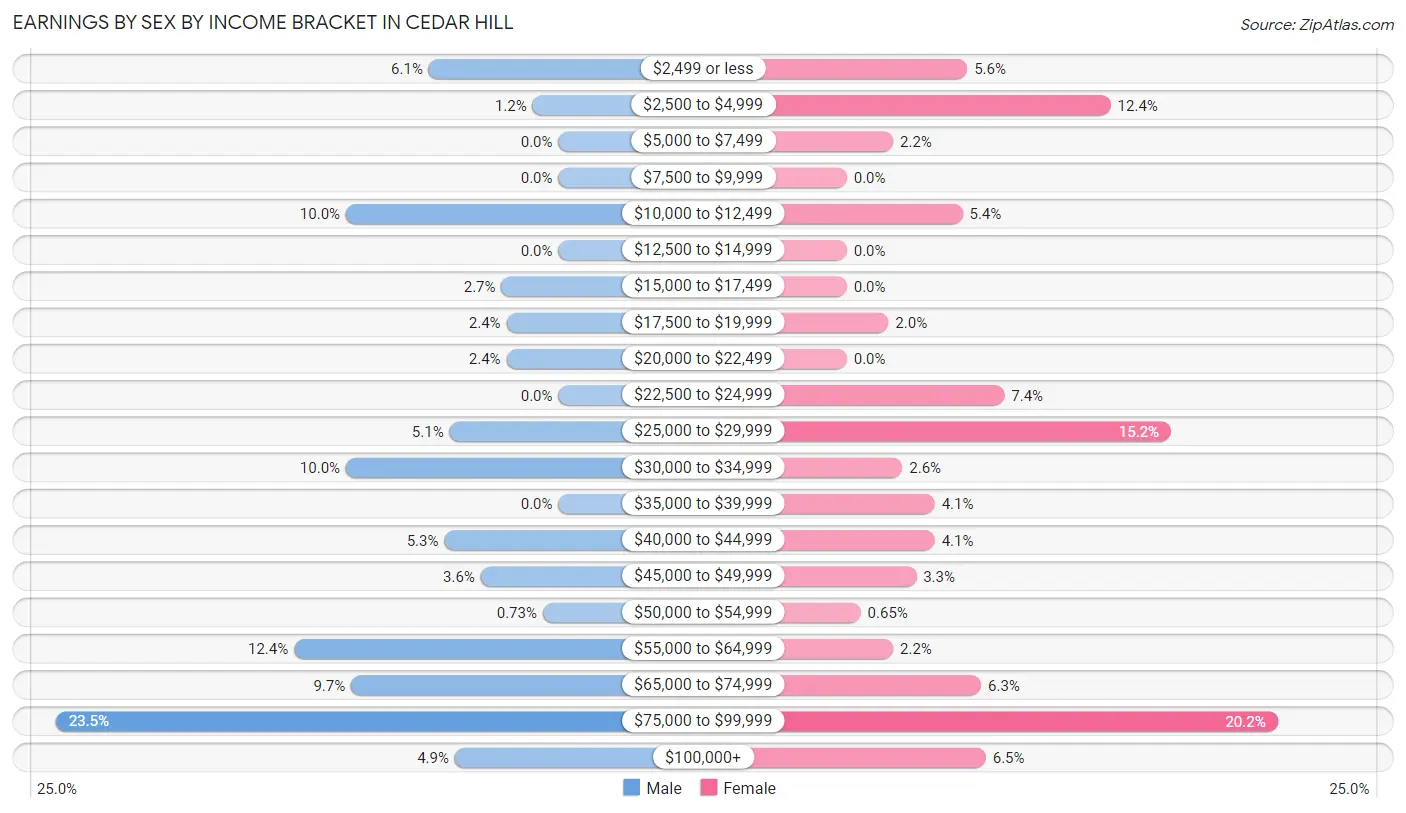
Earnings by Sex by Income Bracket in Cedar Hill
The most common earnings brackets in Cedar Hill are $75,000 to $99,999 for men (97 | 23.5%) and $75,000 to $99,999 for women (93 | 20.2%).
| Income | Male | Female |
| $2,499 or less | 25 (6.1%) | 26 (5.6%) |
| $2,500 to $4,999 | 5 (1.2%) | 57 (12.4%) |
| $5,000 to $7,499 | 0 (0.0%) | 10 (2.2%) |
| $7,500 to $9,999 | 0 (0.0%) | 0 (0.0%) |
| $10,000 to $12,499 | 41 (10.0%) | 25 (5.4%) |
| $12,500 to $14,999 | 0 (0.0%) | 0 (0.0%) |
| $15,000 to $17,499 | 11 (2.7%) | 0 (0.0%) |
| $17,500 to $19,999 | 10 (2.4%) | 9 (1.9%) |
| $20,000 to $22,499 | 10 (2.4%) | 0 (0.0%) |
| $22,500 to $24,999 | 0 (0.0%) | 34 (7.4%) |
| $25,000 to $29,999 | 21 (5.1%) | 70 (15.2%) |
| $30,000 to $34,999 | 41 (10.0%) | 12 (2.6%) |
| $35,000 to $39,999 | 0 (0.0%) | 19 (4.1%) |
| $40,000 to $44,999 | 22 (5.3%) | 19 (4.1%) |
| $45,000 to $49,999 | 15 (3.6%) | 15 (3.3%) |
| $50,000 to $54,999 | 3 (0.7%) | 3 (0.6%) |
| $55,000 to $64,999 | 51 (12.4%) | 10 (2.2%) |
| $65,000 to $74,999 | 40 (9.7%) | 29 (6.3%) |
| $75,000 to $99,999 | 97 (23.5%) | 93 (20.2%) |
| $100,000+ | 20 (4.9%) | 30 (6.5%) |
| Total | 412 (100.0%) | 461 (100.0%) |
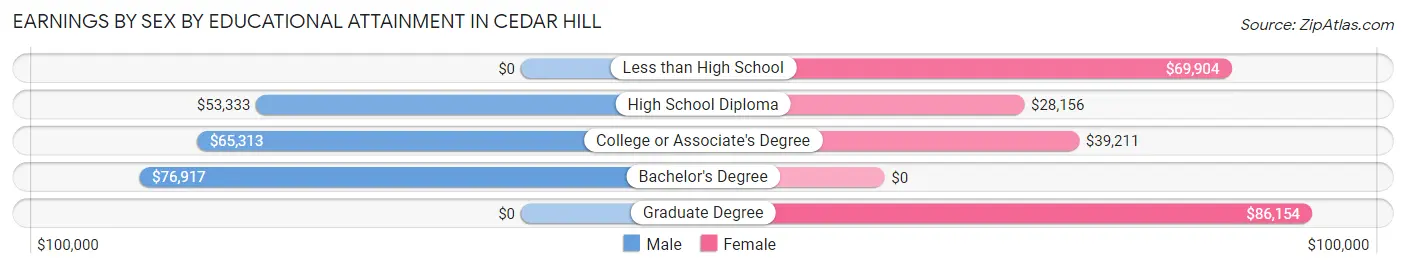
Earnings by Sex by Educational Attainment in Cedar Hill
Average earnings in Cedar Hill are $64,036 for men and $39,803 for women, a difference of 37.8%. Men with an educational attainment of bachelor's degree enjoy the highest average annual earnings of $76,917, while those with high school diploma education earn the least with $53,333. Women with an educational attainment of graduate degree earn the most with the average annual earnings of $86,154, while those with high school diploma education have the smallest earnings of $28,156.
| Educational Attainment | Male Income | Female Income |
| Less than High School | - | - |
| High School Diploma | $53,333 | $28,156 |
| College or Associate's Degree | $65,313 | $39,211 |
| Bachelor's Degree | $76,917 | $0 |
| Graduate Degree | - | - |
| Total | $64,036 | $39,803 |
Family Income in Cedar Hill
Family Income Brackets in Cedar Hill
According to the Cedar Hill family income data, there are 99 families falling into the $50,000 to $74,999 income range, which is the most common income bracket and makes up 25.8% of all families.
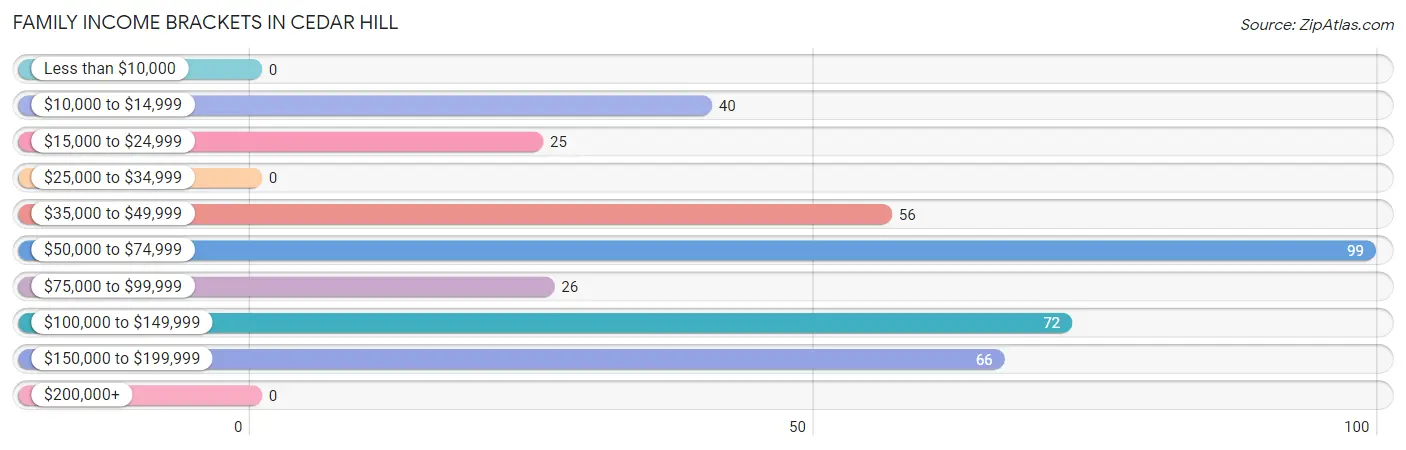
| Income Bracket | # Families | % Families |
| Less than $10,000 | 0 | 0.0% |
| $10,000 to $14,999 | 40 | 10.4% |
| $15,000 to $24,999 | 25 | 6.5% |
| $25,000 to $34,999 | 0 | 0.0% |
| $35,000 to $49,999 | 56 | 14.6% |
| $50,000 to $74,999 | 99 | 25.8% |
| $75,000 to $99,999 | 26 | 6.8% |
| $100,000 to $149,999 | 72 | 18.8% |
| $150,000 to $199,999 | 66 | 17.2% |
| $200,000+ | 0 | 0.0% |
Family Income by Famaliy Size in Cedar Hill
2-person families (202 | 52.6%) account for the highest median family income in Cedar Hill with $77,596 per family, while 2-person families (202 | 52.6%) have the highest median income of $38,798 per family member.
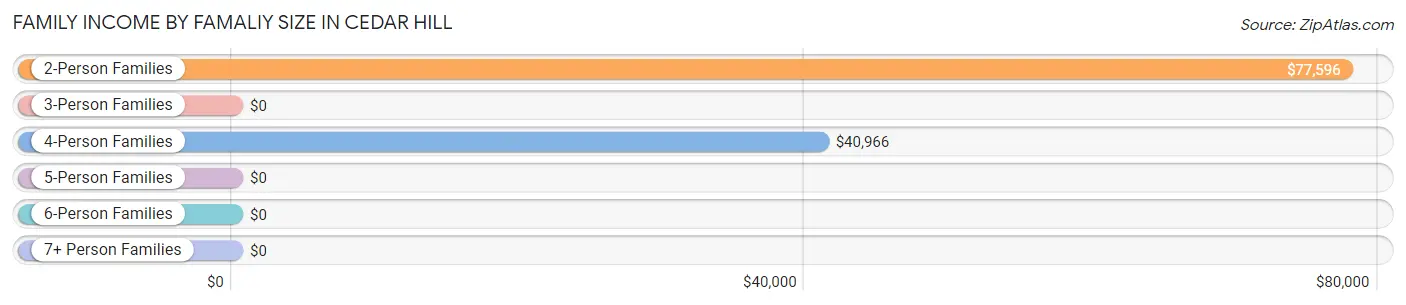
| Income Bracket | # Families | Median Income |
| 2-Person Families | 202 (52.6%) | $77,596 |
| 3-Person Families | 83 (21.6%) | $0 |
| 4-Person Families | 81 (21.1%) | $40,966 |
| 5-Person Families | 8 (2.1%) | $0 |
| 6-Person Families | 10 (2.6%) | $0 |
| 7+ Person Families | 0 (0.0%) | $0 |
| Total | 384 (100.0%) | $62,981 |
Family Income by Number of Earners in Cedar Hill
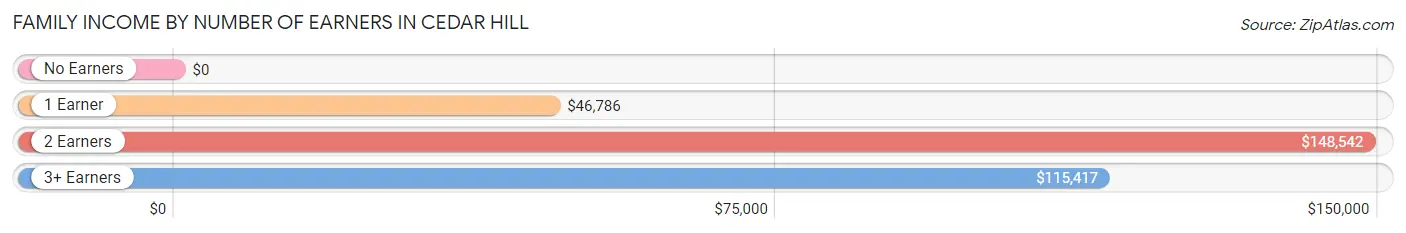
| Number of Earners | # Families | Median Income |
| No Earners | 62 (16.2%) | $0 |
| 1 Earner | 128 (33.3%) | $46,786 |
| 2 Earners | 134 (34.9%) | $148,542 |
| 3+ Earners | 60 (15.6%) | $115,417 |
| Total | 384 (100.0%) | $62,981 |
Household Income in Cedar Hill
Household Income Brackets in Cedar Hill
With 134 households falling in the category, the $50,000 to $74,999 income range is the most frequent in Cedar Hill, accounting for 23.7% of all households.
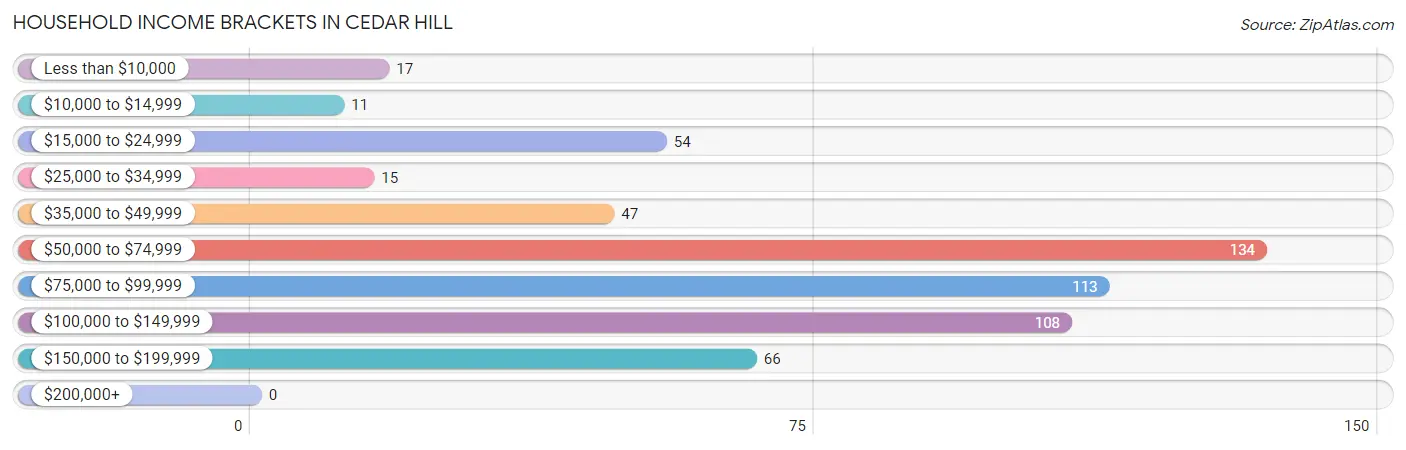
| Income Bracket | # Households | % Households |
| Less than $10,000 | 17 | 3.0% |
| $10,000 to $14,999 | 11 | 1.9% |
| $15,000 to $24,999 | 54 | 9.6% |
| $25,000 to $34,999 | 15 | 2.7% |
| $35,000 to $49,999 | 47 | 8.3% |
| $50,000 to $74,999 | 134 | 23.7% |
| $75,000 to $99,999 | 113 | 20.0% |
| $100,000 to $149,999 | 108 | 19.1% |
| $150,000 to $199,999 | 66 | 11.7% |
| $200,000+ | 0 | 0.0% |
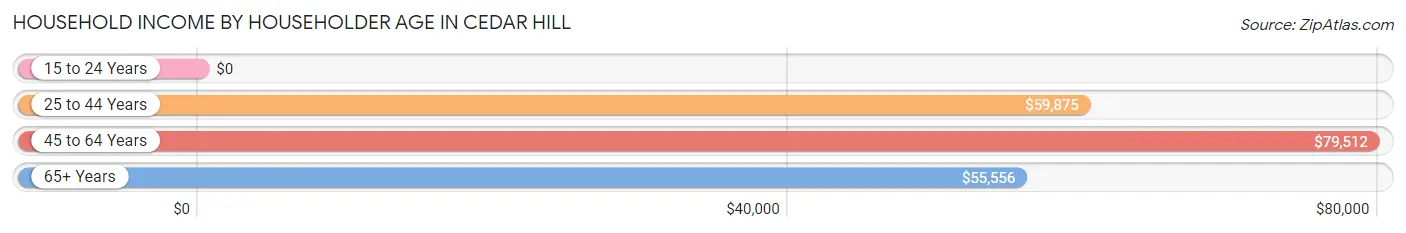
Household Income by Householder Age in Cedar Hill
The median household income in Cedar Hill is $77,774, with the highest median household income of $79,512 found in the 45 to 64 years age bracket for the primary householder. A total of 264 households (46.7%) fall into this category.
| Income Bracket | # Households | Median Income |
| 15 to 24 Years | 0 (0.0%) | $0 |
| 25 to 44 Years | 221 (39.1%) | $59,875 |
| 45 to 64 Years | 264 (46.7%) | $79,512 |
| 65+ Years | 80 (14.2%) | $55,556 |
| Total | 565 (100.0%) | $77,774 |
Poverty in Cedar Hill
Income Below Poverty by Sex and Age in Cedar Hill
With 19.9% poverty level for males and 22.3% for females among the residents of Cedar Hill, 12 to 14 year old males and 12 to 14 year old females are the most vulnerable to poverty, with 35 males (81.4%) and 25 females (83.3%) in their respective age groups living below the poverty level.
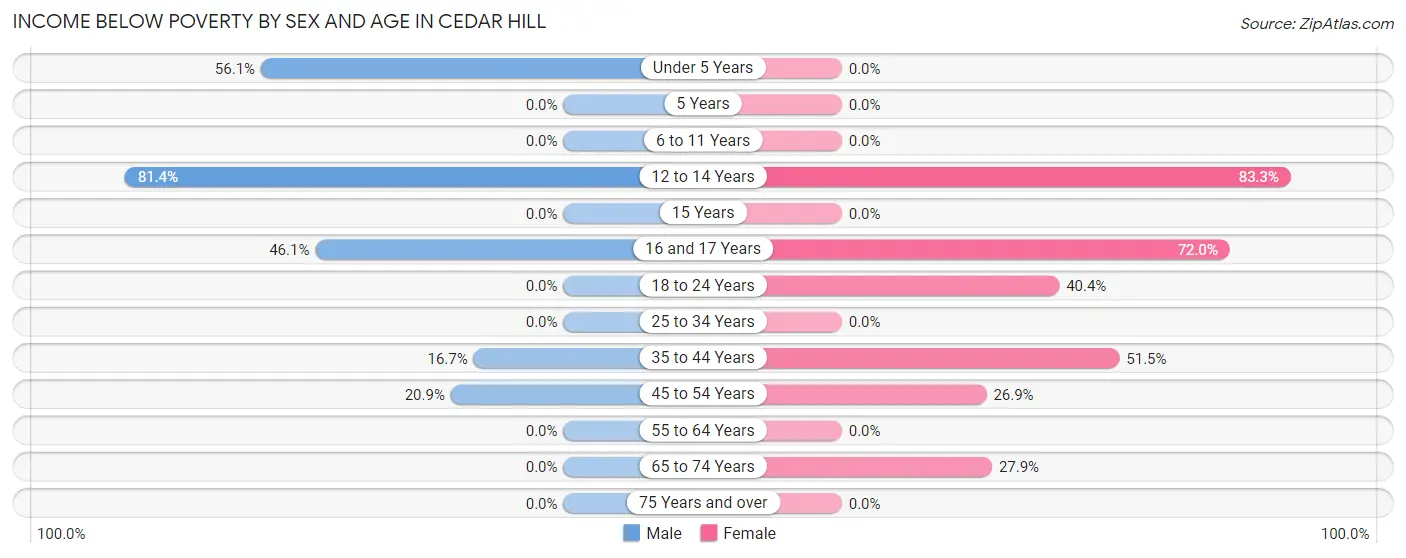
| Age Bracket | Male | Female |
| Under 5 Years | 32 (56.1%) | 0 (0.0%) |
| 5 Years | 0 (0.0%) | 0 (0.0%) |
| 6 to 11 Years | 0 (0.0%) | 0 (0.0%) |
| 12 to 14 Years | 35 (81.4%) | 25 (83.3%) |
| 15 Years | 0 (0.0%) | 0 (0.0%) |
| 16 and 17 Years | 35 (46.1%) | 36 (72.0%) |
| 18 to 24 Years | 0 (0.0%) | 23 (40.4%) |
| 25 to 34 Years | 0 (0.0%) | 0 (0.0%) |
| 35 to 44 Years | 11 (16.7%) | 34 (51.5%) |
| 45 to 54 Years | 28 (20.9%) | 29 (26.9%) |
| 55 to 64 Years | 0 (0.0%) | 0 (0.0%) |
| 65 to 74 Years | 0 (0.0%) | 17 (27.9%) |
| 75 Years and over | 0 (0.0%) | 0 (0.0%) |
| Total | 141 (19.9%) | 164 (22.3%) |
Income Above Poverty by Sex and Age in Cedar Hill
According to the poverty statistics in Cedar Hill, males aged 6 to 11 years and females aged under 5 years are the age groups that are most secure financially, with 100.0% of males and 100.0% of females in these age groups living above the poverty line.
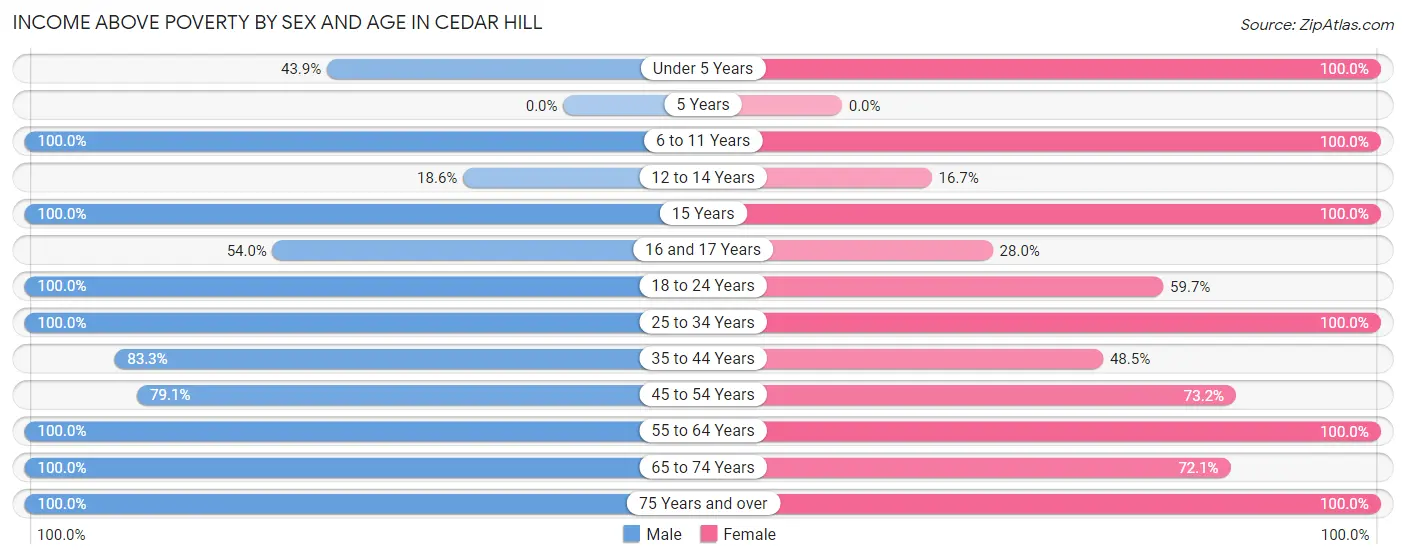
| Age Bracket | Male | Female |
| Under 5 Years | 25 (43.9%) | 58 (100.0%) |
| 5 Years | 0 (0.0%) | 0 (0.0%) |
| 6 to 11 Years | 43 (100.0%) | 9 (100.0%) |
| 12 to 14 Years | 8 (18.6%) | 5 (16.7%) |
| 15 Years | 10 (100.0%) | 12 (100.0%) |
| 16 and 17 Years | 41 (53.9%) | 14 (28.0%) |
| 18 to 24 Years | 36 (100.0%) | 34 (59.7%) |
| 25 to 34 Years | 156 (100.0%) | 128 (100.0%) |
| 35 to 44 Years | 55 (83.3%) | 32 (48.5%) |
| 45 to 54 Years | 106 (79.1%) | 79 (73.2%) |
| 55 to 64 Years | 60 (100.0%) | 140 (100.0%) |
| 65 to 74 Years | 21 (100.0%) | 44 (72.1%) |
| 75 Years and over | 6 (100.0%) | 15 (100.0%) |
| Total | 567 (80.1%) | 570 (77.7%) |
Income Below Poverty Among Married-Couple Families in Cedar Hill
The poverty statistics for married-couple families in Cedar Hill show that 10.9% or 25 of the total 230 families live below the poverty line. Families with 1 or 2 children have the highest poverty rate of 49.0%, comprising of 25 families. On the other hand, families with no children have the lowest poverty rate of 0.0%, which includes 0 families.
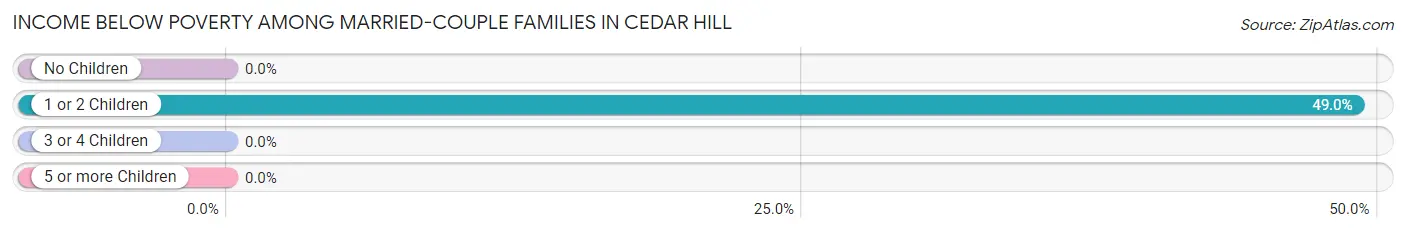
| Children | Above Poverty | Below Poverty |
| No Children | 169 (100.0%) | 0 (0.0%) |
| 1 or 2 Children | 26 (51.0%) | 25 (49.0%) |
| 3 or 4 Children | 10 (100.0%) | 0 (0.0%) |
| 5 or more Children | 0 (0.0%) | 0 (0.0%) |
| Total | 205 (89.1%) | 25 (10.9%) |
Income Below Poverty Among Single-Parent Households in Cedar Hill
According to the poverty data in Cedar Hill, 19.0% or 11 single-father households and 30.2% or 29 single-mother households are living below the poverty line. Among single-father households, those with 1 or 2 children have the highest poverty rate, with 11 households (39.3%) experiencing poverty. Likewise, among single-mother households, those with 1 or 2 children have the highest poverty rate, with 29 households (39.2%) falling below the poverty line.
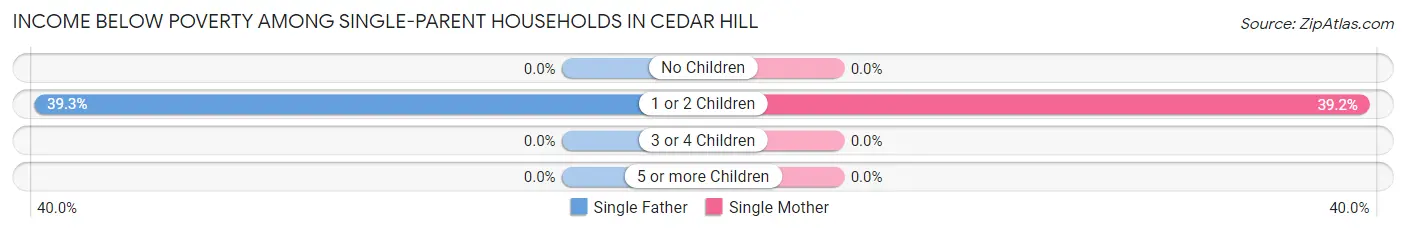
| Children | Single Father | Single Mother |
| No Children | 0 (0.0%) | 0 (0.0%) |
| 1 or 2 Children | 11 (39.3%) | 29 (39.2%) |
| 3 or 4 Children | 0 (0.0%) | 0 (0.0%) |
| 5 or more Children | 0 (0.0%) | 0 (0.0%) |
| Total | 11 (19.0%) | 29 (30.2%) |
Income Below Poverty Among Married-Couple vs Single-Parent Households in Cedar Hill
The poverty data for Cedar Hill shows that 25 of the married-couple family households (10.9%) and 40 of the single-parent households (26.0%) are living below the poverty level. Within the married-couple family households, those with 1 or 2 children have the highest poverty rate, with 25 households (49.0%) falling below the poverty line. Among the single-parent households, those with 1 or 2 children have the highest poverty rate, with 40 household (39.2%) living below poverty.
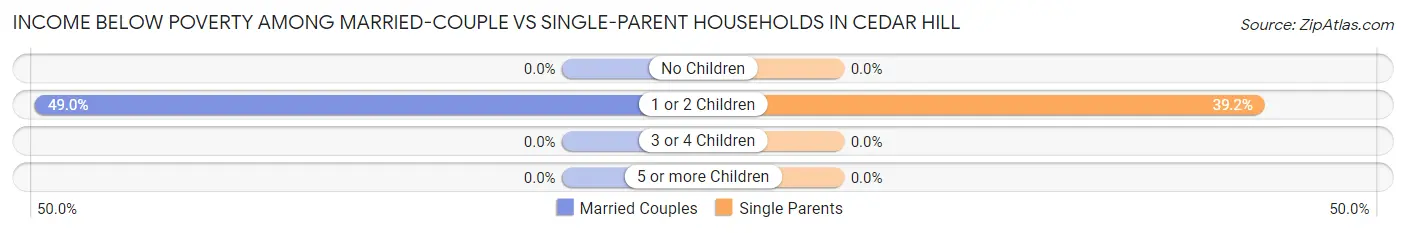
| Children | Married-Couple Families | Single-Parent Households |
| No Children | 0 (0.0%) | 0 (0.0%) |
| 1 or 2 Children | 25 (49.0%) | 40 (39.2%) |
| 3 or 4 Children | 0 (0.0%) | 0 (0.0%) |
| 5 or more Children | 0 (0.0%) | 0 (0.0%) |
| Total | 25 (10.9%) | 40 (26.0%) |
Race in Cedar Hill
The most populous races in Cedar Hill are White / Caucasian (1,337 | 92.0%), Two or more Races (116 | 8.0%), and Hispanic or Latino (31 | 2.1%).
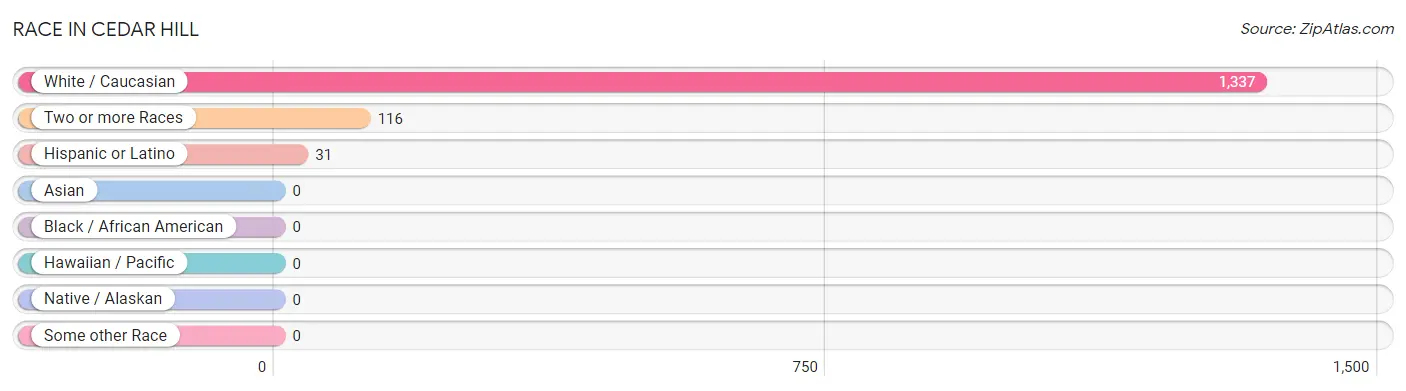
| Race | # Population | % Population |
| Asian | 0 | 0.0% |
| Black / African American | 0 | 0.0% |
| Hawaiian / Pacific | 0 | 0.0% |
| Hispanic or Latino | 31 | 2.1% |
| Native / Alaskan | 0 | 0.0% |
| White / Caucasian | 1,337 | 92.0% |
| Two or more Races | 116 | 8.0% |
| Some other Race | 0 | 0.0% |
| Total | 1,453 | 100.0% |
Ancestry in Cedar Hill
The most populous ancestries reported in Cedar Hill are German (371 | 25.5%), Irish (226 | 15.5%), Scotch-Irish (101 | 7.0%), Italian (73 | 5.0%), and English (57 | 3.9%), together accounting for 57.0% of all Cedar Hill residents.
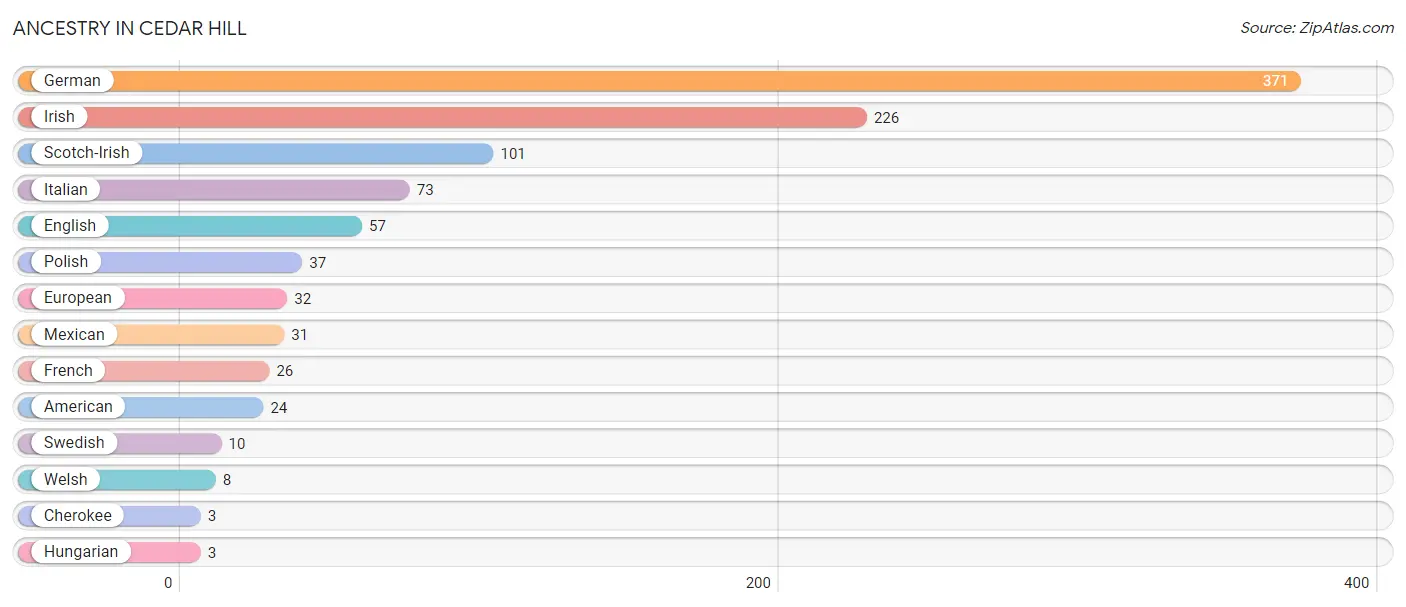
| Ancestry | # Population | % Population |
| American | 24 | 1.7% |
| Cherokee | 3 | 0.2% |
| English | 57 | 3.9% |
| European | 32 | 2.2% |
| French | 26 | 1.8% |
| German | 371 | 25.5% |
| Hungarian | 3 | 0.2% |
| Irish | 226 | 15.5% |
| Italian | 73 | 5.0% |
| Mexican | 31 | 2.1% |
| Polish | 37 | 2.5% |
| Scotch-Irish | 101 | 7.0% |
| Swedish | 10 | 0.7% |
| Welsh | 8 | 0.5% | View All 14 Rows |
Immigrants in Cedar Hill

| Immigration Origin | # Population | % Population | View All 0 Rows |
Sex and Age in Cedar Hill
Sex and Age in Cedar Hill
The most populous age groups in Cedar Hill are 25 to 29 Years (115 | 16.0%) for men and 45 to 49 Years (86 | 11.7%) for women.
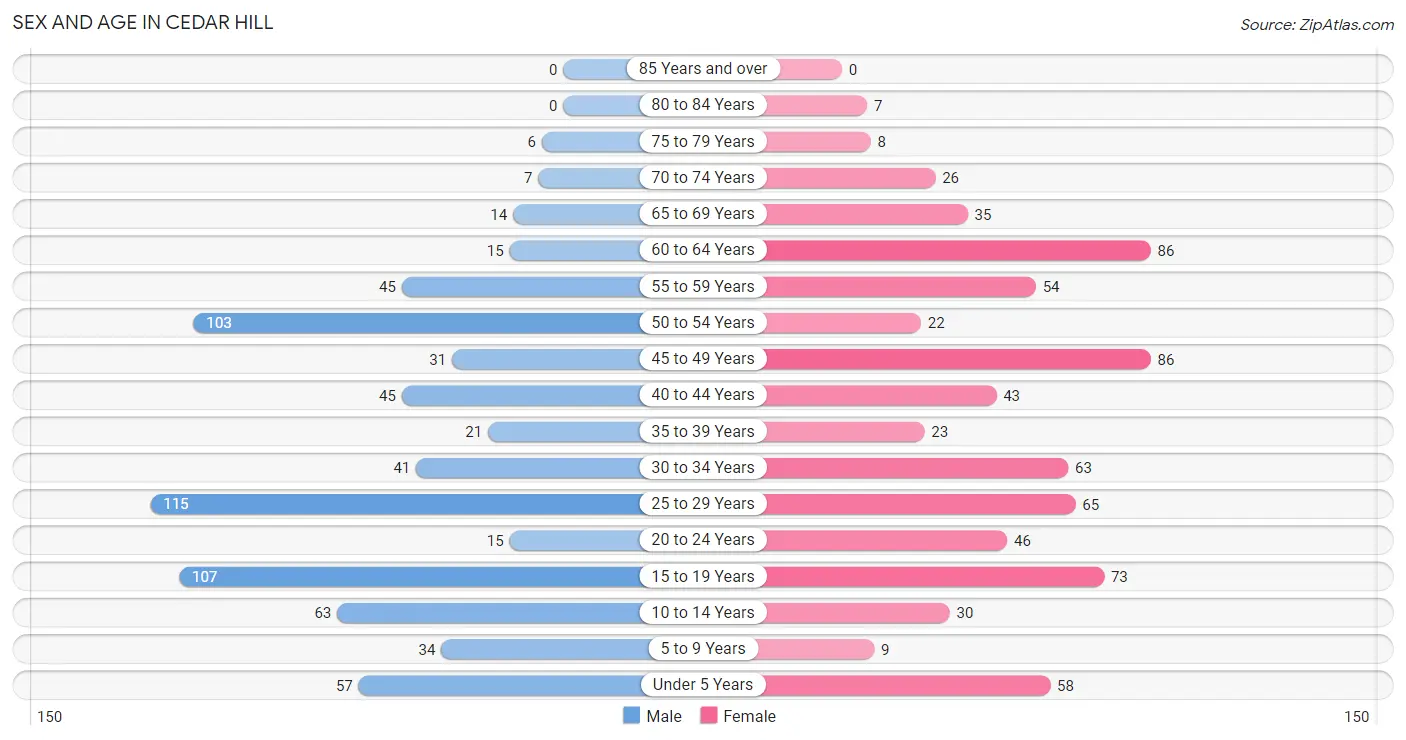
| Age Bracket | Male | Female |
| Under 5 Years | 57 (7.9%) | 58 (7.9%) |
| 5 to 9 Years | 34 (4.7%) | 9 (1.2%) |
| 10 to 14 Years | 63 (8.8%) | 30 (4.1%) |
| 15 to 19 Years | 107 (14.9%) | 73 (10.0%) |
| 20 to 24 Years | 15 (2.1%) | 46 (6.3%) |
| 25 to 29 Years | 115 (16.0%) | 65 (8.9%) |
| 30 to 34 Years | 41 (5.7%) | 63 (8.6%) |
| 35 to 39 Years | 21 (2.9%) | 23 (3.1%) |
| 40 to 44 Years | 45 (6.3%) | 43 (5.9%) |
| 45 to 49 Years | 31 (4.3%) | 86 (11.7%) |
| 50 to 54 Years | 103 (14.3%) | 22 (3.0%) |
| 55 to 59 Years | 45 (6.3%) | 54 (7.4%) |
| 60 to 64 Years | 15 (2.1%) | 86 (11.7%) |
| 65 to 69 Years | 14 (1.9%) | 35 (4.8%) |
| 70 to 74 Years | 7 (1.0%) | 26 (3.5%) |
| 75 to 79 Years | 6 (0.8%) | 8 (1.1%) |
| 80 to 84 Years | 0 (0.0%) | 7 (0.9%) |
| 85 Years and over | 0 (0.0%) | 0 (0.0%) |
| Total | 719 (100.0%) | 734 (100.0%) |
Families and Households in Cedar Hill
Median Family Size in Cedar Hill
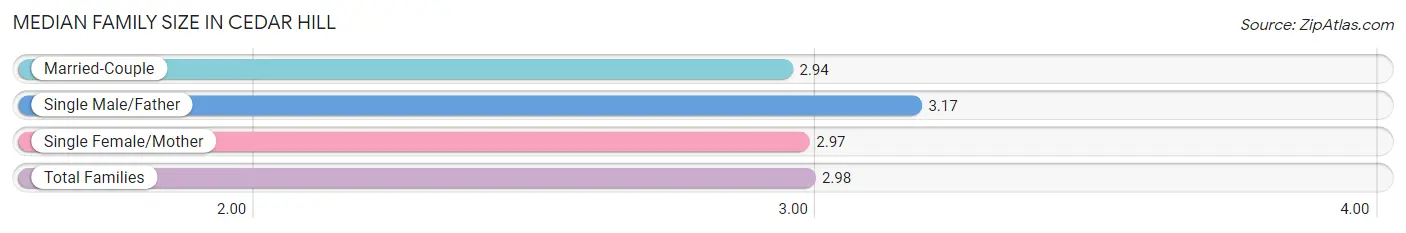
The median family size in Cedar Hill is 2.98 persons per family, with single male/father families (58 | 15.1%) accounting for the largest median family size of 3.17 persons per family. On the other hand, married-couple families (230 | 59.9%) represent the smallest median family size with 2.94 persons per family.
| Family Type | # Families | Family Size |
| Married-Couple | 230 (59.9%) | 2.94 |
| Single Male/Father | 58 (15.1%) | 3.17 |
| Single Female/Mother | 96 (25.0%) | 2.97 |
| Total Families | 384 (100.0%) | 2.98 |
Median Household Size in Cedar Hill
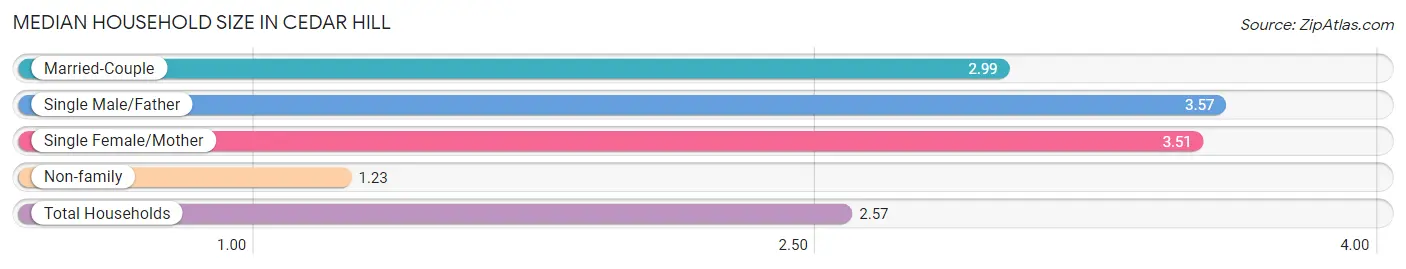
The median household size in Cedar Hill is 2.57 persons per household, with single male/father households (58 | 10.3%) accounting for the largest median household size of 3.57 persons per household. non-family households (181 | 32.0%) represent the smallest median household size with 1.23 persons per household.
| Household Type | # Households | Household Size |
| Married-Couple | 230 (40.7%) | 2.99 |
| Single Male/Father | 58 (10.3%) | 3.57 |
| Single Female/Mother | 96 (17.0%) | 3.51 |
| Non-family | 181 (32.0%) | 1.23 |
| Total Households | 565 (100.0%) | 2.57 |
Household Size by Marriage Status in Cedar Hill
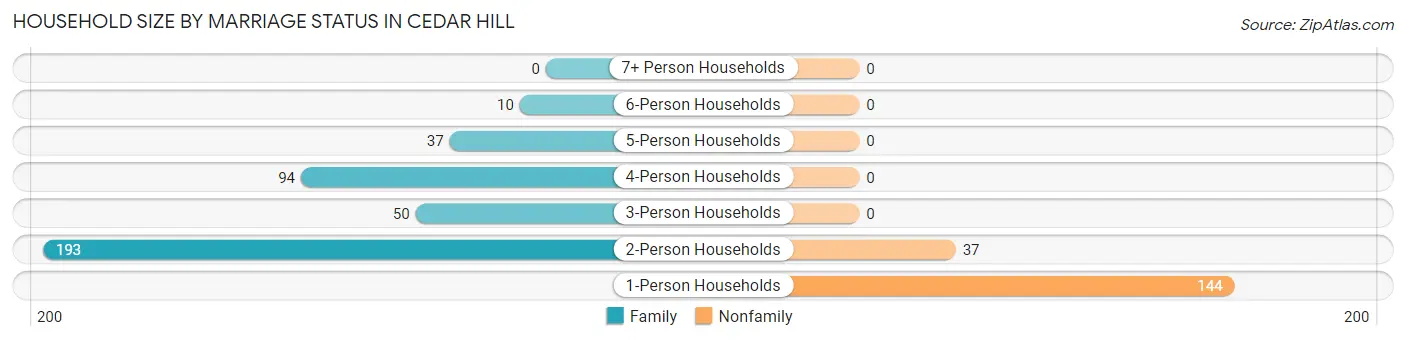
Out of a total of 565 households in Cedar Hill, 384 (68.0%) are family households, while 181 (32.0%) are nonfamily households. The most numerous type of family households are 2-person households, comprising 193, and the most common type of nonfamily households are 1-person households, comprising 144.
| Household Size | Family Households | Nonfamily Households |
| 1-Person Households | - | 144 (25.5%) |
| 2-Person Households | 193 (34.2%) | 37 (6.6%) |
| 3-Person Households | 50 (8.8%) | 0 (0.0%) |
| 4-Person Households | 94 (16.6%) | 0 (0.0%) |
| 5-Person Households | 37 (6.6%) | 0 (0.0%) |
| 6-Person Households | 10 (1.8%) | 0 (0.0%) |
| 7+ Person Households | 0 (0.0%) | 0 (0.0%) |
| Total | 384 (68.0%) | 181 (32.0%) |
Female Fertility in Cedar Hill
Fertility by Age in Cedar Hill
Average fertility rate in Cedar Hill is 148.0 births per 1,000 women. Women in the age bracket of 15 to 19 years have the highest fertility rate with 493.0 births per 1,000 women. Women in the age bracket of 15 to 19 years acount for 61.0% of all women with births.
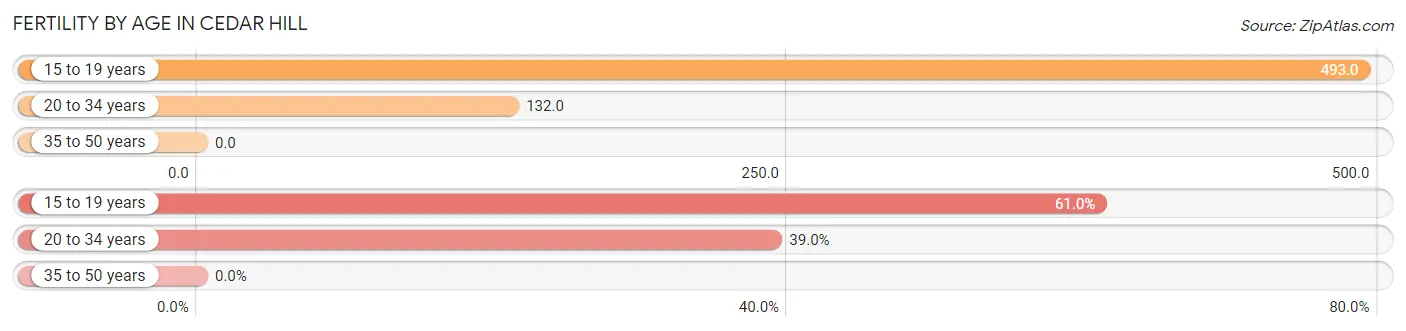
| Age Bracket | Women with Births | Births / 1,000 Women |
| 15 to 19 years | 36 (61.0%) | 493.0 |
| 20 to 34 years | 23 (39.0%) | 132.0 |
| 35 to 50 years | 0 (0.0%) | 0.0 |
| Total | 59 (100.0%) | 148.0 |
Fertility by Age by Marriage Status in Cedar Hill
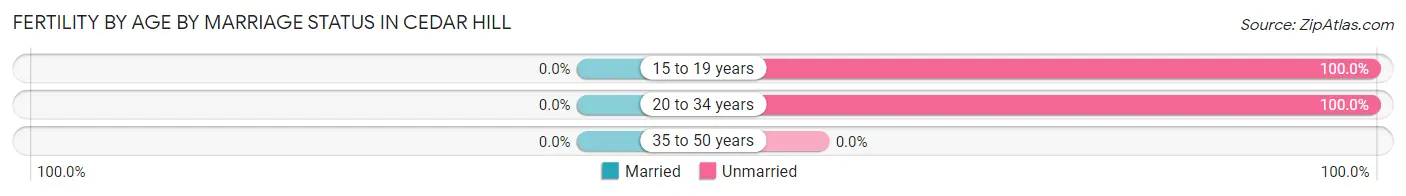
| Age Bracket | Married | Unmarried |
| 15 to 19 years | 0 (0.0%) | 36 (100.0%) |
| 20 to 34 years | 0 (0.0%) | 23 (100.0%) |
| 35 to 50 years | 0 (0.0%) | 0 (0.0%) |
| Total | 0 (0.0%) | 59 (100.0%) |
Fertility by Education in Cedar Hill
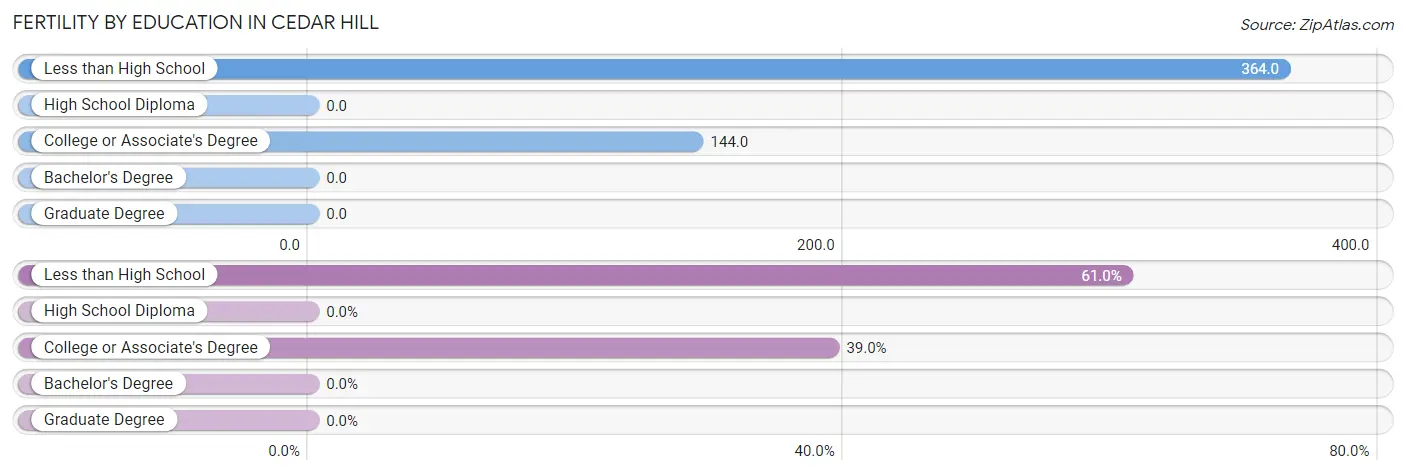
| Educational Attainment | Women with Births | Births / 1,000 Women |
| Less than High School | 36 (61.0%) | 364.0 |
| High School Diploma | 0 (0.0%) | 0.0 |
| College or Associate's Degree | 23 (39.0%) | 144.0 |
| Bachelor's Degree | 0 (0.0%) | 0.0 |
| Graduate Degree | 0 (0.0%) | 0.0 |
| Total | 59 (100.0%) | 148.0 |
Fertility by Education by Marriage Status in Cedar Hill
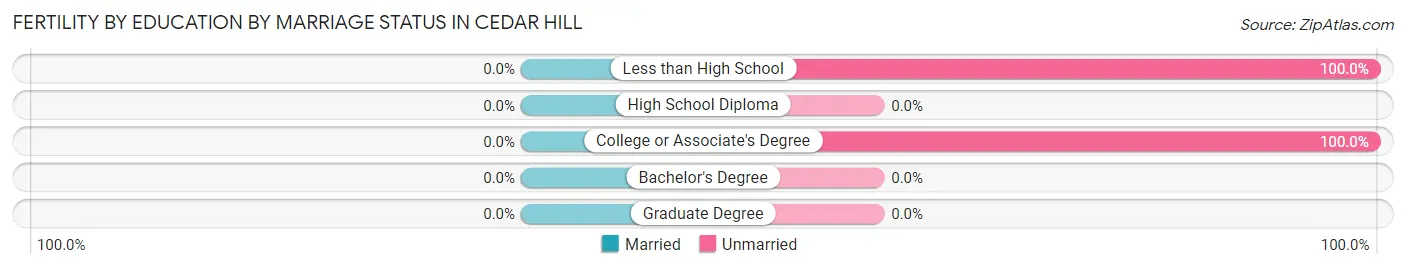
| Educational Attainment | Married | Unmarried |
| Less than High School | 0 (0.0%) | 36 (100.0%) |
| High School Diploma | 0 (0.0%) | 0 (0.0%) |
| College or Associate's Degree | 0 (0.0%) | 23 (100.0%) |
| Bachelor's Degree | 0 (0.0%) | 0 (0.0%) |
| Graduate Degree | 0 (0.0%) | 0 (0.0%) |
| Total | 0 (0.0%) | 59 (100.0%) |
Employment Characteristics in Cedar Hill
Employment by Class of Employer in Cedar Hill
Among the 776 employed individuals in Cedar Hill, private company employees (668 | 86.1%), self-employed (not incorporated) (36 | 4.6%), and not-for-profit organizations (21 | 2.7%) make up the most common classes of employment.
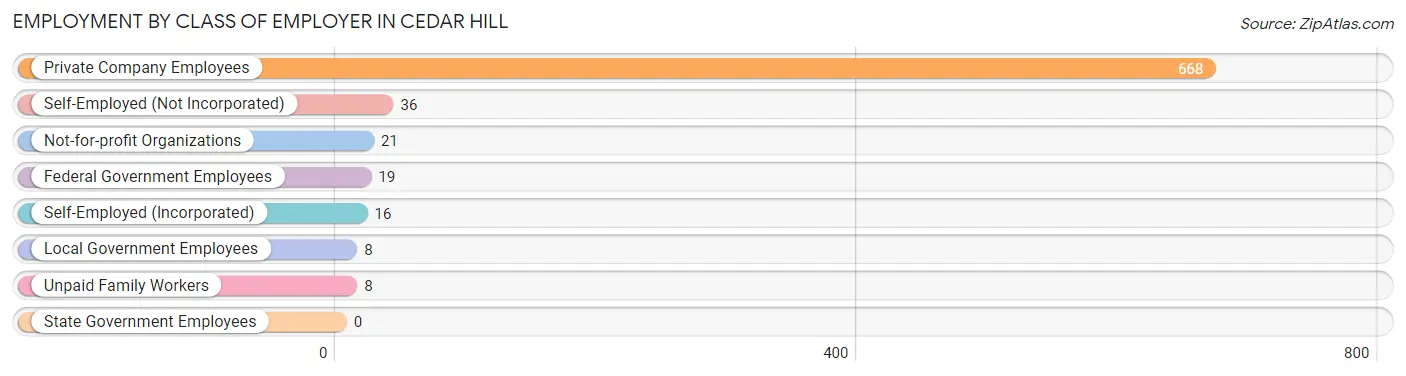
| Employer Class | # Employees | % Employees |
| Private Company Employees | 668 | 86.1% |
| Self-Employed (Incorporated) | 16 | 2.1% |
| Self-Employed (Not Incorporated) | 36 | 4.6% |
| Not-for-profit Organizations | 21 | 2.7% |
| Local Government Employees | 8 | 1.0% |
| State Government Employees | 0 | 0.0% |
| Federal Government Employees | 19 | 2.5% |
| Unpaid Family Workers | 8 | 1.0% |
| Total | 776 | 100.0% |
Employment Status by Age in Cedar Hill
According to the labor force statistics for Cedar Hill, out of the total population over 16 years of age (1,180), 69.5% or 820 individuals are in the labor force, with 3.8% or 31 of them unemployed. The age group with the highest labor force participation rate is 25 to 29 years, with 100.0% or 180 individuals in the labor force. Within the labor force, the 65 to 74 years age range has the highest percentage of unemployed individuals, with 31.0% or 9 of them being unemployed.
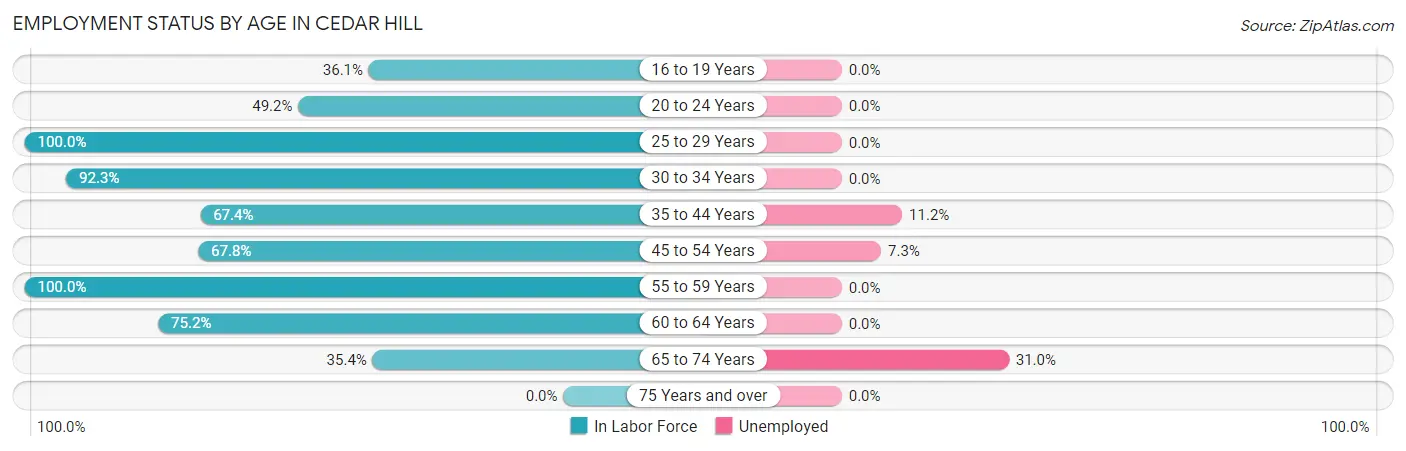
| Age Bracket | In Labor Force | Unemployed |
| 16 to 19 Years | 57 (36.1%) | 0 (0.0%) |
| 20 to 24 Years | 30 (49.2%) | 0 (0.0%) |
| 25 to 29 Years | 180 (100.0%) | 0 (0.0%) |
| 30 to 34 Years | 96 (92.3%) | 0 (0.0%) |
| 35 to 44 Years | 89 (67.4%) | 10 (11.2%) |
| 45 to 54 Years | 164 (67.8%) | 12 (7.3%) |
| 55 to 59 Years | 99 (100.0%) | 0 (0.0%) |
| 60 to 64 Years | 76 (75.2%) | 0 (0.0%) |
| 65 to 74 Years | 29 (35.4%) | 9 (31.0%) |
| 75 Years and over | 0 (0.0%) | 0 (0.0%) |
| Total | 820 (69.5%) | 31 (3.8%) |
Employment Status by Educational Attainment in Cedar Hill
According to labor force statistics for Cedar Hill, 82.1% of individuals (704) out of the total population between 25 and 64 years of age (858) are in the labor force, with 3.1% or 22 of them being unemployed. The group with the highest labor force participation rate are those with the educational attainment of bachelor's degree or higher, with 100.0% or 164 individuals in the labor force. Within the labor force, individuals with high school diploma education have the highest percentage of unemployment, with 6.7% or 12 of them being unemployed.
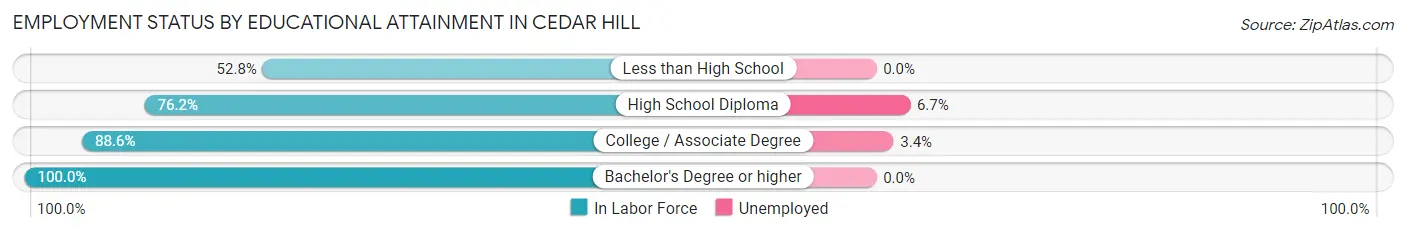
| Educational Attainment | In Labor Force | Unemployed |
| Less than High School | 67 (52.8%) | 0 (0.0%) |
| High School Diploma | 179 (76.2%) | 16 (6.7%) |
| College / Associate Degree | 294 (88.6%) | 11 (3.4%) |
| Bachelor's Degree or higher | 164 (100.0%) | 0 (0.0%) |
| Total | 704 (82.1%) | 27 (3.1%) |
Employment Occupations by Sex in Cedar Hill
Management, Business, Science and Arts Occupations
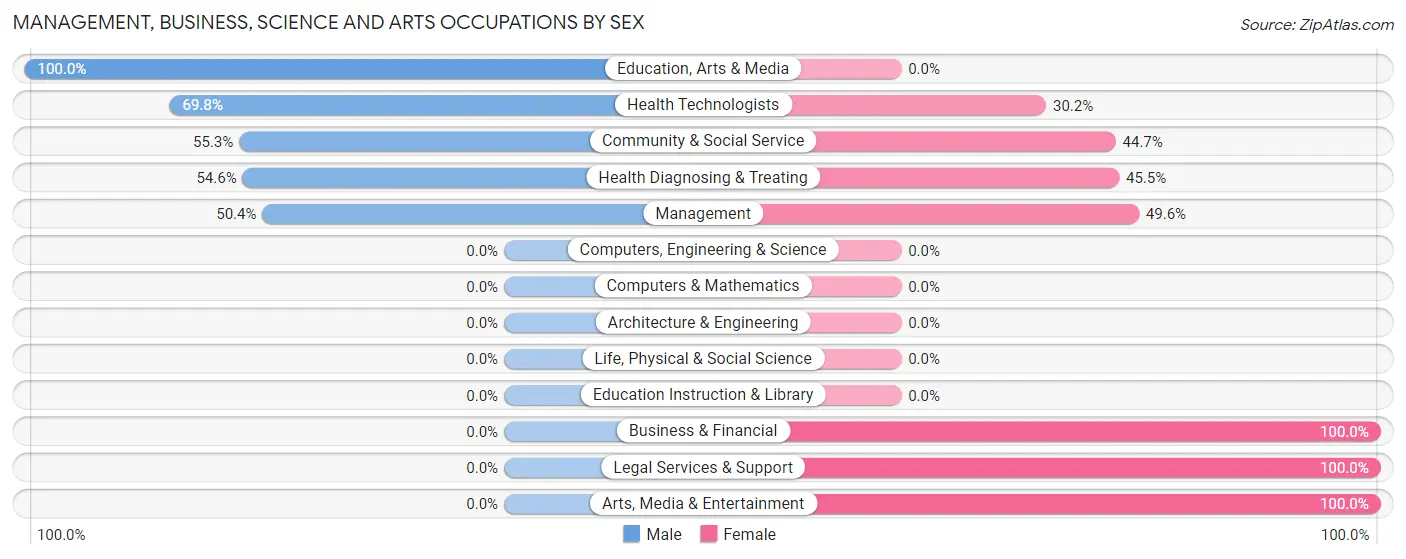
The most common Management, Business, Science and Arts occupations in Cedar Hill are Management (121 | 15.3%), Community & Social Service (76 | 9.6%), Health Diagnosing & Treating (55 | 7.0%), Business & Financial (47 | 6.0%), and Health Technologists (43 | 5.4%).
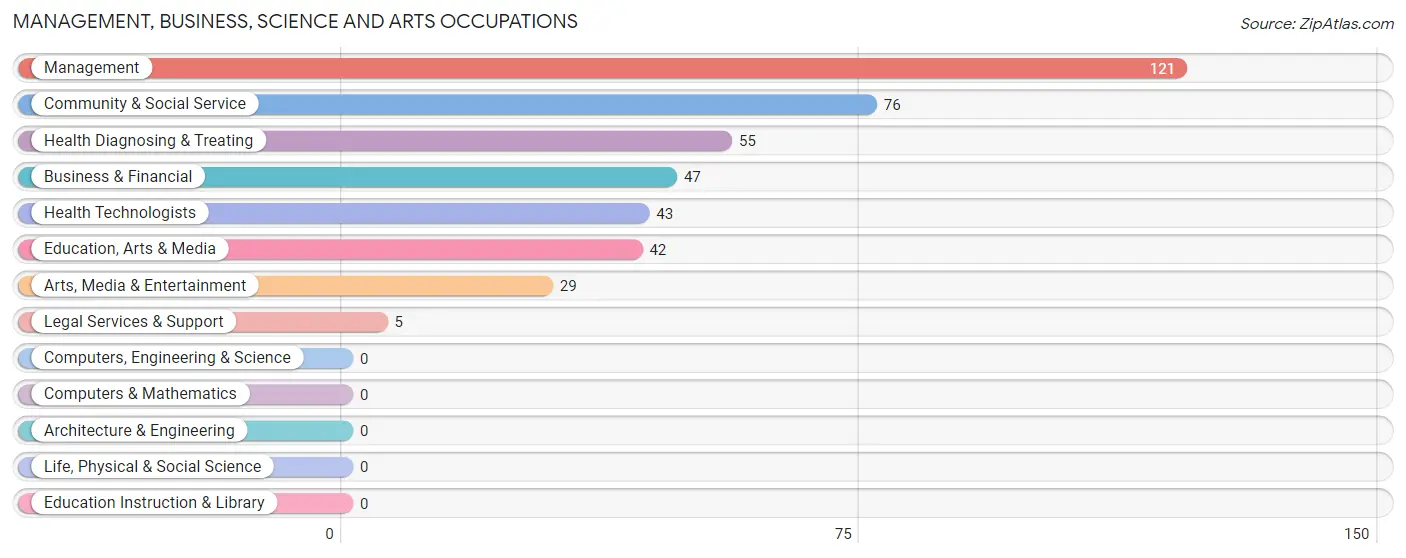
Management, Business, Science and Arts Occupations by Sex
Within the Management, Business, Science and Arts occupations in Cedar Hill, the most male-oriented occupations are Education, Arts & Media (100.0%), Health Technologists (69.8%), and Community & Social Service (55.3%), while the most female-oriented occupations are Business & Financial (100.0%), Legal Services & Support (100.0%), and Arts, Media & Entertainment (100.0%).
| Occupation | Male | Female |
| Management | 61 (50.4%) | 60 (49.6%) |
| Business & Financial | 0 (0.0%) | 47 (100.0%) |
| Computers, Engineering & Science | 0 (0.0%) | 0 (0.0%) |
| Computers & Mathematics | 0 (0.0%) | 0 (0.0%) |
| Architecture & Engineering | 0 (0.0%) | 0 (0.0%) |
| Life, Physical & Social Science | 0 (0.0%) | 0 (0.0%) |
| Community & Social Service | 42 (55.3%) | 34 (44.7%) |
| Education, Arts & Media | 42 (100.0%) | 0 (0.0%) |
| Legal Services & Support | 0 (0.0%) | 5 (100.0%) |
| Education Instruction & Library | 0 (0.0%) | 0 (0.0%) |
| Arts, Media & Entertainment | 0 (0.0%) | 29 (100.0%) |
| Health Diagnosing & Treating | 30 (54.5%) | 25 (45.5%) |
| Health Technologists | 30 (69.8%) | 13 (30.2%) |
| Total (Category) | 133 (44.5%) | 166 (55.5%) |
| Total (Overall) | 407 (51.6%) | 382 (48.4%) |
Services Occupations
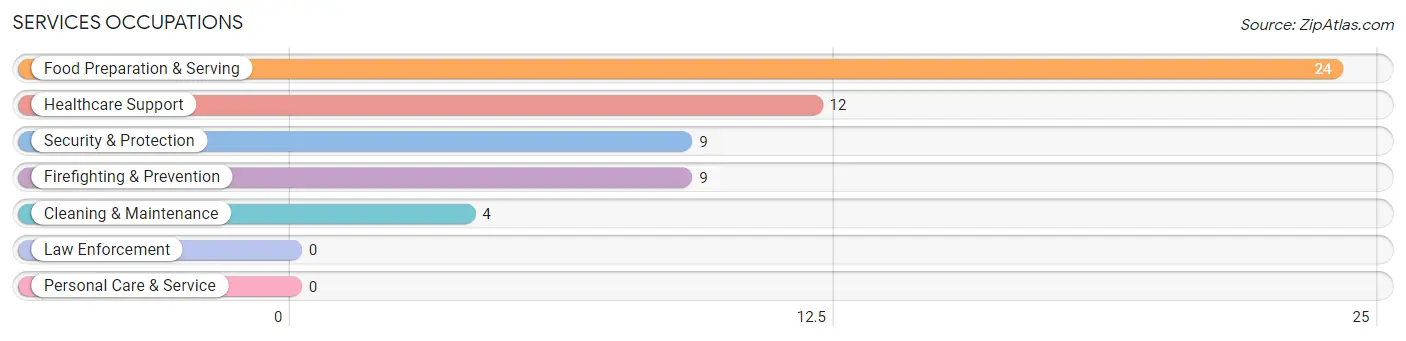
The most common Services occupations in Cedar Hill are Food Preparation & Serving (24 | 3.0%), Healthcare Support (12 | 1.5%), Security & Protection (9 | 1.1%), Firefighting & Prevention (9 | 1.1%), and Cleaning & Maintenance (4 | 0.5%).
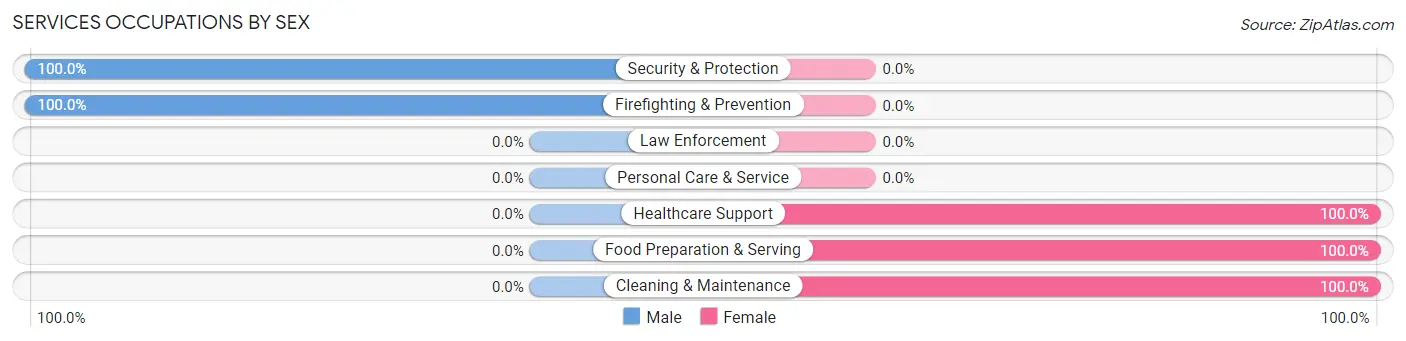
Services Occupations by Sex
Within the Services occupations in Cedar Hill, the most male-oriented occupations are Security & Protection (100.0%), and Firefighting & Prevention (100.0%), while the most female-oriented occupations are Healthcare Support (100.0%), Food Preparation & Serving (100.0%), and Cleaning & Maintenance (100.0%).
| Occupation | Male | Female |
| Healthcare Support | 0 (0.0%) | 12 (100.0%) |
| Security & Protection | 9 (100.0%) | 0 (0.0%) |
| Firefighting & Prevention | 9 (100.0%) | 0 (0.0%) |
| Law Enforcement | 0 (0.0%) | 0 (0.0%) |
| Food Preparation & Serving | 0 (0.0%) | 24 (100.0%) |
| Cleaning & Maintenance | 0 (0.0%) | 4 (100.0%) |
| Personal Care & Service | 0 (0.0%) | 0 (0.0%) |
| Total (Category) | 9 (18.4%) | 40 (81.6%) |
| Total (Overall) | 407 (51.6%) | 382 (48.4%) |
Sales and Office Occupations
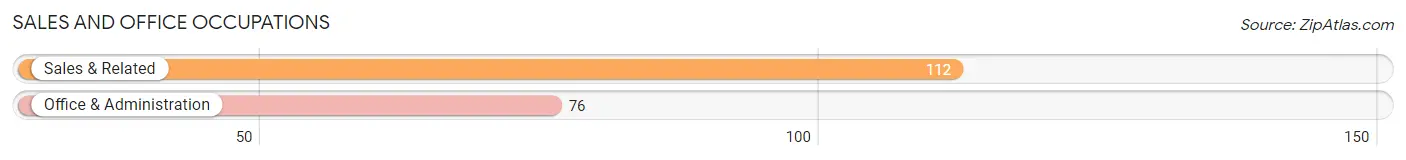
The most common Sales and Office occupations in Cedar Hill are Sales & Related (112 | 14.2%), and Office & Administration (76 | 9.6%).
Sales and Office Occupations by Sex
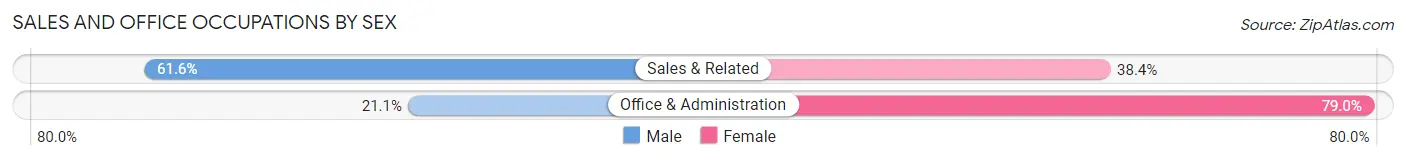
| Occupation | Male | Female |
| Sales & Related | 69 (61.6%) | 43 (38.4%) |
| Office & Administration | 16 (21.0%) | 60 (78.9%) |
| Total (Category) | 85 (45.2%) | 103 (54.8%) |
| Total (Overall) | 407 (51.6%) | 382 (48.4%) |
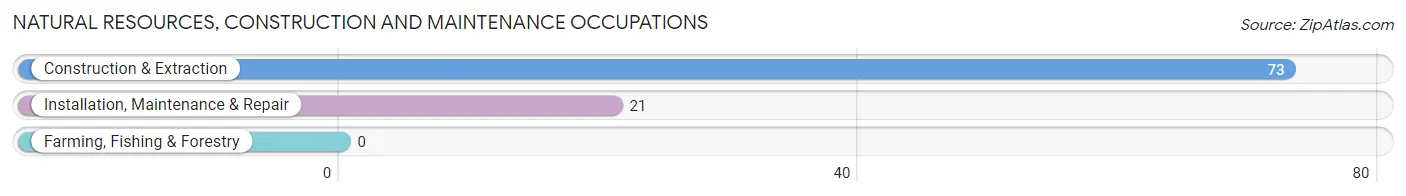
Natural Resources, Construction and Maintenance Occupations
The most common Natural Resources, Construction and Maintenance occupations in Cedar Hill are Construction & Extraction (73 | 9.2%), and Installation, Maintenance & Repair (21 | 2.7%).
Natural Resources, Construction and Maintenance Occupations by Sex
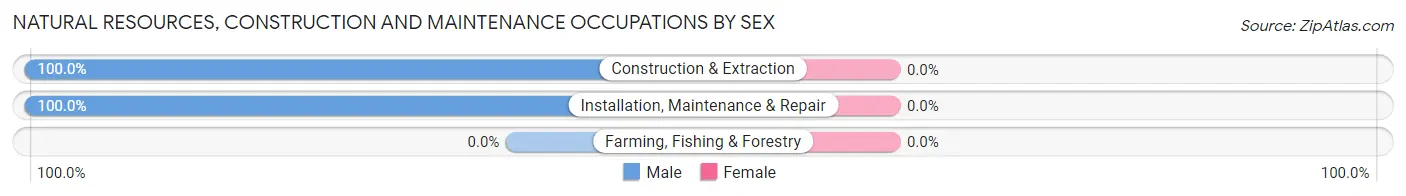
| Occupation | Male | Female |
| Farming, Fishing & Forestry | 0 (0.0%) | 0 (0.0%) |
| Construction & Extraction | 73 (100.0%) | 0 (0.0%) |
| Installation, Maintenance & Repair | 21 (100.0%) | 0 (0.0%) |
| Total (Category) | 94 (100.0%) | 0 (0.0%) |
| Total (Overall) | 407 (51.6%) | 382 (48.4%) |
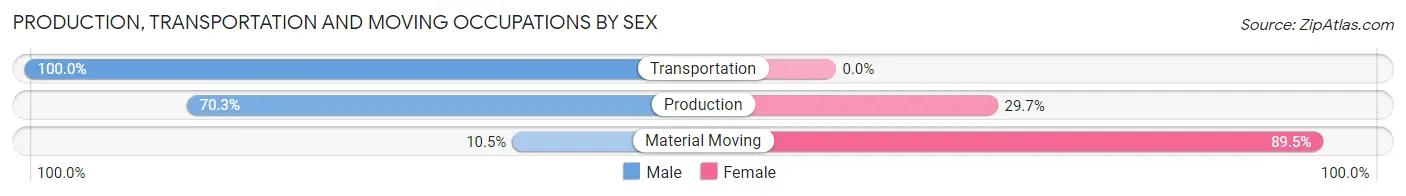
Production, Transportation and Moving Occupations
The most common Production, Transportation and Moving occupations in Cedar Hill are Production (74 | 9.4%), Material Moving (57 | 7.2%), and Transportation (28 | 3.5%).
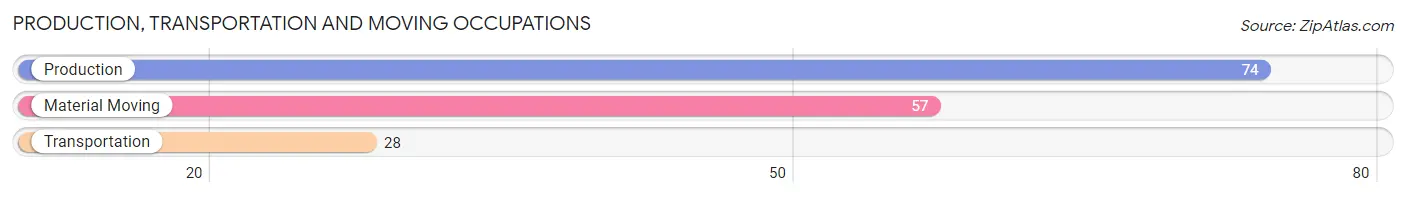
Production, Transportation and Moving Occupations by Sex
| Occupation | Male | Female |
| Production | 52 (70.3%) | 22 (29.7%) |
| Transportation | 28 (100.0%) | 0 (0.0%) |
| Material Moving | 6 (10.5%) | 51 (89.5%) |
| Total (Category) | 86 (54.1%) | 73 (45.9%) |
| Total (Overall) | 407 (51.6%) | 382 (48.4%) |
Employment Industries by Sex in Cedar Hill
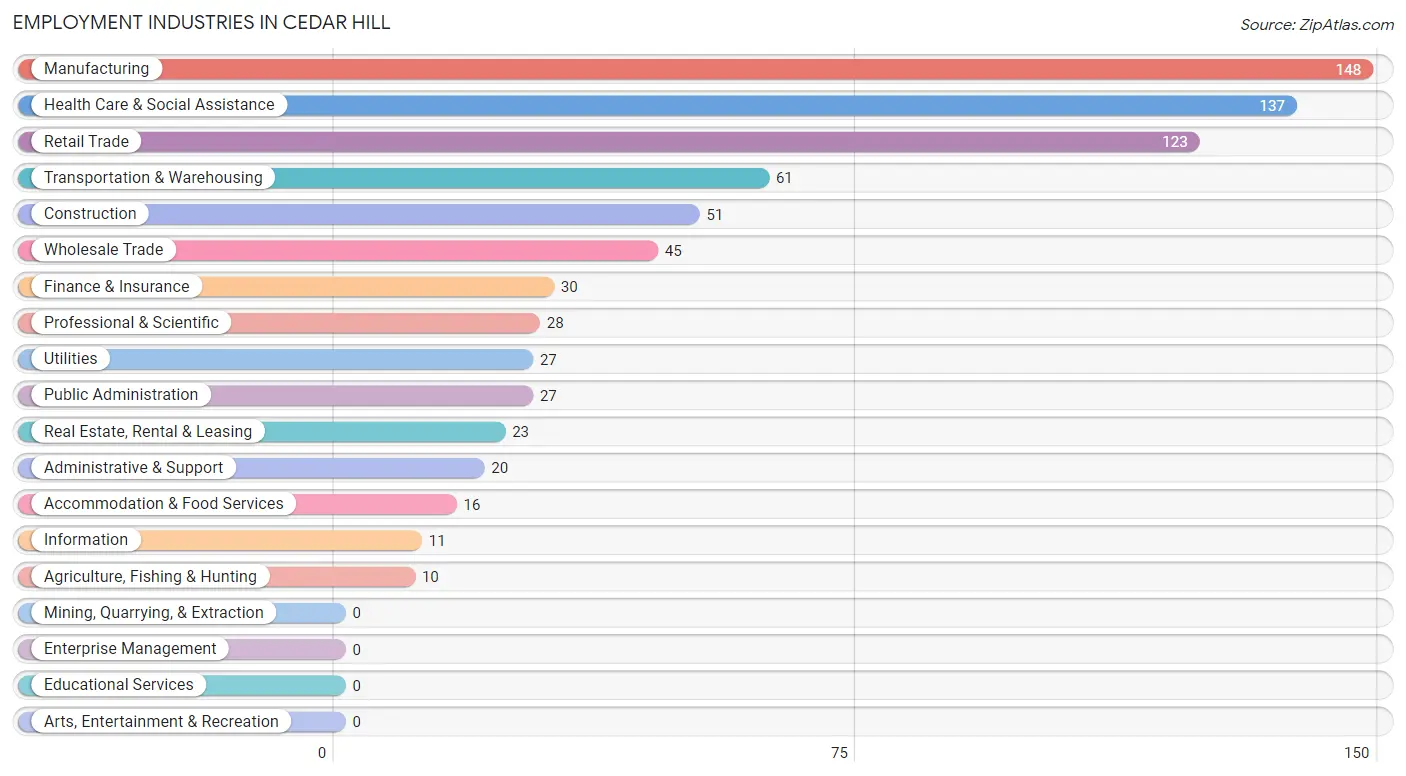
Employment Industries in Cedar Hill
The major employment industries in Cedar Hill include Manufacturing (148 | 18.8%), Health Care & Social Assistance (137 | 17.4%), Retail Trade (123 | 15.6%), Transportation & Warehousing (61 | 7.7%), and Construction (51 | 6.5%).
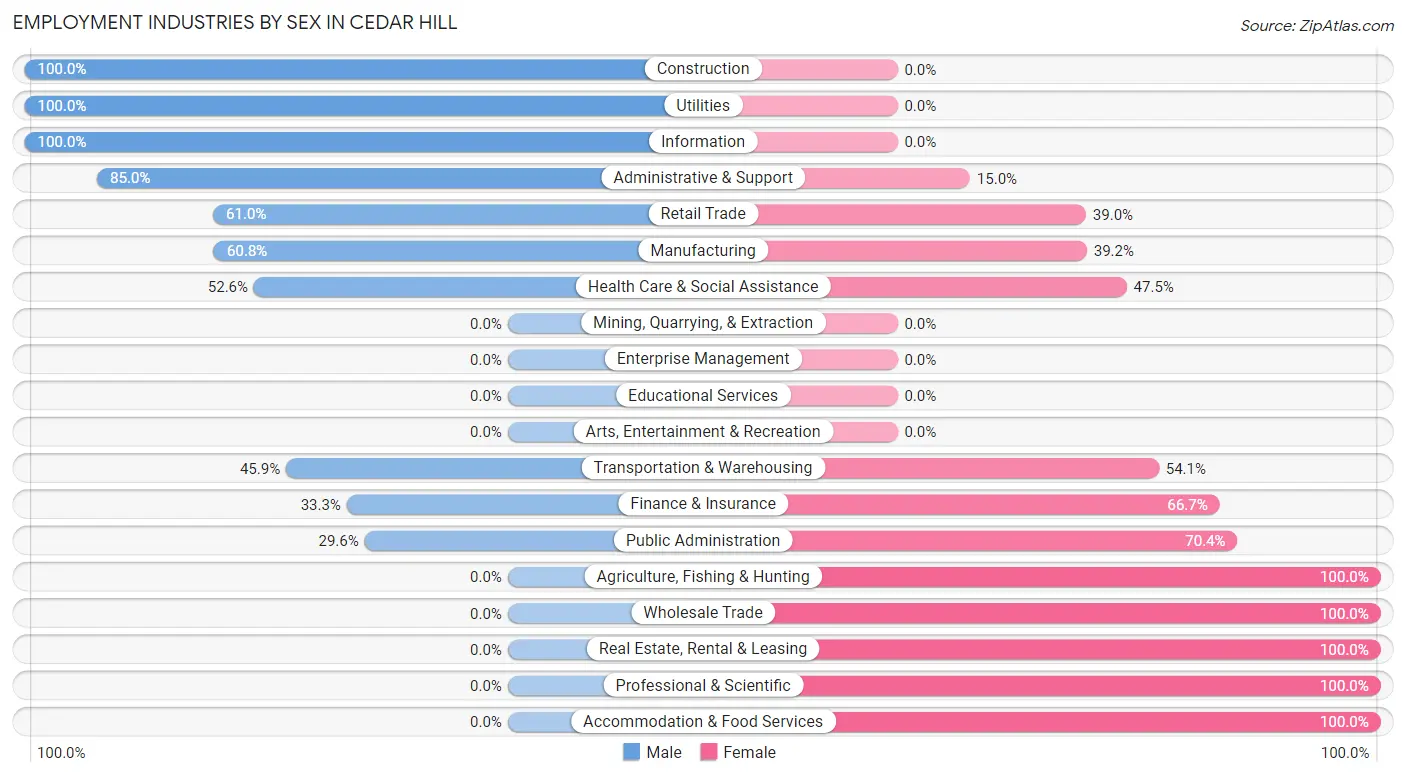
Employment Industries by Sex in Cedar Hill
The Cedar Hill industries that see more men than women are Construction (100.0%), Utilities (100.0%), and Information (100.0%), whereas the industries that tend to have a higher number of women are Agriculture, Fishing & Hunting (100.0%), Wholesale Trade (100.0%), and Real Estate, Rental & Leasing (100.0%).
| Industry | Male | Female |
| Agriculture, Fishing & Hunting | 0 (0.0%) | 10 (100.0%) |
| Mining, Quarrying, & Extraction | 0 (0.0%) | 0 (0.0%) |
| Construction | 51 (100.0%) | 0 (0.0%) |
| Manufacturing | 90 (60.8%) | 58 (39.2%) |
| Wholesale Trade | 0 (0.0%) | 45 (100.0%) |
| Retail Trade | 75 (61.0%) | 48 (39.0%) |
| Transportation & Warehousing | 28 (45.9%) | 33 (54.1%) |
| Utilities | 27 (100.0%) | 0 (0.0%) |
| Information | 11 (100.0%) | 0 (0.0%) |
| Finance & Insurance | 10 (33.3%) | 20 (66.7%) |
| Real Estate, Rental & Leasing | 0 (0.0%) | 23 (100.0%) |
| Professional & Scientific | 0 (0.0%) | 28 (100.0%) |
| Enterprise Management | 0 (0.0%) | 0 (0.0%) |
| Administrative & Support | 17 (85.0%) | 3 (15.0%) |
| Educational Services | 0 (0.0%) | 0 (0.0%) |
| Health Care & Social Assistance | 72 (52.5%) | 65 (47.4%) |
| Arts, Entertainment & Recreation | 0 (0.0%) | 0 (0.0%) |
| Accommodation & Food Services | 0 (0.0%) | 16 (100.0%) |
| Public Administration | 8 (29.6%) | 19 (70.4%) |
| Total | 407 (51.6%) | 382 (48.4%) |
Education in Cedar Hill
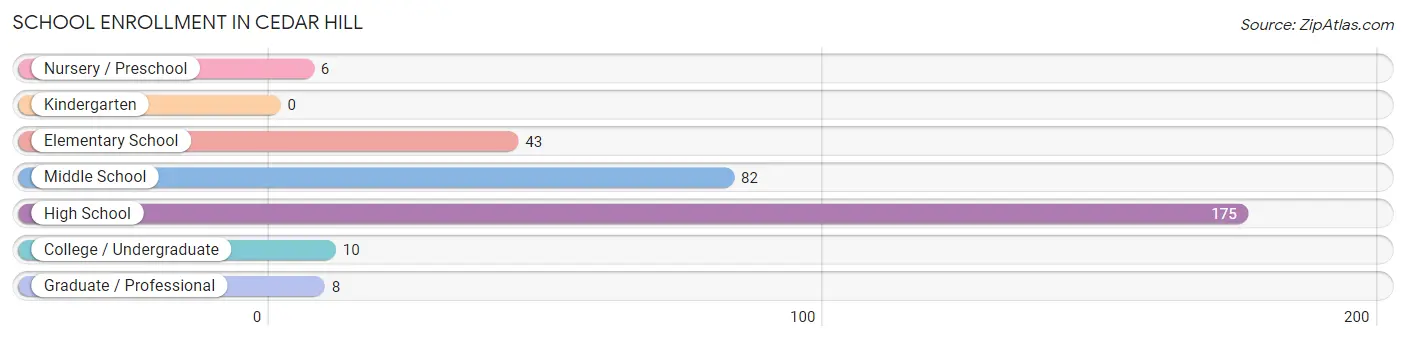
School Enrollment in Cedar Hill
The most common levels of schooling among the 324 students in Cedar Hill are high school (175 | 54.0%), middle school (82 | 25.3%), and elementary school (43 | 13.3%).
| School Level | # Students | % Students |
| Nursery / Preschool | 6 | 1.8% |
| Kindergarten | 0 | 0.0% |
| Elementary School | 43 | 13.3% |
| Middle School | 82 | 25.3% |
| High School | 175 | 54.0% |
| College / Undergraduate | 10 | 3.1% |
| Graduate / Professional | 8 | 2.5% |
| Total | 324 | 100.0% |
School Enrollment by Age by Funding Source in Cedar Hill
Out of a total of 324 students who are enrolled in schools in Cedar Hill, 10 (3.1%) attend a private institution, while the remaining 314 (96.9%) are enrolled in public schools. The age group of 25 to 34 year olds has the highest likelihood of being enrolled in private schools, with 10 (100.0% in the age bracket) enrolled. Conversely, the age group of 3 to 4 year olds has the lowest likelihood of being enrolled in a private school, with 6 (100.0% in the age bracket) attending a public institution.
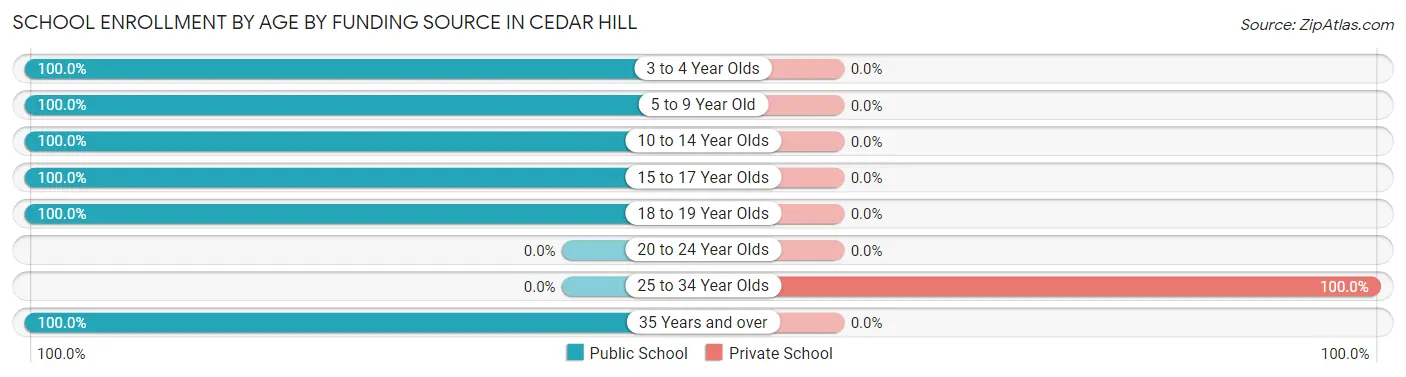
| Age Bracket | Public School | Private School |
| 3 to 4 Year Olds | 6 (100.0%) | 0 (0.0%) |
| 5 to 9 Year Old | 43 (100.0%) | 0 (0.0%) |
| 10 to 14 Year Olds | 93 (100.0%) | 0 (0.0%) |
| 15 to 17 Year Olds | 148 (100.0%) | 0 (0.0%) |
| 18 to 19 Year Olds | 16 (100.0%) | 0 (0.0%) |
| 20 to 24 Year Olds | 0 (0.0%) | 0 (0.0%) |
| 25 to 34 Year Olds | 0 (0.0%) | 10 (100.0%) |
| 35 Years and over | 8 (100.0%) | 0 (0.0%) |
| Total | 314 (96.9%) | 10 (3.1%) |
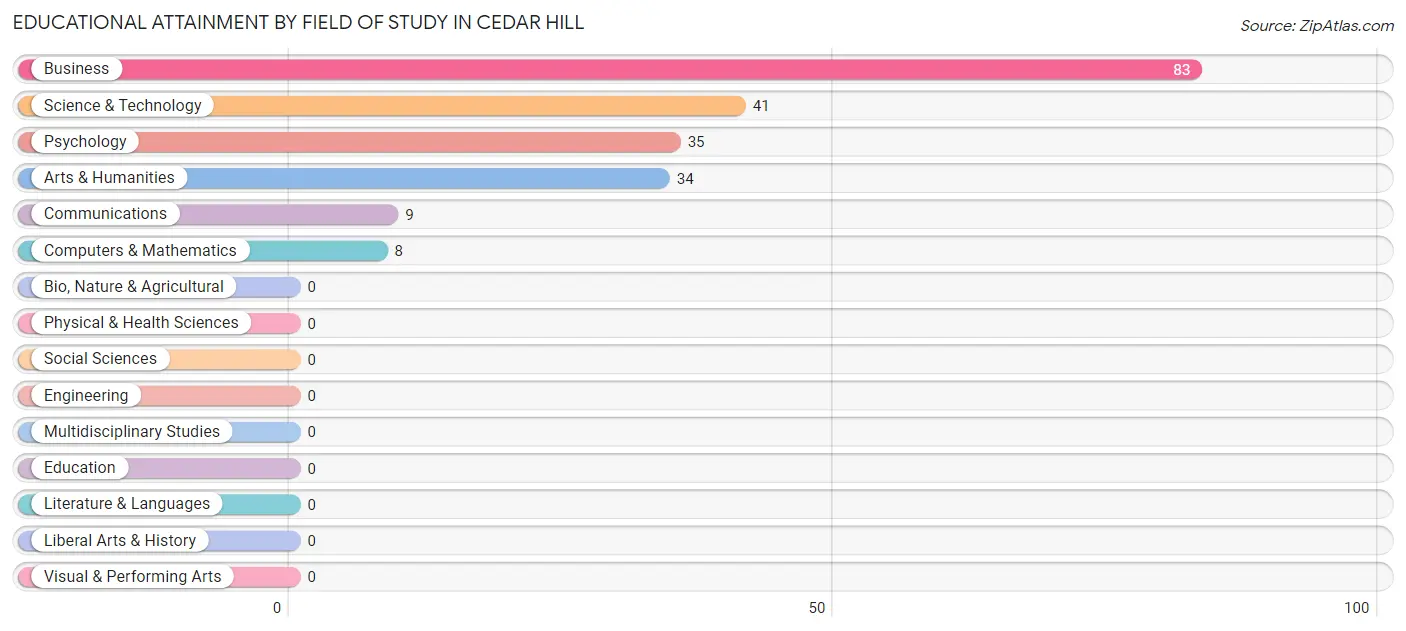
Educational Attainment by Field of Study in Cedar Hill
Business (83 | 39.5%), science & technology (41 | 19.5%), psychology (35 | 16.7%), arts & humanities (34 | 16.2%), and communications (9 | 4.3%) are the most common fields of study among 210 individuals in Cedar Hill who have obtained a bachelor's degree or higher.
| Field of Study | # Graduates | % Graduates |
| Computers & Mathematics | 8 | 3.8% |
| Bio, Nature & Agricultural | 0 | 0.0% |
| Physical & Health Sciences | 0 | 0.0% |
| Psychology | 35 | 16.7% |
| Social Sciences | 0 | 0.0% |
| Engineering | 0 | 0.0% |
| Multidisciplinary Studies | 0 | 0.0% |
| Science & Technology | 41 | 19.5% |
| Business | 83 | 39.5% |
| Education | 0 | 0.0% |
| Literature & Languages | 0 | 0.0% |
| Liberal Arts & History | 0 | 0.0% |
| Visual & Performing Arts | 0 | 0.0% |
| Communications | 9 | 4.3% |
| Arts & Humanities | 34 | 16.2% |
| Total | 210 | 100.0% |
Transportation & Commute in Cedar Hill
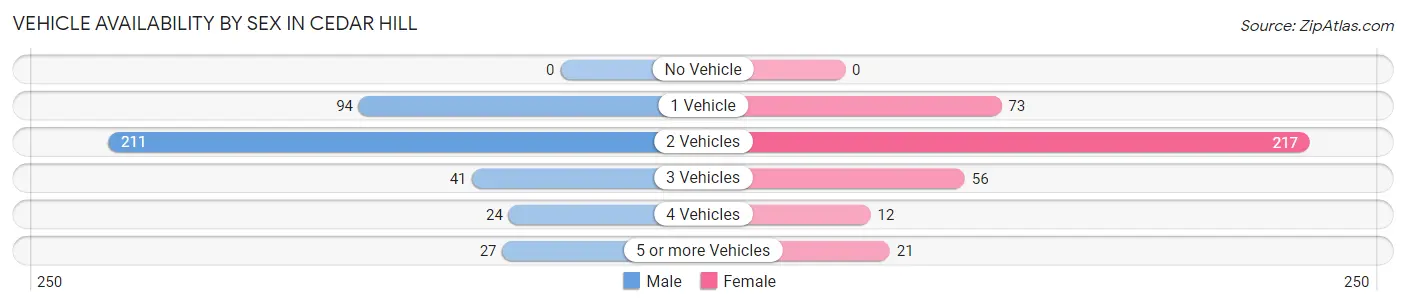
Vehicle Availability by Sex in Cedar Hill
The most prevalent vehicle ownership categories in Cedar Hill are males with 2 vehicles (211, accounting for 53.1%) and females with 2 vehicles (217, making up 55.7%).
| Vehicles Available | Male | Female |
| No Vehicle | 0 (0.0%) | 0 (0.0%) |
| 1 Vehicle | 94 (23.7%) | 73 (19.3%) |
| 2 Vehicles | 211 (53.1%) | 217 (57.3%) |
| 3 Vehicles | 41 (10.3%) | 56 (14.8%) |
| 4 Vehicles | 24 (6.0%) | 12 (3.2%) |
| 5 or more Vehicles | 27 (6.8%) | 21 (5.5%) |
| Total | 397 (100.0%) | 379 (100.0%) |
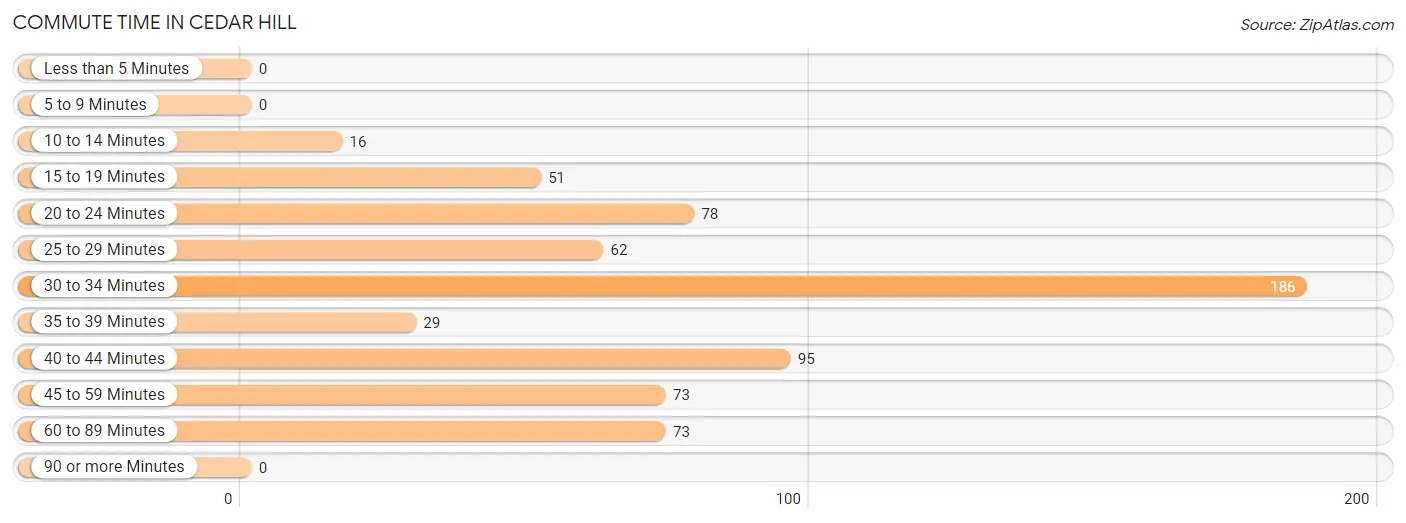
Commute Time in Cedar Hill
The most frequently occuring commute durations in Cedar Hill are 30 to 34 minutes (186 commuters, 28.1%), 40 to 44 minutes (95 commuters, 14.3%), and 20 to 24 minutes (78 commuters, 11.8%).
| Commute Time | # Commuters | % Commuters |
| Less than 5 Minutes | 0 | 0.0% |
| 5 to 9 Minutes | 0 | 0.0% |
| 10 to 14 Minutes | 16 | 2.4% |
| 15 to 19 Minutes | 51 | 7.7% |
| 20 to 24 Minutes | 78 | 11.8% |
| 25 to 29 Minutes | 62 | 9.3% |
| 30 to 34 Minutes | 186 | 28.1% |
| 35 to 39 Minutes | 29 | 4.4% |
| 40 to 44 Minutes | 95 | 14.3% |
| 45 to 59 Minutes | 73 | 11.0% |
| 60 to 89 Minutes | 73 | 11.0% |
| 90 or more Minutes | 0 | 0.0% |
Commute Time by Sex in Cedar Hill
The most common commute times in Cedar Hill are 30 to 34 minutes (107 commuters, 27.7%) for males and 30 to 34 minutes (79 commuters, 28.6%) for females.
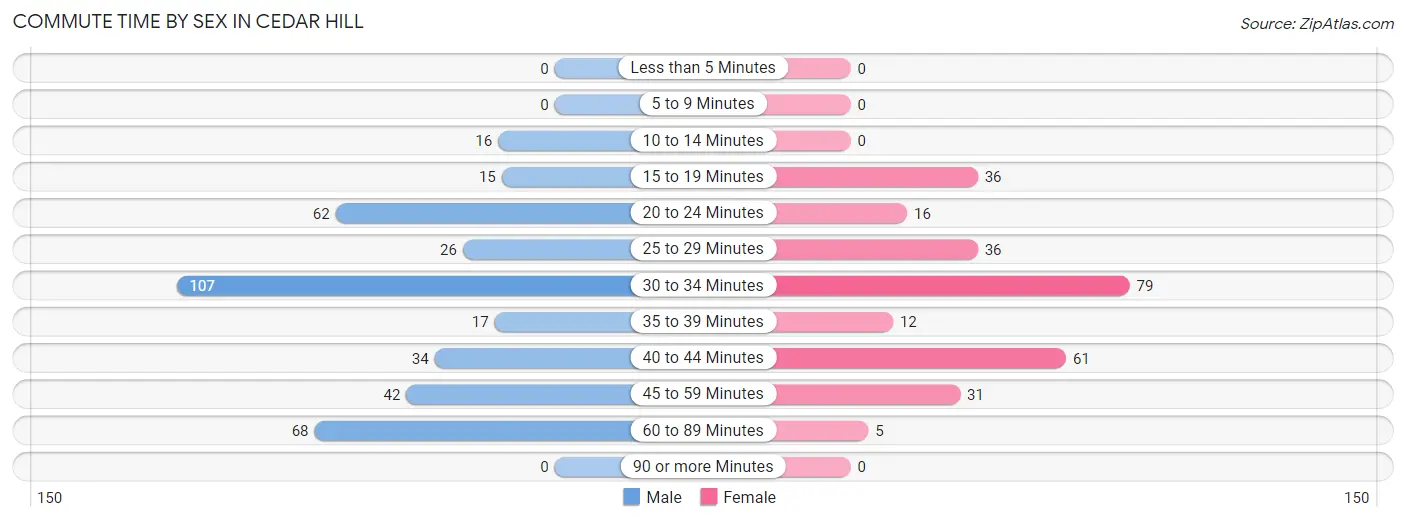
| Commute Time | Male | Female |
| Less than 5 Minutes | 0 (0.0%) | 0 (0.0%) |
| 5 to 9 Minutes | 0 (0.0%) | 0 (0.0%) |
| 10 to 14 Minutes | 16 (4.1%) | 0 (0.0%) |
| 15 to 19 Minutes | 15 (3.9%) | 36 (13.0%) |
| 20 to 24 Minutes | 62 (16.0%) | 16 (5.8%) |
| 25 to 29 Minutes | 26 (6.7%) | 36 (13.0%) |
| 30 to 34 Minutes | 107 (27.7%) | 79 (28.6%) |
| 35 to 39 Minutes | 17 (4.4%) | 12 (4.3%) |
| 40 to 44 Minutes | 34 (8.8%) | 61 (22.1%) |
| 45 to 59 Minutes | 42 (10.8%) | 31 (11.2%) |
| 60 to 89 Minutes | 68 (17.6%) | 5 (1.8%) |
| 90 or more Minutes | 0 (0.0%) | 0 (0.0%) |
Time of Departure to Work by Sex in Cedar Hill
The most frequent times of departure to work in Cedar Hill are 7:00 AM to 7:29 AM (94, 24.3%) for males and 7:00 AM to 7:29 AM (57, 20.6%) for females.
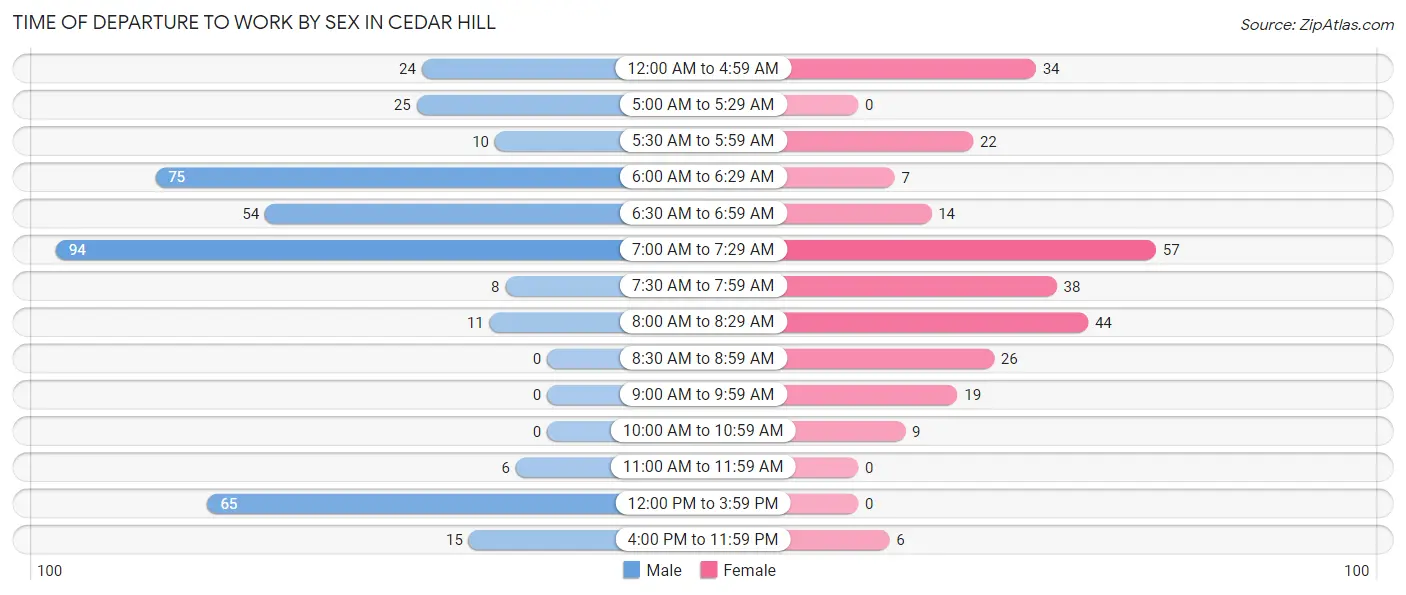
| Time of Departure | Male | Female |
| 12:00 AM to 4:59 AM | 24 (6.2%) | 34 (12.3%) |
| 5:00 AM to 5:29 AM | 25 (6.5%) | 0 (0.0%) |
| 5:30 AM to 5:59 AM | 10 (2.6%) | 22 (8.0%) |
| 6:00 AM to 6:29 AM | 75 (19.4%) | 7 (2.5%) |
| 6:30 AM to 6:59 AM | 54 (14.0%) | 14 (5.1%) |
| 7:00 AM to 7:29 AM | 94 (24.3%) | 57 (20.6%) |
| 7:30 AM to 7:59 AM | 8 (2.1%) | 38 (13.8%) |
| 8:00 AM to 8:29 AM | 11 (2.8%) | 44 (15.9%) |
| 8:30 AM to 8:59 AM | 0 (0.0%) | 26 (9.4%) |
| 9:00 AM to 9:59 AM | 0 (0.0%) | 19 (6.9%) |
| 10:00 AM to 10:59 AM | 0 (0.0%) | 9 (3.3%) |
| 11:00 AM to 11:59 AM | 6 (1.5%) | 0 (0.0%) |
| 12:00 PM to 3:59 PM | 65 (16.8%) | 0 (0.0%) |
| 4:00 PM to 11:59 PM | 15 (3.9%) | 6 (2.2%) |
| Total | 387 (100.0%) | 276 (100.0%) |
Housing Occupancy in Cedar Hill
Occupancy by Ownership in Cedar Hill
Of the total 565 dwellings in Cedar Hill, owner-occupied units account for 407 (72.0%), while renter-occupied units make up 158 (28.0%).
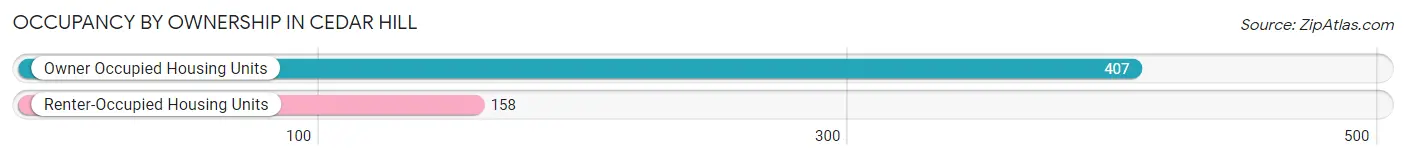
| Occupancy | # Housing Units | % Housing Units |
| Owner Occupied Housing Units | 407 | 72.0% |
| Renter-Occupied Housing Units | 158 | 28.0% |
| Total Occupied Housing Units | 565 | 100.0% |
Occupancy by Household Size in Cedar Hill
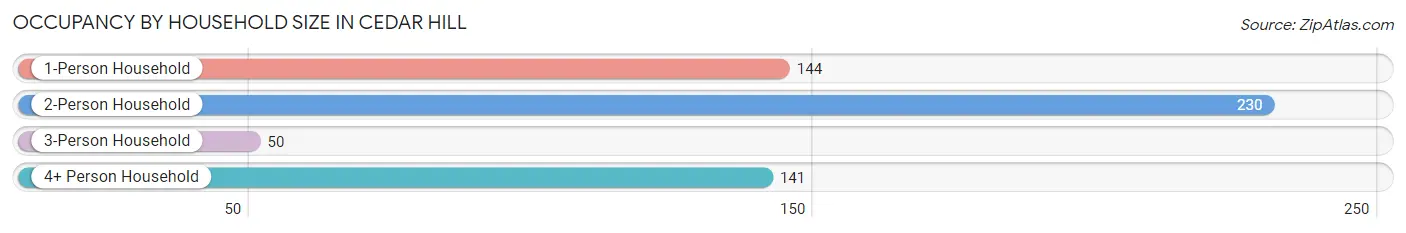
| Household Size | # Housing Units | % Housing Units |
| 1-Person Household | 144 | 25.5% |
| 2-Person Household | 230 | 40.7% |
| 3-Person Household | 50 | 8.8% |
| 4+ Person Household | 141 | 25.0% |
| Total Housing Units | 565 | 100.0% |
Occupancy by Ownership by Household Size in Cedar Hill
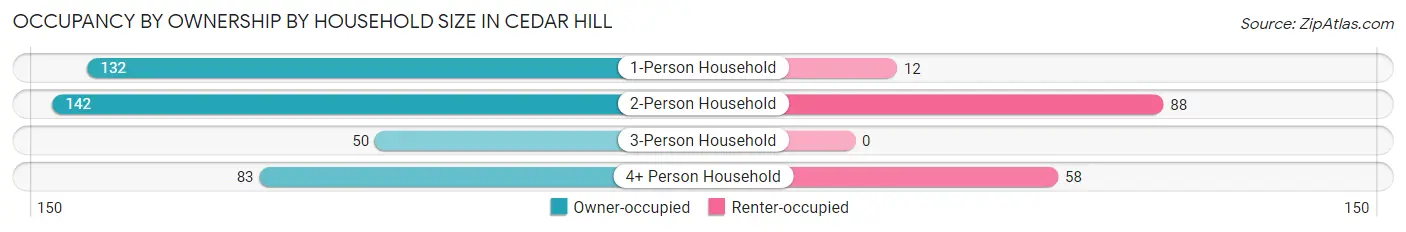
| Household Size | Owner-occupied | Renter-occupied |
| 1-Person Household | 132 (91.7%) | 12 (8.3%) |
| 2-Person Household | 142 (61.7%) | 88 (38.3%) |
| 3-Person Household | 50 (100.0%) | 0 (0.0%) |
| 4+ Person Household | 83 (58.9%) | 58 (41.1%) |
| Total Housing Units | 407 (72.0%) | 158 (28.0%) |
Occupancy by Educational Attainment in Cedar Hill
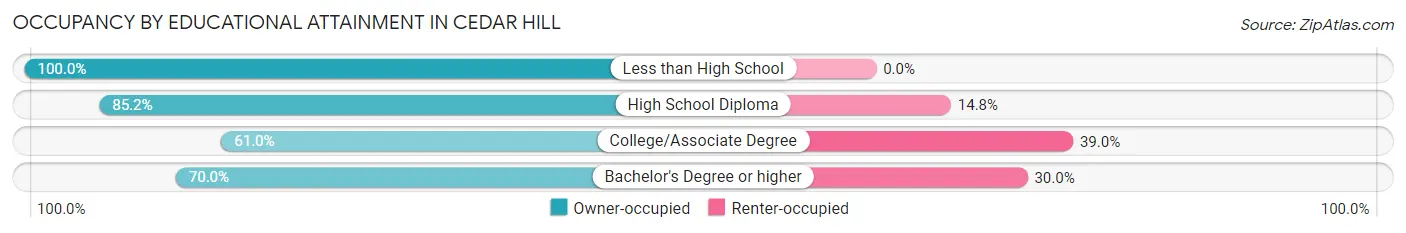
| Household Size | Owner-occupied | Renter-occupied |
| Less than High School | 44 (100.0%) | 0 (0.0%) |
| High School Diploma | 115 (85.2%) | 20 (14.8%) |
| College/Associate Degree | 150 (61.0%) | 96 (39.0%) |
| Bachelor's Degree or higher | 98 (70.0%) | 42 (30.0%) |
Occupancy by Age of Householder in Cedar Hill
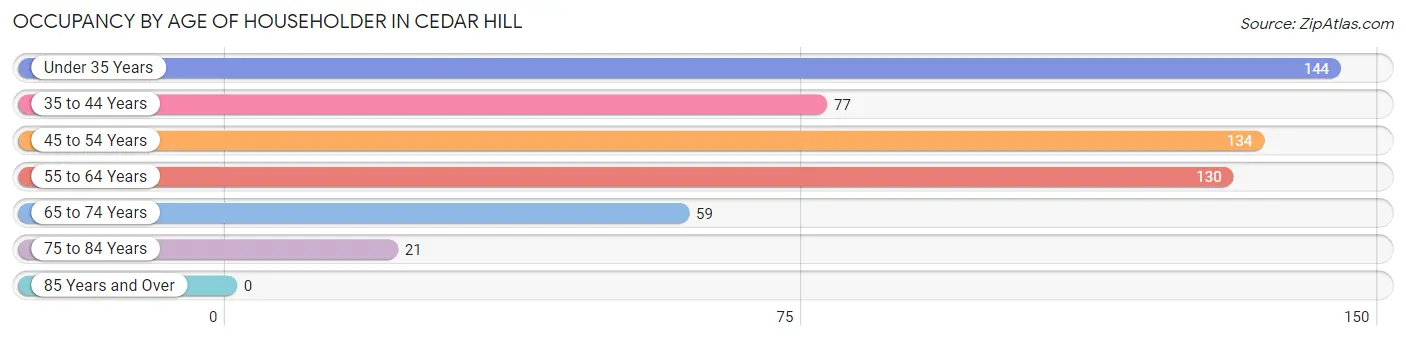
| Age Bracket | # Households | % Households |
| Under 35 Years | 144 | 25.5% |
| 35 to 44 Years | 77 | 13.6% |
| 45 to 54 Years | 134 | 23.7% |
| 55 to 64 Years | 130 | 23.0% |
| 65 to 74 Years | 59 | 10.4% |
| 75 to 84 Years | 21 | 3.7% |
| 85 Years and Over | 0 | 0.0% |
| Total | 565 | 100.0% |
Housing Finances in Cedar Hill
Median Income by Occupancy in Cedar Hill
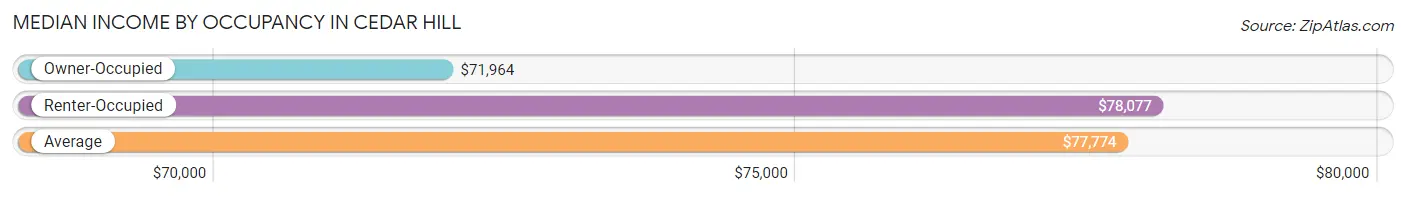
| Occupancy Type | # Households | Median Income |
| Owner-Occupied | 407 (72.0%) | $71,964 |
| Renter-Occupied | 158 (28.0%) | $78,077 |
| Average | 565 (100.0%) | $77,774 |
Occupancy by Householder Income Bracket in Cedar Hill
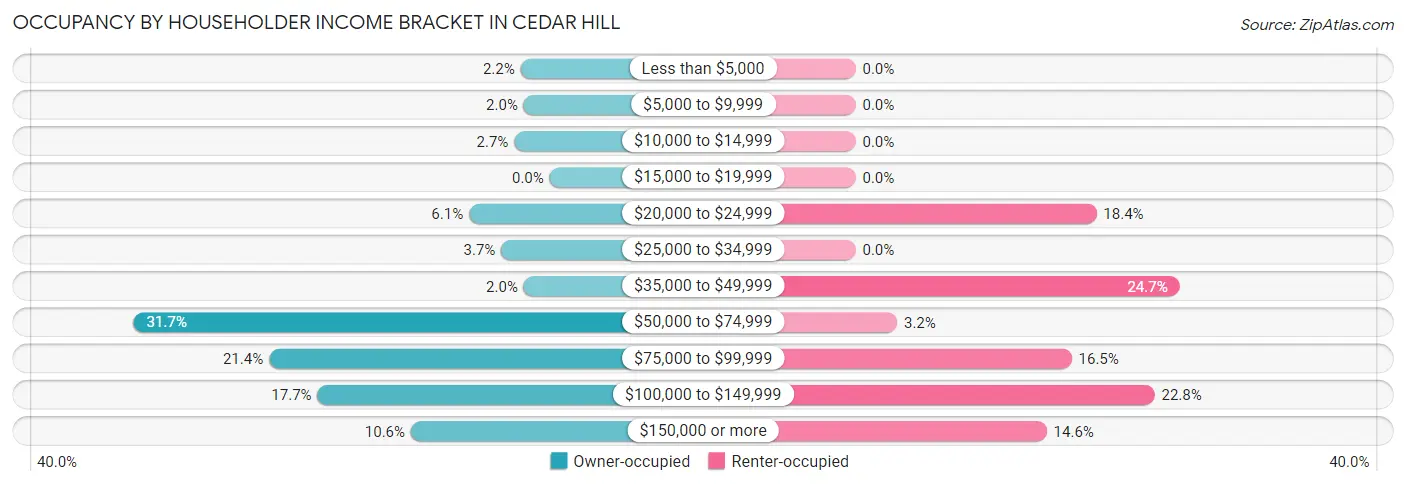
| Income Bracket | Owner-occupied | Renter-occupied |
| Less than $5,000 | 9 (2.2%) | 0 (0.0%) |
| $5,000 to $9,999 | 8 (2.0%) | 0 (0.0%) |
| $10,000 to $14,999 | 11 (2.7%) | 0 (0.0%) |
| $15,000 to $19,999 | 0 (0.0%) | 0 (0.0%) |
| $20,000 to $24,999 | 25 (6.1%) | 29 (18.3%) |
| $25,000 to $34,999 | 15 (3.7%) | 0 (0.0%) |
| $35,000 to $49,999 | 8 (2.0%) | 39 (24.7%) |
| $50,000 to $74,999 | 129 (31.7%) | 5 (3.2%) |
| $75,000 to $99,999 | 87 (21.4%) | 26 (16.5%) |
| $100,000 to $149,999 | 72 (17.7%) | 36 (22.8%) |
| $150,000 or more | 43 (10.6%) | 23 (14.6%) |
| Total | 407 (100.0%) | 158 (100.0%) |
Monthly Housing Cost Tiers in Cedar Hill
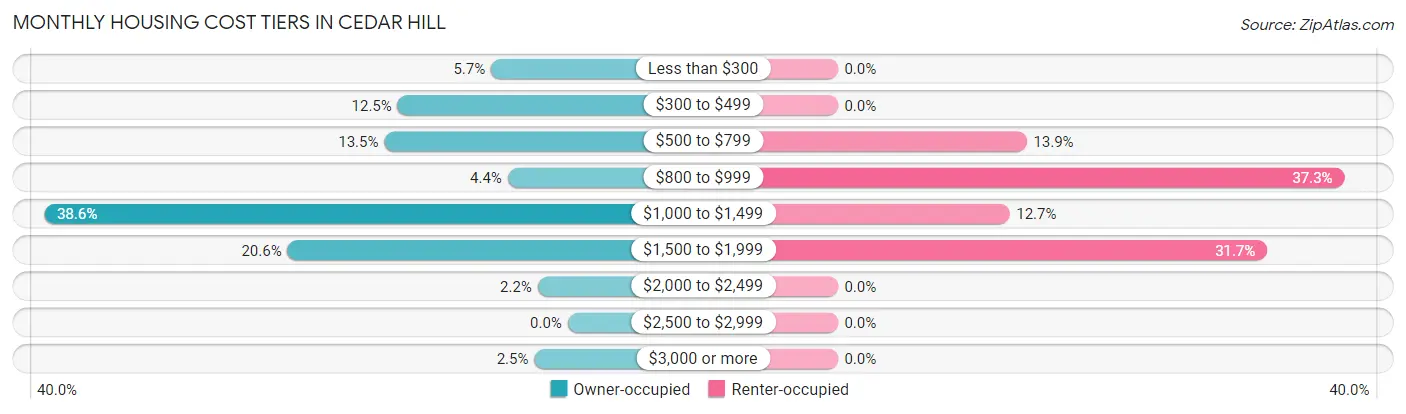
| Monthly Cost | Owner-occupied | Renter-occupied |
| Less than $300 | 23 (5.7%) | 0 (0.0%) |
| $300 to $499 | 51 (12.5%) | 0 (0.0%) |
| $500 to $799 | 55 (13.5%) | 22 (13.9%) |
| $800 to $999 | 18 (4.4%) | 59 (37.3%) |
| $1,000 to $1,499 | 157 (38.6%) | 20 (12.7%) |
| $1,500 to $1,999 | 84 (20.6%) | 50 (31.7%) |
| $2,000 to $2,499 | 9 (2.2%) | 0 (0.0%) |
| $2,500 to $2,999 | 0 (0.0%) | 0 (0.0%) |
| $3,000 or more | 10 (2.5%) | 0 (0.0%) |
| Total | 407 (100.0%) | 158 (100.0%) |
Physical Housing Characteristics in Cedar Hill
Housing Structures in Cedar Hill
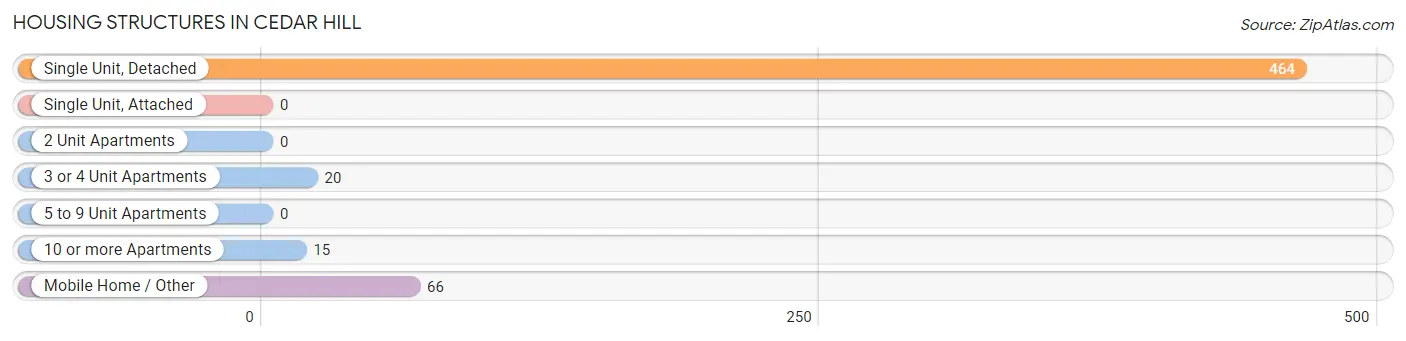
| Structure Type | # Housing Units | % Housing Units |
| Single Unit, Detached | 464 | 82.1% |
| Single Unit, Attached | 0 | 0.0% |
| 2 Unit Apartments | 0 | 0.0% |
| 3 or 4 Unit Apartments | 20 | 3.5% |
| 5 to 9 Unit Apartments | 0 | 0.0% |
| 10 or more Apartments | 15 | 2.6% |
| Mobile Home / Other | 66 | 11.7% |
| Total | 565 | 100.0% |
Housing Structures by Occupancy in Cedar Hill
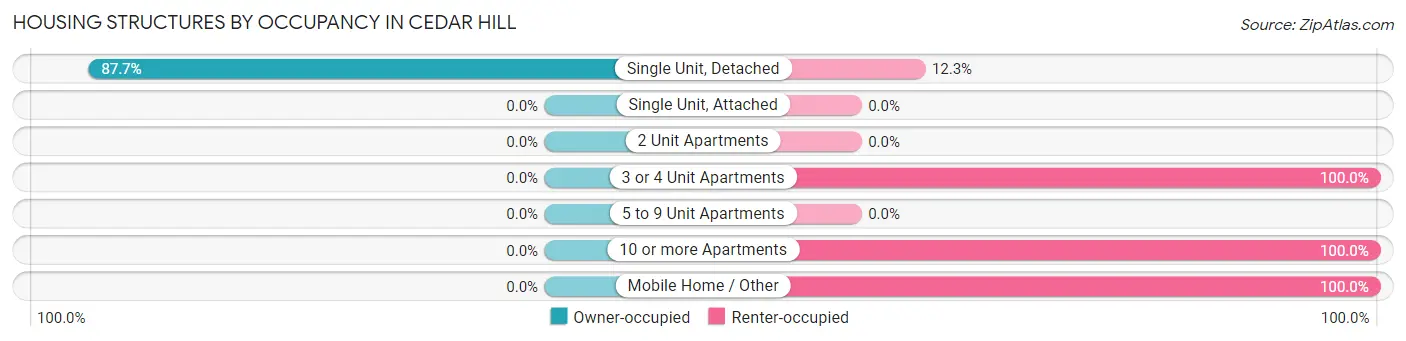
| Structure Type | Owner-occupied | Renter-occupied |
| Single Unit, Detached | 407 (87.7%) | 57 (12.3%) |
| Single Unit, Attached | 0 (0.0%) | 0 (0.0%) |
| 2 Unit Apartments | 0 (0.0%) | 0 (0.0%) |
| 3 or 4 Unit Apartments | 0 (0.0%) | 20 (100.0%) |
| 5 to 9 Unit Apartments | 0 (0.0%) | 0 (0.0%) |
| 10 or more Apartments | 0 (0.0%) | 15 (100.0%) |
| Mobile Home / Other | 0 (0.0%) | 66 (100.0%) |
| Total | 407 (72.0%) | 158 (28.0%) |
Housing Structures by Number of Rooms in Cedar Hill
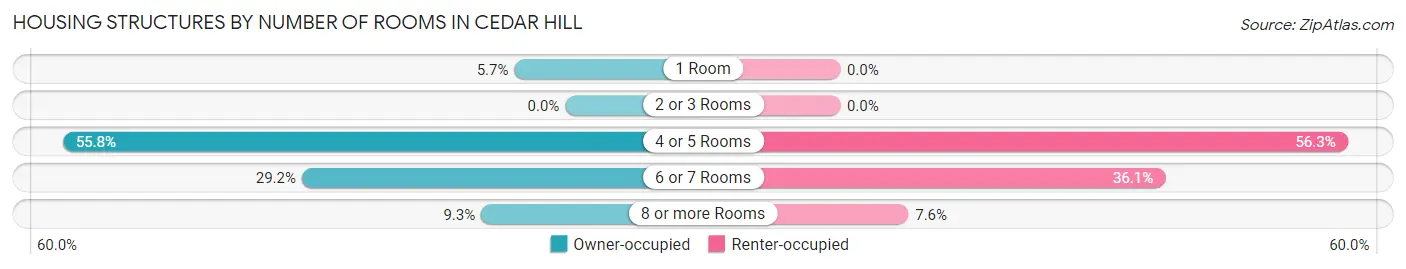
| Number of Rooms | Owner-occupied | Renter-occupied |
| 1 Room | 23 (5.7%) | 0 (0.0%) |
| 2 or 3 Rooms | 0 (0.0%) | 0 (0.0%) |
| 4 or 5 Rooms | 227 (55.8%) | 89 (56.3%) |
| 6 or 7 Rooms | 119 (29.2%) | 57 (36.1%) |
| 8 or more Rooms | 38 (9.3%) | 12 (7.6%) |
| Total | 407 (100.0%) | 158 (100.0%) |
Housing Structure by Heating Type in Cedar Hill
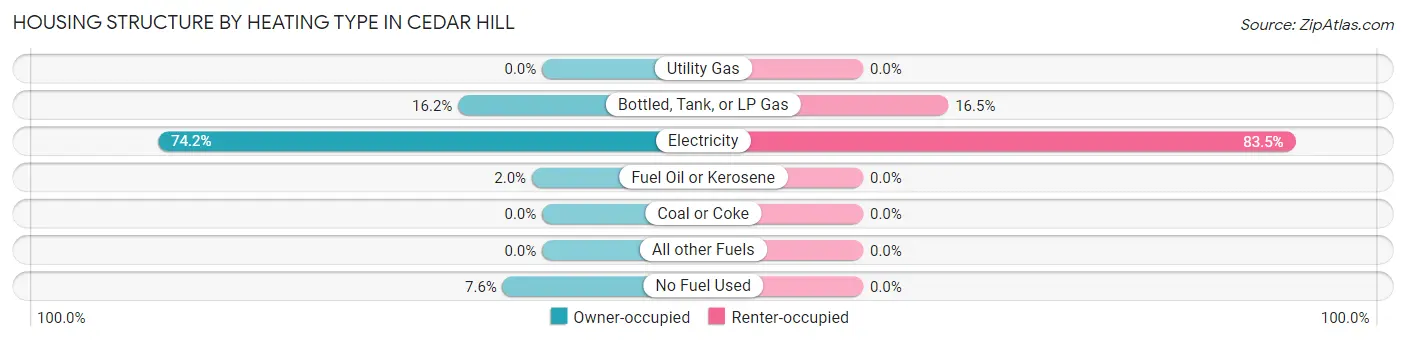
| Heating Type | Owner-occupied | Renter-occupied |
| Utility Gas | 0 (0.0%) | 0 (0.0%) |
| Bottled, Tank, or LP Gas | 66 (16.2%) | 26 (16.5%) |
| Electricity | 302 (74.2%) | 132 (83.5%) |
| Fuel Oil or Kerosene | 8 (2.0%) | 0 (0.0%) |
| Coal or Coke | 0 (0.0%) | 0 (0.0%) |
| All other Fuels | 0 (0.0%) | 0 (0.0%) |
| No Fuel Used | 31 (7.6%) | 0 (0.0%) |
| Total | 407 (100.0%) | 158 (100.0%) |
Household Vehicle Usage in Cedar Hill
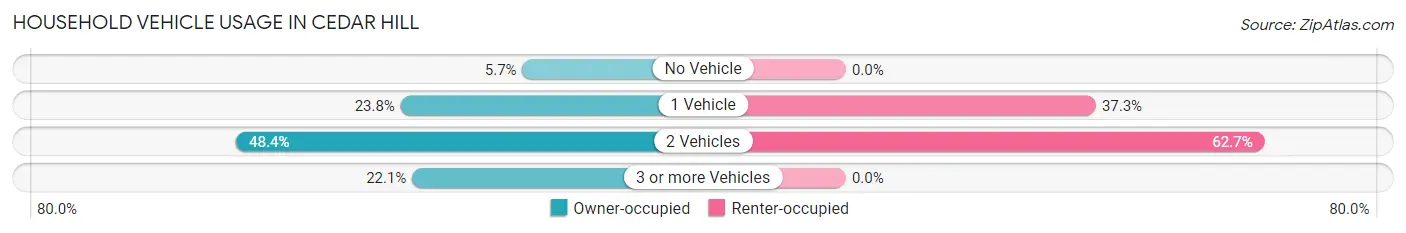
| Vehicles per Household | Owner-occupied | Renter-occupied |
| No Vehicle | 23 (5.7%) | 0 (0.0%) |
| 1 Vehicle | 97 (23.8%) | 59 (37.3%) |
| 2 Vehicles | 197 (48.4%) | 99 (62.7%) |
| 3 or more Vehicles | 90 (22.1%) | 0 (0.0%) |
| Total | 407 (100.0%) | 158 (100.0%) |
Real Estate & Mortgages in Cedar Hill
Real Estate and Mortgage Overview in Cedar Hill
| Characteristic | Without Mortgage | With Mortgage |
| Housing Units | 114 | 293 |
| Median Property Value | $218,900 | $178,200 |
| Median Household Income | $64,333 | $20 |
| Monthly Housing Costs | $445 | $10 |
| Real Estate Taxes | $1,421 | $0 |
Property Value by Mortgage Status in Cedar Hill
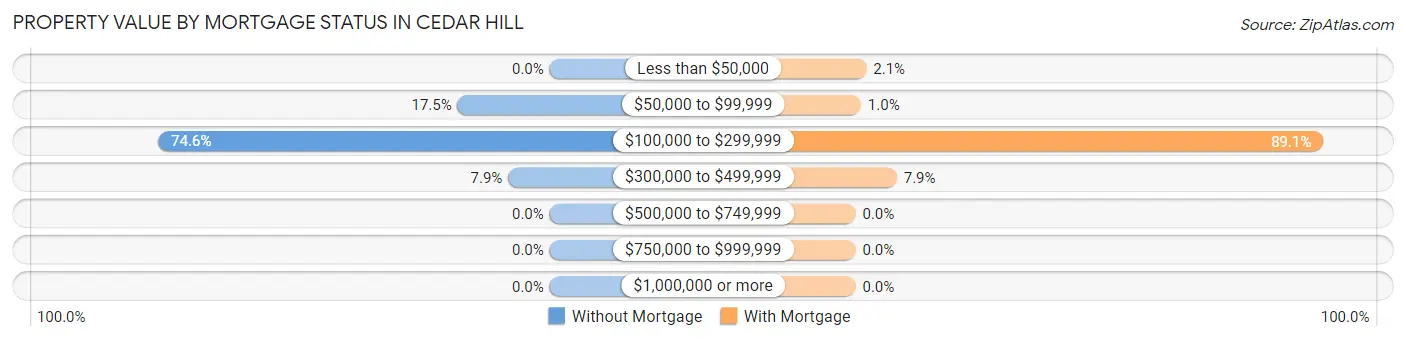
| Property Value | Without Mortgage | With Mortgage |
| Less than $50,000 | 0 (0.0%) | 6 (2.1%) |
| $50,000 to $99,999 | 20 (17.5%) | 3 (1.0%) |
| $100,000 to $299,999 | 85 (74.6%) | 261 (89.1%) |
| $300,000 to $499,999 | 9 (7.9%) | 23 (7.9%) |
| $500,000 to $749,999 | 0 (0.0%) | 0 (0.0%) |
| $750,000 to $999,999 | 0 (0.0%) | 0 (0.0%) |
| $1,000,000 or more | 0 (0.0%) | 0 (0.0%) |
| Total | 114 (100.0%) | 293 (100.0%) |
Household Income by Mortgage Status in Cedar Hill
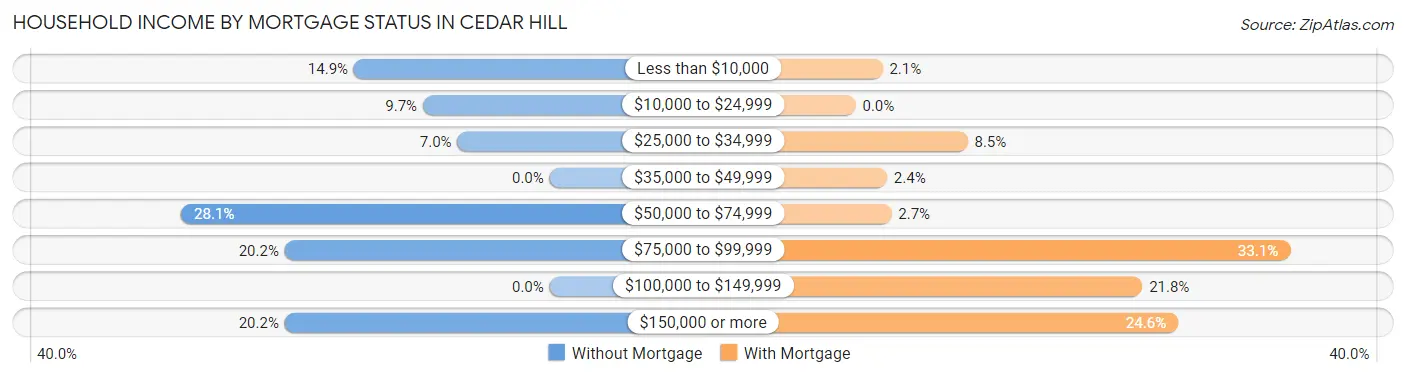
| Household Income | Without Mortgage | With Mortgage |
| Less than $10,000 | 17 (14.9%) | 6 (2.1%) |
| $10,000 to $24,999 | 11 (9.7%) | 0 (0.0%) |
| $25,000 to $34,999 | 8 (7.0%) | 25 (8.5%) |
| $35,000 to $49,999 | 0 (0.0%) | 7 (2.4%) |
| $50,000 to $74,999 | 32 (28.1%) | 8 (2.7%) |
| $75,000 to $99,999 | 23 (20.2%) | 97 (33.1%) |
| $100,000 to $149,999 | 0 (0.0%) | 64 (21.8%) |
| $150,000 or more | 23 (20.2%) | 72 (24.6%) |
| Total | 114 (100.0%) | 293 (100.0%) |
Property Value to Household Income Ratio in Cedar Hill
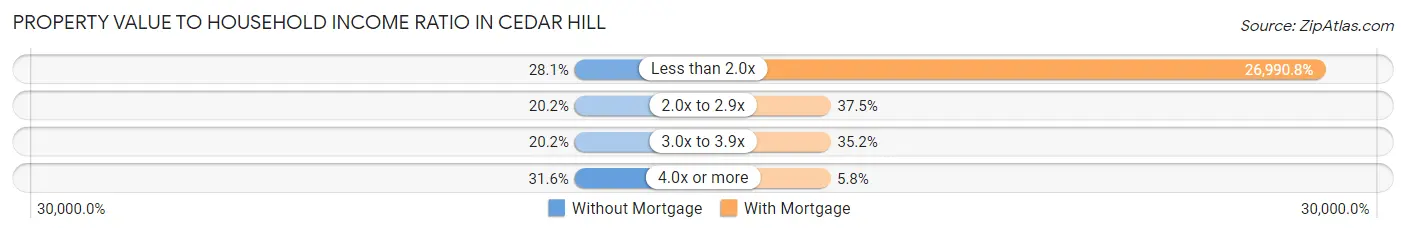
| Value-to-Income Ratio | Without Mortgage | With Mortgage |
| Less than 2.0x | 32 (28.1%) | 79,083 (26,990.8%) |
| 2.0x to 2.9x | 23 (20.2%) | 110 (37.5%) |
| 3.0x to 3.9x | 23 (20.2%) | 103 (35.1%) |
| 4.0x or more | 36 (31.6%) | 17 (5.8%) |
| Total | 114 (100.0%) | 293 (100.0%) |
Real Estate Taxes by Mortgage Status in Cedar Hill
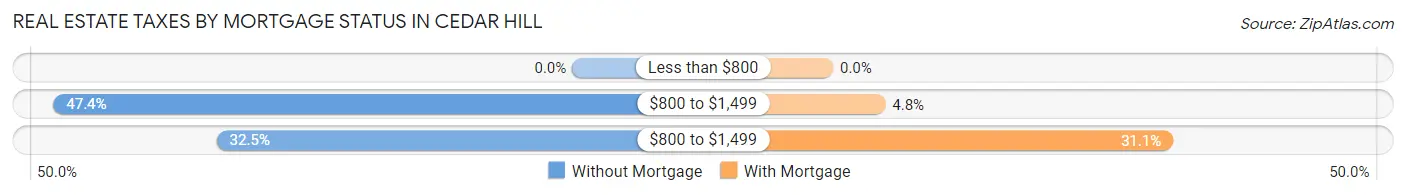
| Property Taxes | Without Mortgage | With Mortgage |
| Less than $800 | 0 (0.0%) | 0 (0.0%) |
| $800 to $1,499 | 54 (47.4%) | 14 (4.8%) |
| $800 to $1,499 | 37 (32.5%) | 91 (31.1%) |
| Total | 114 (100.0%) | 293 (100.0%) |
Health & Disability in Cedar Hill
Health Insurance Coverage by Age in Cedar Hill
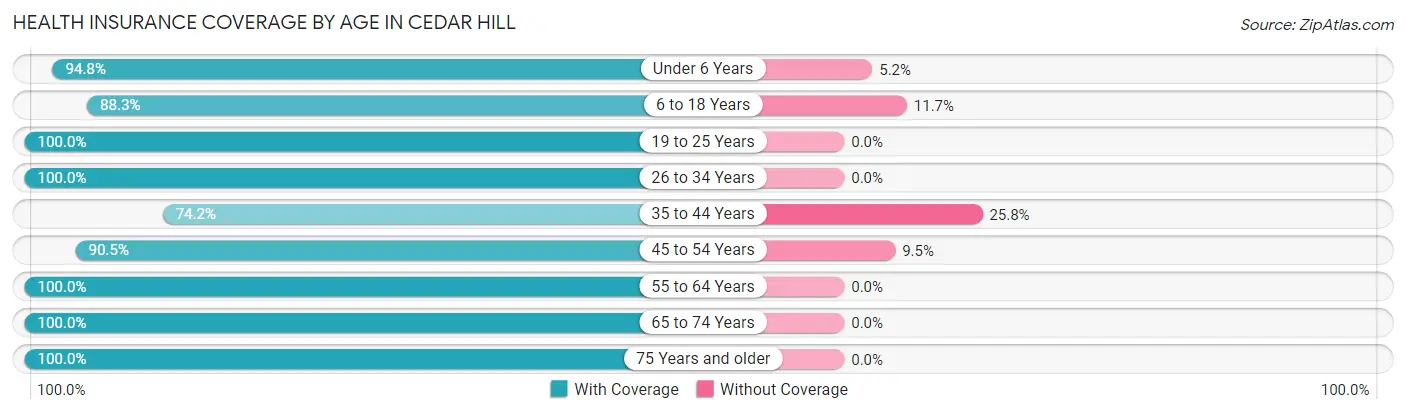
| Age Bracket | With Coverage | Without Coverage |
| Under 6 Years | 109 (94.8%) | 6 (5.2%) |
| 6 to 18 Years | 265 (88.3%) | 35 (11.7%) |
| 19 to 25 Years | 139 (100.0%) | 0 (0.0%) |
| 26 to 34 Years | 222 (100.0%) | 0 (0.0%) |
| 35 to 44 Years | 98 (74.2%) | 34 (25.8%) |
| 45 to 54 Years | 219 (90.5%) | 23 (9.5%) |
| 55 to 64 Years | 200 (100.0%) | 0 (0.0%) |
| 65 to 74 Years | 82 (100.0%) | 0 (0.0%) |
| 75 Years and older | 21 (100.0%) | 0 (0.0%) |
| Total | 1,355 (93.3%) | 98 (6.7%) |
Health Insurance Coverage by Citizenship Status in Cedar Hill
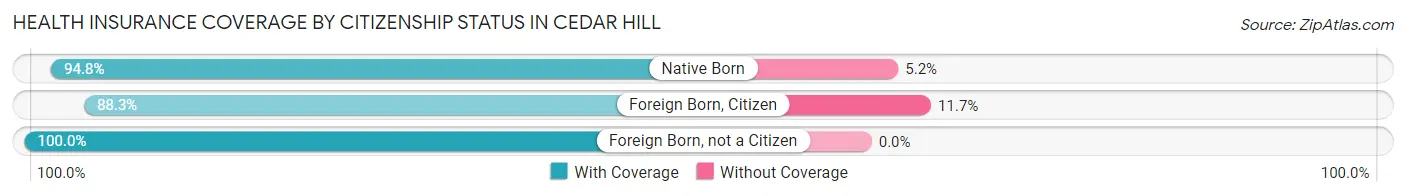
| Citizenship Status | With Coverage | Without Coverage |
| Native Born | 109 (94.8%) | 6 (5.2%) |
| Foreign Born, Citizen | 265 (88.3%) | 35 (11.7%) |
| Foreign Born, not a Citizen | 139 (100.0%) | 0 (0.0%) |
Health Insurance Coverage by Household Income in Cedar Hill
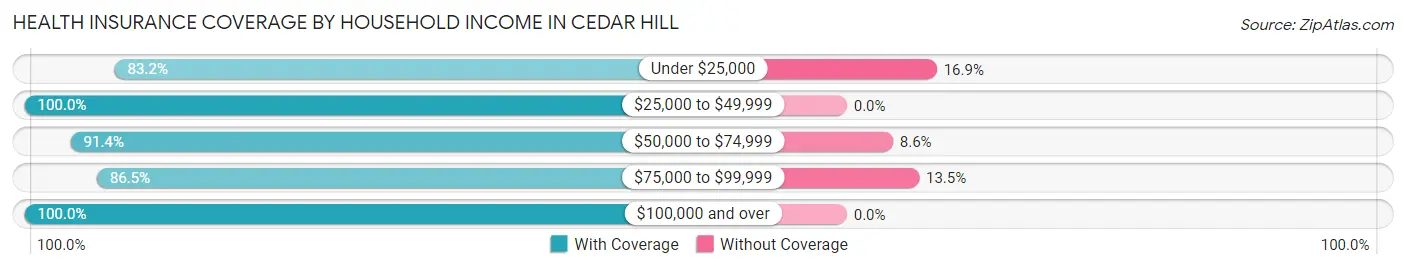
| Household Income | With Coverage | Without Coverage |
| Under $25,000 | 227 (83.2%) | 46 (16.9%) |
| $25,000 to $49,999 | 223 (100.0%) | 0 (0.0%) |
| $50,000 to $74,999 | 307 (91.4%) | 29 (8.6%) |
| $75,000 to $99,999 | 147 (86.5%) | 23 (13.5%) |
| $100,000 and over | 451 (100.0%) | 0 (0.0%) |
Public vs Private Health Insurance Coverage by Age in Cedar Hill
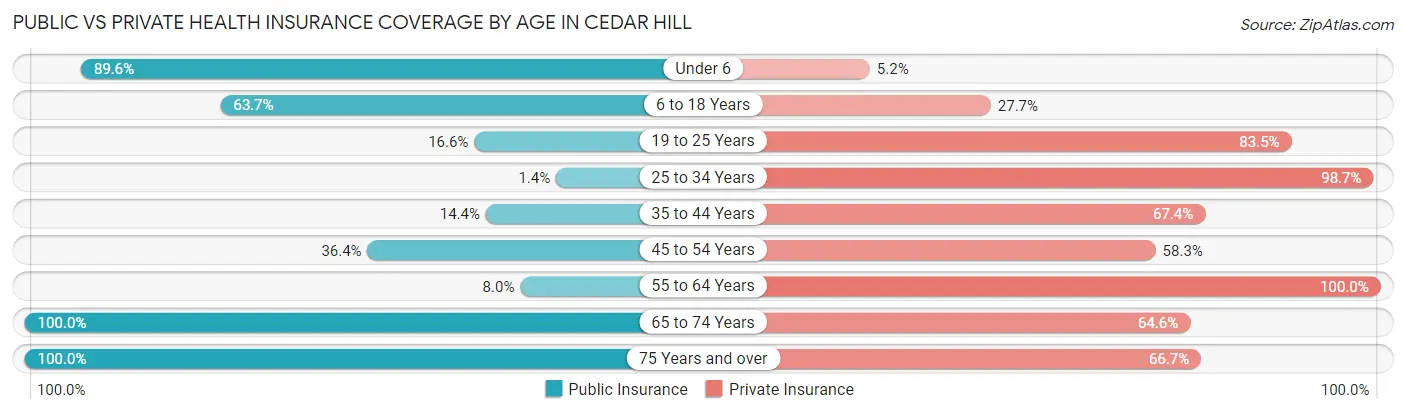
| Age Bracket | Public Insurance | Private Insurance |
| Under 6 | 103 (89.6%) | 6 (5.2%) |
| 6 to 18 Years | 191 (63.7%) | 83 (27.7%) |
| 19 to 25 Years | 23 (16.6%) | 116 (83.5%) |
| 25 to 34 Years | 3 (1.3%) | 219 (98.7%) |
| 35 to 44 Years | 19 (14.4%) | 89 (67.4%) |
| 45 to 54 Years | 88 (36.4%) | 141 (58.3%) |
| 55 to 64 Years | 16 (8.0%) | 200 (100.0%) |
| 65 to 74 Years | 82 (100.0%) | 53 (64.6%) |
| 75 Years and over | 21 (100.0%) | 14 (66.7%) |
| Total | 546 (37.6%) | 921 (63.4%) |
Disability Status by Sex by Age in Cedar Hill
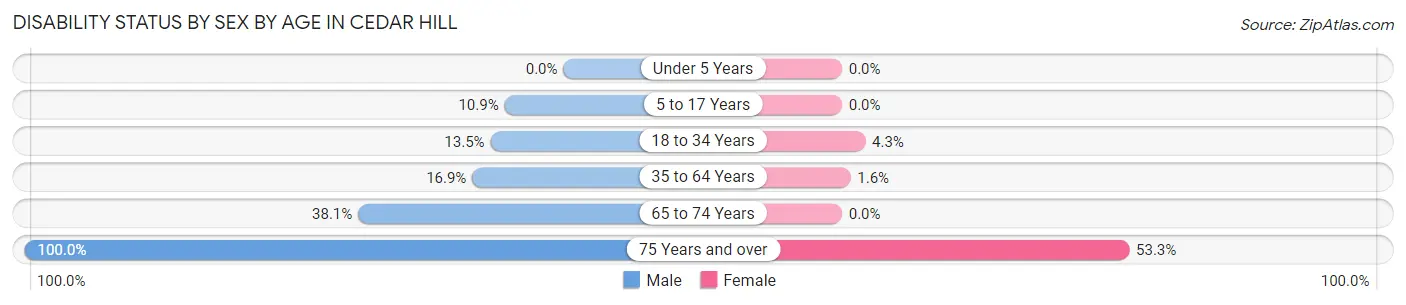
| Age Bracket | Male | Female |
| Under 5 Years | 0 (0.0%) | 0 (0.0%) |
| 5 to 17 Years | 20 (10.9%) | 0 (0.0%) |
| 18 to 34 Years | 26 (13.5%) | 8 (4.3%) |
| 35 to 64 Years | 44 (16.9%) | 5 (1.6%) |
| 65 to 74 Years | 8 (38.1%) | 0 (0.0%) |
| 75 Years and over | 6 (100.0%) | 8 (53.3%) |
Disability Class by Sex by Age in Cedar Hill
Disability Class: Hearing Difficulty
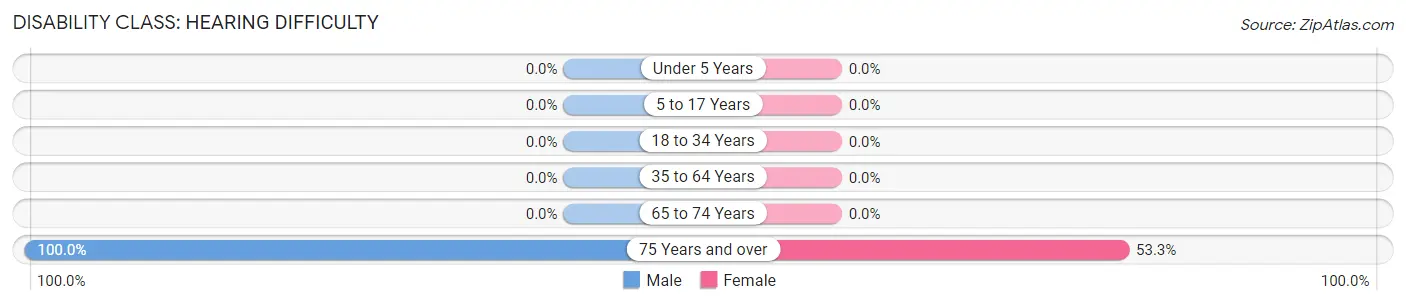
| Age Bracket | Male | Female |
| Under 5 Years | 0 (0.0%) | 0 (0.0%) |
| 5 to 17 Years | 0 (0.0%) | 0 (0.0%) |
| 18 to 34 Years | 0 (0.0%) | 0 (0.0%) |
| 35 to 64 Years | 0 (0.0%) | 0 (0.0%) |
| 65 to 74 Years | 0 (0.0%) | 0 (0.0%) |
| 75 Years and over | 6 (100.0%) | 8 (53.3%) |
Disability Class: Vision Difficulty
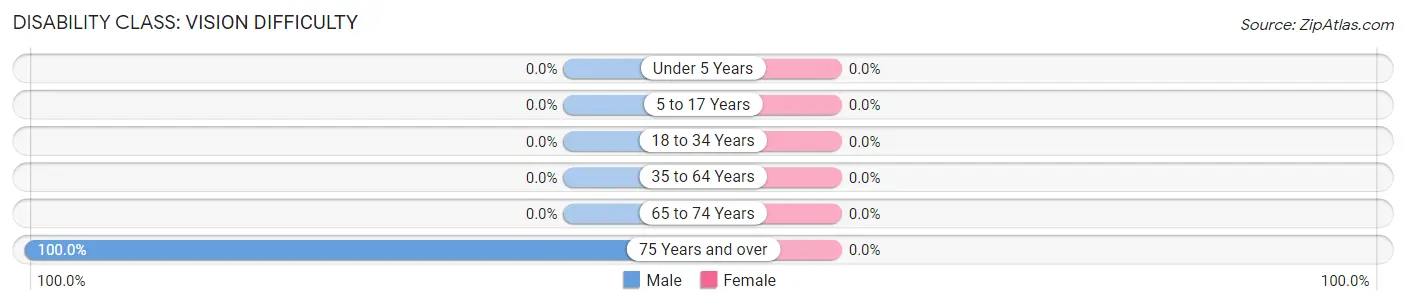
| Age Bracket | Male | Female |
| Under 5 Years | 0 (0.0%) | 0 (0.0%) |
| 5 to 17 Years | 0 (0.0%) | 0 (0.0%) |
| 18 to 34 Years | 0 (0.0%) | 0 (0.0%) |
| 35 to 64 Years | 0 (0.0%) | 0 (0.0%) |
| 65 to 74 Years | 0 (0.0%) | 0 (0.0%) |
| 75 Years and over | 6 (100.0%) | 0 (0.0%) |
Disability Class: Cognitive Difficulty
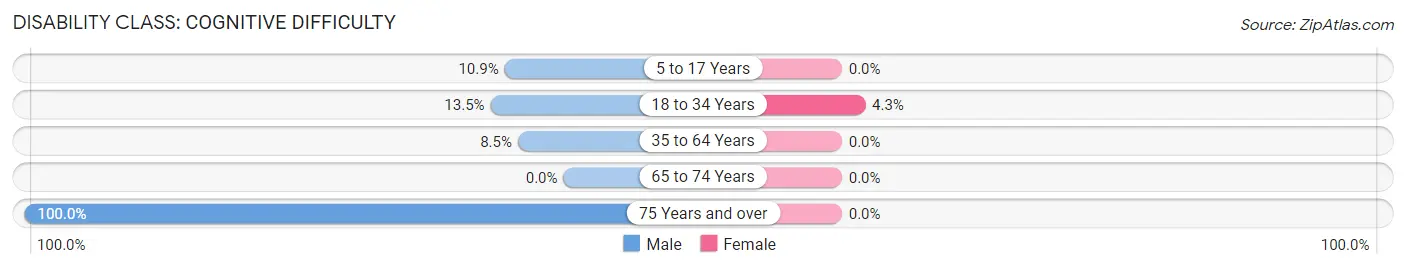
| Age Bracket | Male | Female |
| 5 to 17 Years | 20 (10.9%) | 0 (0.0%) |
| 18 to 34 Years | 26 (13.5%) | 8 (4.3%) |
| 35 to 64 Years | 22 (8.5%) | 0 (0.0%) |
| 65 to 74 Years | 0 (0.0%) | 0 (0.0%) |
| 75 Years and over | 6 (100.0%) | 0 (0.0%) |
Disability Class: Ambulatory Difficulty
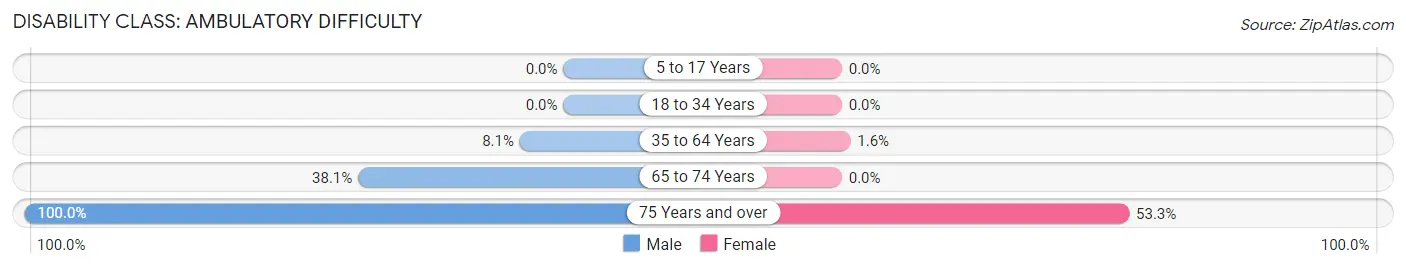
| Age Bracket | Male | Female |
| 5 to 17 Years | 0 (0.0%) | 0 (0.0%) |
| 18 to 34 Years | 0 (0.0%) | 0 (0.0%) |
| 35 to 64 Years | 21 (8.1%) | 5 (1.6%) |
| 65 to 74 Years | 8 (38.1%) | 0 (0.0%) |
| 75 Years and over | 6 (100.0%) | 8 (53.3%) |
Disability Class: Self-Care Difficulty
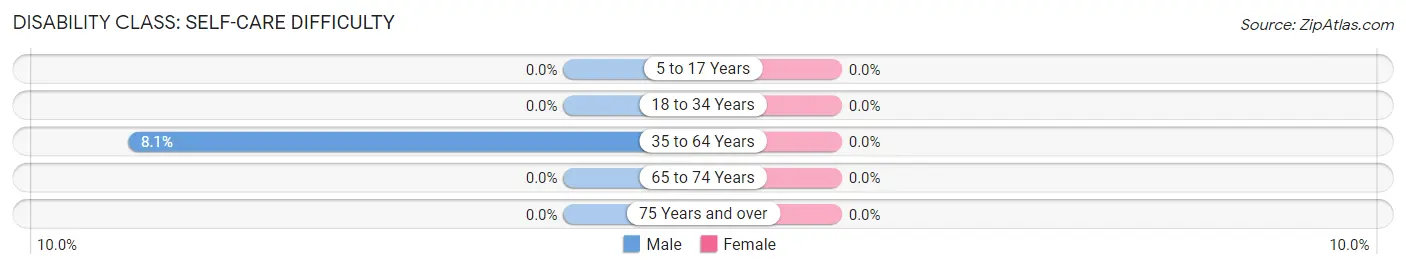
| Age Bracket | Male | Female |
| 5 to 17 Years | 0 (0.0%) | 0 (0.0%) |
| 18 to 34 Years | 0 (0.0%) | 0 (0.0%) |
| 35 to 64 Years | 21 (8.1%) | 0 (0.0%) |
| 65 to 74 Years | 0 (0.0%) | 0 (0.0%) |
| 75 Years and over | 0 (0.0%) | 0 (0.0%) |
Technology Access in Cedar Hill
Computing Device Access in Cedar Hill
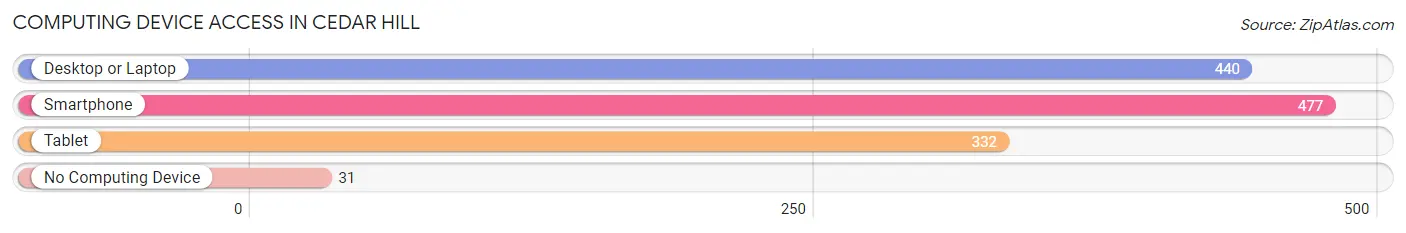
| Device Type | # Households | % Households |
| Desktop or Laptop | 440 | 77.9% |
| Smartphone | 477 | 84.4% |
| Tablet | 332 | 58.8% |
| No Computing Device | 31 | 5.5% |
| Total | 565 | 100.0% |
Internet Access in Cedar Hill
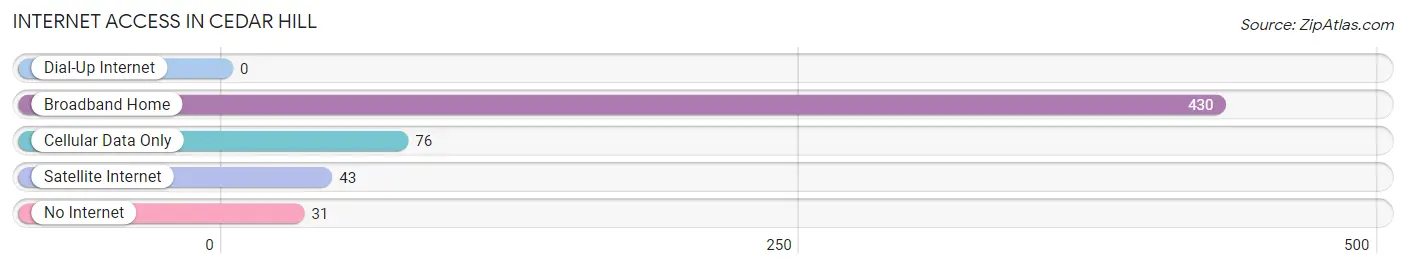
| Internet Type | # Households | % Households |
| Dial-Up Internet | 0 | 0.0% |
| Broadband Home | 430 | 76.1% |
| Cellular Data Only | 76 | 13.5% |
| Satellite Internet | 43 | 7.6% |
| No Internet | 31 | 5.5% |
| Total | 565 | 100.0% |
Cedar Hill Summary
Cedar Hill is a small city located in Jefferson County, Missouri, United States. It is situated on the banks of the Big River, approximately 20 miles south of St. Louis. The city has a population of approximately 4,000 people and is part of the St. Louis metropolitan area.
History
Cedar Hill was founded in 1837 by a group of settlers from Kentucky. The town was named after the cedar trees that grew in abundance in the area. The settlers built a log cabin and a small store, and the town quickly grew. By the late 1800s, Cedar Hill had become a thriving community with a population of over 1,000 people.
The town was home to a variety of businesses, including a sawmill, a gristmill, a blacksmith shop, a general store, and a hotel. The town also had a post office, a school, and a church.
In the early 1900s, Cedar Hill began to decline as the railroad bypassed the town. The population decreased and many of the businesses closed. In the 1950s, the town was revitalized when the Big River was dammed to create a reservoir. This brought new life to the town and the population began to grow again.
Geography
Cedar Hill is located in the Ozark Mountains region of Missouri. The city is situated on the banks of the Big River, approximately 20 miles south of St. Louis. The city has a total area of 2.2 square miles, all of which is land.
The city is located in a hilly area with elevations ranging from 500 to 800 feet above sea level. The climate is humid subtropical, with hot, humid summers and mild winters.
Economy
Cedar Hill’s economy is largely based on tourism and recreation. The city is home to several parks and recreational areas, including the Big River State Park, which offers camping, fishing, and boating. The city also has several restaurants, shops, and other businesses.
The city is also home to several manufacturing companies, including a plastics manufacturer and a metal fabrication company.
Demographics
As of the 2010 census, Cedar Hill had a population of 4,000 people. The racial makeup of the city was 95.2% White, 1.2% African American, 0.7% Native American, 0.4% Asian, 0.1% Pacific Islander, 0.7% from other races, and 1.7% from two or more races. Hispanic or Latino of any race were 2.2% of the population.
The median household income in Cedar Hill was $45,000, and the median family income was $50,000. The per capita income was $20,000. About 10.2% of families and 12.3% of the population were below the poverty line, including 16.7% of those under age 18 and 8.3% of those age 65 or over.
Cedar Hill is a small city with a rich history and a bright future. The city is home to a variety of businesses and recreational activities, and its population is growing. With its close proximity to St. Louis, Cedar Hill is an ideal place to live and work.
Common Questions
What is Per Capita Income in Cedar Hill?
Per Capita income in Cedar Hill is $32,870.
What is the Median Family Income in Cedar Hill?
Median Family Income in Cedar Hill is $62,981.
What is the Median Household income in Cedar Hill?
Median Household Income in Cedar Hill is $77,774.
What is Income or Wage Gap in Cedar Hill?
Income or Wage Gap in Cedar Hill is 46.1%.
Women in Cedar Hill earn 53.9 cents for every dollar earned by a man.
What is Inequality or Gini Index in Cedar Hill?
Inequality or Gini Index in Cedar Hill is 0.33.
What is the Total Population of Cedar Hill?
Total Population of Cedar Hill is 1,453.
What is the Total Male Population of Cedar Hill?
Total Male Population of Cedar Hill is 719.
What is the Total Female Population of Cedar Hill?
Total Female Population of Cedar Hill is 734.
What is the Ratio of Males per 100 Females in Cedar Hill?
There are 97.96 Males per 100 Females in Cedar Hill.
What is the Ratio of Females per 100 Males in Cedar Hill?
There are 102.09 Females per 100 Males in Cedar Hill.
What is the Median Population Age in Cedar Hill?
Median Population Age in Cedar Hill is 32.1 Years.
What is the Average Family Size in Cedar Hill
Average Family Size in Cedar Hill is 3.0 People.
What is the Average Household Size in Cedar Hill
Average Household Size in Cedar Hill is 2.6 People.
How Large is the Labor Force in Cedar Hill?
There are 820 People in the Labor Forcein in Cedar Hill.
What is the Percentage of People in the Labor Force in Cedar Hill?
69.5% of People are in the Labor Force in Cedar Hill.
What is the Unemployment Rate in Cedar Hill?
Unemployment Rate in Cedar Hill is 3.8%.