Cassville, MO Map & Demographics
Cassville Map
Cassville Overview
$33,468
PER CAPITA INCOME
$64,258
AVG FAMILY INCOME
$46,136
AVG HOUSEHOLD INCOME
8.9%
WAGE / INCOME GAP [ % ]
91.1¢/ $1
WAGE / INCOME GAP [ $ ]
$12,764
FAMILY INCOME DEFICIT
0.56
INEQUALITY / GINI INDEX
3,193
TOTAL POPULATION
1,557
MALE POPULATION
1,636
FEMALE POPULATION
95.17
MALES / 100 FEMALES
105.07
FEMALES / 100 MALES
38.7
MEDIAN AGE
3.3
AVG FAMILY SIZE
2.6
AVG HOUSEHOLD SIZE
1,404
LABOR FORCE [ PEOPLE ]
57.0%
PERCENT IN LABOR FORCE
Cassville Zip Codes
Cassville Area Codes
Income in Cassville
Income Overview in Cassville
Per Capita Income in Cassville is $33,468, while median incomes of families and households are $64,258 and $46,136 respectively.
| Characteristic | Number | Measure |
| Per Capita Income | 3,193 | $33,468 |
| Median Family Income | 763 | $64,258 |
| Mean Family Income | 763 | $107,392 |
| Median Household Income | 1,190 | $46,136 |
| Mean Household Income | 1,190 | $88,202 |
| Income Deficit | 763 | $12,764 |
| Wage / Income Gap (%) | 3,193 | 8.87% |
| Wage / Income Gap ($) | 3,193 | 91.13¢ per $1 |
| Gini / Inequality Index | 3,193 | 0.56 |
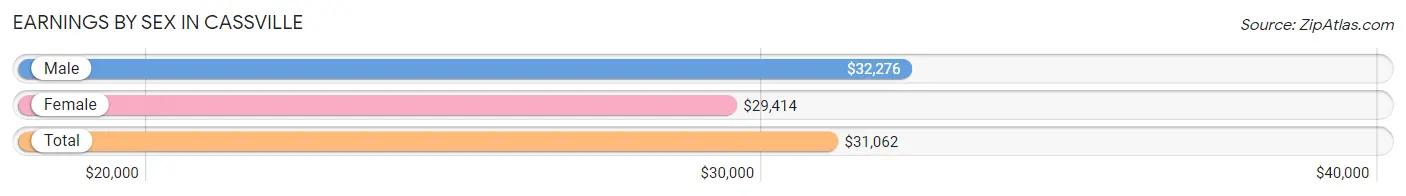
Earnings by Sex in Cassville
Average Earnings in Cassville are $31,062, $32,276 for men and $29,414 for women, a difference of 8.9%.
| Sex | Number | Average Earnings |
| Male | 902 (59.5%) | $32,276 |
| Female | 615 (40.5%) | $29,414 |
| Total | 1,517 (100.0%) | $31,062 |
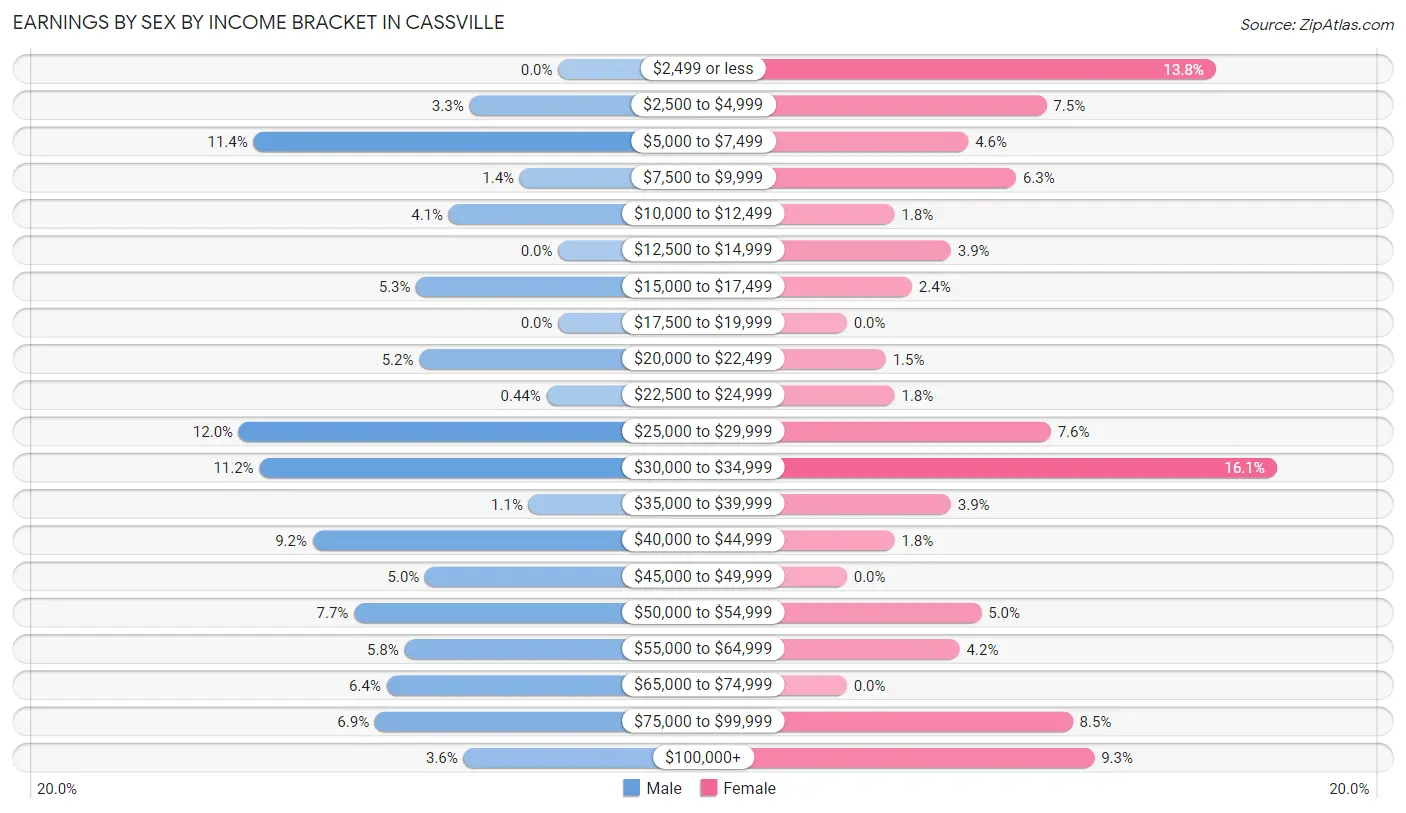
Earnings by Sex by Income Bracket in Cassville
The most common earnings brackets in Cassville are $25,000 to $29,999 for men (108 | 12.0%) and $30,000 to $34,999 for women (99 | 16.1%).
| Income | Male | Female |
| $2,499 or less | 0 (0.0%) | 85 (13.8%) |
| $2,500 to $4,999 | 30 (3.3%) | 46 (7.5%) |
| $5,000 to $7,499 | 103 (11.4%) | 28 (4.5%) |
| $7,500 to $9,999 | 13 (1.4%) | 39 (6.3%) |
| $10,000 to $12,499 | 37 (4.1%) | 11 (1.8%) |
| $12,500 to $14,999 | 0 (0.0%) | 24 (3.9%) |
| $15,000 to $17,499 | 48 (5.3%) | 15 (2.4%) |
| $17,500 to $19,999 | 0 (0.0%) | 0 (0.0%) |
| $20,000 to $22,499 | 47 (5.2%) | 9 (1.5%) |
| $22,500 to $24,999 | 4 (0.4%) | 11 (1.8%) |
| $25,000 to $29,999 | 108 (12.0%) | 47 (7.6%) |
| $30,000 to $34,999 | 101 (11.2%) | 99 (16.1%) |
| $35,000 to $39,999 | 10 (1.1%) | 24 (3.9%) |
| $40,000 to $44,999 | 83 (9.2%) | 11 (1.8%) |
| $45,000 to $49,999 | 45 (5.0%) | 0 (0.0%) |
| $50,000 to $54,999 | 69 (7.6%) | 31 (5.0%) |
| $55,000 to $64,999 | 52 (5.8%) | 26 (4.2%) |
| $65,000 to $74,999 | 58 (6.4%) | 0 (0.0%) |
| $75,000 to $99,999 | 62 (6.9%) | 52 (8.5%) |
| $100,000+ | 32 (3.5%) | 57 (9.3%) |
| Total | 902 (100.0%) | 615 (100.0%) |
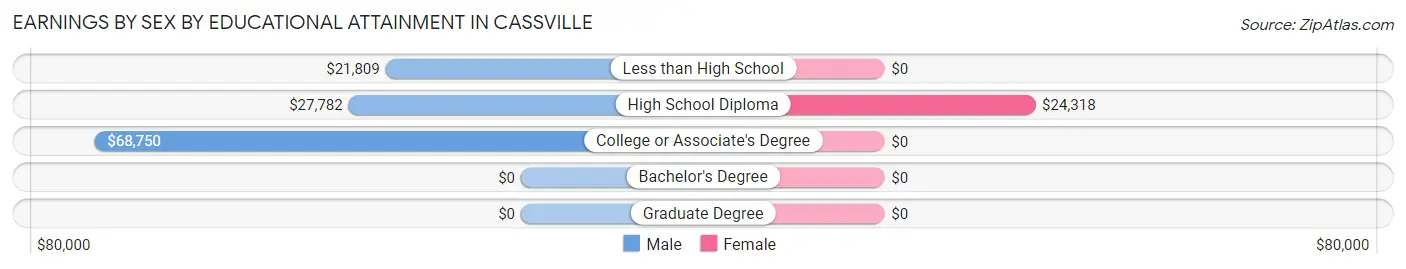
Earnings by Sex by Educational Attainment in Cassville
Average earnings in Cassville are $32,474 for men and $30,318 for women, a difference of 6.6%. Men with an educational attainment of college or associate's degree enjoy the highest average annual earnings of $68,750, while those with less than high school education earn the least with $21,809. Women with an educational attainment of high school diploma earn the most with the average annual earnings of $24,318, while those with high school diploma education have the smallest earnings of $24,318.
| Educational Attainment | Male Income | Female Income |
| Less than High School | $21,809 | $0 |
| High School Diploma | $27,782 | $24,318 |
| College or Associate's Degree | $68,750 | $0 |
| Bachelor's Degree | - | - |
| Graduate Degree | - | - |
| Total | $32,474 | $30,318 |
Family Income in Cassville
Family Income Brackets in Cassville
According to the Cassville family income data, there are 166 families falling into the $100,000 to $149,999 income range, which is the most common income bracket and makes up 21.8% of all families.
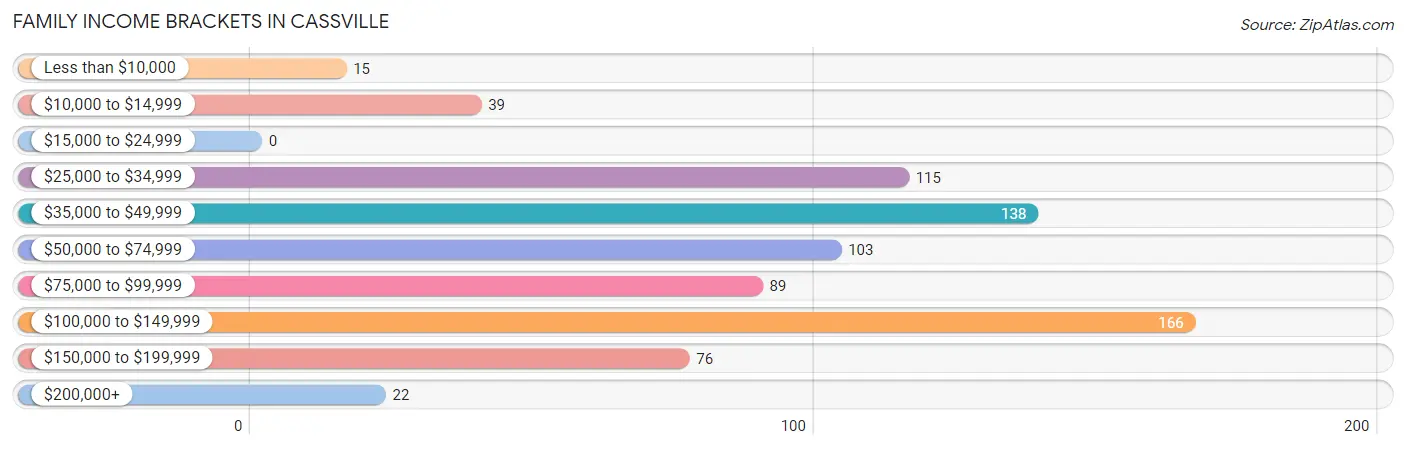
| Income Bracket | # Families | % Families |
| Less than $10,000 | 15 | 2.0% |
| $10,000 to $14,999 | 39 | 5.1% |
| $15,000 to $24,999 | 0 | 0.0% |
| $25,000 to $34,999 | 115 | 15.1% |
| $35,000 to $49,999 | 138 | 18.1% |
| $50,000 to $74,999 | 103 | 13.5% |
| $75,000 to $99,999 | 89 | 11.7% |
| $100,000 to $149,999 | 166 | 21.8% |
| $150,000 to $199,999 | 76 | 10.0% |
| $200,000+ | 22 | 2.9% |
Family Income by Famaliy Size in Cassville
4-person families (127 | 16.6%) account for the highest median family income in Cassville with $113,151 per family, while 2-person families (355 | 46.5%) have the highest median income of $39,158 per family member.
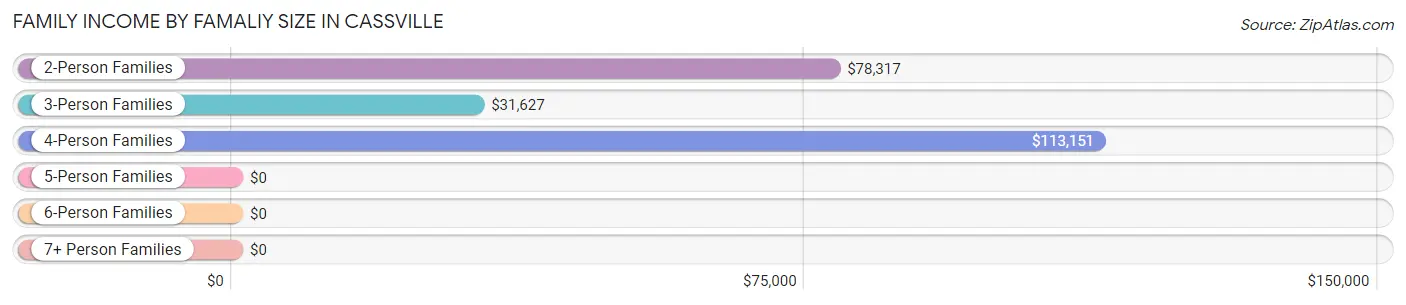
| Income Bracket | # Families | Median Income |
| 2-Person Families | 355 (46.5%) | $78,317 |
| 3-Person Families | 141 (18.5%) | $31,627 |
| 4-Person Families | 127 (16.6%) | $113,151 |
| 5-Person Families | 78 (10.2%) | $0 |
| 6-Person Families | 29 (3.8%) | $0 |
| 7+ Person Families | 33 (4.3%) | $0 |
| Total | 763 (100.0%) | $64,258 |
Family Income by Number of Earners in Cassville
The median family income in Cassville is $64,258, with families comprising 3+ earners (120) having the highest median family income of $114,479, while families with no earners (123) have the lowest median family income of $40,453, accounting for 15.7% and 16.1% of families, respectively.
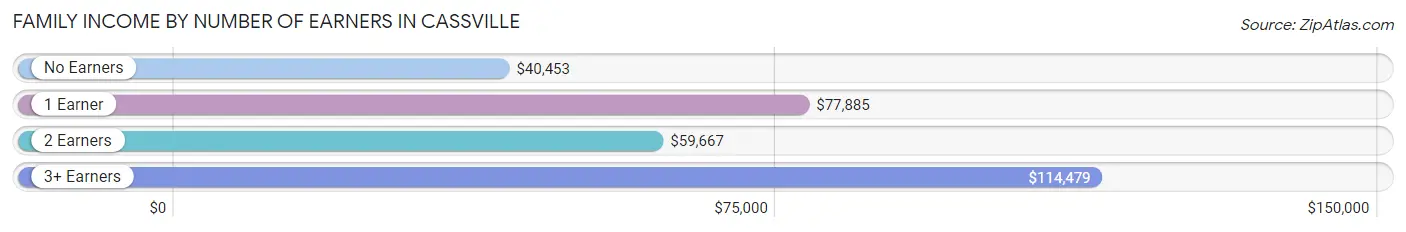
| Number of Earners | # Families | Median Income |
| No Earners | 123 (16.1%) | $40,453 |
| 1 Earner | 234 (30.7%) | $77,885 |
| 2 Earners | 286 (37.5%) | $59,667 |
| 3+ Earners | 120 (15.7%) | $114,479 |
| Total | 763 (100.0%) | $64,258 |
Household Income in Cassville
Household Income Brackets in Cassville
With 220 households falling in the category, the $100,000 to $149,999 income range is the most frequent in Cassville, accounting for 18.5% of all households. In contrast, only 51 households (4.3%) fall into the less than $10,000 income bracket, making it the least populous group.
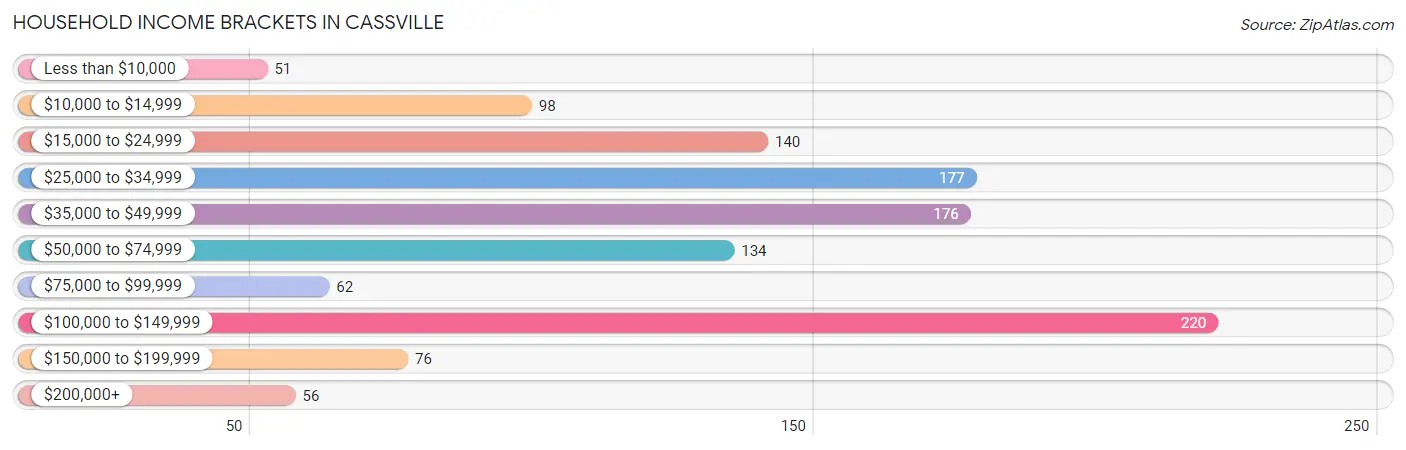
| Income Bracket | # Households | % Households |
| Less than $10,000 | 51 | 4.3% |
| $10,000 to $14,999 | 98 | 8.2% |
| $15,000 to $24,999 | 140 | 11.8% |
| $25,000 to $34,999 | 177 | 14.9% |
| $35,000 to $49,999 | 176 | 14.8% |
| $50,000 to $74,999 | 134 | 11.3% |
| $75,000 to $99,999 | 62 | 5.2% |
| $100,000 to $149,999 | 220 | 18.5% |
| $150,000 to $199,999 | 76 | 6.4% |
| $200,000+ | 56 | 4.7% |
Household Income by Householder Age in Cassville
The median household income in Cassville is $46,136, with the highest median household income of $105,833 found in the 25 to 44 years age bracket for the primary householder. A total of 388 households (32.6%) fall into this category. Meanwhile, the 15 to 24 years age bracket for the primary householder has the lowest median household income of $0, with 36 households (3.0%) in this group.
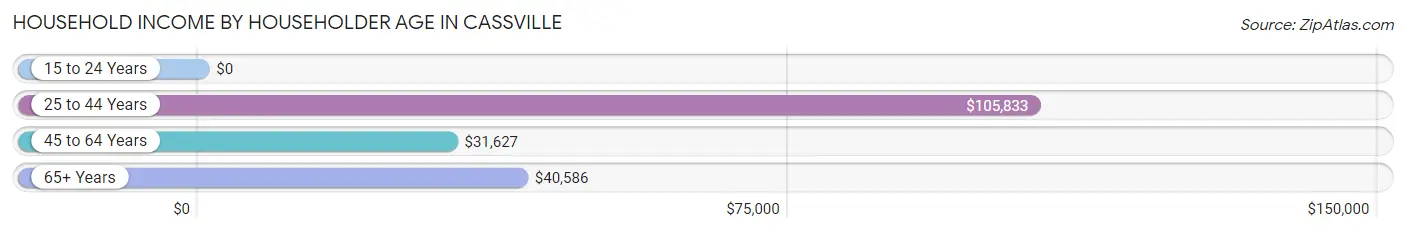
| Income Bracket | # Households | Median Income |
| 15 to 24 Years | 36 (3.0%) | $0 |
| 25 to 44 Years | 388 (32.6%) | $105,833 |
| 45 to 64 Years | 295 (24.8%) | $31,627 |
| 65+ Years | 471 (39.6%) | $40,586 |
| Total | 1,190 (100.0%) | $46,136 |
Poverty in Cassville
Income Below Poverty by Sex and Age in Cassville
With 27.0% poverty level for males and 28.7% for females among the residents of Cassville, under 5 year old males and 6 to 11 year old females are the most vulnerable to poverty, with 79 males (100.0%) and 54 females (100.0%) in their respective age groups living below the poverty level.
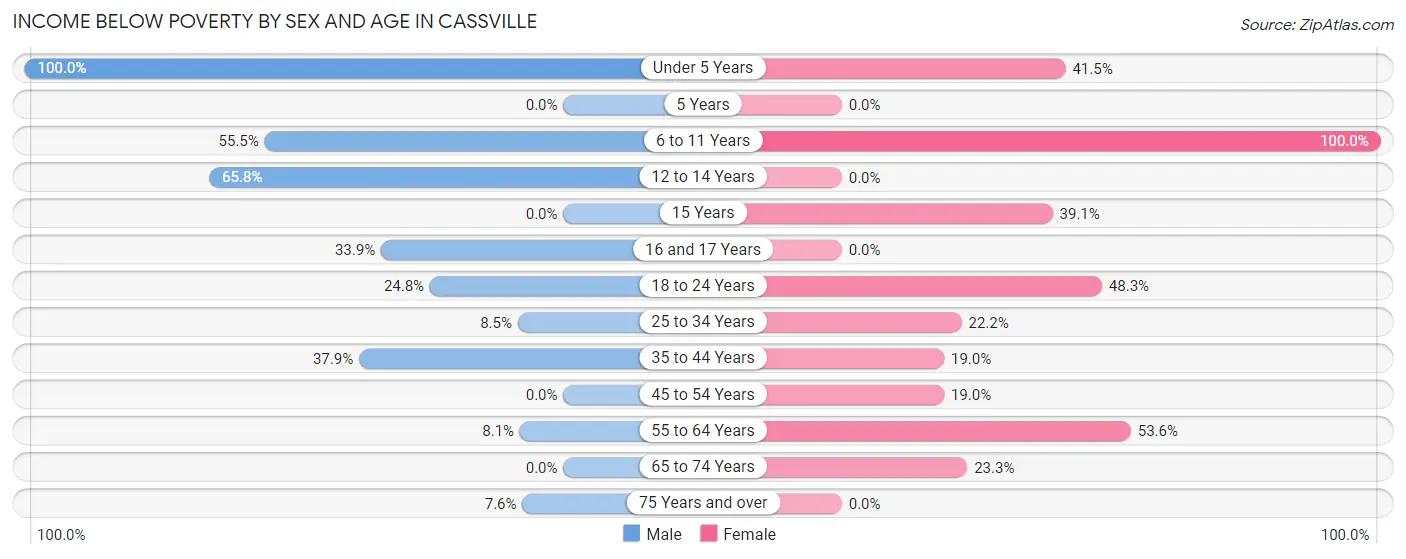
| Age Bracket | Male | Female |
| Under 5 Years | 79 (100.0%) | 93 (41.5%) |
| 5 Years | 0 (0.0%) | 0 (0.0%) |
| 6 to 11 Years | 66 (55.5%) | 54 (100.0%) |
| 12 to 14 Years | 73 (65.8%) | 0 (0.0%) |
| 15 Years | 0 (0.0%) | 18 (39.1%) |
| 16 and 17 Years | 22 (33.9%) | 0 (0.0%) |
| 18 to 24 Years | 26 (24.8%) | 56 (48.3%) |
| 25 to 34 Years | 22 (8.5%) | 20 (22.2%) |
| 35 to 44 Years | 88 (37.9%) | 52 (19.0%) |
| 45 to 54 Years | 0 (0.0%) | 33 (19.0%) |
| 55 to 64 Years | 15 (8.1%) | 59 (53.6%) |
| 65 to 74 Years | 0 (0.0%) | 71 (23.3%) |
| 75 Years and over | 14 (7.6%) | 0 (0.0%) |
| Total | 405 (27.0%) | 456 (28.7%) |
Income Above Poverty by Sex and Age in Cassville
According to the poverty statistics in Cassville, males aged 5 years and females aged 5 years are the age groups that are most secure financially, with 100.0% of males and 100.0% of females in these age groups living above the poverty line.
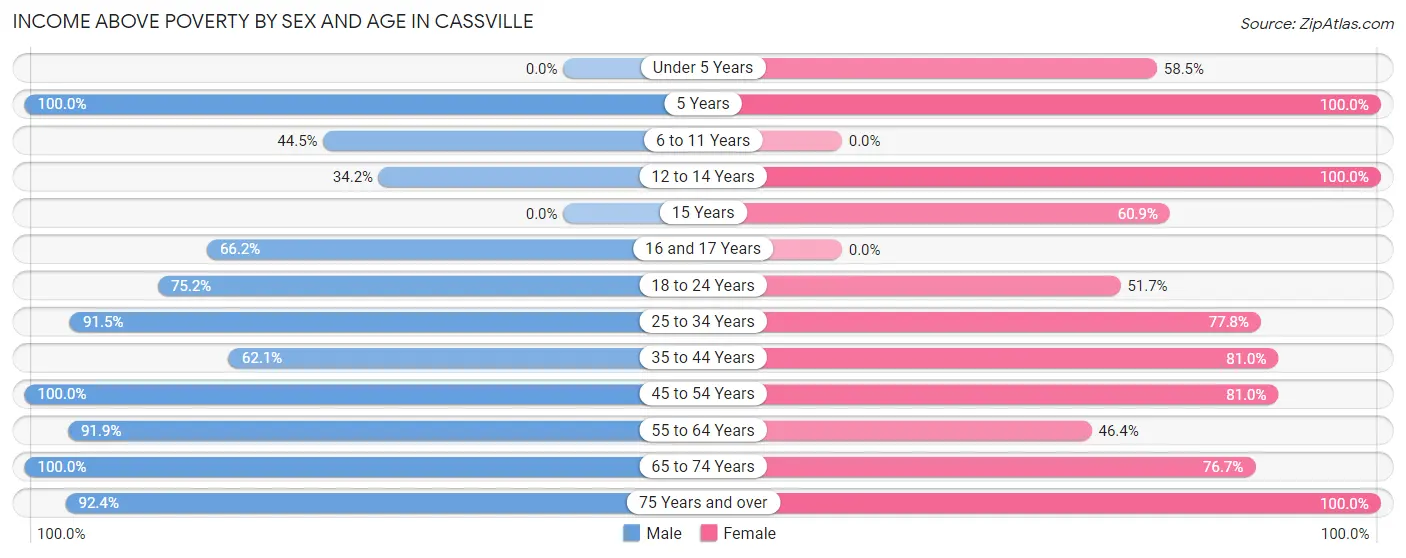
| Age Bracket | Male | Female |
| Under 5 Years | 0 (0.0%) | 131 (58.5%) |
| 5 Years | 21 (100.0%) | 61 (100.0%) |
| 6 to 11 Years | 53 (44.5%) | 0 (0.0%) |
| 12 to 14 Years | 38 (34.2%) | 14 (100.0%) |
| 15 Years | 0 (0.0%) | 28 (60.9%) |
| 16 and 17 Years | 43 (66.1%) | 0 (0.0%) |
| 18 to 24 Years | 79 (75.2%) | 60 (51.7%) |
| 25 to 34 Years | 238 (91.5%) | 70 (77.8%) |
| 35 to 44 Years | 144 (62.1%) | 222 (81.0%) |
| 45 to 54 Years | 46 (100.0%) | 141 (81.0%) |
| 55 to 64 Years | 171 (91.9%) | 51 (46.4%) |
| 65 to 74 Years | 93 (100.0%) | 234 (76.7%) |
| 75 Years and over | 170 (92.4%) | 119 (100.0%) |
| Total | 1,096 (73.0%) | 1,131 (71.3%) |
Income Below Poverty Among Married-Couple Families in Cassville
The poverty statistics for married-couple families in Cassville show that 11.8% or 58 of the total 493 families live below the poverty line. Families with 3 or 4 children have the highest poverty rate of 50.0%, comprising of 43 families. On the other hand, families with 1 or 2 children have the lowest poverty rate of 0.0%, which includes 0 families.
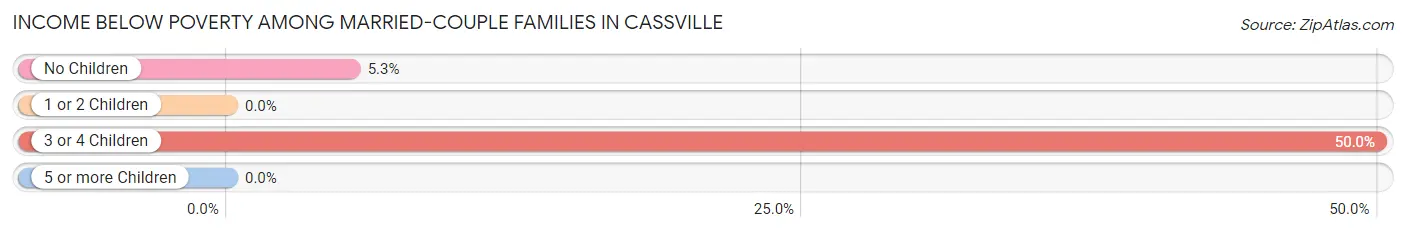
| Children | Above Poverty | Below Poverty |
| No Children | 266 (94.7%) | 15 (5.3%) |
| 1 or 2 Children | 126 (100.0%) | 0 (0.0%) |
| 3 or 4 Children | 43 (50.0%) | 43 (50.0%) |
| 5 or more Children | 0 (0.0%) | 0 (0.0%) |
| Total | 435 (88.2%) | 58 (11.8%) |
Income Below Poverty Among Single-Parent Households in Cassville
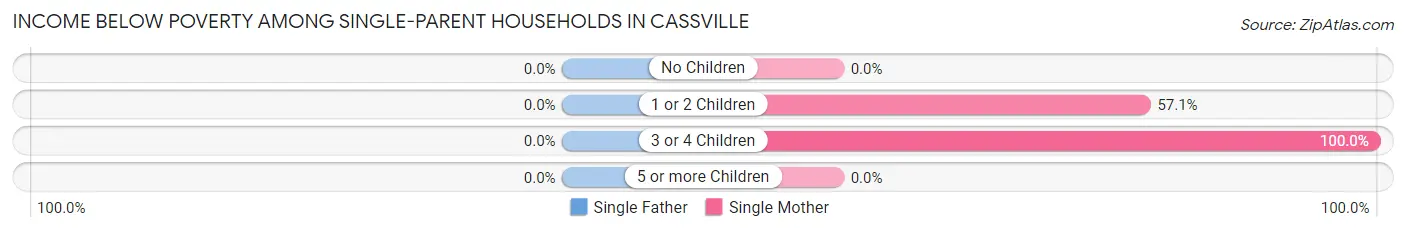
| Children | Single Father | Single Mother |
| No Children | 0 (0.0%) | 0 (0.0%) |
| 1 or 2 Children | 0 (0.0%) | 36 (57.1%) |
| 3 or 4 Children | 0 (0.0%) | 22 (100.0%) |
| 5 or more Children | 0 (0.0%) | 0 (0.0%) |
| Total | 0 (0.0%) | 58 (42.3%) |
Income Below Poverty Among Married-Couple vs Single-Parent Households in Cassville
The poverty data for Cassville shows that 58 of the married-couple family households (11.8%) and 58 of the single-parent households (21.5%) are living below the poverty level. Within the married-couple family households, those with 3 or 4 children have the highest poverty rate, with 43 households (50.0%) falling below the poverty line. Among the single-parent households, those with 3 or 4 children have the highest poverty rate, with 22 household (100.0%) living below poverty.
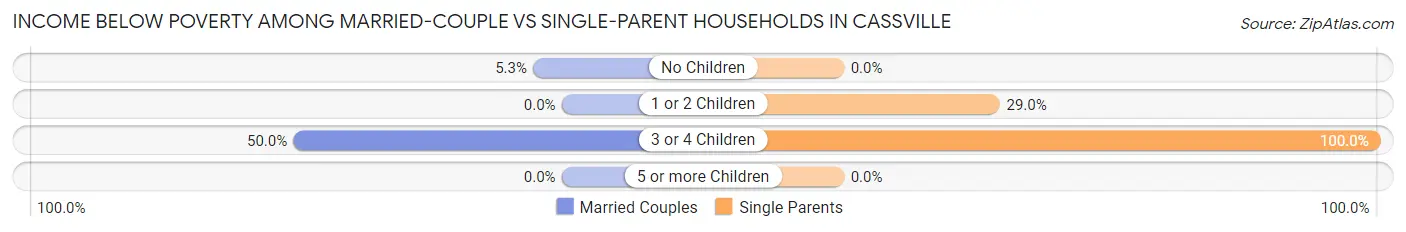
| Children | Married-Couple Families | Single-Parent Households |
| No Children | 15 (5.3%) | 0 (0.0%) |
| 1 or 2 Children | 0 (0.0%) | 36 (29.0%) |
| 3 or 4 Children | 43 (50.0%) | 22 (100.0%) |
| 5 or more Children | 0 (0.0%) | 0 (0.0%) |
| Total | 58 (11.8%) | 58 (21.5%) |
Race in Cassville
The most populous races in Cassville are White / Caucasian (2,867 | 89.8%), Two or more Races (211 | 6.6%), and Hispanic or Latino (80 | 2.5%).
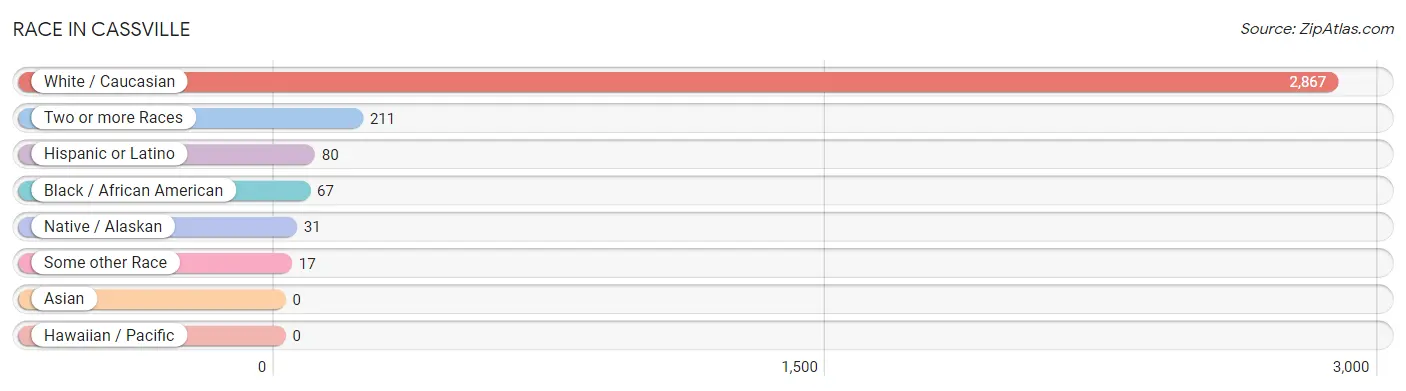
| Race | # Population | % Population |
| Asian | 0 | 0.0% |
| Black / African American | 67 | 2.1% |
| Hawaiian / Pacific | 0 | 0.0% |
| Hispanic or Latino | 80 | 2.5% |
| Native / Alaskan | 31 | 1.0% |
| White / Caucasian | 2,867 | 89.8% |
| Two or more Races | 211 | 6.6% |
| Some other Race | 17 | 0.5% |
| Total | 3,193 | 100.0% |
Ancestry in Cassville
The most populous ancestries reported in Cassville are German (486 | 15.2%), English (352 | 11.0%), American (301 | 9.4%), Irish (244 | 7.6%), and French (147 | 4.6%), together accounting for 47.9% of all Cassville residents.
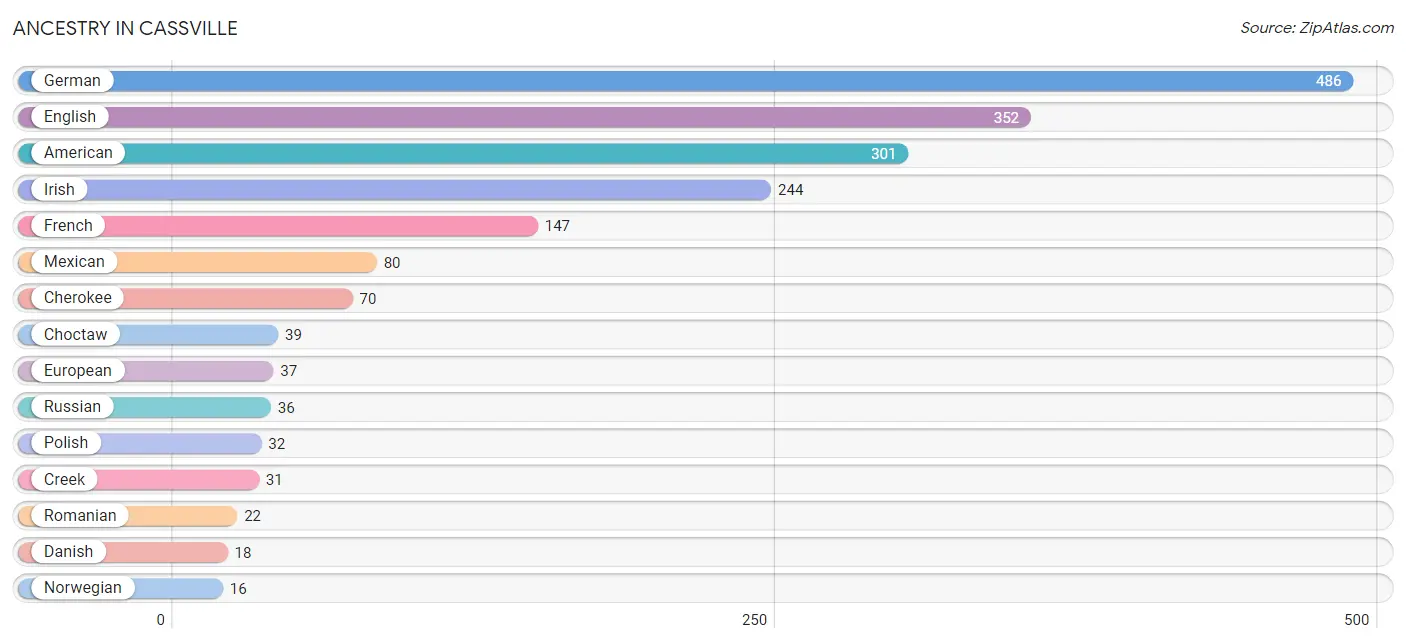
| Ancestry | # Population | % Population |
| American | 301 | 9.4% |
| Cherokee | 70 | 2.2% |
| Choctaw | 39 | 1.2% |
| Creek | 31 | 1.0% |
| Danish | 18 | 0.6% |
| English | 352 | 11.0% |
| European | 37 | 1.2% |
| French | 147 | 4.6% |
| German | 486 | 15.2% |
| Irish | 244 | 7.6% |
| Italian | 10 | 0.3% |
| Mexican | 80 | 2.5% |
| Navajo | 4 | 0.1% |
| Norwegian | 16 | 0.5% |
| Polish | 32 | 1.0% |
| Romanian | 22 | 0.7% |
| Russian | 36 | 1.1% |
| Scotch-Irish | 13 | 0.4% |
| Scottish | 15 | 0.5% |
| Swedish | 13 | 0.4% | View All 20 Rows |
Immigrants in Cassville

| Immigration Origin | # Population | % Population | View All 0 Rows |
Sex and Age in Cassville
Sex and Age in Cassville
The most populous age groups in Cassville are 25 to 29 Years (166 | 10.7%) for men and Under 5 Years (224 | 13.7%) for women.
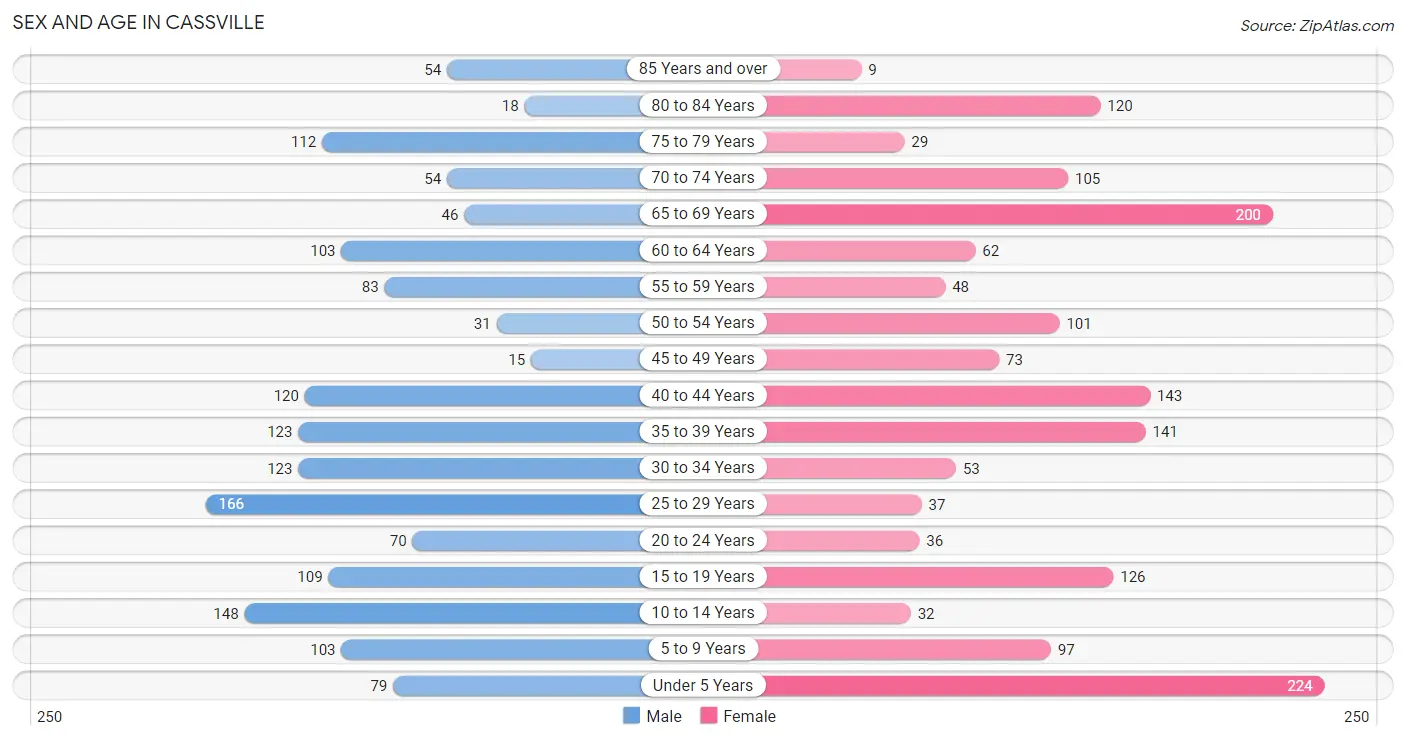
| Age Bracket | Male | Female |
| Under 5 Years | 79 (5.1%) | 224 (13.7%) |
| 5 to 9 Years | 103 (6.6%) | 97 (5.9%) |
| 10 to 14 Years | 148 (9.5%) | 32 (2.0%) |
| 15 to 19 Years | 109 (7.0%) | 126 (7.7%) |
| 20 to 24 Years | 70 (4.5%) | 36 (2.2%) |
| 25 to 29 Years | 166 (10.7%) | 37 (2.3%) |
| 30 to 34 Years | 123 (7.9%) | 53 (3.2%) |
| 35 to 39 Years | 123 (7.9%) | 141 (8.6%) |
| 40 to 44 Years | 120 (7.7%) | 143 (8.7%) |
| 45 to 49 Years | 15 (1.0%) | 73 (4.5%) |
| 50 to 54 Years | 31 (2.0%) | 101 (6.2%) |
| 55 to 59 Years | 83 (5.3%) | 48 (2.9%) |
| 60 to 64 Years | 103 (6.6%) | 62 (3.8%) |
| 65 to 69 Years | 46 (2.9%) | 200 (12.2%) |
| 70 to 74 Years | 54 (3.5%) | 105 (6.4%) |
| 75 to 79 Years | 112 (7.2%) | 29 (1.8%) |
| 80 to 84 Years | 18 (1.2%) | 120 (7.3%) |
| 85 Years and over | 54 (3.5%) | 9 (0.5%) |
| Total | 1,557 (100.0%) | 1,636 (100.0%) |
Families and Households in Cassville
Median Family Size in Cassville
The median family size in Cassville is 3.26 persons per family, with married-couple families (493 | 64.6%) accounting for the largest median family size of 3.4 persons per family. On the other hand, single male/father families (133 | 17.4%) represent the smallest median family size with 2.66 persons per family.
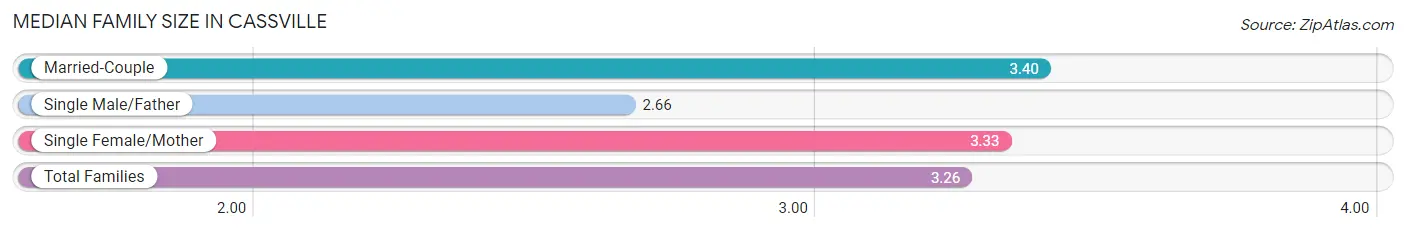
| Family Type | # Families | Family Size |
| Married-Couple | 493 (64.6%) | 3.40 |
| Single Male/Father | 133 (17.4%) | 2.66 |
| Single Female/Mother | 137 (18.0%) | 3.33 |
| Total Families | 763 (100.0%) | 3.26 |
Median Household Size in Cassville
The median household size in Cassville is 2.59 persons per household, with single female/mother households (137 | 11.5%) accounting for the largest median household size of 4.06 persons per household. non-family households (427 | 35.9%) represent the smallest median household size with 1.04 persons per household.
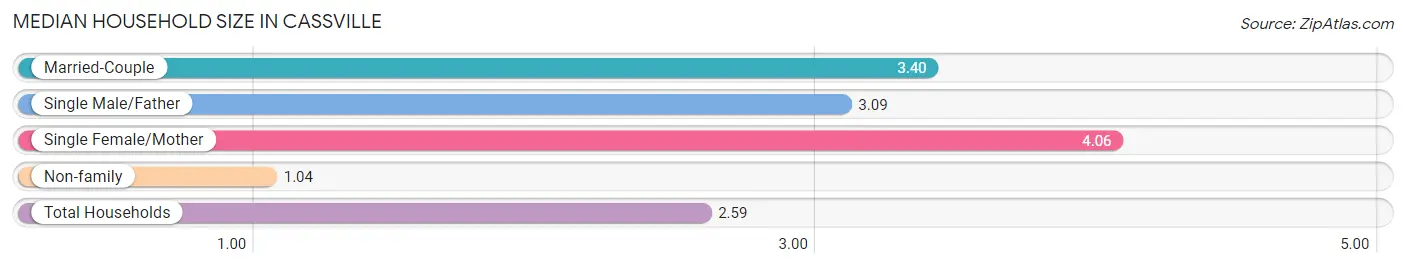
| Household Type | # Households | Household Size |
| Married-Couple | 493 (41.4%) | 3.40 |
| Single Male/Father | 133 (11.2%) | 3.09 |
| Single Female/Mother | 137 (11.5%) | 4.06 |
| Non-family | 427 (35.9%) | 1.04 |
| Total Households | 1,190 (100.0%) | 2.59 |
Household Size by Marriage Status in Cassville
Out of a total of 1,190 households in Cassville, 763 (64.1%) are family households, while 427 (35.9%) are nonfamily households. The most numerous type of family households are 2-person households, comprising 289, and the most common type of nonfamily households are 1-person households, comprising 401.
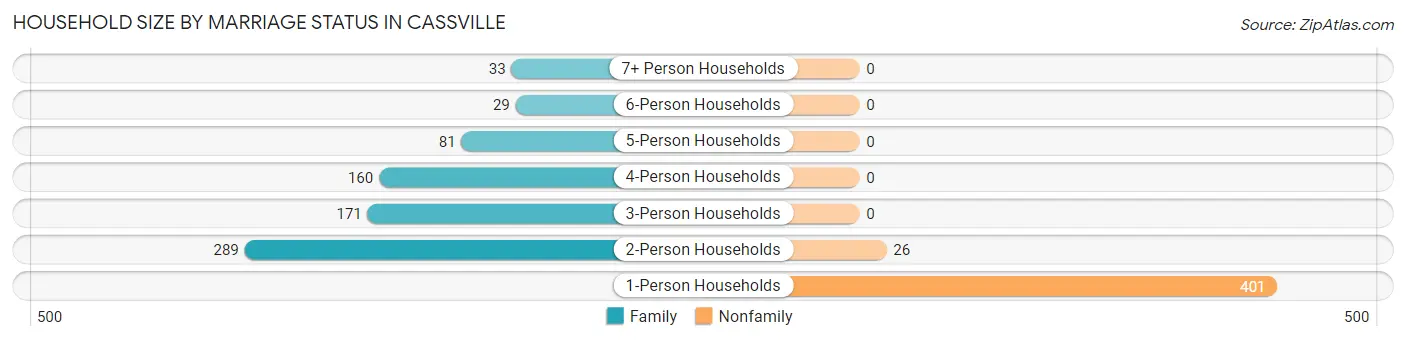
| Household Size | Family Households | Nonfamily Households |
| 1-Person Households | - | 401 (33.7%) |
| 2-Person Households | 289 (24.3%) | 26 (2.2%) |
| 3-Person Households | 171 (14.4%) | 0 (0.0%) |
| 4-Person Households | 160 (13.5%) | 0 (0.0%) |
| 5-Person Households | 81 (6.8%) | 0 (0.0%) |
| 6-Person Households | 29 (2.4%) | 0 (0.0%) |
| 7+ Person Households | 33 (2.8%) | 0 (0.0%) |
| Total | 763 (64.1%) | 427 (35.9%) |
Female Fertility in Cassville
Fertility by Age in Cassville
Average fertility rate in Cassville is 5.0 births per 1,000 women. Women in the age bracket of 20 to 34 years have the highest fertility rate with 24.0 births per 1,000 women. Women in the age bracket of 20 to 34 years acount for 100.0% of all women with births.
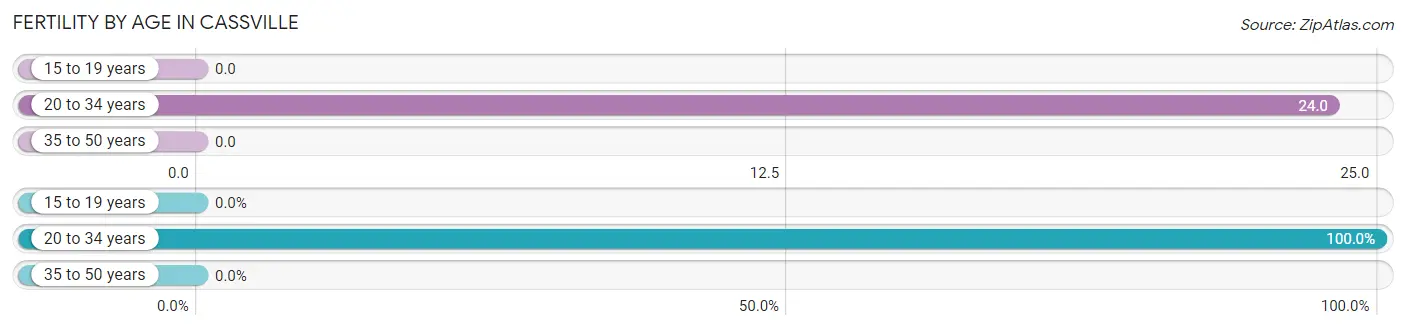
| Age Bracket | Women with Births | Births / 1,000 Women |
| 15 to 19 years | 0 (0.0%) | 0.0 |
| 20 to 34 years | 3 (100.0%) | 24.0 |
| 35 to 50 years | 0 (0.0%) | 0.0 |
| Total | 3 (100.0%) | 5.0 |
Fertility by Age by Marriage Status in Cassville
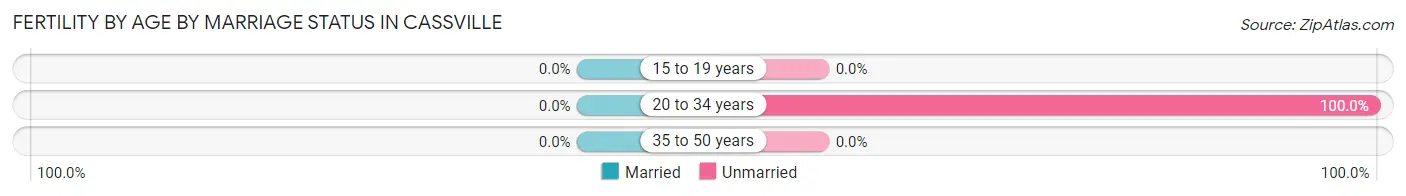
| Age Bracket | Married | Unmarried |
| 15 to 19 years | 0 (0.0%) | 0 (0.0%) |
| 20 to 34 years | 0 (0.0%) | 3 (100.0%) |
| 35 to 50 years | 0 (0.0%) | 0 (0.0%) |
| Total | 0 (0.0%) | 3 (100.0%) |
Fertility by Education in Cassville
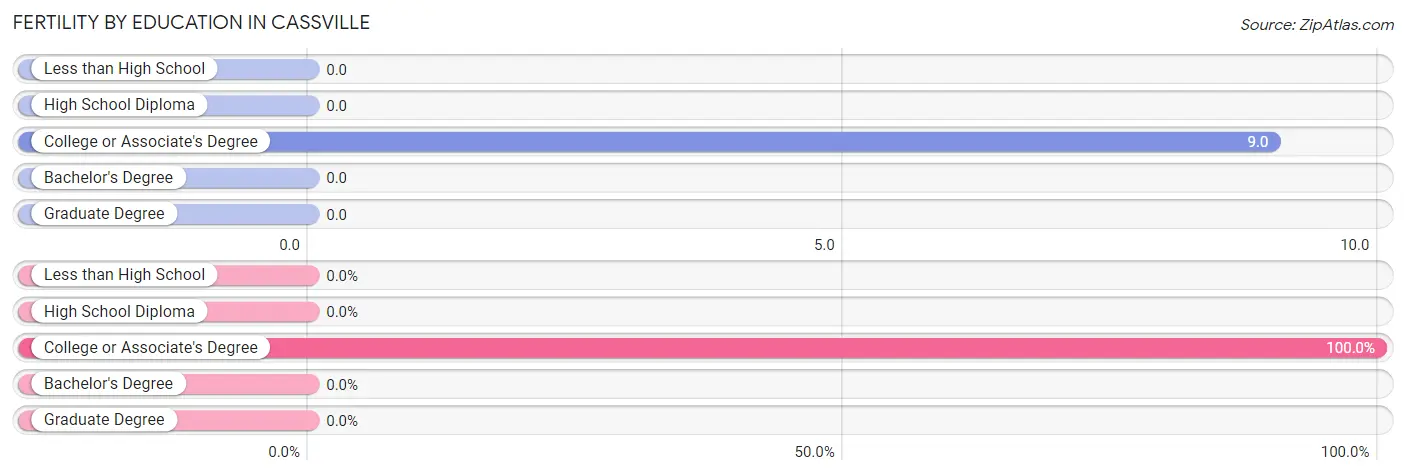
| Educational Attainment | Women with Births | Births / 1,000 Women |
| Less than High School | 0 (0.0%) | 0.0 |
| High School Diploma | 0 (0.0%) | 0.0 |
| College or Associate's Degree | 3 (100.0%) | 9.0 |
| Bachelor's Degree | 0 (0.0%) | 0.0 |
| Graduate Degree | 0 (0.0%) | 0.0 |
| Total | 3 (100.0%) | 5.0 |
Fertility by Education by Marriage Status in Cassville
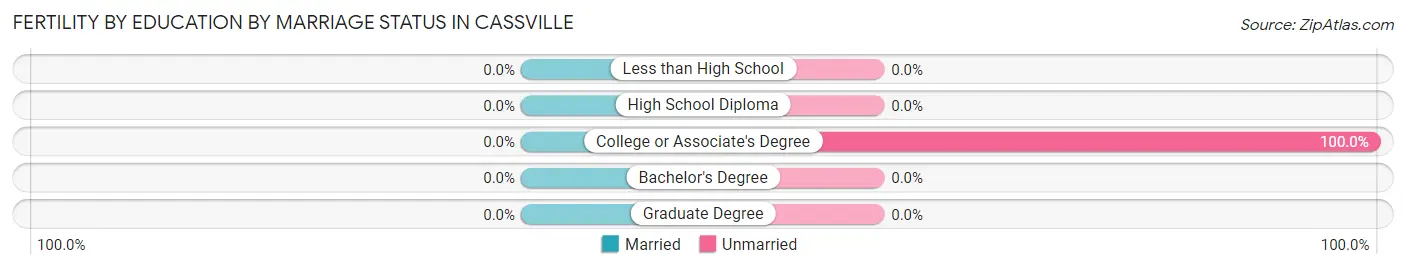
| Educational Attainment | Married | Unmarried |
| Less than High School | 0 (0.0%) | 0 (0.0%) |
| High School Diploma | 0 (0.0%) | 0 (0.0%) |
| College or Associate's Degree | 0 (0.0%) | 3 (100.0%) |
| Bachelor's Degree | 0 (0.0%) | 0 (0.0%) |
| Graduate Degree | 0 (0.0%) | 0 (0.0%) |
| Total | 0 (0.0%) | 3 (100.0%) |
Employment Characteristics in Cassville
Employment by Class of Employer in Cassville
Among the 1,372 employed individuals in Cassville, private company employees (1,074 | 78.3%), local government employees (100 | 7.3%), and not-for-profit organizations (84 | 6.1%) make up the most common classes of employment.
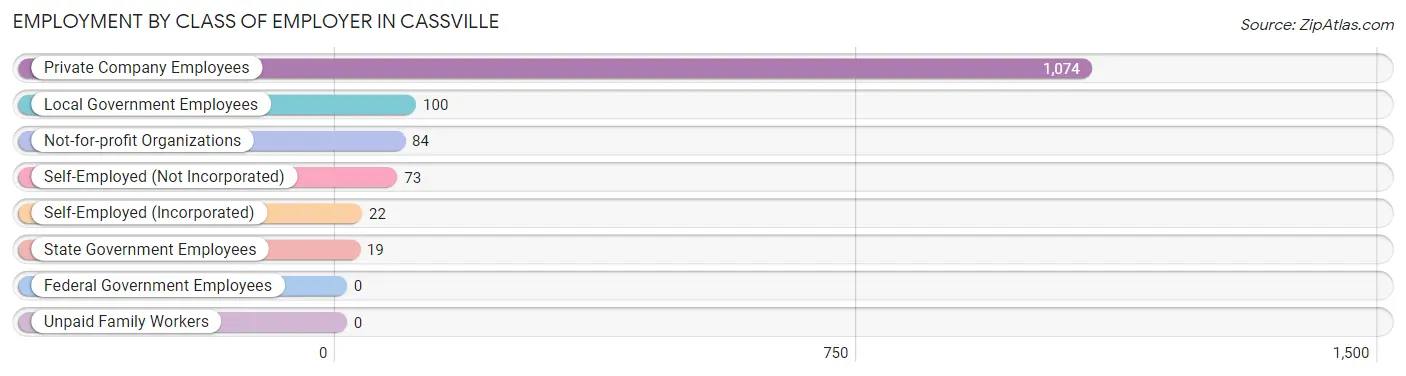
| Employer Class | # Employees | % Employees |
| Private Company Employees | 1,074 | 78.3% |
| Self-Employed (Incorporated) | 22 | 1.6% |
| Self-Employed (Not Incorporated) | 73 | 5.3% |
| Not-for-profit Organizations | 84 | 6.1% |
| Local Government Employees | 100 | 7.3% |
| State Government Employees | 19 | 1.4% |
| Federal Government Employees | 0 | 0.0% |
| Unpaid Family Workers | 0 | 0.0% |
| Total | 1,372 | 100.0% |
Employment Status by Age in Cassville
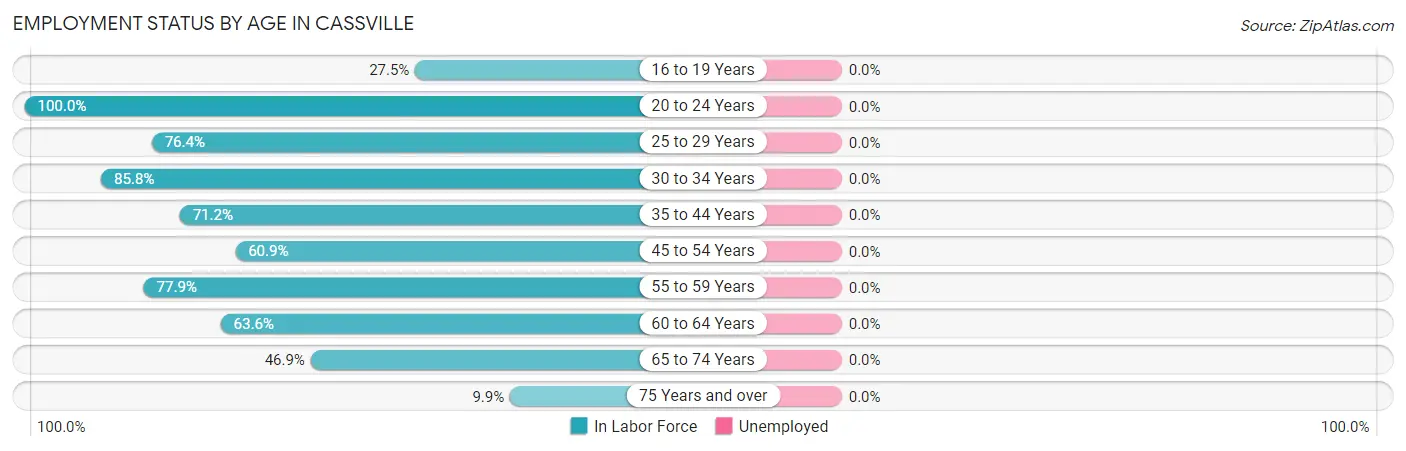
| Age Bracket | In Labor Force | Unemployed |
| 16 to 19 Years | 52 (27.5%) | 0 (0.0%) |
| 20 to 24 Years | 106 (100.0%) | 0 (0.0%) |
| 25 to 29 Years | 155 (76.4%) | 0 (0.0%) |
| 30 to 34 Years | 151 (85.8%) | 0 (0.0%) |
| 35 to 44 Years | 375 (71.2%) | 0 (0.0%) |
| 45 to 54 Years | 134 (60.9%) | 0 (0.0%) |
| 55 to 59 Years | 102 (77.9%) | 0 (0.0%) |
| 60 to 64 Years | 105 (63.6%) | 0 (0.0%) |
| 65 to 74 Years | 190 (46.9%) | 0 (0.0%) |
| 75 Years and over | 34 (9.9%) | 0 (0.0%) |
| Total | 1,404 (57.0%) | 0 (0.0%) |
Employment Status by Educational Attainment in Cassville
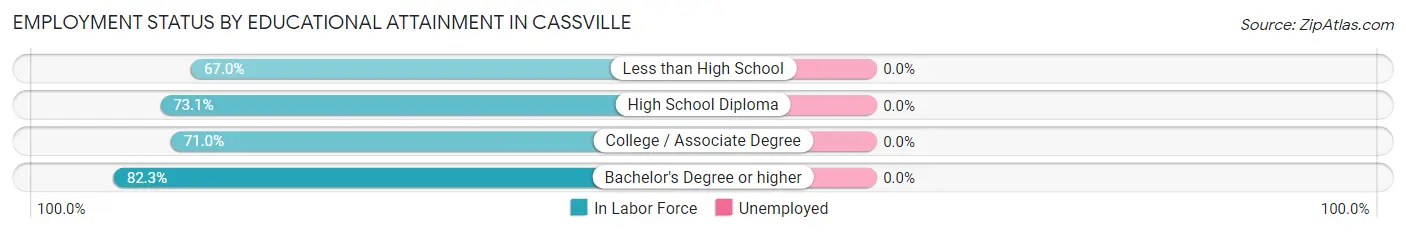
| Educational Attainment | In Labor Force | Unemployed |
| Less than High School | 201 (67.0%) | 0 (0.0%) |
| High School Diploma | 337 (73.1%) | 0 (0.0%) |
| College / Associate Degree | 377 (71.0%) | 0 (0.0%) |
| Bachelor's Degree or higher | 107 (82.3%) | 0 (0.0%) |
| Total | 1,022 (71.9%) | 0 (0.0%) |
Employment Occupations by Sex in Cassville
Management, Business, Science and Arts Occupations
The most common Management, Business, Science and Arts occupations in Cassville are Health Diagnosing & Treating (120 | 8.6%), Computers, Engineering & Science (97 | 6.9%), Community & Social Service (72 | 5.1%), Management (66 | 4.7%), and Health Technologists (63 | 4.5%).
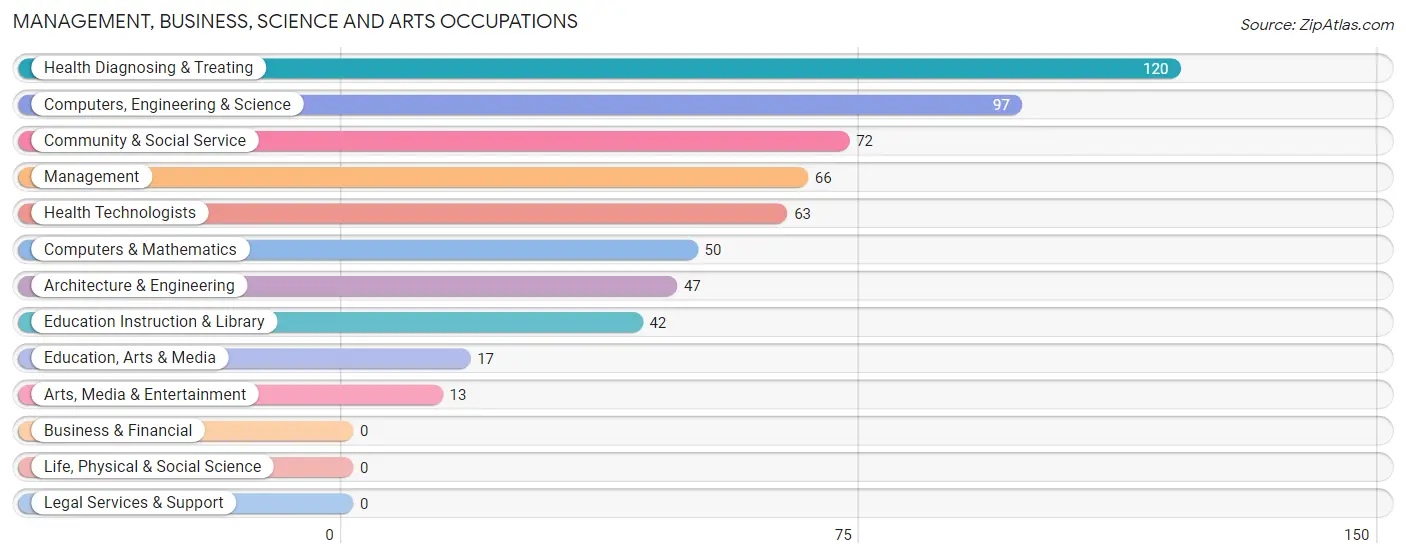
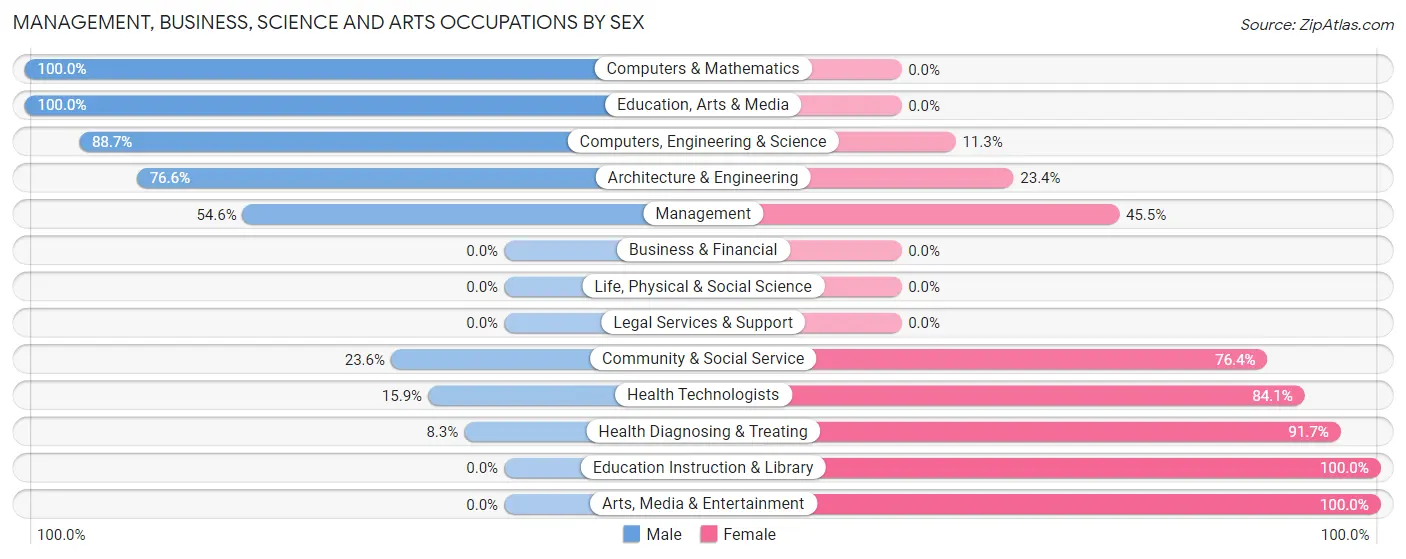
Management, Business, Science and Arts Occupations by Sex
Within the Management, Business, Science and Arts occupations in Cassville, the most male-oriented occupations are Computers & Mathematics (100.0%), Education, Arts & Media (100.0%), and Computers, Engineering & Science (88.7%), while the most female-oriented occupations are Education Instruction & Library (100.0%), Arts, Media & Entertainment (100.0%), and Health Diagnosing & Treating (91.7%).
| Occupation | Male | Female |
| Management | 36 (54.5%) | 30 (45.5%) |
| Business & Financial | 0 (0.0%) | 0 (0.0%) |
| Computers, Engineering & Science | 86 (88.7%) | 11 (11.3%) |
| Computers & Mathematics | 50 (100.0%) | 0 (0.0%) |
| Architecture & Engineering | 36 (76.6%) | 11 (23.4%) |
| Life, Physical & Social Science | 0 (0.0%) | 0 (0.0%) |
| Community & Social Service | 17 (23.6%) | 55 (76.4%) |
| Education, Arts & Media | 17 (100.0%) | 0 (0.0%) |
| Legal Services & Support | 0 (0.0%) | 0 (0.0%) |
| Education Instruction & Library | 0 (0.0%) | 42 (100.0%) |
| Arts, Media & Entertainment | 0 (0.0%) | 13 (100.0%) |
| Health Diagnosing & Treating | 10 (8.3%) | 110 (91.7%) |
| Health Technologists | 10 (15.9%) | 53 (84.1%) |
| Total (Category) | 149 (42.0%) | 206 (58.0%) |
| Total (Overall) | 863 (61.5%) | 541 (38.5%) |
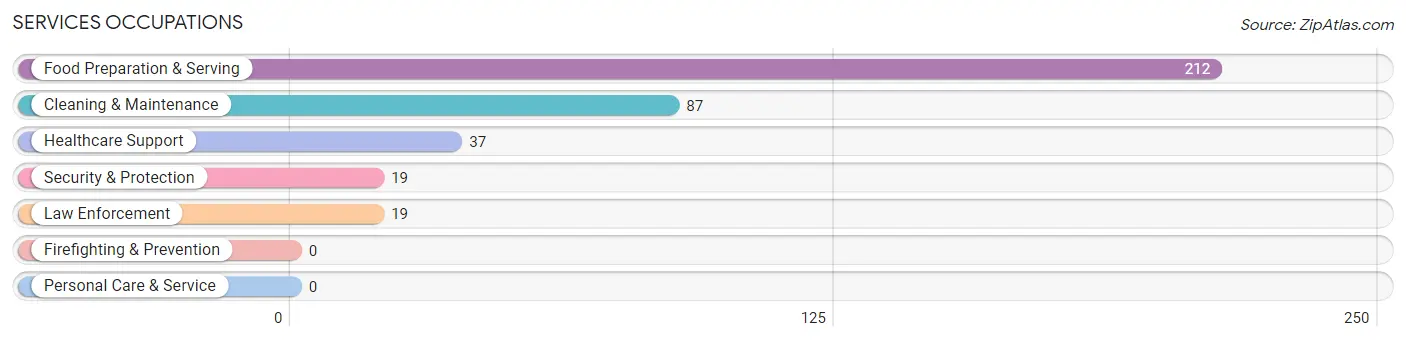
Services Occupations
The most common Services occupations in Cassville are Food Preparation & Serving (212 | 15.1%), Cleaning & Maintenance (87 | 6.2%), Healthcare Support (37 | 2.6%), Security & Protection (19 | 1.3%), and Law Enforcement (19 | 1.3%).
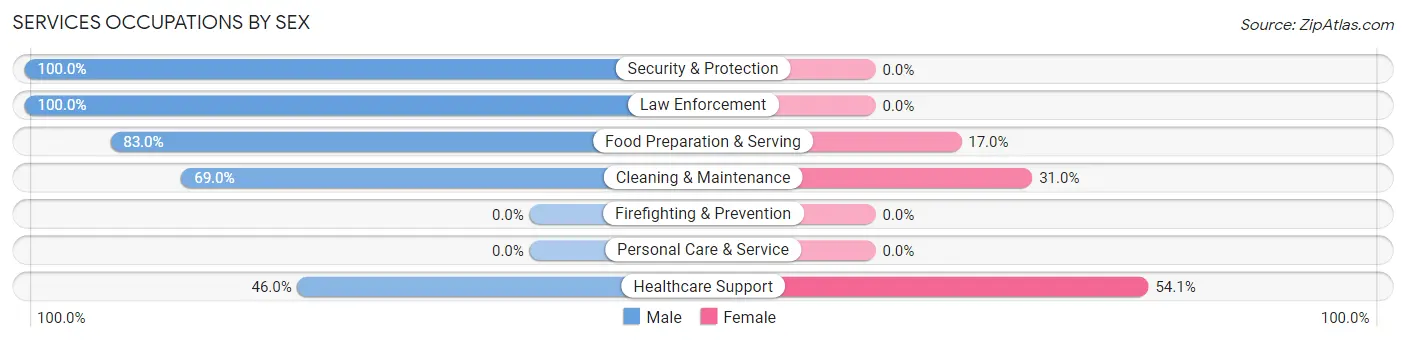
Services Occupations by Sex
Within the Services occupations in Cassville, the most male-oriented occupations are Security & Protection (100.0%), Law Enforcement (100.0%), and Food Preparation & Serving (83.0%), while the most female-oriented occupations are Healthcare Support (54.0%), Cleaning & Maintenance (31.0%), and Food Preparation & Serving (17.0%).
| Occupation | Male | Female |
| Healthcare Support | 17 (46.0%) | 20 (54.0%) |
| Security & Protection | 19 (100.0%) | 0 (0.0%) |
| Firefighting & Prevention | 0 (0.0%) | 0 (0.0%) |
| Law Enforcement | 19 (100.0%) | 0 (0.0%) |
| Food Preparation & Serving | 176 (83.0%) | 36 (17.0%) |
| Cleaning & Maintenance | 60 (69.0%) | 27 (31.0%) |
| Personal Care & Service | 0 (0.0%) | 0 (0.0%) |
| Total (Category) | 272 (76.6%) | 83 (23.4%) |
| Total (Overall) | 863 (61.5%) | 541 (38.5%) |
Sales and Office Occupations
The most common Sales and Office occupations in Cassville are Office & Administration (151 | 10.7%), and Sales & Related (51 | 3.6%).

Sales and Office Occupations by Sex

| Occupation | Male | Female |
| Sales & Related | 25 (49.0%) | 26 (51.0%) |
| Office & Administration | 27 (17.9%) | 124 (82.1%) |
| Total (Category) | 52 (25.7%) | 150 (74.3%) |
| Total (Overall) | 863 (61.5%) | 541 (38.5%) |
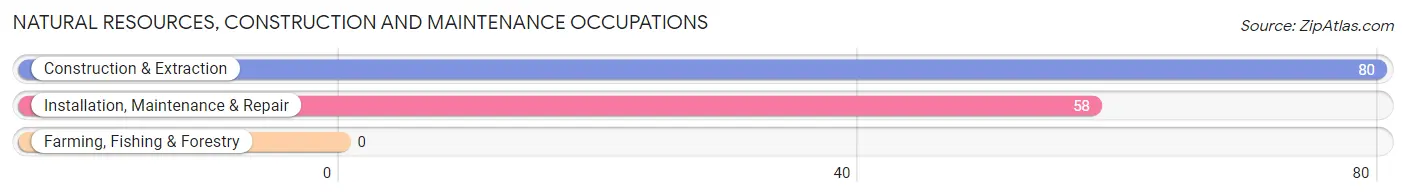
Natural Resources, Construction and Maintenance Occupations
The most common Natural Resources, Construction and Maintenance occupations in Cassville are Construction & Extraction (80 | 5.7%), and Installation, Maintenance & Repair (58 | 4.1%).
Natural Resources, Construction and Maintenance Occupations by Sex

| Occupation | Male | Female |
| Farming, Fishing & Forestry | 0 (0.0%) | 0 (0.0%) |
| Construction & Extraction | 80 (100.0%) | 0 (0.0%) |
| Installation, Maintenance & Repair | 43 (74.1%) | 15 (25.9%) |
| Total (Category) | 123 (89.1%) | 15 (10.9%) |
| Total (Overall) | 863 (61.5%) | 541 (38.5%) |
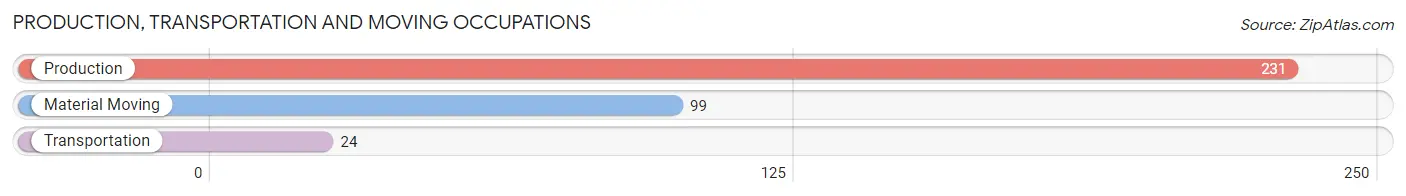
Production, Transportation and Moving Occupations
The most common Production, Transportation and Moving occupations in Cassville are Production (231 | 16.5%), Material Moving (99 | 7.0%), and Transportation (24 | 1.7%).
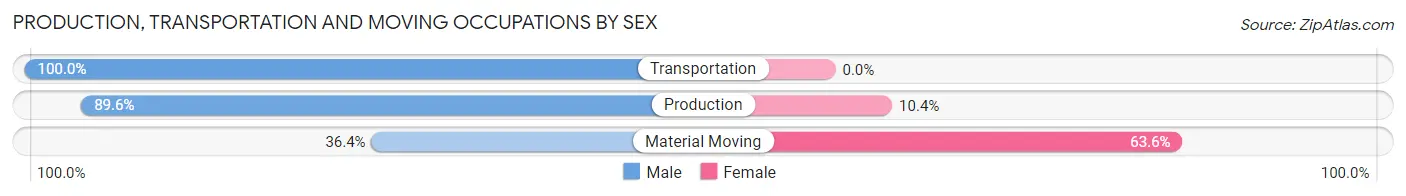
Production, Transportation and Moving Occupations by Sex
| Occupation | Male | Female |
| Production | 207 (89.6%) | 24 (10.4%) |
| Transportation | 24 (100.0%) | 0 (0.0%) |
| Material Moving | 36 (36.4%) | 63 (63.6%) |
| Total (Category) | 267 (75.4%) | 87 (24.6%) |
| Total (Overall) | 863 (61.5%) | 541 (38.5%) |
Employment Industries by Sex in Cassville
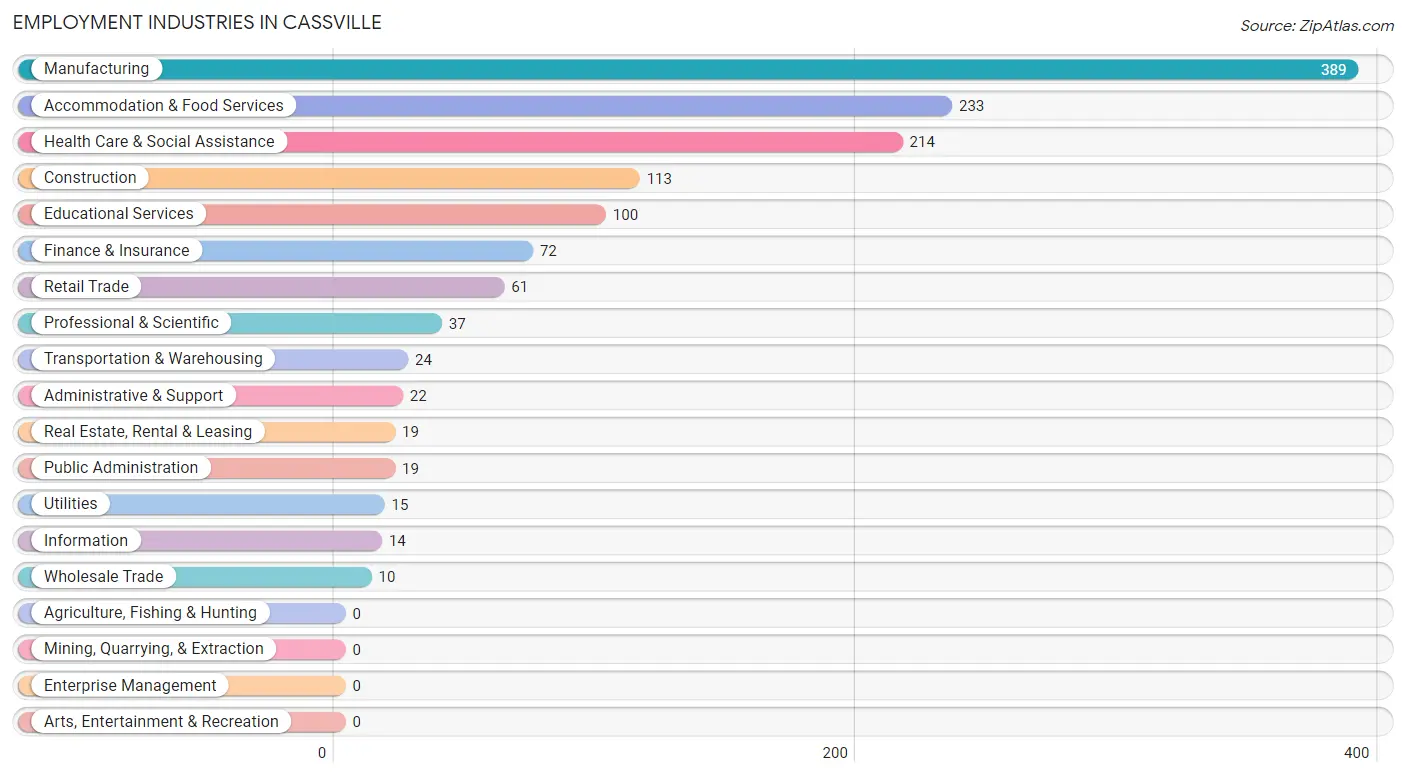
Employment Industries in Cassville
The major employment industries in Cassville include Manufacturing (389 | 27.7%), Accommodation & Food Services (233 | 16.6%), Health Care & Social Assistance (214 | 15.2%), Construction (113 | 8.1%), and Educational Services (100 | 7.1%).
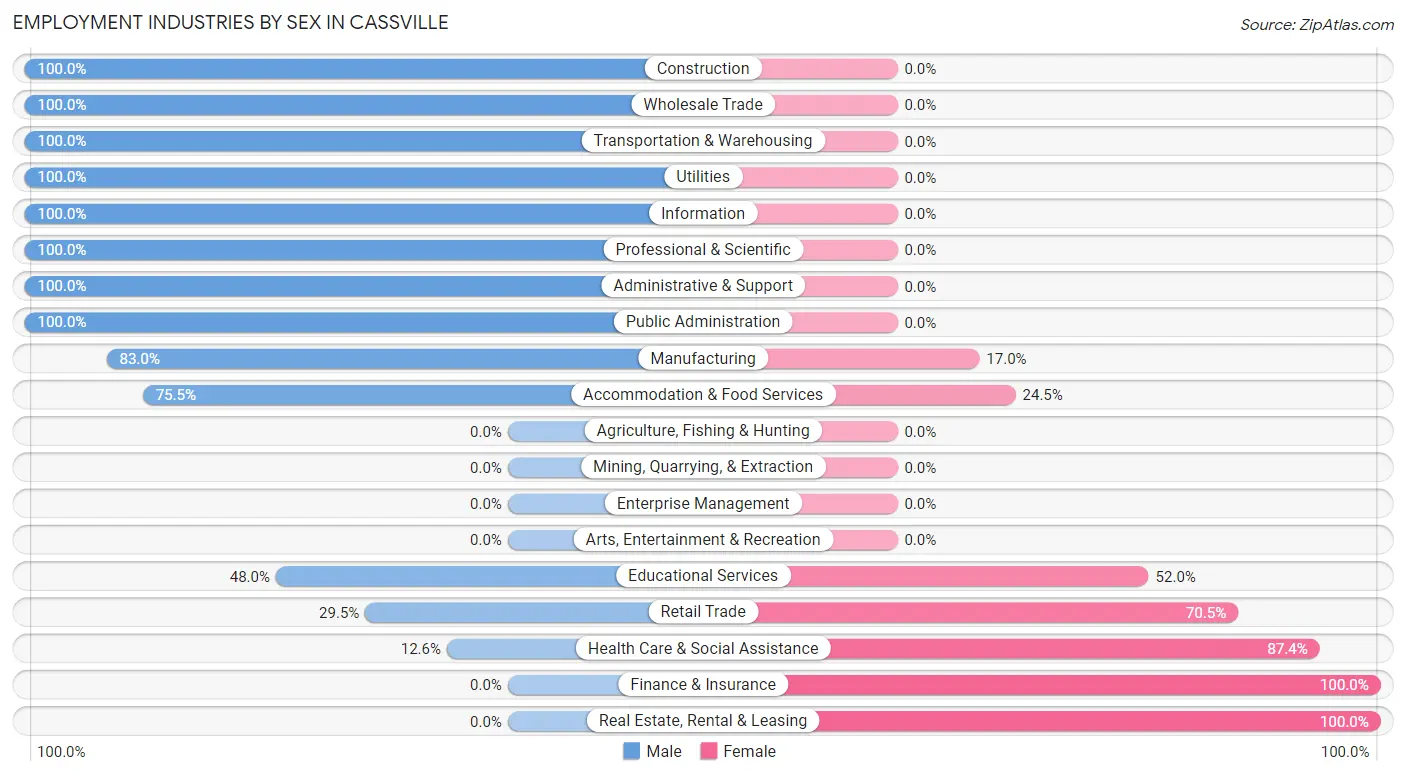
Employment Industries by Sex in Cassville
The Cassville industries that see more men than women are Construction (100.0%), Wholesale Trade (100.0%), and Transportation & Warehousing (100.0%), whereas the industries that tend to have a higher number of women are Finance & Insurance (100.0%), Real Estate, Rental & Leasing (100.0%), and Health Care & Social Assistance (87.4%).
| Industry | Male | Female |
| Agriculture, Fishing & Hunting | 0 (0.0%) | 0 (0.0%) |
| Mining, Quarrying, & Extraction | 0 (0.0%) | 0 (0.0%) |
| Construction | 113 (100.0%) | 0 (0.0%) |
| Manufacturing | 323 (83.0%) | 66 (17.0%) |
| Wholesale Trade | 10 (100.0%) | 0 (0.0%) |
| Retail Trade | 18 (29.5%) | 43 (70.5%) |
| Transportation & Warehousing | 24 (100.0%) | 0 (0.0%) |
| Utilities | 15 (100.0%) | 0 (0.0%) |
| Information | 14 (100.0%) | 0 (0.0%) |
| Finance & Insurance | 0 (0.0%) | 72 (100.0%) |
| Real Estate, Rental & Leasing | 0 (0.0%) | 19 (100.0%) |
| Professional & Scientific | 37 (100.0%) | 0 (0.0%) |
| Enterprise Management | 0 (0.0%) | 0 (0.0%) |
| Administrative & Support | 22 (100.0%) | 0 (0.0%) |
| Educational Services | 48 (48.0%) | 52 (52.0%) |
| Health Care & Social Assistance | 27 (12.6%) | 187 (87.4%) |
| Arts, Entertainment & Recreation | 0 (0.0%) | 0 (0.0%) |
| Accommodation & Food Services | 176 (75.5%) | 57 (24.5%) |
| Public Administration | 19 (100.0%) | 0 (0.0%) |
| Total | 863 (61.5%) | 541 (38.5%) |
Education in Cassville
School Enrollment in Cassville
The most common levels of schooling among the 793 students in Cassville are high school (186 | 23.5%), nursery / preschool (176 | 22.2%), and elementary school (132 | 16.7%).
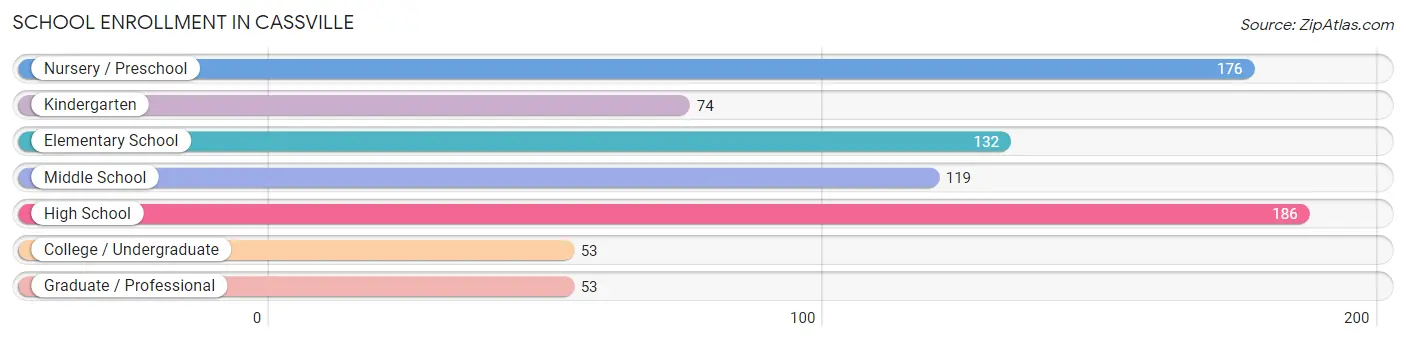
| School Level | # Students | % Students |
| Nursery / Preschool | 176 | 22.2% |
| Kindergarten | 74 | 9.3% |
| Elementary School | 132 | 16.7% |
| Middle School | 119 | 15.0% |
| High School | 186 | 23.5% |
| College / Undergraduate | 53 | 6.7% |
| Graduate / Professional | 53 | 6.7% |
| Total | 793 | 100.0% |
School Enrollment by Age by Funding Source in Cassville
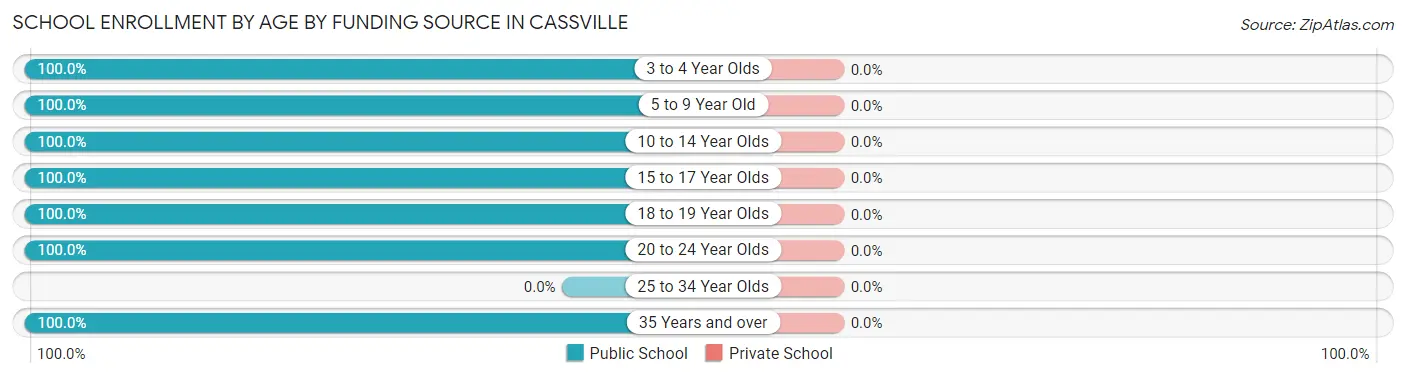
| Age Bracket | Public School | Private School |
| 3 to 4 Year Olds | 189 (100.0%) | 0 (0.0%) |
| 5 to 9 Year Old | 179 (100.0%) | 0 (0.0%) |
| 10 to 14 Year Olds | 180 (100.0%) | 0 (0.0%) |
| 15 to 17 Year Olds | 89 (100.0%) | 0 (0.0%) |
| 18 to 19 Year Olds | 88 (100.0%) | 0 (0.0%) |
| 20 to 24 Year Olds | 15 (100.0%) | 0 (0.0%) |
| 25 to 34 Year Olds | 0 (0.0%) | 0 (0.0%) |
| 35 Years and over | 53 (100.0%) | 0 (0.0%) |
| Total | 793 (100.0%) | 0 (0.0%) |
Educational Attainment by Field of Study in Cassville
Business (88 | 35.9%), education (55 | 22.5%), bio, nature & agricultural (24 | 9.8%), science & technology (23 | 9.4%), and multidisciplinary studies (19 | 7.8%) are the most common fields of study among 245 individuals in Cassville who have obtained a bachelor's degree or higher.
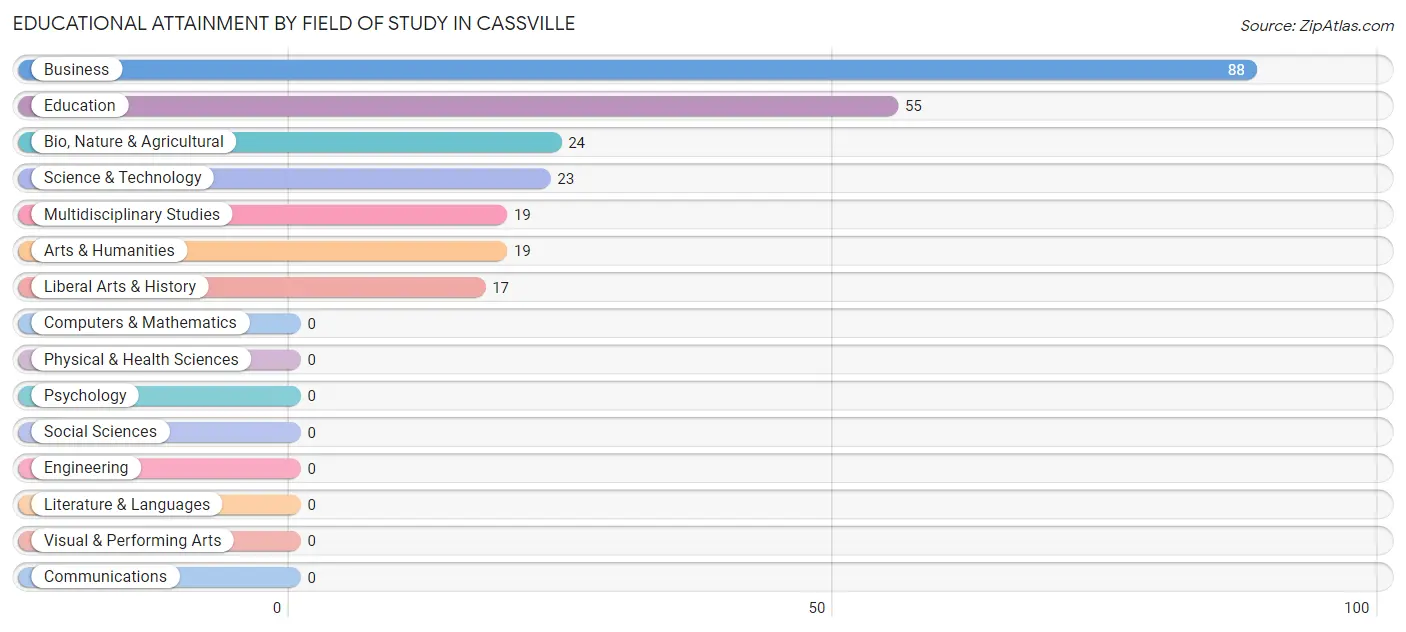
| Field of Study | # Graduates | % Graduates |
| Computers & Mathematics | 0 | 0.0% |
| Bio, Nature & Agricultural | 24 | 9.8% |
| Physical & Health Sciences | 0 | 0.0% |
| Psychology | 0 | 0.0% |
| Social Sciences | 0 | 0.0% |
| Engineering | 0 | 0.0% |
| Multidisciplinary Studies | 19 | 7.8% |
| Science & Technology | 23 | 9.4% |
| Business | 88 | 35.9% |
| Education | 55 | 22.5% |
| Literature & Languages | 0 | 0.0% |
| Liberal Arts & History | 17 | 6.9% |
| Visual & Performing Arts | 0 | 0.0% |
| Communications | 0 | 0.0% |
| Arts & Humanities | 19 | 7.8% |
| Total | 245 | 100.0% |
Transportation & Commute in Cassville
Vehicle Availability by Sex in Cassville
The most prevalent vehicle ownership categories in Cassville are males with 3 vehicles (316, accounting for 36.6%) and females with 3 vehicles (145, making up 62.1%).
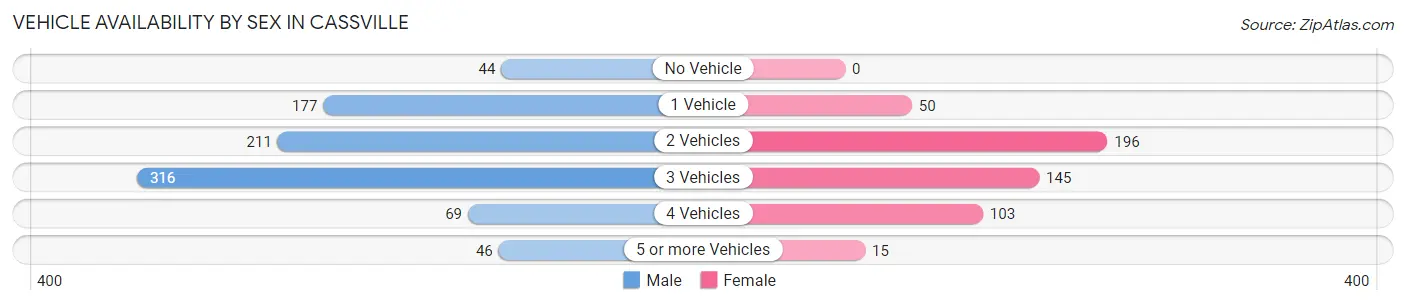
| Vehicles Available | Male | Female |
| No Vehicle | 44 (5.1%) | 0 (0.0%) |
| 1 Vehicle | 177 (20.5%) | 50 (9.8%) |
| 2 Vehicles | 211 (24.4%) | 196 (38.5%) |
| 3 Vehicles | 316 (36.6%) | 145 (28.5%) |
| 4 Vehicles | 69 (8.0%) | 103 (20.2%) |
| 5 or more Vehicles | 46 (5.3%) | 15 (2.9%) |
| Total | 863 (100.0%) | 509 (100.0%) |
Commute Time in Cassville
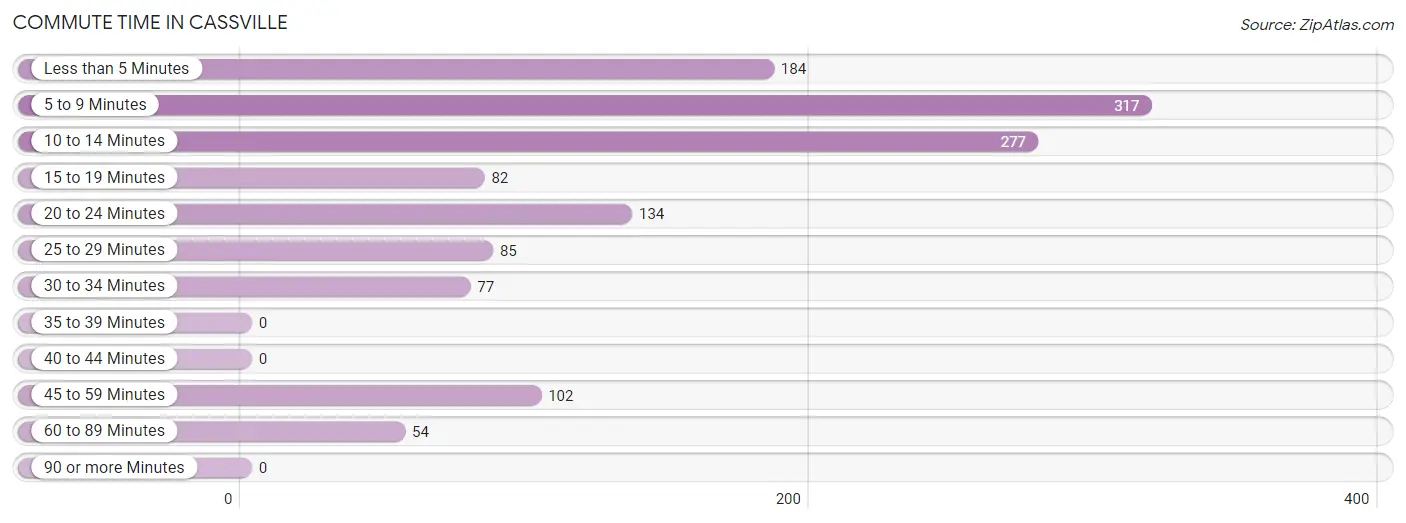
The most frequently occuring commute durations in Cassville are 5 to 9 minutes (317 commuters, 24.2%), 10 to 14 minutes (277 commuters, 21.1%), and less than 5 minutes (184 commuters, 14.0%).
| Commute Time | # Commuters | % Commuters |
| Less than 5 Minutes | 184 | 14.0% |
| 5 to 9 Minutes | 317 | 24.2% |
| 10 to 14 Minutes | 277 | 21.1% |
| 15 to 19 Minutes | 82 | 6.2% |
| 20 to 24 Minutes | 134 | 10.2% |
| 25 to 29 Minutes | 85 | 6.5% |
| 30 to 34 Minutes | 77 | 5.9% |
| 35 to 39 Minutes | 0 | 0.0% |
| 40 to 44 Minutes | 0 | 0.0% |
| 45 to 59 Minutes | 102 | 7.8% |
| 60 to 89 Minutes | 54 | 4.1% |
| 90 or more Minutes | 0 | 0.0% |
Commute Time by Sex in Cassville
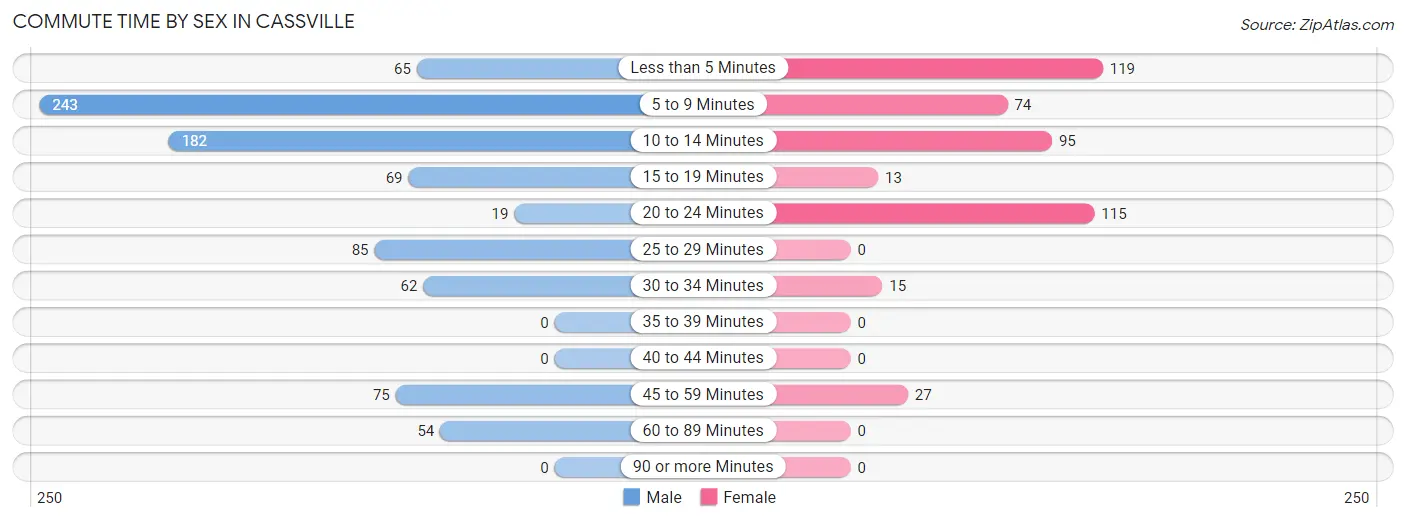
The most common commute times in Cassville are 5 to 9 minutes (243 commuters, 28.4%) for males and less than 5 minutes (119 commuters, 26.0%) for females.
| Commute Time | Male | Female |
| Less than 5 Minutes | 65 (7.6%) | 119 (26.0%) |
| 5 to 9 Minutes | 243 (28.4%) | 74 (16.2%) |
| 10 to 14 Minutes | 182 (21.3%) | 95 (20.7%) |
| 15 to 19 Minutes | 69 (8.1%) | 13 (2.8%) |
| 20 to 24 Minutes | 19 (2.2%) | 115 (25.1%) |
| 25 to 29 Minutes | 85 (10.0%) | 0 (0.0%) |
| 30 to 34 Minutes | 62 (7.3%) | 15 (3.3%) |
| 35 to 39 Minutes | 0 (0.0%) | 0 (0.0%) |
| 40 to 44 Minutes | 0 (0.0%) | 0 (0.0%) |
| 45 to 59 Minutes | 75 (8.8%) | 27 (5.9%) |
| 60 to 89 Minutes | 54 (6.3%) | 0 (0.0%) |
| 90 or more Minutes | 0 (0.0%) | 0 (0.0%) |
Time of Departure to Work by Sex in Cassville
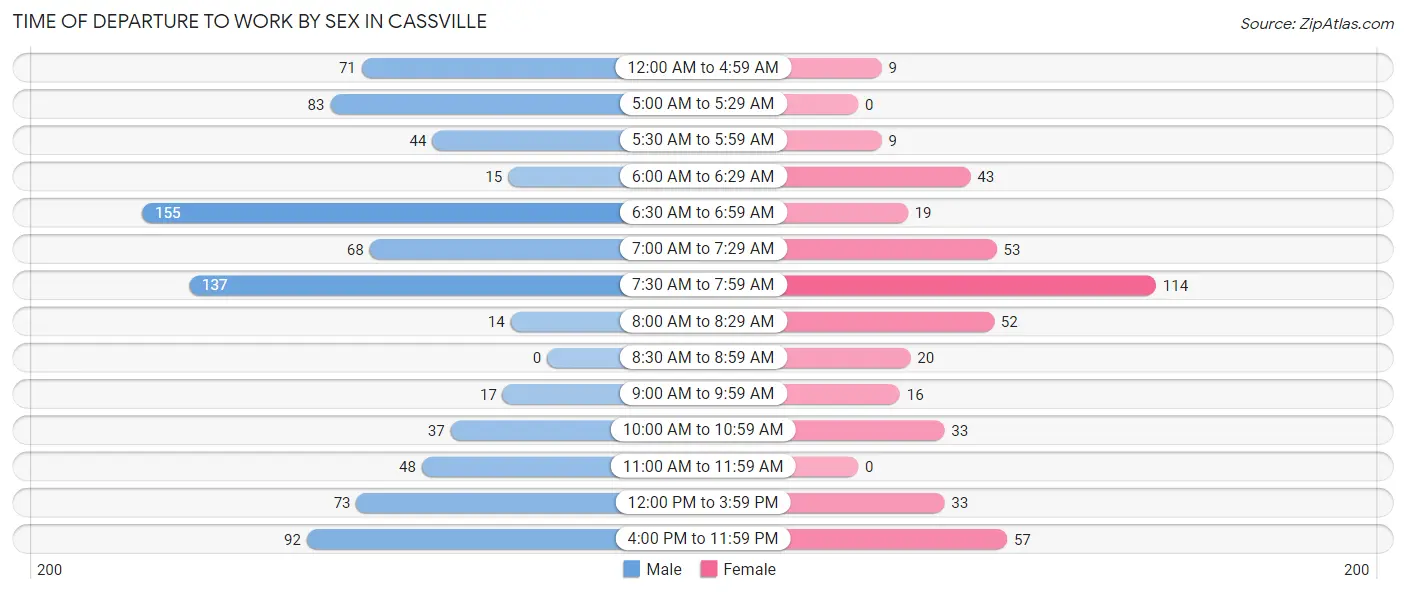
The most frequent times of departure to work in Cassville are 6:30 AM to 6:59 AM (155, 18.1%) for males and 7:30 AM to 7:59 AM (114, 24.9%) for females.
| Time of Departure | Male | Female |
| 12:00 AM to 4:59 AM | 71 (8.3%) | 9 (2.0%) |
| 5:00 AM to 5:29 AM | 83 (9.7%) | 0 (0.0%) |
| 5:30 AM to 5:59 AM | 44 (5.1%) | 9 (2.0%) |
| 6:00 AM to 6:29 AM | 15 (1.8%) | 43 (9.4%) |
| 6:30 AM to 6:59 AM | 155 (18.1%) | 19 (4.2%) |
| 7:00 AM to 7:29 AM | 68 (8.0%) | 53 (11.6%) |
| 7:30 AM to 7:59 AM | 137 (16.0%) | 114 (24.9%) |
| 8:00 AM to 8:29 AM | 14 (1.6%) | 52 (11.4%) |
| 8:30 AM to 8:59 AM | 0 (0.0%) | 20 (4.4%) |
| 9:00 AM to 9:59 AM | 17 (2.0%) | 16 (3.5%) |
| 10:00 AM to 10:59 AM | 37 (4.3%) | 33 (7.2%) |
| 11:00 AM to 11:59 AM | 48 (5.6%) | 0 (0.0%) |
| 12:00 PM to 3:59 PM | 73 (8.6%) | 33 (7.2%) |
| 4:00 PM to 11:59 PM | 92 (10.8%) | 57 (12.4%) |
| Total | 854 (100.0%) | 458 (100.0%) |
Housing Occupancy in Cassville
Occupancy by Ownership in Cassville
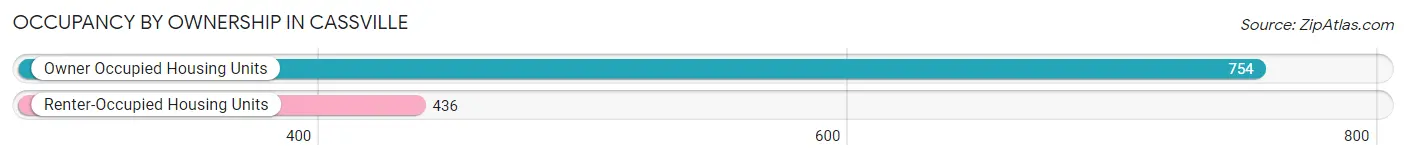
Of the total 1,190 dwellings in Cassville, owner-occupied units account for 754 (63.4%), while renter-occupied units make up 436 (36.6%).
| Occupancy | # Housing Units | % Housing Units |
| Owner Occupied Housing Units | 754 | 63.4% |
| Renter-Occupied Housing Units | 436 | 36.6% |
| Total Occupied Housing Units | 1,190 | 100.0% |
Occupancy by Household Size in Cassville
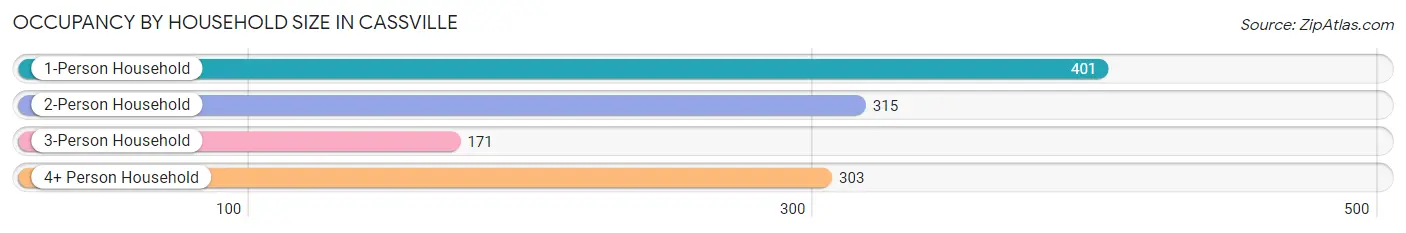
| Household Size | # Housing Units | % Housing Units |
| 1-Person Household | 401 | 33.7% |
| 2-Person Household | 315 | 26.5% |
| 3-Person Household | 171 | 14.4% |
| 4+ Person Household | 303 | 25.5% |
| Total Housing Units | 1,190 | 100.0% |
Occupancy by Ownership by Household Size in Cassville
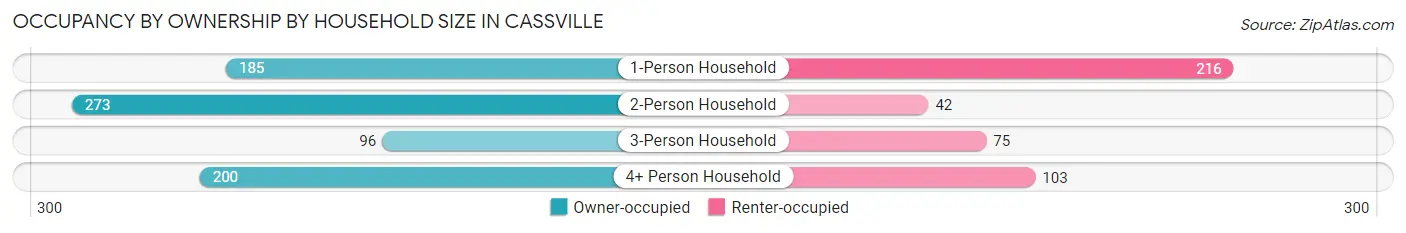
| Household Size | Owner-occupied | Renter-occupied |
| 1-Person Household | 185 (46.1%) | 216 (53.9%) |
| 2-Person Household | 273 (86.7%) | 42 (13.3%) |
| 3-Person Household | 96 (56.1%) | 75 (43.9%) |
| 4+ Person Household | 200 (66.0%) | 103 (34.0%) |
| Total Housing Units | 754 (63.4%) | 436 (36.6%) |
Occupancy by Educational Attainment in Cassville
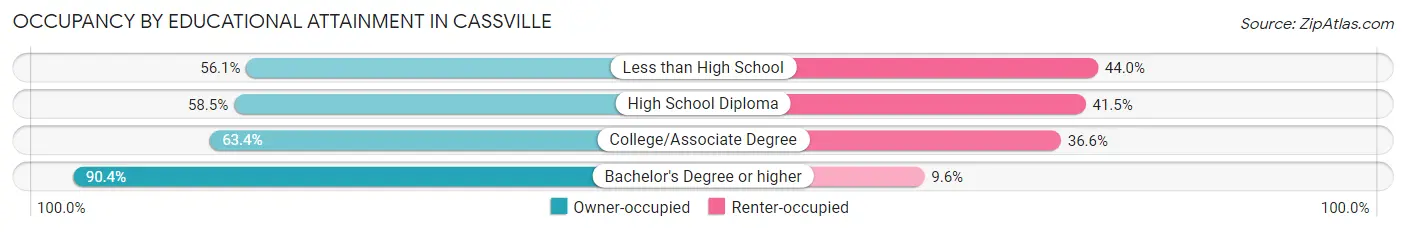
| Household Size | Owner-occupied | Renter-occupied |
| Less than High School | 125 (56.0%) | 98 (44.0%) |
| High School Diploma | 248 (58.5%) | 176 (41.5%) |
| College/Associate Degree | 258 (63.4%) | 149 (36.6%) |
| Bachelor's Degree or higher | 123 (90.4%) | 13 (9.6%) |
Occupancy by Age of Householder in Cassville
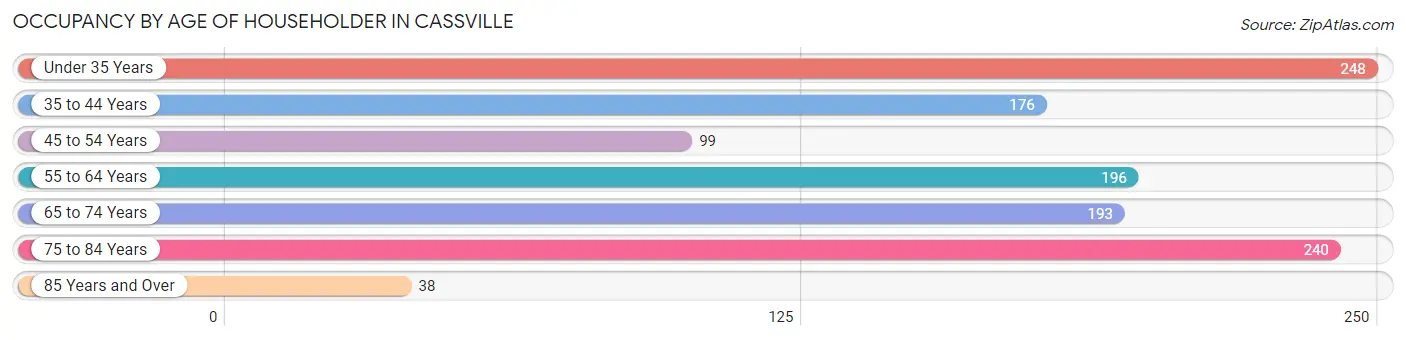
| Age Bracket | # Households | % Households |
| Under 35 Years | 248 | 20.8% |
| 35 to 44 Years | 176 | 14.8% |
| 45 to 54 Years | 99 | 8.3% |
| 55 to 64 Years | 196 | 16.5% |
| 65 to 74 Years | 193 | 16.2% |
| 75 to 84 Years | 240 | 20.2% |
| 85 Years and Over | 38 | 3.2% |
| Total | 1,190 | 100.0% |
Housing Finances in Cassville
Median Income by Occupancy in Cassville
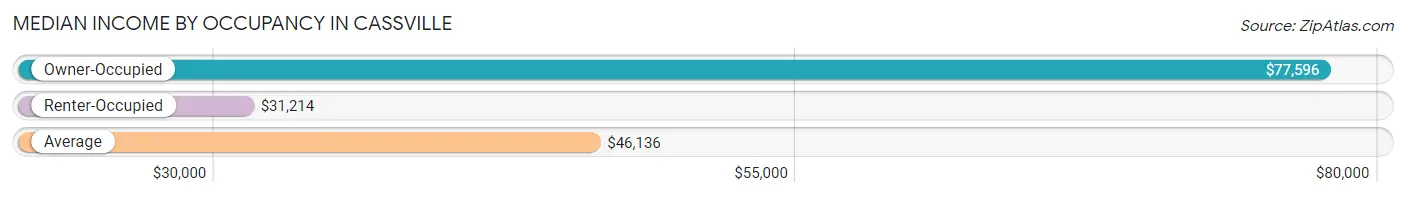
| Occupancy Type | # Households | Median Income |
| Owner-Occupied | 754 (63.4%) | $77,596 |
| Renter-Occupied | 436 (36.6%) | $31,214 |
| Average | 1,190 (100.0%) | $46,136 |
Occupancy by Householder Income Bracket in Cassville
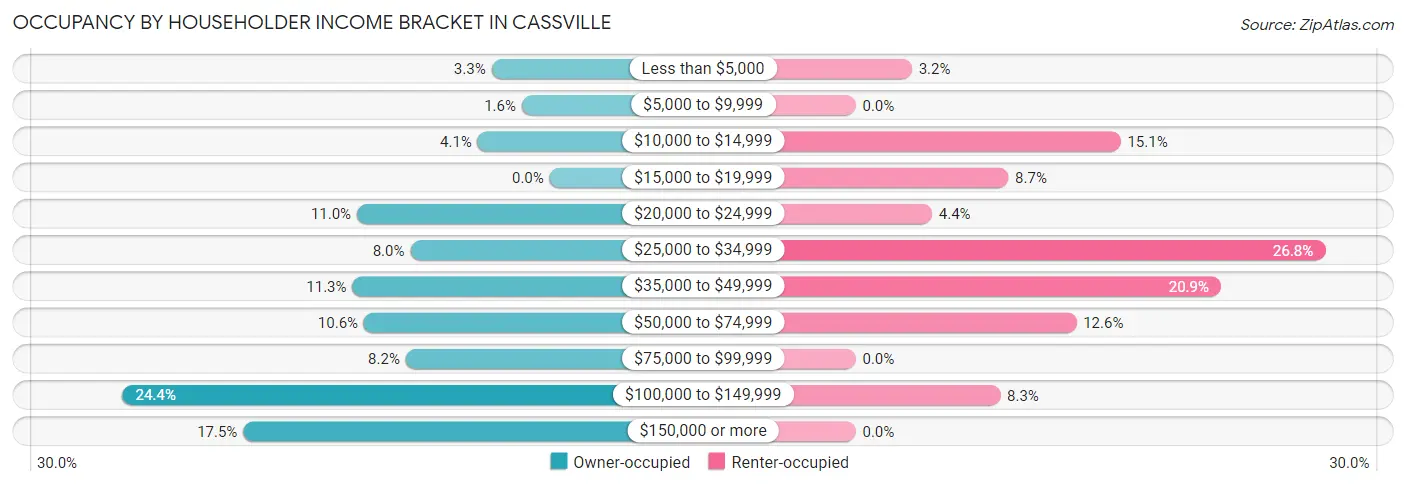
| Income Bracket | Owner-occupied | Renter-occupied |
| Less than $5,000 | 25 (3.3%) | 14 (3.2%) |
| $5,000 to $9,999 | 12 (1.6%) | 0 (0.0%) |
| $10,000 to $14,999 | 31 (4.1%) | 66 (15.1%) |
| $15,000 to $19,999 | 0 (0.0%) | 38 (8.7%) |
| $20,000 to $24,999 | 83 (11.0%) | 19 (4.4%) |
| $25,000 to $34,999 | 60 (8.0%) | 117 (26.8%) |
| $35,000 to $49,999 | 85 (11.3%) | 91 (20.9%) |
| $50,000 to $74,999 | 80 (10.6%) | 55 (12.6%) |
| $75,000 to $99,999 | 62 (8.2%) | 0 (0.0%) |
| $100,000 to $149,999 | 184 (24.4%) | 36 (8.3%) |
| $150,000 or more | 132 (17.5%) | 0 (0.0%) |
| Total | 754 (100.0%) | 436 (100.0%) |
Monthly Housing Cost Tiers in Cassville
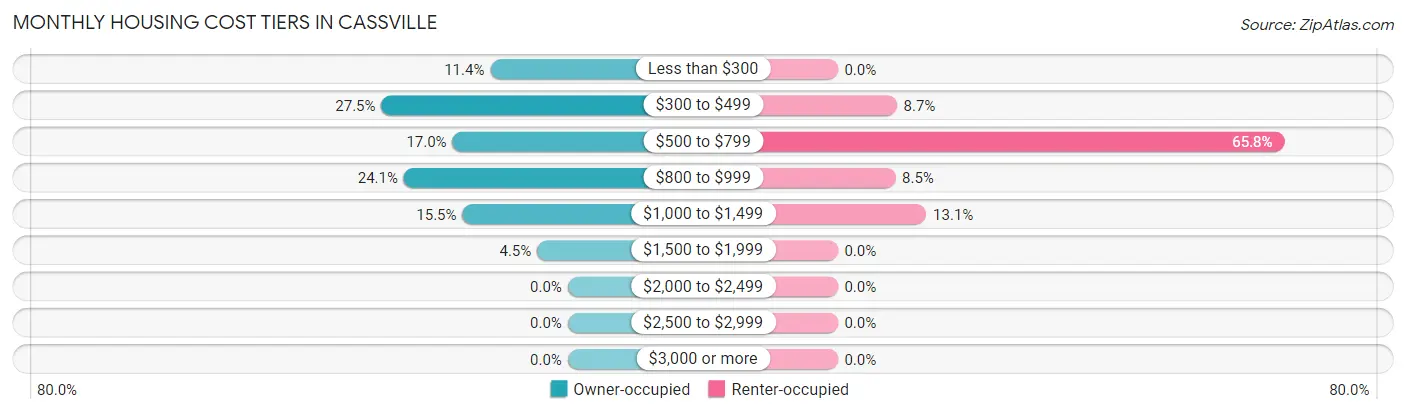
| Monthly Cost | Owner-occupied | Renter-occupied |
| Less than $300 | 86 (11.4%) | 0 (0.0%) |
| $300 to $499 | 207 (27.5%) | 38 (8.7%) |
| $500 to $799 | 128 (17.0%) | 287 (65.8%) |
| $800 to $999 | 182 (24.1%) | 37 (8.5%) |
| $1,000 to $1,499 | 117 (15.5%) | 57 (13.1%) |
| $1,500 to $1,999 | 34 (4.5%) | 0 (0.0%) |
| $2,000 to $2,499 | 0 (0.0%) | 0 (0.0%) |
| $2,500 to $2,999 | 0 (0.0%) | 0 (0.0%) |
| $3,000 or more | 0 (0.0%) | 0 (0.0%) |
| Total | 754 (100.0%) | 436 (100.0%) |
Physical Housing Characteristics in Cassville
Housing Structures in Cassville
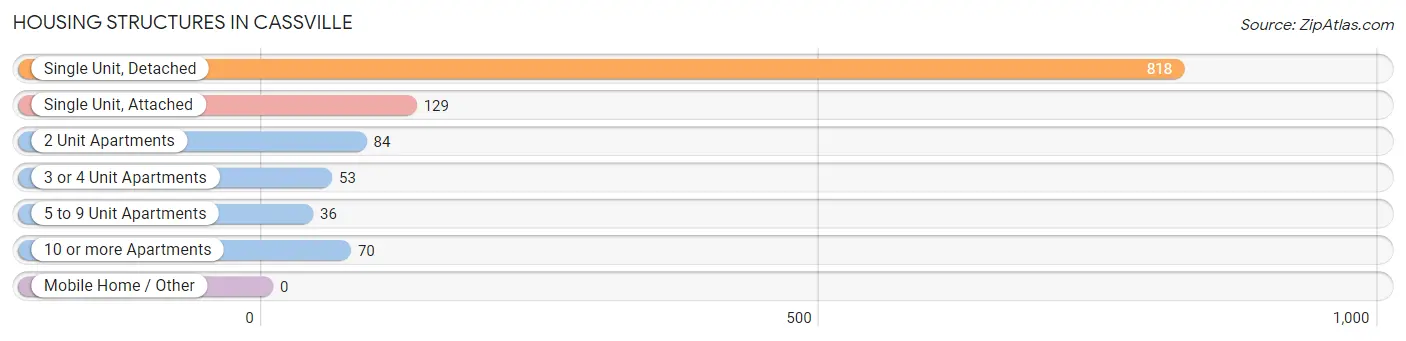
| Structure Type | # Housing Units | % Housing Units |
| Single Unit, Detached | 818 | 68.7% |
| Single Unit, Attached | 129 | 10.8% |
| 2 Unit Apartments | 84 | 7.1% |
| 3 or 4 Unit Apartments | 53 | 4.4% |
| 5 to 9 Unit Apartments | 36 | 3.0% |
| 10 or more Apartments | 70 | 5.9% |
| Mobile Home / Other | 0 | 0.0% |
| Total | 1,190 | 100.0% |
Housing Structures by Occupancy in Cassville
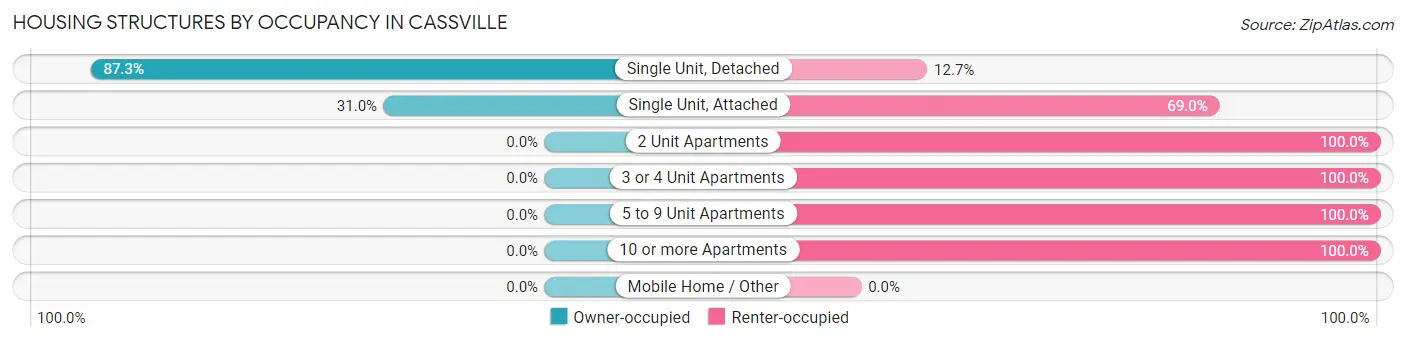
| Structure Type | Owner-occupied | Renter-occupied |
| Single Unit, Detached | 714 (87.3%) | 104 (12.7%) |
| Single Unit, Attached | 40 (31.0%) | 89 (69.0%) |
| 2 Unit Apartments | 0 (0.0%) | 84 (100.0%) |
| 3 or 4 Unit Apartments | 0 (0.0%) | 53 (100.0%) |
| 5 to 9 Unit Apartments | 0 (0.0%) | 36 (100.0%) |
| 10 or more Apartments | 0 (0.0%) | 70 (100.0%) |
| Mobile Home / Other | 0 (0.0%) | 0 (0.0%) |
| Total | 754 (63.4%) | 436 (36.6%) |
Housing Structures by Number of Rooms in Cassville
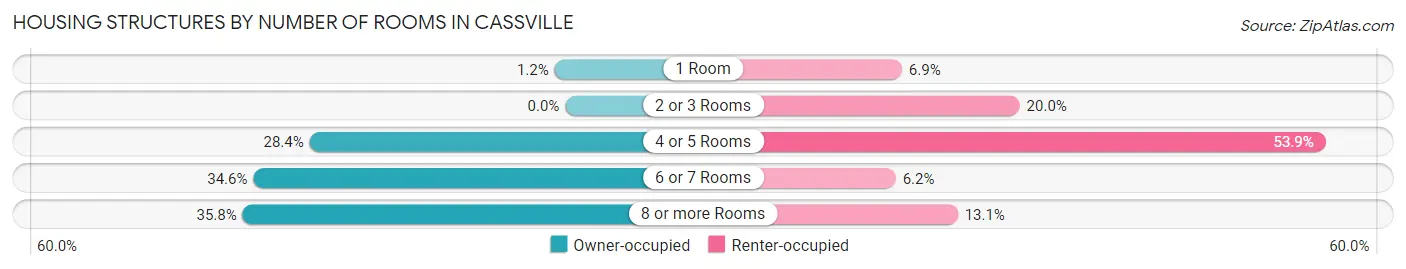
| Number of Rooms | Owner-occupied | Renter-occupied |
| 1 Room | 9 (1.2%) | 30 (6.9%) |
| 2 or 3 Rooms | 0 (0.0%) | 87 (20.0%) |
| 4 or 5 Rooms | 214 (28.4%) | 235 (53.9%) |
| 6 or 7 Rooms | 261 (34.6%) | 27 (6.2%) |
| 8 or more Rooms | 270 (35.8%) | 57 (13.1%) |
| Total | 754 (100.0%) | 436 (100.0%) |
Housing Structure by Heating Type in Cassville
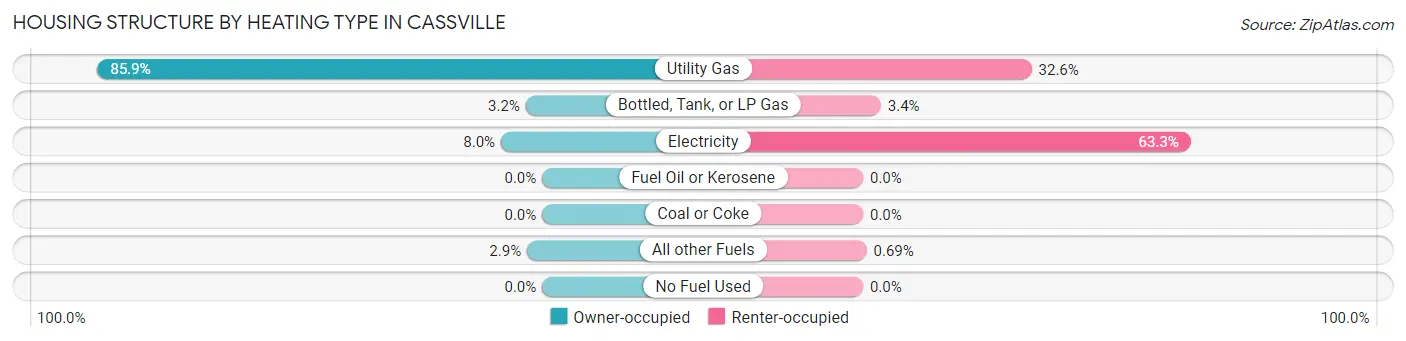
| Heating Type | Owner-occupied | Renter-occupied |
| Utility Gas | 648 (85.9%) | 142 (32.6%) |
| Bottled, Tank, or LP Gas | 24 (3.2%) | 15 (3.4%) |
| Electricity | 60 (8.0%) | 276 (63.3%) |
| Fuel Oil or Kerosene | 0 (0.0%) | 0 (0.0%) |
| Coal or Coke | 0 (0.0%) | 0 (0.0%) |
| All other Fuels | 22 (2.9%) | 3 (0.7%) |
| No Fuel Used | 0 (0.0%) | 0 (0.0%) |
| Total | 754 (100.0%) | 436 (100.0%) |
Household Vehicle Usage in Cassville
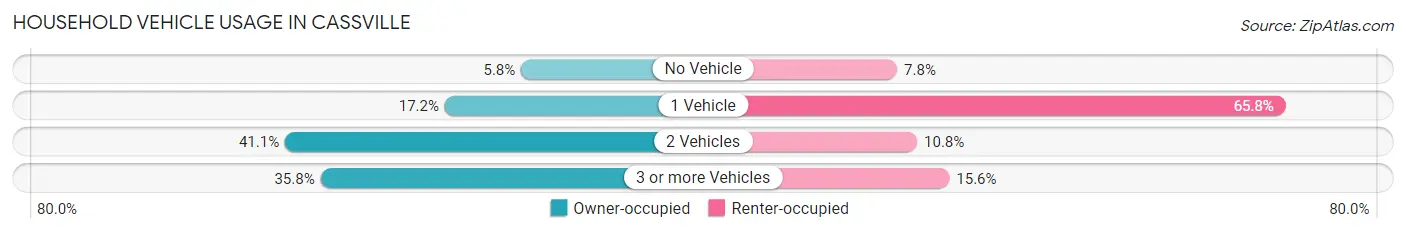
| Vehicles per Household | Owner-occupied | Renter-occupied |
| No Vehicle | 44 (5.8%) | 34 (7.8%) |
| 1 Vehicle | 130 (17.2%) | 287 (65.8%) |
| 2 Vehicles | 310 (41.1%) | 47 (10.8%) |
| 3 or more Vehicles | 270 (35.8%) | 68 (15.6%) |
| Total | 754 (100.0%) | 436 (100.0%) |
Real Estate & Mortgages in Cassville
Real Estate and Mortgage Overview in Cassville
| Characteristic | Without Mortgage | With Mortgage |
| Housing Units | 363 | 391 |
| Median Property Value | $160,500 | $129,100 |
| Median Household Income | $40,711 | $95 |
| Monthly Housing Costs | $386 | $0 |
| Real Estate Taxes | $799 | $34 |
Property Value by Mortgage Status in Cassville
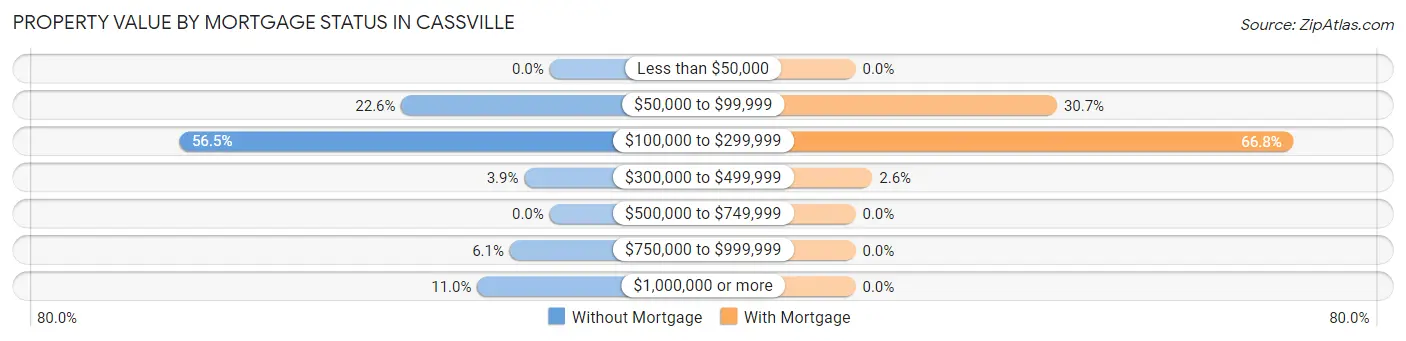
| Property Value | Without Mortgage | With Mortgage |
| Less than $50,000 | 0 (0.0%) | 0 (0.0%) |
| $50,000 to $99,999 | 82 (22.6%) | 120 (30.7%) |
| $100,000 to $299,999 | 205 (56.5%) | 261 (66.7%) |
| $300,000 to $499,999 | 14 (3.9%) | 10 (2.6%) |
| $500,000 to $749,999 | 0 (0.0%) | 0 (0.0%) |
| $750,000 to $999,999 | 22 (6.1%) | 0 (0.0%) |
| $1,000,000 or more | 40 (11.0%) | 0 (0.0%) |
| Total | 363 (100.0%) | 391 (100.0%) |
Household Income by Mortgage Status in Cassville
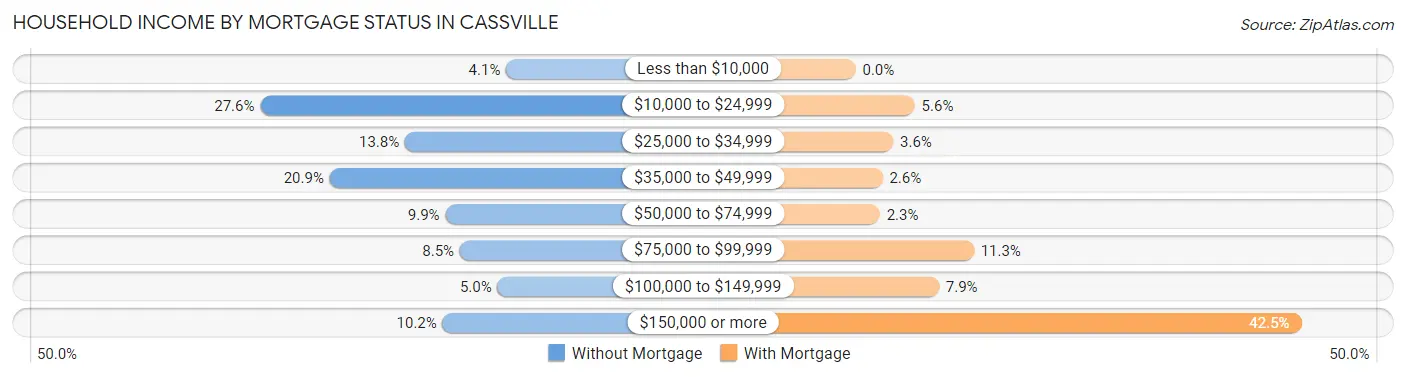
| Household Income | Without Mortgage | With Mortgage |
| Less than $10,000 | 15 (4.1%) | 0 (0.0%) |
| $10,000 to $24,999 | 100 (27.6%) | 22 (5.6%) |
| $25,000 to $34,999 | 50 (13.8%) | 14 (3.6%) |
| $35,000 to $49,999 | 76 (20.9%) | 10 (2.6%) |
| $50,000 to $74,999 | 36 (9.9%) | 9 (2.3%) |
| $75,000 to $99,999 | 31 (8.5%) | 44 (11.3%) |
| $100,000 to $149,999 | 18 (5.0%) | 31 (7.9%) |
| $150,000 or more | 37 (10.2%) | 166 (42.5%) |
| Total | 363 (100.0%) | 391 (100.0%) |
Property Value to Household Income Ratio in Cassville
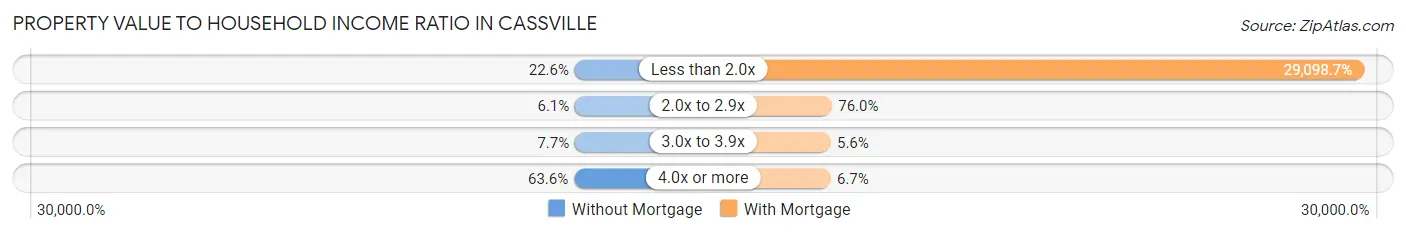
| Value-to-Income Ratio | Without Mortgage | With Mortgage |
| Less than 2.0x | 82 (22.6%) | 113,776 (29,098.7%) |
| 2.0x to 2.9x | 22 (6.1%) | 297 (76.0%) |
| 3.0x to 3.9x | 28 (7.7%) | 22 (5.6%) |
| 4.0x or more | 231 (63.6%) | 26 (6.7%) |
| Total | 363 (100.0%) | 391 (100.0%) |
Real Estate Taxes by Mortgage Status in Cassville
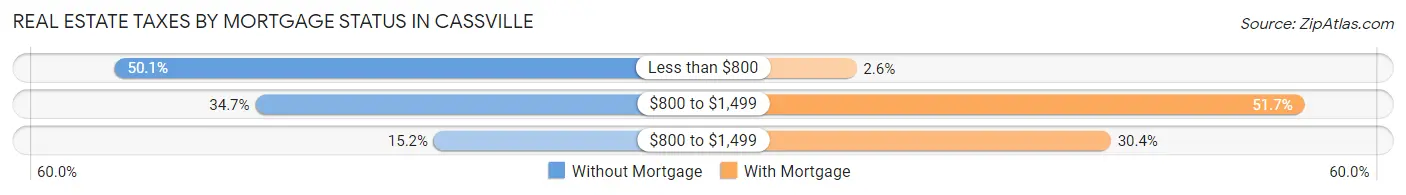
| Property Taxes | Without Mortgage | With Mortgage |
| Less than $800 | 182 (50.1%) | 10 (2.6%) |
| $800 to $1,499 | 126 (34.7%) | 202 (51.7%) |
| $800 to $1,499 | 55 (15.1%) | 119 (30.4%) |
| Total | 363 (100.0%) | 391 (100.0%) |
Health & Disability in Cassville
Health Insurance Coverage by Age in Cassville
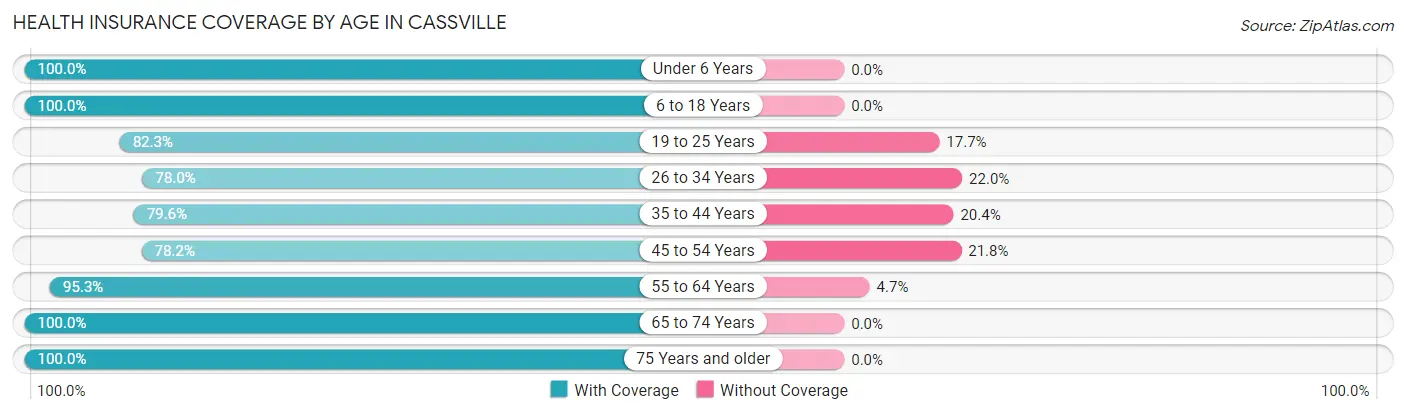
| Age Bracket | With Coverage | Without Coverage |
| Under 6 Years | 385 (100.0%) | 0 (0.0%) |
| 6 to 18 Years | 459 (100.0%) | 0 (0.0%) |
| 19 to 25 Years | 204 (82.3%) | 44 (17.7%) |
| 26 to 34 Years | 213 (78.0%) | 60 (22.0%) |
| 35 to 44 Years | 403 (79.6%) | 103 (20.4%) |
| 45 to 54 Years | 172 (78.2%) | 48 (21.8%) |
| 55 to 64 Years | 282 (95.3%) | 14 (4.7%) |
| 65 to 74 Years | 398 (100.0%) | 0 (0.0%) |
| 75 Years and older | 303 (100.0%) | 0 (0.0%) |
| Total | 2,819 (91.3%) | 269 (8.7%) |
Health Insurance Coverage by Citizenship Status in Cassville

| Citizenship Status | With Coverage | Without Coverage |
| Native Born | 385 (100.0%) | 0 (0.0%) |
| Foreign Born, Citizen | 459 (100.0%) | 0 (0.0%) |
| Foreign Born, not a Citizen | 204 (82.3%) | 44 (17.7%) |
Health Insurance Coverage by Household Income in Cassville
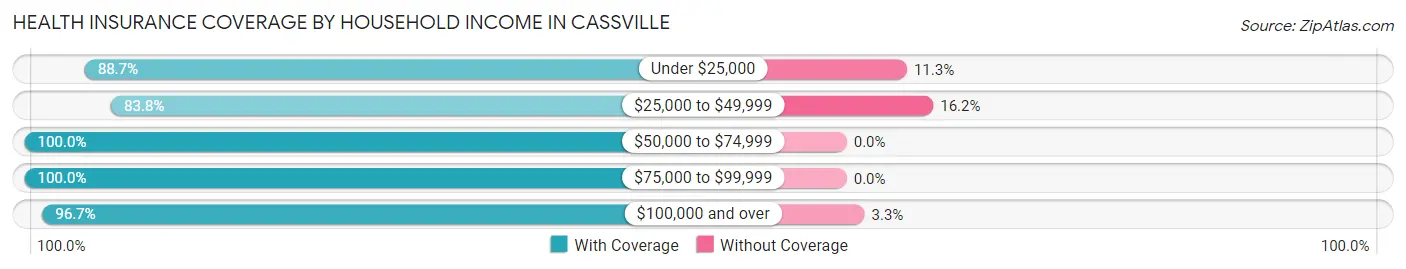
| Household Income | With Coverage | Without Coverage |
| Under $25,000 | 417 (88.7%) | 53 (11.3%) |
| $25,000 to $49,999 | 941 (83.8%) | 182 (16.2%) |
| $50,000 to $74,999 | 346 (100.0%) | 0 (0.0%) |
| $75,000 to $99,999 | 128 (100.0%) | 0 (0.0%) |
| $100,000 and over | 987 (96.7%) | 34 (3.3%) |
Public vs Private Health Insurance Coverage by Age in Cassville
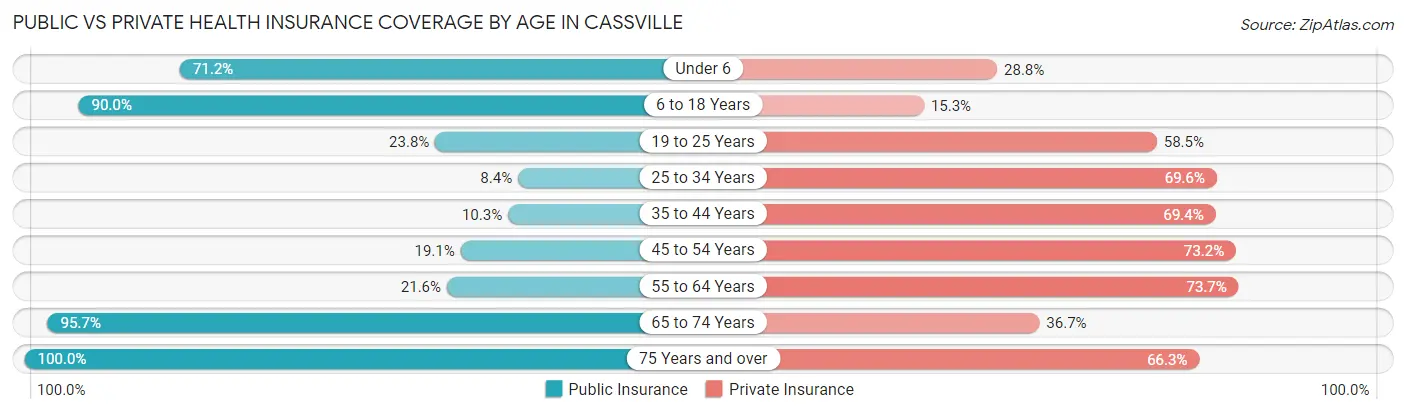
| Age Bracket | Public Insurance | Private Insurance |
| Under 6 | 274 (71.2%) | 111 (28.8%) |
| 6 to 18 Years | 413 (90.0%) | 70 (15.2%) |
| 19 to 25 Years | 59 (23.8%) | 145 (58.5%) |
| 25 to 34 Years | 23 (8.4%) | 190 (69.6%) |
| 35 to 44 Years | 52 (10.3%) | 351 (69.4%) |
| 45 to 54 Years | 42 (19.1%) | 161 (73.2%) |
| 55 to 64 Years | 64 (21.6%) | 218 (73.7%) |
| 65 to 74 Years | 381 (95.7%) | 146 (36.7%) |
| 75 Years and over | 303 (100.0%) | 201 (66.3%) |
| Total | 1,611 (52.2%) | 1,593 (51.6%) |
Disability Status by Sex by Age in Cassville
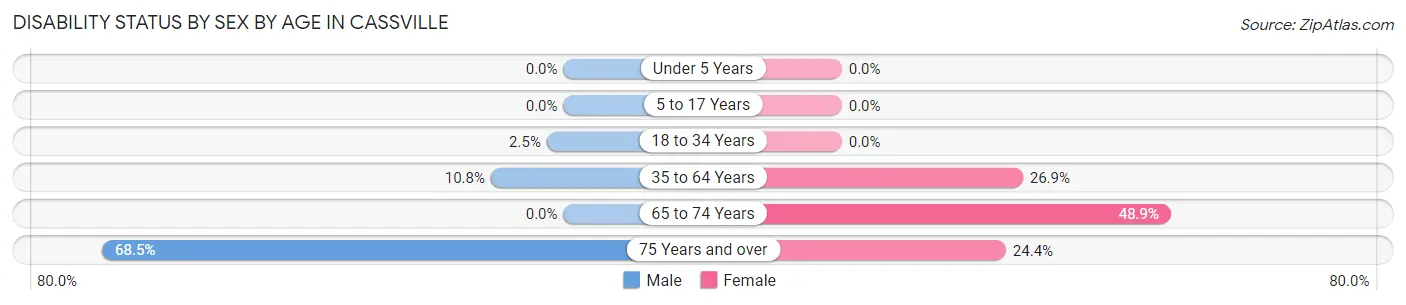
| Age Bracket | Male | Female |
| Under 5 Years | 0 (0.0%) | 0 (0.0%) |
| 5 to 17 Years | 0 (0.0%) | 0 (0.0%) |
| 18 to 34 Years | 9 (2.5%) | 0 (0.0%) |
| 35 to 64 Years | 50 (10.8%) | 150 (26.9%) |
| 65 to 74 Years | 0 (0.0%) | 149 (48.8%) |
| 75 Years and over | 126 (68.5%) | 29 (24.4%) |
Disability Class by Sex by Age in Cassville
Disability Class: Hearing Difficulty
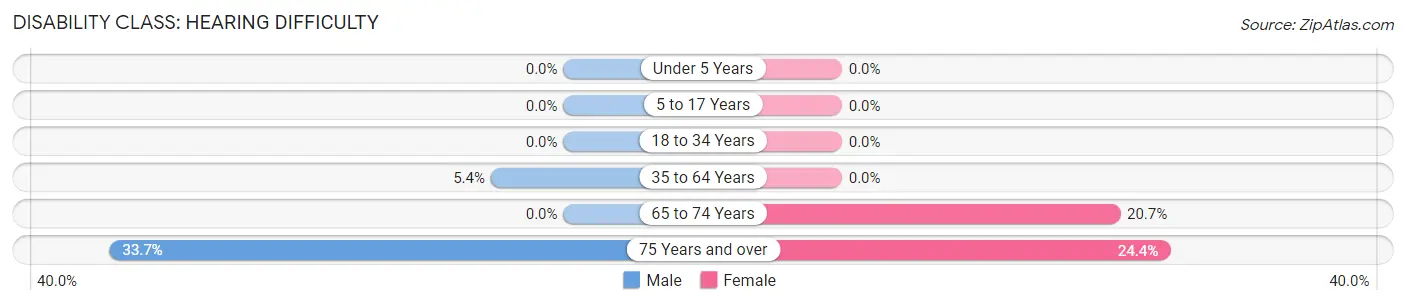
| Age Bracket | Male | Female |
| Under 5 Years | 0 (0.0%) | 0 (0.0%) |
| 5 to 17 Years | 0 (0.0%) | 0 (0.0%) |
| 18 to 34 Years | 0 (0.0%) | 0 (0.0%) |
| 35 to 64 Years | 25 (5.4%) | 0 (0.0%) |
| 65 to 74 Years | 0 (0.0%) | 63 (20.7%) |
| 75 Years and over | 62 (33.7%) | 29 (24.4%) |
Disability Class: Vision Difficulty
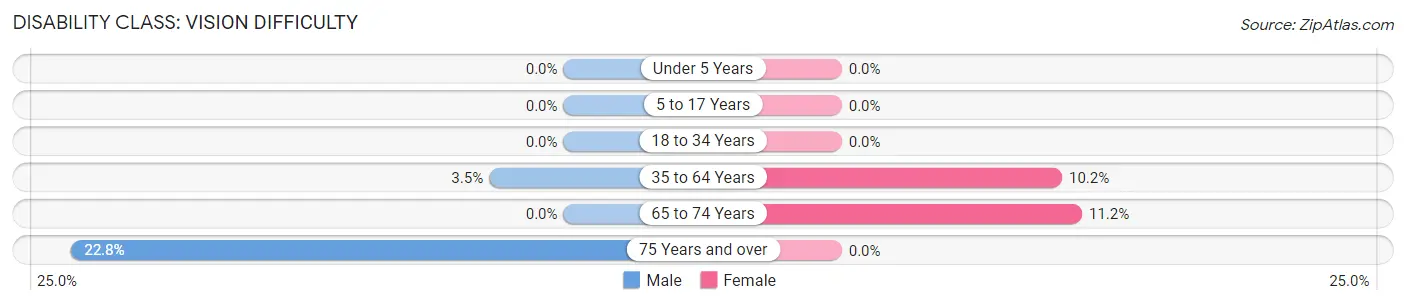
| Age Bracket | Male | Female |
| Under 5 Years | 0 (0.0%) | 0 (0.0%) |
| 5 to 17 Years | 0 (0.0%) | 0 (0.0%) |
| 18 to 34 Years | 0 (0.0%) | 0 (0.0%) |
| 35 to 64 Years | 16 (3.5%) | 57 (10.2%) |
| 65 to 74 Years | 0 (0.0%) | 34 (11.2%) |
| 75 Years and over | 42 (22.8%) | 0 (0.0%) |
Disability Class: Cognitive Difficulty
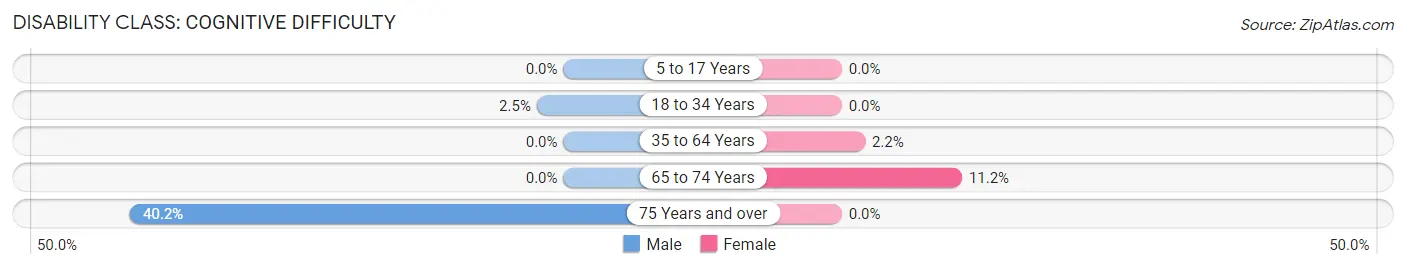
| Age Bracket | Male | Female |
| 5 to 17 Years | 0 (0.0%) | 0 (0.0%) |
| 18 to 34 Years | 9 (2.5%) | 0 (0.0%) |
| 35 to 64 Years | 0 (0.0%) | 12 (2.1%) |
| 65 to 74 Years | 0 (0.0%) | 34 (11.2%) |
| 75 Years and over | 74 (40.2%) | 0 (0.0%) |
Disability Class: Ambulatory Difficulty
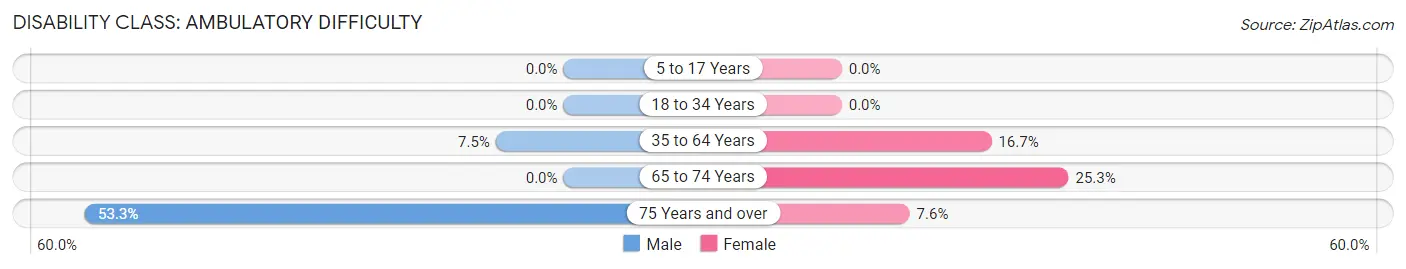
| Age Bracket | Male | Female |
| 5 to 17 Years | 0 (0.0%) | 0 (0.0%) |
| 18 to 34 Years | 0 (0.0%) | 0 (0.0%) |
| 35 to 64 Years | 35 (7.5%) | 93 (16.7%) |
| 65 to 74 Years | 0 (0.0%) | 77 (25.3%) |
| 75 Years and over | 98 (53.3%) | 9 (7.6%) |
Disability Class: Self-Care Difficulty
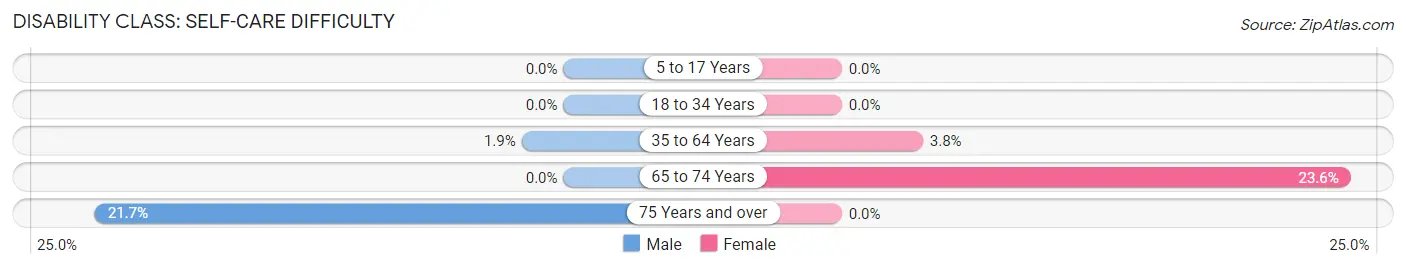
| Age Bracket | Male | Female |
| 5 to 17 Years | 0 (0.0%) | 0 (0.0%) |
| 18 to 34 Years | 0 (0.0%) | 0 (0.0%) |
| 35 to 64 Years | 9 (1.9%) | 21 (3.8%) |
| 65 to 74 Years | 0 (0.0%) | 72 (23.6%) |
| 75 Years and over | 40 (21.7%) | 0 (0.0%) |
Technology Access in Cassville
Computing Device Access in Cassville
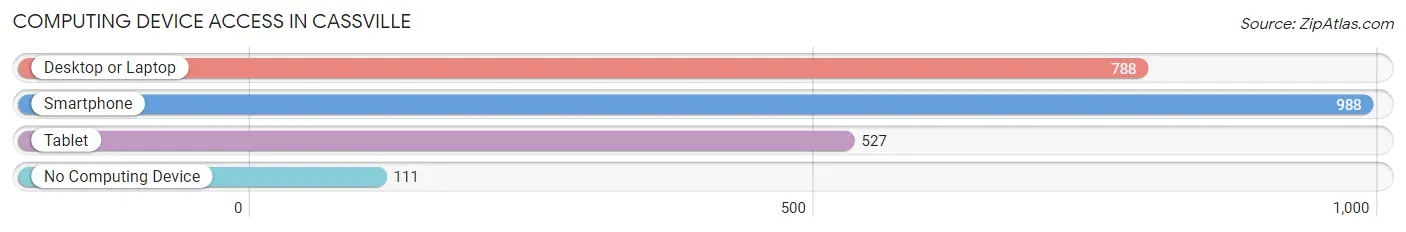
| Device Type | # Households | % Households |
| Desktop or Laptop | 788 | 66.2% |
| Smartphone | 988 | 83.0% |
| Tablet | 527 | 44.3% |
| No Computing Device | 111 | 9.3% |
| Total | 1,190 | 100.0% |
Internet Access in Cassville
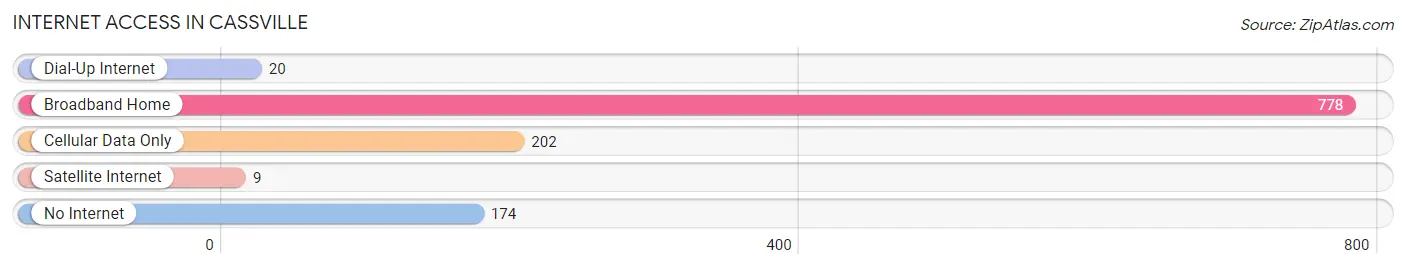
| Internet Type | # Households | % Households |
| Dial-Up Internet | 20 | 1.7% |
| Broadband Home | 778 | 65.4% |
| Cellular Data Only | 202 | 17.0% |
| Satellite Internet | 9 | 0.8% |
| No Internet | 174 | 14.6% |
| Total | 1,190 | 100.0% |
Cassville Summary
Cassville, Missouri is a small town located in the southwestern corner of the state, in Barry County. It is situated on the banks of the White River, and is the county seat of Barry County. The town was founded in 1845, and was named after Archibald Cass, a prominent local politician.
Geography
Cassville is located in the Ozark Plateau region of Missouri, and is surrounded by rolling hills and forests. The town is situated on the banks of the White River, and is located at the intersection of US Route 37 and Missouri Route 76. The town is located approximately 30 miles south of Springfield, Missouri, and is about an hour and a half drive from the state capital of Jefferson City.
The climate in Cassville is generally mild, with hot summers and cold winters. The average annual temperature is around 54 degrees Fahrenheit, and the average annual precipitation is around 40 inches.
Economy
The economy of Cassville is largely based on agriculture and tourism. The town is home to several large farms, and is a popular destination for hunters and fishermen. The town is also home to several small businesses, including restaurants, retail stores, and service providers.
The town is also home to several manufacturing companies, including a plastics factory and a furniture factory. The town is also home to a large poultry processing plant, which is one of the largest employers in the area.
Demographics
As of the 2010 census, the population of Cassville was 3,219. The racial makeup of the town was 95.3% White, 0.7% African American, 0.3% Native American, 0.3% Asian, 0.1% Pacific Islander, 1.2% from other races, and 2.3% from two or more races. Hispanic or Latino of any race were 3.2% of the population.
The median income for a household in Cassville was $30,938, and the median income for a family was $37,917. The per capita income for the town was $17,845. About 16.2% of families and 19.2% of the population were below the poverty line, including 25.2% of those under age 18 and 11.2% of those age 65 or over.
Conclusion
Cassville, Missouri is a small town located in the southwestern corner of the state, in Barry County. It is situated on the banks of the White River, and is the county seat of Barry County. The town was founded in 1845, and was named after Archibald Cass, a prominent local politician. The economy of Cassville is largely based on agriculture and tourism, and the town is home to several large farms, manufacturing companies, and small businesses. As of the 2010 census, the population of Cassville was 3,219, and the median income for a household was $30,938.
Common Questions
What is Per Capita Income in Cassville?
Per Capita income in Cassville is $33,468.
What is the Median Family Income in Cassville?
Median Family Income in Cassville is $64,258.
What is the Median Household income in Cassville?
Median Household Income in Cassville is $46,136.
What is Income or Wage Gap in Cassville?
Income or Wage Gap in Cassville is 8.9%.
Women in Cassville earn 91.1 cents for every dollar earned by a man.
What is Family Income Deficit in Cassville?
Family Income Deficit in Cassville is $12,764.
Families that are below poverty line in Cassville earn $12,764 less on average than the poverty threshold level.
What is Inequality or Gini Index in Cassville?
Inequality or Gini Index in Cassville is 0.56.
What is the Total Population of Cassville?
Total Population of Cassville is 3,193.
What is the Total Male Population of Cassville?
Total Male Population of Cassville is 1,557.
What is the Total Female Population of Cassville?
Total Female Population of Cassville is 1,636.
What is the Ratio of Males per 100 Females in Cassville?
There are 95.17 Males per 100 Females in Cassville.
What is the Ratio of Females per 100 Males in Cassville?
There are 105.07 Females per 100 Males in Cassville.
What is the Median Population Age in Cassville?
Median Population Age in Cassville is 38.7 Years.
What is the Average Family Size in Cassville
Average Family Size in Cassville is 3.3 People.
What is the Average Household Size in Cassville
Average Household Size in Cassville is 2.6 People.
How Large is the Labor Force in Cassville?
There are 1,404 People in the Labor Forcein in Cassville.
What is the Percentage of People in the Labor Force in Cassville?
57.0% of People are in the Labor Force in Cassville.