Carterville, MO Map & Demographics
Carterville Map
Carterville Overview
$18,402
PER CAPITA INCOME
$56,008
AVG FAMILY INCOME
$45,708
AVG HOUSEHOLD INCOME
29.7%
WAGE / INCOME GAP [ % ]
70.3¢/ $1
WAGE / INCOME GAP [ $ ]
0.33
INEQUALITY / GINI INDEX
1,951
TOTAL POPULATION
1,122
MALE POPULATION
829
FEMALE POPULATION
135.34
MALES / 100 FEMALES
73.89
FEMALES / 100 MALES
36.1
MEDIAN AGE
3.3
AVG FAMILY SIZE
2.8
AVG HOUSEHOLD SIZE
848
LABOR FORCE [ PEOPLE ]
59.0%
PERCENT IN LABOR FORCE
8.6%
UNEMPLOYMENT RATE
Carterville Zip Codes
Carterville Area Codes
Income in Carterville
Income Overview in Carterville
Per Capita Income in Carterville is $18,402, while median incomes of families and households are $56,008 and $45,708 respectively.
| Characteristic | Number | Measure |
| Per Capita Income | 1,951 | $18,402 |
| Median Family Income | 503 | $56,008 |
| Mean Family Income | 503 | $59,267 |
| Median Household Income | 691 | $45,708 |
| Mean Household Income | 691 | $52,946 |
| Income Deficit | 503 | $0 |
| Wage / Income Gap (%) | 1,951 | 29.68% |
| Wage / Income Gap ($) | 1,951 | 70.32¢ per $1 |
| Gini / Inequality Index | 1,951 | 0.33 |
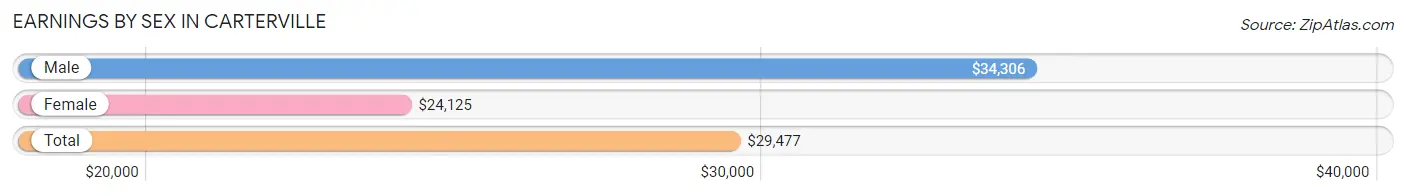
Earnings by Sex in Carterville
Average Earnings in Carterville are $29,477, $34,306 for men and $24,125 for women, a difference of 29.7%.
| Sex | Number | Average Earnings |
| Male | 460 (50.4%) | $34,306 |
| Female | 452 (49.6%) | $24,125 |
| Total | 912 (100.0%) | $29,477 |
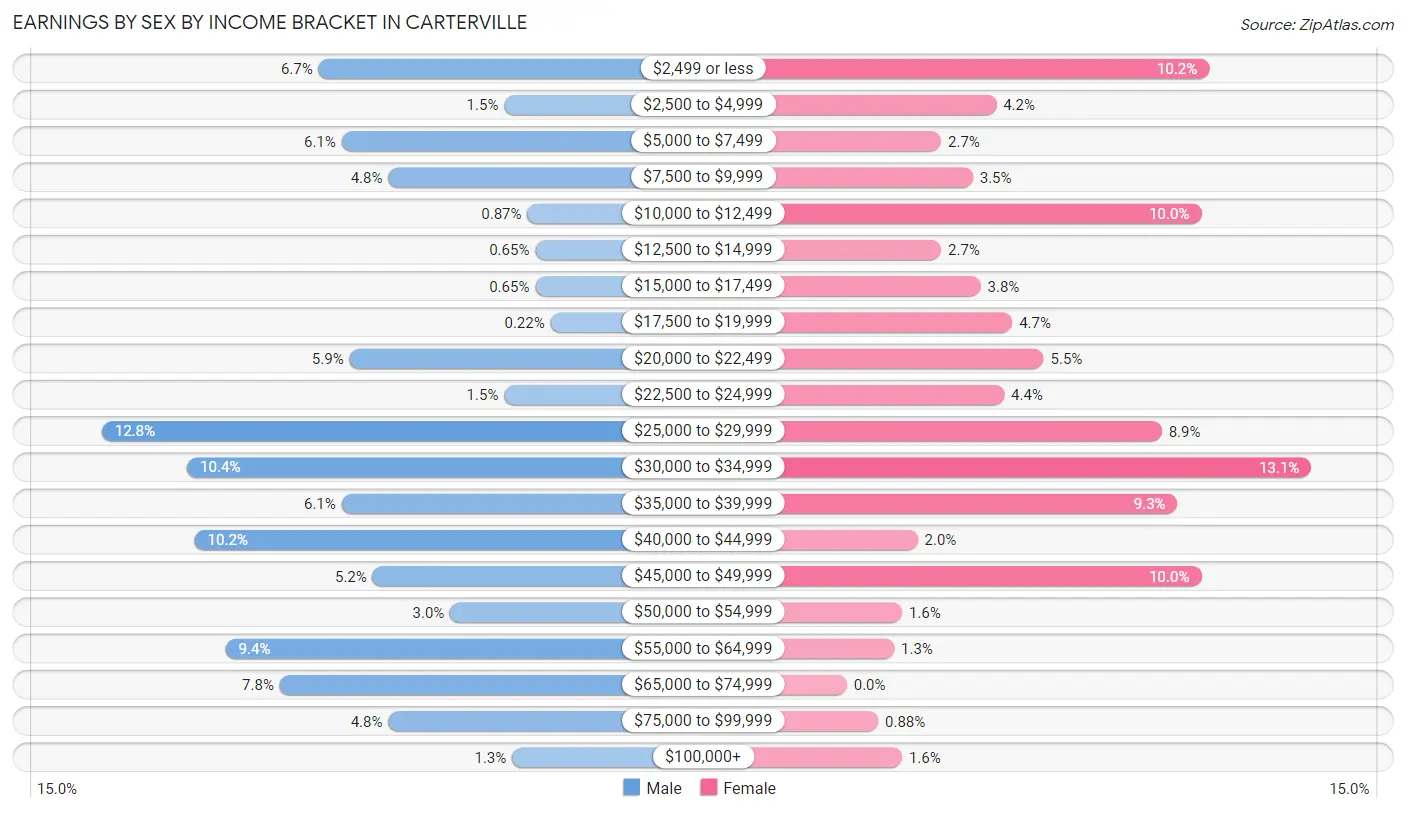
Earnings by Sex by Income Bracket in Carterville
The most common earnings brackets in Carterville are $25,000 to $29,999 for men (59 | 12.8%) and $30,000 to $34,999 for women (59 | 13.1%).
| Income | Male | Female |
| $2,499 or less | 31 (6.7%) | 46 (10.2%) |
| $2,500 to $4,999 | 7 (1.5%) | 19 (4.2%) |
| $5,000 to $7,499 | 28 (6.1%) | 12 (2.6%) |
| $7,500 to $9,999 | 22 (4.8%) | 16 (3.5%) |
| $10,000 to $12,499 | 4 (0.9%) | 45 (10.0%) |
| $12,500 to $14,999 | 3 (0.6%) | 12 (2.6%) |
| $15,000 to $17,499 | 3 (0.6%) | 17 (3.8%) |
| $17,500 to $19,999 | 1 (0.2%) | 21 (4.6%) |
| $20,000 to $22,499 | 27 (5.9%) | 25 (5.5%) |
| $22,500 to $24,999 | 7 (1.5%) | 20 (4.4%) |
| $25,000 to $29,999 | 59 (12.8%) | 40 (8.8%) |
| $30,000 to $34,999 | 48 (10.4%) | 59 (13.1%) |
| $35,000 to $39,999 | 28 (6.1%) | 42 (9.3%) |
| $40,000 to $44,999 | 47 (10.2%) | 9 (2.0%) |
| $45,000 to $49,999 | 24 (5.2%) | 45 (10.0%) |
| $50,000 to $54,999 | 14 (3.0%) | 7 (1.5%) |
| $55,000 to $64,999 | 43 (9.3%) | 6 (1.3%) |
| $65,000 to $74,999 | 36 (7.8%) | 0 (0.0%) |
| $75,000 to $99,999 | 22 (4.8%) | 4 (0.9%) |
| $100,000+ | 6 (1.3%) | 7 (1.5%) |
| Total | 460 (100.0%) | 452 (100.0%) |
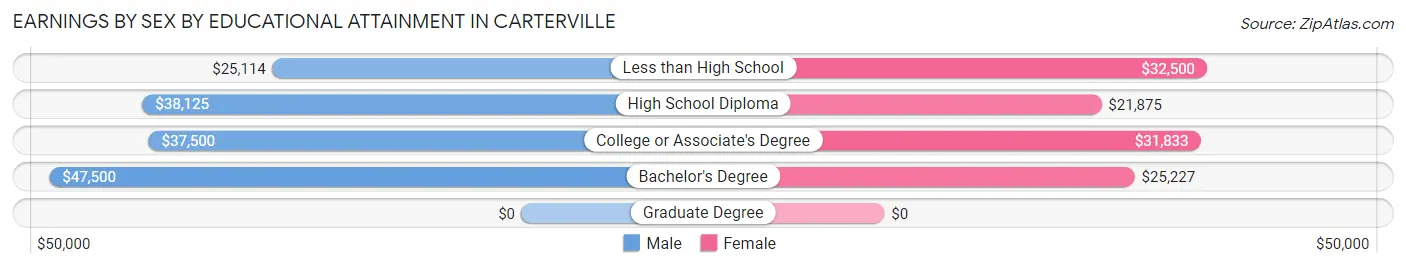
Earnings by Sex by Educational Attainment in Carterville
Average earnings in Carterville are $37,396 for men and $26,048 for women, a difference of 30.3%. Men with an educational attainment of bachelor's degree enjoy the highest average annual earnings of $47,500, while those with less than high school education earn the least with $25,114. Women with an educational attainment of less than high school earn the most with the average annual earnings of $32,500, while those with high school diploma education have the smallest earnings of $21,875.
| Educational Attainment | Male Income | Female Income |
| Less than High School | $25,114 | $32,500 |
| High School Diploma | $38,125 | $21,875 |
| College or Associate's Degree | $37,500 | $31,833 |
| Bachelor's Degree | $47,500 | $25,227 |
| Graduate Degree | - | - |
| Total | $37,396 | $26,048 |
Family Income in Carterville
Family Income Brackets in Carterville
According to the Carterville family income data, there are 150 families falling into the $50,000 to $74,999 income range, which is the most common income bracket and makes up 29.8% of all families. Conversely, the $200,000+ income bracket is the least frequent group with only 2 families (0.4%) belonging to this category.
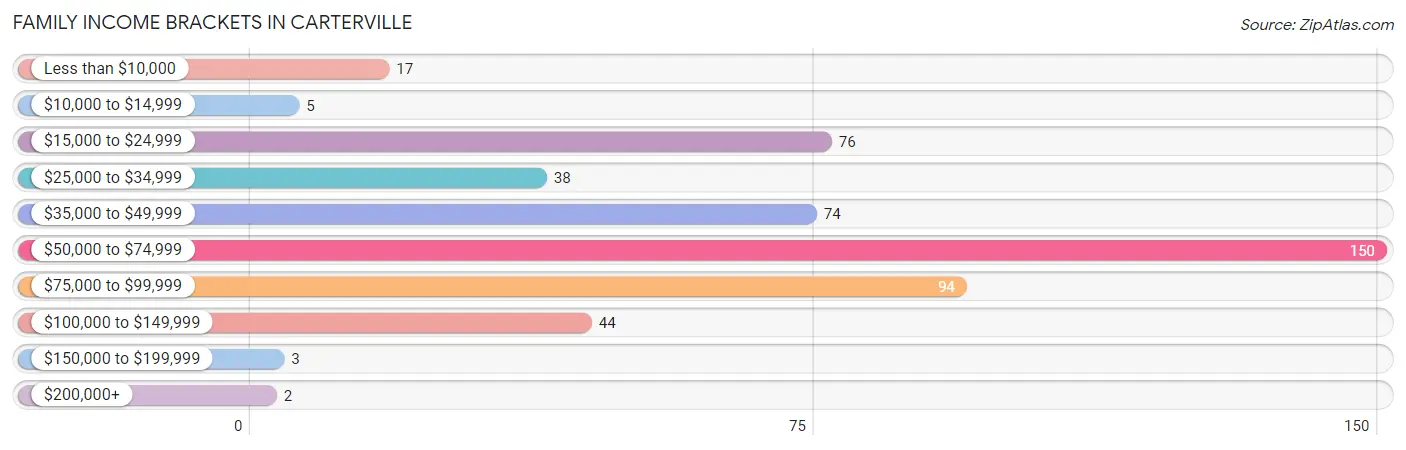
| Income Bracket | # Families | % Families |
| Less than $10,000 | 17 | 3.4% |
| $10,000 to $14,999 | 5 | 1.0% |
| $15,000 to $24,999 | 76 | 15.1% |
| $25,000 to $34,999 | 38 | 7.6% |
| $35,000 to $49,999 | 74 | 14.7% |
| $50,000 to $74,999 | 150 | 29.8% |
| $75,000 to $99,999 | 94 | 18.7% |
| $100,000 to $149,999 | 44 | 8.7% |
| $150,000 to $199,999 | 3 | 0.6% |
| $200,000+ | 2 | 0.4% |
Family Income by Famaliy Size in Carterville
3-person families (86 | 17.1%) account for the highest median family income in Carterville with $61,250 per family, while 2-person families (200 | 39.8%) have the highest median income of $29,750 per family member.
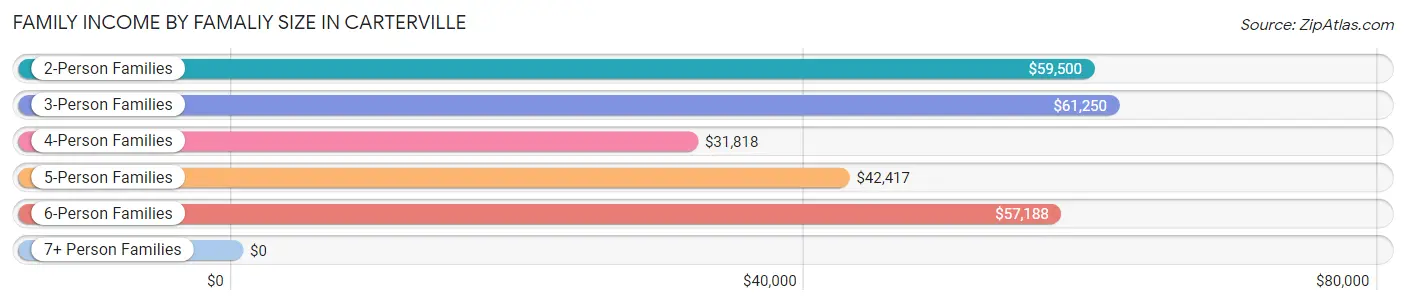
| Income Bracket | # Families | Median Income |
| 2-Person Families | 200 (39.8%) | $59,500 |
| 3-Person Families | 86 (17.1%) | $61,250 |
| 4-Person Families | 132 (26.2%) | $31,818 |
| 5-Person Families | 43 (8.6%) | $42,417 |
| 6-Person Families | 28 (5.6%) | $57,188 |
| 7+ Person Families | 14 (2.8%) | $0 |
| Total | 503 (100.0%) | $56,008 |
Family Income by Number of Earners in Carterville
The median family income in Carterville is $56,008, with families comprising 3+ earners (35) having the highest median family income of $109,844, while families with no earners (51) have the lowest median family income of $27,750, accounting for 7.0% and 10.1% of families, respectively.
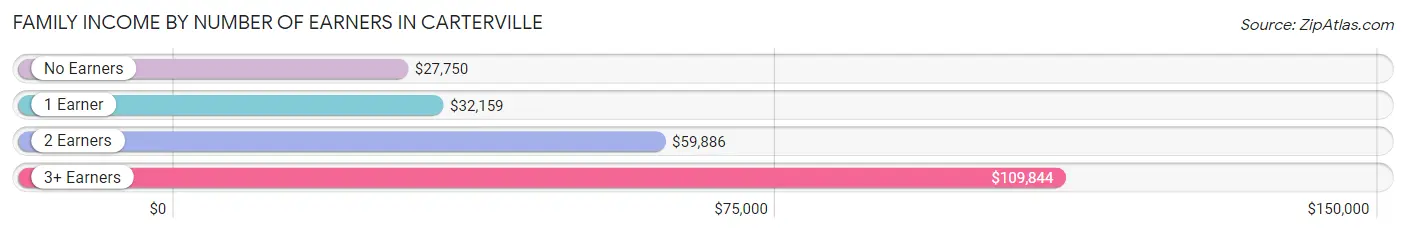
| Number of Earners | # Families | Median Income |
| No Earners | 51 (10.1%) | $27,750 |
| 1 Earner | 171 (34.0%) | $32,159 |
| 2 Earners | 246 (48.9%) | $59,886 |
| 3+ Earners | 35 (7.0%) | $109,844 |
| Total | 503 (100.0%) | $56,008 |
Household Income in Carterville
Household Income Brackets in Carterville
With 159 households falling in the category, the $35,000 to $49,999 income range is the most frequent in Carterville, accounting for 23.0% of all households. In contrast, only 2 households (0.3%) fall into the $200,000+ income bracket, making it the least populous group.
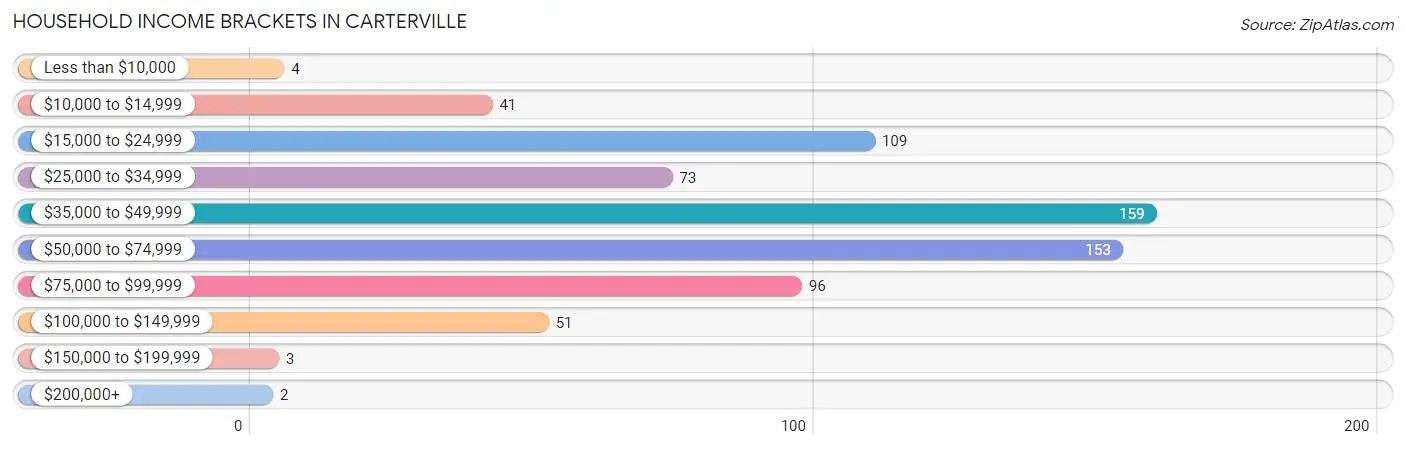
| Income Bracket | # Households | % Households |
| Less than $10,000 | 4 | 0.6% |
| $10,000 to $14,999 | 41 | 5.9% |
| $15,000 to $24,999 | 109 | 15.8% |
| $25,000 to $34,999 | 73 | 10.6% |
| $35,000 to $49,999 | 159 | 23.0% |
| $50,000 to $74,999 | 153 | 22.1% |
| $75,000 to $99,999 | 96 | 13.9% |
| $100,000 to $149,999 | 51 | 7.4% |
| $150,000 to $199,999 | 3 | 0.4% |
| $200,000+ | 2 | 0.3% |
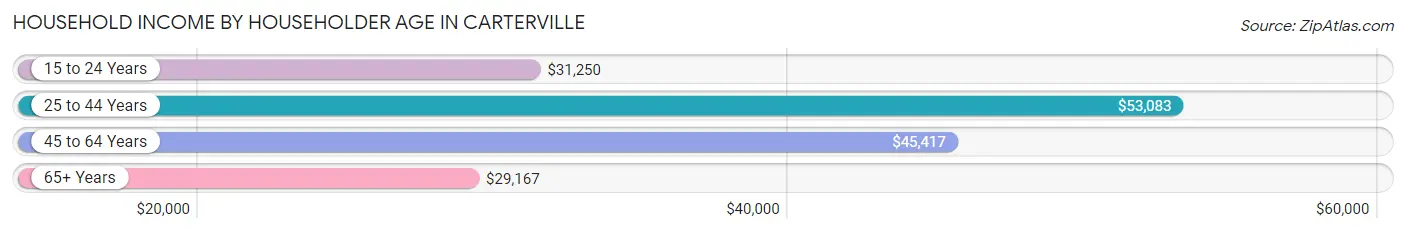
Household Income by Householder Age in Carterville
The median household income in Carterville is $45,708, with the highest median household income of $53,083 found in the 25 to 44 years age bracket for the primary householder. A total of 291 households (42.1%) fall into this category. Meanwhile, the 65+ years age bracket for the primary householder has the lowest median household income of $29,167, with 134 households (19.4%) in this group.
| Income Bracket | # Households | Median Income |
| 15 to 24 Years | 10 (1.5%) | $31,250 |
| 25 to 44 Years | 291 (42.1%) | $53,083 |
| 45 to 64 Years | 256 (37.0%) | $45,417 |
| 65+ Years | 134 (19.4%) | $29,167 |
| Total | 691 (100.0%) | $45,708 |
Poverty in Carterville
Income Below Poverty by Sex and Age in Carterville
With 28.4% poverty level for males and 20.4% for females among the residents of Carterville, 15 year old males and 55 to 64 year old females are the most vulnerable to poverty, with 53 males (81.5%) and 52 females (38.0%) in their respective age groups living below the poverty level.
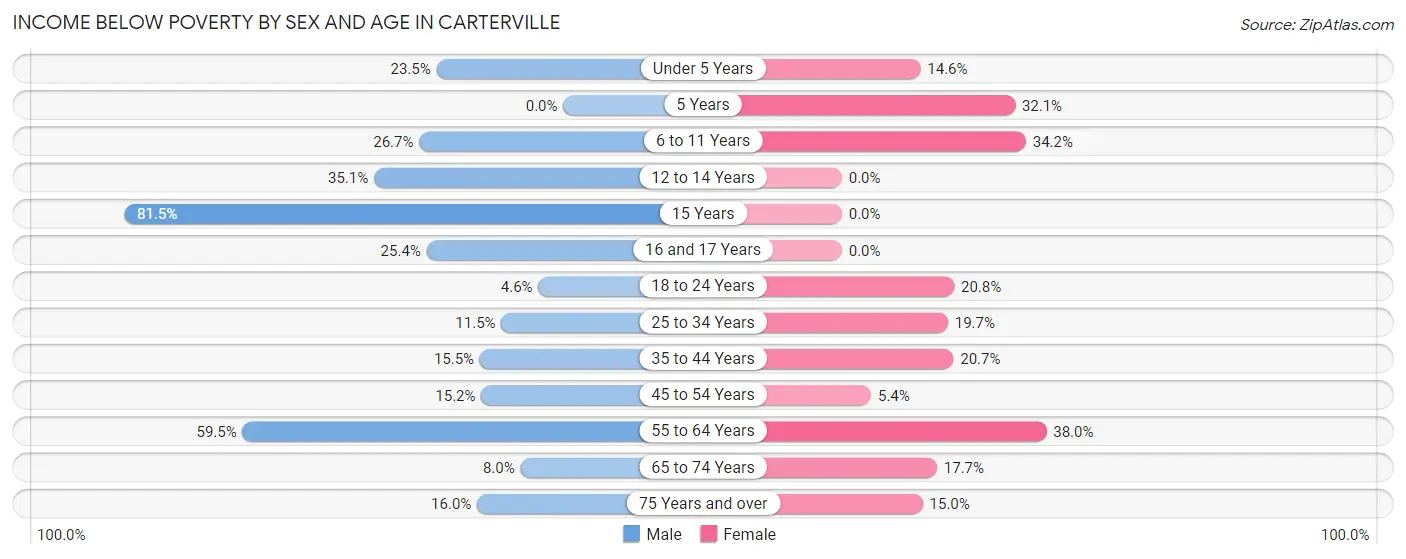
| Age Bracket | Male | Female |
| Under 5 Years | 12 (23.5%) | 7 (14.6%) |
| 5 Years | 0 (0.0%) | 9 (32.1%) |
| 6 to 11 Years | 23 (26.7%) | 14 (34.2%) |
| 12 to 14 Years | 39 (35.1%) | 0 (0.0%) |
| 15 Years | 53 (81.5%) | 0 (0.0%) |
| 16 and 17 Years | 17 (25.4%) | 0 (0.0%) |
| 18 to 24 Years | 3 (4.6%) | 10 (20.8%) |
| 25 to 34 Years | 13 (11.5%) | 24 (19.7%) |
| 35 to 44 Years | 24 (15.5%) | 30 (20.7%) |
| 45 to 54 Years | 14 (15.2%) | 5 (5.4%) |
| 55 to 64 Years | 103 (59.5%) | 52 (38.0%) |
| 65 to 74 Years | 7 (8.0%) | 9 (17.6%) |
| 75 Years and over | 4 (16.0%) | 6 (15.0%) |
| Total | 312 (28.4%) | 166 (20.4%) |
Income Above Poverty by Sex and Age in Carterville
According to the poverty statistics in Carterville, males aged 5 years and females aged 12 to 14 years are the age groups that are most secure financially, with 100.0% of males and 100.0% of females in these age groups living above the poverty line.
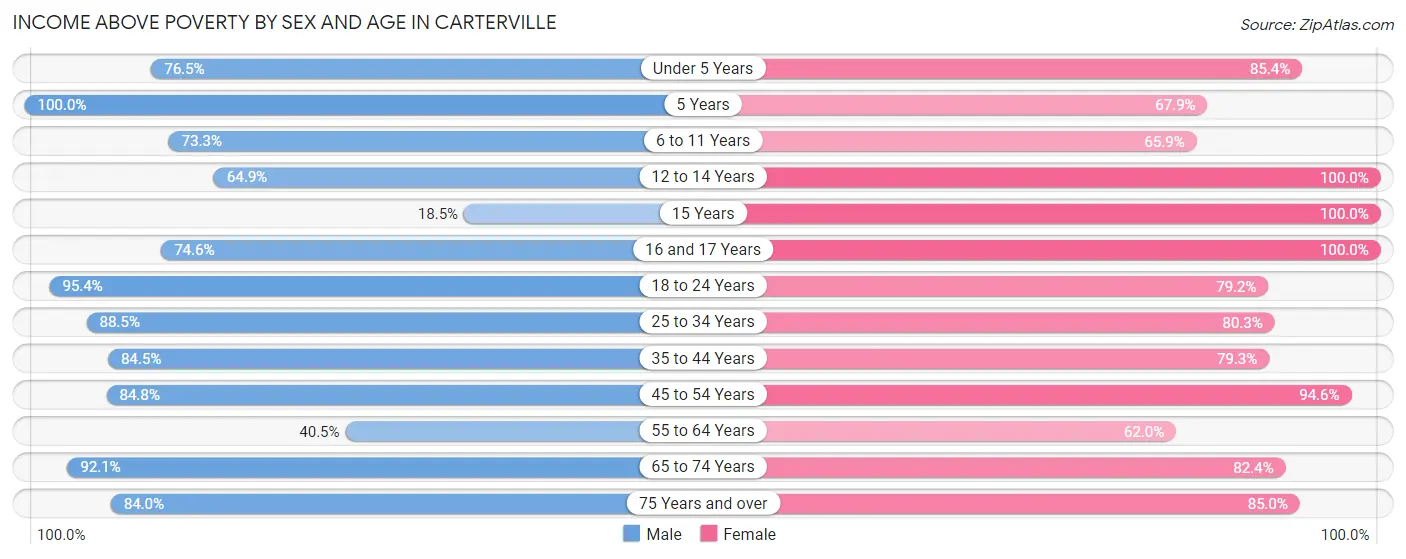
| Age Bracket | Male | Female |
| Under 5 Years | 39 (76.5%) | 41 (85.4%) |
| 5 Years | 9 (100.0%) | 19 (67.9%) |
| 6 to 11 Years | 63 (73.3%) | 27 (65.8%) |
| 12 to 14 Years | 72 (64.9%) | 24 (100.0%) |
| 15 Years | 12 (18.5%) | 13 (100.0%) |
| 16 and 17 Years | 50 (74.6%) | 24 (100.0%) |
| 18 to 24 Years | 62 (95.4%) | 38 (79.2%) |
| 25 to 34 Years | 100 (88.5%) | 98 (80.3%) |
| 35 to 44 Years | 131 (84.5%) | 115 (79.3%) |
| 45 to 54 Years | 78 (84.8%) | 87 (94.6%) |
| 55 to 64 Years | 70 (40.5%) | 85 (62.0%) |
| 65 to 74 Years | 81 (92.0%) | 42 (82.4%) |
| 75 Years and over | 21 (84.0%) | 34 (85.0%) |
| Total | 788 (71.6%) | 647 (79.6%) |
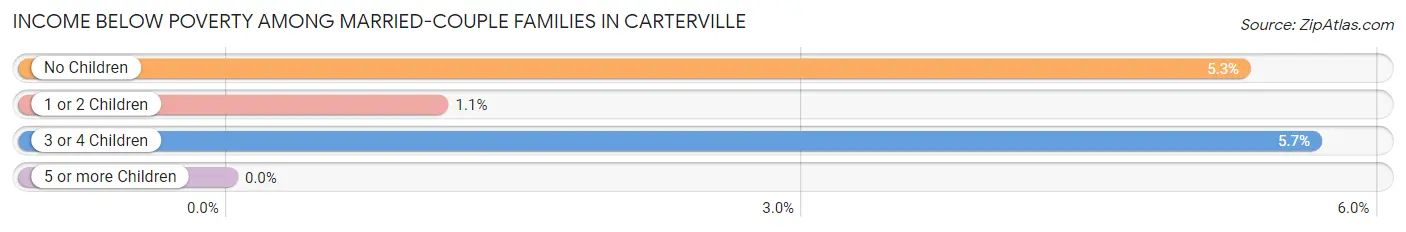
Income Below Poverty Among Married-Couple Families in Carterville
The poverty statistics for married-couple families in Carterville show that 4.2% or 14 of the total 333 families live below the poverty line. Families with 3 or 4 children have the highest poverty rate of 5.7%, comprising of 3 families. On the other hand, families with 1 or 2 children have the lowest poverty rate of 1.1%, which includes 1 families.
| Children | Above Poverty | Below Poverty |
| No Children | 179 (94.7%) | 10 (5.3%) |
| 1 or 2 Children | 90 (98.9%) | 1 (1.1%) |
| 3 or 4 Children | 50 (94.3%) | 3 (5.7%) |
| 5 or more Children | 0 (0.0%) | 0 (0.0%) |
| Total | 319 (95.8%) | 14 (4.2%) |
Income Below Poverty Among Single-Parent Households in Carterville
According to the poverty data in Carterville, 11.7% or 7 single-father households and 60.9% or 67 single-mother households are living below the poverty line. Among single-father households, those with 5 or more children have the highest poverty rate, with 6 households (100.0%) experiencing poverty. Likewise, among single-mother households, those with 3 or 4 children have the highest poverty rate, with 19 households (70.4%) falling below the poverty line.
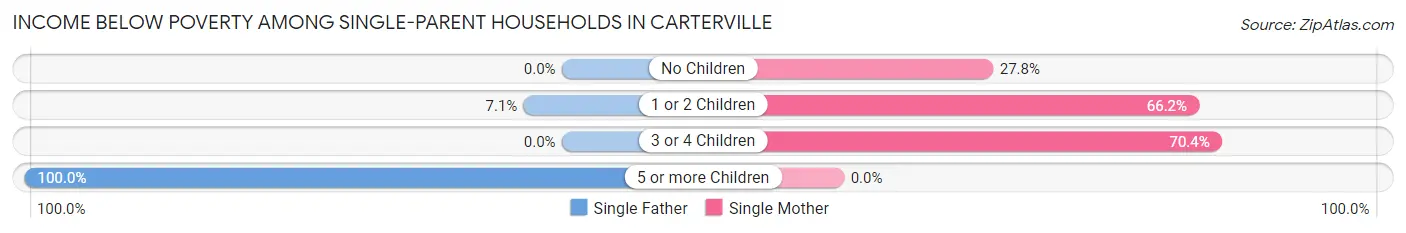
| Children | Single Father | Single Mother |
| No Children | 0 (0.0%) | 5 (27.8%) |
| 1 or 2 Children | 1 (7.1%) | 43 (66.1%) |
| 3 or 4 Children | 0 (0.0%) | 19 (70.4%) |
| 5 or more Children | 6 (100.0%) | 0 (0.0%) |
| Total | 7 (11.7%) | 67 (60.9%) |
Income Below Poverty Among Married-Couple vs Single-Parent Households in Carterville
The poverty data for Carterville shows that 14 of the married-couple family households (4.2%) and 74 of the single-parent households (43.5%) are living below the poverty level. Within the married-couple family households, those with 3 or 4 children have the highest poverty rate, with 3 households (5.7%) falling below the poverty line. Among the single-parent households, those with 5 or more children have the highest poverty rate, with 6 household (100.0%) living below poverty.
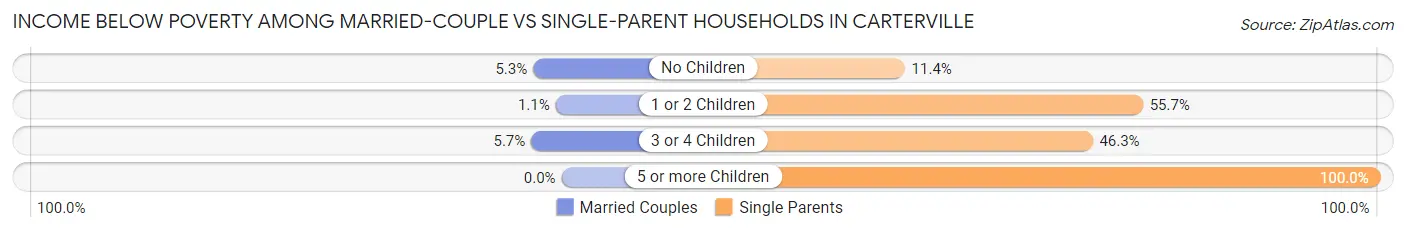
| Children | Married-Couple Families | Single-Parent Households |
| No Children | 10 (5.3%) | 5 (11.4%) |
| 1 or 2 Children | 1 (1.1%) | 44 (55.7%) |
| 3 or 4 Children | 3 (5.7%) | 19 (46.3%) |
| 5 or more Children | 0 (0.0%) | 6 (100.0%) |
| Total | 14 (4.2%) | 74 (43.5%) |
Race in Carterville
The most populous races in Carterville are White / Caucasian (1,710 | 87.6%), Two or more Races (202 | 10.3%), and Hispanic or Latino (110 | 5.6%).
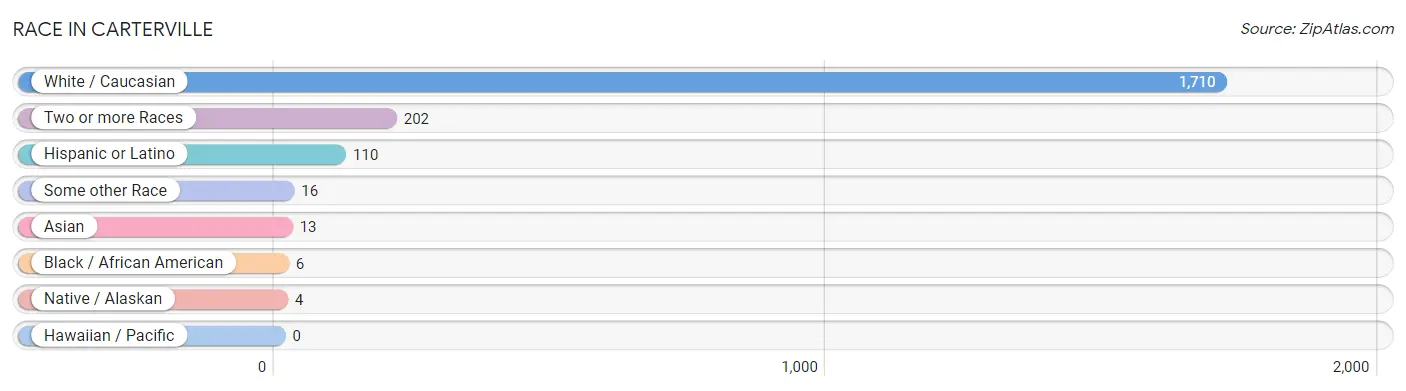
| Race | # Population | % Population |
| Asian | 13 | 0.7% |
| Black / African American | 6 | 0.3% |
| Hawaiian / Pacific | 0 | 0.0% |
| Hispanic or Latino | 110 | 5.6% |
| Native / Alaskan | 4 | 0.2% |
| White / Caucasian | 1,710 | 87.6% |
| Two or more Races | 202 | 10.3% |
| Some other Race | 16 | 0.8% |
| Total | 1,951 | 100.0% |
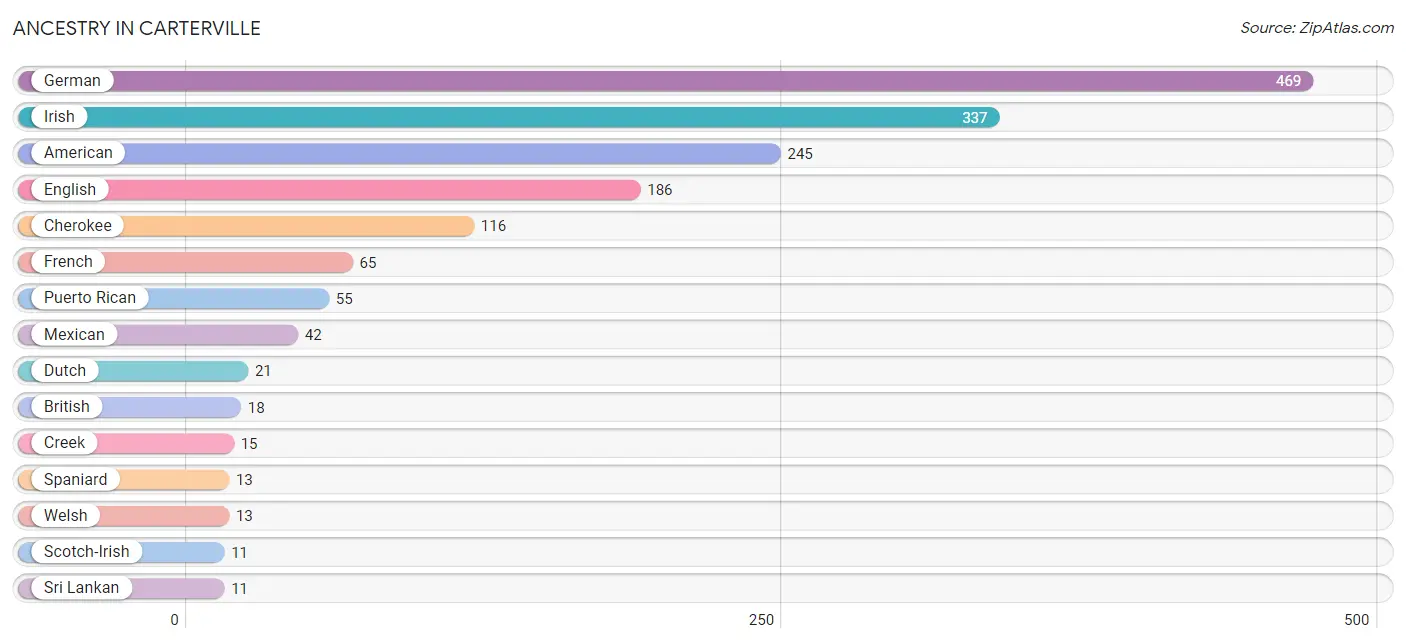
Ancestry in Carterville
The most populous ancestries reported in Carterville are German (469 | 24.0%), Irish (337 | 17.3%), American (245 | 12.6%), English (186 | 9.5%), and Cherokee (116 | 5.9%), together accounting for 69.3% of all Carterville residents.
| Ancestry | # Population | % Population |
| American | 245 | 12.6% |
| Austrian | 3 | 0.2% |
| Blackfeet | 9 | 0.5% |
| British | 18 | 0.9% |
| Canadian | 3 | 0.2% |
| Cherokee | 116 | 5.9% |
| Creek | 15 | 0.8% |
| Danish | 4 | 0.2% |
| Dutch | 21 | 1.1% |
| English | 186 | 9.5% |
| European | 8 | 0.4% |
| Finnish | 2 | 0.1% |
| French | 65 | 3.3% |
| German | 469 | 24.0% |
| Iranian | 3 | 0.2% |
| Irish | 337 | 17.3% |
| Iroquois | 4 | 0.2% |
| Italian | 3 | 0.2% |
| Korean | 7 | 0.4% |
| Lithuanian | 3 | 0.2% |
| Mexican | 42 | 2.1% |
| Norwegian | 4 | 0.2% |
| Osage | 5 | 0.3% |
| Portuguese | 8 | 0.4% |
| Puerto Rican | 55 | 2.8% |
| Scotch-Irish | 11 | 0.6% |
| Scottish | 9 | 0.5% |
| Spaniard | 13 | 0.7% |
| Sri Lankan | 11 | 0.6% |
| Swedish | 3 | 0.2% |
| Swiss | 5 | 0.3% |
| Ukrainian | 2 | 0.1% |
| Welsh | 13 | 0.7% | View All 33 Rows |
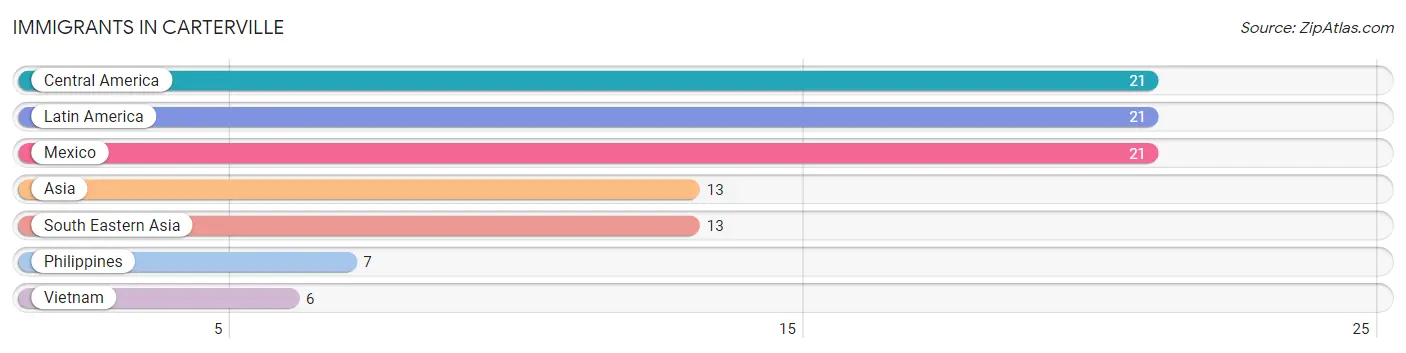
Immigrants in Carterville
The most numerous immigrant groups reported in Carterville came from Central America (21 | 1.1%), Latin America (21 | 1.1%), Mexico (21 | 1.1%), Asia (13 | 0.7%), and South Eastern Asia (13 | 0.7%), together accounting for 4.6% of all Carterville residents.
| Immigration Origin | # Population | % Population |
| Asia | 13 | 0.7% |
| Central America | 21 | 1.1% |
| Latin America | 21 | 1.1% |
| Mexico | 21 | 1.1% |
| Philippines | 7 | 0.4% |
| South Eastern Asia | 13 | 0.7% |
| Vietnam | 6 | 0.3% | View All 7 Rows |
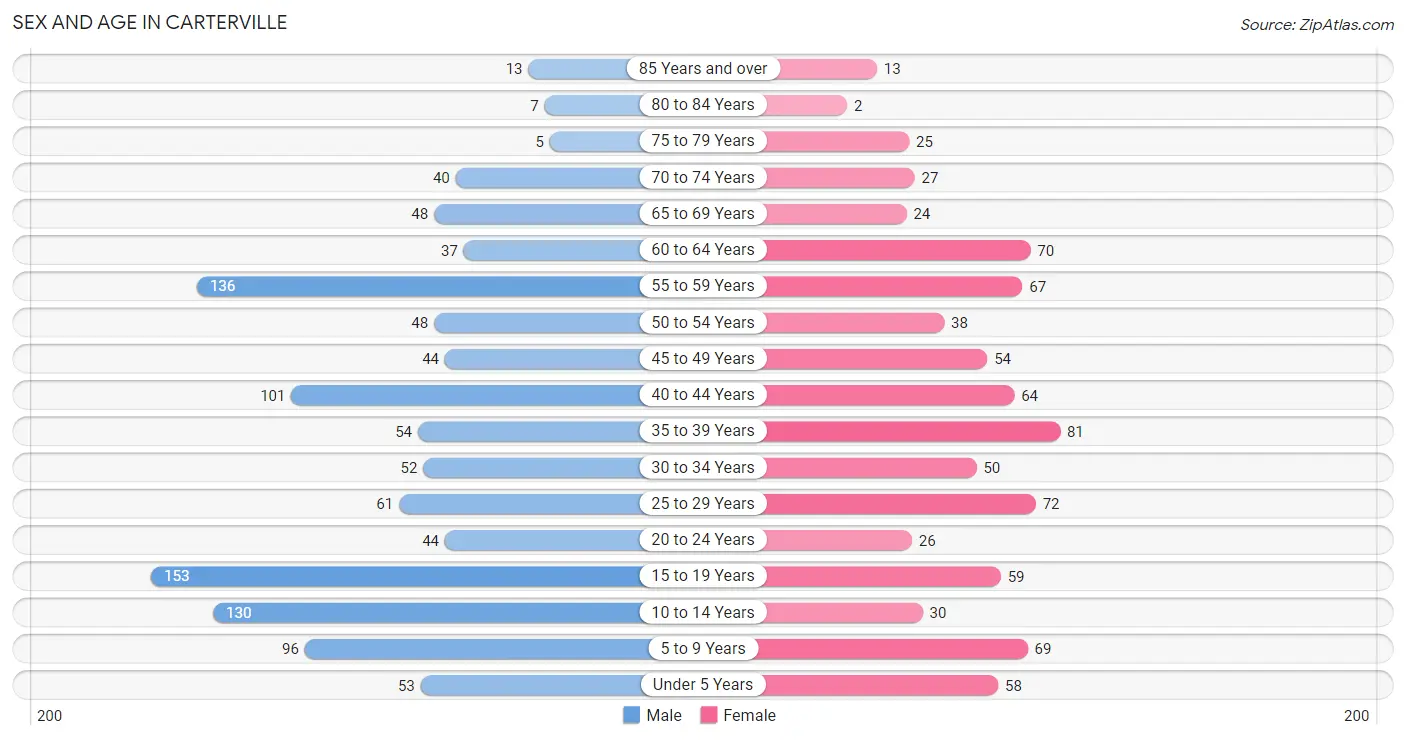
Sex and Age in Carterville
Sex and Age in Carterville
The most populous age groups in Carterville are 15 to 19 Years (153 | 13.6%) for men and 35 to 39 Years (81 | 9.8%) for women.
| Age Bracket | Male | Female |
| Under 5 Years | 53 (4.7%) | 58 (7.0%) |
| 5 to 9 Years | 96 (8.6%) | 69 (8.3%) |
| 10 to 14 Years | 130 (11.6%) | 30 (3.6%) |
| 15 to 19 Years | 153 (13.6%) | 59 (7.1%) |
| 20 to 24 Years | 44 (3.9%) | 26 (3.1%) |
| 25 to 29 Years | 61 (5.4%) | 72 (8.7%) |
| 30 to 34 Years | 52 (4.6%) | 50 (6.0%) |
| 35 to 39 Years | 54 (4.8%) | 81 (9.8%) |
| 40 to 44 Years | 101 (9.0%) | 64 (7.7%) |
| 45 to 49 Years | 44 (3.9%) | 54 (6.5%) |
| 50 to 54 Years | 48 (4.3%) | 38 (4.6%) |
| 55 to 59 Years | 136 (12.1%) | 67 (8.1%) |
| 60 to 64 Years | 37 (3.3%) | 70 (8.4%) |
| 65 to 69 Years | 48 (4.3%) | 24 (2.9%) |
| 70 to 74 Years | 40 (3.6%) | 27 (3.3%) |
| 75 to 79 Years | 5 (0.4%) | 25 (3.0%) |
| 80 to 84 Years | 7 (0.6%) | 2 (0.2%) |
| 85 Years and over | 13 (1.2%) | 13 (1.6%) |
| Total | 1,122 (100.0%) | 829 (100.0%) |
Families and Households in Carterville
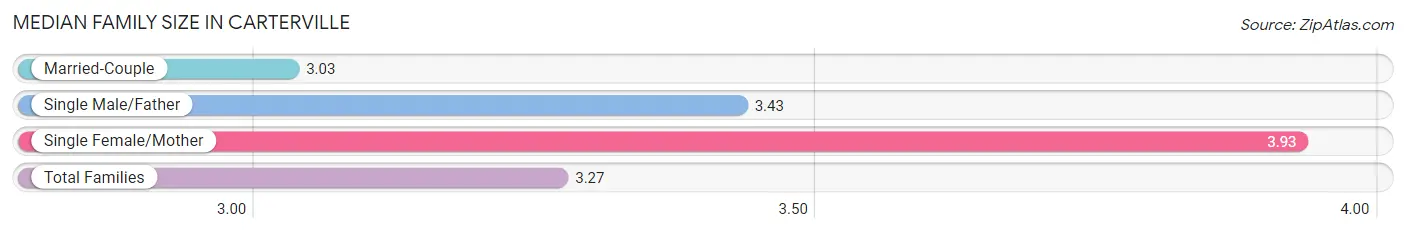
Median Family Size in Carterville
The median family size in Carterville is 3.27 persons per family, with single female/mother families (110 | 21.9%) accounting for the largest median family size of 3.93 persons per family. On the other hand, married-couple families (333 | 66.2%) represent the smallest median family size with 3.03 persons per family.
| Family Type | # Families | Family Size |
| Married-Couple | 333 (66.2%) | 3.03 |
| Single Male/Father | 60 (11.9%) | 3.43 |
| Single Female/Mother | 110 (21.9%) | 3.93 |
| Total Families | 503 (100.0%) | 3.27 |
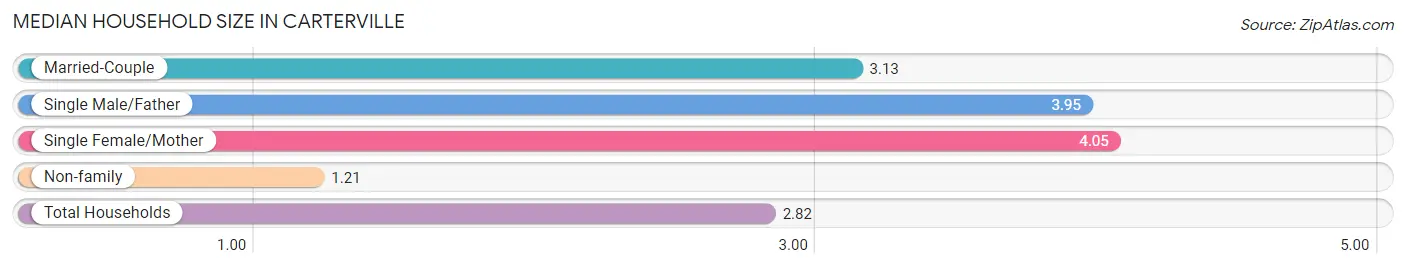
Median Household Size in Carterville
The median household size in Carterville is 2.82 persons per household, with single female/mother households (110 | 15.9%) accounting for the largest median household size of 4.05 persons per household. non-family households (188 | 27.2%) represent the smallest median household size with 1.21 persons per household.
| Household Type | # Households | Household Size |
| Married-Couple | 333 (48.2%) | 3.13 |
| Single Male/Father | 60 (8.7%) | 3.95 |
| Single Female/Mother | 110 (15.9%) | 4.05 |
| Non-family | 188 (27.2%) | 1.21 |
| Total Households | 691 (100.0%) | 2.82 |
Household Size by Marriage Status in Carterville
Out of a total of 691 households in Carterville, 503 (72.8%) are family households, while 188 (27.2%) are nonfamily households. The most numerous type of family households are 2-person households, comprising 184, and the most common type of nonfamily households are 1-person households, comprising 155.
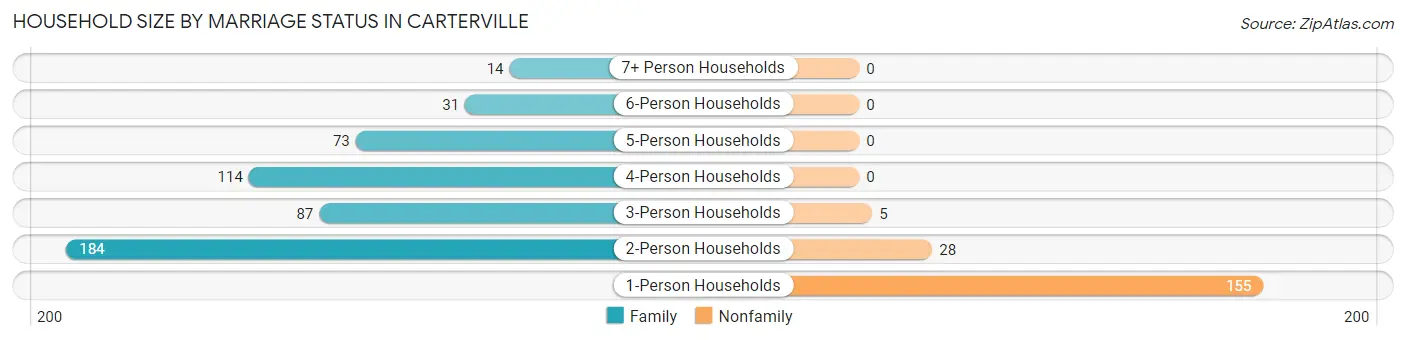
| Household Size | Family Households | Nonfamily Households |
| 1-Person Households | - | 155 (22.4%) |
| 2-Person Households | 184 (26.6%) | 28 (4.1%) |
| 3-Person Households | 87 (12.6%) | 5 (0.7%) |
| 4-Person Households | 114 (16.5%) | 0 (0.0%) |
| 5-Person Households | 73 (10.6%) | 0 (0.0%) |
| 6-Person Households | 31 (4.5%) | 0 (0.0%) |
| 7+ Person Households | 14 (2.0%) | 0 (0.0%) |
| Total | 503 (72.8%) | 188 (27.2%) |
Female Fertility in Carterville
Fertility by Age in Carterville
Average fertility rate in Carterville is 60.0 births per 1,000 women. Women in the age bracket of 20 to 34 years have the highest fertility rate with 128.0 births per 1,000 women. Women in the age bracket of 20 to 34 years acount for 76.0% of all women with births.
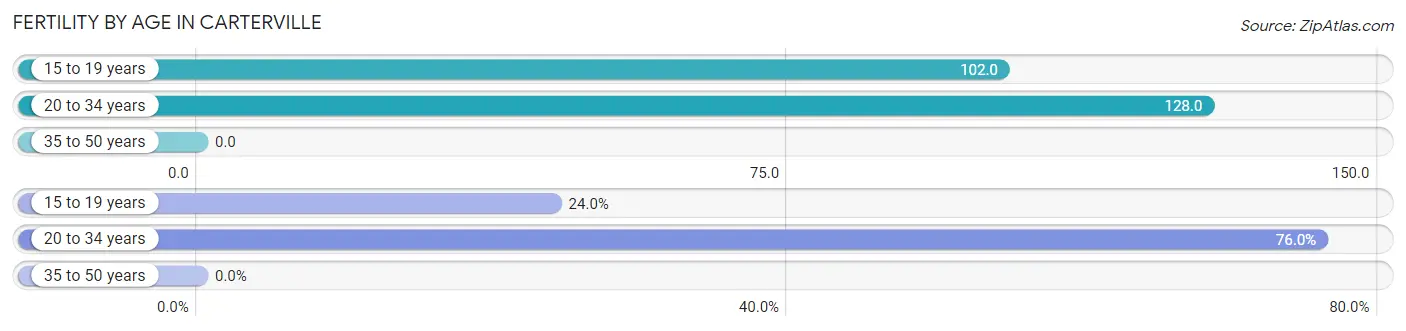
| Age Bracket | Women with Births | Births / 1,000 Women |
| 15 to 19 years | 6 (24.0%) | 102.0 |
| 20 to 34 years | 19 (76.0%) | 128.0 |
| 35 to 50 years | 0 (0.0%) | 0.0 |
| Total | 25 (100.0%) | 60.0 |
Fertility by Age by Marriage Status in Carterville
68.0% of women with births (25) in Carterville are married. The highest percentage of unmarried women with births falls into 15 to 19 years age bracket with 100.0% of them unmarried at the time of birth, while the lowest percentage of unmarried women with births belong to 20 to 34 years age bracket with 10.5% of them unmarried.
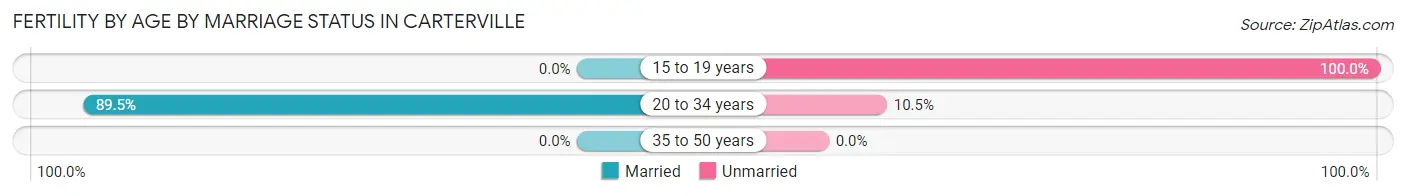
| Age Bracket | Married | Unmarried |
| 15 to 19 years | 0 (0.0%) | 6 (100.0%) |
| 20 to 34 years | 17 (89.5%) | 2 (10.5%) |
| 35 to 50 years | 0 (0.0%) | 0 (0.0%) |
| Total | 17 (68.0%) | 8 (32.0%) |
Fertility by Education in Carterville
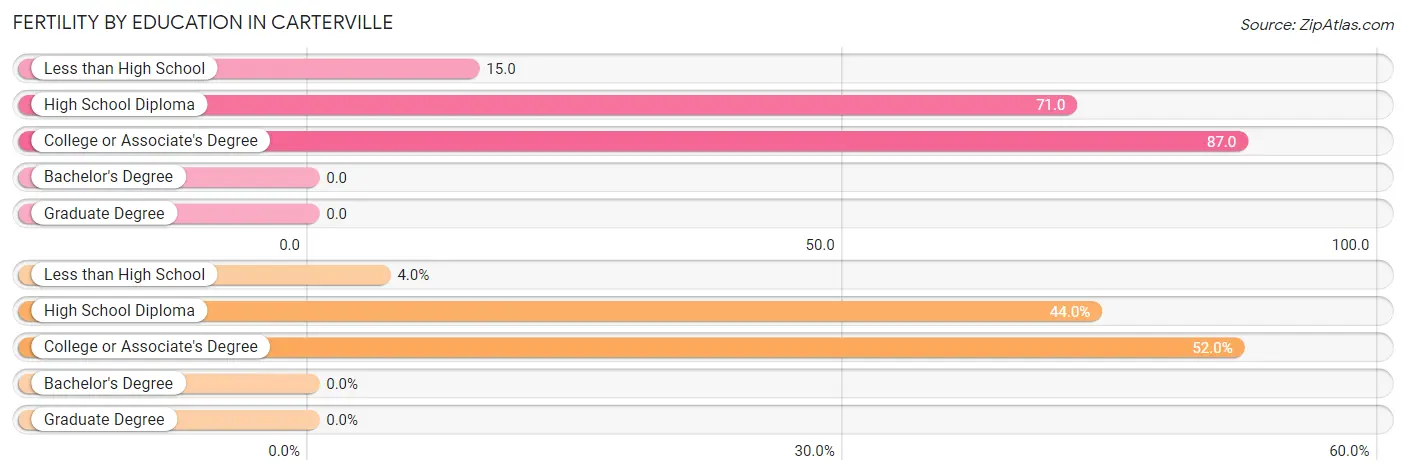
| Educational Attainment | Women with Births | Births / 1,000 Women |
| Less than High School | 1 (4.0%) | 15.0 |
| High School Diploma | 11 (44.0%) | 71.0 |
| College or Associate's Degree | 13 (52.0%) | 87.0 |
| Bachelor's Degree | 0 (0.0%) | 0.0 |
| Graduate Degree | 0 (0.0%) | 0.0 |
| Total | 25 (100.0%) | 60.0 |
Fertility by Education by Marriage Status in Carterville
32.0% of women with births in Carterville are unmarried. Women with the educational attainment of college or associate's degree are most likely to be married with 100.0% of them married at childbirth, while women with the educational attainment of less than high school are least likely to be married with 100.0% of them unmarried at childbirth.
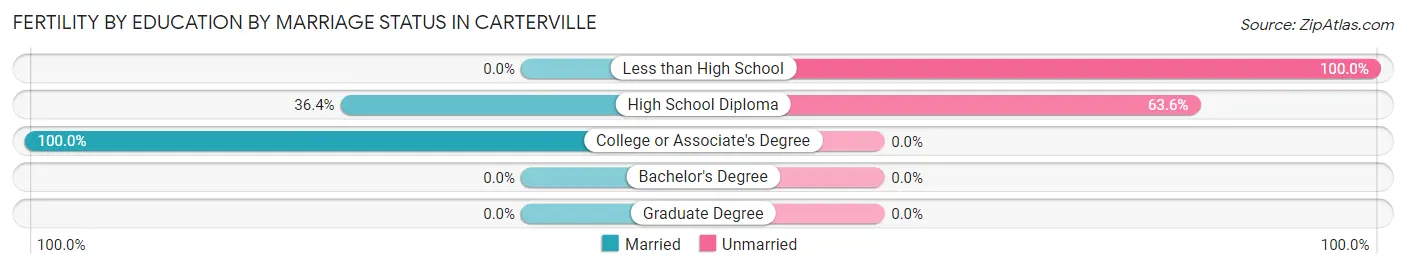
| Educational Attainment | Married | Unmarried |
| Less than High School | 0 (0.0%) | 1 (100.0%) |
| High School Diploma | 4 (36.4%) | 7 (63.6%) |
| College or Associate's Degree | 13 (100.0%) | 0 (0.0%) |
| Bachelor's Degree | 0 (0.0%) | 0 (0.0%) |
| Graduate Degree | 0 (0.0%) | 0 (0.0%) |
| Total | 17 (68.0%) | 8 (32.0%) |
Employment Characteristics in Carterville
Employment by Class of Employer in Carterville
Among the 734 employed individuals in Carterville, private company employees (595 | 81.1%), not-for-profit organizations (49 | 6.7%), and self-employed (not incorporated) (32 | 4.4%) make up the most common classes of employment.
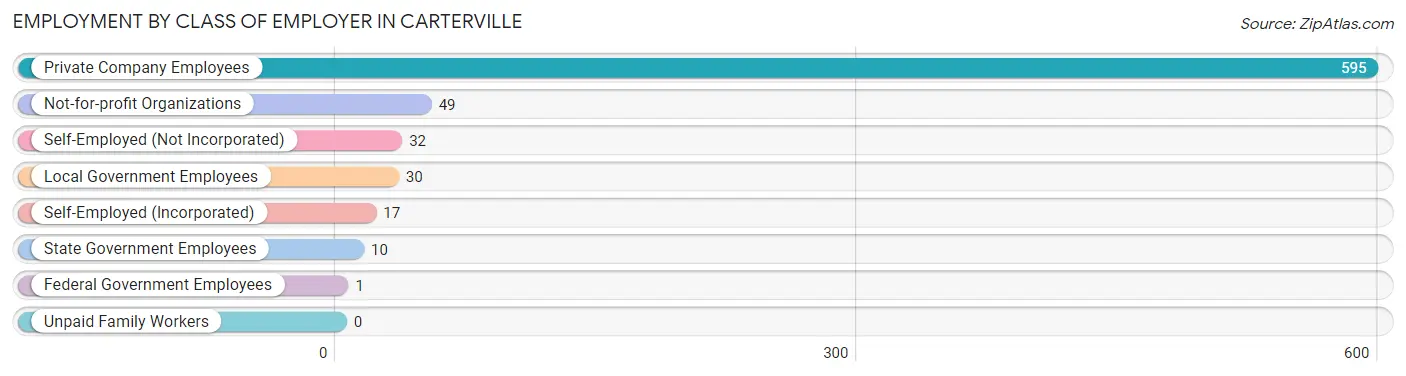
| Employer Class | # Employees | % Employees |
| Private Company Employees | 595 | 81.1% |
| Self-Employed (Incorporated) | 17 | 2.3% |
| Self-Employed (Not Incorporated) | 32 | 4.4% |
| Not-for-profit Organizations | 49 | 6.7% |
| Local Government Employees | 30 | 4.1% |
| State Government Employees | 10 | 1.4% |
| Federal Government Employees | 1 | 0.1% |
| Unpaid Family Workers | 0 | 0.0% |
| Total | 734 | 100.0% |
Employment Status by Age in Carterville
According to the labor force statistics for Carterville, out of the total population over 16 years of age (1,437), 59.0% or 848 individuals are in the labor force, with 8.6% or 73 of them unemployed. The age group with the highest labor force participation rate is 30 to 34 years, with 98.0% or 100 individuals in the labor force. Within the labor force, the 20 to 24 years age range has the highest percentage of unemployed individuals, with 28.8% or 19 of them being unemployed.
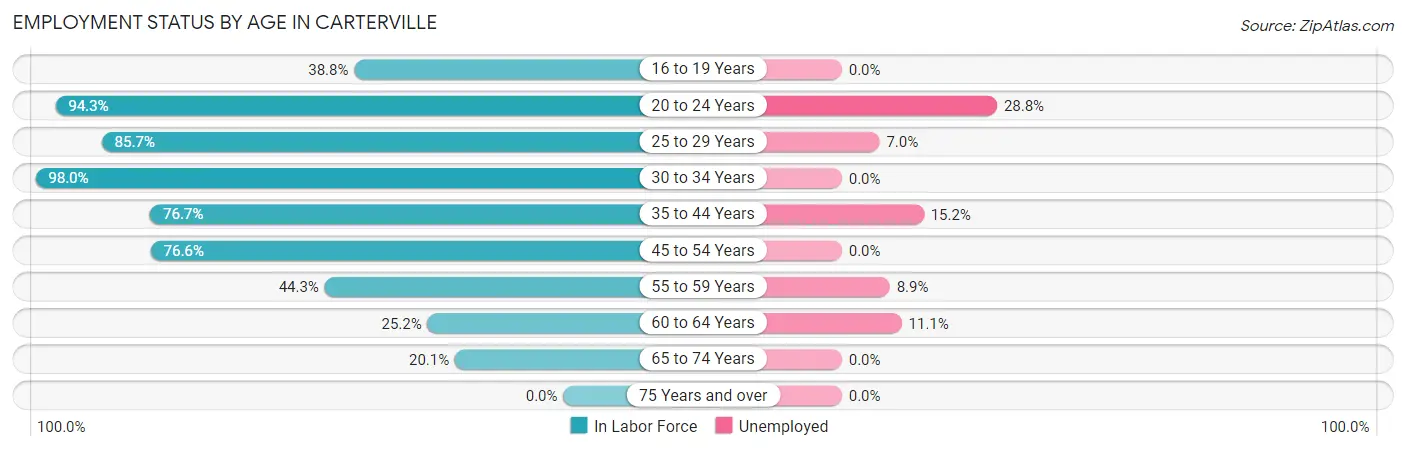
| Age Bracket | In Labor Force | Unemployed |
| 16 to 19 Years | 52 (38.8%) | 0 (0.0%) |
| 20 to 24 Years | 66 (94.3%) | 19 (28.8%) |
| 25 to 29 Years | 114 (85.7%) | 8 (7.0%) |
| 30 to 34 Years | 100 (98.0%) | 0 (0.0%) |
| 35 to 44 Years | 230 (76.7%) | 35 (15.2%) |
| 45 to 54 Years | 141 (76.6%) | 0 (0.0%) |
| 55 to 59 Years | 90 (44.3%) | 8 (8.9%) |
| 60 to 64 Years | 27 (25.2%) | 3 (11.1%) |
| 65 to 74 Years | 28 (20.1%) | 0 (0.0%) |
| 75 Years and over | 0 (0.0%) | 0 (0.0%) |
| Total | 848 (59.0%) | 73 (8.6%) |
Employment Status by Educational Attainment in Carterville
According to labor force statistics for Carterville, 68.2% of individuals (702) out of the total population between 25 and 64 years of age (1,029) are in the labor force, with 7.7% or 54 of them being unemployed. The group with the highest labor force participation rate are those with the educational attainment of bachelor's degree or higher, with 100.0% or 75 individuals in the labor force. Within the labor force, individuals with less than high school education have the highest percentage of unemployment, with 13.6% or 14 of them being unemployed.
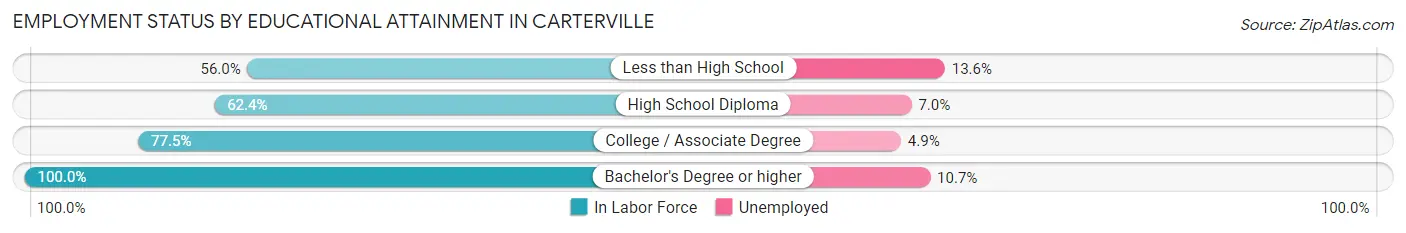
| Educational Attainment | In Labor Force | Unemployed |
| Less than High School | 103 (56.0%) | 25 (13.6%) |
| High School Diploma | 300 (62.4%) | 34 (7.0%) |
| College / Associate Degree | 224 (77.5%) | 14 (4.9%) |
| Bachelor's Degree or higher | 75 (100.0%) | 8 (10.7%) |
| Total | 702 (68.2%) | 79 (7.7%) |
Employment Occupations by Sex in Carterville
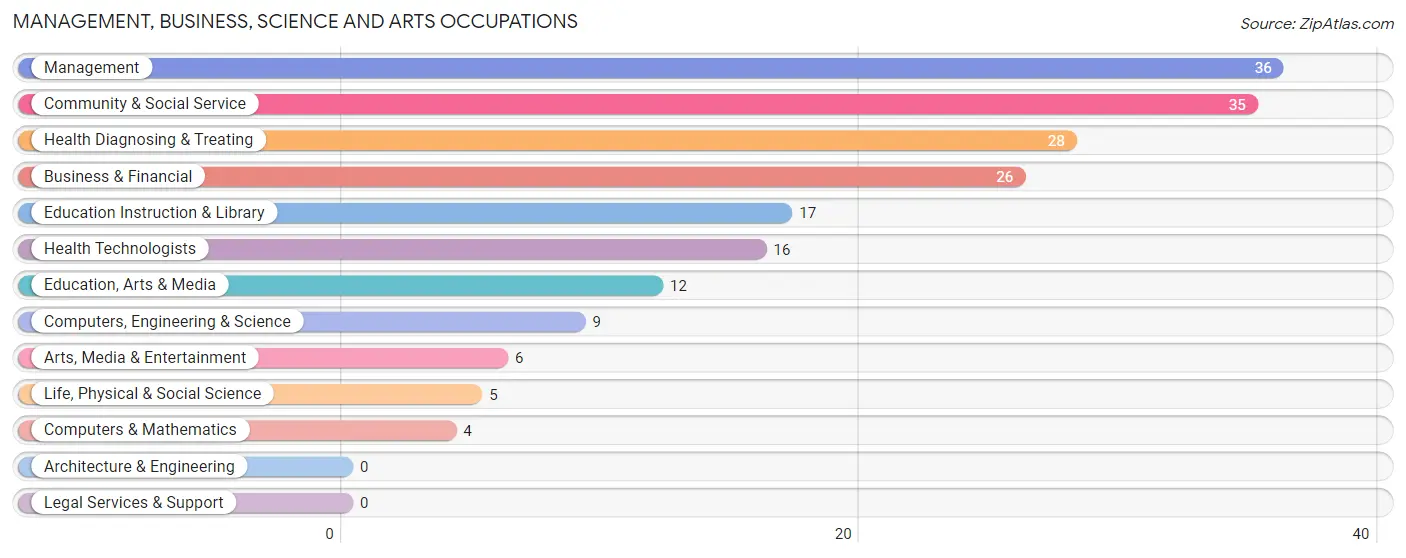
Management, Business, Science and Arts Occupations
The most common Management, Business, Science and Arts occupations in Carterville are Management (36 | 4.6%), Community & Social Service (35 | 4.5%), Health Diagnosing & Treating (28 | 3.6%), Business & Financial (26 | 3.4%), and Education Instruction & Library (17 | 2.2%).
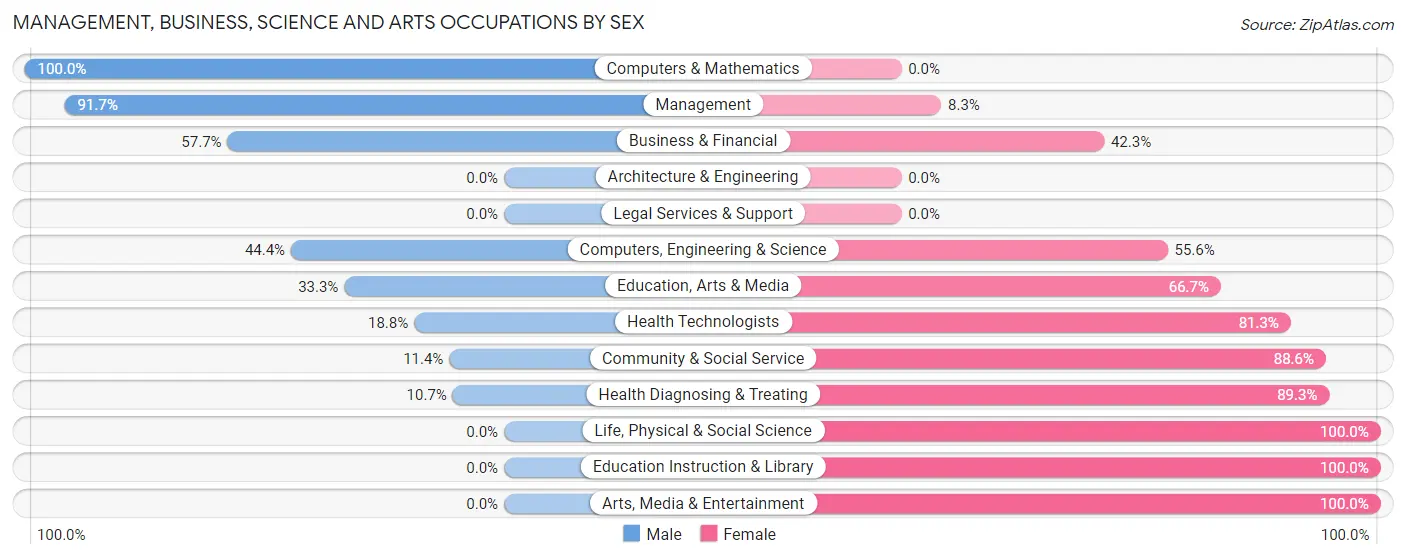
Management, Business, Science and Arts Occupations by Sex
Within the Management, Business, Science and Arts occupations in Carterville, the most male-oriented occupations are Computers & Mathematics (100.0%), Management (91.7%), and Business & Financial (57.7%), while the most female-oriented occupations are Life, Physical & Social Science (100.0%), Education Instruction & Library (100.0%), and Arts, Media & Entertainment (100.0%).
| Occupation | Male | Female |
| Management | 33 (91.7%) | 3 (8.3%) |
| Business & Financial | 15 (57.7%) | 11 (42.3%) |
| Computers, Engineering & Science | 4 (44.4%) | 5 (55.6%) |
| Computers & Mathematics | 4 (100.0%) | 0 (0.0%) |
| Architecture & Engineering | 0 (0.0%) | 0 (0.0%) |
| Life, Physical & Social Science | 0 (0.0%) | 5 (100.0%) |
| Community & Social Service | 4 (11.4%) | 31 (88.6%) |
| Education, Arts & Media | 4 (33.3%) | 8 (66.7%) |
| Legal Services & Support | 0 (0.0%) | 0 (0.0%) |
| Education Instruction & Library | 0 (0.0%) | 17 (100.0%) |
| Arts, Media & Entertainment | 0 (0.0%) | 6 (100.0%) |
| Health Diagnosing & Treating | 3 (10.7%) | 25 (89.3%) |
| Health Technologists | 3 (18.8%) | 13 (81.2%) |
| Total (Category) | 59 (44.0%) | 75 (56.0%) |
| Total (Overall) | 426 (55.0%) | 349 (45.0%) |
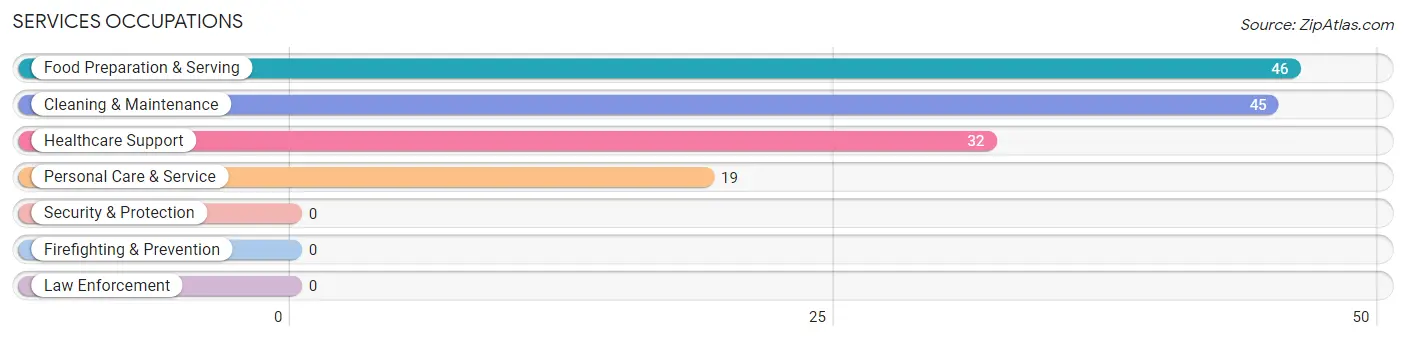
Services Occupations
The most common Services occupations in Carterville are Food Preparation & Serving (46 | 5.9%), Cleaning & Maintenance (45 | 5.8%), Healthcare Support (32 | 4.1%), and Personal Care & Service (19 | 2.5%).
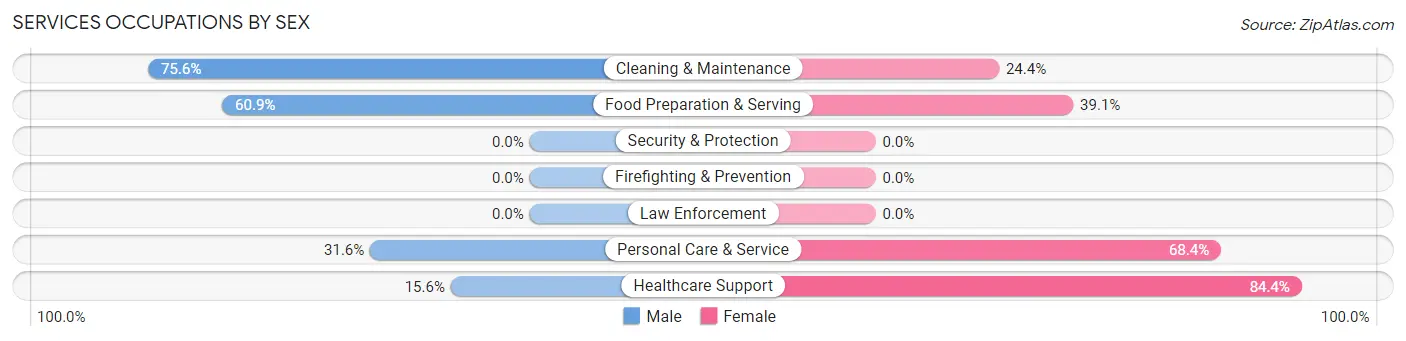
Services Occupations by Sex
Within the Services occupations in Carterville, the most male-oriented occupations are Cleaning & Maintenance (75.6%), Food Preparation & Serving (60.9%), and Personal Care & Service (31.6%), while the most female-oriented occupations are Healthcare Support (84.4%), Personal Care & Service (68.4%), and Food Preparation & Serving (39.1%).
| Occupation | Male | Female |
| Healthcare Support | 5 (15.6%) | 27 (84.4%) |
| Security & Protection | 0 (0.0%) | 0 (0.0%) |
| Firefighting & Prevention | 0 (0.0%) | 0 (0.0%) |
| Law Enforcement | 0 (0.0%) | 0 (0.0%) |
| Food Preparation & Serving | 28 (60.9%) | 18 (39.1%) |
| Cleaning & Maintenance | 34 (75.6%) | 11 (24.4%) |
| Personal Care & Service | 6 (31.6%) | 13 (68.4%) |
| Total (Category) | 73 (51.4%) | 69 (48.6%) |
| Total (Overall) | 426 (55.0%) | 349 (45.0%) |
Sales and Office Occupations
The most common Sales and Office occupations in Carterville are Office & Administration (112 | 14.4%), and Sales & Related (74 | 9.6%).
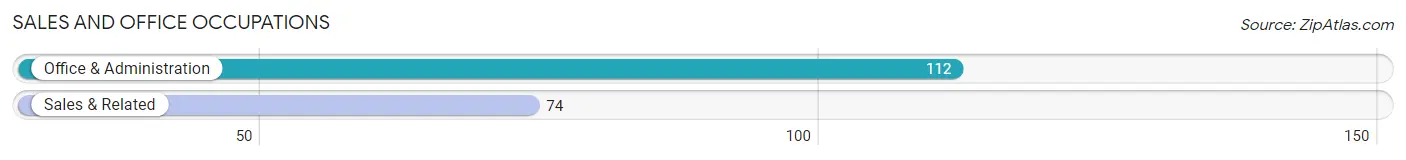
Sales and Office Occupations by Sex
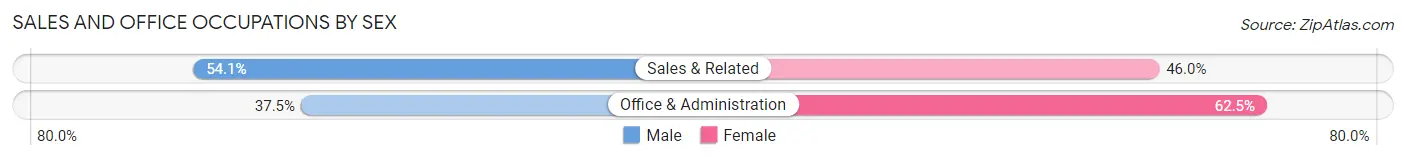
| Occupation | Male | Female |
| Sales & Related | 40 (54.0%) | 34 (46.0%) |
| Office & Administration | 42 (37.5%) | 70 (62.5%) |
| Total (Category) | 82 (44.1%) | 104 (55.9%) |
| Total (Overall) | 426 (55.0%) | 349 (45.0%) |
Natural Resources, Construction and Maintenance Occupations
The most common Natural Resources, Construction and Maintenance occupations in Carterville are Installation, Maintenance & Repair (53 | 6.8%), Construction & Extraction (36 | 4.6%), and Farming, Fishing & Forestry (9 | 1.2%).
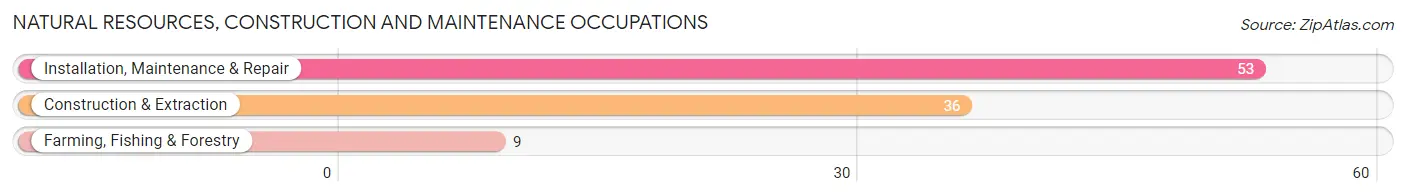
Natural Resources, Construction and Maintenance Occupations by Sex
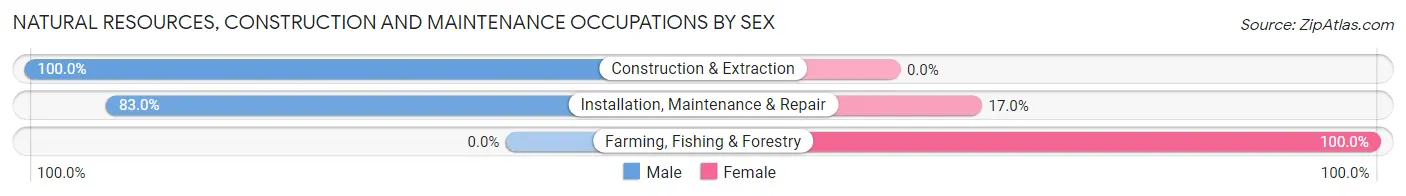
| Occupation | Male | Female |
| Farming, Fishing & Forestry | 0 (0.0%) | 9 (100.0%) |
| Construction & Extraction | 36 (100.0%) | 0 (0.0%) |
| Installation, Maintenance & Repair | 44 (83.0%) | 9 (17.0%) |
| Total (Category) | 80 (81.6%) | 18 (18.4%) |
| Total (Overall) | 426 (55.0%) | 349 (45.0%) |
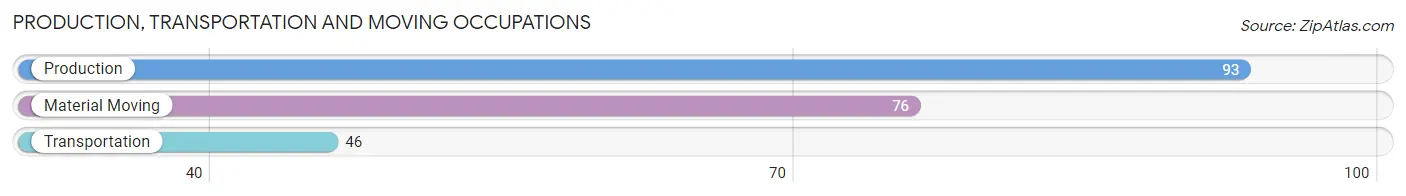
Production, Transportation and Moving Occupations
The most common Production, Transportation and Moving occupations in Carterville are Production (93 | 12.0%), Material Moving (76 | 9.8%), and Transportation (46 | 5.9%).
Production, Transportation and Moving Occupations by Sex
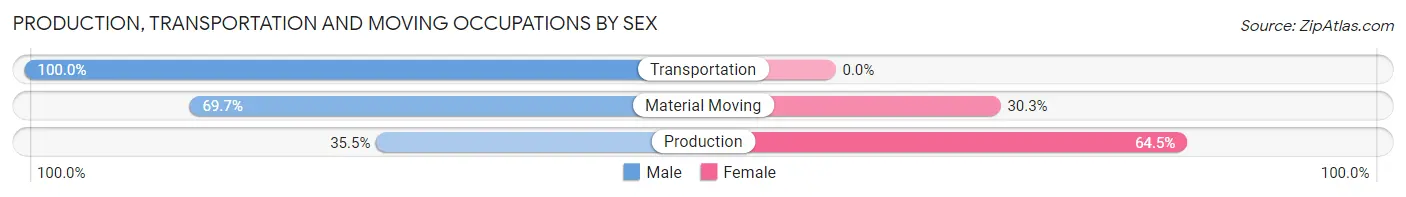
| Occupation | Male | Female |
| Production | 33 (35.5%) | 60 (64.5%) |
| Transportation | 46 (100.0%) | 0 (0.0%) |
| Material Moving | 53 (69.7%) | 23 (30.3%) |
| Total (Category) | 132 (61.4%) | 83 (38.6%) |
| Total (Overall) | 426 (55.0%) | 349 (45.0%) |
Employment Industries by Sex in Carterville
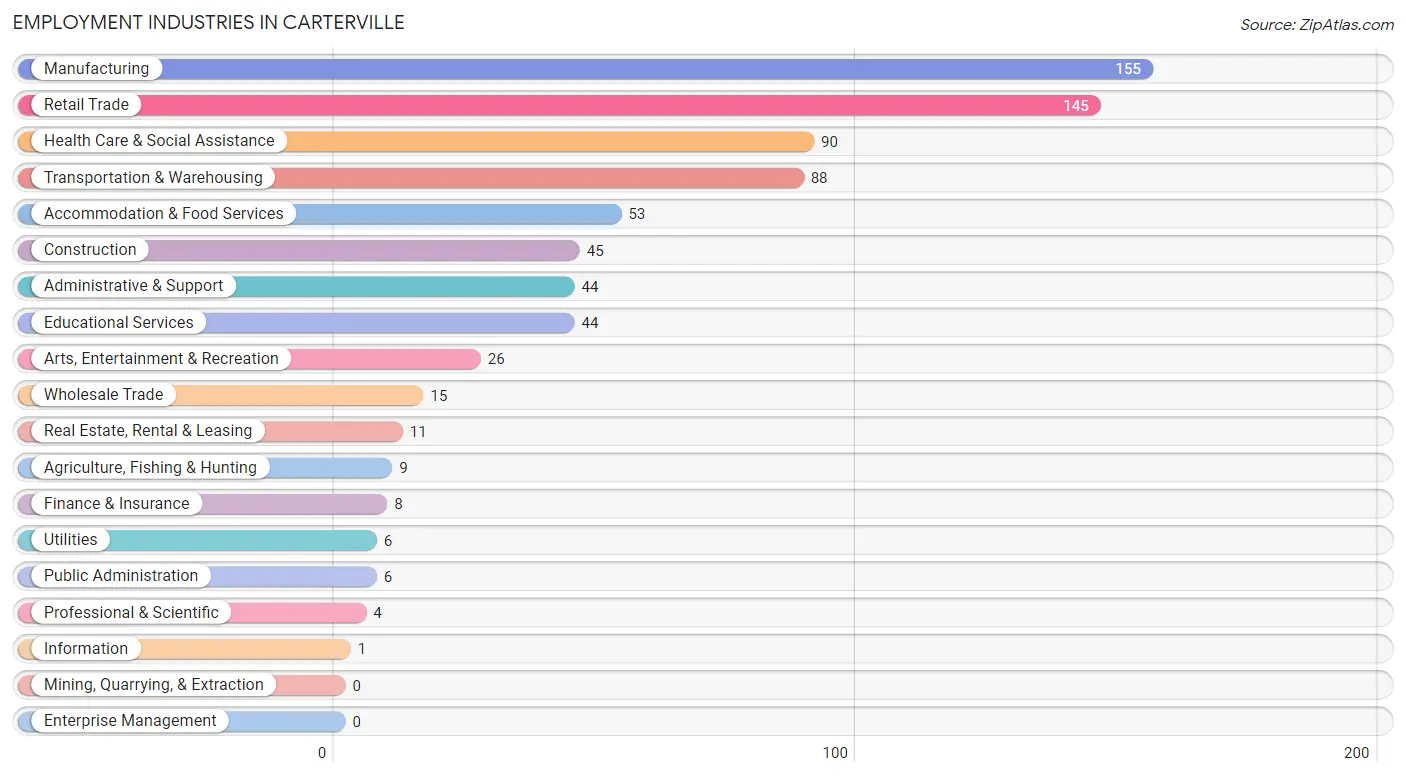
Employment Industries in Carterville
The major employment industries in Carterville include Manufacturing (155 | 20.0%), Retail Trade (145 | 18.7%), Health Care & Social Assistance (90 | 11.6%), Transportation & Warehousing (88 | 11.4%), and Accommodation & Food Services (53 | 6.8%).
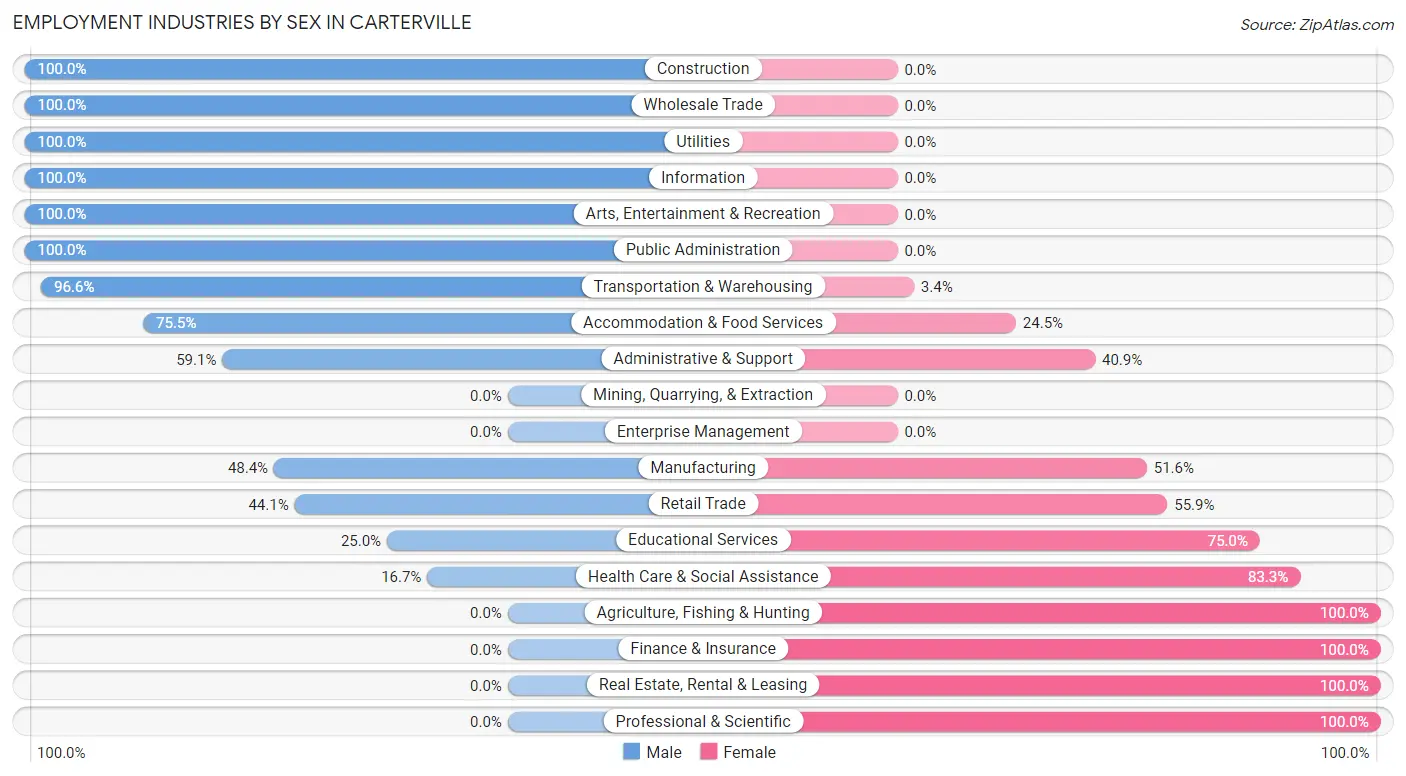
Employment Industries by Sex in Carterville
The Carterville industries that see more men than women are Construction (100.0%), Wholesale Trade (100.0%), and Utilities (100.0%), whereas the industries that tend to have a higher number of women are Agriculture, Fishing & Hunting (100.0%), Finance & Insurance (100.0%), and Real Estate, Rental & Leasing (100.0%).
| Industry | Male | Female |
| Agriculture, Fishing & Hunting | 0 (0.0%) | 9 (100.0%) |
| Mining, Quarrying, & Extraction | 0 (0.0%) | 0 (0.0%) |
| Construction | 45 (100.0%) | 0 (0.0%) |
| Manufacturing | 75 (48.4%) | 80 (51.6%) |
| Wholesale Trade | 15 (100.0%) | 0 (0.0%) |
| Retail Trade | 64 (44.1%) | 81 (55.9%) |
| Transportation & Warehousing | 85 (96.6%) | 3 (3.4%) |
| Utilities | 6 (100.0%) | 0 (0.0%) |
| Information | 1 (100.0%) | 0 (0.0%) |
| Finance & Insurance | 0 (0.0%) | 8 (100.0%) |
| Real Estate, Rental & Leasing | 0 (0.0%) | 11 (100.0%) |
| Professional & Scientific | 0 (0.0%) | 4 (100.0%) |
| Enterprise Management | 0 (0.0%) | 0 (0.0%) |
| Administrative & Support | 26 (59.1%) | 18 (40.9%) |
| Educational Services | 11 (25.0%) | 33 (75.0%) |
| Health Care & Social Assistance | 15 (16.7%) | 75 (83.3%) |
| Arts, Entertainment & Recreation | 26 (100.0%) | 0 (0.0%) |
| Accommodation & Food Services | 40 (75.5%) | 13 (24.5%) |
| Public Administration | 6 (100.0%) | 0 (0.0%) |
| Total | 426 (55.0%) | 349 (45.0%) |
Education in Carterville
School Enrollment in Carterville
The most common levels of schooling among the 551 students in Carterville are middle school (177 | 32.1%), high school (154 | 28.0%), and elementary school (126 | 22.9%).
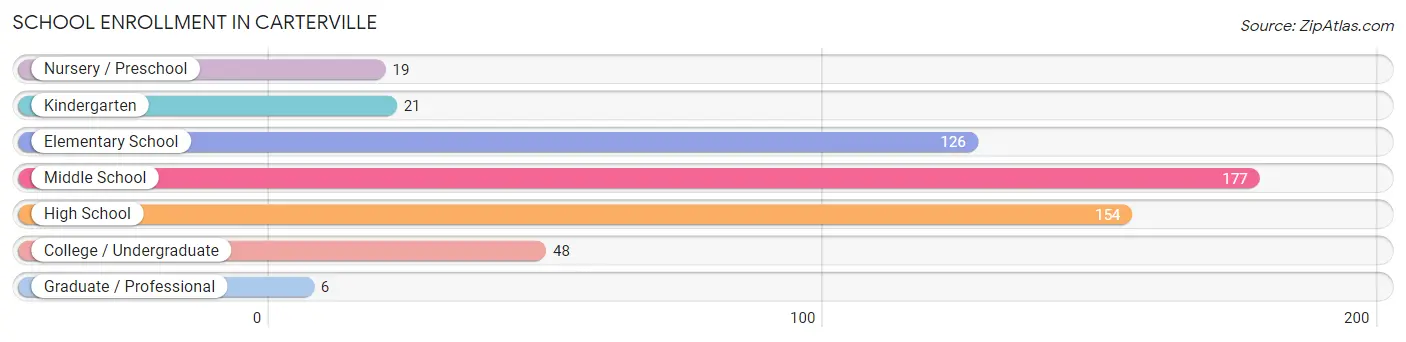
| School Level | # Students | % Students |
| Nursery / Preschool | 19 | 3.5% |
| Kindergarten | 21 | 3.8% |
| Elementary School | 126 | 22.9% |
| Middle School | 177 | 32.1% |
| High School | 154 | 28.0% |
| College / Undergraduate | 48 | 8.7% |
| Graduate / Professional | 6 | 1.1% |
| Total | 551 | 100.0% |
School Enrollment by Age by Funding Source in Carterville
Out of a total of 551 students who are enrolled in schools in Carterville, 30 (5.4%) attend a private institution, while the remaining 521 (94.6%) are enrolled in public schools. The age group of 3 to 4 year olds has the highest likelihood of being enrolled in private schools, with 5 (41.7% in the age bracket) enrolled. Conversely, the age group of 18 to 19 year olds has the lowest likelihood of being enrolled in a private school, with 14 (100.0% in the age bracket) attending a public institution.
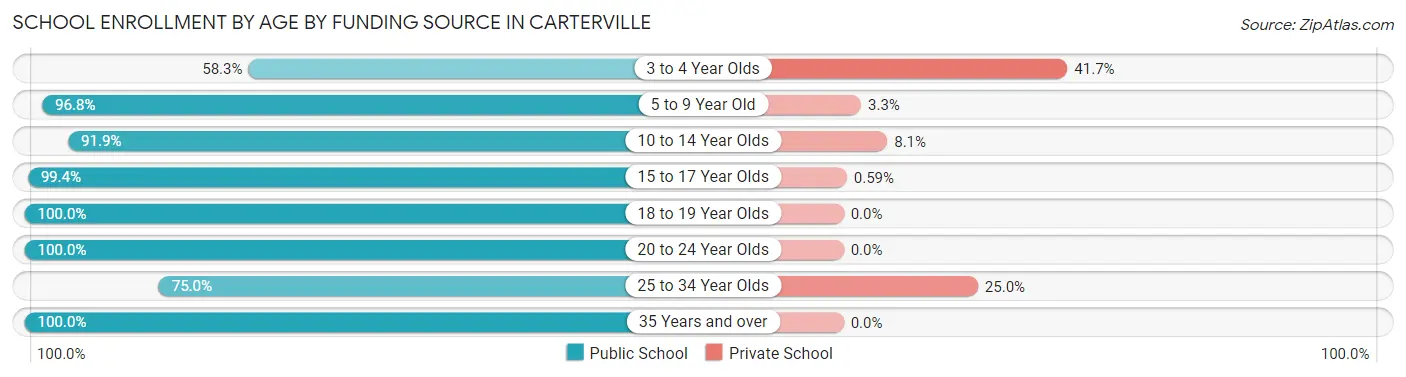
| Age Bracket | Public School | Private School |
| 3 to 4 Year Olds | 7 (58.3%) | 5 (41.7%) |
| 5 to 9 Year Old | 149 (96.8%) | 5 (3.3%) |
| 10 to 14 Year Olds | 147 (91.9%) | 13 (8.1%) |
| 15 to 17 Year Olds | 168 (99.4%) | 1 (0.6%) |
| 18 to 19 Year Olds | 14 (100.0%) | 0 (0.0%) |
| 20 to 24 Year Olds | 13 (100.0%) | 0 (0.0%) |
| 25 to 34 Year Olds | 18 (75.0%) | 6 (25.0%) |
| 35 Years and over | 5 (100.0%) | 0 (0.0%) |
| Total | 521 (94.6%) | 30 (5.4%) |
Educational Attainment by Field of Study in Carterville
Business (22 | 25.0%), education (14 | 15.9%), social sciences (12 | 13.6%), liberal arts & history (11 | 12.5%), and science & technology (10 | 11.4%) are the most common fields of study among 88 individuals in Carterville who have obtained a bachelor's degree or higher.
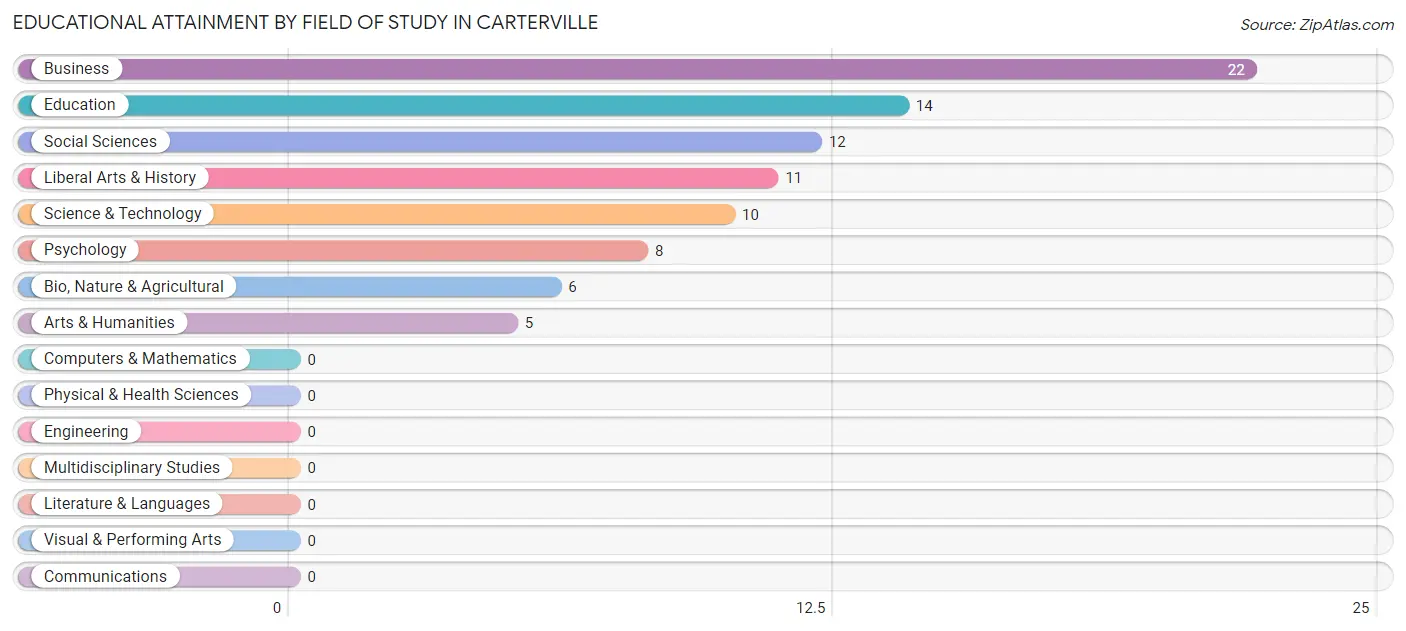
| Field of Study | # Graduates | % Graduates |
| Computers & Mathematics | 0 | 0.0% |
| Bio, Nature & Agricultural | 6 | 6.8% |
| Physical & Health Sciences | 0 | 0.0% |
| Psychology | 8 | 9.1% |
| Social Sciences | 12 | 13.6% |
| Engineering | 0 | 0.0% |
| Multidisciplinary Studies | 0 | 0.0% |
| Science & Technology | 10 | 11.4% |
| Business | 22 | 25.0% |
| Education | 14 | 15.9% |
| Literature & Languages | 0 | 0.0% |
| Liberal Arts & History | 11 | 12.5% |
| Visual & Performing Arts | 0 | 0.0% |
| Communications | 0 | 0.0% |
| Arts & Humanities | 5 | 5.7% |
| Total | 88 | 100.0% |
Transportation & Commute in Carterville
Vehicle Availability by Sex in Carterville
The most prevalent vehicle ownership categories in Carterville are males with 2 vehicles (165, accounting for 40.0%) and females with 2 vehicles (156, making up 51.4%).
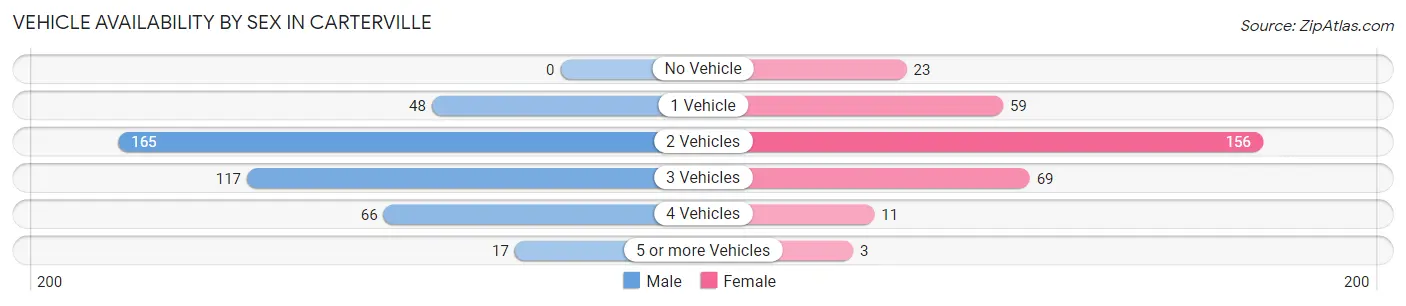
| Vehicles Available | Male | Female |
| No Vehicle | 0 (0.0%) | 23 (7.2%) |
| 1 Vehicle | 48 (11.6%) | 59 (18.4%) |
| 2 Vehicles | 165 (40.0%) | 156 (48.6%) |
| 3 Vehicles | 117 (28.3%) | 69 (21.5%) |
| 4 Vehicles | 66 (16.0%) | 11 (3.4%) |
| 5 or more Vehicles | 17 (4.1%) | 3 (0.9%) |
| Total | 413 (100.0%) | 321 (100.0%) |
Commute Time in Carterville
The most frequently occuring commute durations in Carterville are 15 to 19 minutes (189 commuters, 26.6%), 20 to 24 minutes (148 commuters, 20.8%), and 10 to 14 minutes (122 commuters, 17.2%).
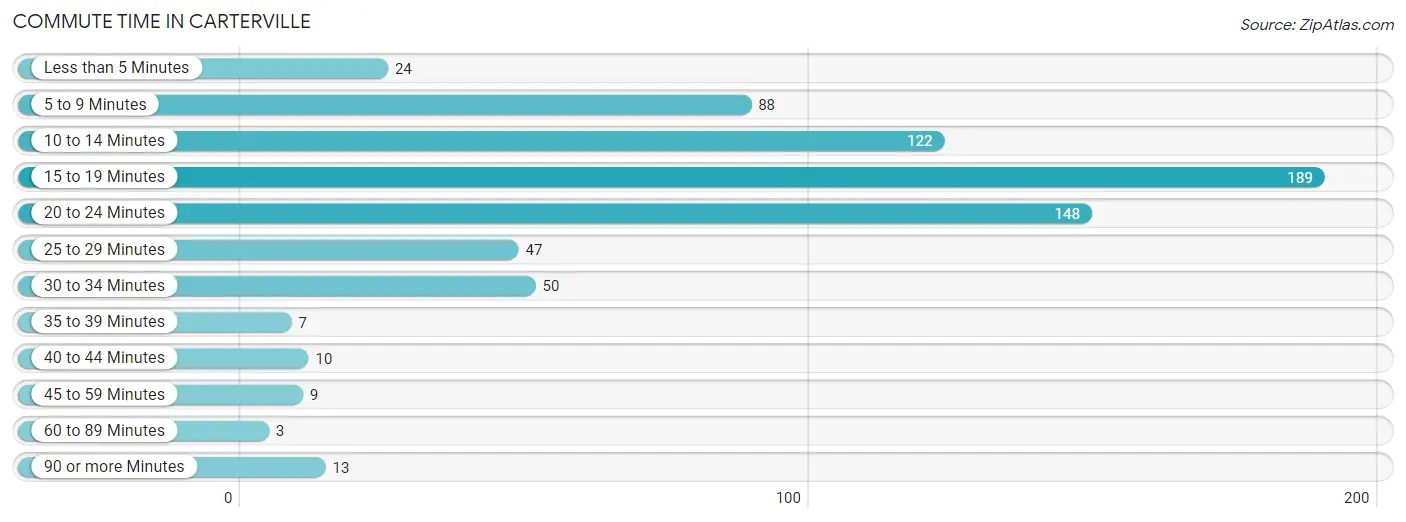
| Commute Time | # Commuters | % Commuters |
| Less than 5 Minutes | 24 | 3.4% |
| 5 to 9 Minutes | 88 | 12.4% |
| 10 to 14 Minutes | 122 | 17.2% |
| 15 to 19 Minutes | 189 | 26.6% |
| 20 to 24 Minutes | 148 | 20.8% |
| 25 to 29 Minutes | 47 | 6.6% |
| 30 to 34 Minutes | 50 | 7.0% |
| 35 to 39 Minutes | 7 | 1.0% |
| 40 to 44 Minutes | 10 | 1.4% |
| 45 to 59 Minutes | 9 | 1.3% |
| 60 to 89 Minutes | 3 | 0.4% |
| 90 or more Minutes | 13 | 1.8% |
Commute Time by Sex in Carterville
The most common commute times in Carterville are 15 to 19 minutes (104 commuters, 25.8%) for males and 20 to 24 minutes (93 commuters, 30.3%) for females.
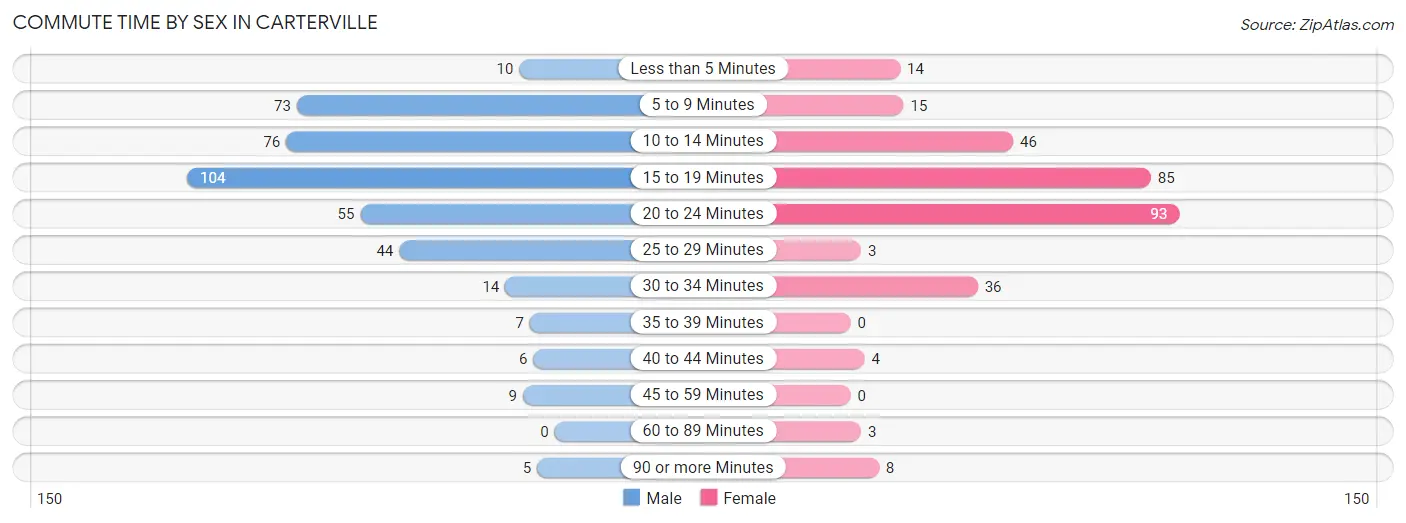
| Commute Time | Male | Female |
| Less than 5 Minutes | 10 (2.5%) | 14 (4.6%) |
| 5 to 9 Minutes | 73 (18.1%) | 15 (4.9%) |
| 10 to 14 Minutes | 76 (18.9%) | 46 (15.0%) |
| 15 to 19 Minutes | 104 (25.8%) | 85 (27.7%) |
| 20 to 24 Minutes | 55 (13.7%) | 93 (30.3%) |
| 25 to 29 Minutes | 44 (10.9%) | 3 (1.0%) |
| 30 to 34 Minutes | 14 (3.5%) | 36 (11.7%) |
| 35 to 39 Minutes | 7 (1.7%) | 0 (0.0%) |
| 40 to 44 Minutes | 6 (1.5%) | 4 (1.3%) |
| 45 to 59 Minutes | 9 (2.2%) | 0 (0.0%) |
| 60 to 89 Minutes | 0 (0.0%) | 3 (1.0%) |
| 90 or more Minutes | 5 (1.2%) | 8 (2.6%) |
Time of Departure to Work by Sex in Carterville
The most frequent times of departure to work in Carterville are 7:30 AM to 7:59 AM (59, 14.6%) for males and 7:30 AM to 7:59 AM (83, 27.0%) for females.
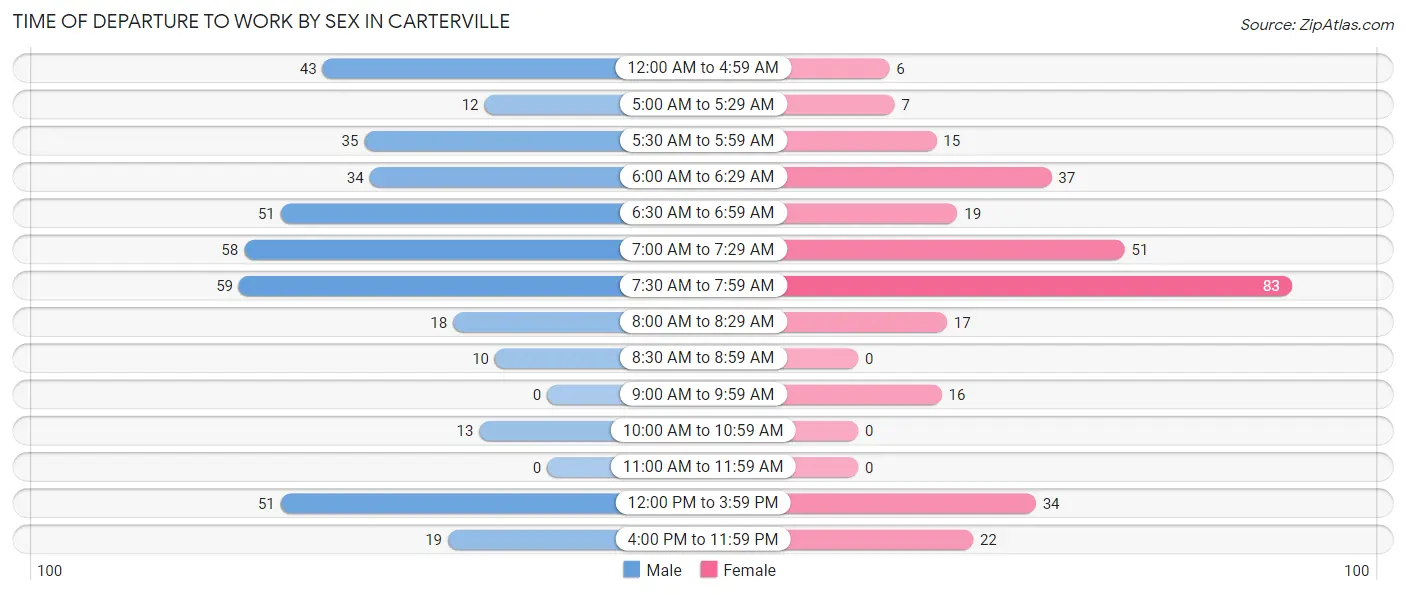
| Time of Departure | Male | Female |
| 12:00 AM to 4:59 AM | 43 (10.7%) | 6 (1.9%) |
| 5:00 AM to 5:29 AM | 12 (3.0%) | 7 (2.3%) |
| 5:30 AM to 5:59 AM | 35 (8.7%) | 15 (4.9%) |
| 6:00 AM to 6:29 AM | 34 (8.4%) | 37 (12.0%) |
| 6:30 AM to 6:59 AM | 51 (12.7%) | 19 (6.2%) |
| 7:00 AM to 7:29 AM | 58 (14.4%) | 51 (16.6%) |
| 7:30 AM to 7:59 AM | 59 (14.6%) | 83 (27.0%) |
| 8:00 AM to 8:29 AM | 18 (4.5%) | 17 (5.5%) |
| 8:30 AM to 8:59 AM | 10 (2.5%) | 0 (0.0%) |
| 9:00 AM to 9:59 AM | 0 (0.0%) | 16 (5.2%) |
| 10:00 AM to 10:59 AM | 13 (3.2%) | 0 (0.0%) |
| 11:00 AM to 11:59 AM | 0 (0.0%) | 0 (0.0%) |
| 12:00 PM to 3:59 PM | 51 (12.7%) | 34 (11.1%) |
| 4:00 PM to 11:59 PM | 19 (4.7%) | 22 (7.2%) |
| Total | 403 (100.0%) | 307 (100.0%) |
Housing Occupancy in Carterville
Occupancy by Ownership in Carterville
Of the total 691 dwellings in Carterville, owner-occupied units account for 487 (70.5%), while renter-occupied units make up 204 (29.5%).
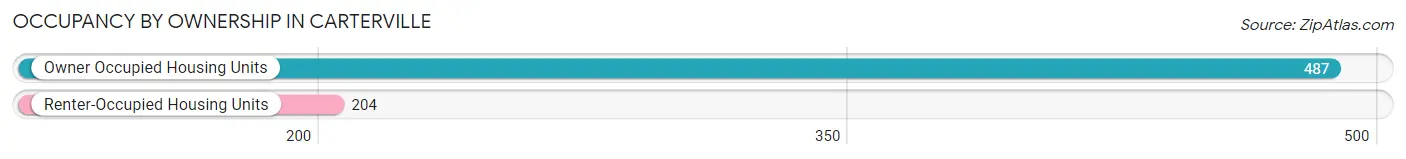
| Occupancy | # Housing Units | % Housing Units |
| Owner Occupied Housing Units | 487 | 70.5% |
| Renter-Occupied Housing Units | 204 | 29.5% |
| Total Occupied Housing Units | 691 | 100.0% |
Occupancy by Household Size in Carterville
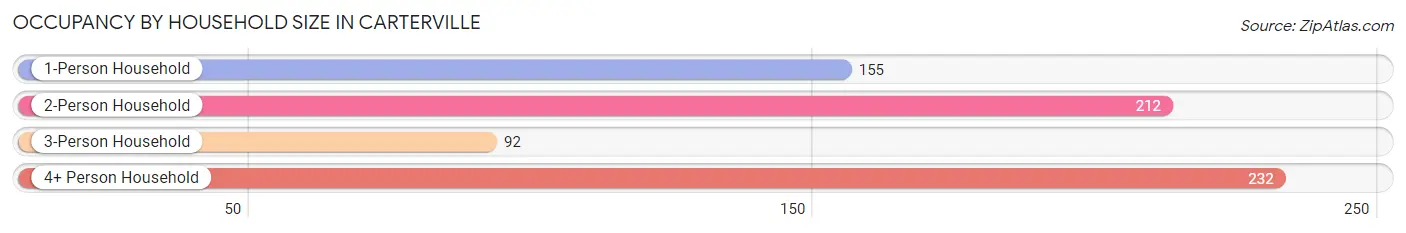
| Household Size | # Housing Units | % Housing Units |
| 1-Person Household | 155 | 22.4% |
| 2-Person Household | 212 | 30.7% |
| 3-Person Household | 92 | 13.3% |
| 4+ Person Household | 232 | 33.6% |
| Total Housing Units | 691 | 100.0% |
Occupancy by Ownership by Household Size in Carterville
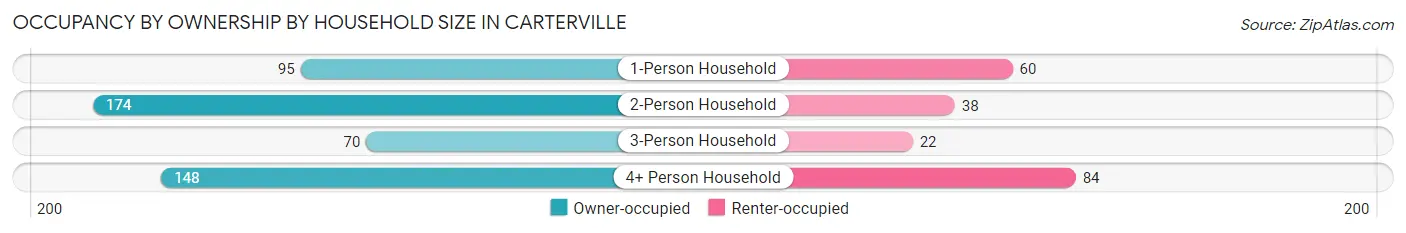
| Household Size | Owner-occupied | Renter-occupied |
| 1-Person Household | 95 (61.3%) | 60 (38.7%) |
| 2-Person Household | 174 (82.1%) | 38 (17.9%) |
| 3-Person Household | 70 (76.1%) | 22 (23.9%) |
| 4+ Person Household | 148 (63.8%) | 84 (36.2%) |
| Total Housing Units | 487 (70.5%) | 204 (29.5%) |
Occupancy by Educational Attainment in Carterville
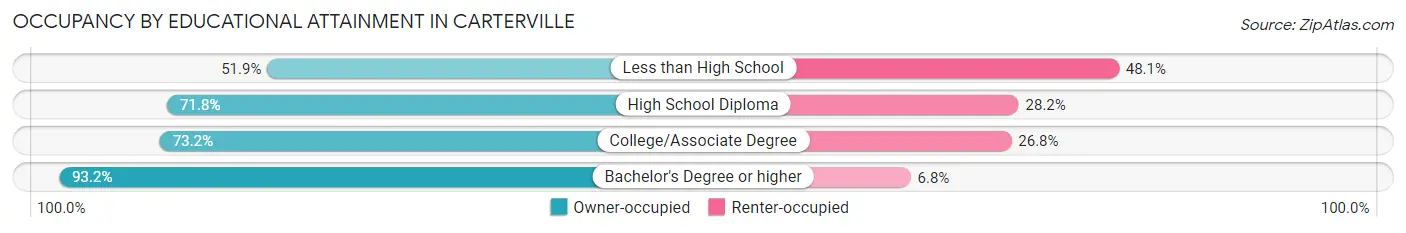
| Household Size | Owner-occupied | Renter-occupied |
| Less than High School | 55 (51.9%) | 51 (48.1%) |
| High School Diploma | 249 (71.8%) | 98 (28.2%) |
| College/Associate Degree | 142 (73.2%) | 52 (26.8%) |
| Bachelor's Degree or higher | 41 (93.2%) | 3 (6.8%) |
Occupancy by Age of Householder in Carterville
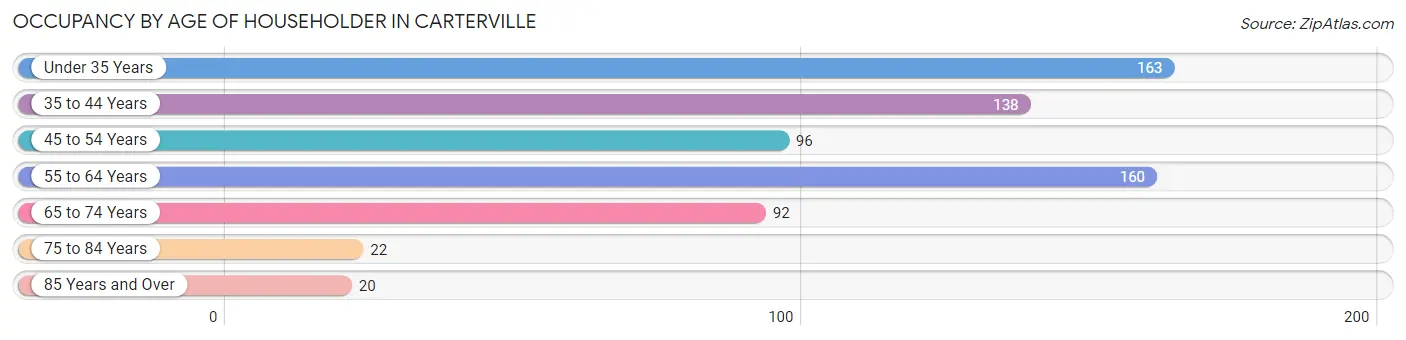
| Age Bracket | # Households | % Households |
| Under 35 Years | 163 | 23.6% |
| 35 to 44 Years | 138 | 20.0% |
| 45 to 54 Years | 96 | 13.9% |
| 55 to 64 Years | 160 | 23.2% |
| 65 to 74 Years | 92 | 13.3% |
| 75 to 84 Years | 22 | 3.2% |
| 85 Years and Over | 20 | 2.9% |
| Total | 691 | 100.0% |
Housing Finances in Carterville
Median Income by Occupancy in Carterville
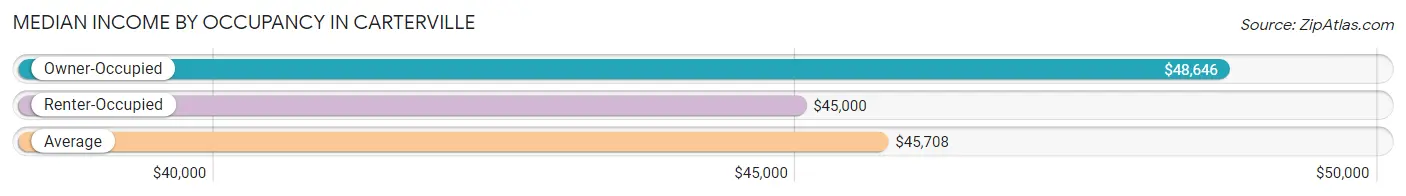
| Occupancy Type | # Households | Median Income |
| Owner-Occupied | 487 (70.5%) | $48,646 |
| Renter-Occupied | 204 (29.5%) | $45,000 |
| Average | 691 (100.0%) | $45,708 |
Occupancy by Householder Income Bracket in Carterville
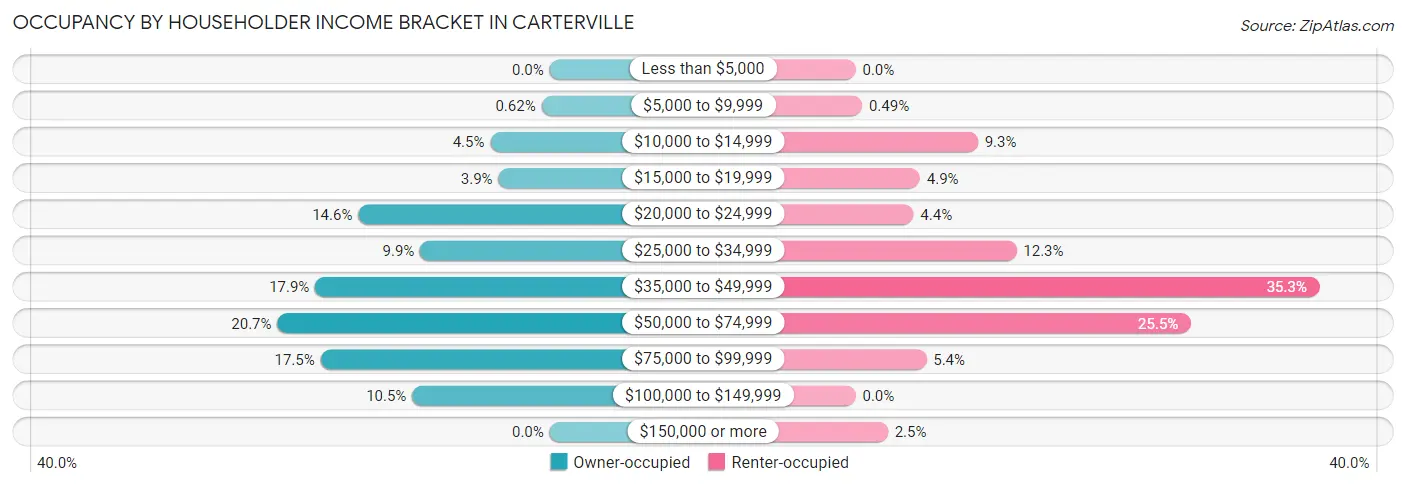
| Income Bracket | Owner-occupied | Renter-occupied |
| Less than $5,000 | 0 (0.0%) | 0 (0.0%) |
| $5,000 to $9,999 | 3 (0.6%) | 1 (0.5%) |
| $10,000 to $14,999 | 22 (4.5%) | 19 (9.3%) |
| $15,000 to $19,999 | 19 (3.9%) | 10 (4.9%) |
| $20,000 to $24,999 | 71 (14.6%) | 9 (4.4%) |
| $25,000 to $34,999 | 48 (9.9%) | 25 (12.2%) |
| $35,000 to $49,999 | 87 (17.9%) | 72 (35.3%) |
| $50,000 to $74,999 | 101 (20.7%) | 52 (25.5%) |
| $75,000 to $99,999 | 85 (17.4%) | 11 (5.4%) |
| $100,000 to $149,999 | 51 (10.5%) | 0 (0.0%) |
| $150,000 or more | 0 (0.0%) | 5 (2.5%) |
| Total | 487 (100.0%) | 204 (100.0%) |
Monthly Housing Cost Tiers in Carterville
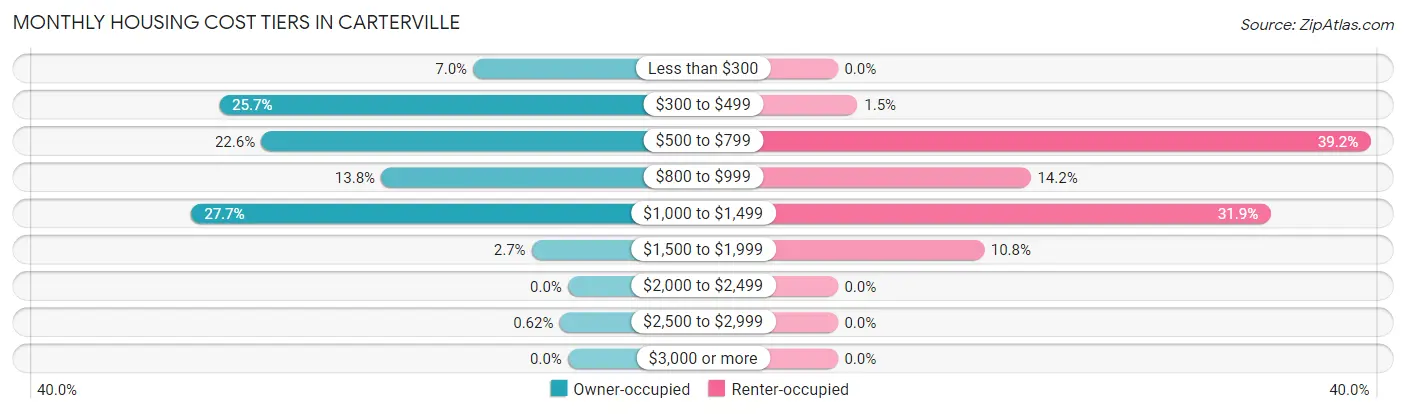
| Monthly Cost | Owner-occupied | Renter-occupied |
| Less than $300 | 34 (7.0%) | 0 (0.0%) |
| $300 to $499 | 125 (25.7%) | 3 (1.5%) |
| $500 to $799 | 110 (22.6%) | 80 (39.2%) |
| $800 to $999 | 67 (13.8%) | 29 (14.2%) |
| $1,000 to $1,499 | 135 (27.7%) | 65 (31.9%) |
| $1,500 to $1,999 | 13 (2.7%) | 22 (10.8%) |
| $2,000 to $2,499 | 0 (0.0%) | 0 (0.0%) |
| $2,500 to $2,999 | 3 (0.6%) | 0 (0.0%) |
| $3,000 or more | 0 (0.0%) | 0 (0.0%) |
| Total | 487 (100.0%) | 204 (100.0%) |
Physical Housing Characteristics in Carterville
Housing Structures in Carterville
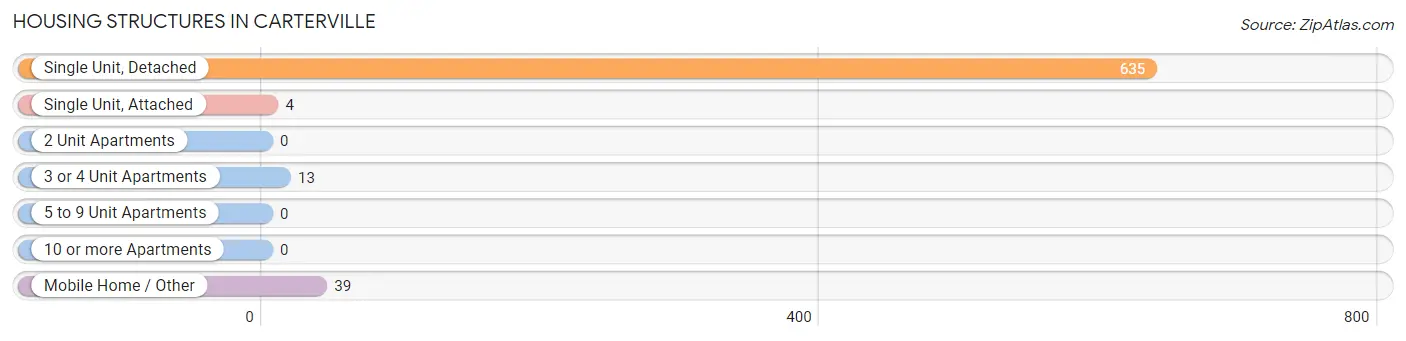
| Structure Type | # Housing Units | % Housing Units |
| Single Unit, Detached | 635 | 91.9% |
| Single Unit, Attached | 4 | 0.6% |
| 2 Unit Apartments | 0 | 0.0% |
| 3 or 4 Unit Apartments | 13 | 1.9% |
| 5 to 9 Unit Apartments | 0 | 0.0% |
| 10 or more Apartments | 0 | 0.0% |
| Mobile Home / Other | 39 | 5.6% |
| Total | 691 | 100.0% |
Housing Structures by Occupancy in Carterville
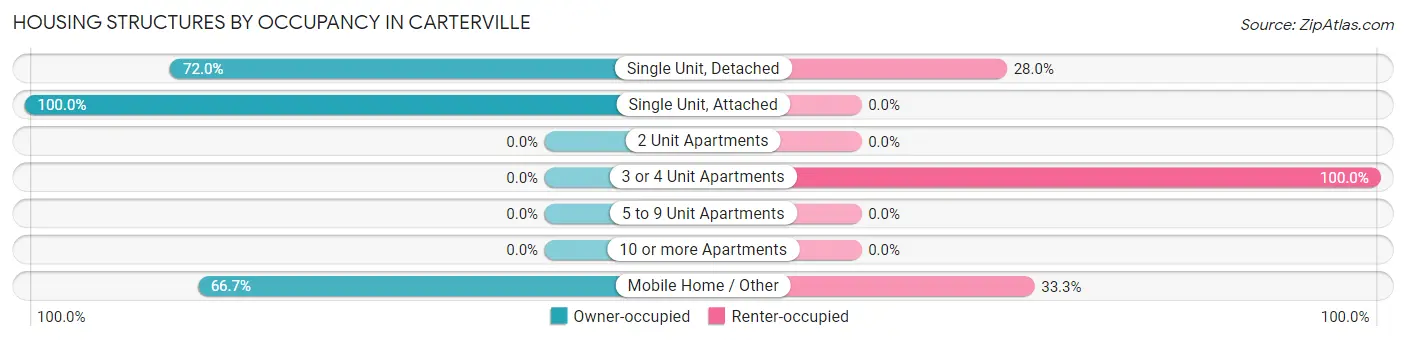
| Structure Type | Owner-occupied | Renter-occupied |
| Single Unit, Detached | 457 (72.0%) | 178 (28.0%) |
| Single Unit, Attached | 4 (100.0%) | 0 (0.0%) |
| 2 Unit Apartments | 0 (0.0%) | 0 (0.0%) |
| 3 or 4 Unit Apartments | 0 (0.0%) | 13 (100.0%) |
| 5 to 9 Unit Apartments | 0 (0.0%) | 0 (0.0%) |
| 10 or more Apartments | 0 (0.0%) | 0 (0.0%) |
| Mobile Home / Other | 26 (66.7%) | 13 (33.3%) |
| Total | 487 (70.5%) | 204 (29.5%) |
Housing Structures by Number of Rooms in Carterville
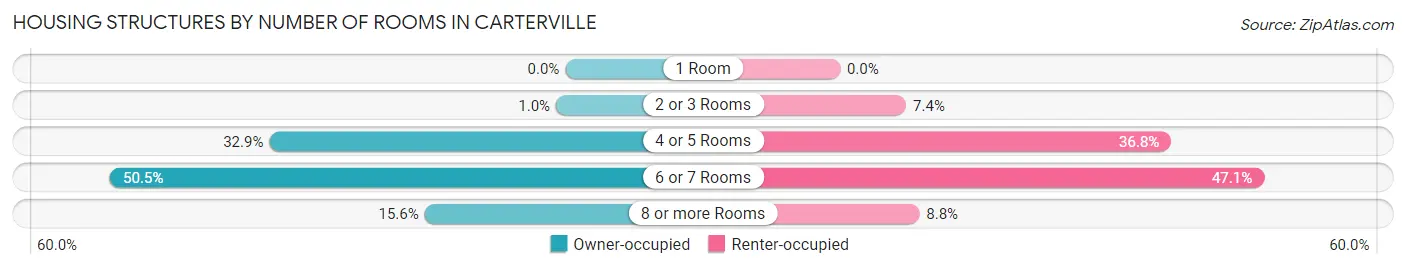
| Number of Rooms | Owner-occupied | Renter-occupied |
| 1 Room | 0 (0.0%) | 0 (0.0%) |
| 2 or 3 Rooms | 5 (1.0%) | 15 (7.3%) |
| 4 or 5 Rooms | 160 (32.9%) | 75 (36.8%) |
| 6 or 7 Rooms | 246 (50.5%) | 96 (47.1%) |
| 8 or more Rooms | 76 (15.6%) | 18 (8.8%) |
| Total | 487 (100.0%) | 204 (100.0%) |
Housing Structure by Heating Type in Carterville
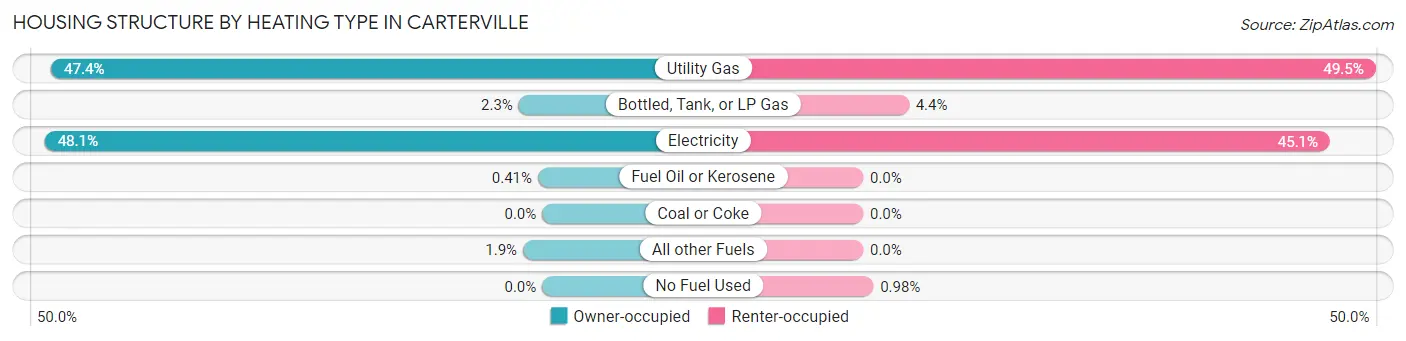
| Heating Type | Owner-occupied | Renter-occupied |
| Utility Gas | 231 (47.4%) | 101 (49.5%) |
| Bottled, Tank, or LP Gas | 11 (2.3%) | 9 (4.4%) |
| Electricity | 234 (48.0%) | 92 (45.1%) |
| Fuel Oil or Kerosene | 2 (0.4%) | 0 (0.0%) |
| Coal or Coke | 0 (0.0%) | 0 (0.0%) |
| All other Fuels | 9 (1.8%) | 0 (0.0%) |
| No Fuel Used | 0 (0.0%) | 2 (1.0%) |
| Total | 487 (100.0%) | 204 (100.0%) |
Household Vehicle Usage in Carterville
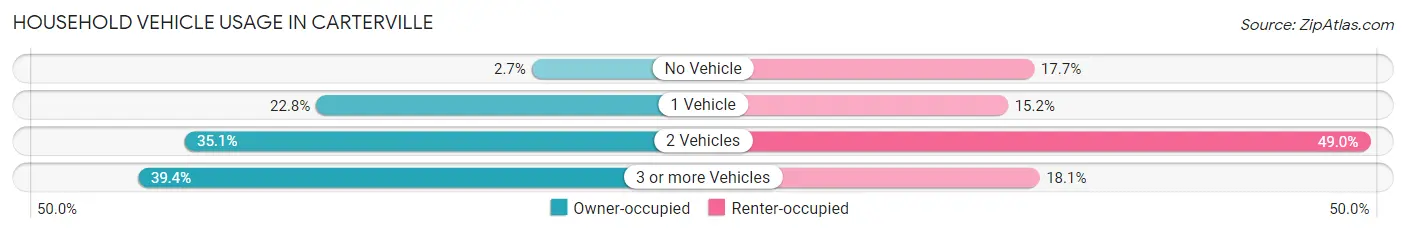
| Vehicles per Household | Owner-occupied | Renter-occupied |
| No Vehicle | 13 (2.7%) | 36 (17.6%) |
| 1 Vehicle | 111 (22.8%) | 31 (15.2%) |
| 2 Vehicles | 171 (35.1%) | 100 (49.0%) |
| 3 or more Vehicles | 192 (39.4%) | 37 (18.1%) |
| Total | 487 (100.0%) | 204 (100.0%) |
Real Estate & Mortgages in Carterville
Real Estate and Mortgage Overview in Carterville
| Characteristic | Without Mortgage | With Mortgage |
| Housing Units | 207 | 280 |
| Median Property Value | $58,800 | $101,300 |
| Median Household Income | $35,313 | $0 |
| Monthly Housing Costs | $432 | $0 |
| Real Estate Taxes | $707 | $0 |
Property Value by Mortgage Status in Carterville
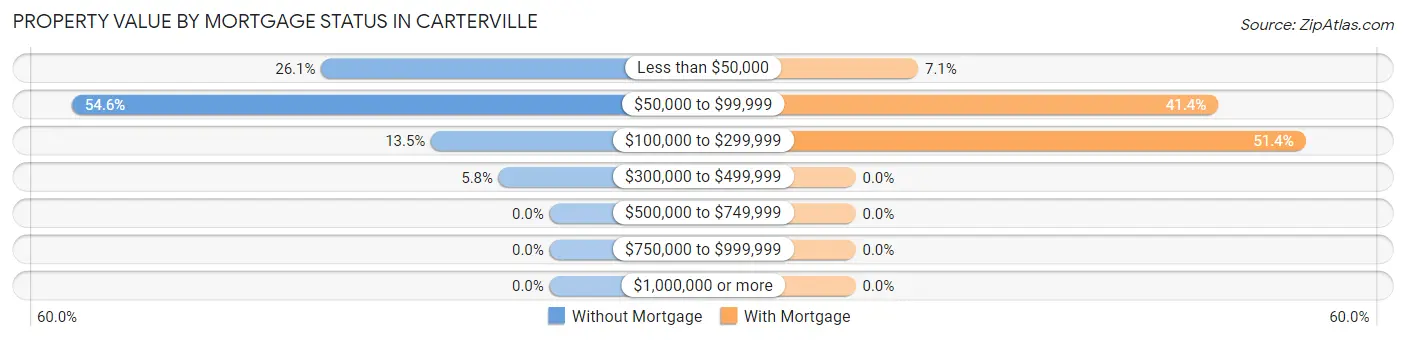
| Property Value | Without Mortgage | With Mortgage |
| Less than $50,000 | 54 (26.1%) | 20 (7.1%) |
| $50,000 to $99,999 | 113 (54.6%) | 116 (41.4%) |
| $100,000 to $299,999 | 28 (13.5%) | 144 (51.4%) |
| $300,000 to $499,999 | 12 (5.8%) | 0 (0.0%) |
| $500,000 to $749,999 | 0 (0.0%) | 0 (0.0%) |
| $750,000 to $999,999 | 0 (0.0%) | 0 (0.0%) |
| $1,000,000 or more | 0 (0.0%) | 0 (0.0%) |
| Total | 207 (100.0%) | 280 (100.0%) |
Household Income by Mortgage Status in Carterville
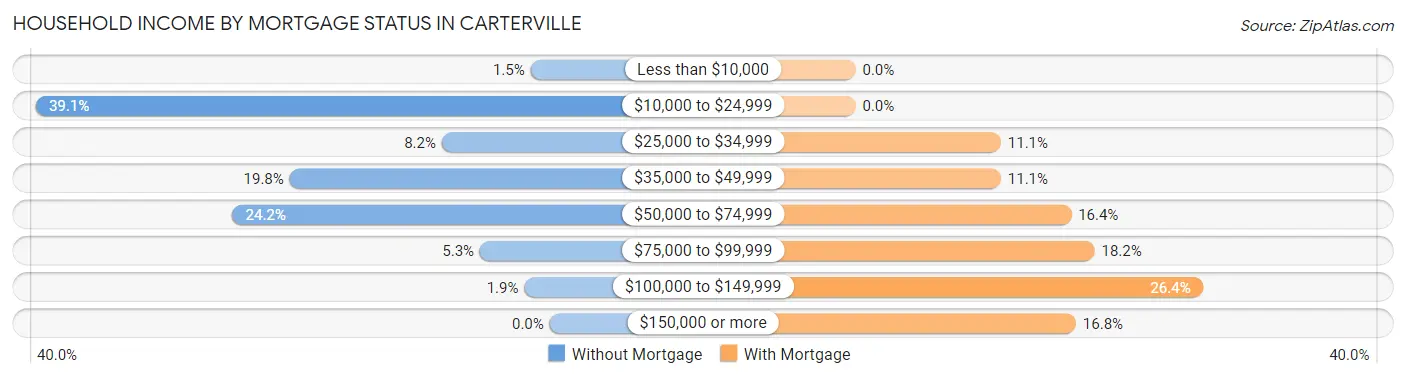
| Household Income | Without Mortgage | With Mortgage |
| Less than $10,000 | 3 (1.5%) | 0 (0.0%) |
| $10,000 to $24,999 | 81 (39.1%) | 0 (0.0%) |
| $25,000 to $34,999 | 17 (8.2%) | 31 (11.1%) |
| $35,000 to $49,999 | 41 (19.8%) | 31 (11.1%) |
| $50,000 to $74,999 | 50 (24.1%) | 46 (16.4%) |
| $75,000 to $99,999 | 11 (5.3%) | 51 (18.2%) |
| $100,000 to $149,999 | 4 (1.9%) | 74 (26.4%) |
| $150,000 or more | 0 (0.0%) | 47 (16.8%) |
| Total | 207 (100.0%) | 280 (100.0%) |
Property Value to Household Income Ratio in Carterville
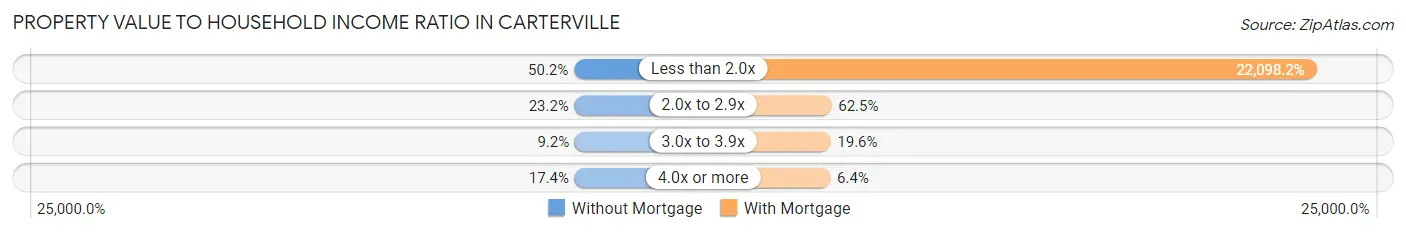
| Value-to-Income Ratio | Without Mortgage | With Mortgage |
| Less than 2.0x | 104 (50.2%) | 61,875 (22,098.2%) |
| 2.0x to 2.9x | 48 (23.2%) | 175 (62.5%) |
| 3.0x to 3.9x | 19 (9.2%) | 55 (19.6%) |
| 4.0x or more | 36 (17.4%) | 18 (6.4%) |
| Total | 207 (100.0%) | 280 (100.0%) |
Real Estate Taxes by Mortgage Status in Carterville
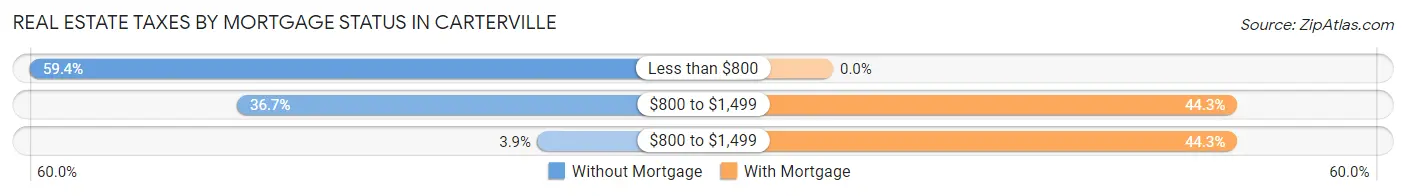
| Property Taxes | Without Mortgage | With Mortgage |
| Less than $800 | 123 (59.4%) | 0 (0.0%) |
| $800 to $1,499 | 76 (36.7%) | 124 (44.3%) |
| $800 to $1,499 | 8 (3.9%) | 124 (44.3%) |
| Total | 207 (100.0%) | 280 (100.0%) |
Health & Disability in Carterville
Health Insurance Coverage by Age in Carterville
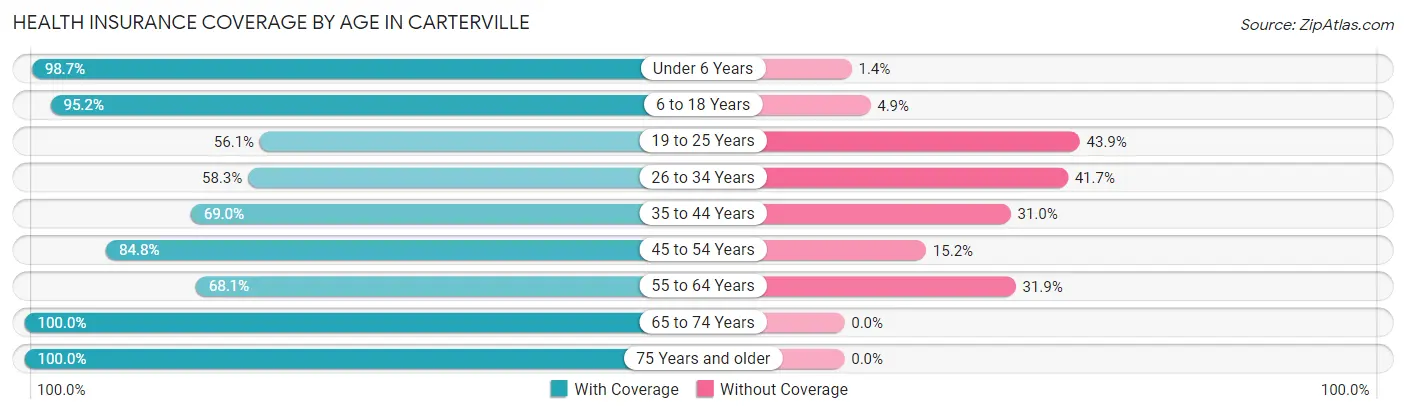
| Age Bracket | With Coverage | Without Coverage |
| Under 6 Years | 146 (98.7%) | 2 (1.3%) |
| 6 to 18 Years | 451 (95.2%) | 23 (4.9%) |
| 19 to 25 Years | 78 (56.1%) | 61 (43.9%) |
| 26 to 34 Years | 112 (58.3%) | 80 (41.7%) |
| 35 to 44 Years | 207 (69.0%) | 93 (31.0%) |
| 45 to 54 Years | 156 (84.8%) | 28 (15.2%) |
| 55 to 64 Years | 211 (68.1%) | 99 (31.9%) |
| 65 to 74 Years | 139 (100.0%) | 0 (0.0%) |
| 75 Years and older | 65 (100.0%) | 0 (0.0%) |
| Total | 1,565 (80.2%) | 386 (19.8%) |
Health Insurance Coverage by Citizenship Status in Carterville
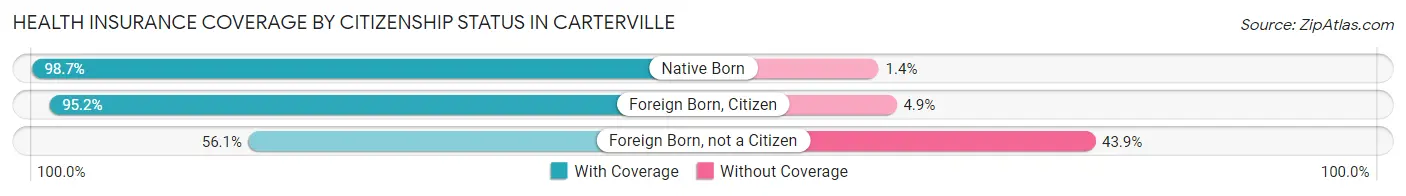
| Citizenship Status | With Coverage | Without Coverage |
| Native Born | 146 (98.7%) | 2 (1.3%) |
| Foreign Born, Citizen | 451 (95.2%) | 23 (4.9%) |
| Foreign Born, not a Citizen | 78 (56.1%) | 61 (43.9%) |
Health Insurance Coverage by Household Income in Carterville
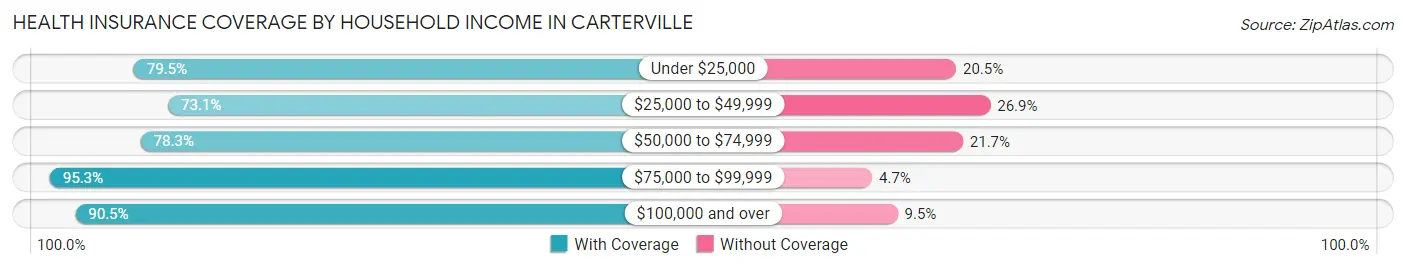
| Household Income | With Coverage | Without Coverage |
| Under $25,000 | 338 (79.5%) | 87 (20.5%) |
| $25,000 to $49,999 | 438 (73.1%) | 161 (26.9%) |
| $50,000 to $74,999 | 396 (78.3%) | 110 (21.7%) |
| $75,000 to $99,999 | 241 (95.3%) | 12 (4.7%) |
| $100,000 and over | 152 (90.5%) | 16 (9.5%) |
Public vs Private Health Insurance Coverage by Age in Carterville
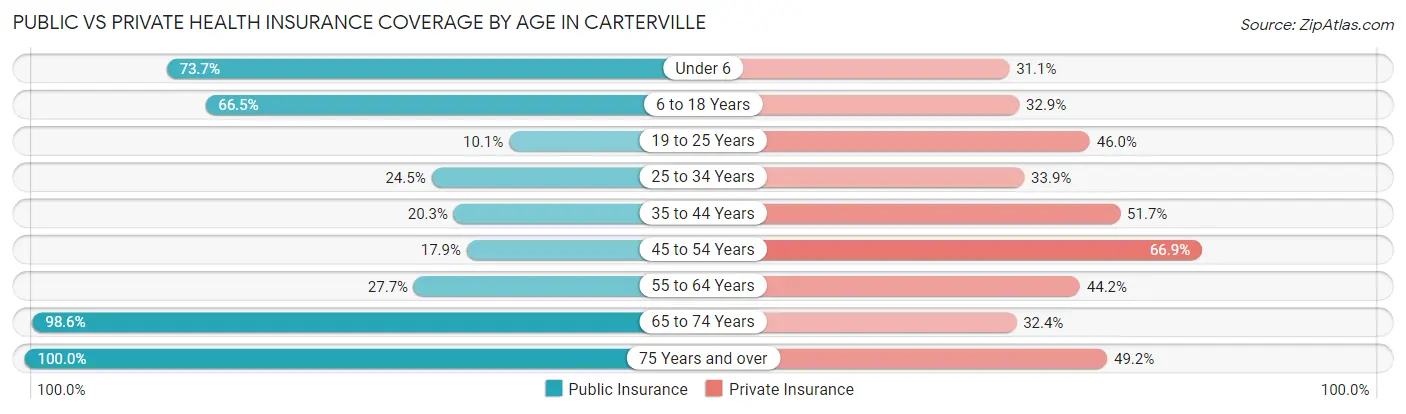
| Age Bracket | Public Insurance | Private Insurance |
| Under 6 | 109 (73.7%) | 46 (31.1%) |
| 6 to 18 Years | 315 (66.5%) | 156 (32.9%) |
| 19 to 25 Years | 14 (10.1%) | 64 (46.0%) |
| 25 to 34 Years | 47 (24.5%) | 65 (33.9%) |
| 35 to 44 Years | 61 (20.3%) | 155 (51.7%) |
| 45 to 54 Years | 33 (17.9%) | 123 (66.8%) |
| 55 to 64 Years | 86 (27.7%) | 137 (44.2%) |
| 65 to 74 Years | 137 (98.6%) | 45 (32.4%) |
| 75 Years and over | 65 (100.0%) | 32 (49.2%) |
| Total | 867 (44.4%) | 823 (42.2%) |
Disability Status by Sex by Age in Carterville
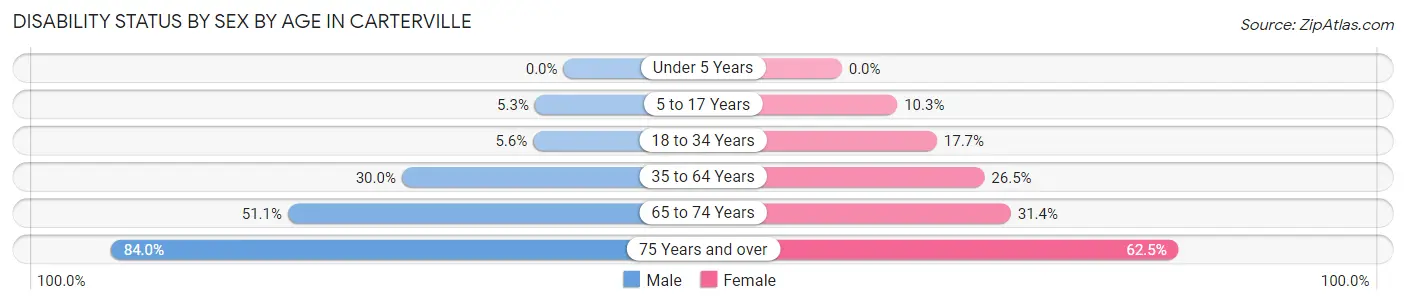
| Age Bracket | Male | Female |
| Under 5 Years | 0 (0.0%) | 0 (0.0%) |
| 5 to 17 Years | 19 (5.3%) | 14 (10.3%) |
| 18 to 34 Years | 10 (5.6%) | 30 (17.6%) |
| 35 to 64 Years | 126 (30.0%) | 99 (26.5%) |
| 65 to 74 Years | 45 (51.1%) | 16 (31.4%) |
| 75 Years and over | 21 (84.0%) | 25 (62.5%) |
Disability Class by Sex by Age in Carterville
Disability Class: Hearing Difficulty
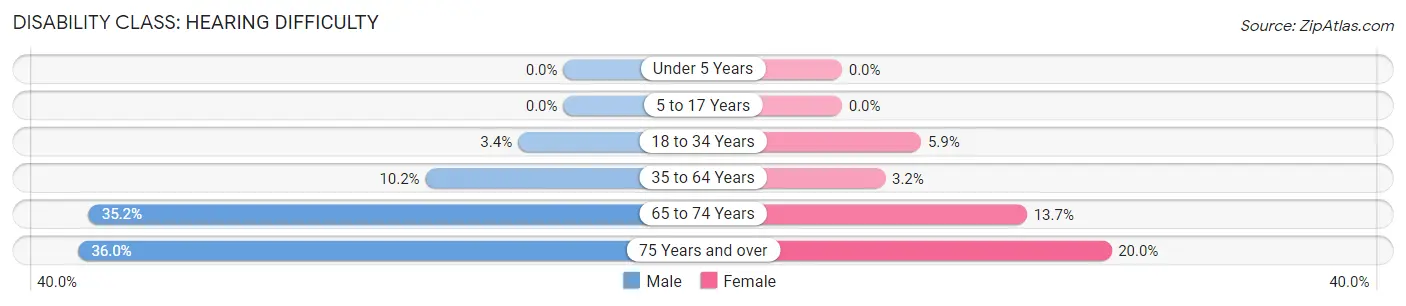
| Age Bracket | Male | Female |
| Under 5 Years | 0 (0.0%) | 0 (0.0%) |
| 5 to 17 Years | 0 (0.0%) | 0 (0.0%) |
| 18 to 34 Years | 6 (3.4%) | 10 (5.9%) |
| 35 to 64 Years | 43 (10.2%) | 12 (3.2%) |
| 65 to 74 Years | 31 (35.2%) | 7 (13.7%) |
| 75 Years and over | 9 (36.0%) | 8 (20.0%) |
Disability Class: Vision Difficulty
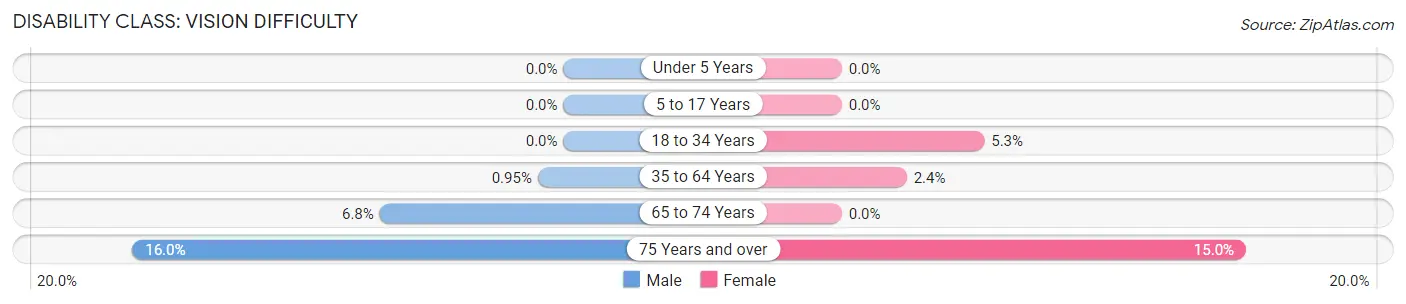
| Age Bracket | Male | Female |
| Under 5 Years | 0 (0.0%) | 0 (0.0%) |
| 5 to 17 Years | 0 (0.0%) | 0 (0.0%) |
| 18 to 34 Years | 0 (0.0%) | 9 (5.3%) |
| 35 to 64 Years | 4 (0.9%) | 9 (2.4%) |
| 65 to 74 Years | 6 (6.8%) | 0 (0.0%) |
| 75 Years and over | 4 (16.0%) | 6 (15.0%) |
Disability Class: Cognitive Difficulty
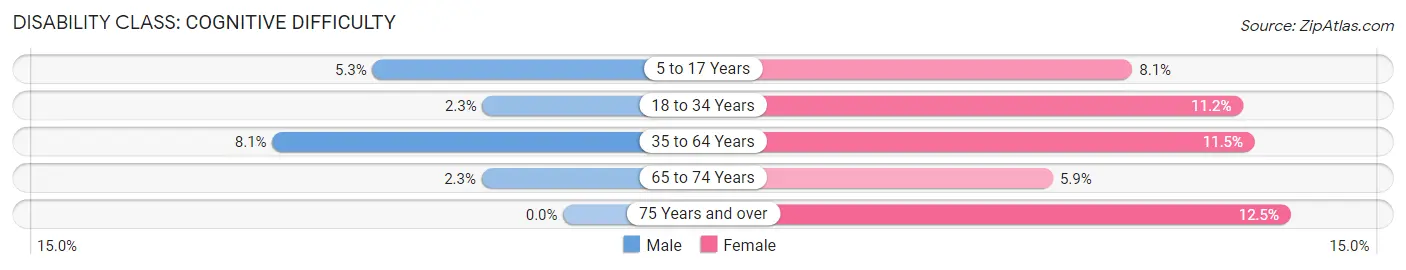
| Age Bracket | Male | Female |
| 5 to 17 Years | 19 (5.3%) | 11 (8.1%) |
| 18 to 34 Years | 4 (2.2%) | 19 (11.2%) |
| 35 to 64 Years | 34 (8.1%) | 43 (11.5%) |
| 65 to 74 Years | 2 (2.3%) | 3 (5.9%) |
| 75 Years and over | 0 (0.0%) | 5 (12.5%) |
Disability Class: Ambulatory Difficulty
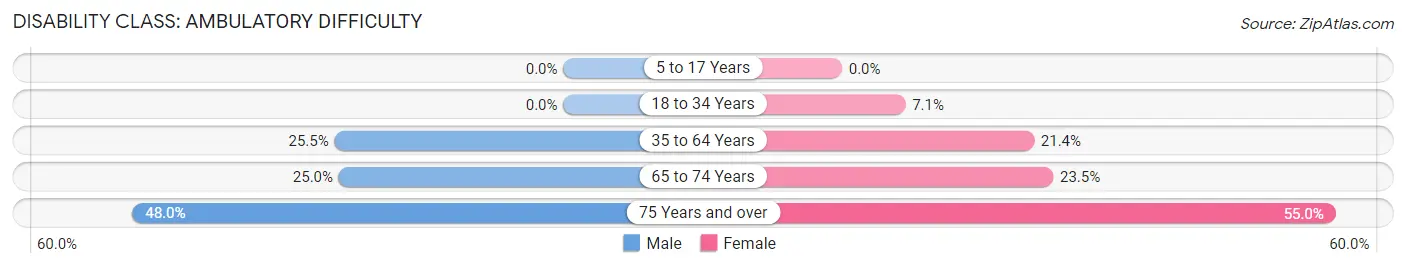
| Age Bracket | Male | Female |
| 5 to 17 Years | 0 (0.0%) | 0 (0.0%) |
| 18 to 34 Years | 0 (0.0%) | 12 (7.1%) |
| 35 to 64 Years | 107 (25.5%) | 80 (21.4%) |
| 65 to 74 Years | 22 (25.0%) | 12 (23.5%) |
| 75 Years and over | 12 (48.0%) | 22 (55.0%) |
Disability Class: Self-Care Difficulty
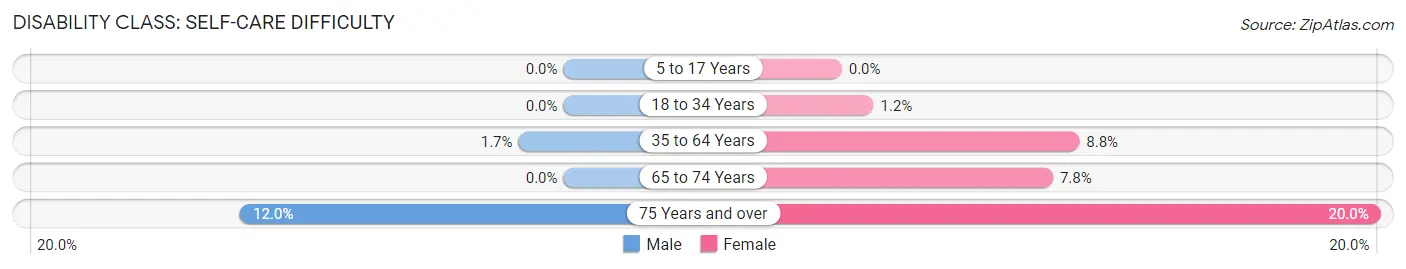
| Age Bracket | Male | Female |
| 5 to 17 Years | 0 (0.0%) | 0 (0.0%) |
| 18 to 34 Years | 0 (0.0%) | 2 (1.2%) |
| 35 to 64 Years | 7 (1.7%) | 33 (8.8%) |
| 65 to 74 Years | 0 (0.0%) | 4 (7.8%) |
| 75 Years and over | 3 (12.0%) | 8 (20.0%) |
Technology Access in Carterville
Computing Device Access in Carterville
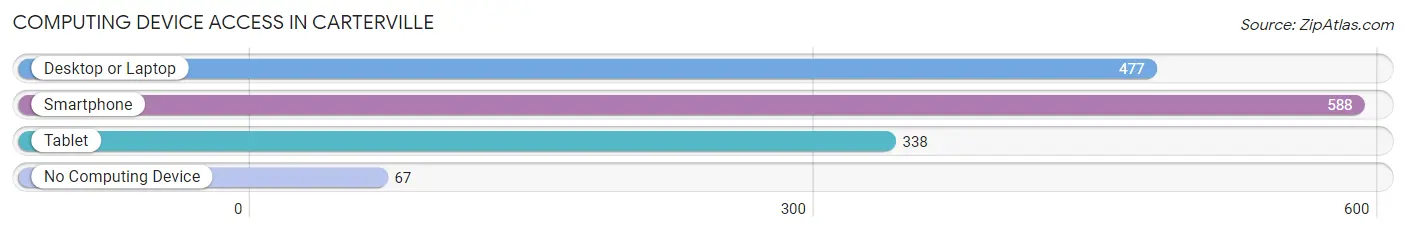
| Device Type | # Households | % Households |
| Desktop or Laptop | 477 | 69.0% |
| Smartphone | 588 | 85.1% |
| Tablet | 338 | 48.9% |
| No Computing Device | 67 | 9.7% |
| Total | 691 | 100.0% |
Internet Access in Carterville
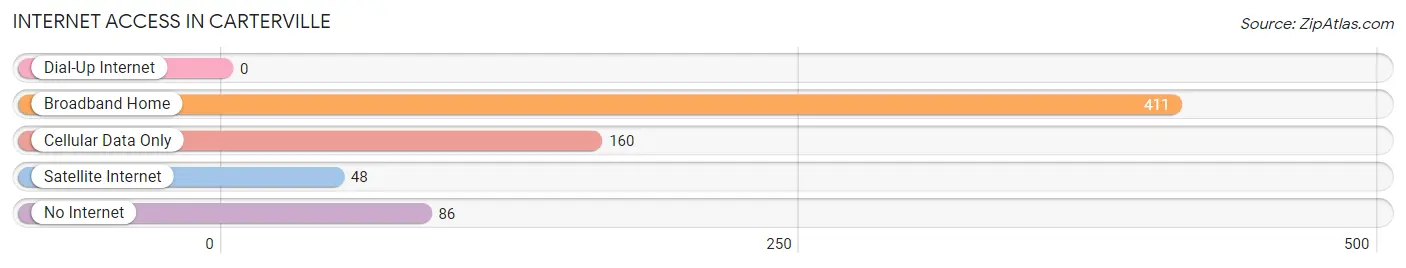
| Internet Type | # Households | % Households |
| Dial-Up Internet | 0 | 0.0% |
| Broadband Home | 411 | 59.5% |
| Cellular Data Only | 160 | 23.2% |
| Satellite Internet | 48 | 7.0% |
| No Internet | 86 | 12.4% |
| Total | 691 | 100.0% |
Carterville Summary
Carthage, Missouri is a small town located in Jasper County, Missouri. It is situated in the southwestern corner of the state, about 30 miles south of Joplin. The town was founded in 1854 and was named after the ancient city of Carthage in Tunisia. The population of the town was 2,945 at the 2010 census.
Carthage is located in the Ozark Plateau, a region of rolling hills and valleys. The town is situated on the banks of the Spring River, which flows through the town and is a popular destination for fishing and canoeing. The town is also located near the Mark Twain National Forest, which provides a variety of outdoor activities such as camping, hiking, and horseback riding.
The economy of Carthage is largely based on agriculture and manufacturing. The town is home to several large agricultural operations, including a large hog farm and a large dairy farm. The town is also home to several manufacturing companies, including a large furniture manufacturer and a large plastics manufacturer.
The demographics of Carthage are largely white, with a small African American population. The median household income in the town is $37,000, and the median home value is $90,000. The town has a low unemployment rate of 4.2%, and the poverty rate is 11.3%.
Carthage is served by the Carthage R-9 School District, which includes two elementary schools, one middle school, and one high school. The town is also home to several churches, including the First Baptist Church, the First United Methodist Church, and the Church of Jesus Christ of Latter-day Saints.
Carthage is a small town with a rich history and a strong sense of community. The town is home to a variety of businesses and industries, and the town's residents are proud of their town and its history. The town is a great place to live, work, and raise a family.
Common Questions
What is Per Capita Income in Carterville?
Per Capita income in Carterville is $18,402.
What is the Median Family Income in Carterville?
Median Family Income in Carterville is $56,008.
What is the Median Household income in Carterville?
Median Household Income in Carterville is $45,708.
What is Income or Wage Gap in Carterville?
Income or Wage Gap in Carterville is 29.7%.
Women in Carterville earn 70.3 cents for every dollar earned by a man.
What is Inequality or Gini Index in Carterville?
Inequality or Gini Index in Carterville is 0.33.
What is the Total Population of Carterville?
Total Population of Carterville is 1,951.
What is the Total Male Population of Carterville?
Total Male Population of Carterville is 1,122.
What is the Total Female Population of Carterville?
Total Female Population of Carterville is 829.
What is the Ratio of Males per 100 Females in Carterville?
There are 135.34 Males per 100 Females in Carterville.
What is the Ratio of Females per 100 Males in Carterville?
There are 73.89 Females per 100 Males in Carterville.
What is the Median Population Age in Carterville?
Median Population Age in Carterville is 36.1 Years.
What is the Average Family Size in Carterville
Average Family Size in Carterville is 3.3 People.
What is the Average Household Size in Carterville
Average Household Size in Carterville is 2.8 People.
How Large is the Labor Force in Carterville?
There are 848 People in the Labor Forcein in Carterville.
What is the Percentage of People in the Labor Force in Carterville?
59.0% of People are in the Labor Force in Carterville.
What is the Unemployment Rate in Carterville?
Unemployment Rate in Carterville is 8.6%.