Zip Codes with the Most Immigrants from Philippines in Cape Girardeau, MO
RELATED REPORTS & OPTIONS
Philippines
Cape Girardeau
Compare Zip Codes
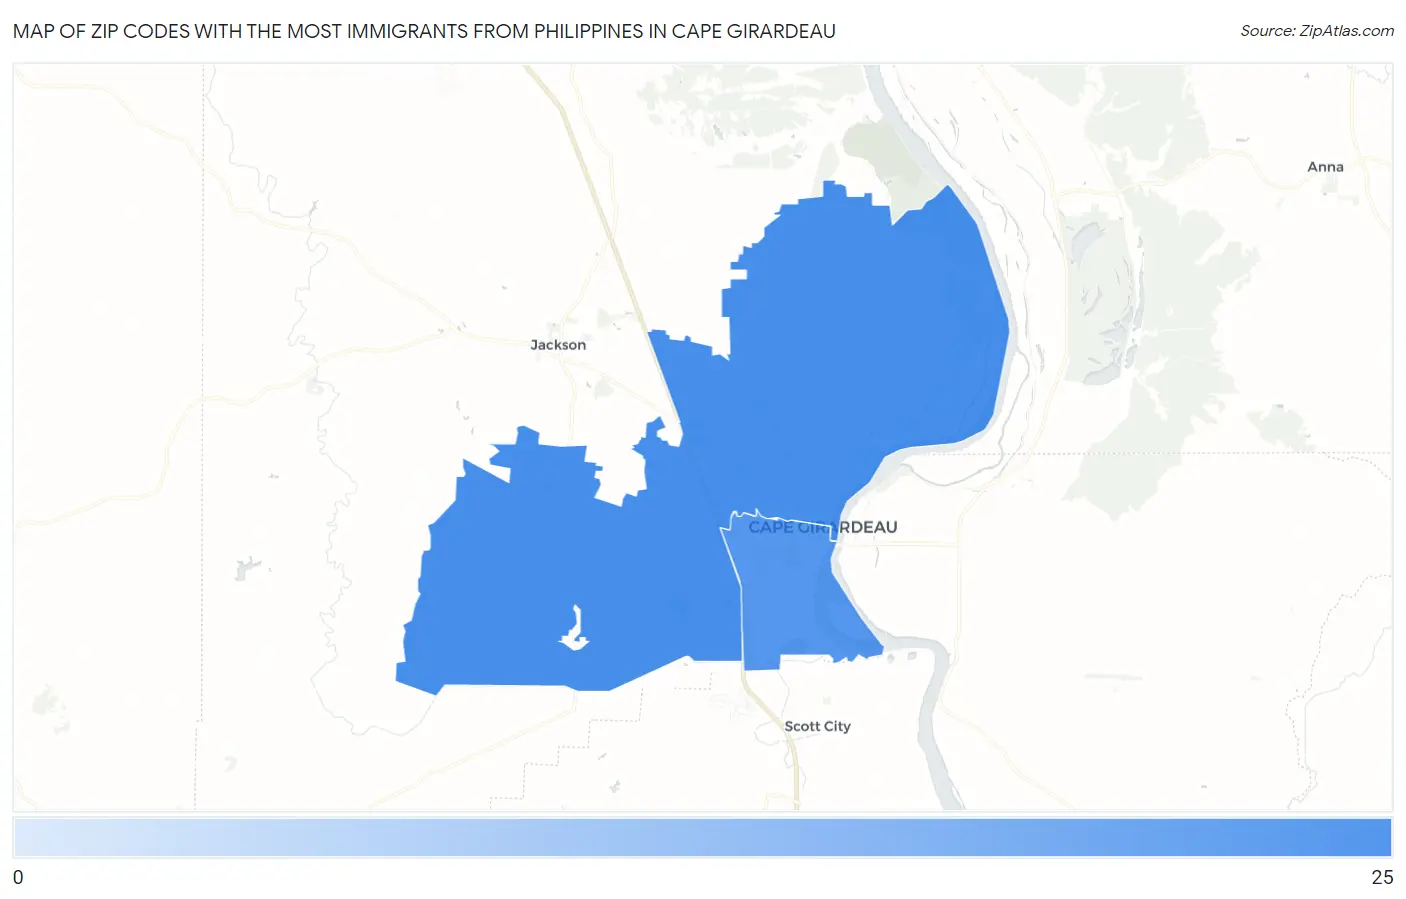
Map of Zip Codes with the Most Immigrants from Philippines in Cape Girardeau
18
24
Zip Codes with the Most Immigrants from Philippines in Cape Girardeau, MO
| Zip Code | Philippines | vs State | vs National | |
| 1. | 63701 | 24 | 10,873(0.22%)#127 | 1,985,710(0.00%)#7,162 |
| 2. | 63703 | 18 | 10,873(0.17%)#147 | 1,985,710(0.00%)#7,935 |
1
Common Questions
What are the Top Zip Codes with the Most Immigrants from Philippines in Cape Girardeau, MO?
Top Zip Codes with the Most Immigrants from Philippines in Cape Girardeau, MO are:
What zip code has the Most Immigrants from Philippines in Cape Girardeau, MO?
63701 has the Most Immigrants from Philippines in Cape Girardeau, MO with 24.
What is the Total Immigrants from Philippines in Cape Girardeau, MO?
Total Immigrants from Philippines in Cape Girardeau is 18.
What is the Total Immigrants from Philippines in Missouri?
Total Immigrants from Philippines in Missouri is 10,873.
What is the Total Immigrants from Philippines in the United States?
Total Immigrants from Philippines in the United States is 1,985,710.