Barnhart, MO Map & Demographics
Barnhart Map
Barnhart Overview
$43,220
PER CAPITA INCOME
$91,932
AVG FAMILY INCOME
$91,864
AVG HOUSEHOLD INCOME
28.0%
WAGE / INCOME GAP [ % ]
72.0¢/ $1
WAGE / INCOME GAP [ $ ]
0.35
INEQUALITY / GINI INDEX
6,040
TOTAL POPULATION
3,118
MALE POPULATION
2,922
FEMALE POPULATION
106.71
MALES / 100 FEMALES
93.71
FEMALES / 100 MALES
33.7
MEDIAN AGE
2.8
AVG FAMILY SIZE
2.6
AVG HOUSEHOLD SIZE
3,416
LABOR FORCE [ PEOPLE ]
70.8%
PERCENT IN LABOR FORCE
1.8%
UNEMPLOYMENT RATE
Barnhart Zip Codes
Barnhart Area Codes
Income in Barnhart
Income Overview in Barnhart
Per Capita Income in Barnhart is $43,220, while median incomes of families and households are $91,932 and $91,864 respectively.
| Characteristic | Number | Measure |
| Per Capita Income | 6,040 | $43,220 |
| Median Family Income | 1,795 | $91,932 |
| Mean Family Income | 1,795 | $108,739 |
| Median Household Income | 2,256 | $91,864 |
| Mean Household Income | 2,256 | $107,605 |
| Income Deficit | 1,795 | $0 |
| Wage / Income Gap (%) | 6,040 | 28.00% |
| Wage / Income Gap ($) | 6,040 | 72.00¢ per $1 |
| Gini / Inequality Index | 6,040 | 0.35 |
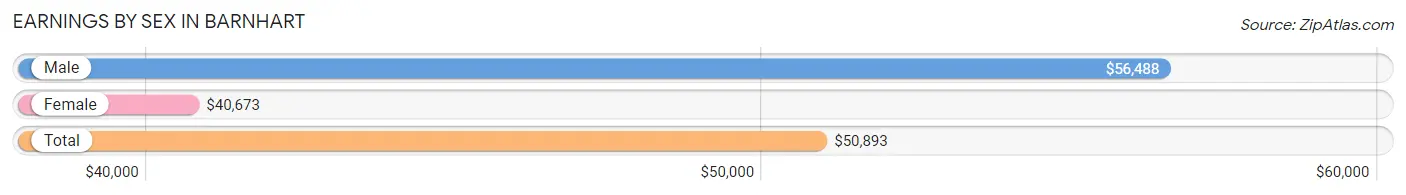
Earnings by Sex in Barnhart
Average Earnings in Barnhart are $50,893, $56,488 for men and $40,673 for women, a difference of 28.0%.
| Sex | Number | Average Earnings |
| Male | 1,943 (52.9%) | $56,488 |
| Female | 1,729 (47.1%) | $40,673 |
| Total | 3,672 (100.0%) | $50,893 |
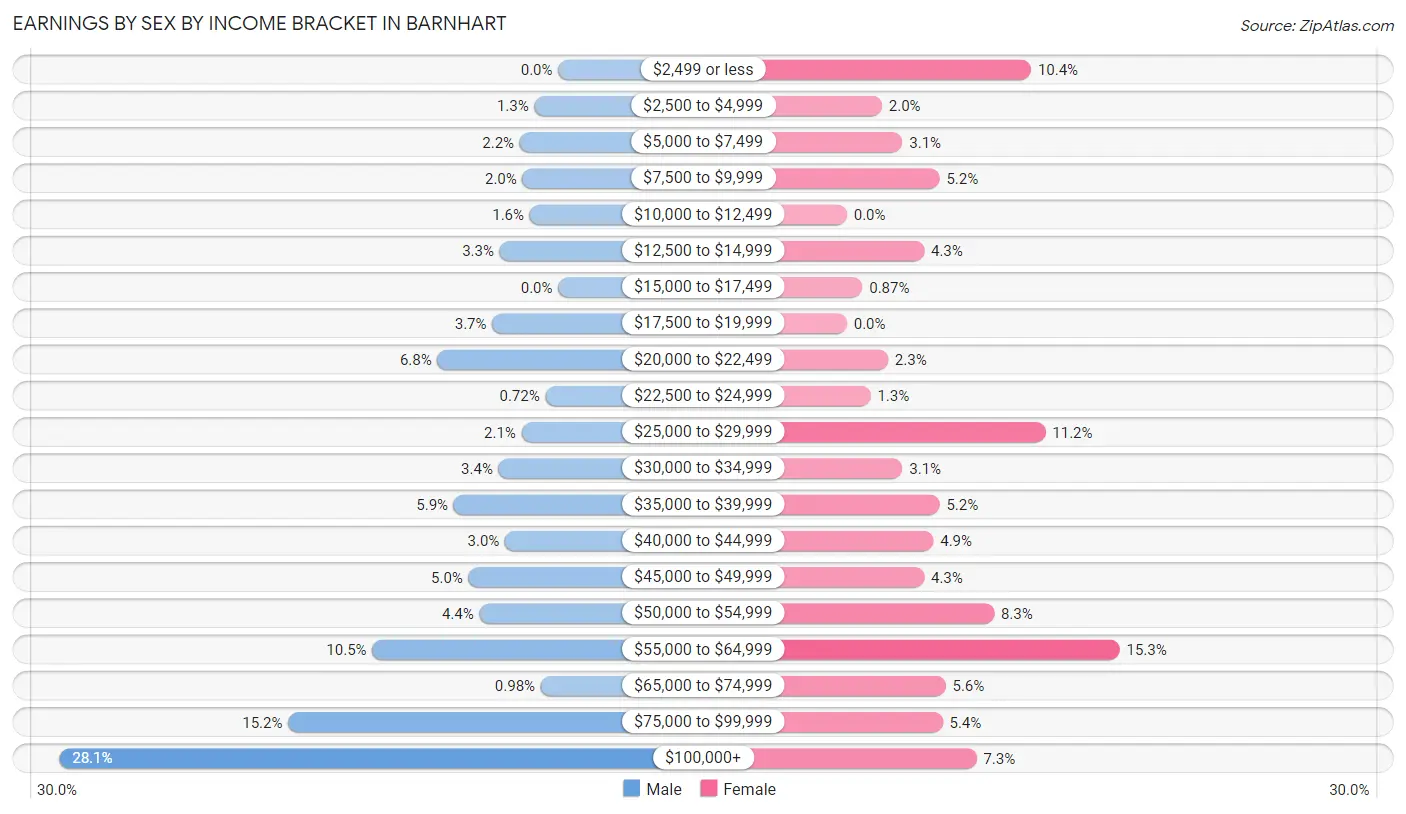
Earnings by Sex by Income Bracket in Barnhart
The most common earnings brackets in Barnhart are $100,000+ for men (545 | 28.1%) and $55,000 to $64,999 for women (265 | 15.3%).
| Income | Male | Female |
| $2,499 or less | 0 (0.0%) | 179 (10.3%) |
| $2,500 to $4,999 | 26 (1.3%) | 34 (2.0%) |
| $5,000 to $7,499 | 42 (2.2%) | 54 (3.1%) |
| $7,500 to $9,999 | 39 (2.0%) | 90 (5.2%) |
| $10,000 to $12,499 | 31 (1.6%) | 0 (0.0%) |
| $12,500 to $14,999 | 64 (3.3%) | 75 (4.3%) |
| $15,000 to $17,499 | 0 (0.0%) | 15 (0.9%) |
| $17,500 to $19,999 | 72 (3.7%) | 0 (0.0%) |
| $20,000 to $22,499 | 132 (6.8%) | 40 (2.3%) |
| $22,500 to $24,999 | 14 (0.7%) | 23 (1.3%) |
| $25,000 to $29,999 | 40 (2.1%) | 193 (11.2%) |
| $30,000 to $34,999 | 65 (3.4%) | 54 (3.1%) |
| $35,000 to $39,999 | 114 (5.9%) | 90 (5.2%) |
| $40,000 to $44,999 | 58 (3.0%) | 84 (4.9%) |
| $45,000 to $49,999 | 98 (5.0%) | 75 (4.3%) |
| $50,000 to $54,999 | 86 (4.4%) | 143 (8.3%) |
| $55,000 to $64,999 | 203 (10.4%) | 265 (15.3%) |
| $65,000 to $74,999 | 19 (1.0%) | 96 (5.6%) |
| $75,000 to $99,999 | 295 (15.2%) | 93 (5.4%) |
| $100,000+ | 545 (28.1%) | 126 (7.3%) |
| Total | 1,943 (100.0%) | 1,729 (100.0%) |
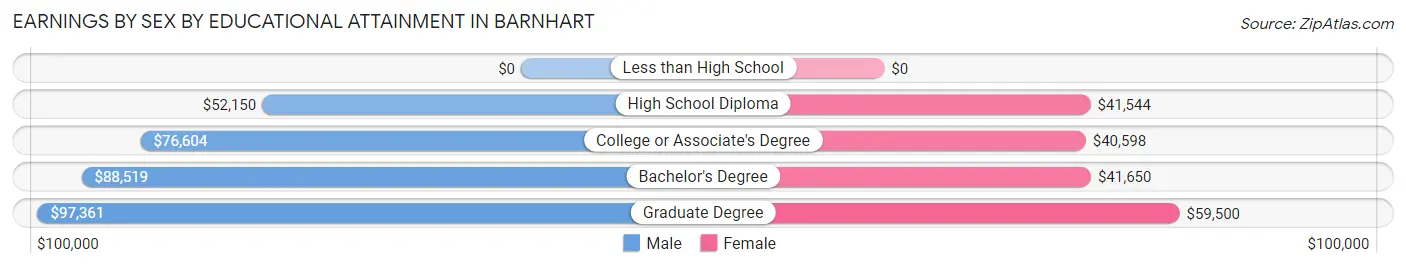
Earnings by Sex by Educational Attainment in Barnhart
Average earnings in Barnhart are $60,368 for men and $45,023 for women, a difference of 25.4%. Men with an educational attainment of graduate degree enjoy the highest average annual earnings of $97,361, while those with high school diploma education earn the least with $52,150. Women with an educational attainment of graduate degree earn the most with the average annual earnings of $59,500, while those with college or associate's degree education have the smallest earnings of $40,598.
| Educational Attainment | Male Income | Female Income |
| Less than High School | - | - |
| High School Diploma | $52,150 | $41,544 |
| College or Associate's Degree | $76,604 | $40,598 |
| Bachelor's Degree | $88,519 | $41,650 |
| Graduate Degree | $97,361 | $59,500 |
| Total | $60,368 | $45,023 |
Family Income in Barnhart
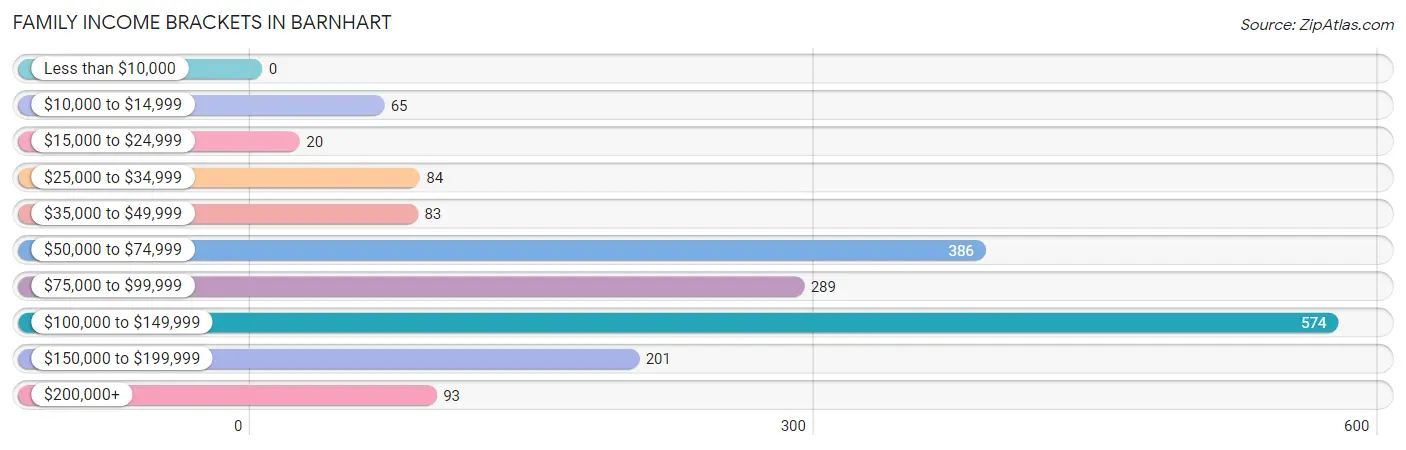
Family Income Brackets in Barnhart
According to the Barnhart family income data, there are 574 families falling into the $100,000 to $149,999 income range, which is the most common income bracket and makes up 32.0% of all families.
| Income Bracket | # Families | % Families |
| Less than $10,000 | 0 | 0.0% |
| $10,000 to $14,999 | 65 | 3.6% |
| $15,000 to $24,999 | 20 | 1.1% |
| $25,000 to $34,999 | 84 | 4.7% |
| $35,000 to $49,999 | 83 | 4.6% |
| $50,000 to $74,999 | 386 | 21.5% |
| $75,000 to $99,999 | 289 | 16.1% |
| $100,000 to $149,999 | 574 | 32.0% |
| $150,000 to $199,999 | 201 | 11.2% |
| $200,000+ | 93 | 5.2% |
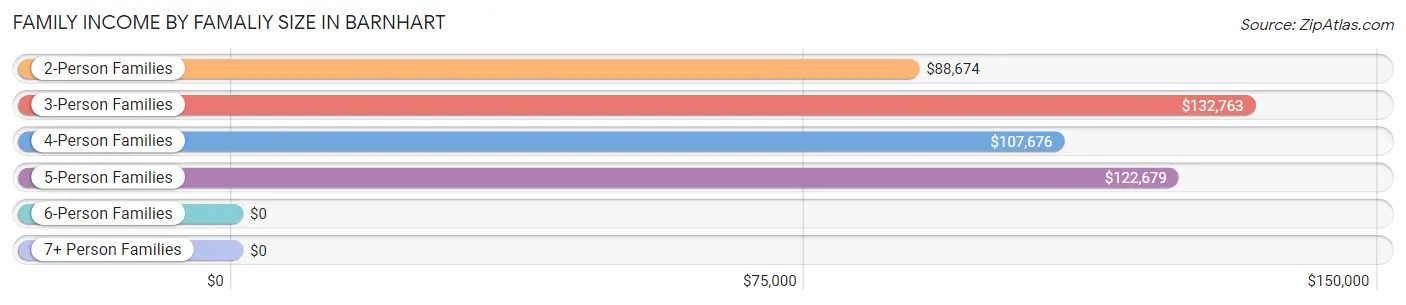
Family Income by Famaliy Size in Barnhart
3-person families (354 | 19.7%) account for the highest median family income in Barnhart with $132,763 per family, while 2-person families (975 | 54.3%) have the highest median income of $44,337 per family member.
| Income Bracket | # Families | Median Income |
| 2-Person Families | 975 (54.3%) | $88,674 |
| 3-Person Families | 354 (19.7%) | $132,763 |
| 4-Person Families | 308 (17.2%) | $107,676 |
| 5-Person Families | 75 (4.2%) | $122,679 |
| 6-Person Families | 83 (4.6%) | $0 |
| 7+ Person Families | 0 (0.0%) | $0 |
| Total | 1,795 (100.0%) | $91,932 |
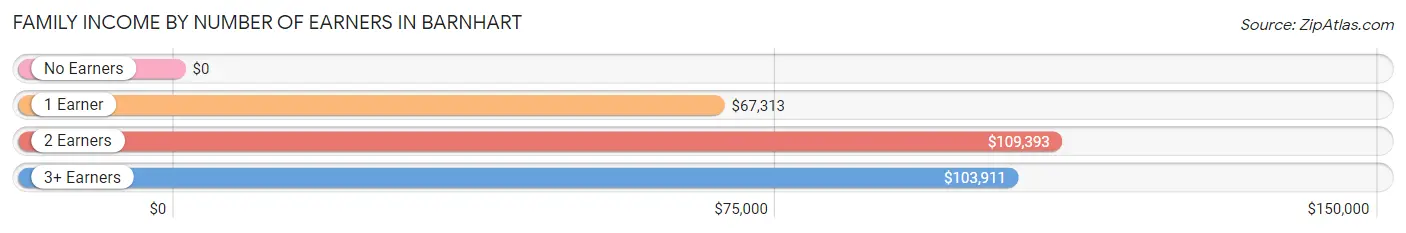
Family Income by Number of Earners in Barnhart
| Number of Earners | # Families | Median Income |
| No Earners | 151 (8.4%) | $0 |
| 1 Earner | 683 (38.1%) | $67,313 |
| 2 Earners | 786 (43.8%) | $109,393 |
| 3+ Earners | 175 (9.8%) | $103,911 |
| Total | 1,795 (100.0%) | $91,932 |
Household Income in Barnhart
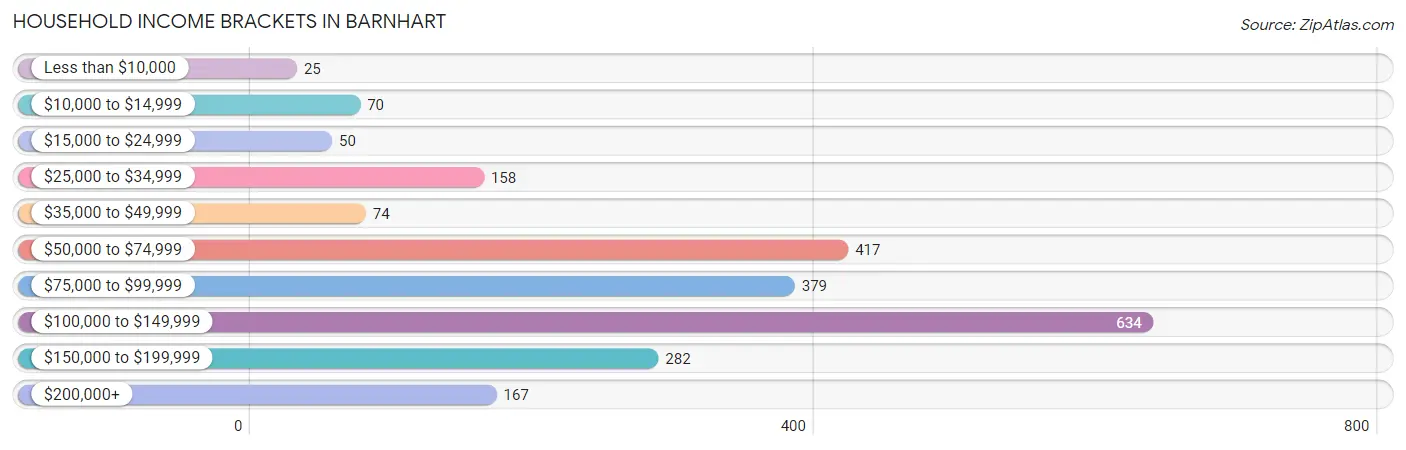
Household Income Brackets in Barnhart
With 634 households falling in the category, the $100,000 to $149,999 income range is the most frequent in Barnhart, accounting for 28.1% of all households. In contrast, only 25 households (1.1%) fall into the less than $10,000 income bracket, making it the least populous group.
| Income Bracket | # Households | % Households |
| Less than $10,000 | 25 | 1.1% |
| $10,000 to $14,999 | 70 | 3.1% |
| $15,000 to $24,999 | 50 | 2.2% |
| $25,000 to $34,999 | 158 | 7.0% |
| $35,000 to $49,999 | 74 | 3.3% |
| $50,000 to $74,999 | 417 | 18.5% |
| $75,000 to $99,999 | 379 | 16.8% |
| $100,000 to $149,999 | 634 | 28.1% |
| $150,000 to $199,999 | 282 | 12.5% |
| $200,000+ | 167 | 7.4% |
Household Income by Householder Age in Barnhart
The median household income in Barnhart is $91,864, with the highest median household income of $107,578 found in the 25 to 44 years age bracket for the primary householder. A total of 952 households (42.2%) fall into this category. Meanwhile, the 15 to 24 years age bracket for the primary householder has the lowest median household income of $0, with 159 households (7.0%) in this group.
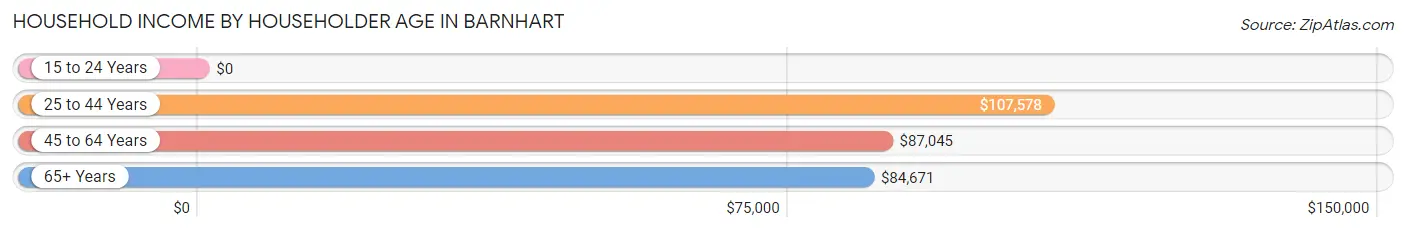
| Income Bracket | # Households | Median Income |
| 15 to 24 Years | 159 (7.0%) | $0 |
| 25 to 44 Years | 952 (42.2%) | $107,578 |
| 45 to 64 Years | 782 (34.7%) | $87,045 |
| 65+ Years | 363 (16.1%) | $84,671 |
| Total | 2,256 (100.0%) | $91,864 |
Poverty in Barnhart
Income Below Poverty by Sex and Age in Barnhart
With 5.8% poverty level for males and 4.4% for females among the residents of Barnhart, 45 to 54 year old males and 16 and 17 year old females are the most vulnerable to poverty, with 76 males (17.1%) and 60 females (42.0%) in their respective age groups living below the poverty level.
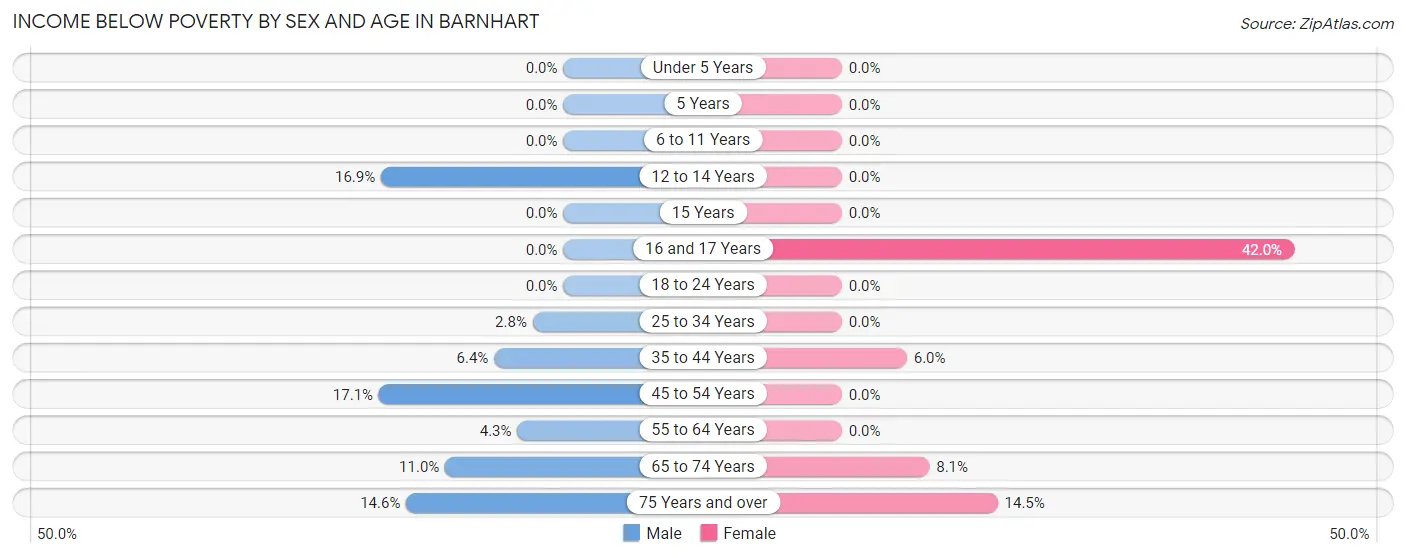
| Age Bracket | Male | Female |
| Under 5 Years | 0 (0.0%) | 0 (0.0%) |
| 5 Years | 0 (0.0%) | 0 (0.0%) |
| 6 to 11 Years | 0 (0.0%) | 0 (0.0%) |
| 12 to 14 Years | 22 (16.9%) | 0 (0.0%) |
| 15 Years | 0 (0.0%) | 0 (0.0%) |
| 16 and 17 Years | 0 (0.0%) | 60 (42.0%) |
| 18 to 24 Years | 0 (0.0%) | 0 (0.0%) |
| 25 to 34 Years | 14 (2.8%) | 0 (0.0%) |
| 35 to 44 Years | 31 (6.4%) | 26 (6.0%) |
| 45 to 54 Years | 76 (17.1%) | 0 (0.0%) |
| 55 to 64 Years | 14 (4.3%) | 0 (0.0%) |
| 65 to 74 Years | 17 (11.0%) | 19 (8.1%) |
| 75 Years and over | 7 (14.6%) | 24 (14.5%) |
| Total | 181 (5.8%) | 129 (4.4%) |
Income Above Poverty by Sex and Age in Barnhart
According to the poverty statistics in Barnhart, males aged under 5 years and females aged under 5 years are the age groups that are most secure financially, with 100.0% of males and 100.0% of females in these age groups living above the poverty line.
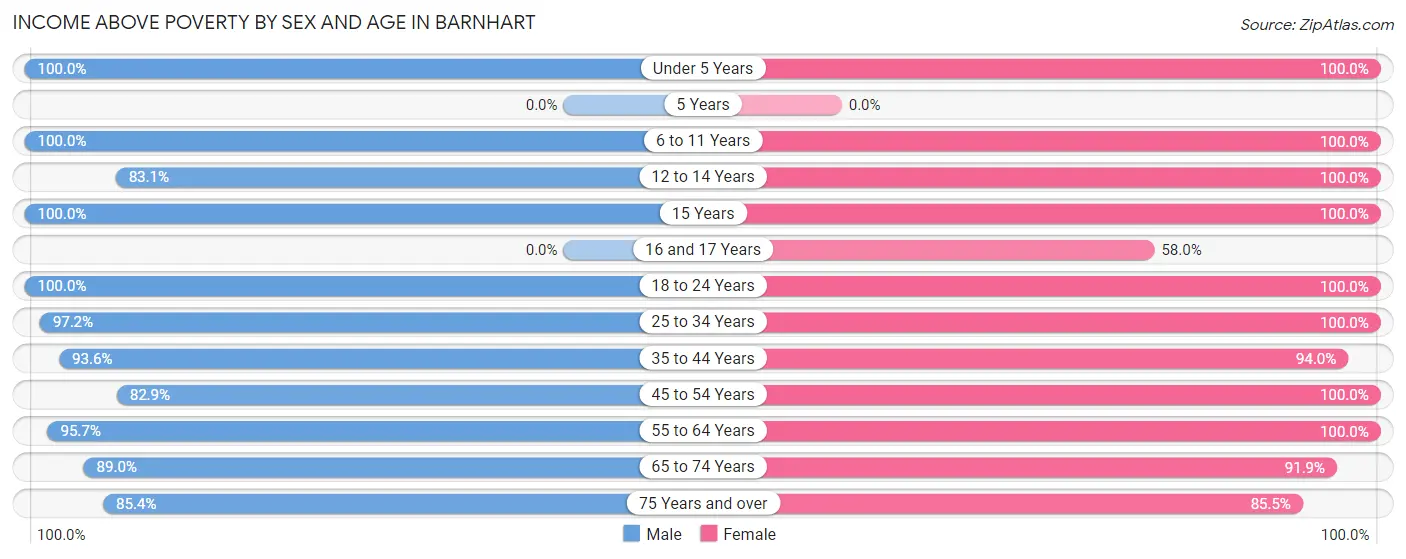
| Age Bracket | Male | Female |
| Under 5 Years | 384 (100.0%) | 146 (100.0%) |
| 5 Years | 0 (0.0%) | 0 (0.0%) |
| 6 to 11 Years | 265 (100.0%) | 61 (100.0%) |
| 12 to 14 Years | 108 (83.1%) | 96 (100.0%) |
| 15 Years | 41 (100.0%) | 92 (100.0%) |
| 16 and 17 Years | 0 (0.0%) | 83 (58.0%) |
| 18 to 24 Years | 347 (100.0%) | 384 (100.0%) |
| 25 to 34 Years | 479 (97.2%) | 514 (100.0%) |
| 35 to 44 Years | 452 (93.6%) | 405 (94.0%) |
| 45 to 54 Years | 368 (82.9%) | 206 (100.0%) |
| 55 to 64 Years | 314 (95.7%) | 443 (100.0%) |
| 65 to 74 Years | 138 (89.0%) | 215 (91.9%) |
| 75 Years and over | 41 (85.4%) | 142 (85.5%) |
| Total | 2,937 (94.2%) | 2,787 (95.6%) |
Income Below Poverty Among Married-Couple Families in Barnhart
The poverty statistics for married-couple families in Barnhart show that 7.2% or 83 of the total 1,158 families live below the poverty line. Families with 1 or 2 children have the highest poverty rate of 15.0%, comprising of 64 families. On the other hand, families with 3 or 4 children have the lowest poverty rate of 0.0%, which includes 0 families.
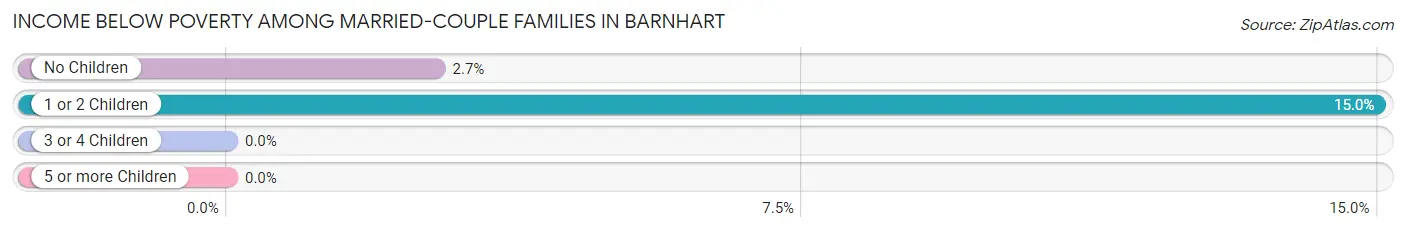
| Children | Above Poverty | Below Poverty |
| No Children | 681 (97.3%) | 19 (2.7%) |
| 1 or 2 Children | 363 (85.0%) | 64 (15.0%) |
| 3 or 4 Children | 31 (100.0%) | 0 (0.0%) |
| 5 or more Children | 0 (0.0%) | 0 (0.0%) |
| Total | 1,075 (92.8%) | 83 (7.2%) |
Income Below Poverty Among Single-Parent Households in Barnhart
| Children | Single Father | Single Mother |
| No Children | 0 (0.0%) | 0 (0.0%) |
| 1 or 2 Children | 0 (0.0%) | 0 (0.0%) |
| 3 or 4 Children | 0 (0.0%) | 0 (0.0%) |
| 5 or more Children | 0 (0.0%) | 0 (0.0%) |
| Total | 0 (0.0%) | 0 (0.0%) |
Income Below Poverty Among Married-Couple vs Single-Parent Households in Barnhart
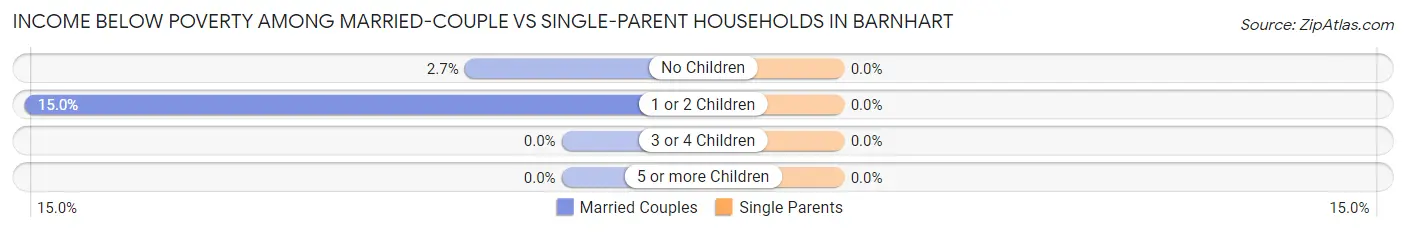
| Children | Married-Couple Families | Single-Parent Households |
| No Children | 19 (2.7%) | 0 (0.0%) |
| 1 or 2 Children | 64 (15.0%) | 0 (0.0%) |
| 3 or 4 Children | 0 (0.0%) | 0 (0.0%) |
| 5 or more Children | 0 (0.0%) | 0 (0.0%) |
| Total | 83 (7.2%) | 0 (0.0%) |
Race in Barnhart
The most populous races in Barnhart are White / Caucasian (5,530 | 91.6%), Two or more Races (477 | 7.9%), and Hispanic or Latino (62 | 1.0%).
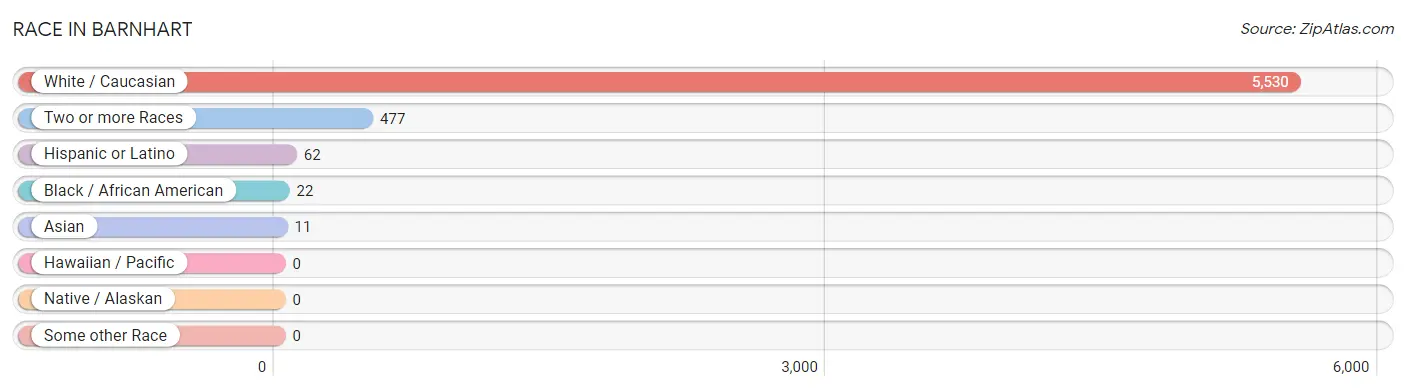
| Race | # Population | % Population |
| Asian | 11 | 0.2% |
| Black / African American | 22 | 0.4% |
| Hawaiian / Pacific | 0 | 0.0% |
| Hispanic or Latino | 62 | 1.0% |
| Native / Alaskan | 0 | 0.0% |
| White / Caucasian | 5,530 | 91.6% |
| Two or more Races | 477 | 7.9% |
| Some other Race | 0 | 0.0% |
| Total | 6,040 | 100.0% |
Ancestry in Barnhart
The most populous ancestries reported in Barnhart are German (2,406 | 39.8%), Irish (1,430 | 23.7%), Italian (415 | 6.9%), English (355 | 5.9%), and French (324 | 5.4%), together accounting for 81.6% of all Barnhart residents.
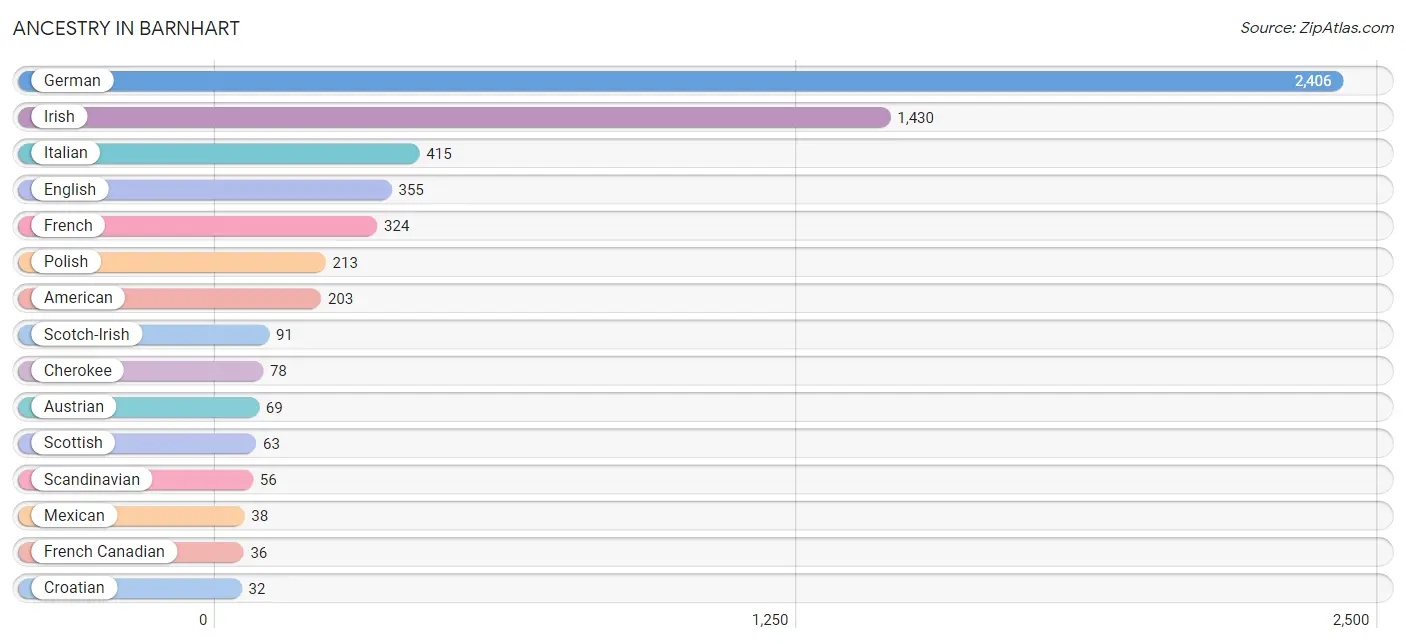
| Ancestry | # Population | % Population |
| American | 203 | 3.4% |
| Austrian | 69 | 1.1% |
| Burmese | 11 | 0.2% |
| Cherokee | 78 | 1.3% |
| Croatian | 32 | 0.5% |
| Dutch | 19 | 0.3% |
| English | 355 | 5.9% |
| Ethiopian | 22 | 0.4% |
| European | 15 | 0.3% |
| French | 324 | 5.4% |
| French Canadian | 36 | 0.6% |
| German | 2,406 | 39.8% |
| Hungarian | 15 | 0.3% |
| Irish | 1,430 | 23.7% |
| Italian | 415 | 6.9% |
| Korean | 3 | 0.1% |
| Mexican | 38 | 0.6% |
| Polish | 213 | 3.5% |
| Puerto Rican | 24 | 0.4% |
| Scandinavian | 56 | 0.9% |
| Scotch-Irish | 91 | 1.5% |
| Scottish | 63 | 1.0% |
| Subsaharan African | 22 | 0.4% |
| Swedish | 13 | 0.2% | View All 24 Rows |
Immigrants in Barnhart
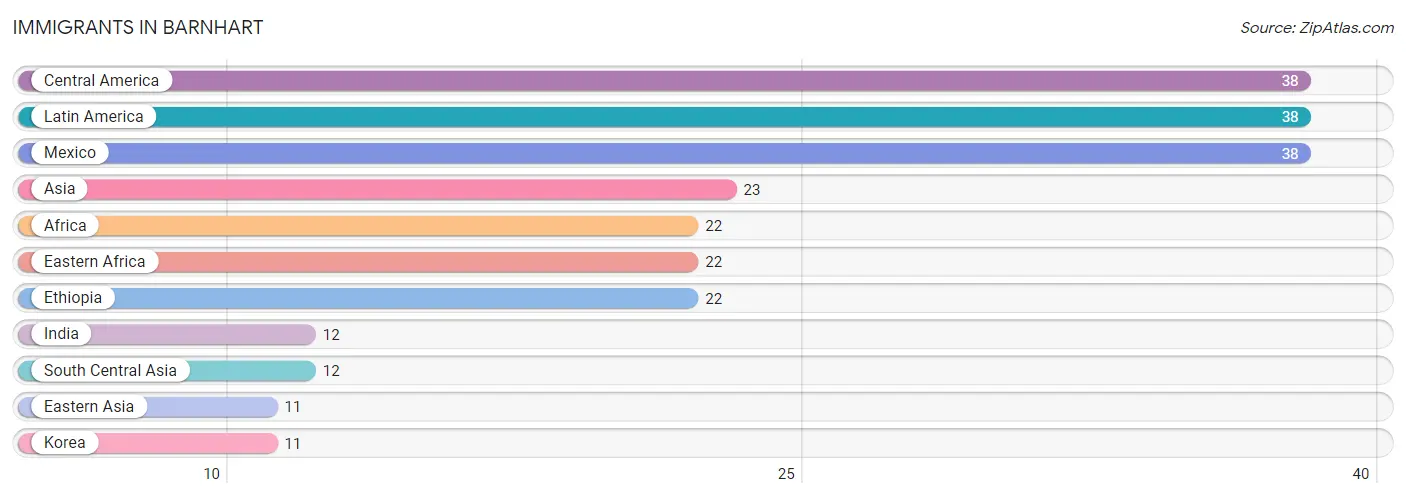
The most numerous immigrant groups reported in Barnhart came from Central America (38 | 0.6%), Latin America (38 | 0.6%), Mexico (38 | 0.6%), Asia (23 | 0.4%), and Africa (22 | 0.4%), together accounting for 2.6% of all Barnhart residents.
| Immigration Origin | # Population | % Population |
| Africa | 22 | 0.4% |
| Asia | 23 | 0.4% |
| Central America | 38 | 0.6% |
| Eastern Africa | 22 | 0.4% |
| Eastern Asia | 11 | 0.2% |
| Ethiopia | 22 | 0.4% |
| India | 12 | 0.2% |
| Korea | 11 | 0.2% |
| Latin America | 38 | 0.6% |
| Mexico | 38 | 0.6% |
| South Central Asia | 12 | 0.2% | View All 11 Rows |
Sex and Age in Barnhart
Sex and Age in Barnhart
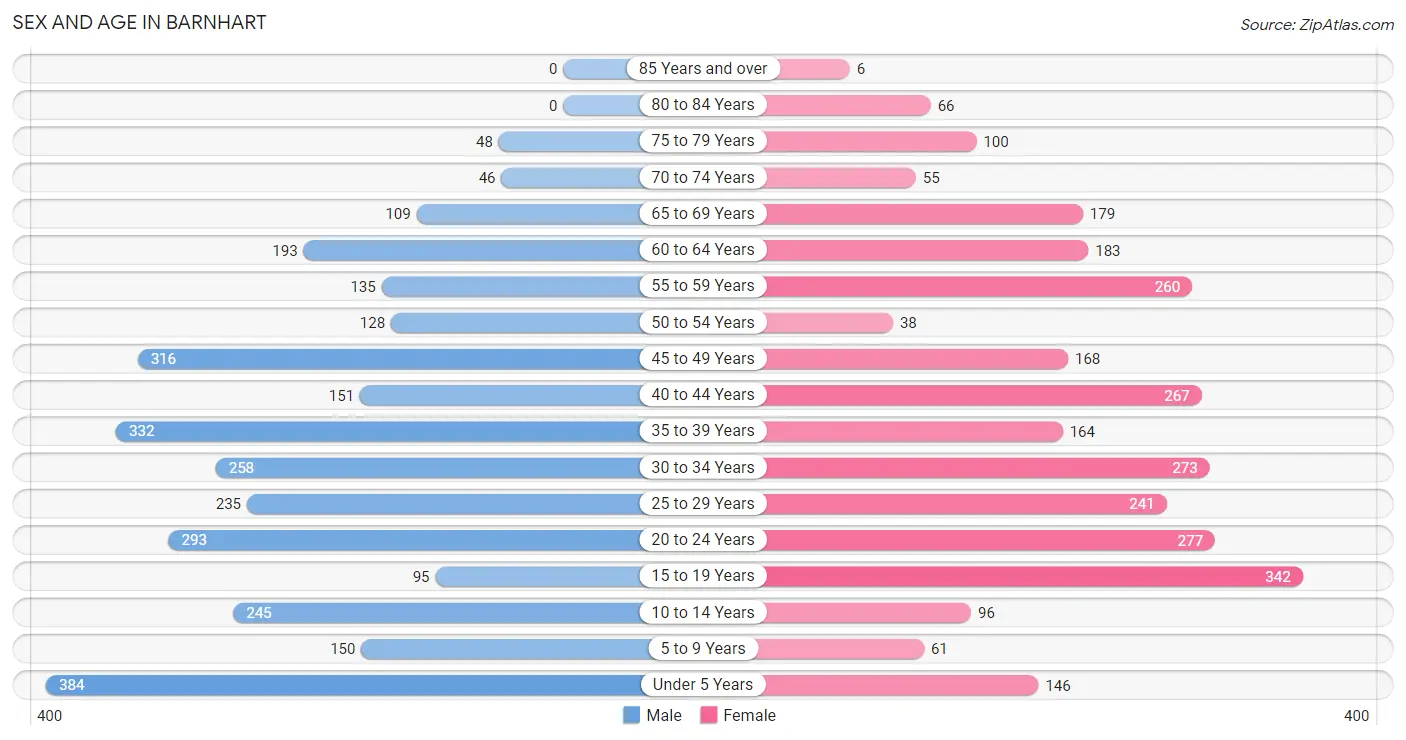
The most populous age groups in Barnhart are Under 5 Years (384 | 12.3%) for men and 15 to 19 Years (342 | 11.7%) for women.
| Age Bracket | Male | Female |
| Under 5 Years | 384 (12.3%) | 146 (5.0%) |
| 5 to 9 Years | 150 (4.8%) | 61 (2.1%) |
| 10 to 14 Years | 245 (7.9%) | 96 (3.3%) |
| 15 to 19 Years | 95 (3.0%) | 342 (11.7%) |
| 20 to 24 Years | 293 (9.4%) | 277 (9.5%) |
| 25 to 29 Years | 235 (7.5%) | 241 (8.3%) |
| 30 to 34 Years | 258 (8.3%) | 273 (9.3%) |
| 35 to 39 Years | 332 (10.6%) | 164 (5.6%) |
| 40 to 44 Years | 151 (4.8%) | 267 (9.1%) |
| 45 to 49 Years | 316 (10.1%) | 168 (5.8%) |
| 50 to 54 Years | 128 (4.1%) | 38 (1.3%) |
| 55 to 59 Years | 135 (4.3%) | 260 (8.9%) |
| 60 to 64 Years | 193 (6.2%) | 183 (6.3%) |
| 65 to 69 Years | 109 (3.5%) | 179 (6.1%) |
| 70 to 74 Years | 46 (1.5%) | 55 (1.9%) |
| 75 to 79 Years | 48 (1.5%) | 100 (3.4%) |
| 80 to 84 Years | 0 (0.0%) | 66 (2.3%) |
| 85 Years and over | 0 (0.0%) | 6 (0.2%) |
| Total | 3,118 (100.0%) | 2,922 (100.0%) |
Families and Households in Barnhart
Median Family Size in Barnhart
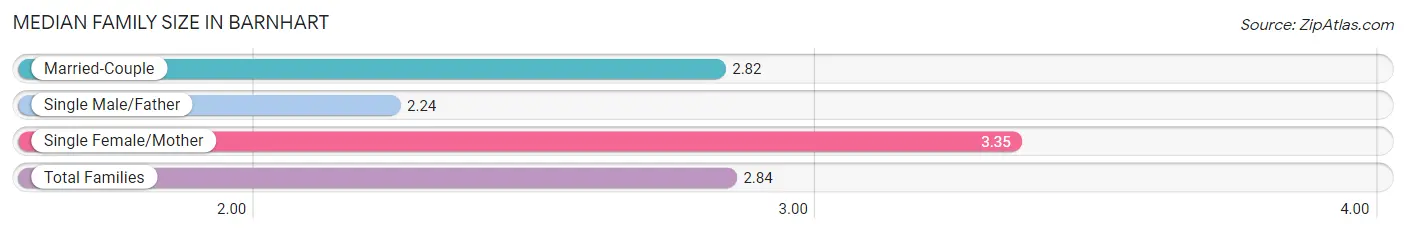
The median family size in Barnhart is 2.84 persons per family, with single female/mother families (358 | 19.9%) accounting for the largest median family size of 3.35 persons per family. On the other hand, single male/father families (279 | 15.5%) represent the smallest median family size with 2.24 persons per family.
| Family Type | # Families | Family Size |
| Married-Couple | 1,158 (64.5%) | 2.82 |
| Single Male/Father | 279 (15.5%) | 2.24 |
| Single Female/Mother | 358 (19.9%) | 3.35 |
| Total Families | 1,795 (100.0%) | 2.84 |
Median Household Size in Barnhart
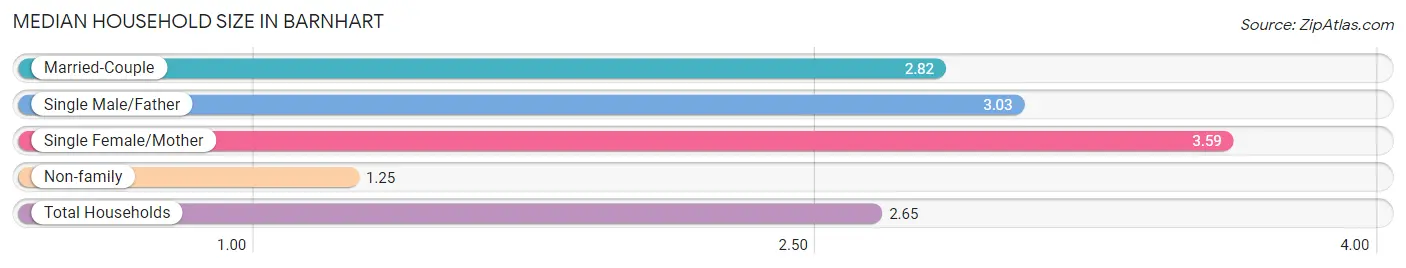
The median household size in Barnhart is 2.65 persons per household, with single female/mother households (358 | 15.9%) accounting for the largest median household size of 3.59 persons per household. non-family households (461 | 20.4%) represent the smallest median household size with 1.25 persons per household.
| Household Type | # Households | Household Size |
| Married-Couple | 1,158 (51.3%) | 2.82 |
| Single Male/Father | 279 (12.4%) | 3.03 |
| Single Female/Mother | 358 (15.9%) | 3.59 |
| Non-family | 461 (20.4%) | 1.25 |
| Total Households | 2,256 (100.0%) | 2.65 |
Household Size by Marriage Status in Barnhart
Out of a total of 2,256 households in Barnhart, 1,795 (79.6%) are family households, while 461 (20.4%) are nonfamily households. The most numerous type of family households are 2-person households, comprising 848, and the most common type of nonfamily households are 1-person households, comprising 354.
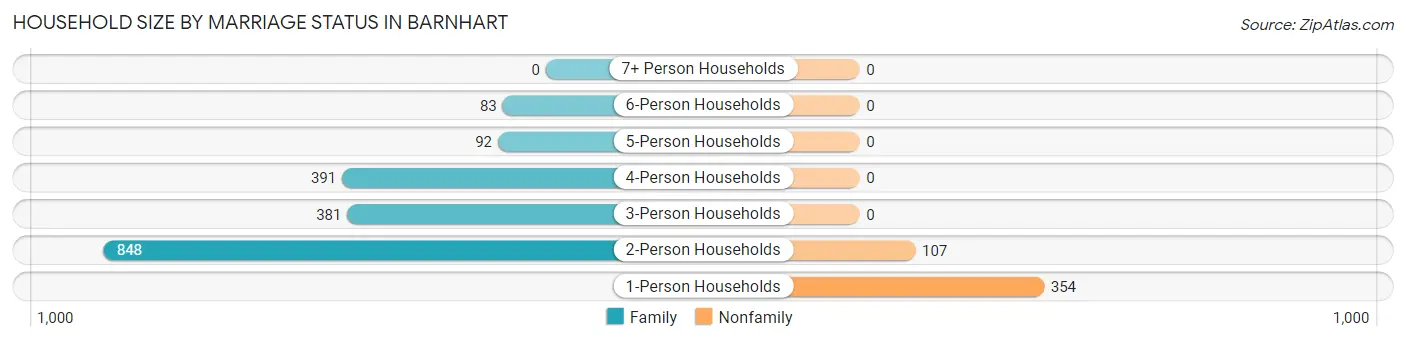
| Household Size | Family Households | Nonfamily Households |
| 1-Person Households | - | 354 (15.7%) |
| 2-Person Households | 848 (37.6%) | 107 (4.7%) |
| 3-Person Households | 381 (16.9%) | 0 (0.0%) |
| 4-Person Households | 391 (17.3%) | 0 (0.0%) |
| 5-Person Households | 92 (4.1%) | 0 (0.0%) |
| 6-Person Households | 83 (3.7%) | 0 (0.0%) |
| 7+ Person Households | 0 (0.0%) | 0 (0.0%) |
| Total | 1,795 (79.6%) | 461 (20.4%) |
Female Fertility in Barnhart
Fertility by Age in Barnhart
Average fertility rate in Barnhart is 37.0 births per 1,000 women. Women in the age bracket of 35 to 50 years have the highest fertility rate with 52.0 births per 1,000 women. Women in the age bracket of 20 to 34 years acount for 51.6% of all women with births.
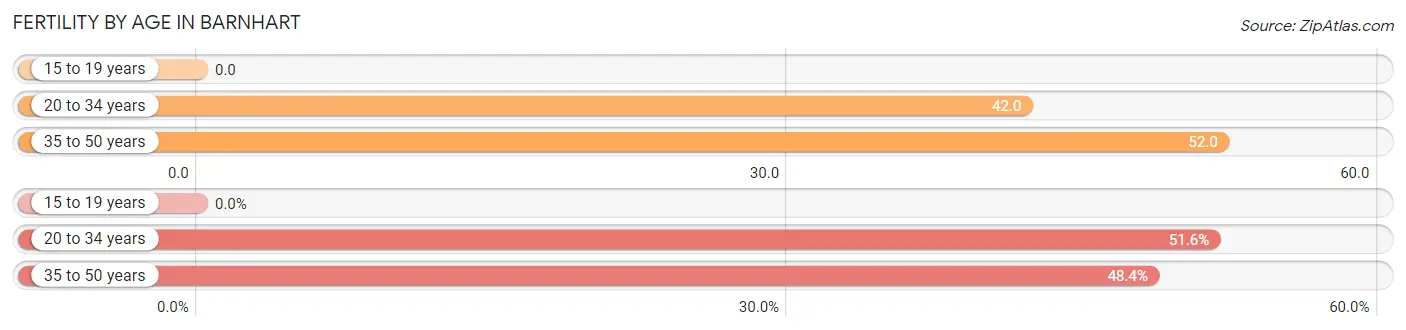
| Age Bracket | Women with Births | Births / 1,000 Women |
| 15 to 19 years | 0 (0.0%) | 0.0 |
| 20 to 34 years | 33 (51.6%) | 42.0 |
| 35 to 50 years | 31 (48.4%) | 52.0 |
| Total | 64 (100.0%) | 37.0 |
Fertility by Age by Marriage Status in Barnhart
81.2% of women with births (64) in Barnhart are married. The highest percentage of unmarried women with births falls into 35 to 50 years age bracket with 38.7% of them unmarried at the time of birth, while the lowest percentage of unmarried women with births belong to 20 to 34 years age bracket with 0.0% of them unmarried.
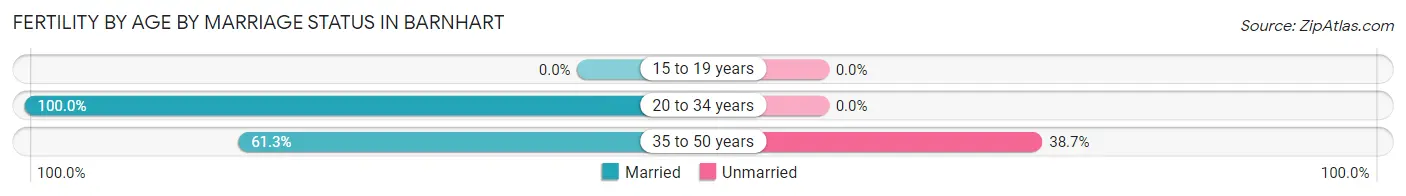
| Age Bracket | Married | Unmarried |
| 15 to 19 years | 0 (0.0%) | 0 (0.0%) |
| 20 to 34 years | 33 (100.0%) | 0 (0.0%) |
| 35 to 50 years | 19 (61.3%) | 12 (38.7%) |
| Total | 52 (81.2%) | 12 (18.8%) |
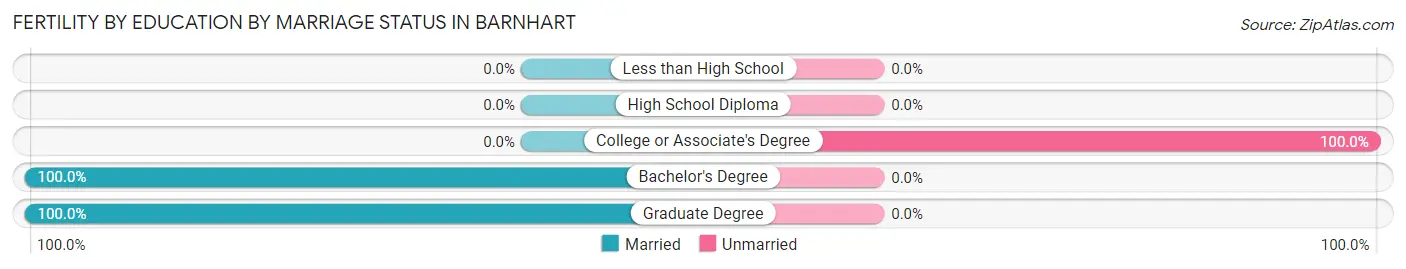
Fertility by Education in Barnhart
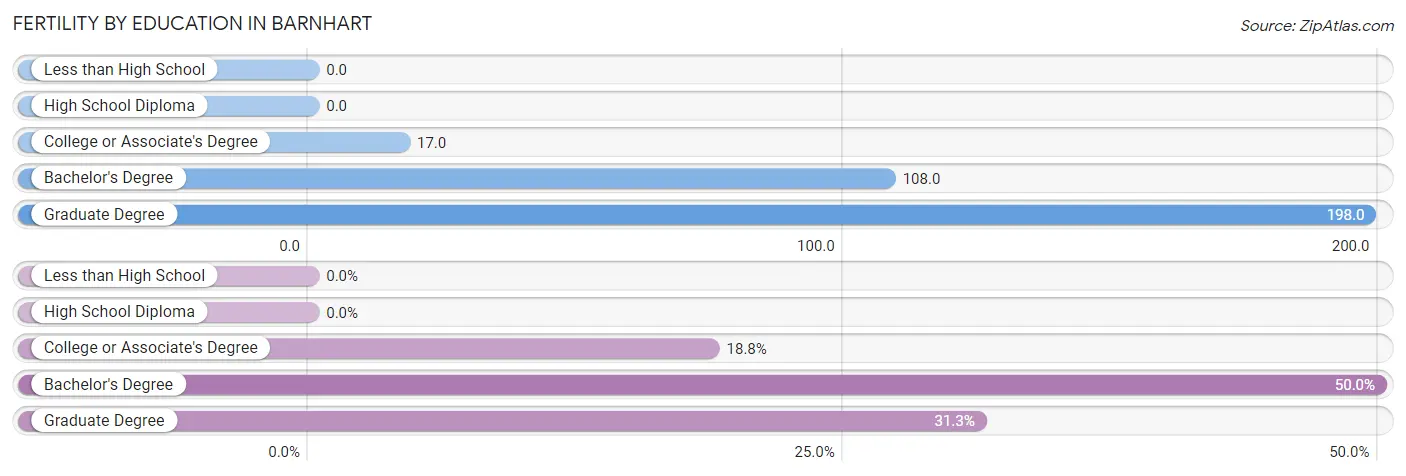
| Educational Attainment | Women with Births | Births / 1,000 Women |
| Less than High School | 0 (0.0%) | 0.0 |
| High School Diploma | 0 (0.0%) | 0.0 |
| College or Associate's Degree | 12 (18.8%) | 17.0 |
| Bachelor's Degree | 32 (50.0%) | 108.0 |
| Graduate Degree | 20 (31.2%) | 198.0 |
| Total | 64 (100.0%) | 37.0 |
Fertility by Education by Marriage Status in Barnhart
18.8% of women with births in Barnhart are unmarried. Women with the educational attainment of bachelor's degree are most likely to be married with 100.0% of them married at childbirth, while women with the educational attainment of college or associate's degree are least likely to be married with 100.0% of them unmarried at childbirth.
| Educational Attainment | Married | Unmarried |
| Less than High School | 0 (0.0%) | 0 (0.0%) |
| High School Diploma | 0 (0.0%) | 0 (0.0%) |
| College or Associate's Degree | 0 (0.0%) | 12 (100.0%) |
| Bachelor's Degree | 32 (100.0%) | 0 (0.0%) |
| Graduate Degree | 20 (100.0%) | 0 (0.0%) |
| Total | 52 (81.2%) | 12 (18.8%) |
Employment Characteristics in Barnhart
Employment by Class of Employer in Barnhart
Among the 3,312 employed individuals in Barnhart, private company employees (2,429 | 73.3%), not-for-profit organizations (452 | 13.7%), and local government employees (207 | 6.2%) make up the most common classes of employment.
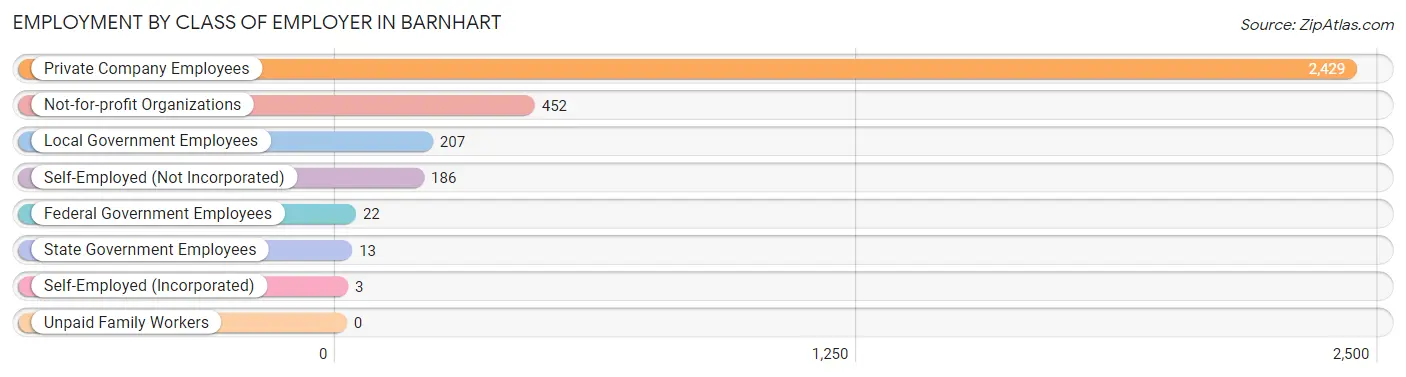
| Employer Class | # Employees | % Employees |
| Private Company Employees | 2,429 | 73.3% |
| Self-Employed (Incorporated) | 3 | 0.1% |
| Self-Employed (Not Incorporated) | 186 | 5.6% |
| Not-for-profit Organizations | 452 | 13.7% |
| Local Government Employees | 207 | 6.2% |
| State Government Employees | 13 | 0.4% |
| Federal Government Employees | 22 | 0.7% |
| Unpaid Family Workers | 0 | 0.0% |
| Total | 3,312 | 100.0% |
Employment Status by Age in Barnhart
According to the labor force statistics for Barnhart, out of the total population over 16 years of age (4,825), 70.8% or 3,416 individuals are in the labor force, with 1.8% or 61 of them unemployed. The age group with the highest labor force participation rate is 25 to 29 years, with 100.0% or 476 individuals in the labor force. Within the labor force, the 45 to 54 years age range has the highest percentage of unemployed individuals, with 7.5% or 44 of them being unemployed.
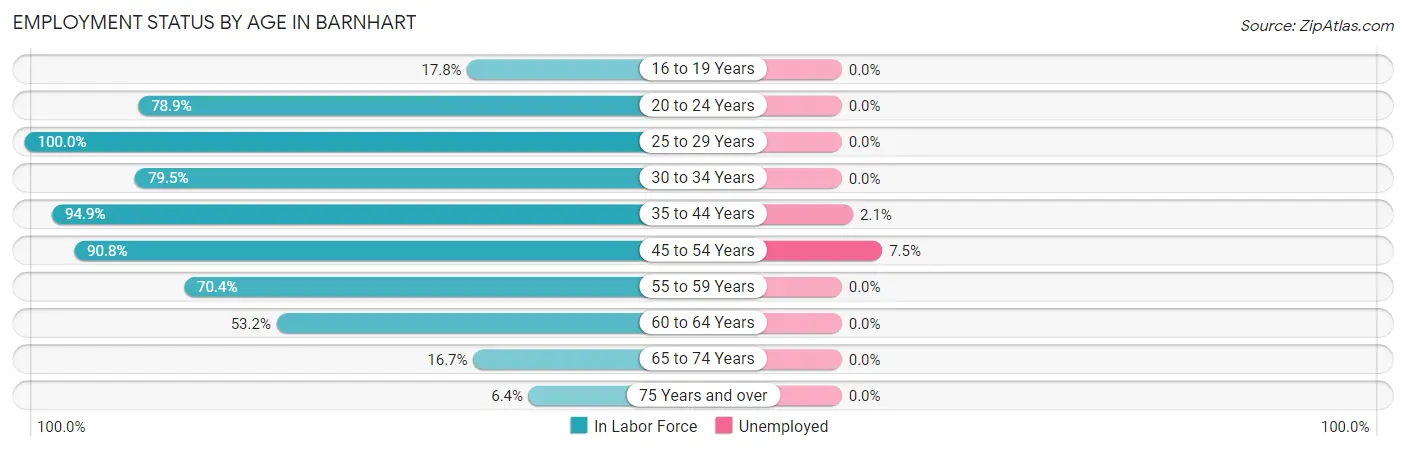
| Age Bracket | In Labor Force | Unemployed |
| 16 to 19 Years | 54 (17.8%) | 0 (0.0%) |
| 20 to 24 Years | 450 (78.9%) | 0 (0.0%) |
| 25 to 29 Years | 476 (100.0%) | 0 (0.0%) |
| 30 to 34 Years | 422 (79.5%) | 0 (0.0%) |
| 35 to 44 Years | 867 (94.9%) | 18 (2.1%) |
| 45 to 54 Years | 590 (90.8%) | 44 (7.5%) |
| 55 to 59 Years | 278 (70.4%) | 0 (0.0%) |
| 60 to 64 Years | 200 (53.2%) | 0 (0.0%) |
| 65 to 74 Years | 65 (16.7%) | 0 (0.0%) |
| 75 Years and over | 14 (6.4%) | 0 (0.0%) |
| Total | 3,416 (70.8%) | 61 (1.8%) |
Employment Status by Educational Attainment in Barnhart
According to labor force statistics for Barnhart, 84.8% of individuals (2,834) out of the total population between 25 and 64 years of age (3,342) are in the labor force, with 2.2% or 62 of them being unemployed. The group with the highest labor force participation rate are those with the educational attainment of bachelor's degree or higher, with 90.8% or 726 individuals in the labor force. Within the labor force, individuals with less than high school education have the highest percentage of unemployment, with 14.3% or 17 of them being unemployed.
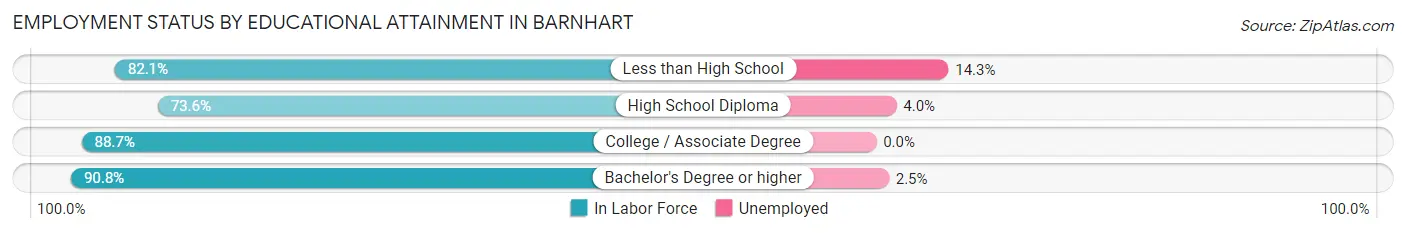
| Educational Attainment | In Labor Force | Unemployed |
| Less than High School | 119 (82.1%) | 21 (14.3%) |
| High School Diploma | 676 (73.6%) | 37 (4.0%) |
| College / Associate Degree | 1,312 (88.7%) | 0 (0.0%) |
| Bachelor's Degree or higher | 726 (90.8%) | 20 (2.5%) |
| Total | 2,834 (84.8%) | 74 (2.2%) |
Employment Occupations by Sex in Barnhart
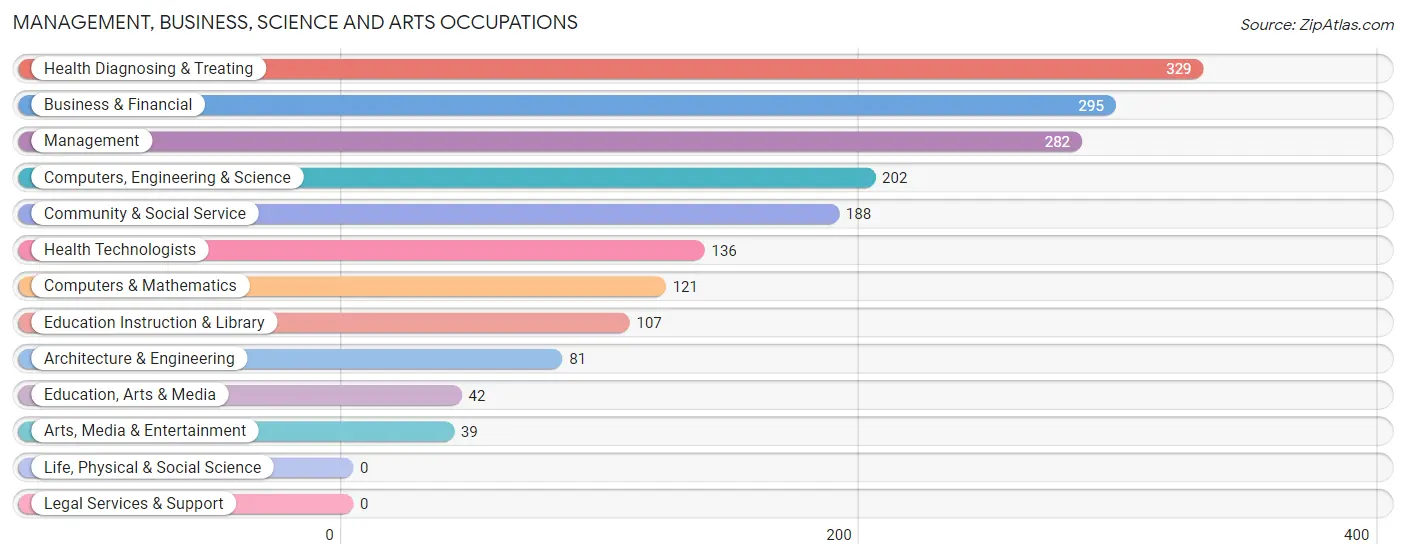
Management, Business, Science and Arts Occupations
The most common Management, Business, Science and Arts occupations in Barnhart are Health Diagnosing & Treating (329 | 9.8%), Business & Financial (295 | 8.8%), Management (282 | 8.4%), Computers, Engineering & Science (202 | 6.0%), and Community & Social Service (188 | 5.6%).
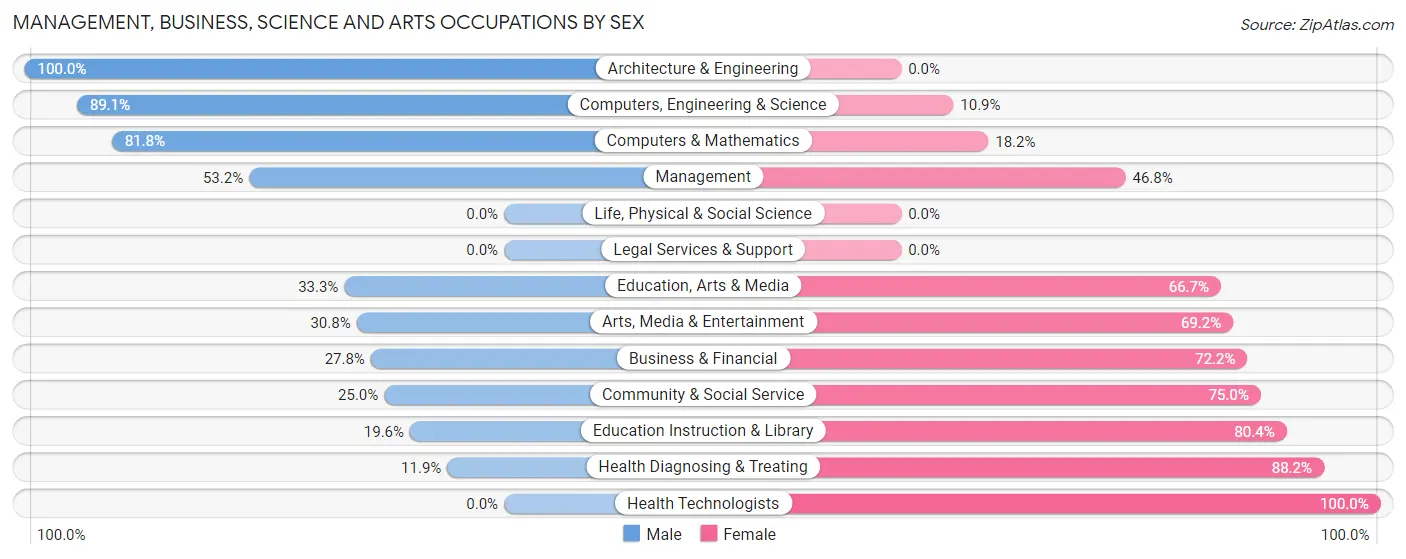
Management, Business, Science and Arts Occupations by Sex
Within the Management, Business, Science and Arts occupations in Barnhart, the most male-oriented occupations are Architecture & Engineering (100.0%), Computers, Engineering & Science (89.1%), and Computers & Mathematics (81.8%), while the most female-oriented occupations are Health Technologists (100.0%), Health Diagnosing & Treating (88.1%), and Education Instruction & Library (80.4%).
| Occupation | Male | Female |
| Management | 150 (53.2%) | 132 (46.8%) |
| Business & Financial | 82 (27.8%) | 213 (72.2%) |
| Computers, Engineering & Science | 180 (89.1%) | 22 (10.9%) |
| Computers & Mathematics | 99 (81.8%) | 22 (18.2%) |
| Architecture & Engineering | 81 (100.0%) | 0 (0.0%) |
| Life, Physical & Social Science | 0 (0.0%) | 0 (0.0%) |
| Community & Social Service | 47 (25.0%) | 141 (75.0%) |
| Education, Arts & Media | 14 (33.3%) | 28 (66.7%) |
| Legal Services & Support | 0 (0.0%) | 0 (0.0%) |
| Education Instruction & Library | 21 (19.6%) | 86 (80.4%) |
| Arts, Media & Entertainment | 12 (30.8%) | 27 (69.2%) |
| Health Diagnosing & Treating | 39 (11.8%) | 290 (88.1%) |
| Health Technologists | 0 (0.0%) | 136 (100.0%) |
| Total (Category) | 498 (38.4%) | 798 (61.6%) |
| Total (Overall) | 1,886 (56.2%) | 1,468 (43.8%) |
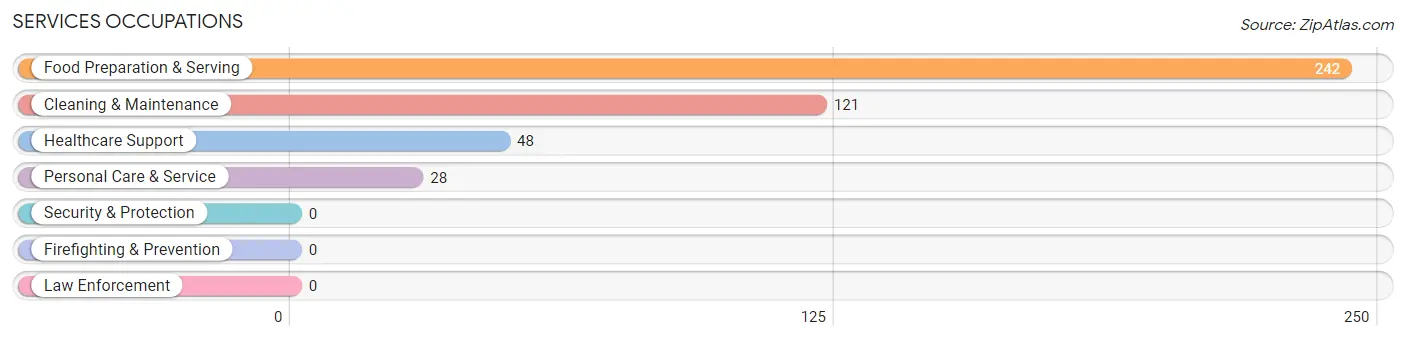
Services Occupations
The most common Services occupations in Barnhart are Food Preparation & Serving (242 | 7.2%), Cleaning & Maintenance (121 | 3.6%), Healthcare Support (48 | 1.4%), and Personal Care & Service (28 | 0.8%).
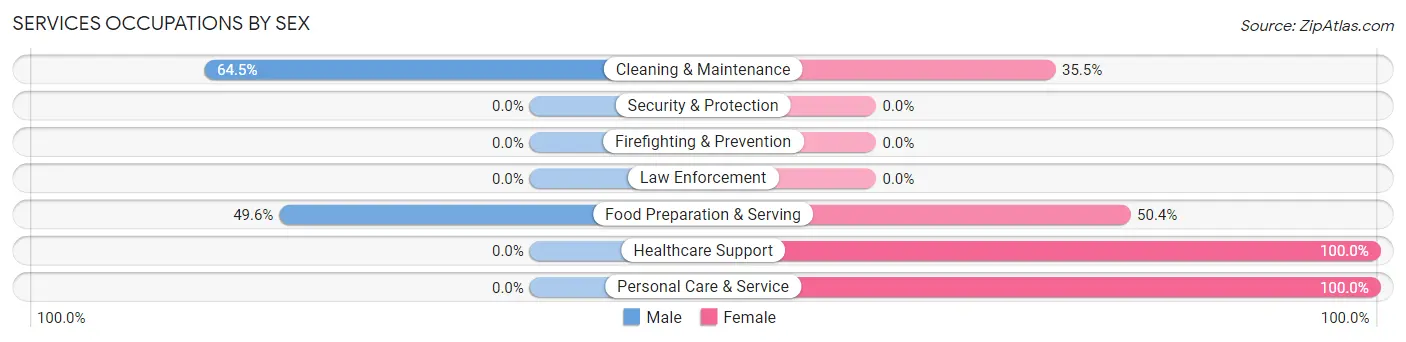
Services Occupations by Sex
Within the Services occupations in Barnhart, the most male-oriented occupations are Cleaning & Maintenance (64.5%), and Food Preparation & Serving (49.6%), while the most female-oriented occupations are Healthcare Support (100.0%), Personal Care & Service (100.0%), and Food Preparation & Serving (50.4%).
| Occupation | Male | Female |
| Healthcare Support | 0 (0.0%) | 48 (100.0%) |
| Security & Protection | 0 (0.0%) | 0 (0.0%) |
| Firefighting & Prevention | 0 (0.0%) | 0 (0.0%) |
| Law Enforcement | 0 (0.0%) | 0 (0.0%) |
| Food Preparation & Serving | 120 (49.6%) | 122 (50.4%) |
| Cleaning & Maintenance | 78 (64.5%) | 43 (35.5%) |
| Personal Care & Service | 0 (0.0%) | 28 (100.0%) |
| Total (Category) | 198 (45.1%) | 241 (54.9%) |
| Total (Overall) | 1,886 (56.2%) | 1,468 (43.8%) |
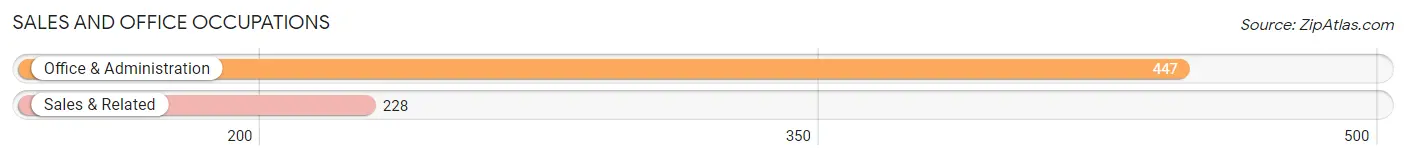
Sales and Office Occupations
The most common Sales and Office occupations in Barnhart are Office & Administration (447 | 13.3%), and Sales & Related (228 | 6.8%).
Sales and Office Occupations by Sex
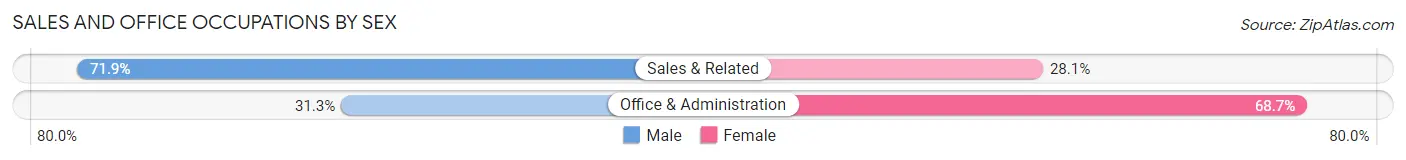
| Occupation | Male | Female |
| Sales & Related | 164 (71.9%) | 64 (28.1%) |
| Office & Administration | 140 (31.3%) | 307 (68.7%) |
| Total (Category) | 304 (45.0%) | 371 (55.0%) |
| Total (Overall) | 1,886 (56.2%) | 1,468 (43.8%) |
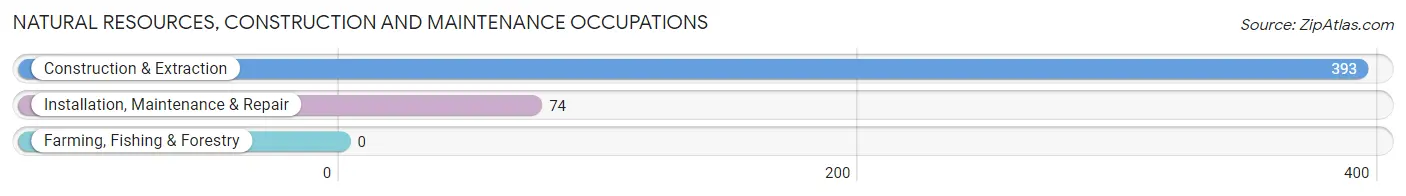
Natural Resources, Construction and Maintenance Occupations
The most common Natural Resources, Construction and Maintenance occupations in Barnhart are Construction & Extraction (393 | 11.7%), and Installation, Maintenance & Repair (74 | 2.2%).
Natural Resources, Construction and Maintenance Occupations by Sex
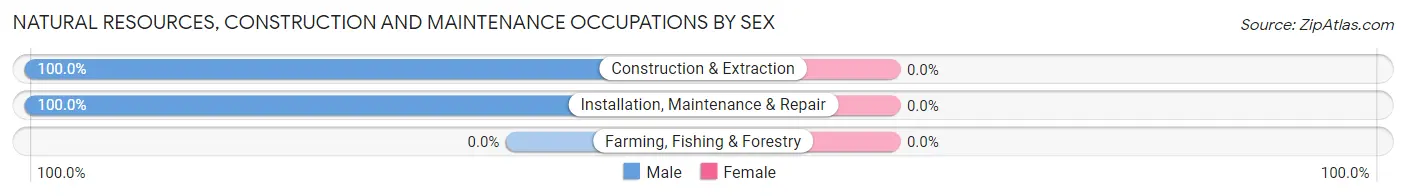
| Occupation | Male | Female |
| Farming, Fishing & Forestry | 0 (0.0%) | 0 (0.0%) |
| Construction & Extraction | 393 (100.0%) | 0 (0.0%) |
| Installation, Maintenance & Repair | 74 (100.0%) | 0 (0.0%) |
| Total (Category) | 467 (100.0%) | 0 (0.0%) |
| Total (Overall) | 1,886 (56.2%) | 1,468 (43.8%) |
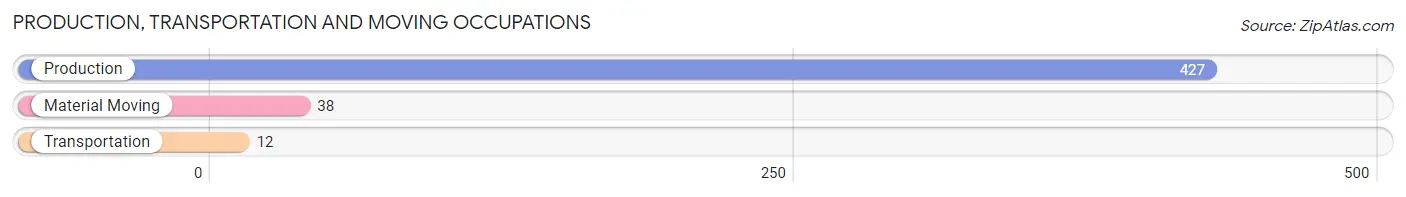
Production, Transportation and Moving Occupations
The most common Production, Transportation and Moving occupations in Barnhart are Production (427 | 12.7%), Material Moving (38 | 1.1%), and Transportation (12 | 0.4%).
Production, Transportation and Moving Occupations by Sex
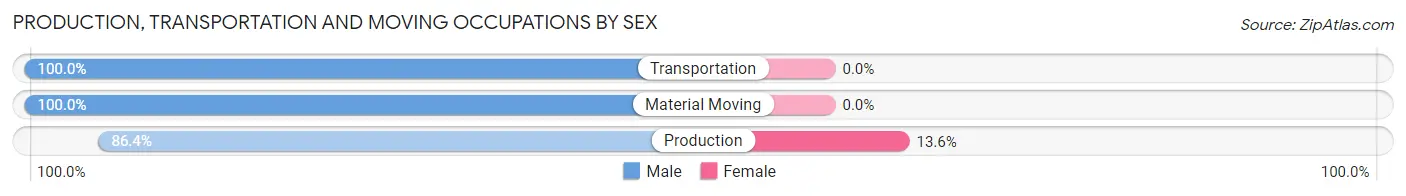
| Occupation | Male | Female |
| Production | 369 (86.4%) | 58 (13.6%) |
| Transportation | 12 (100.0%) | 0 (0.0%) |
| Material Moving | 38 (100.0%) | 0 (0.0%) |
| Total (Category) | 419 (87.8%) | 58 (12.2%) |
| Total (Overall) | 1,886 (56.2%) | 1,468 (43.8%) |
Employment Industries by Sex in Barnhart
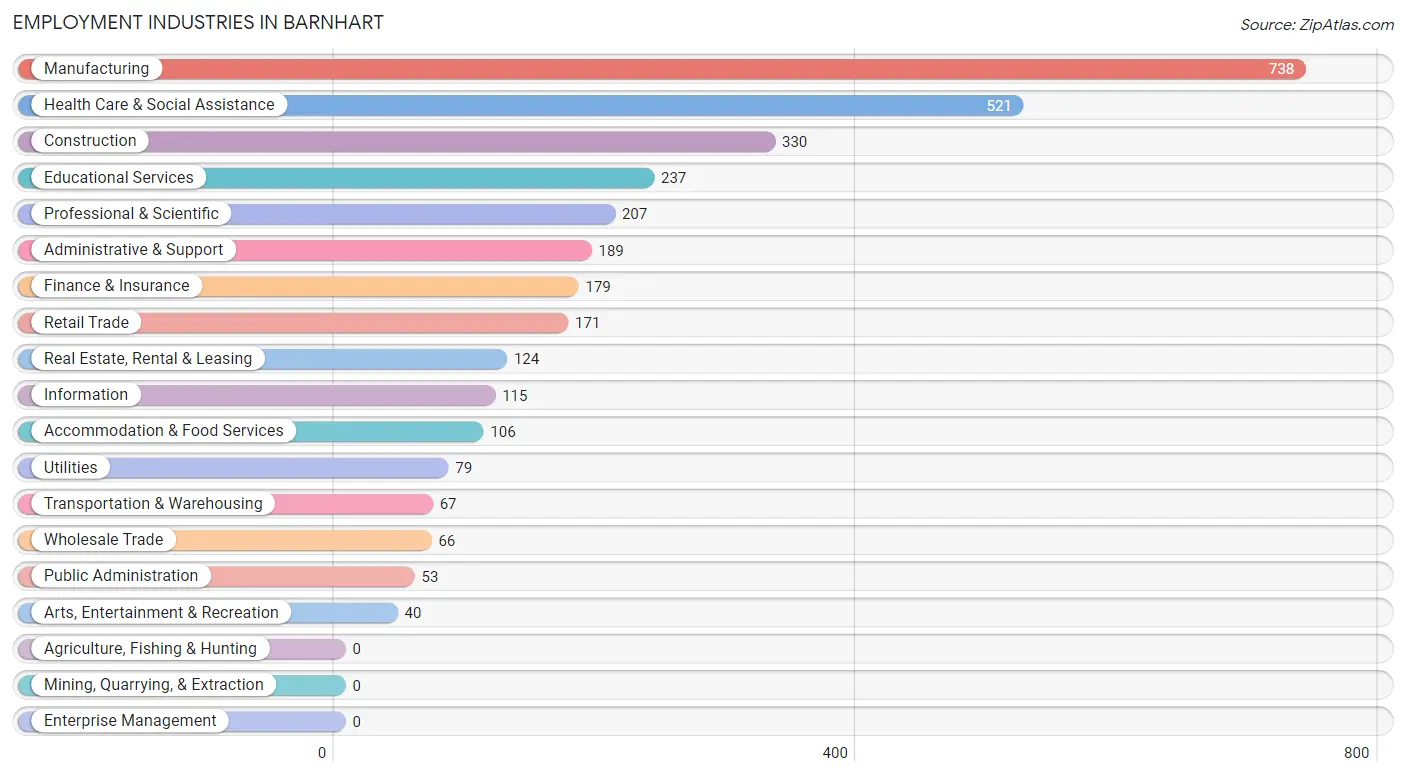
Employment Industries in Barnhart
The major employment industries in Barnhart include Manufacturing (738 | 22.0%), Health Care & Social Assistance (521 | 15.5%), Construction (330 | 9.8%), Educational Services (237 | 7.1%), and Professional & Scientific (207 | 6.2%).
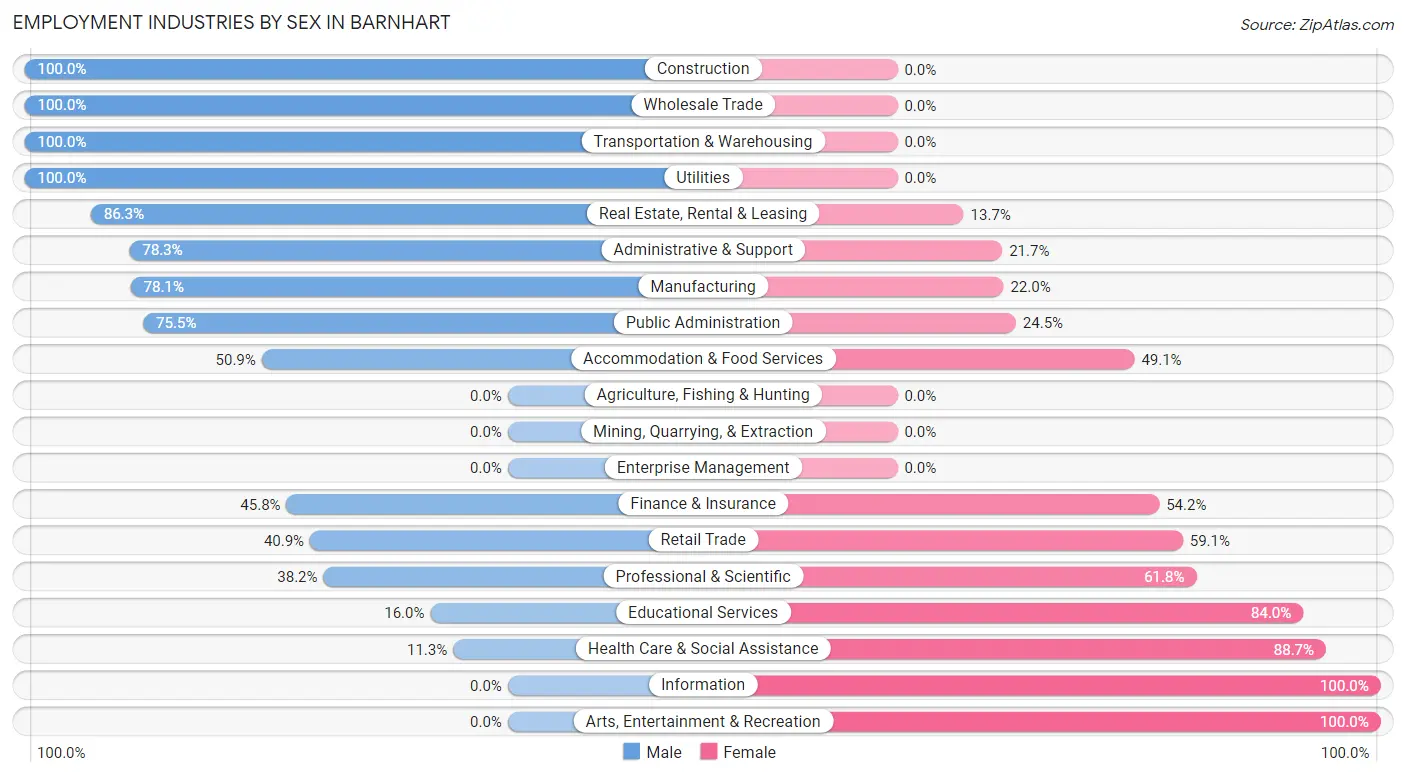
Employment Industries by Sex in Barnhart
The Barnhart industries that see more men than women are Construction (100.0%), Wholesale Trade (100.0%), and Transportation & Warehousing (100.0%), whereas the industries that tend to have a higher number of women are Information (100.0%), Arts, Entertainment & Recreation (100.0%), and Health Care & Social Assistance (88.7%).
| Industry | Male | Female |
| Agriculture, Fishing & Hunting | 0 (0.0%) | 0 (0.0%) |
| Mining, Quarrying, & Extraction | 0 (0.0%) | 0 (0.0%) |
| Construction | 330 (100.0%) | 0 (0.0%) |
| Manufacturing | 576 (78.0%) | 162 (22.0%) |
| Wholesale Trade | 66 (100.0%) | 0 (0.0%) |
| Retail Trade | 70 (40.9%) | 101 (59.1%) |
| Transportation & Warehousing | 67 (100.0%) | 0 (0.0%) |
| Utilities | 79 (100.0%) | 0 (0.0%) |
| Information | 0 (0.0%) | 115 (100.0%) |
| Finance & Insurance | 82 (45.8%) | 97 (54.2%) |
| Real Estate, Rental & Leasing | 107 (86.3%) | 17 (13.7%) |
| Professional & Scientific | 79 (38.2%) | 128 (61.8%) |
| Enterprise Management | 0 (0.0%) | 0 (0.0%) |
| Administrative & Support | 148 (78.3%) | 41 (21.7%) |
| Educational Services | 38 (16.0%) | 199 (84.0%) |
| Health Care & Social Assistance | 59 (11.3%) | 462 (88.7%) |
| Arts, Entertainment & Recreation | 0 (0.0%) | 40 (100.0%) |
| Accommodation & Food Services | 54 (50.9%) | 52 (49.1%) |
| Public Administration | 40 (75.5%) | 13 (24.5%) |
| Total | 1,886 (56.2%) | 1,468 (43.8%) |
Education in Barnhart
School Enrollment in Barnhart
The most common levels of schooling among the 1,223 students in Barnhart are high school (372 | 30.4%), elementary school (267 | 21.8%), and middle school (224 | 18.3%).
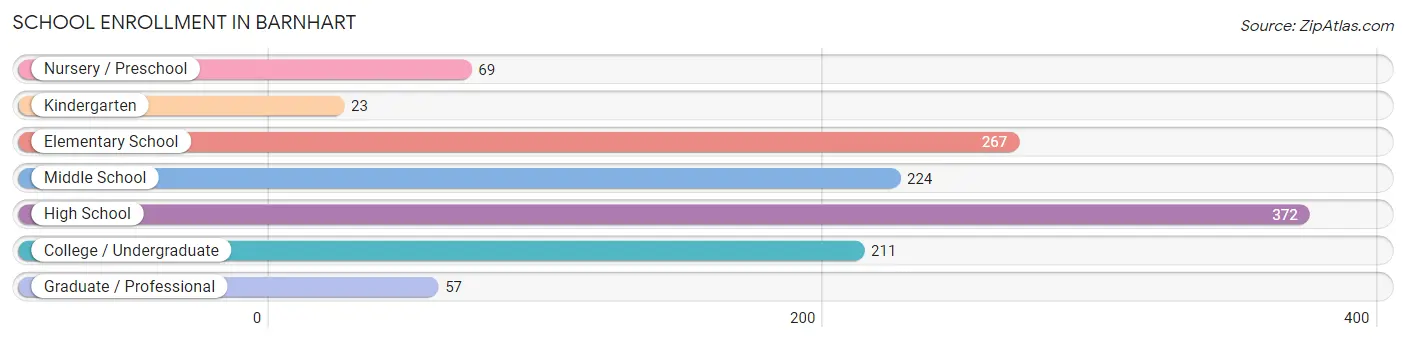
| School Level | # Students | % Students |
| Nursery / Preschool | 69 | 5.6% |
| Kindergarten | 23 | 1.9% |
| Elementary School | 267 | 21.8% |
| Middle School | 224 | 18.3% |
| High School | 372 | 30.4% |
| College / Undergraduate | 211 | 17.2% |
| Graduate / Professional | 57 | 4.7% |
| Total | 1,223 | 100.0% |
School Enrollment by Age by Funding Source in Barnhart
Out of a total of 1,223 students who are enrolled in schools in Barnhart, 139 (11.4%) attend a private institution, while the remaining 1,084 (88.6%) are enrolled in public schools. The age group of 3 to 4 year olds has the highest likelihood of being enrolled in private schools, with 35 (50.7% in the age bracket) enrolled. Conversely, the age group of 18 to 19 year olds has the lowest likelihood of being enrolled in a private school, with 161 (100.0% in the age bracket) attending a public institution.
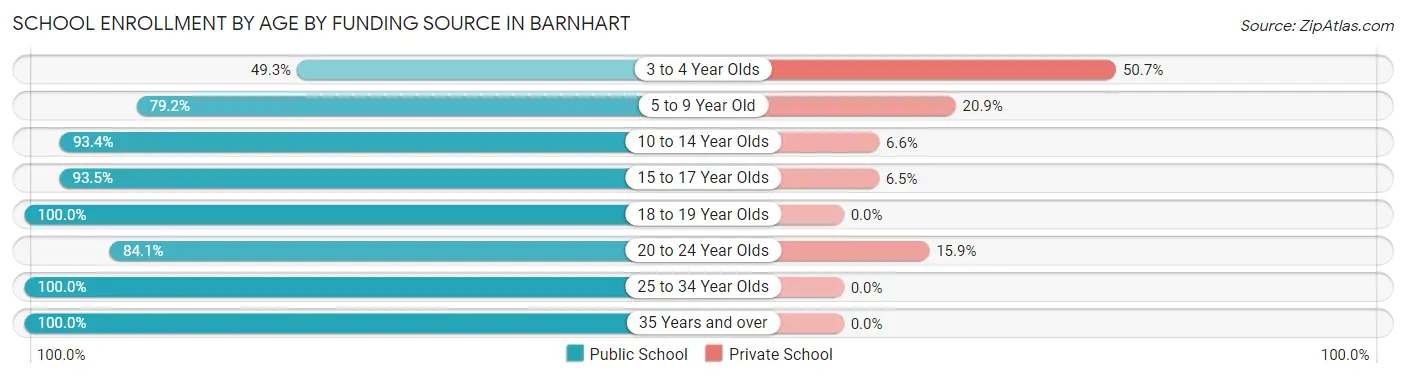
| Age Bracket | Public School | Private School |
| 3 to 4 Year Olds | 34 (49.3%) | 35 (50.7%) |
| 5 to 9 Year Old | 167 (79.1%) | 44 (20.8%) |
| 10 to 14 Year Olds | 283 (93.4%) | 20 (6.6%) |
| 15 to 17 Year Olds | 258 (93.5%) | 18 (6.5%) |
| 18 to 19 Year Olds | 161 (100.0%) | 0 (0.0%) |
| 20 to 24 Year Olds | 116 (84.1%) | 22 (15.9%) |
| 25 to 34 Year Olds | 21 (100.0%) | 0 (0.0%) |
| 35 Years and over | 44 (100.0%) | 0 (0.0%) |
| Total | 1,084 (88.6%) | 139 (11.4%) |
Educational Attainment by Field of Study in Barnhart
Education (250 | 26.6%), business (171 | 18.2%), arts & humanities (112 | 11.9%), engineering (85 | 9.0%), and computers & mathematics (65 | 6.9%) are the most common fields of study among 939 individuals in Barnhart who have obtained a bachelor's degree or higher.
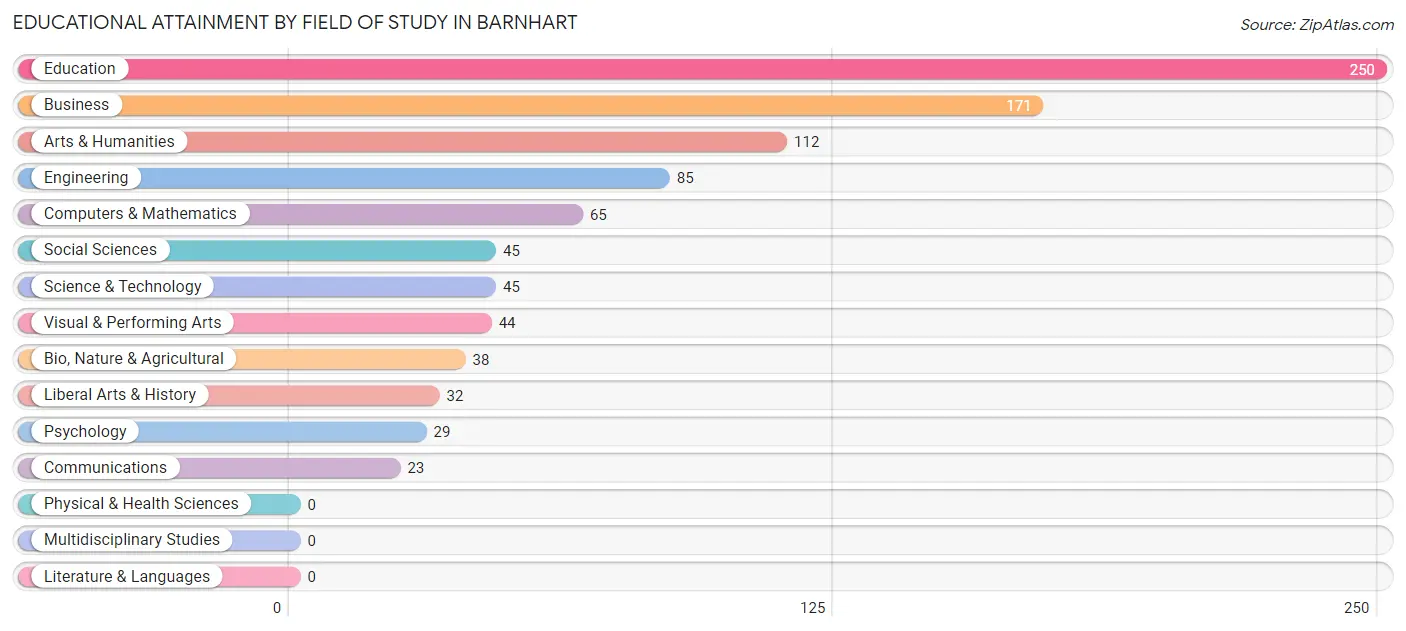
| Field of Study | # Graduates | % Graduates |
| Computers & Mathematics | 65 | 6.9% |
| Bio, Nature & Agricultural | 38 | 4.1% |
| Physical & Health Sciences | 0 | 0.0% |
| Psychology | 29 | 3.1% |
| Social Sciences | 45 | 4.8% |
| Engineering | 85 | 9.0% |
| Multidisciplinary Studies | 0 | 0.0% |
| Science & Technology | 45 | 4.8% |
| Business | 171 | 18.2% |
| Education | 250 | 26.6% |
| Literature & Languages | 0 | 0.0% |
| Liberal Arts & History | 32 | 3.4% |
| Visual & Performing Arts | 44 | 4.7% |
| Communications | 23 | 2.5% |
| Arts & Humanities | 112 | 11.9% |
| Total | 939 | 100.0% |
Transportation & Commute in Barnhart
Vehicle Availability by Sex in Barnhart
The most prevalent vehicle ownership categories in Barnhart are males with 2 vehicles (1,072, accounting for 58.9%) and females with 2 vehicles (769, making up 73.0%).
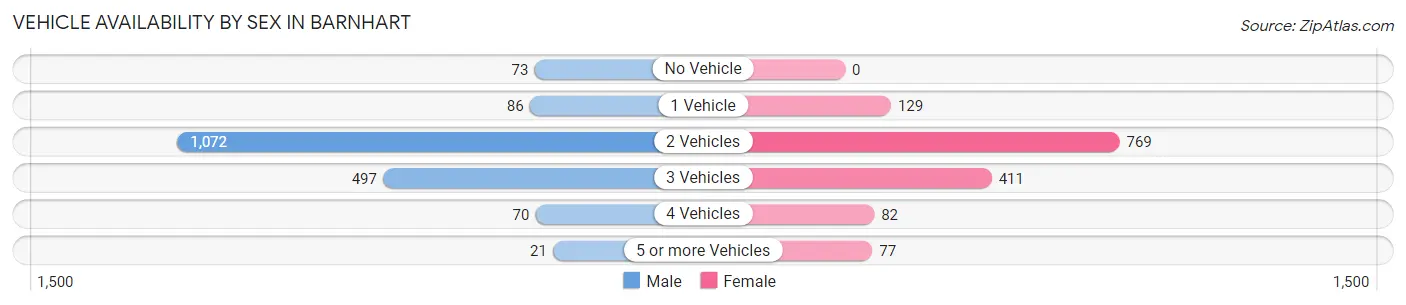
| Vehicles Available | Male | Female |
| No Vehicle | 73 (4.0%) | 0 (0.0%) |
| 1 Vehicle | 86 (4.7%) | 129 (8.8%) |
| 2 Vehicles | 1,072 (58.9%) | 769 (52.4%) |
| 3 Vehicles | 497 (27.3%) | 411 (28.0%) |
| 4 Vehicles | 70 (3.8%) | 82 (5.6%) |
| 5 or more Vehicles | 21 (1.1%) | 77 (5.2%) |
| Total | 1,819 (100.0%) | 1,468 (100.0%) |
Commute Time in Barnhart
The most frequently occuring commute durations in Barnhart are 30 to 34 minutes (608 commuters, 20.3%), 20 to 24 minutes (410 commuters, 13.7%), and 45 to 59 minutes (390 commuters, 13.0%).
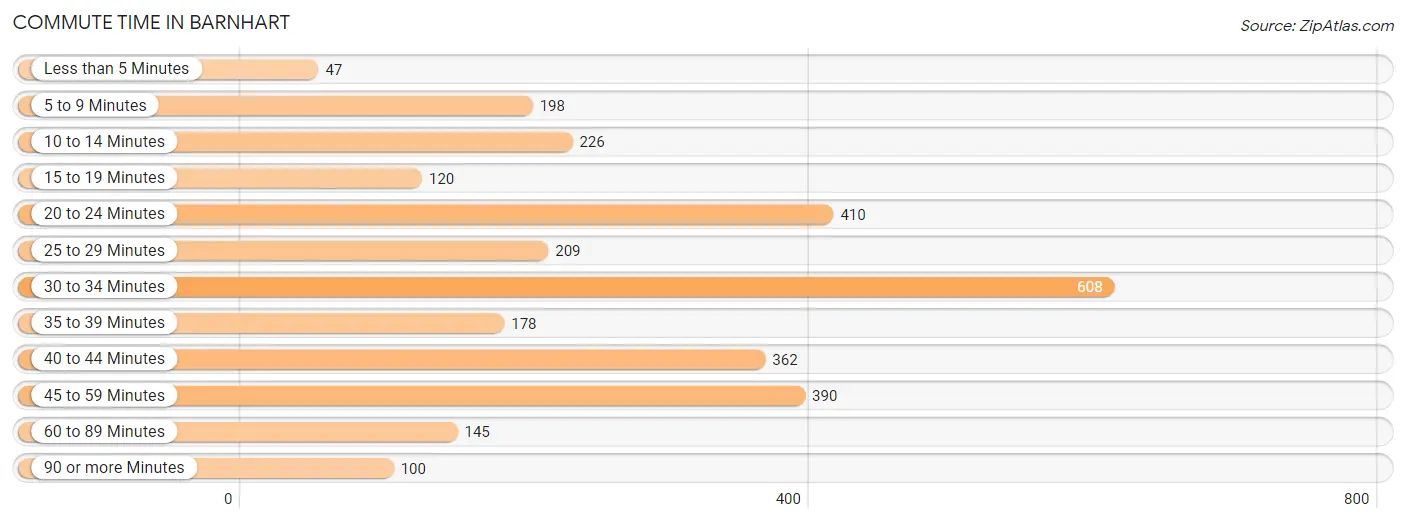
| Commute Time | # Commuters | % Commuters |
| Less than 5 Minutes | 47 | 1.6% |
| 5 to 9 Minutes | 198 | 6.6% |
| 10 to 14 Minutes | 226 | 7.5% |
| 15 to 19 Minutes | 120 | 4.0% |
| 20 to 24 Minutes | 410 | 13.7% |
| 25 to 29 Minutes | 209 | 7.0% |
| 30 to 34 Minutes | 608 | 20.3% |
| 35 to 39 Minutes | 178 | 5.9% |
| 40 to 44 Minutes | 362 | 12.1% |
| 45 to 59 Minutes | 390 | 13.0% |
| 60 to 89 Minutes | 145 | 4.8% |
| 90 or more Minutes | 100 | 3.3% |
Commute Time by Sex in Barnhart
The most common commute times in Barnhart are 30 to 34 minutes (434 commuters, 26.3%) for males and 20 to 24 minutes (263 commuters, 19.6%) for females.
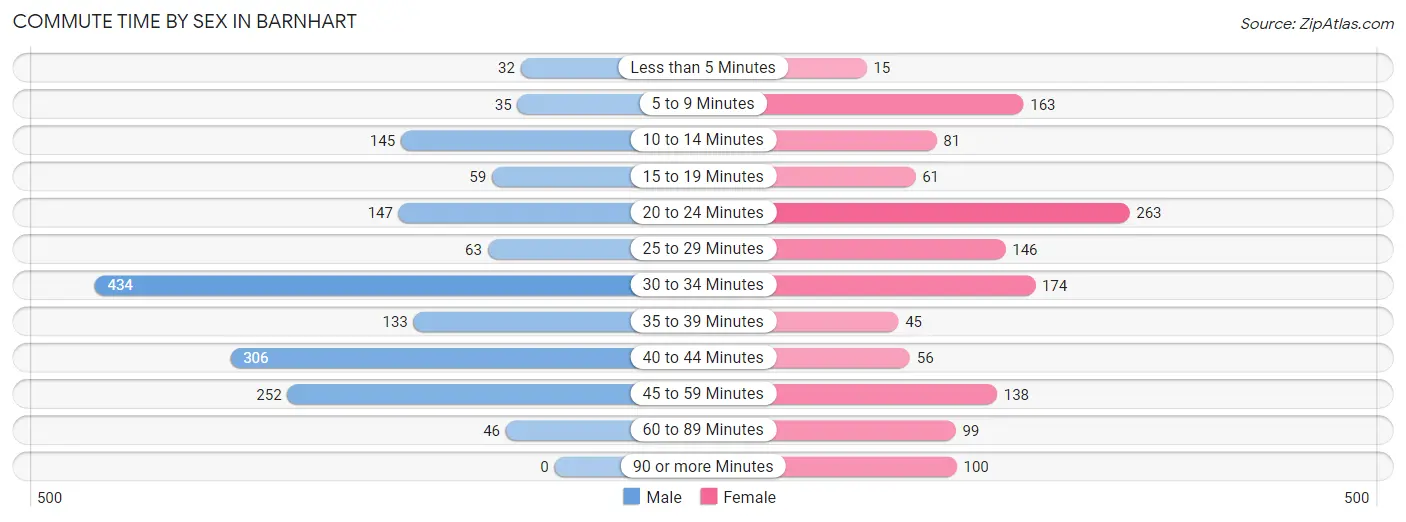
| Commute Time | Male | Female |
| Less than 5 Minutes | 32 (1.9%) | 15 (1.1%) |
| 5 to 9 Minutes | 35 (2.1%) | 163 (12.2%) |
| 10 to 14 Minutes | 145 (8.8%) | 81 (6.0%) |
| 15 to 19 Minutes | 59 (3.6%) | 61 (4.5%) |
| 20 to 24 Minutes | 147 (8.9%) | 263 (19.6%) |
| 25 to 29 Minutes | 63 (3.8%) | 146 (10.9%) |
| 30 to 34 Minutes | 434 (26.3%) | 174 (13.0%) |
| 35 to 39 Minutes | 133 (8.1%) | 45 (3.4%) |
| 40 to 44 Minutes | 306 (18.5%) | 56 (4.2%) |
| 45 to 59 Minutes | 252 (15.2%) | 138 (10.3%) |
| 60 to 89 Minutes | 46 (2.8%) | 99 (7.4%) |
| 90 or more Minutes | 0 (0.0%) | 100 (7.5%) |
Time of Departure to Work by Sex in Barnhart
The most frequent times of departure to work in Barnhart are 6:00 AM to 6:29 AM (283, 17.1%) for males and 6:00 AM to 6:29 AM (230, 17.2%) for females.
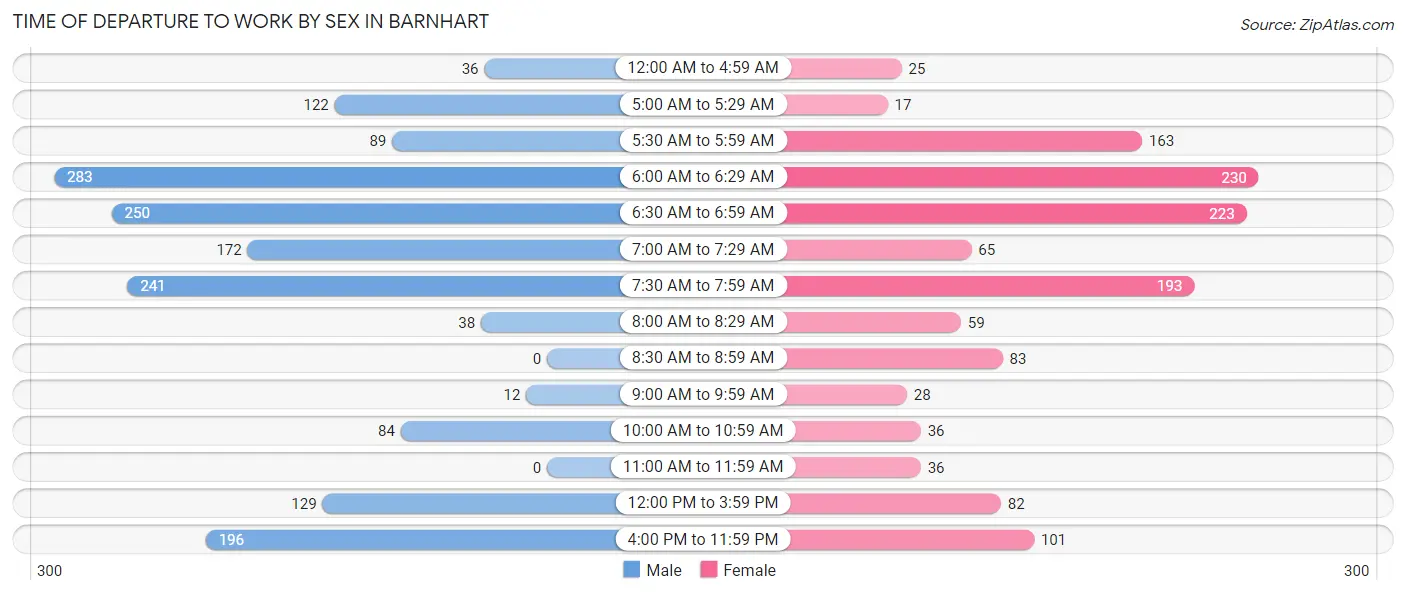
| Time of Departure | Male | Female |
| 12:00 AM to 4:59 AM | 36 (2.2%) | 25 (1.9%) |
| 5:00 AM to 5:29 AM | 122 (7.4%) | 17 (1.3%) |
| 5:30 AM to 5:59 AM | 89 (5.4%) | 163 (12.2%) |
| 6:00 AM to 6:29 AM | 283 (17.1%) | 230 (17.2%) |
| 6:30 AM to 6:59 AM | 250 (15.1%) | 223 (16.6%) |
| 7:00 AM to 7:29 AM | 172 (10.4%) | 65 (4.9%) |
| 7:30 AM to 7:59 AM | 241 (14.6%) | 193 (14.4%) |
| 8:00 AM to 8:29 AM | 38 (2.3%) | 59 (4.4%) |
| 8:30 AM to 8:59 AM | 0 (0.0%) | 83 (6.2%) |
| 9:00 AM to 9:59 AM | 12 (0.7%) | 28 (2.1%) |
| 10:00 AM to 10:59 AM | 84 (5.1%) | 36 (2.7%) |
| 11:00 AM to 11:59 AM | 0 (0.0%) | 36 (2.7%) |
| 12:00 PM to 3:59 PM | 129 (7.8%) | 82 (6.1%) |
| 4:00 PM to 11:59 PM | 196 (11.9%) | 101 (7.5%) |
| Total | 1,652 (100.0%) | 1,341 (100.0%) |
Housing Occupancy in Barnhart
Occupancy by Ownership in Barnhart
Of the total 2,256 dwellings in Barnhart, owner-occupied units account for 1,937 (85.9%), while renter-occupied units make up 319 (14.1%).
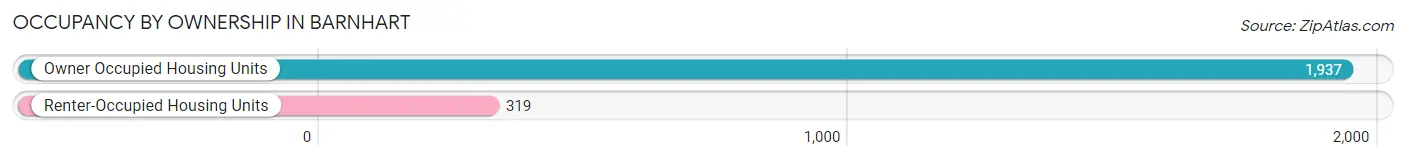
| Occupancy | # Housing Units | % Housing Units |
| Owner Occupied Housing Units | 1,937 | 85.9% |
| Renter-Occupied Housing Units | 319 | 14.1% |
| Total Occupied Housing Units | 2,256 | 100.0% |
Occupancy by Household Size in Barnhart
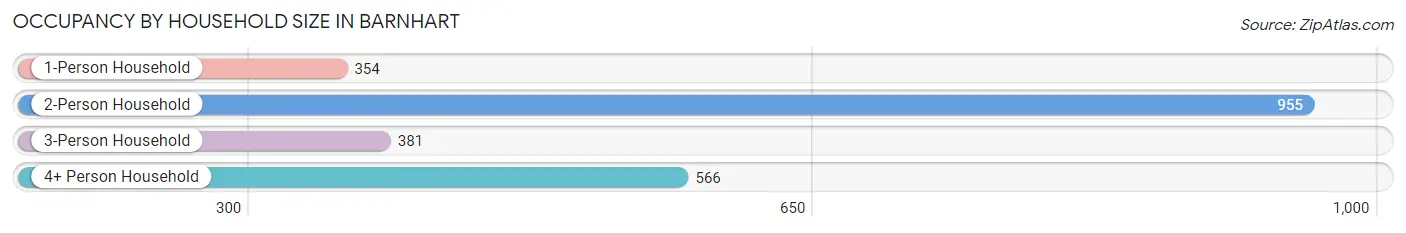
| Household Size | # Housing Units | % Housing Units |
| 1-Person Household | 354 | 15.7% |
| 2-Person Household | 955 | 42.3% |
| 3-Person Household | 381 | 16.9% |
| 4+ Person Household | 566 | 25.1% |
| Total Housing Units | 2,256 | 100.0% |
Occupancy by Ownership by Household Size in Barnhart
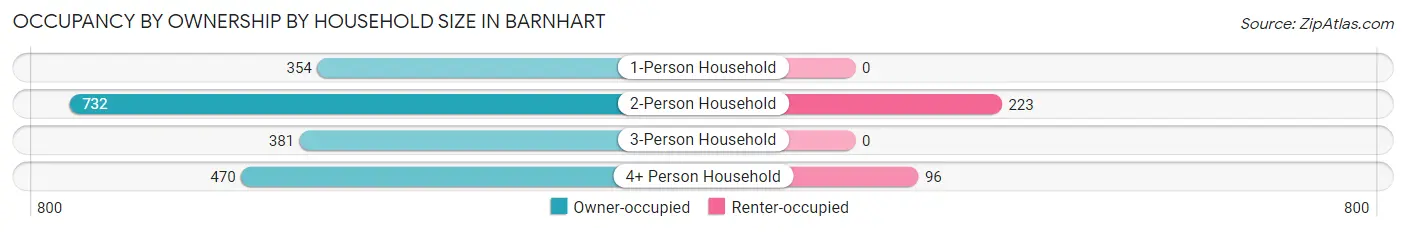
| Household Size | Owner-occupied | Renter-occupied |
| 1-Person Household | 354 (100.0%) | 0 (0.0%) |
| 2-Person Household | 732 (76.6%) | 223 (23.4%) |
| 3-Person Household | 381 (100.0%) | 0 (0.0%) |
| 4+ Person Household | 470 (83.0%) | 96 (17.0%) |
| Total Housing Units | 1,937 (85.9%) | 319 (14.1%) |
Occupancy by Educational Attainment in Barnhart
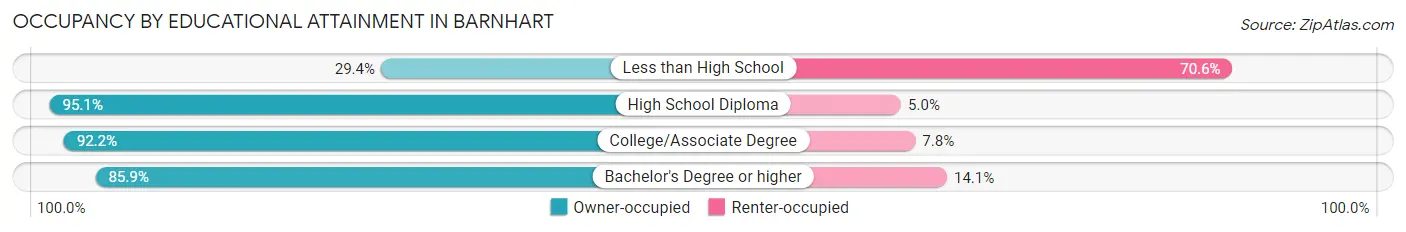
| Household Size | Owner-occupied | Renter-occupied |
| Less than High School | 57 (29.4%) | 137 (70.6%) |
| High School Diploma | 595 (95.1%) | 31 (5.0%) |
| College/Associate Degree | 747 (92.2%) | 63 (7.8%) |
| Bachelor's Degree or higher | 538 (85.9%) | 88 (14.1%) |
Occupancy by Age of Householder in Barnhart
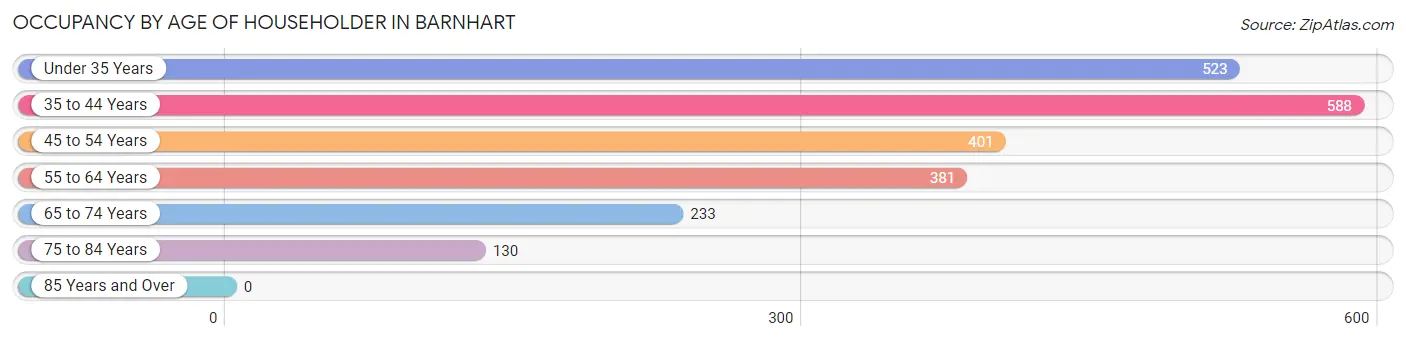
| Age Bracket | # Households | % Households |
| Under 35 Years | 523 | 23.2% |
| 35 to 44 Years | 588 | 26.1% |
| 45 to 54 Years | 401 | 17.8% |
| 55 to 64 Years | 381 | 16.9% |
| 65 to 74 Years | 233 | 10.3% |
| 75 to 84 Years | 130 | 5.8% |
| 85 Years and Over | 0 | 0.0% |
| Total | 2,256 | 100.0% |
Housing Finances in Barnhart
Median Income by Occupancy in Barnhart
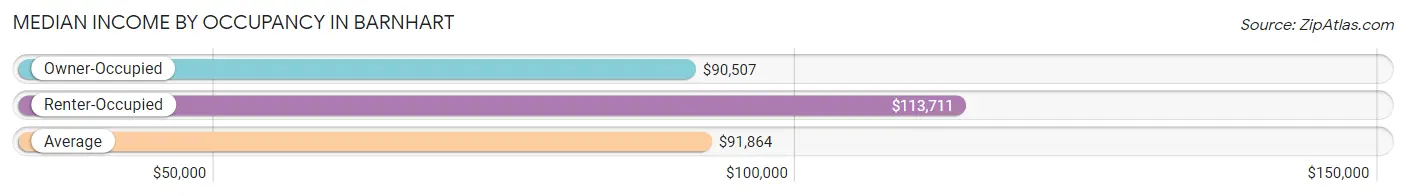
| Occupancy Type | # Households | Median Income |
| Owner-Occupied | 1,937 (85.9%) | $90,507 |
| Renter-Occupied | 319 (14.1%) | $113,711 |
| Average | 2,256 (100.0%) | $91,864 |
Occupancy by Householder Income Bracket in Barnhart
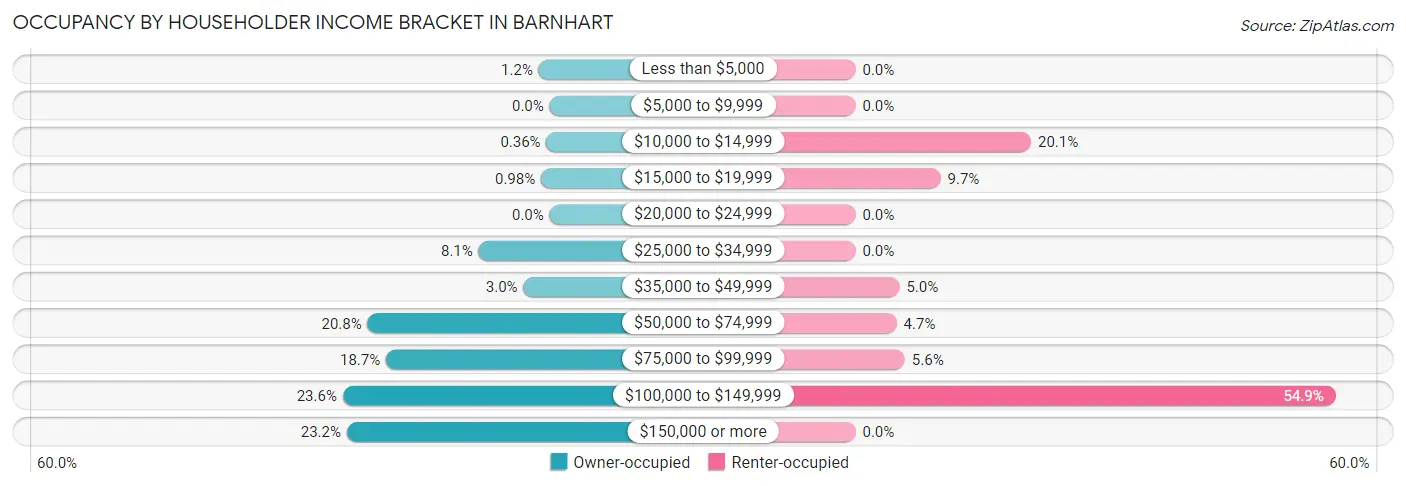
| Income Bracket | Owner-occupied | Renter-occupied |
| Less than $5,000 | 24 (1.2%) | 0 (0.0%) |
| $5,000 to $9,999 | 0 (0.0%) | 0 (0.0%) |
| $10,000 to $14,999 | 7 (0.4%) | 64 (20.1%) |
| $15,000 to $19,999 | 19 (1.0%) | 31 (9.7%) |
| $20,000 to $24,999 | 0 (0.0%) | 0 (0.0%) |
| $25,000 to $34,999 | 157 (8.1%) | 0 (0.0%) |
| $35,000 to $49,999 | 58 (3.0%) | 16 (5.0%) |
| $50,000 to $74,999 | 403 (20.8%) | 15 (4.7%) |
| $75,000 to $99,999 | 362 (18.7%) | 18 (5.6%) |
| $100,000 to $149,999 | 458 (23.6%) | 175 (54.9%) |
| $150,000 or more | 449 (23.2%) | 0 (0.0%) |
| Total | 1,937 (100.0%) | 319 (100.0%) |
Monthly Housing Cost Tiers in Barnhart
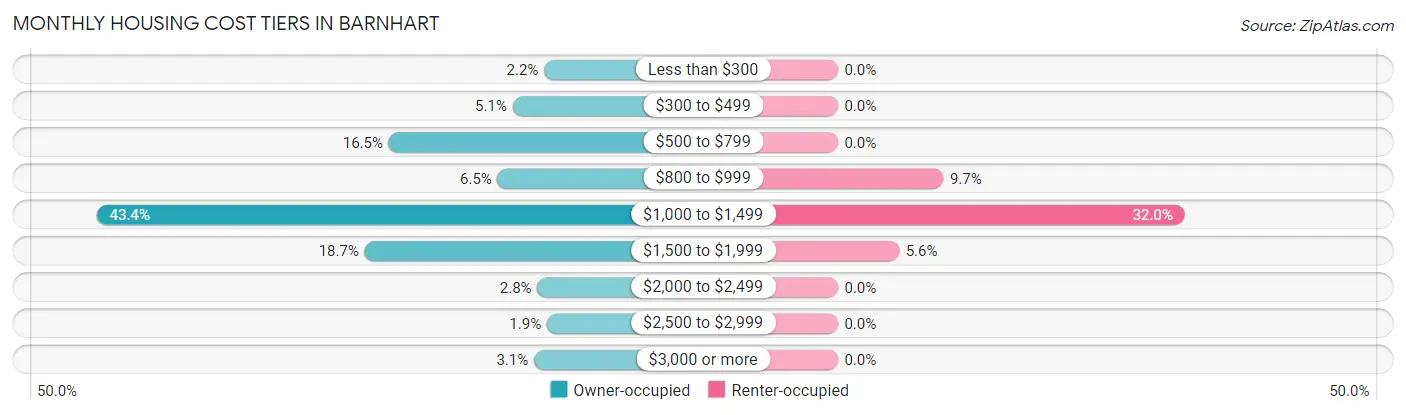
| Monthly Cost | Owner-occupied | Renter-occupied |
| Less than $300 | 42 (2.2%) | 0 (0.0%) |
| $300 to $499 | 98 (5.1%) | 0 (0.0%) |
| $500 to $799 | 319 (16.5%) | 0 (0.0%) |
| $800 to $999 | 125 (6.5%) | 31 (9.7%) |
| $1,000 to $1,499 | 840 (43.4%) | 102 (32.0%) |
| $1,500 to $1,999 | 362 (18.7%) | 18 (5.6%) |
| $2,000 to $2,499 | 54 (2.8%) | 0 (0.0%) |
| $2,500 to $2,999 | 37 (1.9%) | 0 (0.0%) |
| $3,000 or more | 60 (3.1%) | 0 (0.0%) |
| Total | 1,937 (100.0%) | 319 (100.0%) |
Physical Housing Characteristics in Barnhart
Housing Structures in Barnhart
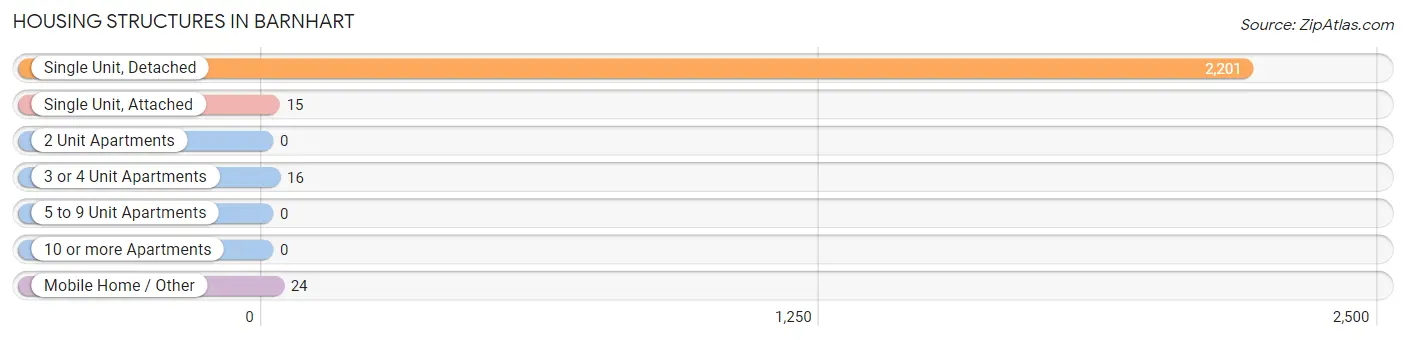
| Structure Type | # Housing Units | % Housing Units |
| Single Unit, Detached | 2,201 | 97.6% |
| Single Unit, Attached | 15 | 0.7% |
| 2 Unit Apartments | 0 | 0.0% |
| 3 or 4 Unit Apartments | 16 | 0.7% |
| 5 to 9 Unit Apartments | 0 | 0.0% |
| 10 or more Apartments | 0 | 0.0% |
| Mobile Home / Other | 24 | 1.1% |
| Total | 2,256 | 100.0% |
Housing Structures by Occupancy in Barnhart
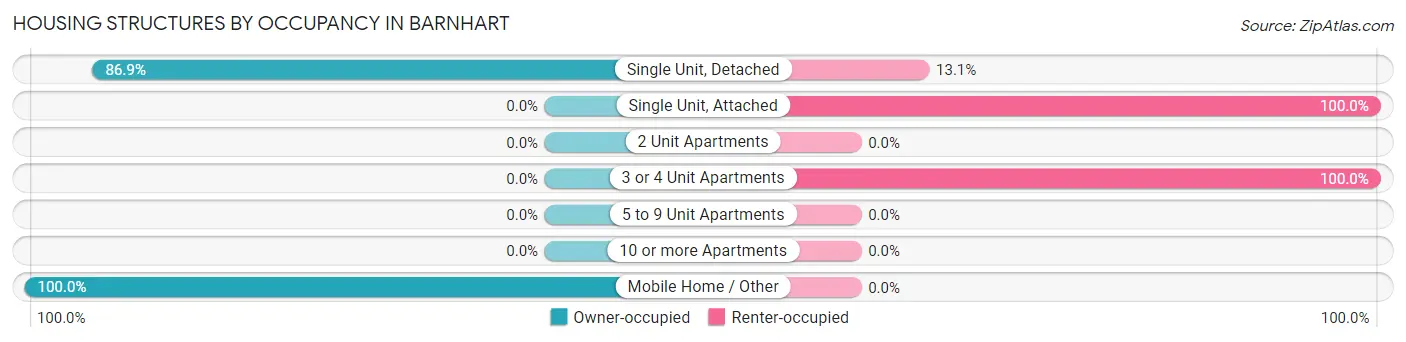
| Structure Type | Owner-occupied | Renter-occupied |
| Single Unit, Detached | 1,913 (86.9%) | 288 (13.1%) |
| Single Unit, Attached | 0 (0.0%) | 15 (100.0%) |
| 2 Unit Apartments | 0 (0.0%) | 0 (0.0%) |
| 3 or 4 Unit Apartments | 0 (0.0%) | 16 (100.0%) |
| 5 to 9 Unit Apartments | 0 (0.0%) | 0 (0.0%) |
| 10 or more Apartments | 0 (0.0%) | 0 (0.0%) |
| Mobile Home / Other | 24 (100.0%) | 0 (0.0%) |
| Total | 1,937 (85.9%) | 319 (14.1%) |
Housing Structures by Number of Rooms in Barnhart
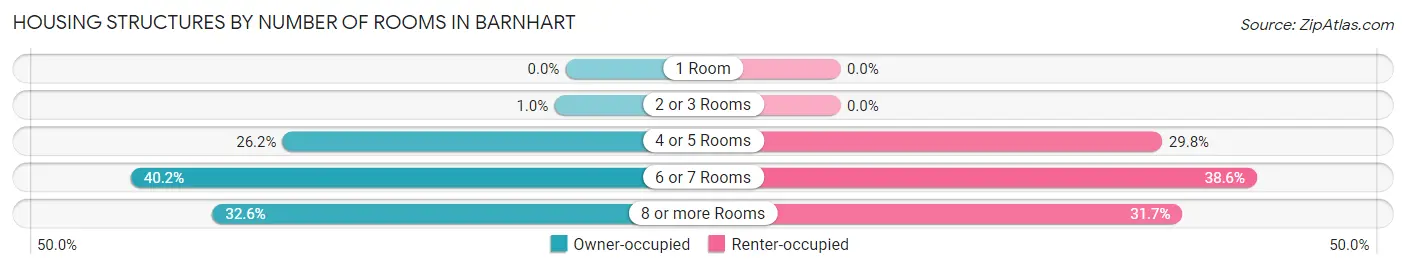
| Number of Rooms | Owner-occupied | Renter-occupied |
| 1 Room | 0 (0.0%) | 0 (0.0%) |
| 2 or 3 Rooms | 20 (1.0%) | 0 (0.0%) |
| 4 or 5 Rooms | 507 (26.2%) | 95 (29.8%) |
| 6 or 7 Rooms | 778 (40.2%) | 123 (38.6%) |
| 8 or more Rooms | 632 (32.6%) | 101 (31.7%) |
| Total | 1,937 (100.0%) | 319 (100.0%) |
Housing Structure by Heating Type in Barnhart
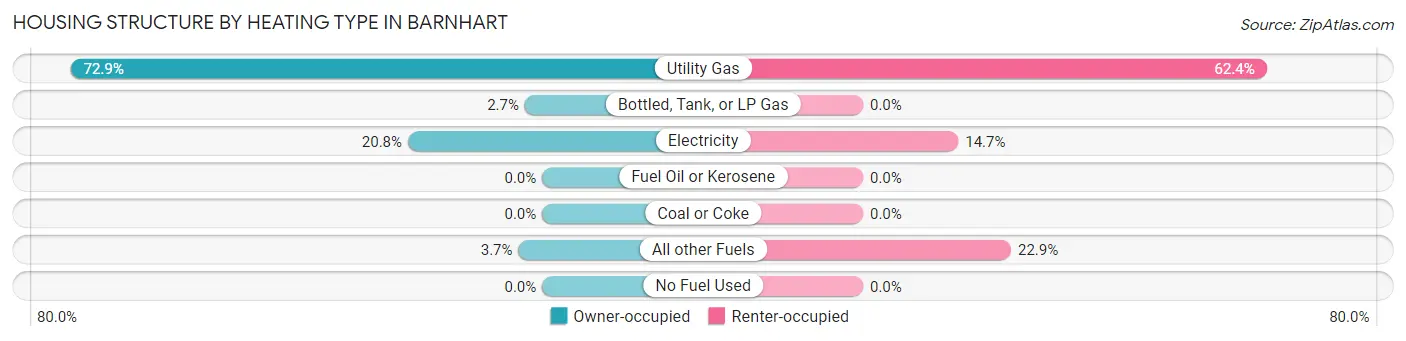
| Heating Type | Owner-occupied | Renter-occupied |
| Utility Gas | 1,412 (72.9%) | 199 (62.4%) |
| Bottled, Tank, or LP Gas | 52 (2.7%) | 0 (0.0%) |
| Electricity | 402 (20.7%) | 47 (14.7%) |
| Fuel Oil or Kerosene | 0 (0.0%) | 0 (0.0%) |
| Coal or Coke | 0 (0.0%) | 0 (0.0%) |
| All other Fuels | 71 (3.7%) | 73 (22.9%) |
| No Fuel Used | 0 (0.0%) | 0 (0.0%) |
| Total | 1,937 (100.0%) | 319 (100.0%) |
Household Vehicle Usage in Barnhart
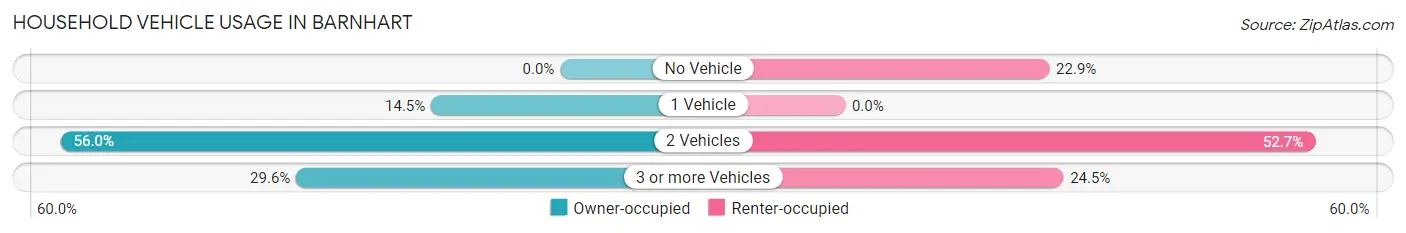
| Vehicles per Household | Owner-occupied | Renter-occupied |
| No Vehicle | 0 (0.0%) | 73 (22.9%) |
| 1 Vehicle | 280 (14.5%) | 0 (0.0%) |
| 2 Vehicles | 1,084 (56.0%) | 168 (52.7%) |
| 3 or more Vehicles | 573 (29.6%) | 78 (24.4%) |
| Total | 1,937 (100.0%) | 319 (100.0%) |
Real Estate & Mortgages in Barnhart
Real Estate and Mortgage Overview in Barnhart
| Characteristic | Without Mortgage | With Mortgage |
| Housing Units | 448 | 1,489 |
| Median Property Value | $176,300 | $188,900 |
| Median Household Income | $72,875 | $423 |
| Monthly Housing Costs | $591 | $60 |
| Real Estate Taxes | $1,512 | $0 |
Property Value by Mortgage Status in Barnhart
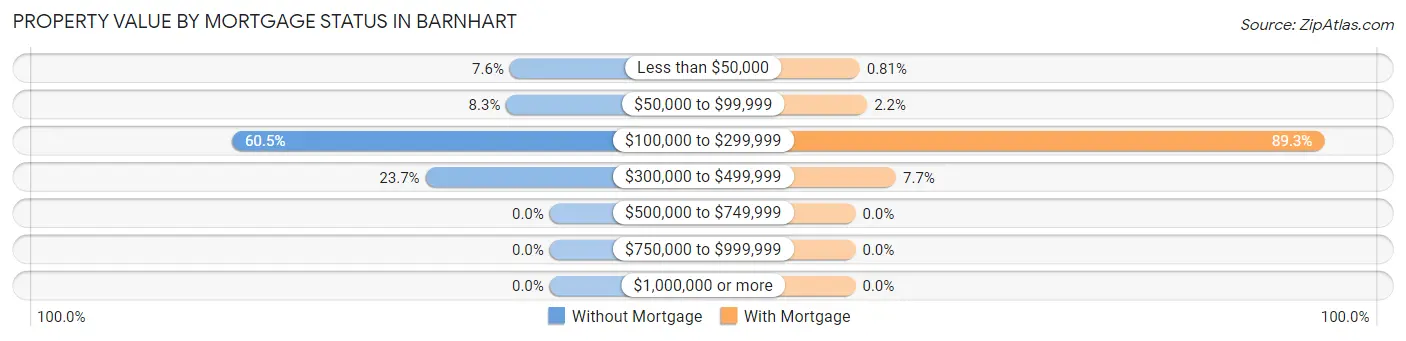
| Property Value | Without Mortgage | With Mortgage |
| Less than $50,000 | 34 (7.6%) | 12 (0.8%) |
| $50,000 to $99,999 | 37 (8.3%) | 33 (2.2%) |
| $100,000 to $299,999 | 271 (60.5%) | 1,329 (89.2%) |
| $300,000 to $499,999 | 106 (23.7%) | 115 (7.7%) |
| $500,000 to $749,999 | 0 (0.0%) | 0 (0.0%) |
| $750,000 to $999,999 | 0 (0.0%) | 0 (0.0%) |
| $1,000,000 or more | 0 (0.0%) | 0 (0.0%) |
| Total | 448 (100.0%) | 1,489 (100.0%) |
Household Income by Mortgage Status in Barnhart
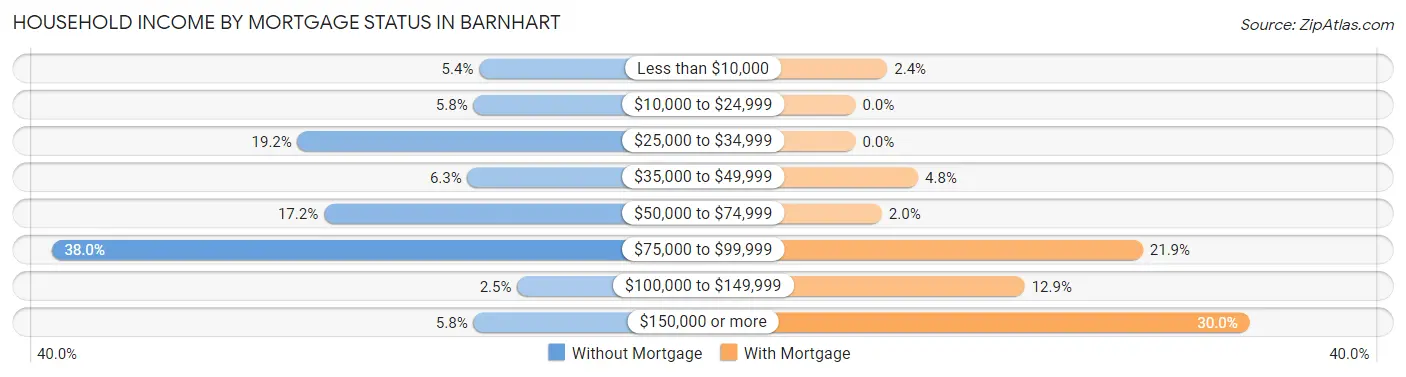
| Household Income | Without Mortgage | With Mortgage |
| Less than $10,000 | 24 (5.4%) | 36 (2.4%) |
| $10,000 to $24,999 | 26 (5.8%) | 0 (0.0%) |
| $25,000 to $34,999 | 86 (19.2%) | 0 (0.0%) |
| $35,000 to $49,999 | 28 (6.2%) | 71 (4.8%) |
| $50,000 to $74,999 | 77 (17.2%) | 30 (2.0%) |
| $75,000 to $99,999 | 170 (38.0%) | 326 (21.9%) |
| $100,000 to $149,999 | 11 (2.5%) | 192 (12.9%) |
| $150,000 or more | 26 (5.8%) | 447 (30.0%) |
| Total | 448 (100.0%) | 1,489 (100.0%) |
Property Value to Household Income Ratio in Barnhart
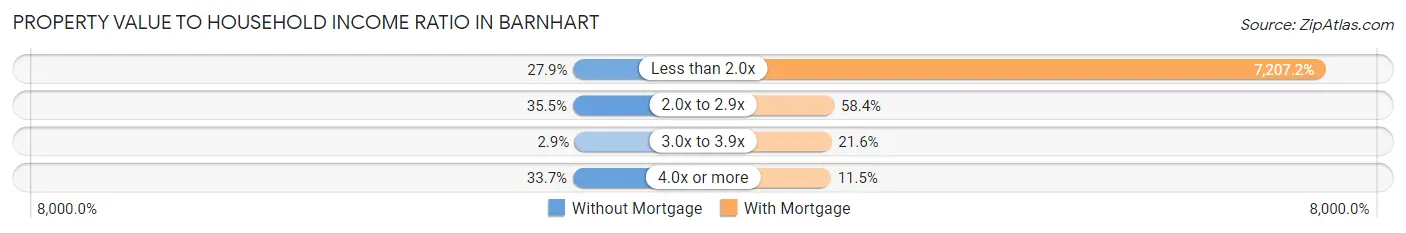
| Value-to-Income Ratio | Without Mortgage | With Mortgage |
| Less than 2.0x | 125 (27.9%) | 107,315 (7,207.2%) |
| 2.0x to 2.9x | 159 (35.5%) | 869 (58.4%) |
| 3.0x to 3.9x | 13 (2.9%) | 321 (21.6%) |
| 4.0x or more | 151 (33.7%) | 171 (11.5%) |
| Total | 448 (100.0%) | 1,489 (100.0%) |
Real Estate Taxes by Mortgage Status in Barnhart
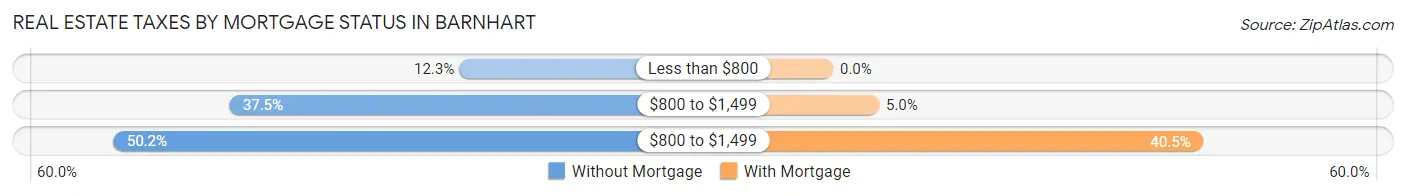
| Property Taxes | Without Mortgage | With Mortgage |
| Less than $800 | 55 (12.3%) | 0 (0.0%) |
| $800 to $1,499 | 168 (37.5%) | 75 (5.0%) |
| $800 to $1,499 | 225 (50.2%) | 603 (40.5%) |
| Total | 448 (100.0%) | 1,489 (100.0%) |
Health & Disability in Barnhart
Health Insurance Coverage by Age in Barnhart
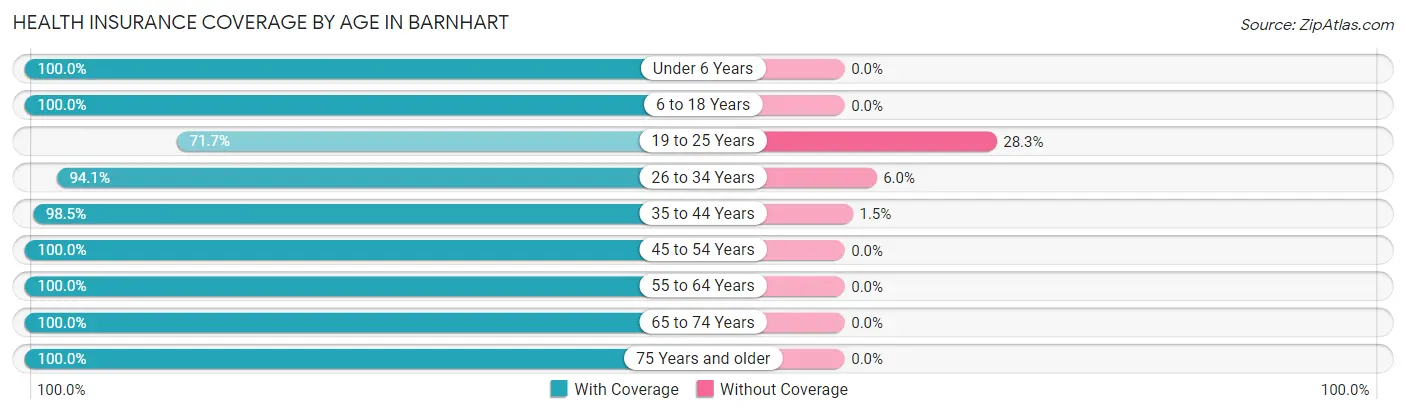
| Age Bracket | With Coverage | Without Coverage |
| Under 6 Years | 530 (100.0%) | 0 (0.0%) |
| 6 to 18 Years | 924 (100.0%) | 0 (0.0%) |
| 19 to 25 Years | 478 (71.7%) | 189 (28.3%) |
| 26 to 34 Years | 917 (94.1%) | 58 (5.9%) |
| 35 to 44 Years | 900 (98.5%) | 14 (1.5%) |
| 45 to 54 Years | 650 (100.0%) | 0 (0.0%) |
| 55 to 64 Years | 771 (100.0%) | 0 (0.0%) |
| 65 to 74 Years | 389 (100.0%) | 0 (0.0%) |
| 75 Years and older | 214 (100.0%) | 0 (0.0%) |
| Total | 5,773 (95.7%) | 261 (4.3%) |
Health Insurance Coverage by Citizenship Status in Barnhart

| Citizenship Status | With Coverage | Without Coverage |
| Native Born | 530 (100.0%) | 0 (0.0%) |
| Foreign Born, Citizen | 924 (100.0%) | 0 (0.0%) |
| Foreign Born, not a Citizen | 478 (71.7%) | 189 (28.3%) |
Health Insurance Coverage by Household Income in Barnhart
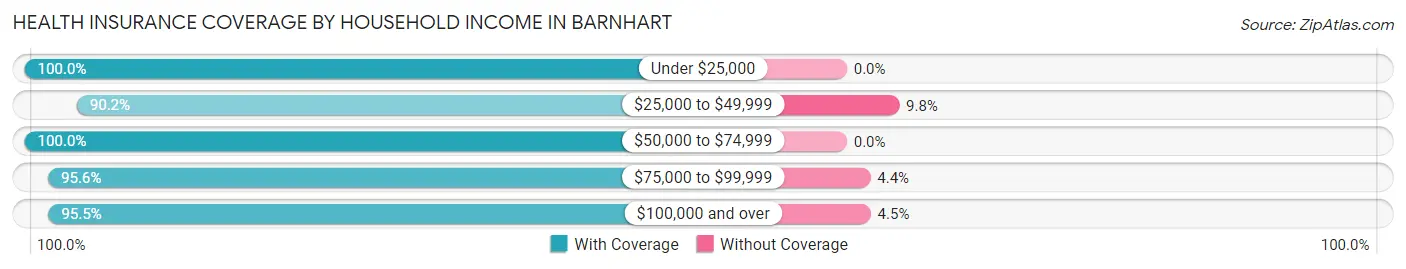
| Household Income | With Coverage | Without Coverage |
| Under $25,000 | 270 (100.0%) | 0 (0.0%) |
| $25,000 to $49,999 | 414 (90.2%) | 45 (9.8%) |
| $50,000 to $74,999 | 954 (100.0%) | 0 (0.0%) |
| $75,000 to $99,999 | 931 (95.6%) | 43 (4.4%) |
| $100,000 and over | 3,164 (95.5%) | 148 (4.5%) |
Public vs Private Health Insurance Coverage by Age in Barnhart
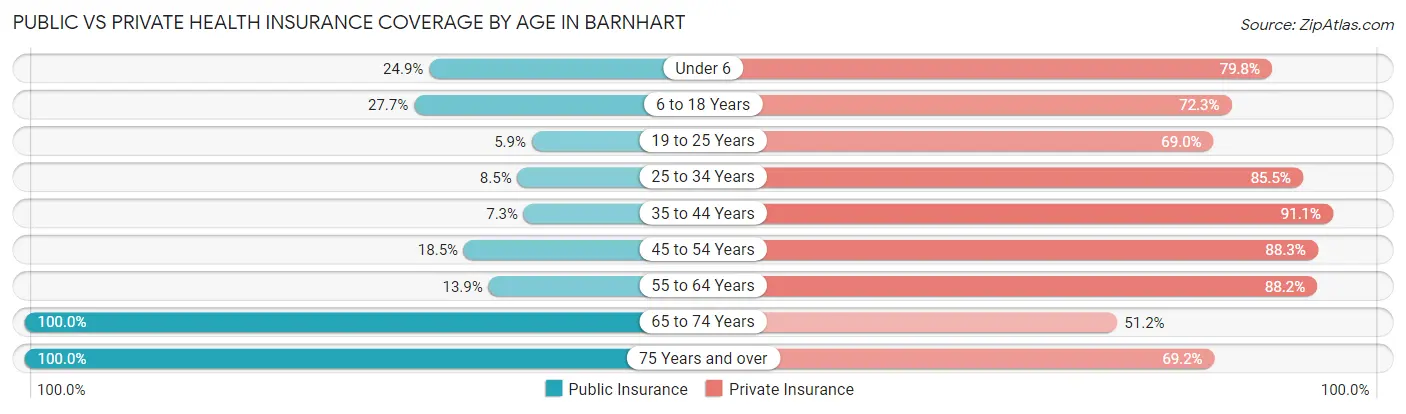
| Age Bracket | Public Insurance | Private Insurance |
| Under 6 | 132 (24.9%) | 423 (79.8%) |
| 6 to 18 Years | 256 (27.7%) | 668 (72.3%) |
| 19 to 25 Years | 39 (5.9%) | 460 (69.0%) |
| 25 to 34 Years | 83 (8.5%) | 834 (85.5%) |
| 35 to 44 Years | 67 (7.3%) | 833 (91.1%) |
| 45 to 54 Years | 120 (18.5%) | 574 (88.3%) |
| 55 to 64 Years | 107 (13.9%) | 680 (88.2%) |
| 65 to 74 Years | 389 (100.0%) | 199 (51.2%) |
| 75 Years and over | 214 (100.0%) | 148 (69.2%) |
| Total | 1,407 (23.3%) | 4,819 (79.9%) |
Disability Status by Sex by Age in Barnhart
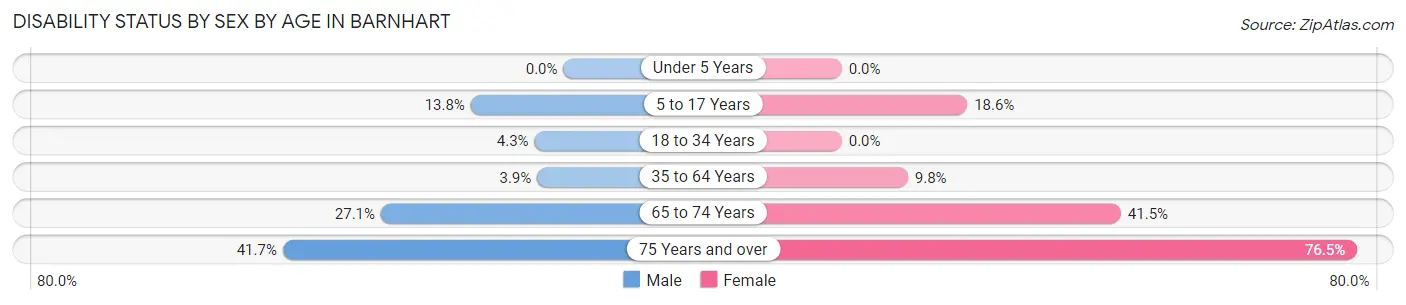
| Age Bracket | Male | Female |
| Under 5 Years | 0 (0.0%) | 0 (0.0%) |
| 5 to 17 Years | 60 (13.8%) | 73 (18.6%) |
| 18 to 34 Years | 36 (4.3%) | 0 (0.0%) |
| 35 to 64 Years | 49 (3.9%) | 106 (9.8%) |
| 65 to 74 Years | 42 (27.1%) | 97 (41.4%) |
| 75 Years and over | 20 (41.7%) | 127 (76.5%) |
Disability Class by Sex by Age in Barnhart
Disability Class: Hearing Difficulty
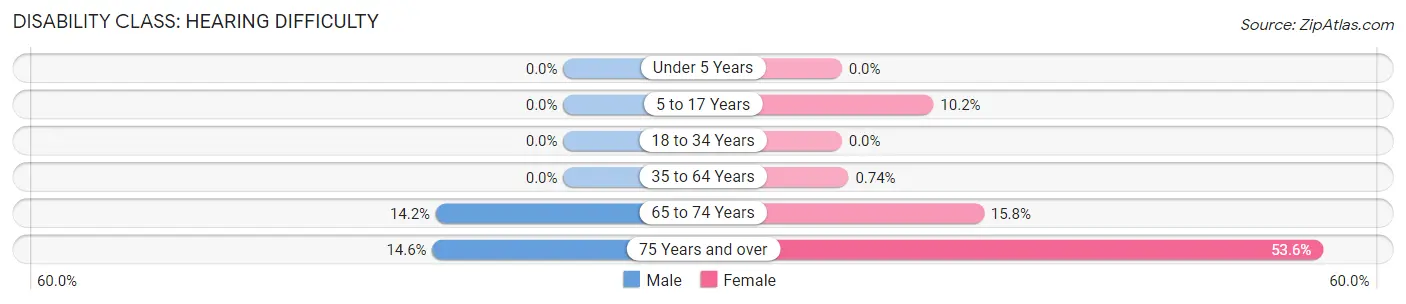
| Age Bracket | Male | Female |
| Under 5 Years | 0 (0.0%) | 0 (0.0%) |
| 5 to 17 Years | 0 (0.0%) | 40 (10.2%) |
| 18 to 34 Years | 0 (0.0%) | 0 (0.0%) |
| 35 to 64 Years | 0 (0.0%) | 8 (0.7%) |
| 65 to 74 Years | 22 (14.2%) | 37 (15.8%) |
| 75 Years and over | 7 (14.6%) | 89 (53.6%) |
Disability Class: Vision Difficulty
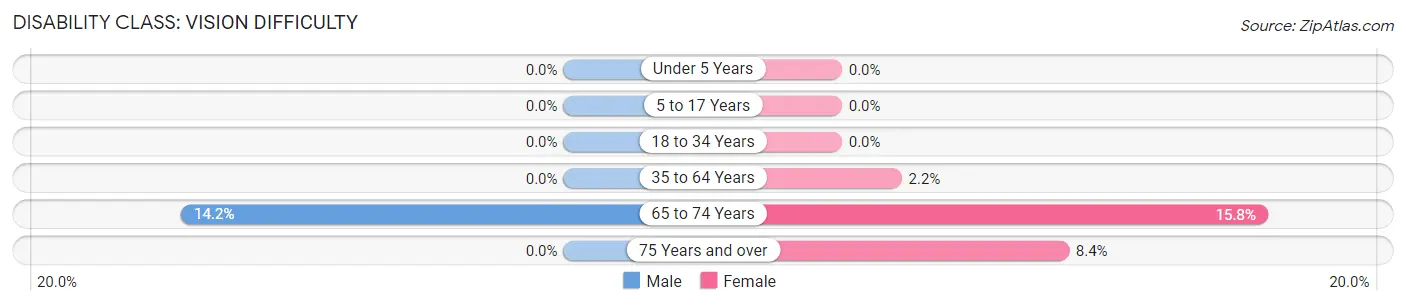
| Age Bracket | Male | Female |
| Under 5 Years | 0 (0.0%) | 0 (0.0%) |
| 5 to 17 Years | 0 (0.0%) | 0 (0.0%) |
| 18 to 34 Years | 0 (0.0%) | 0 (0.0%) |
| 35 to 64 Years | 0 (0.0%) | 24 (2.2%) |
| 65 to 74 Years | 22 (14.2%) | 37 (15.8%) |
| 75 Years and over | 0 (0.0%) | 14 (8.4%) |
Disability Class: Cognitive Difficulty
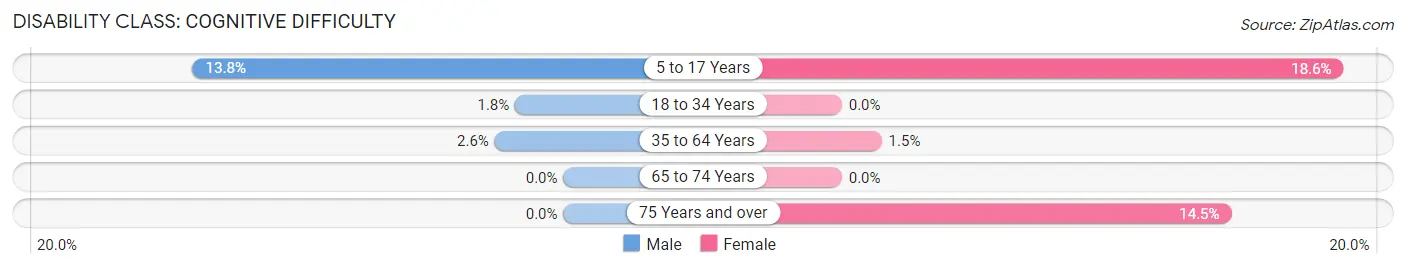
| Age Bracket | Male | Female |
| 5 to 17 Years | 60 (13.8%) | 73 (18.6%) |
| 18 to 34 Years | 15 (1.8%) | 0 (0.0%) |
| 35 to 64 Years | 32 (2.5%) | 16 (1.5%) |
| 65 to 74 Years | 0 (0.0%) | 0 (0.0%) |
| 75 Years and over | 0 (0.0%) | 24 (14.5%) |
Disability Class: Ambulatory Difficulty
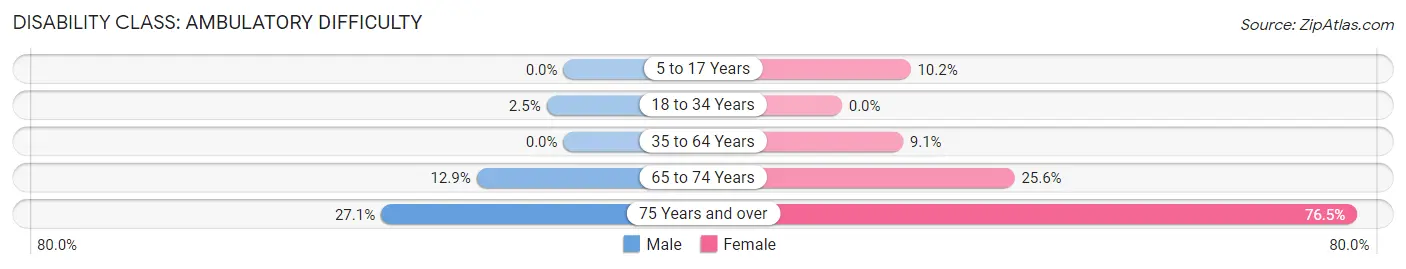
| Age Bracket | Male | Female |
| 5 to 17 Years | 0 (0.0%) | 40 (10.2%) |
| 18 to 34 Years | 21 (2.5%) | 0 (0.0%) |
| 35 to 64 Years | 0 (0.0%) | 98 (9.1%) |
| 65 to 74 Years | 20 (12.9%) | 60 (25.6%) |
| 75 Years and over | 13 (27.1%) | 127 (76.5%) |
Disability Class: Self-Care Difficulty
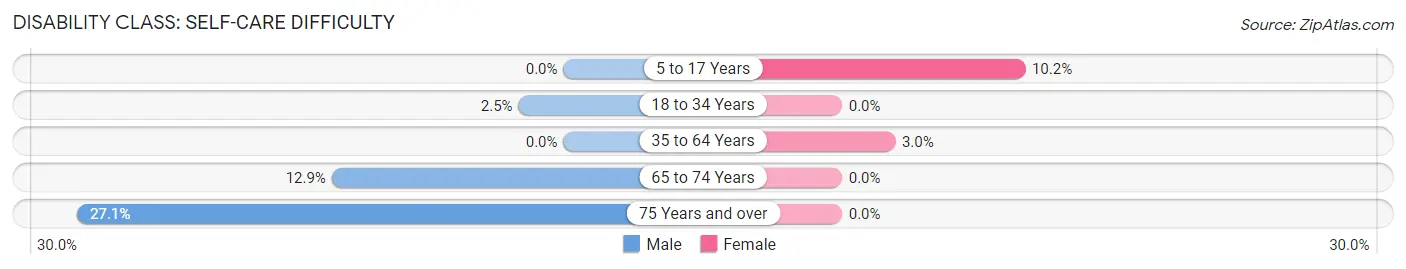
| Age Bracket | Male | Female |
| 5 to 17 Years | 0 (0.0%) | 40 (10.2%) |
| 18 to 34 Years | 21 (2.5%) | 0 (0.0%) |
| 35 to 64 Years | 0 (0.0%) | 32 (3.0%) |
| 65 to 74 Years | 20 (12.9%) | 0 (0.0%) |
| 75 Years and over | 13 (27.1%) | 0 (0.0%) |
Technology Access in Barnhart
Computing Device Access in Barnhart
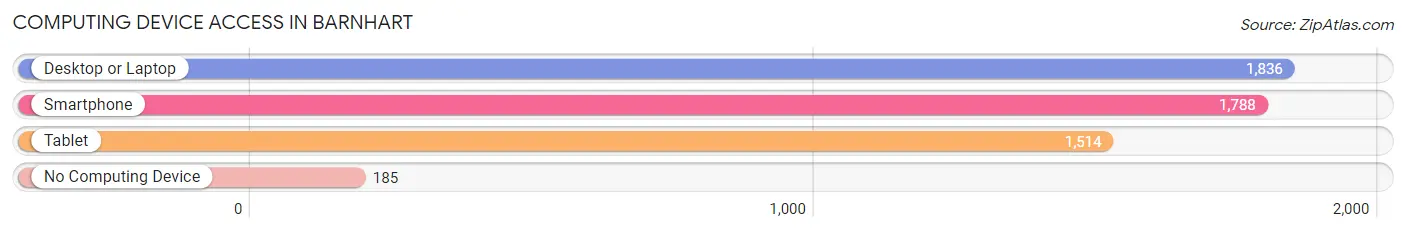
| Device Type | # Households | % Households |
| Desktop or Laptop | 1,836 | 81.4% |
| Smartphone | 1,788 | 79.3% |
| Tablet | 1,514 | 67.1% |
| No Computing Device | 185 | 8.2% |
| Total | 2,256 | 100.0% |
Internet Access in Barnhart
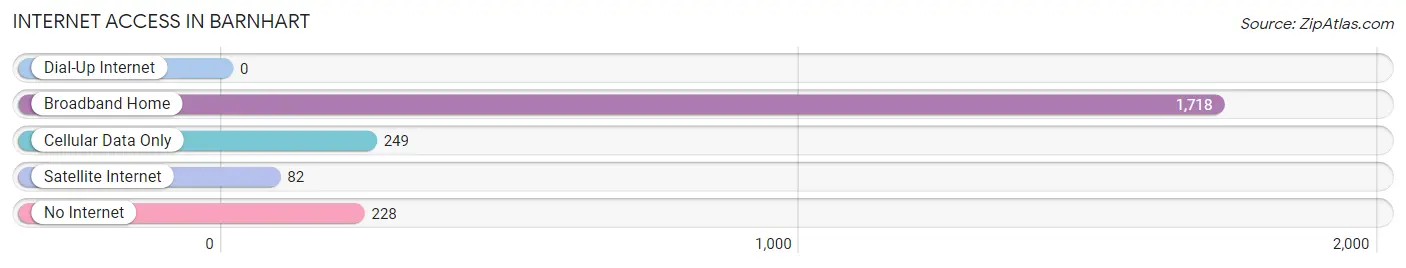
| Internet Type | # Households | % Households |
| Dial-Up Internet | 0 | 0.0% |
| Broadband Home | 1,718 | 76.1% |
| Cellular Data Only | 249 | 11.0% |
| Satellite Internet | 82 | 3.6% |
| No Internet | 228 | 10.1% |
| Total | 2,256 | 100.0% |
Barnhart Summary
Hart, Missouri is a small town located in Jefferson County, Missouri. It is situated on the banks of the Big River, and is home to a population of approximately 1,000 people. The town was founded in 1845 by a group of settlers from Kentucky, and was named after one of the settlers, William Hart.
Hart is located in the Ozark Mountains, and is surrounded by rolling hills and lush forests. The town is situated at an elevation of 890 feet, and is located approximately 30 miles south of St. Louis. The climate in Hart is humid subtropical, with hot summers and mild winters.
The economy of Hart is largely based on agriculture, with the majority of the population employed in farming and related activities. The town is also home to several small businesses, including a grocery store, a hardware store, and a few restaurants.
The demographics of Hart are largely white, with a small African American population. The median household income is approximately $35,000, and the median home value is around $90,000. The town is served by the Jefferson County School District, and is home to a number of churches.
Hart is a small, rural town with a rich history and a strong sense of community. The town is home to a variety of recreational activities, including fishing, hunting, and camping. The town is also home to a number of historic sites, including the Hart Cemetery, which dates back to the early 1800s.
Hart is a great place to live and work, and is a great place to raise a family. The town is a great place to experience the beauty of the Ozarks, and to enjoy the peace and quiet of small-town life.
Common Questions
What is Per Capita Income in Barnhart?
Per Capita income in Barnhart is $43,220.
What is the Median Family Income in Barnhart?
Median Family Income in Barnhart is $91,932.
What is the Median Household income in Barnhart?
Median Household Income in Barnhart is $91,864.
What is Income or Wage Gap in Barnhart?
Income or Wage Gap in Barnhart is 28.0%.
Women in Barnhart earn 72.0 cents for every dollar earned by a man.
What is Inequality or Gini Index in Barnhart?
Inequality or Gini Index in Barnhart is 0.35.
What is the Total Population of Barnhart?
Total Population of Barnhart is 6,040.
What is the Total Male Population of Barnhart?
Total Male Population of Barnhart is 3,118.
What is the Total Female Population of Barnhart?
Total Female Population of Barnhart is 2,922.
What is the Ratio of Males per 100 Females in Barnhart?
There are 106.71 Males per 100 Females in Barnhart.
What is the Ratio of Females per 100 Males in Barnhart?
There are 93.71 Females per 100 Males in Barnhart.
What is the Median Population Age in Barnhart?
Median Population Age in Barnhart is 33.7 Years.
What is the Average Family Size in Barnhart
Average Family Size in Barnhart is 2.8 People.
What is the Average Household Size in Barnhart
Average Household Size in Barnhart is 2.6 People.
How Large is the Labor Force in Barnhart?
There are 3,416 People in the Labor Forcein in Barnhart.
What is the Percentage of People in the Labor Force in Barnhart?
70.8% of People are in the Labor Force in Barnhart.
What is the Unemployment Rate in Barnhart?
Unemployment Rate in Barnhart is 1.8%.