Zip Codes with the Highest Percentage of Population Employed in Farming, Fishing & Forestry in Ballwin, MO
RELATED REPORTS & OPTIONS
Select to Compare
Select to Compare
Compare Zip Codes
Map of Zip Codes with the Highest Percentage of Population Employed in Farming, Fishing & Forestry in Ballwin
0.082%
0.082%
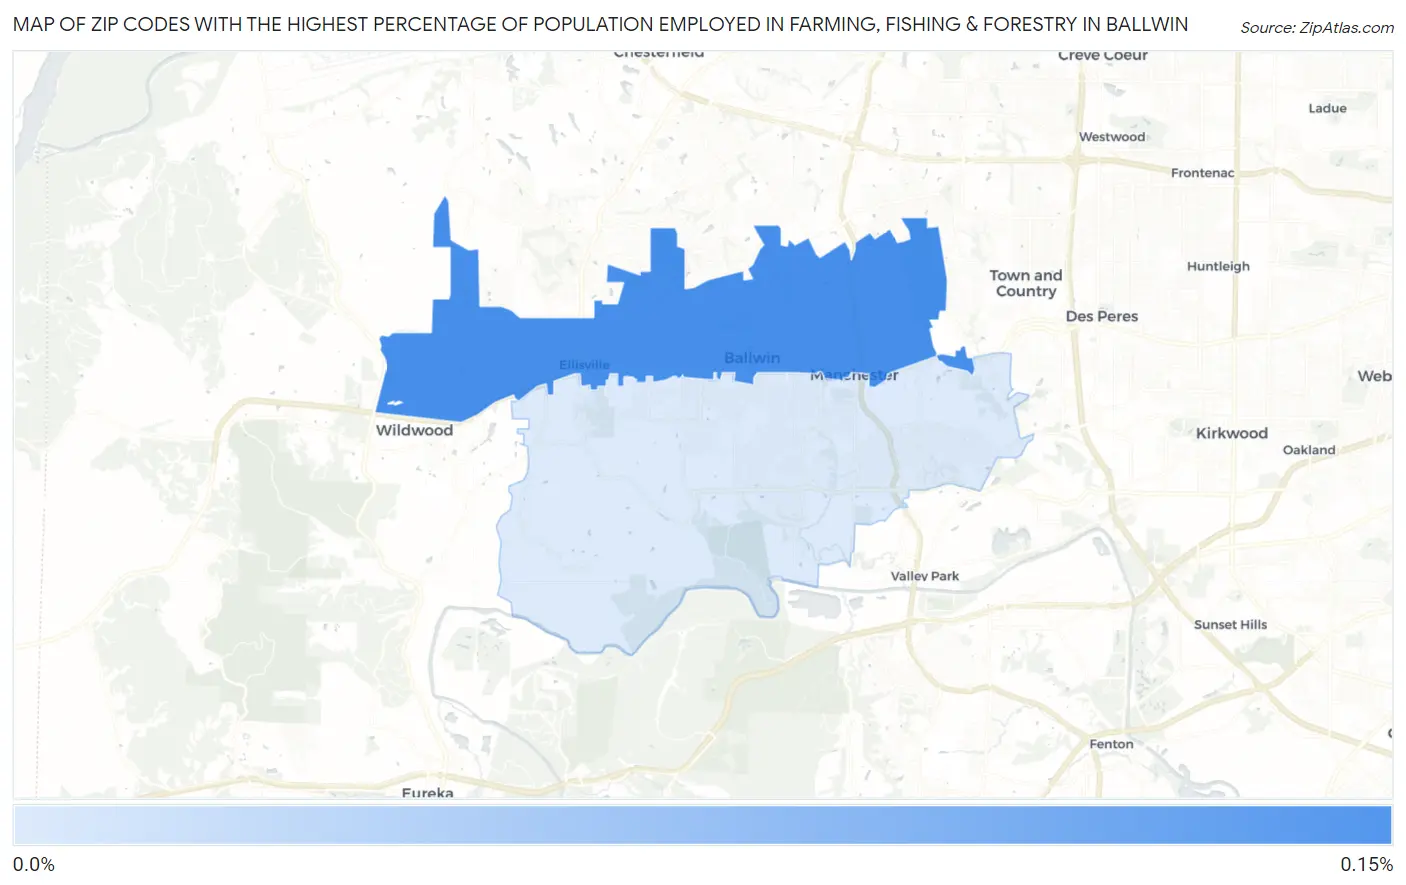
Zip Codes with the Highest Percentage of Population Employed in Farming, Fishing & Forestry in Ballwin, MO
| Zip Code | % Employed | vs State | vs National | |
| 1. | 63011 | 0.082% | 0.49%(-0.407)#578 | 0.61%(-0.523)#18,082 |
1
Common Questions
What are the Top Zip Codes with the Highest Percentage of Population Employed in Farming, Fishing & Forestry in Ballwin, MO?
Top Zip Codes with the Highest Percentage of Population Employed in Farming, Fishing & Forestry in Ballwin, MO are:
What zip code has the Highest Percentage of Population Employed in Farming, Fishing & Forestry in Ballwin, MO?
63011 has the Highest Percentage of Population Employed in Farming, Fishing & Forestry in Ballwin, MO with 0.082%.
What is the Percentage of Population Employed in Farming, Fishing & Forestry in Ballwin, MO?
Percentage of Population Employed in Farming, Fishing & Forestry in Ballwin is 0.093%.
What is the Percentage of Population Employed in Farming, Fishing & Forestry in Missouri?
Percentage of Population Employed in Farming, Fishing & Forestry in Missouri is 0.49%.
What is the Percentage of Population Employed in Farming, Fishing & Forestry in the United States?
Percentage of Population Employed in Farming, Fishing & Forestry in the United States is 0.61%.