Ava, MO Map & Demographics
Ava Map
Ava Overview
$24,280
PER CAPITA INCOME
$59,513
AVG FAMILY INCOME
$43,969
AVG HOUSEHOLD INCOME
25.8%
WAGE / INCOME GAP [ % ]
74.2¢/ $1
WAGE / INCOME GAP [ $ ]
0.48
INEQUALITY / GINI INDEX
2,933
TOTAL POPULATION
1,413
MALE POPULATION
1,520
FEMALE POPULATION
92.96
MALES / 100 FEMALES
107.57
FEMALES / 100 MALES
38.8
MEDIAN AGE
3.3
AVG FAMILY SIZE
2.6
AVG HOUSEHOLD SIZE
1,130
LABOR FORCE [ PEOPLE ]
52.0%
PERCENT IN LABOR FORCE
8.5%
UNEMPLOYMENT RATE
Ava Zip Codes
Ava Area Codes
Income in Ava
Income Overview in Ava
Per Capita Income in Ava is $24,280, while median incomes of families and households are $59,513 and $43,969 respectively.
| Characteristic | Number | Measure |
| Per Capita Income | 2,933 | $24,280 |
| Median Family Income | 651 | $59,513 |
| Mean Family Income | 651 | $80,438 |
| Median Household Income | 1,087 | $43,969 |
| Mean Household Income | 1,087 | $60,308 |
| Income Deficit | 651 | $0 |
| Wage / Income Gap (%) | 2,933 | 25.78% |
| Wage / Income Gap ($) | 2,933 | 74.22¢ per $1 |
| Gini / Inequality Index | 2,933 | 0.48 |
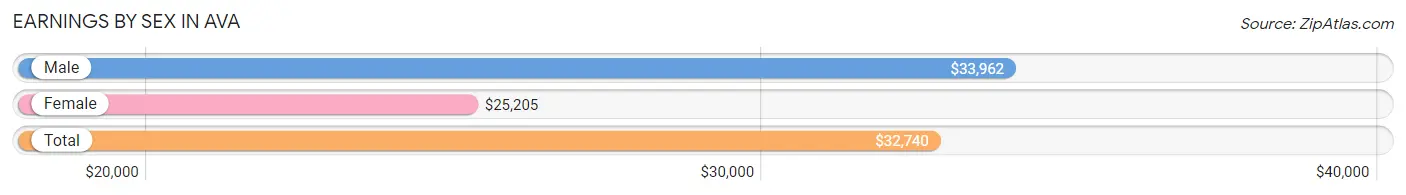
Earnings by Sex in Ava
Average Earnings in Ava are $32,740, $33,962 for men and $25,205 for women, a difference of 25.8%.
| Sex | Number | Average Earnings |
| Male | 615 (54.1%) | $33,962 |
| Female | 521 (45.9%) | $25,205 |
| Total | 1,136 (100.0%) | $32,740 |
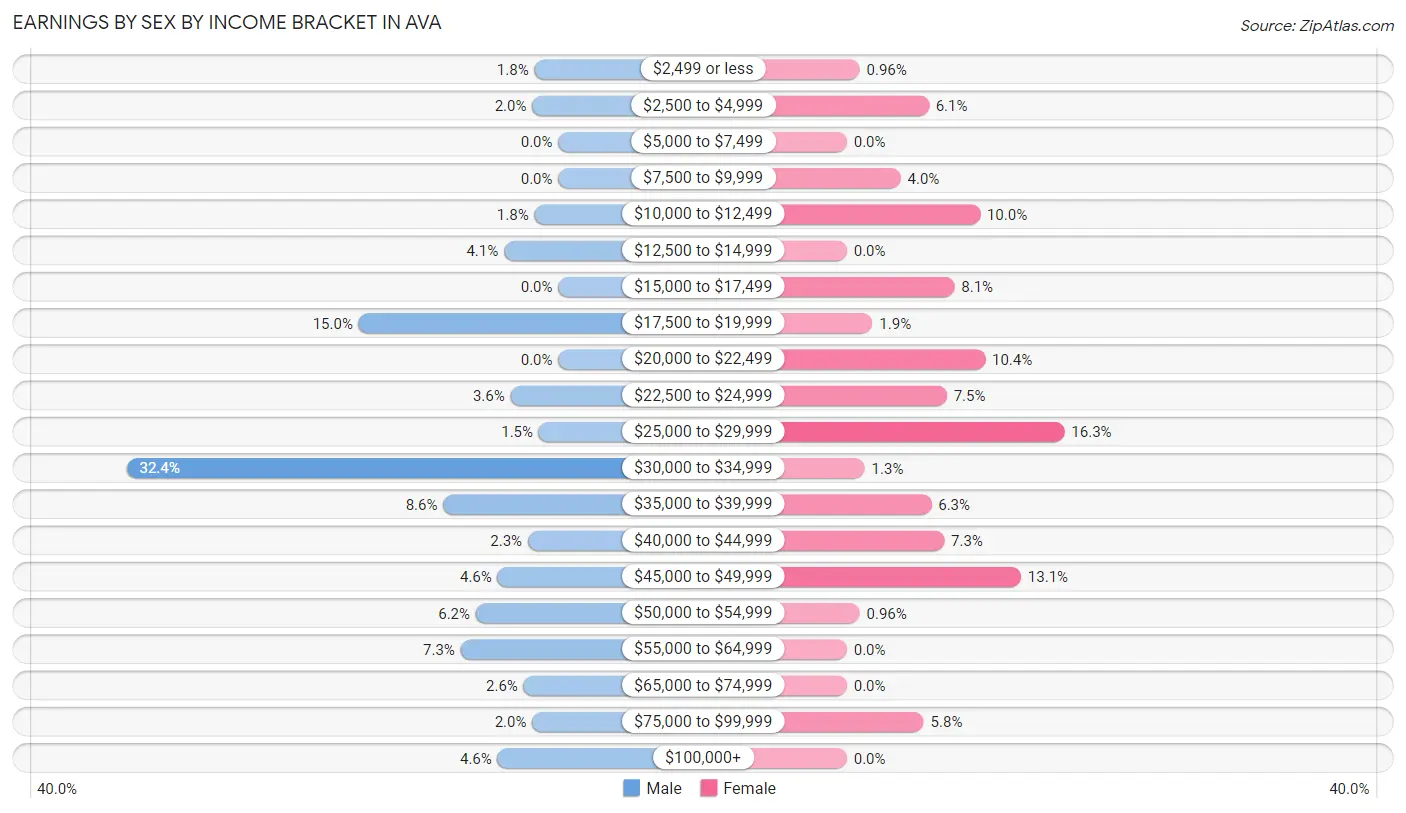
Earnings by Sex by Income Bracket in Ava
The most common earnings brackets in Ava are $30,000 to $34,999 for men (199 | 32.4%) and $25,000 to $29,999 for women (85 | 16.3%).
| Income | Male | Female |
| $2,499 or less | 11 (1.8%) | 5 (1.0%) |
| $2,500 to $4,999 | 12 (1.9%) | 32 (6.1%) |
| $5,000 to $7,499 | 0 (0.0%) | 0 (0.0%) |
| $7,500 to $9,999 | 0 (0.0%) | 21 (4.0%) |
| $10,000 to $12,499 | 11 (1.8%) | 52 (10.0%) |
| $12,500 to $14,999 | 25 (4.1%) | 0 (0.0%) |
| $15,000 to $17,499 | 0 (0.0%) | 42 (8.1%) |
| $17,500 to $19,999 | 92 (15.0%) | 10 (1.9%) |
| $20,000 to $22,499 | 0 (0.0%) | 54 (10.4%) |
| $22,500 to $24,999 | 22 (3.6%) | 39 (7.5%) |
| $25,000 to $29,999 | 9 (1.5%) | 85 (16.3%) |
| $30,000 to $34,999 | 199 (32.4%) | 7 (1.3%) |
| $35,000 to $39,999 | 53 (8.6%) | 33 (6.3%) |
| $40,000 to $44,999 | 14 (2.3%) | 38 (7.3%) |
| $45,000 to $49,999 | 28 (4.5%) | 68 (13.1%) |
| $50,000 to $54,999 | 38 (6.2%) | 5 (1.0%) |
| $55,000 to $64,999 | 45 (7.3%) | 0 (0.0%) |
| $65,000 to $74,999 | 16 (2.6%) | 0 (0.0%) |
| $75,000 to $99,999 | 12 (1.9%) | 30 (5.8%) |
| $100,000+ | 28 (4.5%) | 0 (0.0%) |
| Total | 615 (100.0%) | 521 (100.0%) |
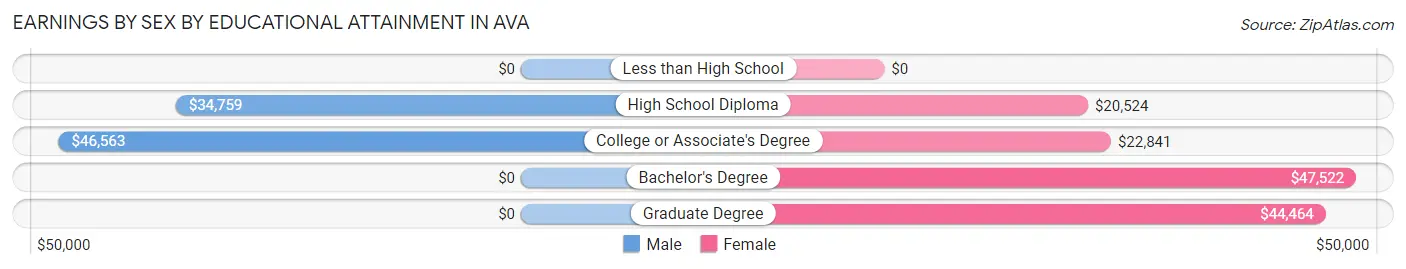
Earnings by Sex by Educational Attainment in Ava
Average earnings in Ava are $34,653 for men and $28,750 for women, a difference of 17.0%. Men with an educational attainment of college or associate's degree enjoy the highest average annual earnings of $46,563, while those with high school diploma education earn the least with $34,759. Women with an educational attainment of bachelor's degree earn the most with the average annual earnings of $47,522, while those with high school diploma education have the smallest earnings of $20,524.
| Educational Attainment | Male Income | Female Income |
| Less than High School | - | - |
| High School Diploma | $34,759 | $20,524 |
| College or Associate's Degree | $46,563 | $22,841 |
| Bachelor's Degree | - | - |
| Graduate Degree | - | - |
| Total | $34,653 | $28,750 |
Family Income in Ava
Family Income Brackets in Ava
According to the Ava family income data, there are 219 families falling into the $50,000 to $74,999 income range, which is the most common income bracket and makes up 33.6% of all families.
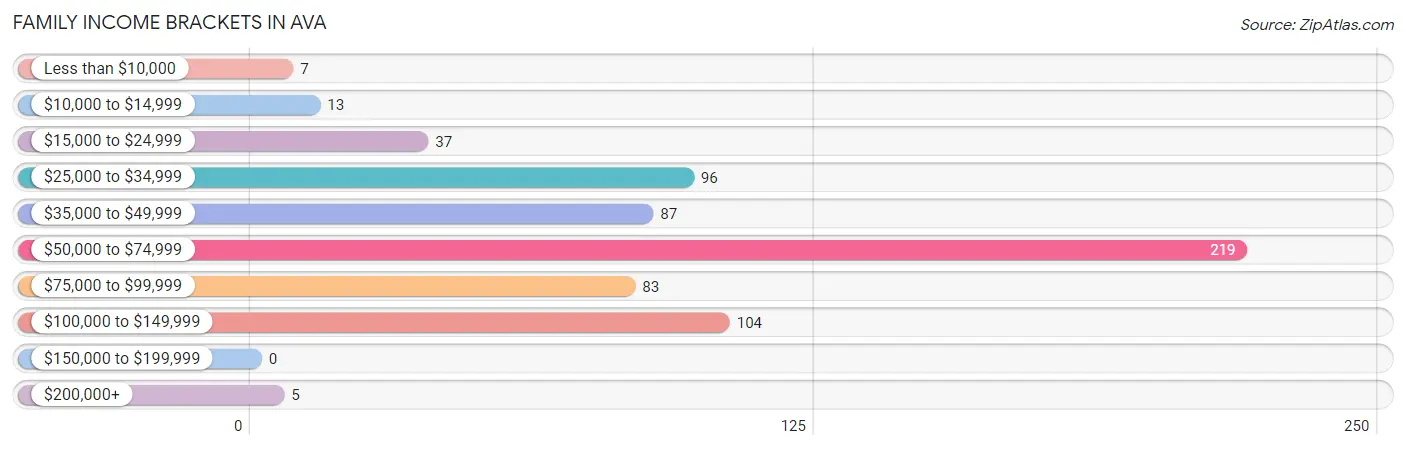
| Income Bracket | # Families | % Families |
| Less than $10,000 | 7 | 1.1% |
| $10,000 to $14,999 | 13 | 2.0% |
| $15,000 to $24,999 | 37 | 5.7% |
| $25,000 to $34,999 | 96 | 14.7% |
| $35,000 to $49,999 | 87 | 13.4% |
| $50,000 to $74,999 | 219 | 33.6% |
| $75,000 to $99,999 | 83 | 12.7% |
| $100,000 to $149,999 | 104 | 16.0% |
| $150,000 to $199,999 | 0 | 0.0% |
| $200,000+ | 5 | 0.8% |
Family Income by Famaliy Size in Ava
3-person families (298 | 45.8%) account for the highest median family income in Ava with $60,902 per family, while 2-person families (209 | 32.1%) have the highest median income of $29,152 per family member.
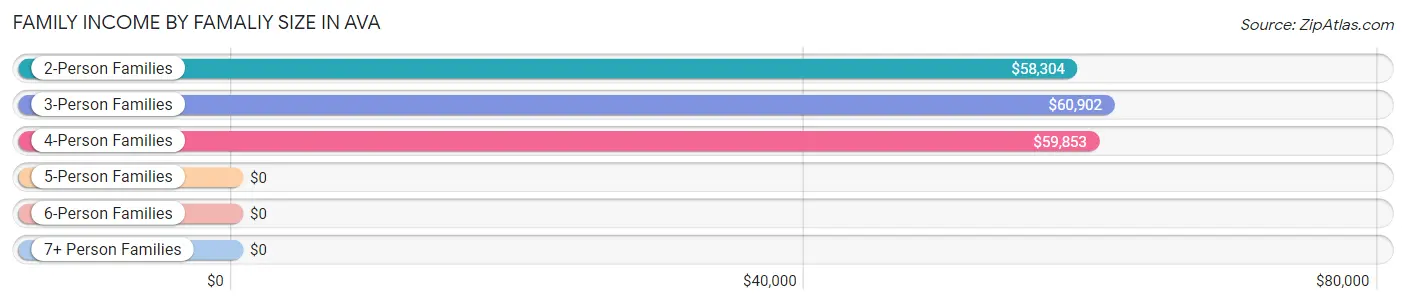
| Income Bracket | # Families | Median Income |
| 2-Person Families | 209 (32.1%) | $58,304 |
| 3-Person Families | 298 (45.8%) | $60,902 |
| 4-Person Families | 80 (12.3%) | $59,853 |
| 5-Person Families | 43 (6.6%) | $0 |
| 6-Person Families | 21 (3.2%) | $0 |
| 7+ Person Families | 0 (0.0%) | $0 |
| Total | 651 (100.0%) | $59,513 |
Family Income by Number of Earners in Ava
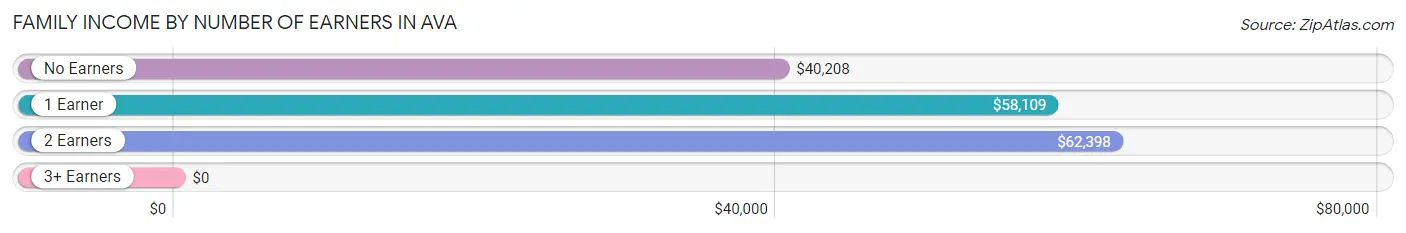
| Number of Earners | # Families | Median Income |
| No Earners | 119 (18.3%) | $40,208 |
| 1 Earner | 176 (27.0%) | $58,109 |
| 2 Earners | 351 (53.9%) | $62,398 |
| 3+ Earners | 5 (0.8%) | $0 |
| Total | 651 (100.0%) | $59,513 |
Household Income in Ava
Household Income Brackets in Ava
With 318 households falling in the category, the $50,000 to $74,999 income range is the most frequent in Ava, accounting for 29.2% of all households. In contrast, only 3 households (0.3%) fall into the $150,000 to $199,999 income bracket, making it the least populous group.
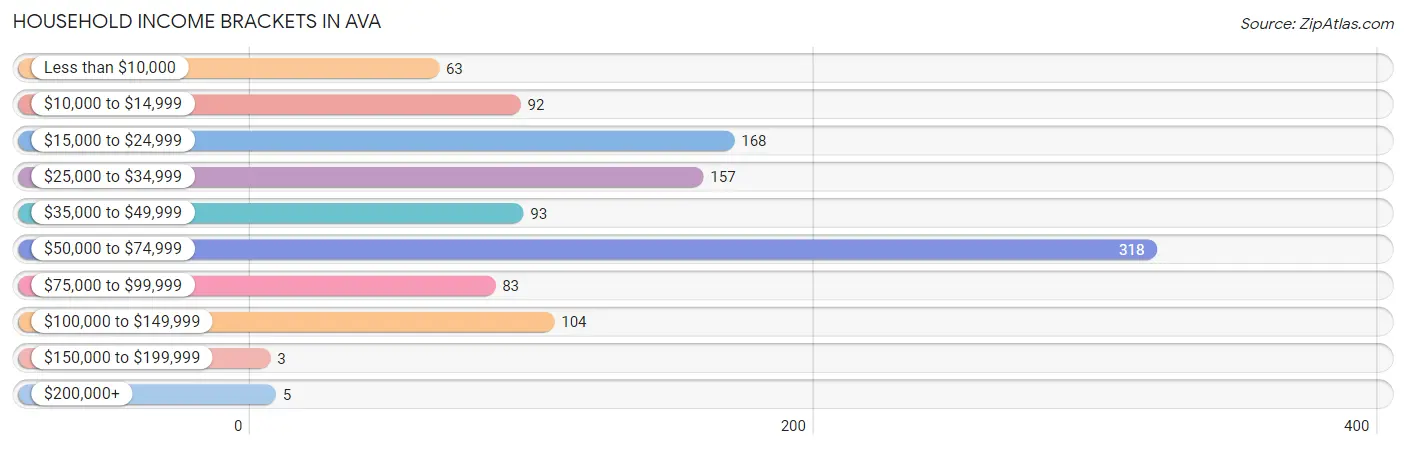
| Income Bracket | # Households | % Households |
| Less than $10,000 | 63 | 5.8% |
| $10,000 to $14,999 | 92 | 8.5% |
| $15,000 to $24,999 | 168 | 15.5% |
| $25,000 to $34,999 | 157 | 14.4% |
| $35,000 to $49,999 | 93 | 8.6% |
| $50,000 to $74,999 | 318 | 29.3% |
| $75,000 to $99,999 | 83 | 7.6% |
| $100,000 to $149,999 | 104 | 9.6% |
| $150,000 to $199,999 | 3 | 0.3% |
| $200,000+ | 5 | 0.5% |
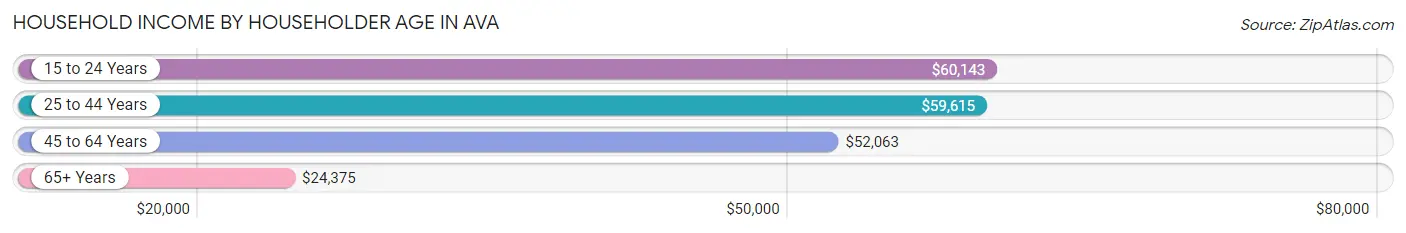
Household Income by Householder Age in Ava
The median household income in Ava is $43,969, with the highest median household income of $60,143 found in the 15 to 24 years age bracket for the primary householder. A total of 125 households (11.5%) fall into this category. Meanwhile, the 65+ years age bracket for the primary householder has the lowest median household income of $24,375, with 331 households (30.4%) in this group.
| Income Bracket | # Households | Median Income |
| 15 to 24 Years | 125 (11.5%) | $60,143 |
| 25 to 44 Years | 288 (26.5%) | $59,615 |
| 45 to 64 Years | 343 (31.6%) | $52,063 |
| 65+ Years | 331 (30.4%) | $24,375 |
| Total | 1,087 (100.0%) | $43,969 |
Poverty in Ava
Income Below Poverty by Sex and Age in Ava
With 23.3% poverty level for males and 18.4% for females among the residents of Ava, 15 year old males and 12 to 14 year old females are the most vulnerable to poverty, with 48 males (100.0%) and 49 females (100.0%) in their respective age groups living below the poverty level.
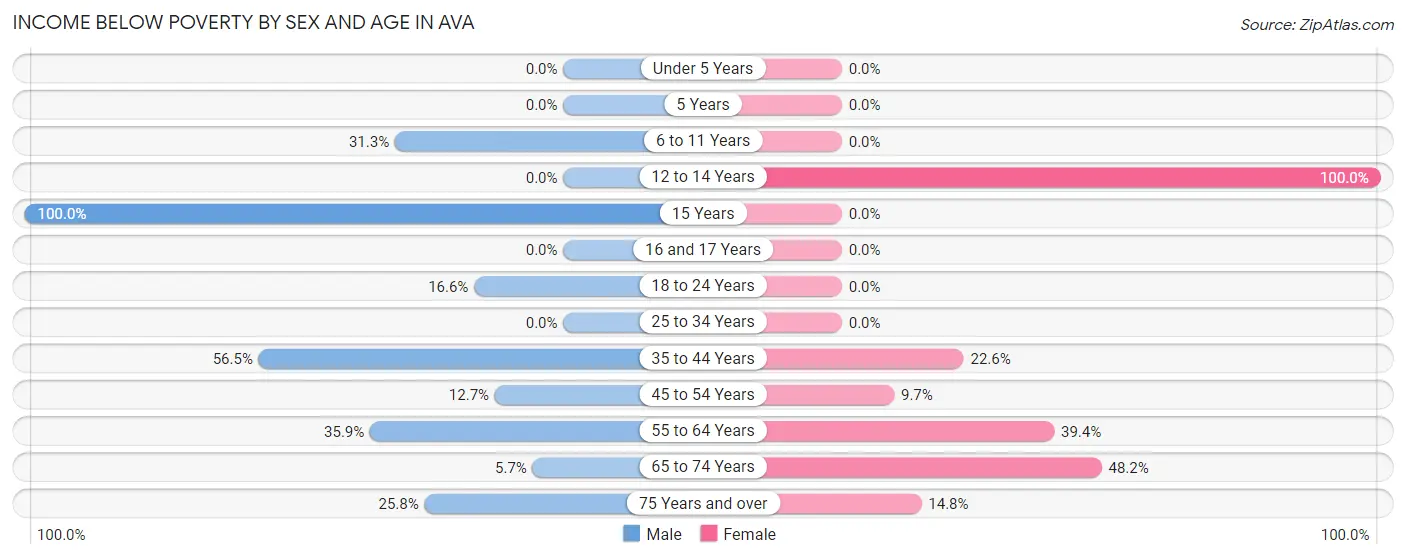
| Age Bracket | Male | Female |
| Under 5 Years | 0 (0.0%) | 0 (0.0%) |
| 5 Years | 0 (0.0%) | 0 (0.0%) |
| 6 to 11 Years | 35 (31.2%) | 0 (0.0%) |
| 12 to 14 Years | 0 (0.0%) | 49 (100.0%) |
| 15 Years | 48 (100.0%) | 0 (0.0%) |
| 16 and 17 Years | 0 (0.0%) | 0 (0.0%) |
| 18 to 24 Years | 23 (16.6%) | 0 (0.0%) |
| 25 to 34 Years | 0 (0.0%) | 0 (0.0%) |
| 35 to 44 Years | 121 (56.5%) | 47 (22.6%) |
| 45 to 54 Years | 24 (12.7%) | 13 (9.7%) |
| 55 to 64 Years | 33 (35.9%) | 39 (39.4%) |
| 65 to 74 Years | 7 (5.7%) | 108 (48.2%) |
| 75 Years and over | 25 (25.8%) | 13 (14.8%) |
| Total | 316 (23.3%) | 269 (18.4%) |
Income Above Poverty by Sex and Age in Ava
According to the poverty statistics in Ava, males aged under 5 years and females aged under 5 years are the age groups that are most secure financially, with 100.0% of males and 100.0% of females in these age groups living above the poverty line.
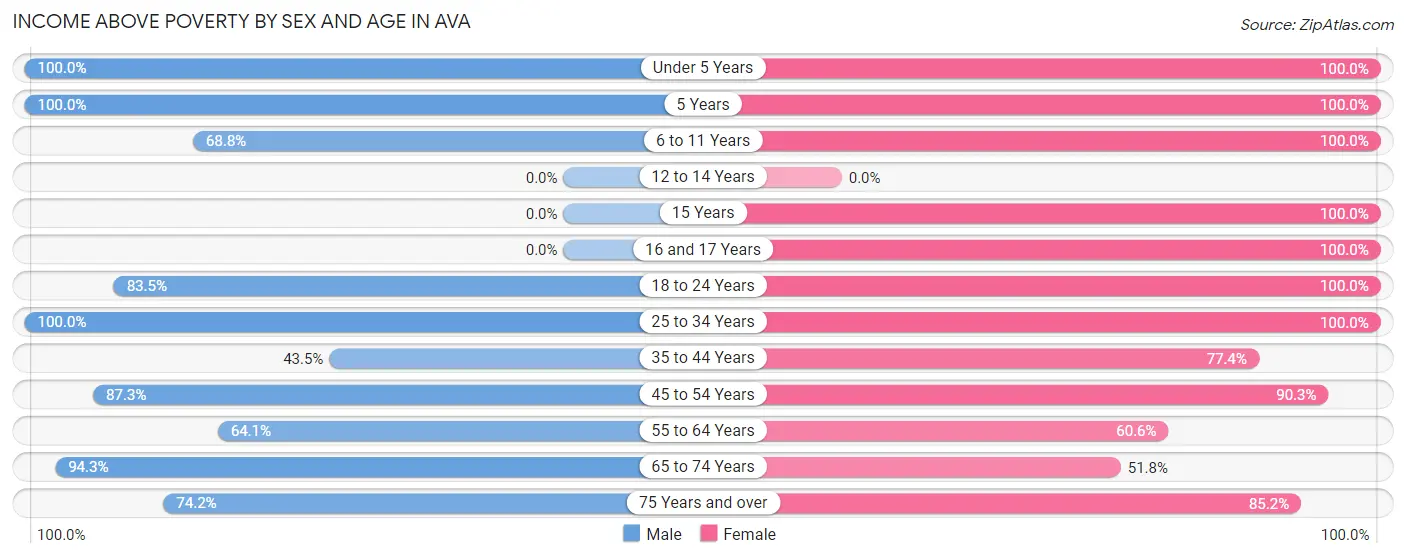
| Age Bracket | Male | Female |
| Under 5 Years | 83 (100.0%) | 116 (100.0%) |
| 5 Years | 53 (100.0%) | 25 (100.0%) |
| 6 to 11 Years | 77 (68.8%) | 202 (100.0%) |
| 12 to 14 Years | 0 (0.0%) | 0 (0.0%) |
| 15 Years | 0 (0.0%) | 72 (100.0%) |
| 16 and 17 Years | 0 (0.0%) | 31 (100.0%) |
| 18 to 24 Years | 116 (83.5%) | 120 (100.0%) |
| 25 to 34 Years | 204 (100.0%) | 97 (100.0%) |
| 35 to 44 Years | 93 (43.5%) | 161 (77.4%) |
| 45 to 54 Years | 165 (87.3%) | 121 (90.3%) |
| 55 to 64 Years | 59 (64.1%) | 60 (60.6%) |
| 65 to 74 Years | 116 (94.3%) | 116 (51.8%) |
| 75 Years and over | 72 (74.2%) | 75 (85.2%) |
| Total | 1,038 (76.7%) | 1,196 (81.6%) |
Income Below Poverty Among Married-Couple Families in Ava
The poverty statistics for married-couple families in Ava show that 1.6% or 7 of the total 443 families live below the poverty line. Families with no children have the highest poverty rate of 3.5%, comprising of 7 families. On the other hand, families with 1 or 2 children have the lowest poverty rate of 0.0%, which includes 0 families.
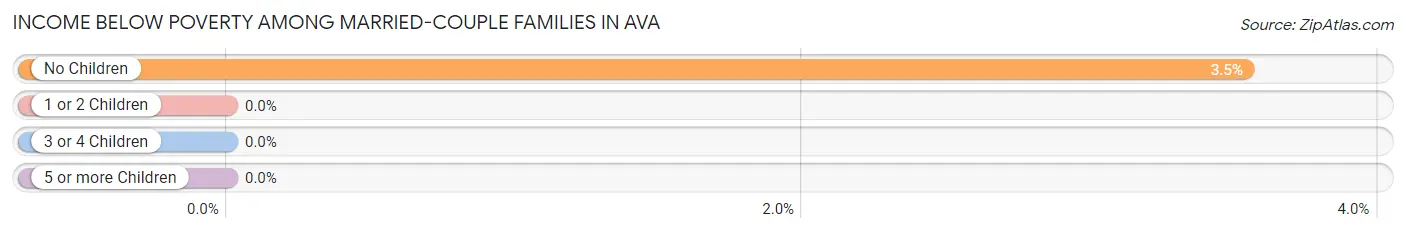
| Children | Above Poverty | Below Poverty |
| No Children | 191 (96.5%) | 7 (3.5%) |
| 1 or 2 Children | 202 (100.0%) | 0 (0.0%) |
| 3 or 4 Children | 43 (100.0%) | 0 (0.0%) |
| 5 or more Children | 0 (0.0%) | 0 (0.0%) |
| Total | 436 (98.4%) | 7 (1.6%) |
Income Below Poverty Among Single-Parent Households in Ava
According to the poverty data in Ava, 37.3% or 28 single-father households and 4.5% or 6 single-mother households are living below the poverty line. Among single-father households, those with 3 or 4 children have the highest poverty rate, with 21 households (46.7%) experiencing poverty. Likewise, among single-mother households, those with 1 or 2 children have the highest poverty rate, with 6 households (5.7%) falling below the poverty line.
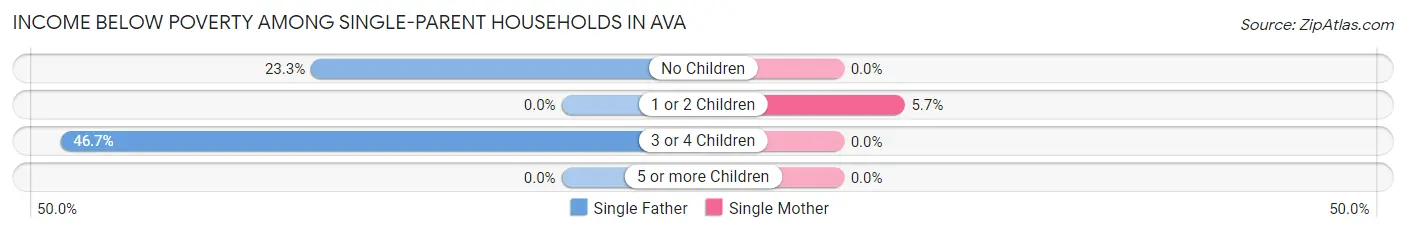
| Children | Single Father | Single Mother |
| No Children | 7 (23.3%) | 0 (0.0%) |
| 1 or 2 Children | 0 (0.0%) | 6 (5.7%) |
| 3 or 4 Children | 21 (46.7%) | 0 (0.0%) |
| 5 or more Children | 0 (0.0%) | 0 (0.0%) |
| Total | 28 (37.3%) | 6 (4.5%) |
Income Below Poverty Among Married-Couple vs Single-Parent Households in Ava
The poverty data for Ava shows that 7 of the married-couple family households (1.6%) and 34 of the single-parent households (16.4%) are living below the poverty level. Within the married-couple family households, those with no children have the highest poverty rate, with 7 households (3.5%) falling below the poverty line. Among the single-parent households, those with 3 or 4 children have the highest poverty rate, with 21 household (46.7%) living below poverty.
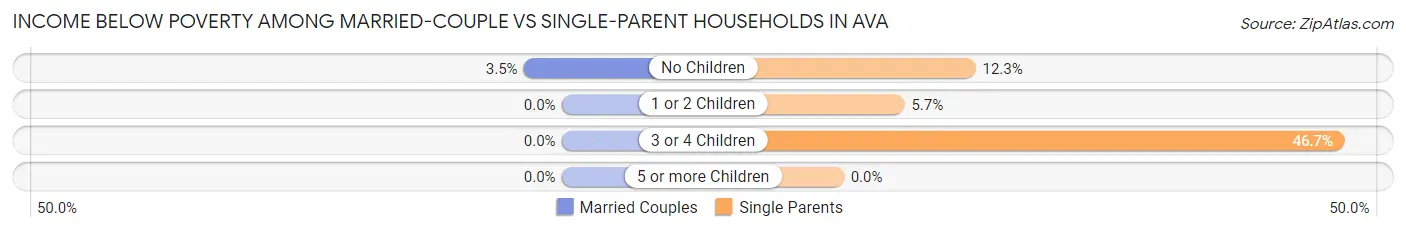
| Children | Married-Couple Families | Single-Parent Households |
| No Children | 7 (3.5%) | 7 (12.3%) |
| 1 or 2 Children | 0 (0.0%) | 6 (5.7%) |
| 3 or 4 Children | 0 (0.0%) | 21 (46.7%) |
| 5 or more Children | 0 (0.0%) | 0 (0.0%) |
| Total | 7 (1.6%) | 34 (16.4%) |
Race in Ava
The most populous races in Ava are White / Caucasian (2,907 | 99.1%), Two or more Races (16 | 0.5%), and Hispanic or Latino (15 | 0.5%).
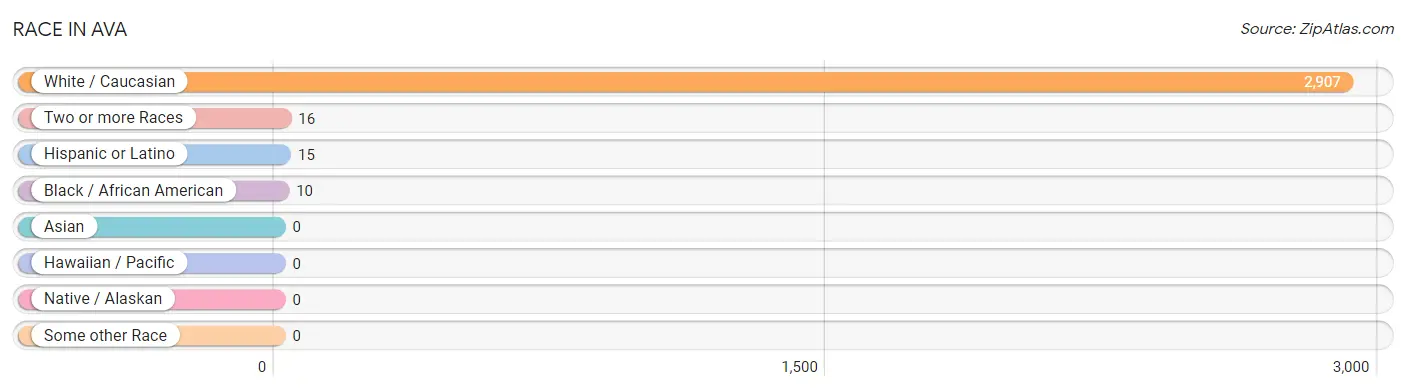
| Race | # Population | % Population |
| Asian | 0 | 0.0% |
| Black / African American | 10 | 0.3% |
| Hawaiian / Pacific | 0 | 0.0% |
| Hispanic or Latino | 15 | 0.5% |
| Native / Alaskan | 0 | 0.0% |
| White / Caucasian | 2,907 | 99.1% |
| Two or more Races | 16 | 0.5% |
| Some other Race | 0 | 0.0% |
| Total | 2,933 | 100.0% |
Ancestry in Ava
The most populous ancestries reported in Ava are German (646 | 22.0%), Irish (351 | 12.0%), English (267 | 9.1%), French (236 | 8.1%), and Italian (160 | 5.5%), together accounting for 56.6% of all Ava residents.
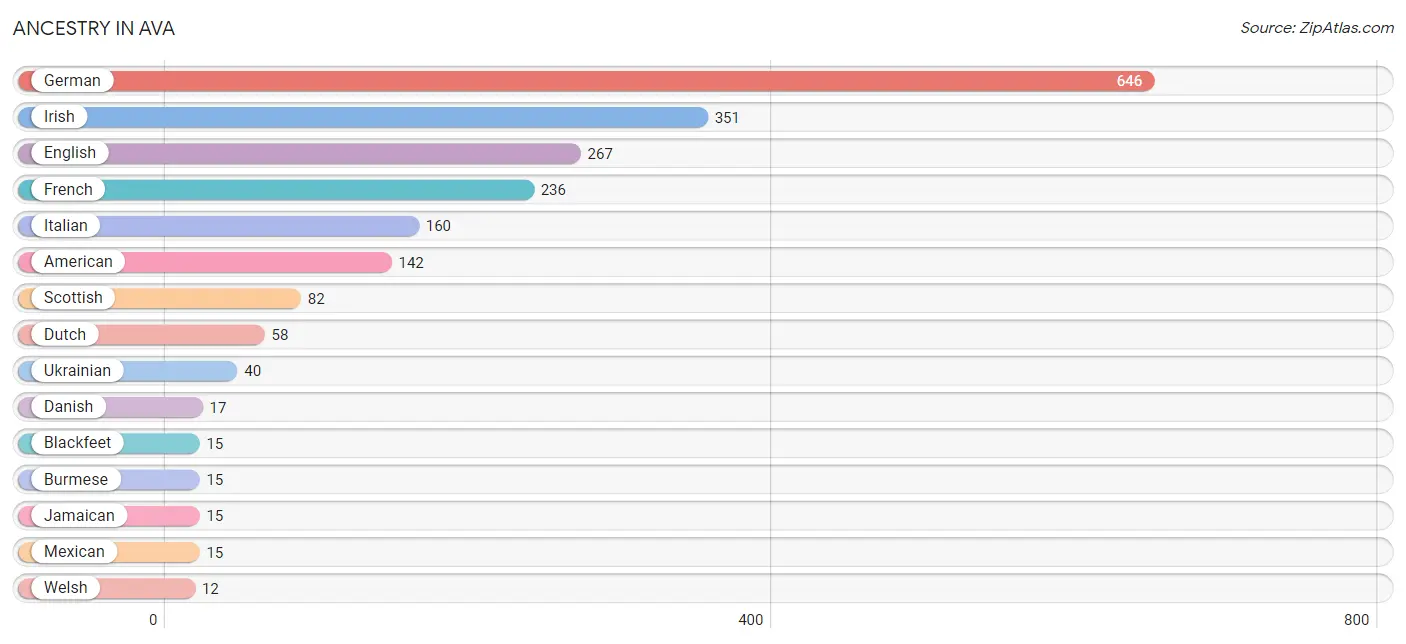
| Ancestry | # Population | % Population |
| American | 142 | 4.8% |
| Blackfeet | 15 | 0.5% |
| British | 5 | 0.2% |
| Burmese | 15 | 0.5% |
| Canadian | 11 | 0.4% |
| Czechoslovakian | 10 | 0.3% |
| Danish | 17 | 0.6% |
| Dutch | 58 | 2.0% |
| English | 267 | 9.1% |
| European | 11 | 0.4% |
| French | 236 | 8.1% |
| German | 646 | 22.0% |
| Hungarian | 10 | 0.3% |
| Irish | 351 | 12.0% |
| Italian | 160 | 5.5% |
| Jamaican | 15 | 0.5% |
| Mexican | 15 | 0.5% |
| Norwegian | 11 | 0.4% |
| Polish | 3 | 0.1% |
| Scotch-Irish | 7 | 0.2% |
| Scottish | 82 | 2.8% |
| Ukrainian | 40 | 1.4% |
| Welsh | 12 | 0.4% | View All 23 Rows |
Immigrants in Ava
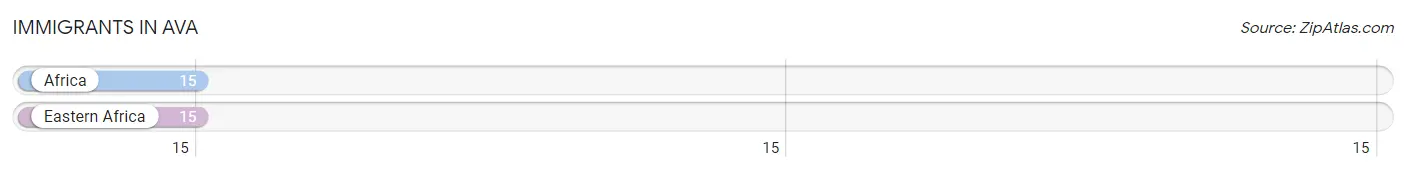
The most numerous immigrant groups reported in Ava came from Africa (15 | 0.5%), and Eastern Africa (15 | 0.5%), together accounting for 1.0% of all Ava residents.
| Immigration Origin | # Population | % Population |
| Africa | 15 | 0.5% |
| Eastern Africa | 15 | 0.5% | View All 2 Rows |
Sex and Age in Ava
Sex and Age in Ava
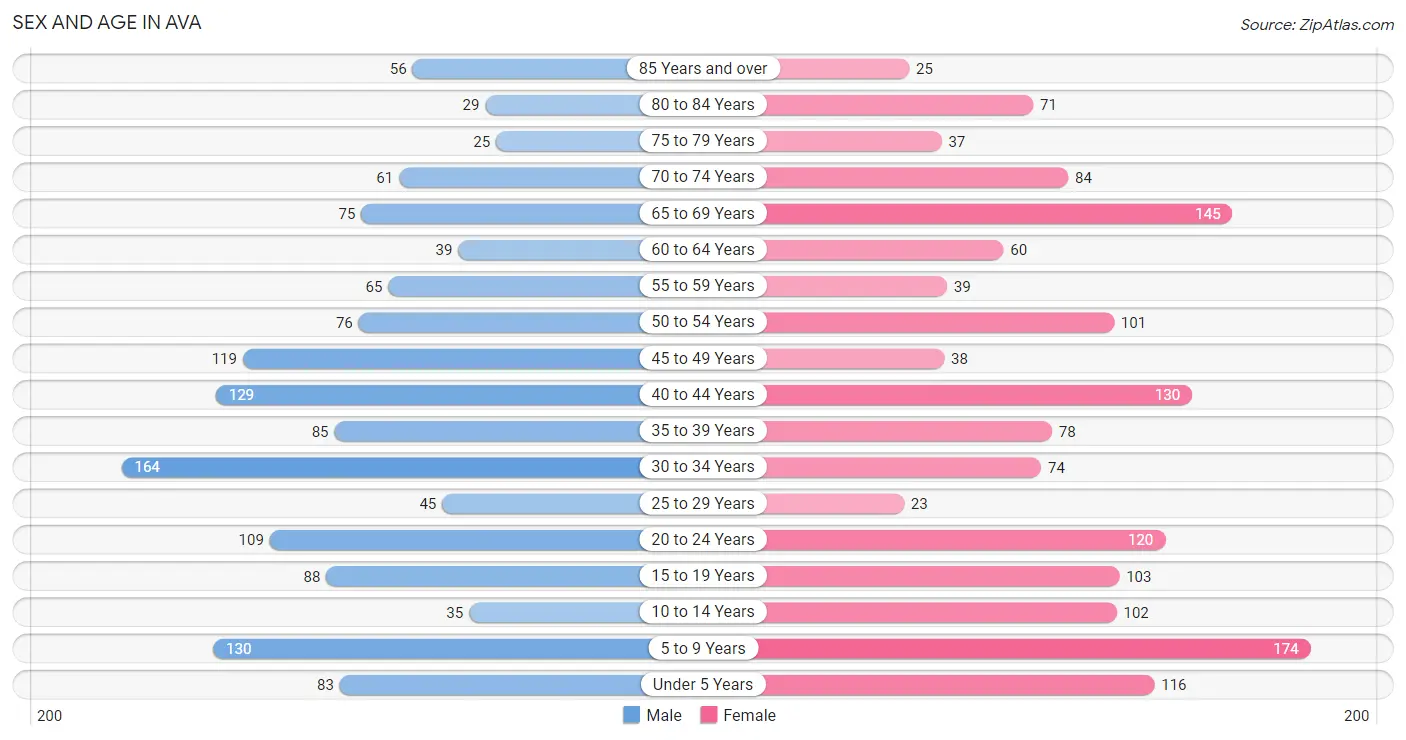
The most populous age groups in Ava are 30 to 34 Years (164 | 11.6%) for men and 5 to 9 Years (174 | 11.5%) for women.
| Age Bracket | Male | Female |
| Under 5 Years | 83 (5.9%) | 116 (7.6%) |
| 5 to 9 Years | 130 (9.2%) | 174 (11.5%) |
| 10 to 14 Years | 35 (2.5%) | 102 (6.7%) |
| 15 to 19 Years | 88 (6.2%) | 103 (6.8%) |
| 20 to 24 Years | 109 (7.7%) | 120 (7.9%) |
| 25 to 29 Years | 45 (3.2%) | 23 (1.5%) |
| 30 to 34 Years | 164 (11.6%) | 74 (4.9%) |
| 35 to 39 Years | 85 (6.0%) | 78 (5.1%) |
| 40 to 44 Years | 129 (9.1%) | 130 (8.6%) |
| 45 to 49 Years | 119 (8.4%) | 38 (2.5%) |
| 50 to 54 Years | 76 (5.4%) | 101 (6.6%) |
| 55 to 59 Years | 65 (4.6%) | 39 (2.6%) |
| 60 to 64 Years | 39 (2.8%) | 60 (4.0%) |
| 65 to 69 Years | 75 (5.3%) | 145 (9.5%) |
| 70 to 74 Years | 61 (4.3%) | 84 (5.5%) |
| 75 to 79 Years | 25 (1.8%) | 37 (2.4%) |
| 80 to 84 Years | 29 (2.1%) | 71 (4.7%) |
| 85 Years and over | 56 (4.0%) | 25 (1.6%) |
| Total | 1,413 (100.0%) | 1,520 (100.0%) |
Families and Households in Ava
Median Family Size in Ava
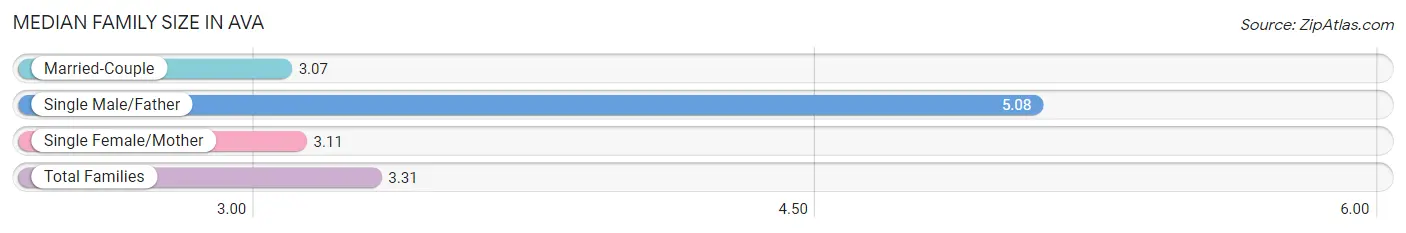
The median family size in Ava is 3.31 persons per family, with single male/father families (75 | 11.5%) accounting for the largest median family size of 5.08 persons per family. On the other hand, married-couple families (443 | 68.0%) represent the smallest median family size with 3.07 persons per family.
| Family Type | # Families | Family Size |
| Married-Couple | 443 (68.0%) | 3.07 |
| Single Male/Father | 75 (11.5%) | 5.08 |
| Single Female/Mother | 133 (20.4%) | 3.11 |
| Total Families | 651 (100.0%) | 3.31 |
Median Household Size in Ava
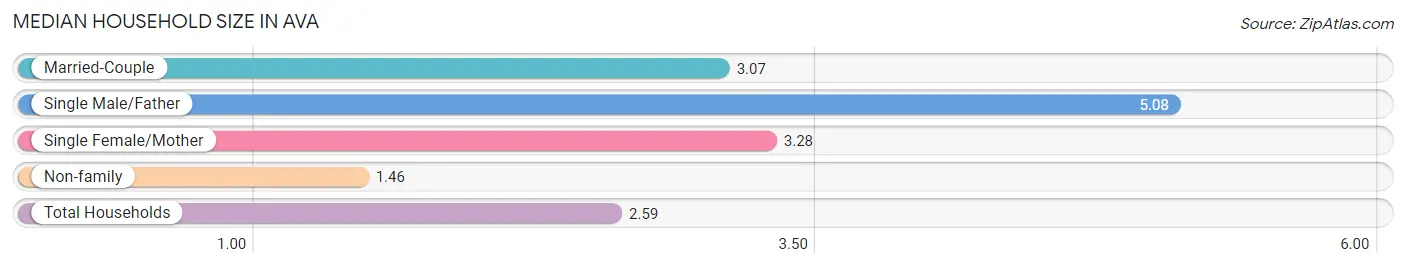
The median household size in Ava is 2.59 persons per household, with single male/father households (75 | 6.9%) accounting for the largest median household size of 5.08 persons per household. non-family households (436 | 40.1%) represent the smallest median household size with 1.46 persons per household.
| Household Type | # Households | Household Size |
| Married-Couple | 443 (40.7%) | 3.07 |
| Single Male/Father | 75 (6.9%) | 5.08 |
| Single Female/Mother | 133 (12.2%) | 3.28 |
| Non-family | 436 (40.1%) | 1.46 |
| Total Households | 1,087 (100.0%) | 2.59 |
Household Size by Marriage Status in Ava
Out of a total of 1,087 households in Ava, 651 (59.9%) are family households, while 436 (40.1%) are nonfamily households. The most numerous type of family households are 3-person households, comprising 278, and the most common type of nonfamily households are 1-person households, comprising 313.
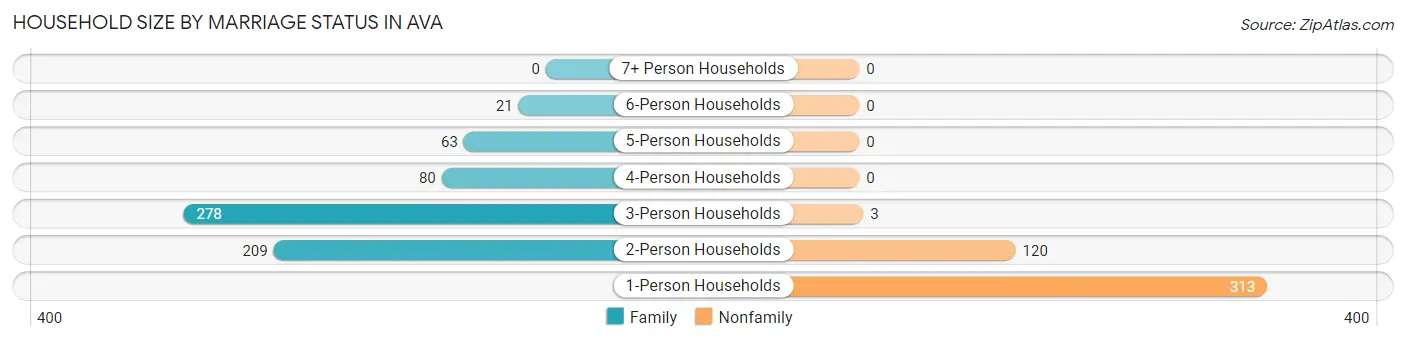
| Household Size | Family Households | Nonfamily Households |
| 1-Person Households | - | 313 (28.8%) |
| 2-Person Households | 209 (19.2%) | 120 (11.0%) |
| 3-Person Households | 278 (25.6%) | 3 (0.3%) |
| 4-Person Households | 80 (7.4%) | 0 (0.0%) |
| 5-Person Households | 63 (5.8%) | 0 (0.0%) |
| 6-Person Households | 21 (1.9%) | 0 (0.0%) |
| 7+ Person Households | 0 (0.0%) | 0 (0.0%) |
| Total | 651 (59.9%) | 436 (40.1%) |
Female Fertility in Ava
Fertility by Age in Ava
| Age Bracket | Women with Births | Births / 1,000 Women |
| 15 to 19 years | 0 (0.0%) | 0.0 |
| 20 to 34 years | 0 (0.0%) | 0.0 |
| 35 to 50 years | 0 (0.0%) | 0.0 |
| Total | 0 (0.0%) | 0.0 |
Fertility by Age by Marriage Status in Ava
| Age Bracket | Married | Unmarried |
| 15 to 19 years | 0 (0.0%) | 0 (0.0%) |
| 20 to 34 years | 0 (0.0%) | 0 (0.0%) |
| 35 to 50 years | 0 (0.0%) | 0 (0.0%) |
| Total | 0 (0.0%) | 0 (0.0%) |
Fertility by Education in Ava
| Educational Attainment | Women with Births | Births / 1,000 Women |
| Less than High School | 0 (0.0%) | 0.0 |
| High School Diploma | 0 (0.0%) | 0.0 |
| College or Associate's Degree | 0 (0.0%) | 0.0 |
| Bachelor's Degree | 0 (0.0%) | 0.0 |
| Graduate Degree | 0 (0.0%) | 0.0 |
| Total | 0 (0.0%) | 0.0 |
Fertility by Education by Marriage Status in Ava
| Educational Attainment | Married | Unmarried |
| Less than High School | 0 (0.0%) | 0 (0.0%) |
| High School Diploma | 0 (0.0%) | 0 (0.0%) |
| College or Associate's Degree | 0 (0.0%) | 0 (0.0%) |
| Bachelor's Degree | 0 (0.0%) | 0 (0.0%) |
| Graduate Degree | 0 (0.0%) | 0 (0.0%) |
| Total | 0 (0.0%) | 0 (0.0%) |
Employment Characteristics in Ava
Employment by Class of Employer in Ava
Among the 985 employed individuals in Ava, private company employees (614 | 62.3%), not-for-profit organizations (208 | 21.1%), and self-employed (not incorporated) (104 | 10.6%) make up the most common classes of employment.
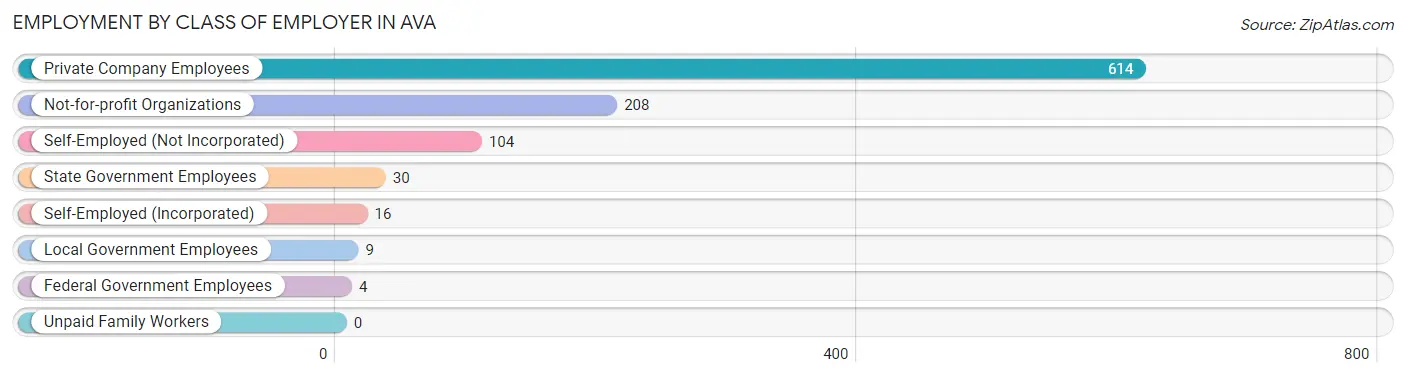
| Employer Class | # Employees | % Employees |
| Private Company Employees | 614 | 62.3% |
| Self-Employed (Incorporated) | 16 | 1.6% |
| Self-Employed (Not Incorporated) | 104 | 10.6% |
| Not-for-profit Organizations | 208 | 21.1% |
| Local Government Employees | 9 | 0.9% |
| State Government Employees | 30 | 3.0% |
| Federal Government Employees | 4 | 0.4% |
| Unpaid Family Workers | 0 | 0.0% |
| Total | 985 | 100.0% |
Employment Status by Age in Ava
According to the labor force statistics for Ava, out of the total population over 16 years of age (2,173), 52.0% or 1,130 individuals are in the labor force, with 8.5% or 96 of them unemployed. The age group with the highest labor force participation rate is 20 to 24 years, with 98.3% or 225 individuals in the labor force. Within the labor force, the 16 to 19 years age range has the highest percentage of unemployed individuals, with 41.8% or 23 of them being unemployed.
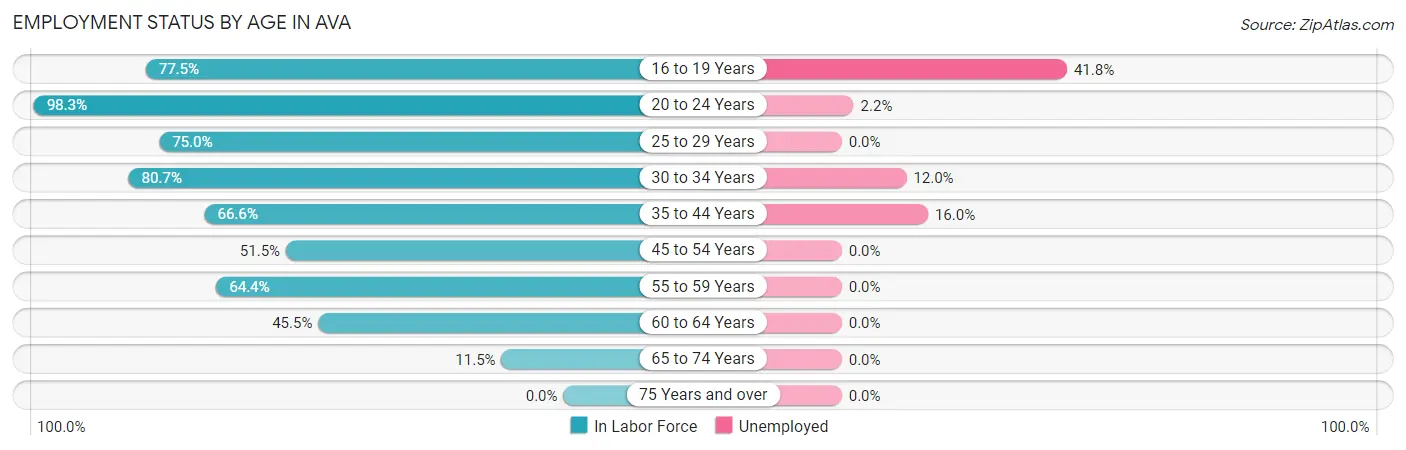
| Age Bracket | In Labor Force | Unemployed |
| 16 to 19 Years | 55 (77.5%) | 23 (41.8%) |
| 20 to 24 Years | 225 (98.3%) | 5 (2.2%) |
| 25 to 29 Years | 51 (75.0%) | 0 (0.0%) |
| 30 to 34 Years | 192 (80.7%) | 23 (12.0%) |
| 35 to 44 Years | 281 (66.6%) | 45 (16.0%) |
| 45 to 54 Years | 172 (51.5%) | 0 (0.0%) |
| 55 to 59 Years | 67 (64.4%) | 0 (0.0%) |
| 60 to 64 Years | 45 (45.5%) | 0 (0.0%) |
| 65 to 74 Years | 42 (11.5%) | 0 (0.0%) |
| 75 Years and over | 0 (0.0%) | 0 (0.0%) |
| Total | 1,130 (52.0%) | 96 (8.5%) |
Employment Status by Educational Attainment in Ava
According to labor force statistics for Ava, 63.9% of individuals (808) out of the total population between 25 and 64 years of age (1,265) are in the labor force, with 8.4% or 68 of them being unemployed. The group with the highest labor force participation rate are those with the educational attainment of bachelor's degree or higher, with 100.0% or 242 individuals in the labor force. Within the labor force, individuals with less than high school education have the highest percentage of unemployment, with 54.8% or 23 of them being unemployed.
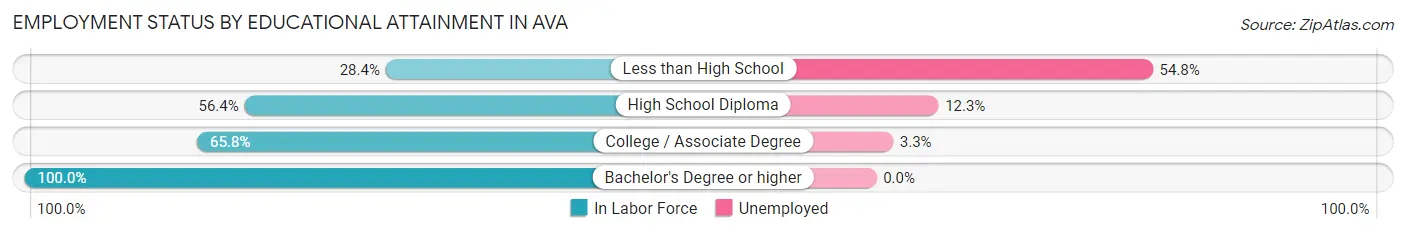
| Educational Attainment | In Labor Force | Unemployed |
| Less than High School | 42 (28.4%) | 81 (54.8%) |
| High School Diploma | 310 (56.4%) | 68 (12.3%) |
| College / Associate Degree | 214 (65.8%) | 11 (3.3%) |
| Bachelor's Degree or higher | 242 (100.0%) | 0 (0.0%) |
| Total | 808 (63.9%) | 106 (8.4%) |
Employment Occupations by Sex in Ava
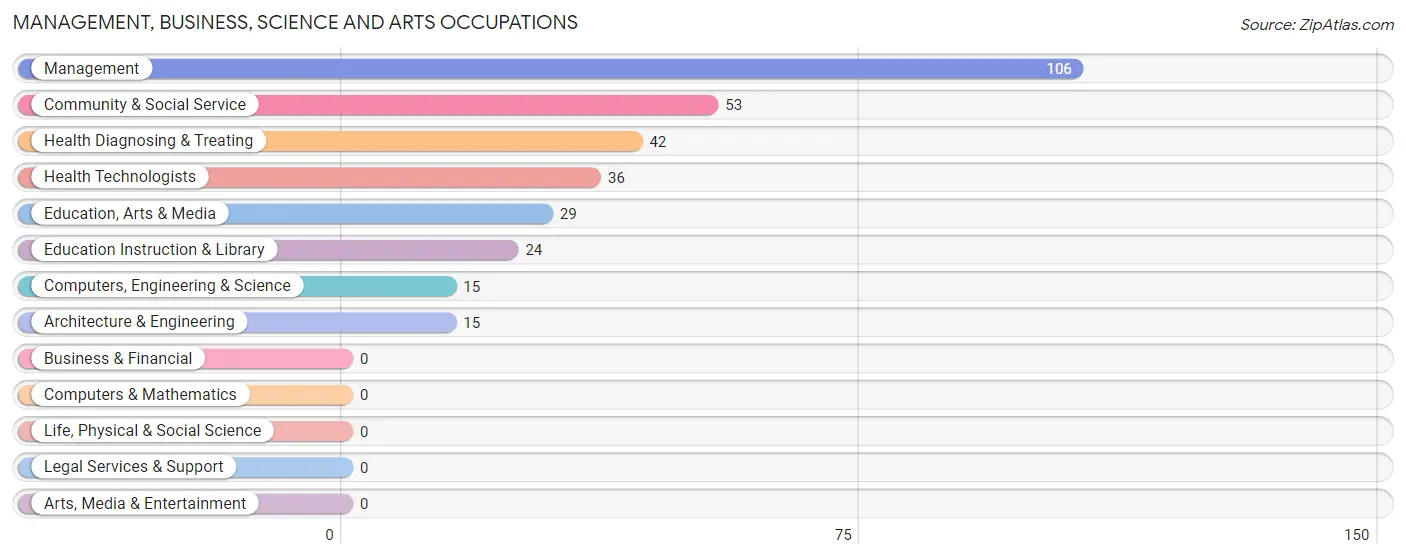
Management, Business, Science and Arts Occupations
The most common Management, Business, Science and Arts occupations in Ava are Management (106 | 10.2%), Community & Social Service (53 | 5.1%), Health Diagnosing & Treating (42 | 4.1%), Health Technologists (36 | 3.5%), and Education, Arts & Media (29 | 2.8%).
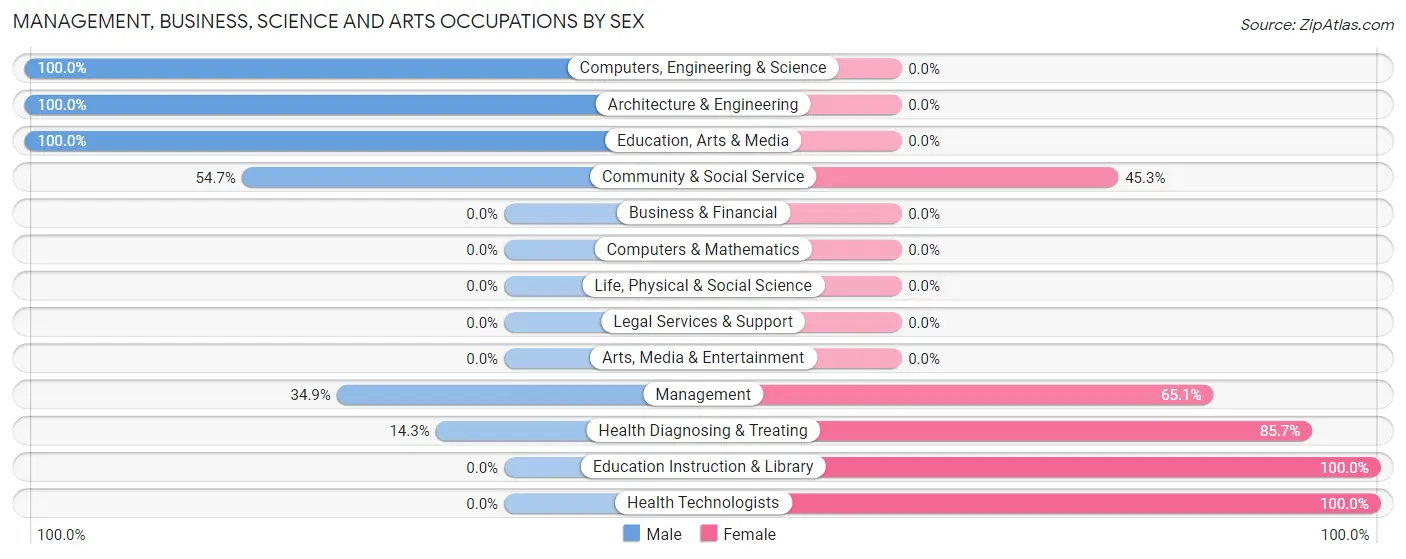
Management, Business, Science and Arts Occupations by Sex
Within the Management, Business, Science and Arts occupations in Ava, the most male-oriented occupations are Computers, Engineering & Science (100.0%), Architecture & Engineering (100.0%), and Education, Arts & Media (100.0%), while the most female-oriented occupations are Education Instruction & Library (100.0%), Health Technologists (100.0%), and Health Diagnosing & Treating (85.7%).
| Occupation | Male | Female |
| Management | 37 (34.9%) | 69 (65.1%) |
| Business & Financial | 0 (0.0%) | 0 (0.0%) |
| Computers, Engineering & Science | 15 (100.0%) | 0 (0.0%) |
| Computers & Mathematics | 0 (0.0%) | 0 (0.0%) |
| Architecture & Engineering | 15 (100.0%) | 0 (0.0%) |
| Life, Physical & Social Science | 0 (0.0%) | 0 (0.0%) |
| Community & Social Service | 29 (54.7%) | 24 (45.3%) |
| Education, Arts & Media | 29 (100.0%) | 0 (0.0%) |
| Legal Services & Support | 0 (0.0%) | 0 (0.0%) |
| Education Instruction & Library | 0 (0.0%) | 24 (100.0%) |
| Arts, Media & Entertainment | 0 (0.0%) | 0 (0.0%) |
| Health Diagnosing & Treating | 6 (14.3%) | 36 (85.7%) |
| Health Technologists | 0 (0.0%) | 36 (100.0%) |
| Total (Category) | 87 (40.3%) | 129 (59.7%) |
| Total (Overall) | 558 (54.0%) | 476 (46.0%) |
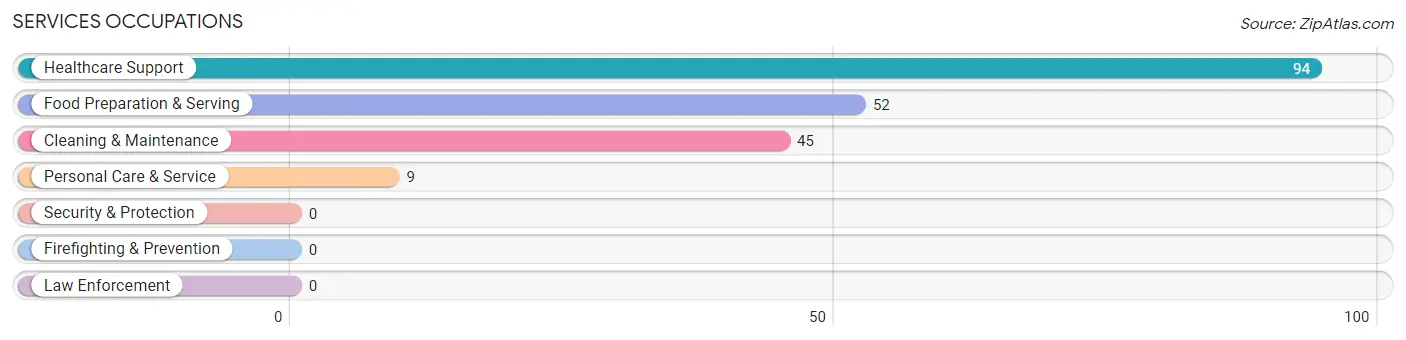
Services Occupations
The most common Services occupations in Ava are Healthcare Support (94 | 9.1%), Food Preparation & Serving (52 | 5.0%), Cleaning & Maintenance (45 | 4.3%), and Personal Care & Service (9 | 0.9%).
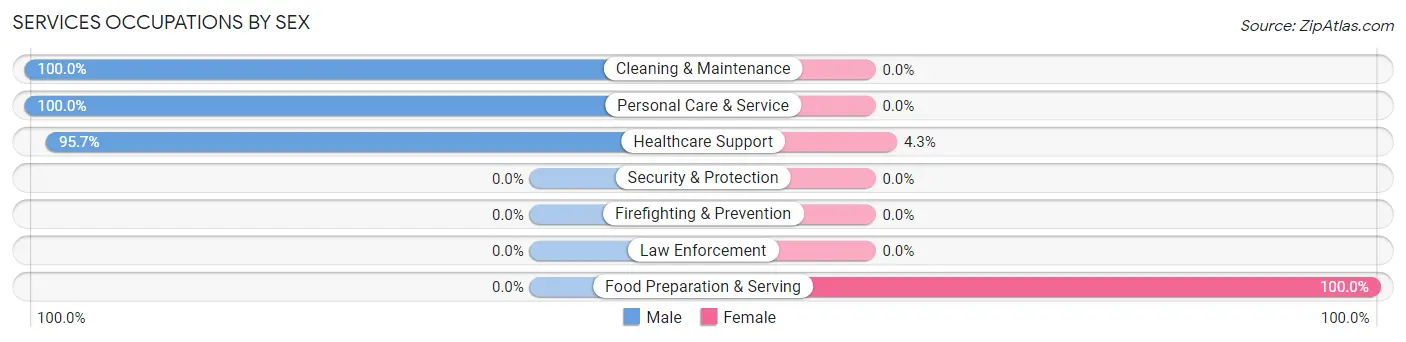
Services Occupations by Sex
Within the Services occupations in Ava, the most male-oriented occupations are Cleaning & Maintenance (100.0%), Personal Care & Service (100.0%), and Healthcare Support (95.7%), while the most female-oriented occupations are Food Preparation & Serving (100.0%), and Healthcare Support (4.3%).
| Occupation | Male | Female |
| Healthcare Support | 90 (95.7%) | 4 (4.3%) |
| Security & Protection | 0 (0.0%) | 0 (0.0%) |
| Firefighting & Prevention | 0 (0.0%) | 0 (0.0%) |
| Law Enforcement | 0 (0.0%) | 0 (0.0%) |
| Food Preparation & Serving | 0 (0.0%) | 52 (100.0%) |
| Cleaning & Maintenance | 45 (100.0%) | 0 (0.0%) |
| Personal Care & Service | 9 (100.0%) | 0 (0.0%) |
| Total (Category) | 144 (72.0%) | 56 (28.0%) |
| Total (Overall) | 558 (54.0%) | 476 (46.0%) |
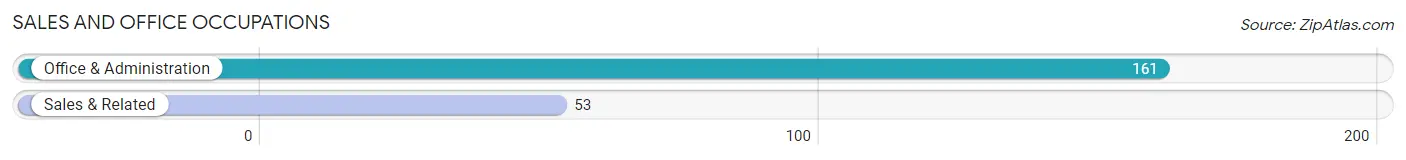
Sales and Office Occupations
The most common Sales and Office occupations in Ava are Office & Administration (161 | 15.6%), and Sales & Related (53 | 5.1%).
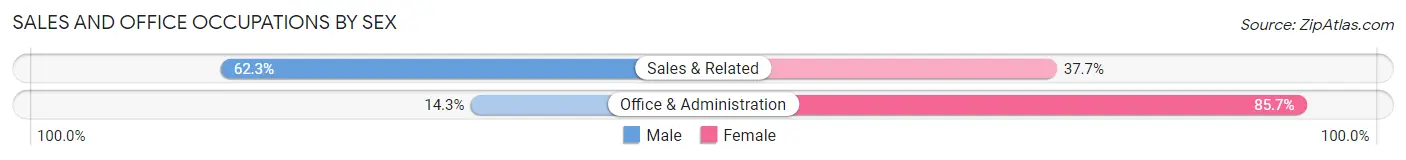
Sales and Office Occupations by Sex
| Occupation | Male | Female |
| Sales & Related | 33 (62.3%) | 20 (37.7%) |
| Office & Administration | 23 (14.3%) | 138 (85.7%) |
| Total (Category) | 56 (26.2%) | 158 (73.8%) |
| Total (Overall) | 558 (54.0%) | 476 (46.0%) |
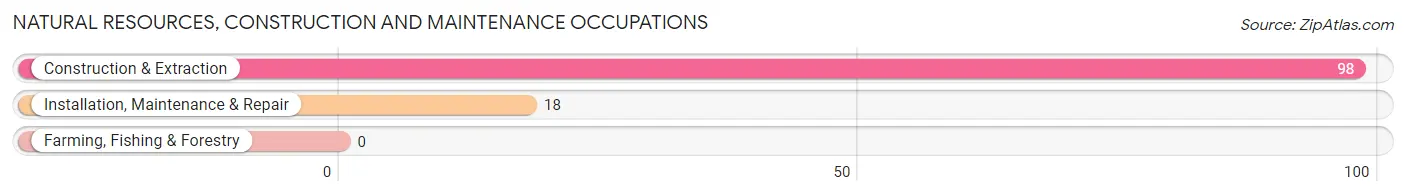
Natural Resources, Construction and Maintenance Occupations
The most common Natural Resources, Construction and Maintenance occupations in Ava are Construction & Extraction (98 | 9.5%), and Installation, Maintenance & Repair (18 | 1.7%).
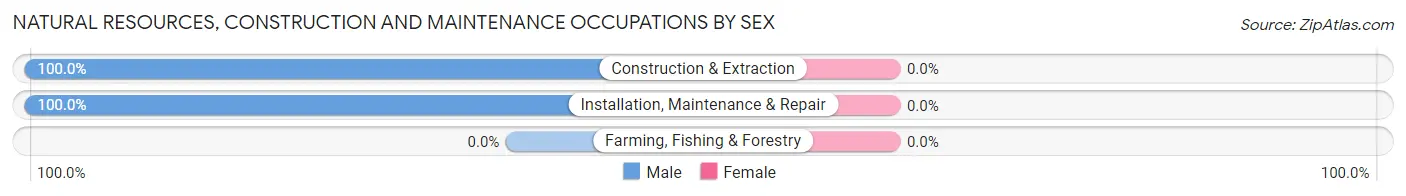
Natural Resources, Construction and Maintenance Occupations by Sex
| Occupation | Male | Female |
| Farming, Fishing & Forestry | 0 (0.0%) | 0 (0.0%) |
| Construction & Extraction | 98 (100.0%) | 0 (0.0%) |
| Installation, Maintenance & Repair | 18 (100.0%) | 0 (0.0%) |
| Total (Category) | 116 (100.0%) | 0 (0.0%) |
| Total (Overall) | 558 (54.0%) | 476 (46.0%) |
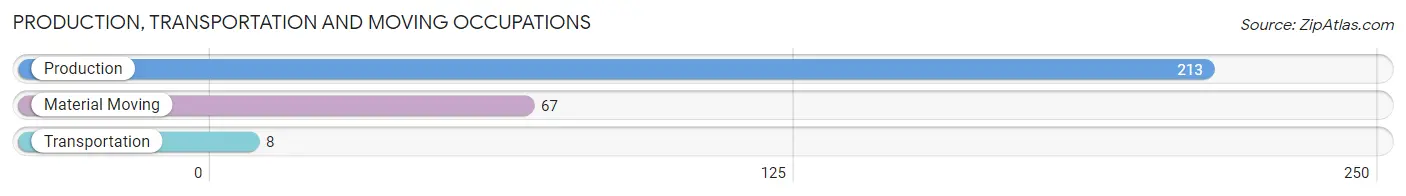
Production, Transportation and Moving Occupations
The most common Production, Transportation and Moving occupations in Ava are Production (213 | 20.6%), Material Moving (67 | 6.5%), and Transportation (8 | 0.8%).
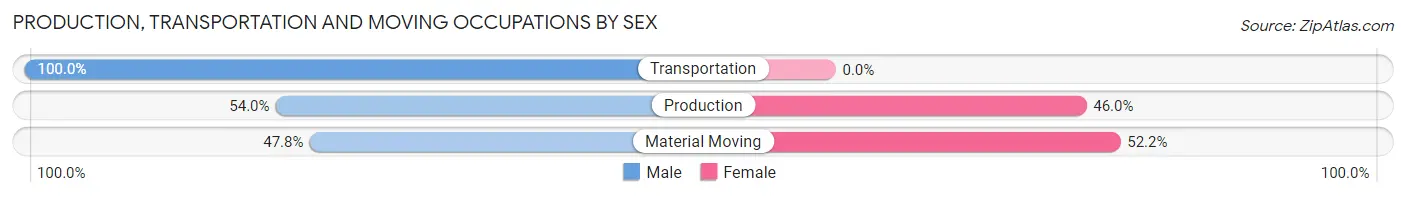
Production, Transportation and Moving Occupations by Sex
| Occupation | Male | Female |
| Production | 115 (54.0%) | 98 (46.0%) |
| Transportation | 8 (100.0%) | 0 (0.0%) |
| Material Moving | 32 (47.8%) | 35 (52.2%) |
| Total (Category) | 155 (53.8%) | 133 (46.2%) |
| Total (Overall) | 558 (54.0%) | 476 (46.0%) |
Employment Industries by Sex in Ava
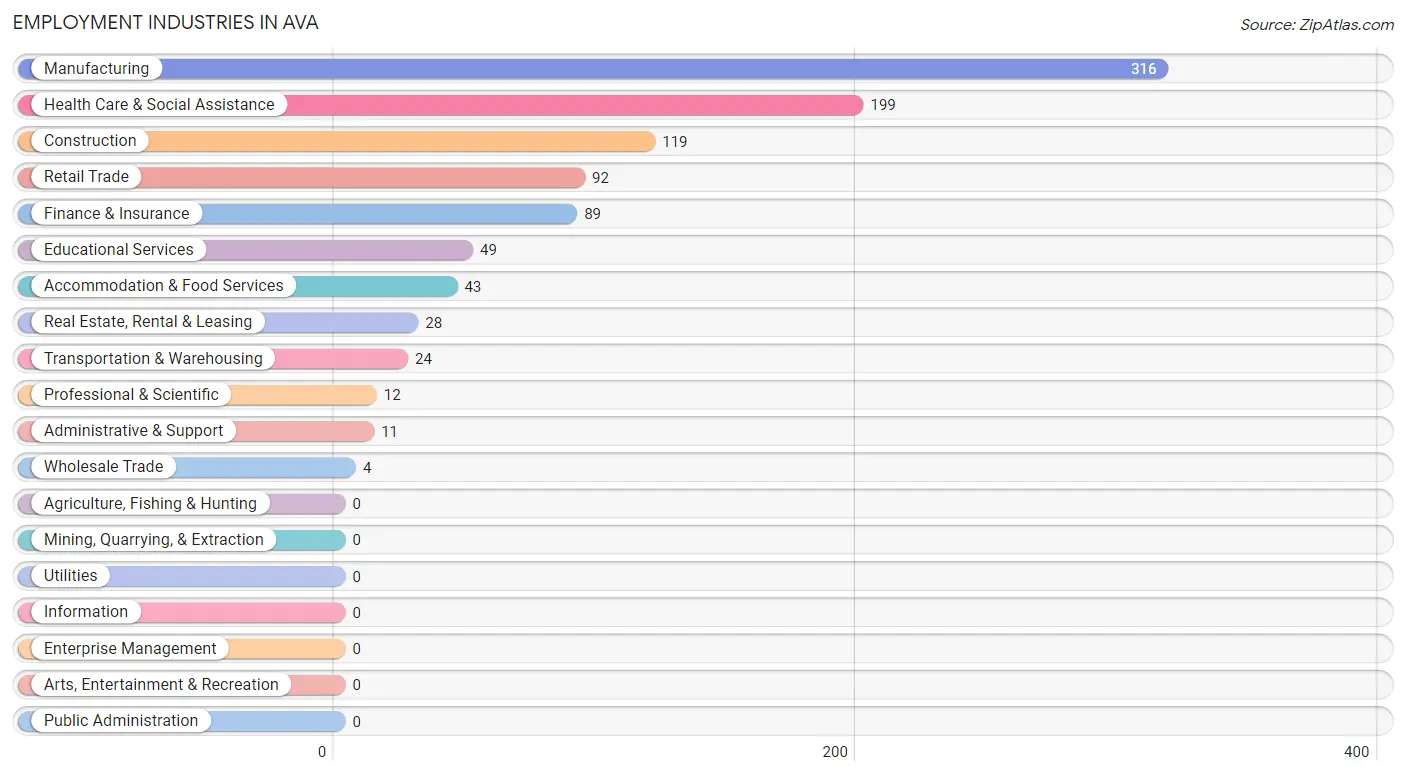
Employment Industries in Ava
The major employment industries in Ava include Manufacturing (316 | 30.6%), Health Care & Social Assistance (199 | 19.3%), Construction (119 | 11.5%), Retail Trade (92 | 8.9%), and Finance & Insurance (89 | 8.6%).
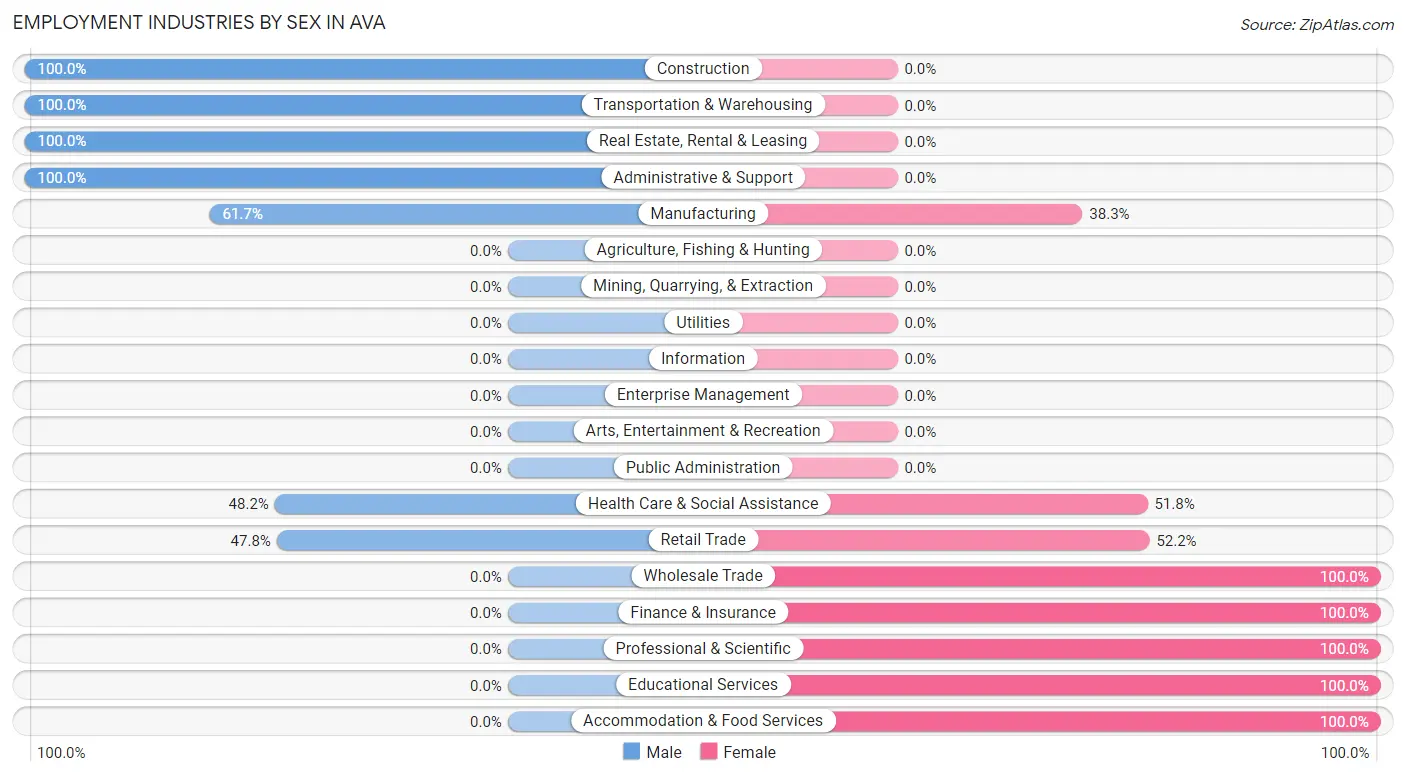
Employment Industries by Sex in Ava
The Ava industries that see more men than women are Construction (100.0%), Transportation & Warehousing (100.0%), and Real Estate, Rental & Leasing (100.0%), whereas the industries that tend to have a higher number of women are Wholesale Trade (100.0%), Finance & Insurance (100.0%), and Professional & Scientific (100.0%).
| Industry | Male | Female |
| Agriculture, Fishing & Hunting | 0 (0.0%) | 0 (0.0%) |
| Mining, Quarrying, & Extraction | 0 (0.0%) | 0 (0.0%) |
| Construction | 119 (100.0%) | 0 (0.0%) |
| Manufacturing | 195 (61.7%) | 121 (38.3%) |
| Wholesale Trade | 0 (0.0%) | 4 (100.0%) |
| Retail Trade | 44 (47.8%) | 48 (52.2%) |
| Transportation & Warehousing | 24 (100.0%) | 0 (0.0%) |
| Utilities | 0 (0.0%) | 0 (0.0%) |
| Information | 0 (0.0%) | 0 (0.0%) |
| Finance & Insurance | 0 (0.0%) | 89 (100.0%) |
| Real Estate, Rental & Leasing | 28 (100.0%) | 0 (0.0%) |
| Professional & Scientific | 0 (0.0%) | 12 (100.0%) |
| Enterprise Management | 0 (0.0%) | 0 (0.0%) |
| Administrative & Support | 11 (100.0%) | 0 (0.0%) |
| Educational Services | 0 (0.0%) | 49 (100.0%) |
| Health Care & Social Assistance | 96 (48.2%) | 103 (51.8%) |
| Arts, Entertainment & Recreation | 0 (0.0%) | 0 (0.0%) |
| Accommodation & Food Services | 0 (0.0%) | 43 (100.0%) |
| Public Administration | 0 (0.0%) | 0 (0.0%) |
| Total | 558 (54.0%) | 476 (46.0%) |
Education in Ava
School Enrollment in Ava
The most common levels of schooling among the 507 students in Ava are high school (151 | 29.8%), elementary school (132 | 26.0%), and nursery / preschool (84 | 16.6%).
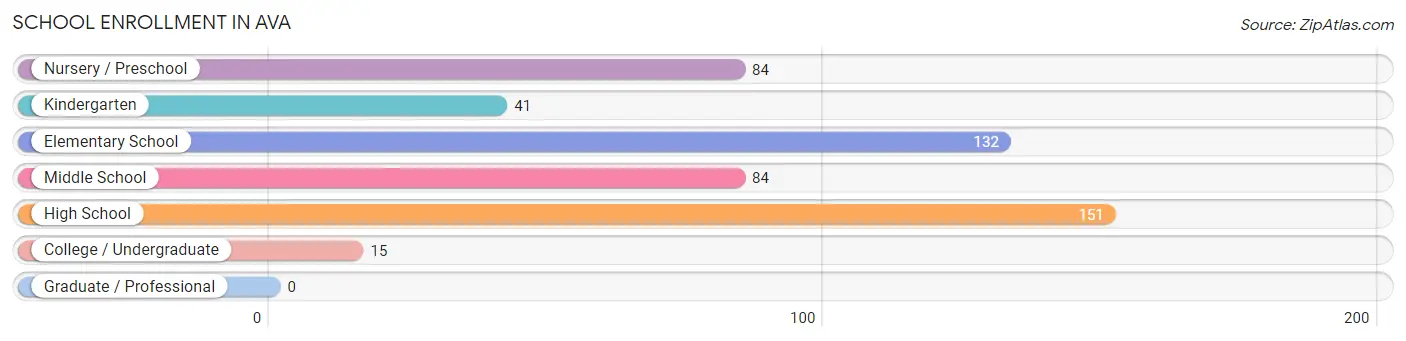
| School Level | # Students | % Students |
| Nursery / Preschool | 84 | 16.6% |
| Kindergarten | 41 | 8.1% |
| Elementary School | 132 | 26.0% |
| Middle School | 84 | 16.6% |
| High School | 151 | 29.8% |
| College / Undergraduate | 15 | 3.0% |
| Graduate / Professional | 0 | 0.0% |
| Total | 507 | 100.0% |
School Enrollment by Age by Funding Source in Ava
Out of a total of 507 students who are enrolled in schools in Ava, 191 (37.7%) attend a private institution, while the remaining 316 (62.3%) are enrolled in public schools. The age group of 10 to 14 year olds has the highest likelihood of being enrolled in private schools, with 84 (100.0% in the age bracket) enrolled. Conversely, the age group of 3 to 4 year olds has the lowest likelihood of being enrolled in a private school, with 6 (100.0% in the age bracket) attending a public institution.
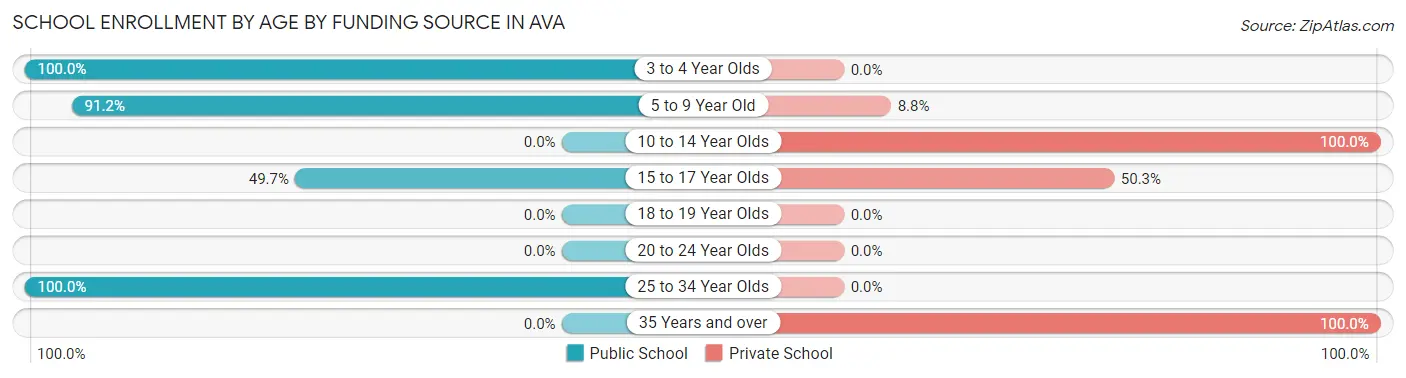
| Age Bracket | Public School | Private School |
| 3 to 4 Year Olds | 6 (100.0%) | 0 (0.0%) |
| 5 to 9 Year Old | 229 (91.2%) | 22 (8.8%) |
| 10 to 14 Year Olds | 0 (0.0%) | 84 (100.0%) |
| 15 to 17 Year Olds | 75 (49.7%) | 76 (50.3%) |
| 18 to 19 Year Olds | 0 (0.0%) | 0 (0.0%) |
| 20 to 24 Year Olds | 0 (0.0%) | 0 (0.0%) |
| 25 to 34 Year Olds | 6 (100.0%) | 0 (0.0%) |
| 35 Years and over | 0 (0.0%) | 9 (100.0%) |
| Total | 316 (62.3%) | 191 (37.7%) |
Educational Attainment by Field of Study in Ava
Business (86 | 25.4%), liberal arts & history (63 | 18.6%), education (47 | 13.9%), computers & mathematics (41 | 12.1%), and bio, nature & agricultural (34 | 10.0%) are the most common fields of study among 339 individuals in Ava who have obtained a bachelor's degree or higher.
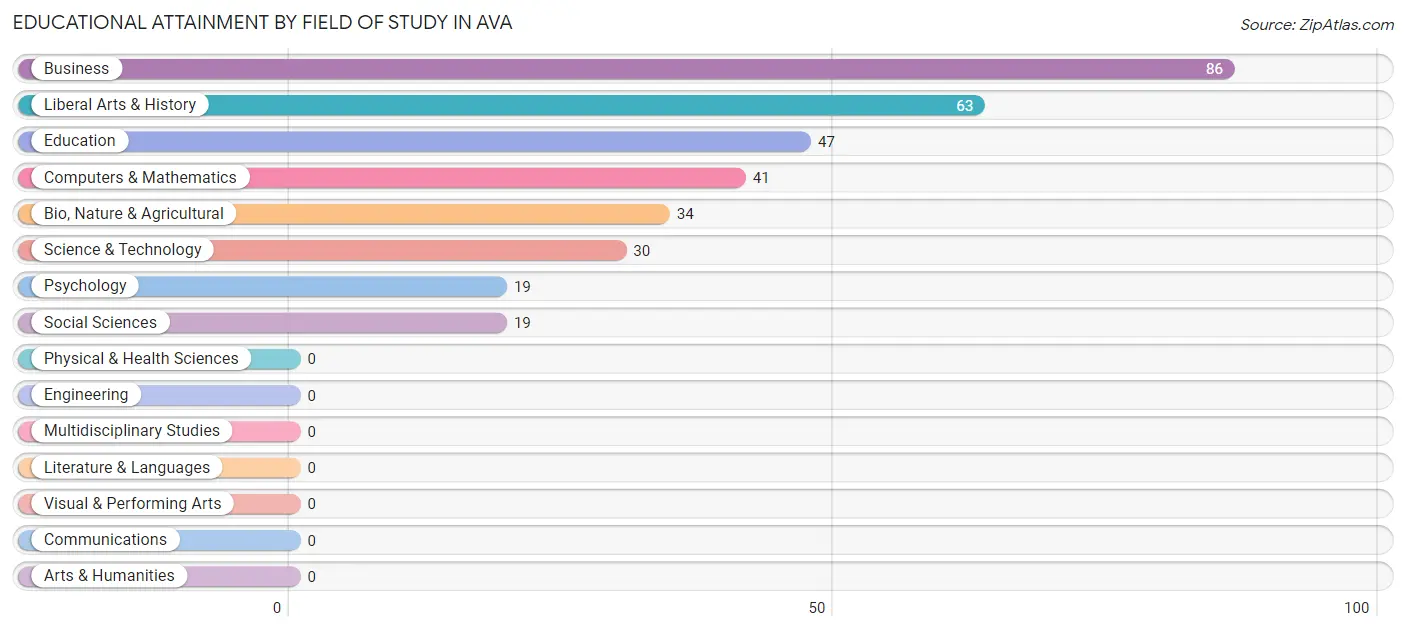
| Field of Study | # Graduates | % Graduates |
| Computers & Mathematics | 41 | 12.1% |
| Bio, Nature & Agricultural | 34 | 10.0% |
| Physical & Health Sciences | 0 | 0.0% |
| Psychology | 19 | 5.6% |
| Social Sciences | 19 | 5.6% |
| Engineering | 0 | 0.0% |
| Multidisciplinary Studies | 0 | 0.0% |
| Science & Technology | 30 | 8.8% |
| Business | 86 | 25.4% |
| Education | 47 | 13.9% |
| Literature & Languages | 0 | 0.0% |
| Liberal Arts & History | 63 | 18.6% |
| Visual & Performing Arts | 0 | 0.0% |
| Communications | 0 | 0.0% |
| Arts & Humanities | 0 | 0.0% |
| Total | 339 | 100.0% |
Transportation & Commute in Ava
Vehicle Availability by Sex in Ava
The most prevalent vehicle ownership categories in Ava are males with 2 vehicles (307, accounting for 55.0%) and females with 2 vehicles (255, making up 71.9%).
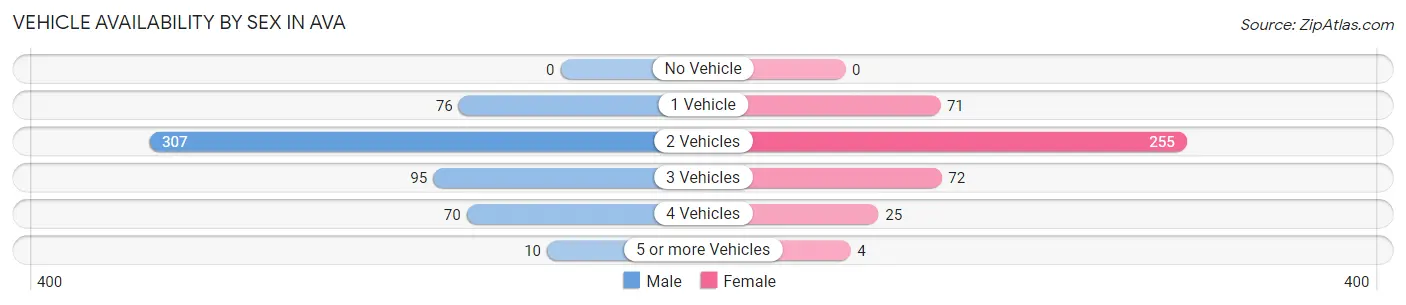
| Vehicles Available | Male | Female |
| No Vehicle | 0 (0.0%) | 0 (0.0%) |
| 1 Vehicle | 76 (13.6%) | 71 (16.6%) |
| 2 Vehicles | 307 (55.0%) | 255 (59.7%) |
| 3 Vehicles | 95 (17.0%) | 72 (16.9%) |
| 4 Vehicles | 70 (12.5%) | 25 (5.9%) |
| 5 or more Vehicles | 10 (1.8%) | 4 (0.9%) |
| Total | 558 (100.0%) | 427 (100.0%) |
Commute Time in Ava
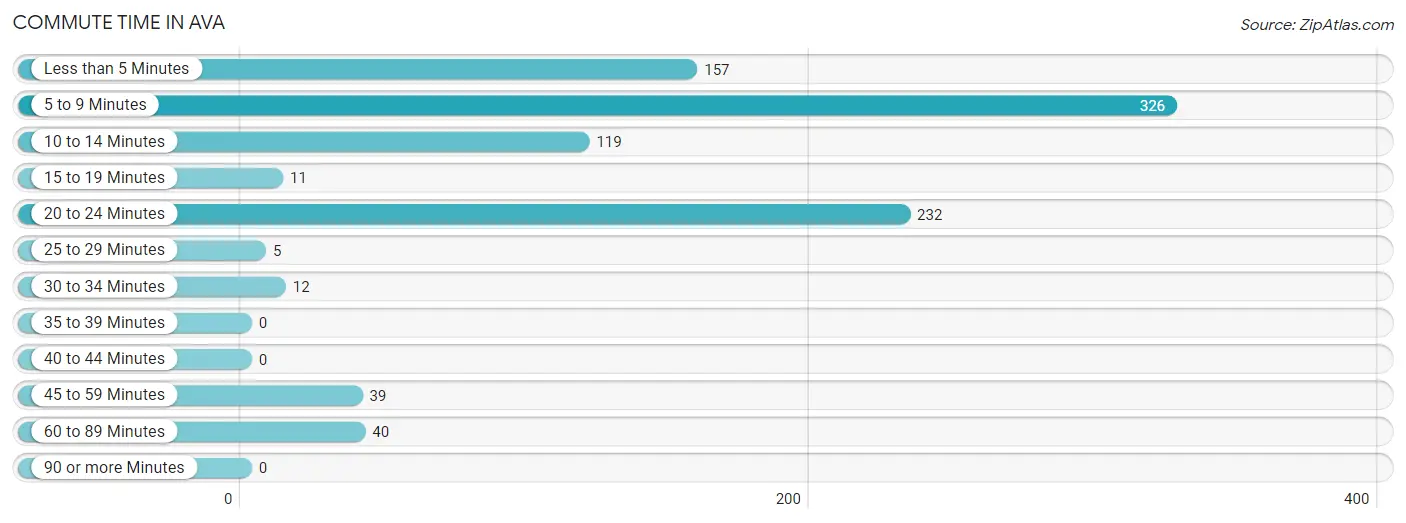
The most frequently occuring commute durations in Ava are 5 to 9 minutes (326 commuters, 34.6%), 20 to 24 minutes (232 commuters, 24.6%), and less than 5 minutes (157 commuters, 16.7%).
| Commute Time | # Commuters | % Commuters |
| Less than 5 Minutes | 157 | 16.7% |
| 5 to 9 Minutes | 326 | 34.6% |
| 10 to 14 Minutes | 119 | 12.7% |
| 15 to 19 Minutes | 11 | 1.2% |
| 20 to 24 Minutes | 232 | 24.6% |
| 25 to 29 Minutes | 5 | 0.5% |
| 30 to 34 Minutes | 12 | 1.3% |
| 35 to 39 Minutes | 0 | 0.0% |
| 40 to 44 Minutes | 0 | 0.0% |
| 45 to 59 Minutes | 39 | 4.1% |
| 60 to 89 Minutes | 40 | 4.3% |
| 90 or more Minutes | 0 | 0.0% |
Commute Time by Sex in Ava
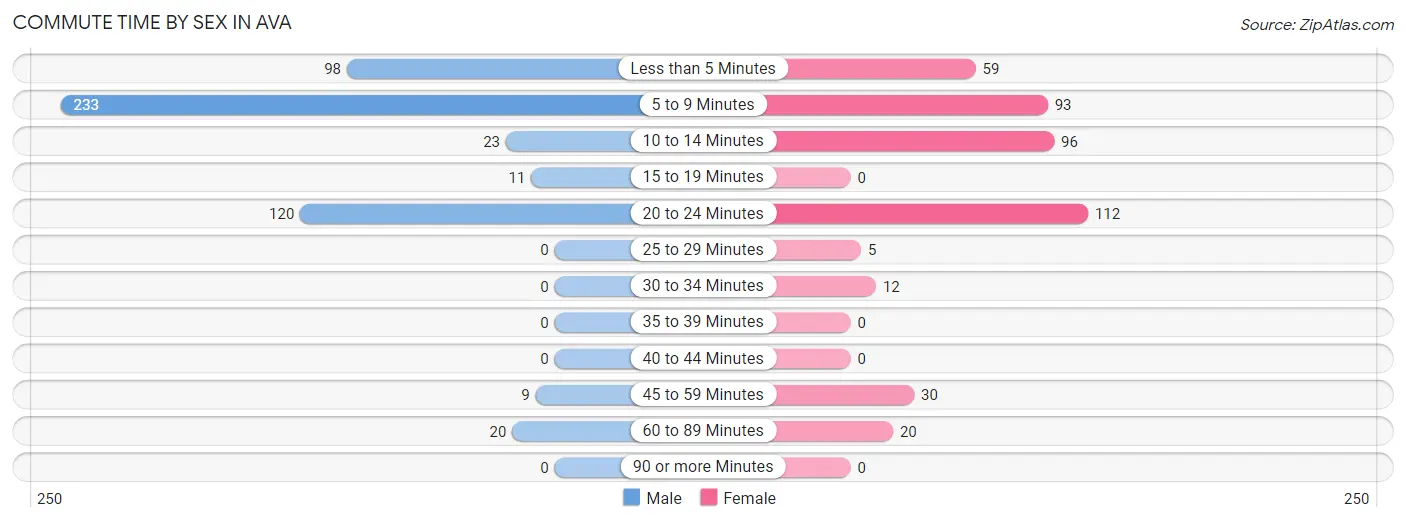
The most common commute times in Ava are 5 to 9 minutes (233 commuters, 45.3%) for males and 20 to 24 minutes (112 commuters, 26.2%) for females.
| Commute Time | Male | Female |
| Less than 5 Minutes | 98 (19.1%) | 59 (13.8%) |
| 5 to 9 Minutes | 233 (45.3%) | 93 (21.8%) |
| 10 to 14 Minutes | 23 (4.5%) | 96 (22.5%) |
| 15 to 19 Minutes | 11 (2.1%) | 0 (0.0%) |
| 20 to 24 Minutes | 120 (23.4%) | 112 (26.2%) |
| 25 to 29 Minutes | 0 (0.0%) | 5 (1.2%) |
| 30 to 34 Minutes | 0 (0.0%) | 12 (2.8%) |
| 35 to 39 Minutes | 0 (0.0%) | 0 (0.0%) |
| 40 to 44 Minutes | 0 (0.0%) | 0 (0.0%) |
| 45 to 59 Minutes | 9 (1.8%) | 30 (7.0%) |
| 60 to 89 Minutes | 20 (3.9%) | 20 (4.7%) |
| 90 or more Minutes | 0 (0.0%) | 0 (0.0%) |
Time of Departure to Work by Sex in Ava
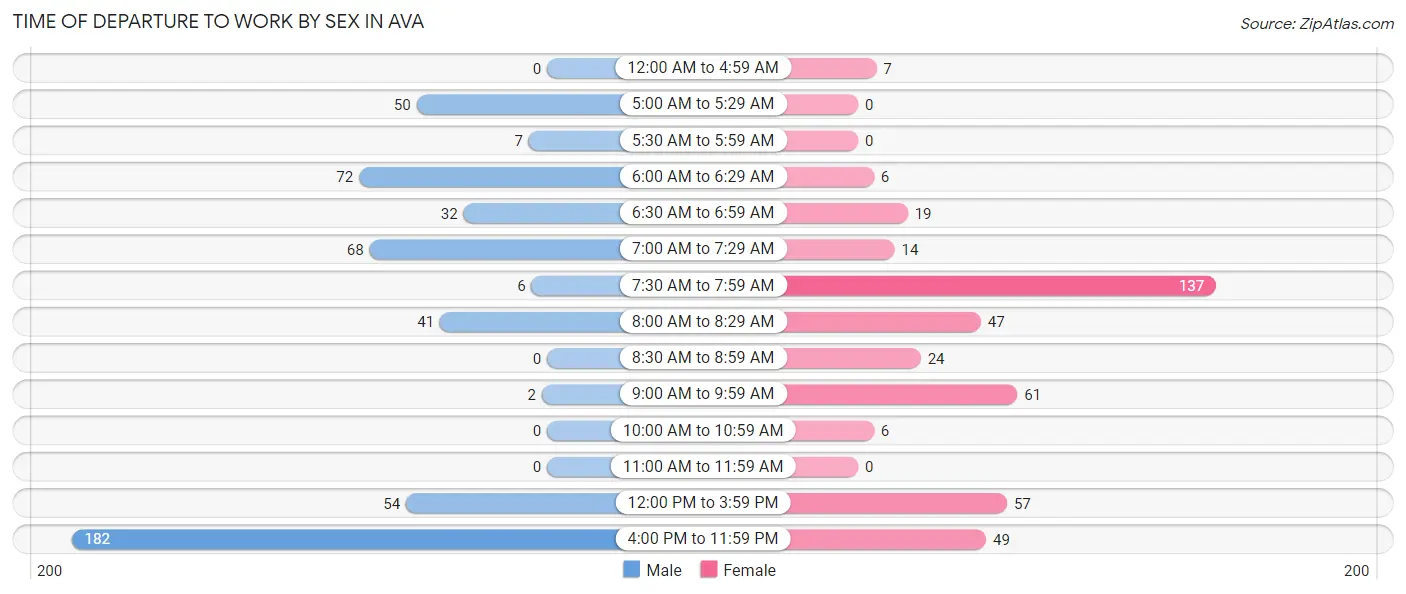
The most frequent times of departure to work in Ava are 4:00 PM to 11:59 PM (182, 35.4%) for males and 7:30 AM to 7:59 AM (137, 32.1%) for females.
| Time of Departure | Male | Female |
| 12:00 AM to 4:59 AM | 0 (0.0%) | 7 (1.6%) |
| 5:00 AM to 5:29 AM | 50 (9.7%) | 0 (0.0%) |
| 5:30 AM to 5:59 AM | 7 (1.4%) | 0 (0.0%) |
| 6:00 AM to 6:29 AM | 72 (14.0%) | 6 (1.4%) |
| 6:30 AM to 6:59 AM | 32 (6.2%) | 19 (4.4%) |
| 7:00 AM to 7:29 AM | 68 (13.2%) | 14 (3.3%) |
| 7:30 AM to 7:59 AM | 6 (1.2%) | 137 (32.1%) |
| 8:00 AM to 8:29 AM | 41 (8.0%) | 47 (11.0%) |
| 8:30 AM to 8:59 AM | 0 (0.0%) | 24 (5.6%) |
| 9:00 AM to 9:59 AM | 2 (0.4%) | 61 (14.3%) |
| 10:00 AM to 10:59 AM | 0 (0.0%) | 6 (1.4%) |
| 11:00 AM to 11:59 AM | 0 (0.0%) | 0 (0.0%) |
| 12:00 PM to 3:59 PM | 54 (10.5%) | 57 (13.4%) |
| 4:00 PM to 11:59 PM | 182 (35.4%) | 49 (11.5%) |
| Total | 514 (100.0%) | 427 (100.0%) |
Housing Occupancy in Ava
Occupancy by Ownership in Ava
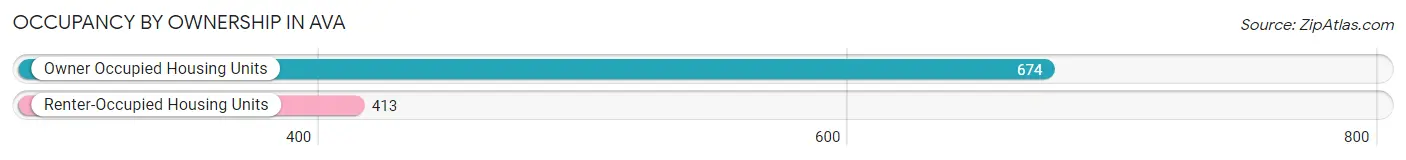
Of the total 1,087 dwellings in Ava, owner-occupied units account for 674 (62.0%), while renter-occupied units make up 413 (38.0%).
| Occupancy | # Housing Units | % Housing Units |
| Owner Occupied Housing Units | 674 | 62.0% |
| Renter-Occupied Housing Units | 413 | 38.0% |
| Total Occupied Housing Units | 1,087 | 100.0% |
Occupancy by Household Size in Ava
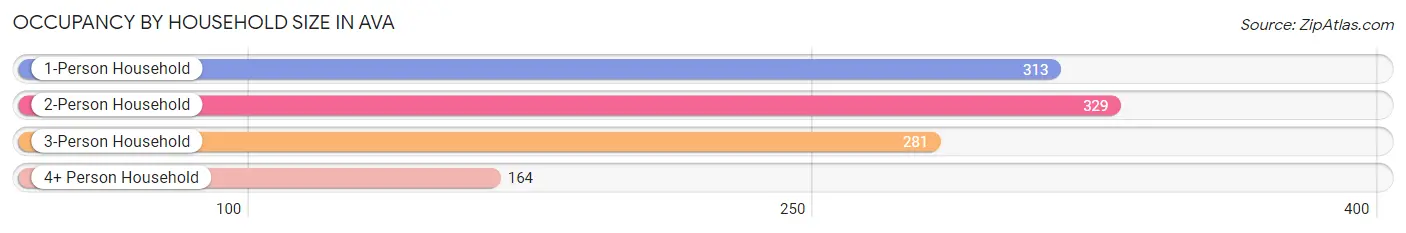
| Household Size | # Housing Units | % Housing Units |
| 1-Person Household | 313 | 28.8% |
| 2-Person Household | 329 | 30.3% |
| 3-Person Household | 281 | 25.9% |
| 4+ Person Household | 164 | 15.1% |
| Total Housing Units | 1,087 | 100.0% |
Occupancy by Ownership by Household Size in Ava
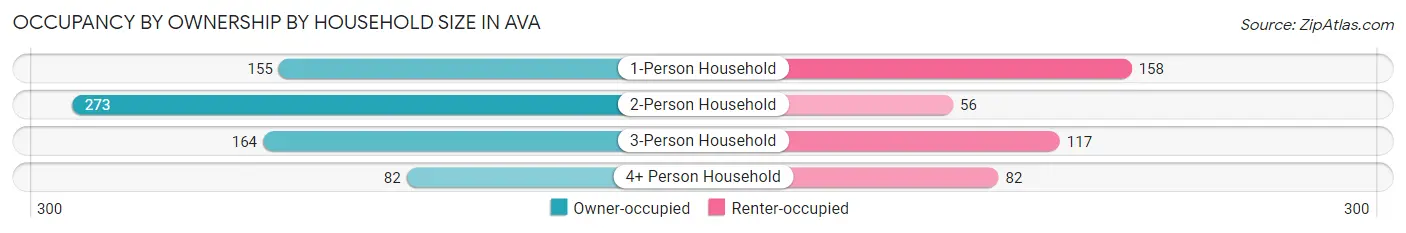
| Household Size | Owner-occupied | Renter-occupied |
| 1-Person Household | 155 (49.5%) | 158 (50.5%) |
| 2-Person Household | 273 (83.0%) | 56 (17.0%) |
| 3-Person Household | 164 (58.4%) | 117 (41.6%) |
| 4+ Person Household | 82 (50.0%) | 82 (50.0%) |
| Total Housing Units | 674 (62.0%) | 413 (38.0%) |
Occupancy by Educational Attainment in Ava
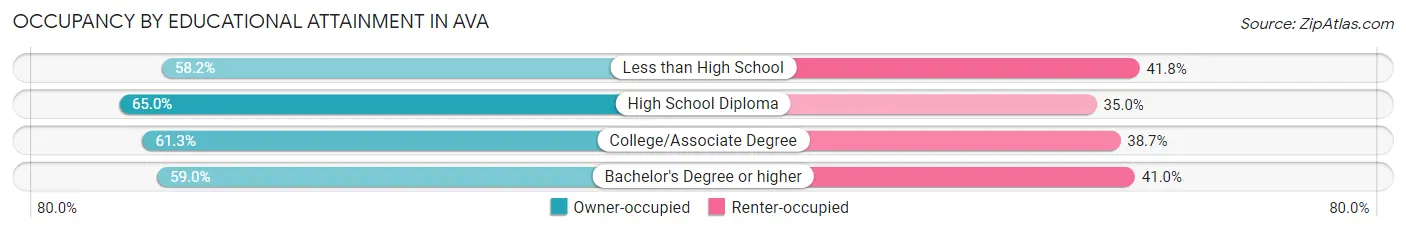
| Household Size | Owner-occupied | Renter-occupied |
| Less than High School | 85 (58.2%) | 61 (41.8%) |
| High School Diploma | 292 (65.0%) | 157 (35.0%) |
| College/Associate Degree | 182 (61.3%) | 115 (38.7%) |
| Bachelor's Degree or higher | 115 (59.0%) | 80 (41.0%) |
Occupancy by Age of Householder in Ava
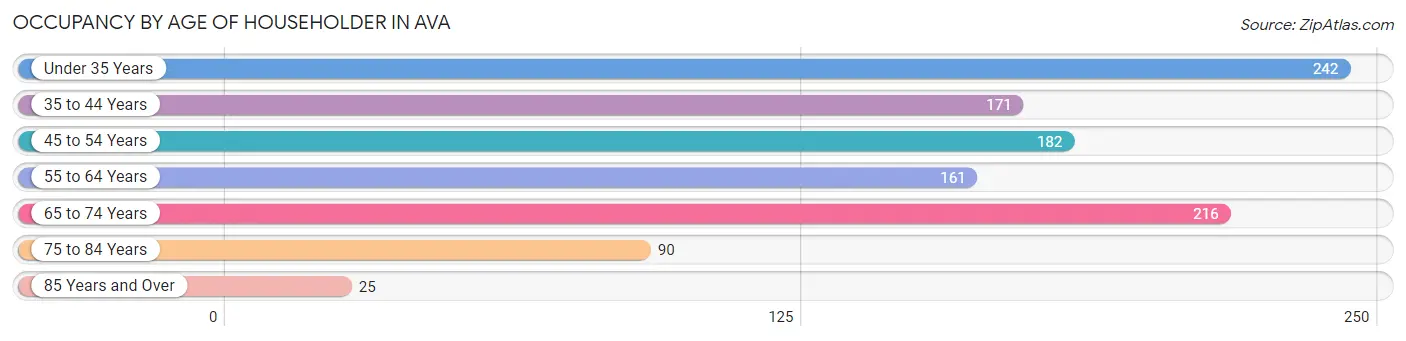
| Age Bracket | # Households | % Households |
| Under 35 Years | 242 | 22.3% |
| 35 to 44 Years | 171 | 15.7% |
| 45 to 54 Years | 182 | 16.7% |
| 55 to 64 Years | 161 | 14.8% |
| 65 to 74 Years | 216 | 19.9% |
| 75 to 84 Years | 90 | 8.3% |
| 85 Years and Over | 25 | 2.3% |
| Total | 1,087 | 100.0% |
Housing Finances in Ava
Median Income by Occupancy in Ava
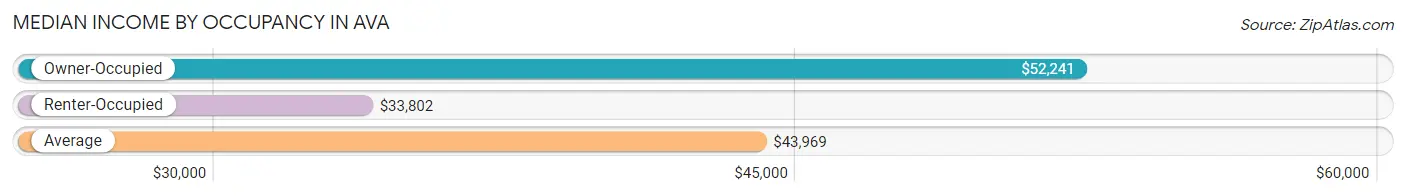
| Occupancy Type | # Households | Median Income |
| Owner-Occupied | 674 (62.0%) | $52,241 |
| Renter-Occupied | 413 (38.0%) | $33,802 |
| Average | 1,087 (100.0%) | $43,969 |
Occupancy by Householder Income Bracket in Ava
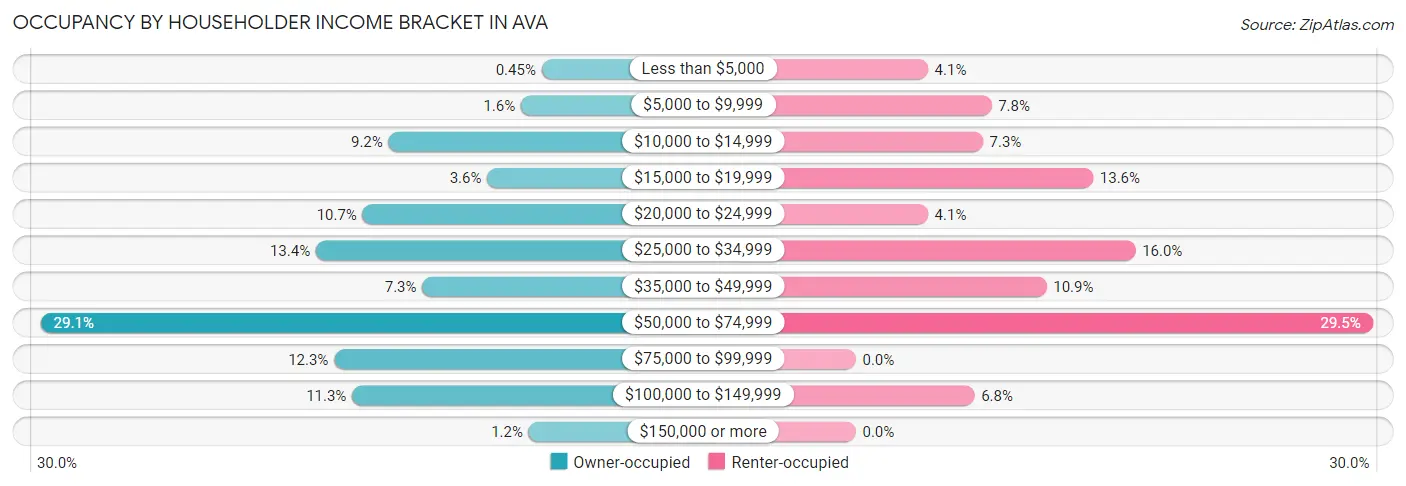
| Income Bracket | Owner-occupied | Renter-occupied |
| Less than $5,000 | 3 (0.4%) | 17 (4.1%) |
| $5,000 to $9,999 | 11 (1.6%) | 32 (7.7%) |
| $10,000 to $14,999 | 62 (9.2%) | 30 (7.3%) |
| $15,000 to $19,999 | 24 (3.6%) | 56 (13.6%) |
| $20,000 to $24,999 | 72 (10.7%) | 17 (4.1%) |
| $25,000 to $34,999 | 90 (13.4%) | 66 (16.0%) |
| $35,000 to $49,999 | 49 (7.3%) | 45 (10.9%) |
| $50,000 to $74,999 | 196 (29.1%) | 122 (29.5%) |
| $75,000 to $99,999 | 83 (12.3%) | 0 (0.0%) |
| $100,000 to $149,999 | 76 (11.3%) | 28 (6.8%) |
| $150,000 or more | 8 (1.2%) | 0 (0.0%) |
| Total | 674 (100.0%) | 413 (100.0%) |
Monthly Housing Cost Tiers in Ava
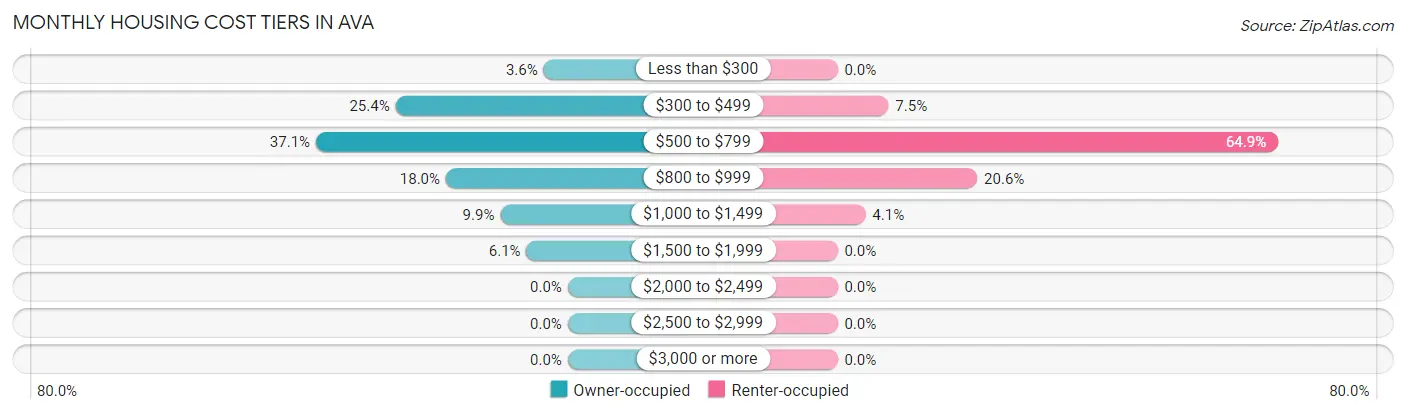
| Monthly Cost | Owner-occupied | Renter-occupied |
| Less than $300 | 24 (3.6%) | 0 (0.0%) |
| $300 to $499 | 171 (25.4%) | 31 (7.5%) |
| $500 to $799 | 250 (37.1%) | 268 (64.9%) |
| $800 to $999 | 121 (17.9%) | 85 (20.6%) |
| $1,000 to $1,499 | 67 (9.9%) | 17 (4.1%) |
| $1,500 to $1,999 | 41 (6.1%) | 0 (0.0%) |
| $2,000 to $2,499 | 0 (0.0%) | 0 (0.0%) |
| $2,500 to $2,999 | 0 (0.0%) | 0 (0.0%) |
| $3,000 or more | 0 (0.0%) | 0 (0.0%) |
| Total | 674 (100.0%) | 413 (100.0%) |
Physical Housing Characteristics in Ava
Housing Structures in Ava
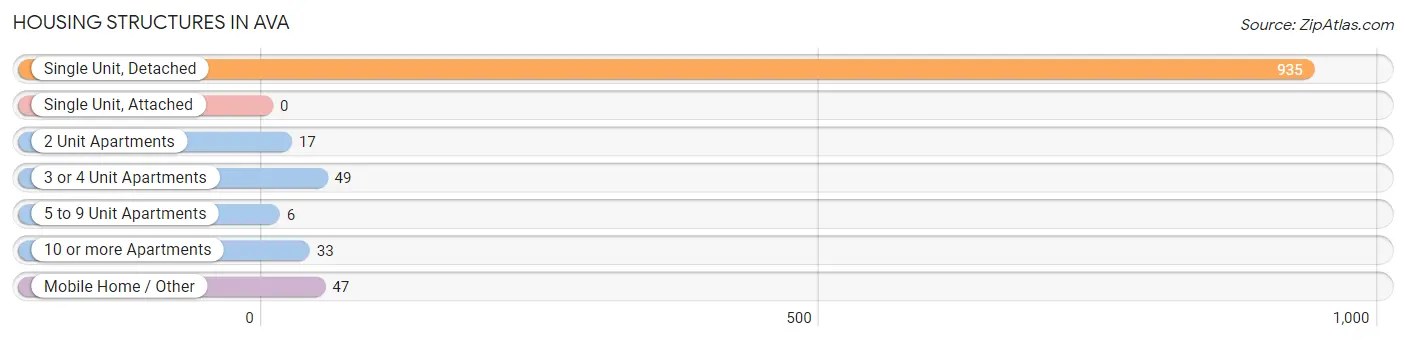
| Structure Type | # Housing Units | % Housing Units |
| Single Unit, Detached | 935 | 86.0% |
| Single Unit, Attached | 0 | 0.0% |
| 2 Unit Apartments | 17 | 1.6% |
| 3 or 4 Unit Apartments | 49 | 4.5% |
| 5 to 9 Unit Apartments | 6 | 0.5% |
| 10 or more Apartments | 33 | 3.0% |
| Mobile Home / Other | 47 | 4.3% |
| Total | 1,087 | 100.0% |
Housing Structures by Occupancy in Ava
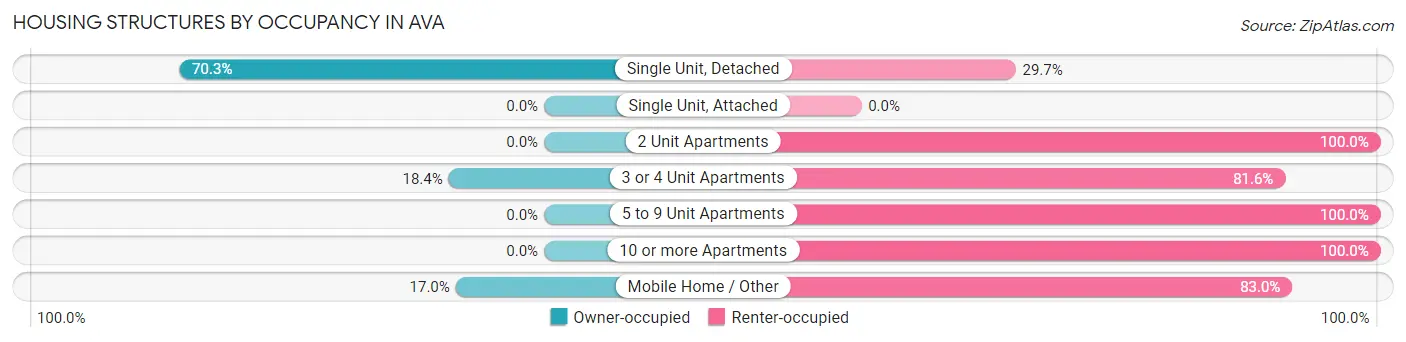
| Structure Type | Owner-occupied | Renter-occupied |
| Single Unit, Detached | 657 (70.3%) | 278 (29.7%) |
| Single Unit, Attached | 0 (0.0%) | 0 (0.0%) |
| 2 Unit Apartments | 0 (0.0%) | 17 (100.0%) |
| 3 or 4 Unit Apartments | 9 (18.4%) | 40 (81.6%) |
| 5 to 9 Unit Apartments | 0 (0.0%) | 6 (100.0%) |
| 10 or more Apartments | 0 (0.0%) | 33 (100.0%) |
| Mobile Home / Other | 8 (17.0%) | 39 (83.0%) |
| Total | 674 (62.0%) | 413 (38.0%) |
Housing Structures by Number of Rooms in Ava
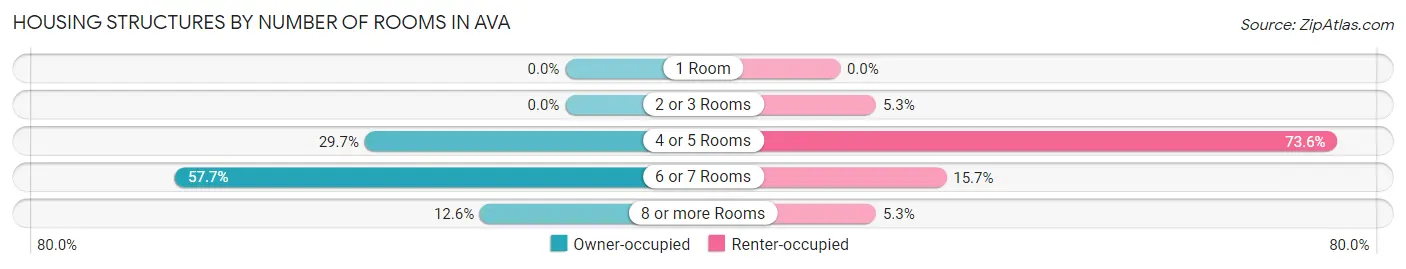
| Number of Rooms | Owner-occupied | Renter-occupied |
| 1 Room | 0 (0.0%) | 0 (0.0%) |
| 2 or 3 Rooms | 0 (0.0%) | 22 (5.3%) |
| 4 or 5 Rooms | 200 (29.7%) | 304 (73.6%) |
| 6 or 7 Rooms | 389 (57.7%) | 65 (15.7%) |
| 8 or more Rooms | 85 (12.6%) | 22 (5.3%) |
| Total | 674 (100.0%) | 413 (100.0%) |
Housing Structure by Heating Type in Ava
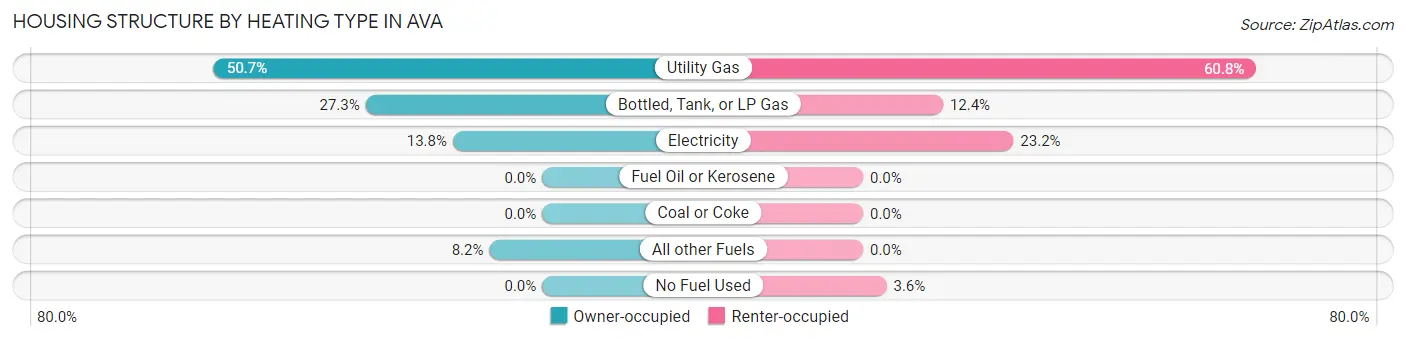
| Heating Type | Owner-occupied | Renter-occupied |
| Utility Gas | 342 (50.7%) | 251 (60.8%) |
| Bottled, Tank, or LP Gas | 184 (27.3%) | 51 (12.3%) |
| Electricity | 93 (13.8%) | 96 (23.2%) |
| Fuel Oil or Kerosene | 0 (0.0%) | 0 (0.0%) |
| Coal or Coke | 0 (0.0%) | 0 (0.0%) |
| All other Fuels | 55 (8.2%) | 0 (0.0%) |
| No Fuel Used | 0 (0.0%) | 15 (3.6%) |
| Total | 674 (100.0%) | 413 (100.0%) |
Household Vehicle Usage in Ava
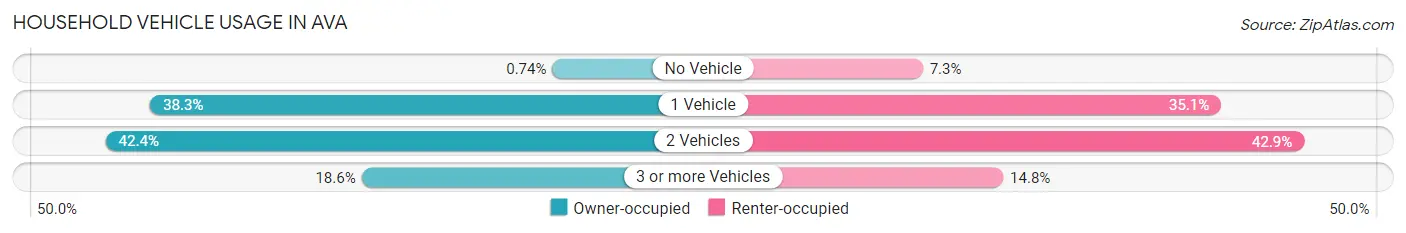
| Vehicles per Household | Owner-occupied | Renter-occupied |
| No Vehicle | 5 (0.7%) | 30 (7.3%) |
| 1 Vehicle | 258 (38.3%) | 145 (35.1%) |
| 2 Vehicles | 286 (42.4%) | 177 (42.9%) |
| 3 or more Vehicles | 125 (18.5%) | 61 (14.8%) |
| Total | 674 (100.0%) | 413 (100.0%) |
Real Estate & Mortgages in Ava
Real Estate and Mortgage Overview in Ava
| Characteristic | Without Mortgage | With Mortgage |
| Housing Units | 274 | 400 |
| Median Property Value | $122,300 | $103,300 |
| Median Household Income | $58,013 | $0 |
| Monthly Housing Costs | $467 | $0 |
| Real Estate Taxes | $582 | $10 |
Property Value by Mortgage Status in Ava
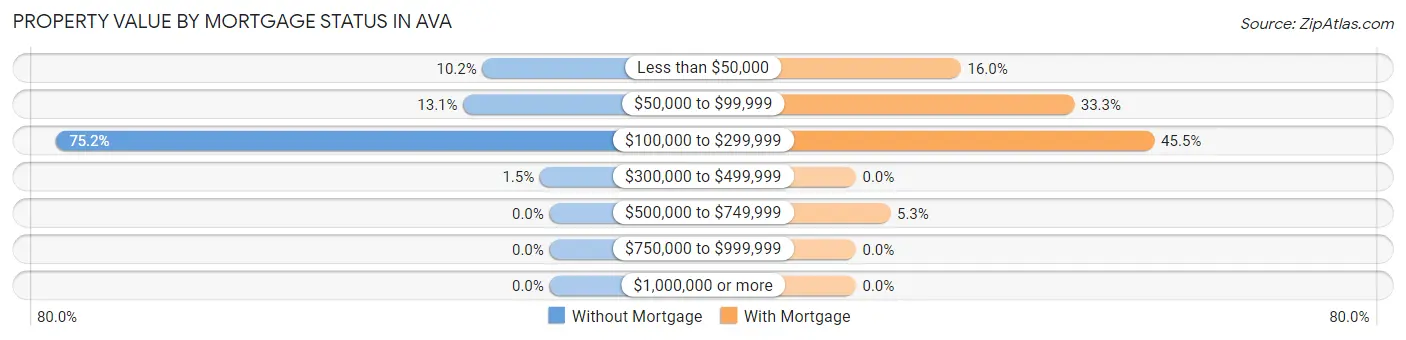
| Property Value | Without Mortgage | With Mortgage |
| Less than $50,000 | 28 (10.2%) | 64 (16.0%) |
| $50,000 to $99,999 | 36 (13.1%) | 133 (33.3%) |
| $100,000 to $299,999 | 206 (75.2%) | 182 (45.5%) |
| $300,000 to $499,999 | 4 (1.5%) | 0 (0.0%) |
| $500,000 to $749,999 | 0 (0.0%) | 21 (5.2%) |
| $750,000 to $999,999 | 0 (0.0%) | 0 (0.0%) |
| $1,000,000 or more | 0 (0.0%) | 0 (0.0%) |
| Total | 274 (100.0%) | 400 (100.0%) |
Household Income by Mortgage Status in Ava
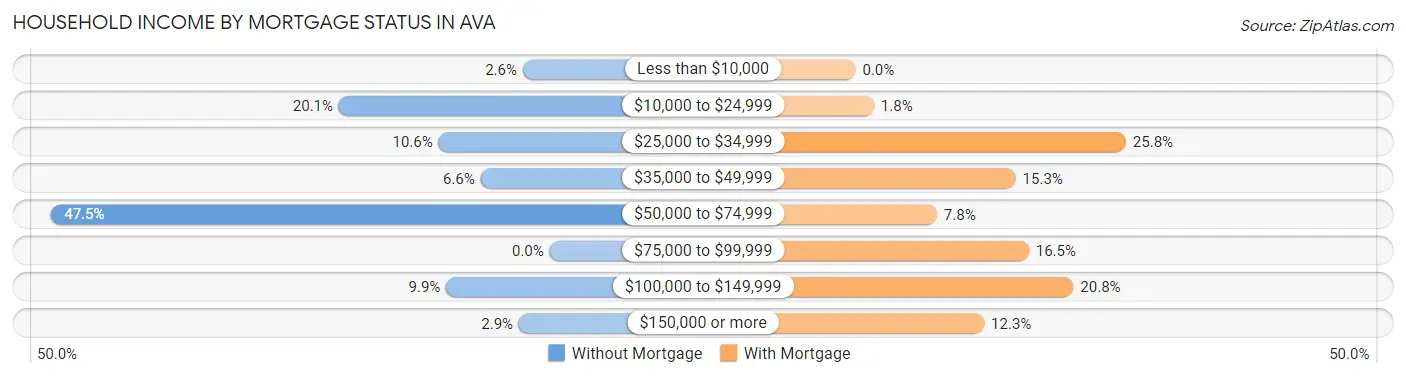
| Household Income | Without Mortgage | With Mortgage |
| Less than $10,000 | 7 (2.5%) | 0 (0.0%) |
| $10,000 to $24,999 | 55 (20.1%) | 7 (1.8%) |
| $25,000 to $34,999 | 29 (10.6%) | 103 (25.8%) |
| $35,000 to $49,999 | 18 (6.6%) | 61 (15.2%) |
| $50,000 to $74,999 | 130 (47.4%) | 31 (7.7%) |
| $75,000 to $99,999 | 0 (0.0%) | 66 (16.5%) |
| $100,000 to $149,999 | 27 (9.9%) | 83 (20.7%) |
| $150,000 or more | 8 (2.9%) | 49 (12.2%) |
| Total | 274 (100.0%) | 400 (100.0%) |
Property Value to Household Income Ratio in Ava

| Value-to-Income Ratio | Without Mortgage | With Mortgage |
| Less than 2.0x | 105 (38.3%) | 44,839 (11,209.7%) |
| 2.0x to 2.9x | 48 (17.5%) | 179 (44.8%) |
| 3.0x to 3.9x | 29 (10.6%) | 47 (11.7%) |
| 4.0x or more | 92 (33.6%) | 72 (18.0%) |
| Total | 274 (100.0%) | 400 (100.0%) |
Real Estate Taxes by Mortgage Status in Ava
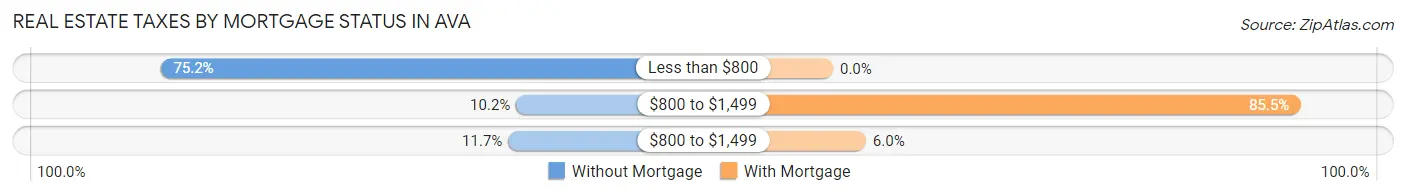
| Property Taxes | Without Mortgage | With Mortgage |
| Less than $800 | 206 (75.2%) | 0 (0.0%) |
| $800 to $1,499 | 28 (10.2%) | 342 (85.5%) |
| $800 to $1,499 | 32 (11.7%) | 24 (6.0%) |
| Total | 274 (100.0%) | 400 (100.0%) |
Health & Disability in Ava
Health Insurance Coverage by Age in Ava
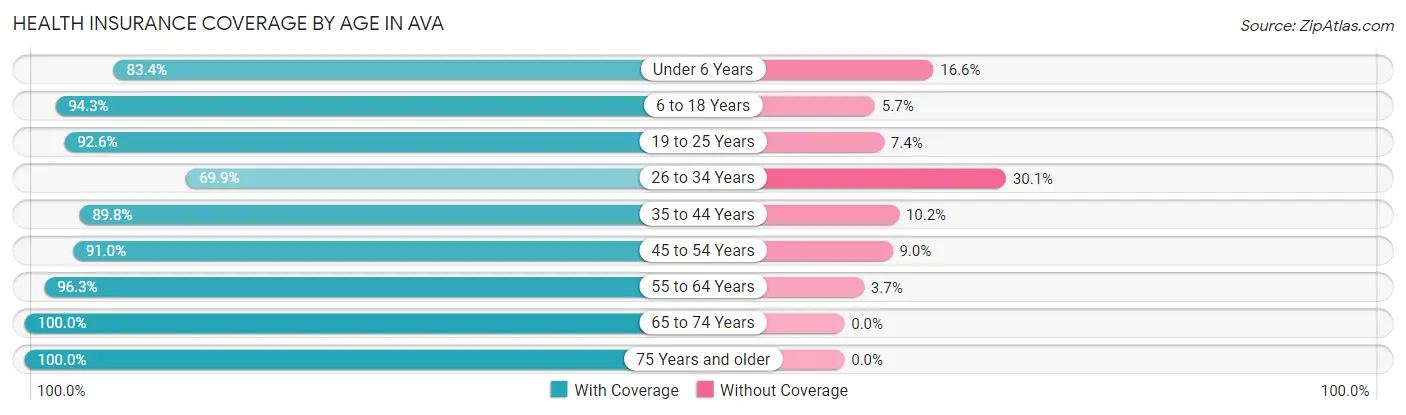
| Age Bracket | With Coverage | Without Coverage |
| Under 6 Years | 231 (83.4%) | 46 (16.6%) |
| 6 to 18 Years | 495 (94.3%) | 30 (5.7%) |
| 19 to 25 Years | 238 (92.6%) | 19 (7.4%) |
| 26 to 34 Years | 204 (69.9%) | 88 (30.1%) |
| 35 to 44 Years | 379 (89.8%) | 43 (10.2%) |
| 45 to 54 Years | 294 (91.0%) | 29 (9.0%) |
| 55 to 64 Years | 184 (96.3%) | 7 (3.7%) |
| 65 to 74 Years | 347 (100.0%) | 0 (0.0%) |
| 75 Years and older | 185 (100.0%) | 0 (0.0%) |
| Total | 2,557 (90.7%) | 262 (9.3%) |
Health Insurance Coverage by Citizenship Status in Ava
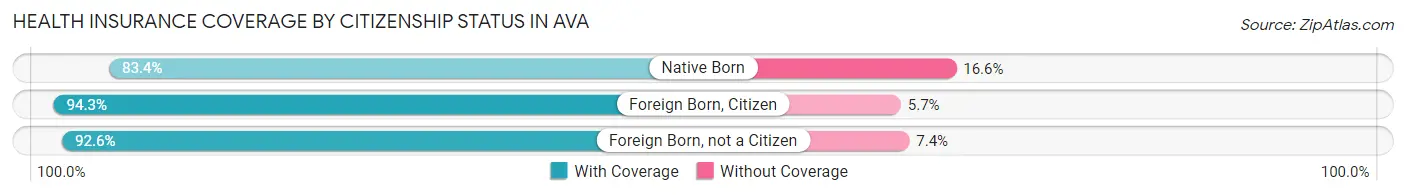
| Citizenship Status | With Coverage | Without Coverage |
| Native Born | 231 (83.4%) | 46 (16.6%) |
| Foreign Born, Citizen | 495 (94.3%) | 30 (5.7%) |
| Foreign Born, not a Citizen | 238 (92.6%) | 19 (7.4%) |
Health Insurance Coverage by Household Income in Ava
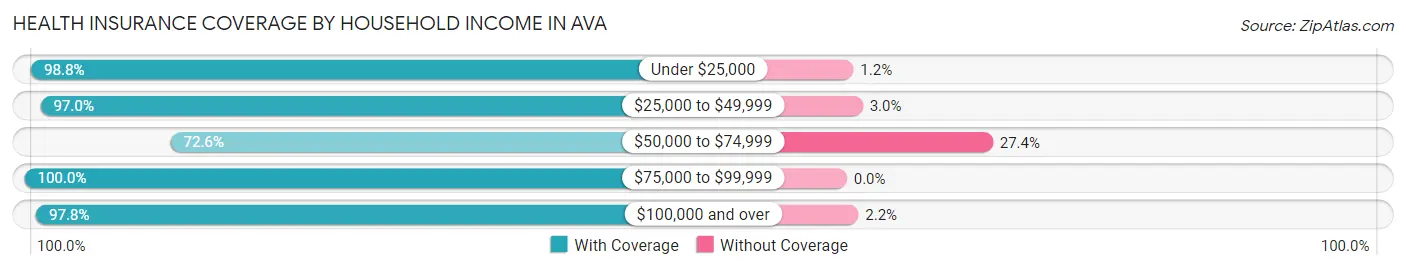
| Household Income | With Coverage | Without Coverage |
| Under $25,000 | 559 (98.8%) | 7 (1.2%) |
| $25,000 to $49,999 | 586 (97.0%) | 18 (3.0%) |
| $50,000 to $74,999 | 600 (72.6%) | 226 (27.4%) |
| $75,000 to $99,999 | 309 (100.0%) | 0 (0.0%) |
| $100,000 and over | 498 (97.8%) | 11 (2.2%) |
Public vs Private Health Insurance Coverage by Age in Ava
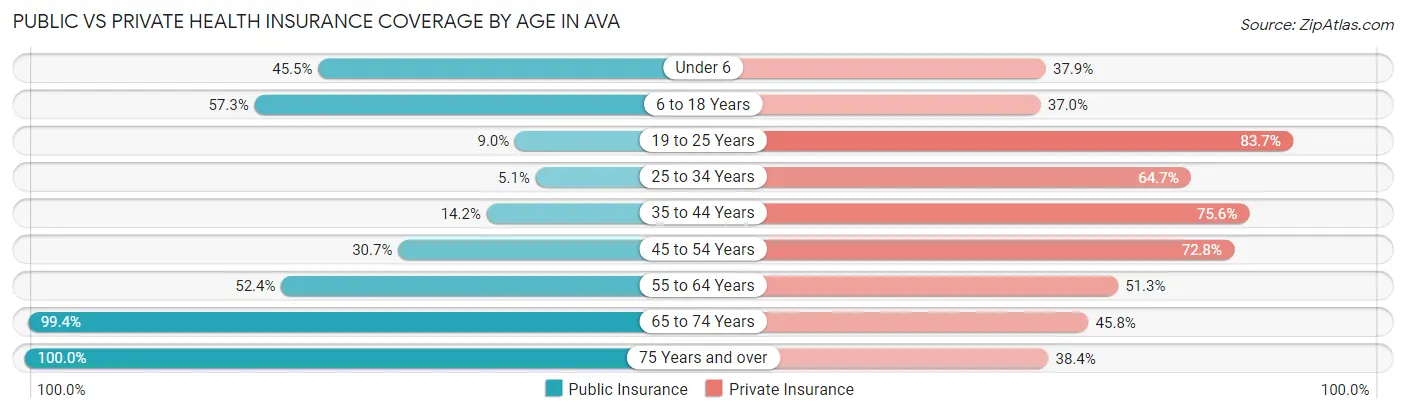
| Age Bracket | Public Insurance | Private Insurance |
| Under 6 | 126 (45.5%) | 105 (37.9%) |
| 6 to 18 Years | 301 (57.3%) | 194 (36.9%) |
| 19 to 25 Years | 23 (8.9%) | 215 (83.7%) |
| 25 to 34 Years | 15 (5.1%) | 189 (64.7%) |
| 35 to 44 Years | 60 (14.2%) | 319 (75.6%) |
| 45 to 54 Years | 99 (30.6%) | 235 (72.8%) |
| 55 to 64 Years | 100 (52.4%) | 98 (51.3%) |
| 65 to 74 Years | 345 (99.4%) | 159 (45.8%) |
| 75 Years and over | 185 (100.0%) | 71 (38.4%) |
| Total | 1,254 (44.5%) | 1,585 (56.2%) |
Disability Status by Sex by Age in Ava
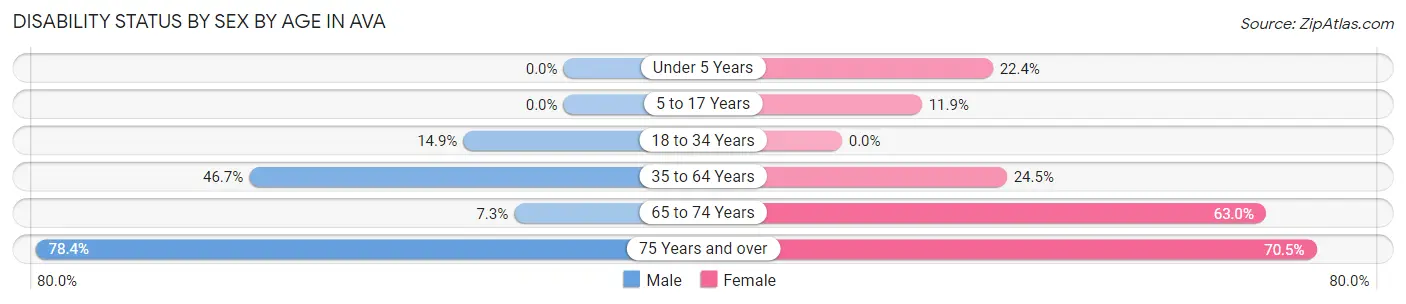
| Age Bracket | Male | Female |
| Under 5 Years | 0 (0.0%) | 26 (22.4%) |
| 5 to 17 Years | 0 (0.0%) | 45 (11.9%) |
| 18 to 34 Years | 51 (14.9%) | 0 (0.0%) |
| 35 to 64 Years | 231 (46.7%) | 108 (24.5%) |
| 65 to 74 Years | 9 (7.3%) | 141 (62.9%) |
| 75 Years and over | 76 (78.3%) | 62 (70.5%) |
Disability Class by Sex by Age in Ava
Disability Class: Hearing Difficulty
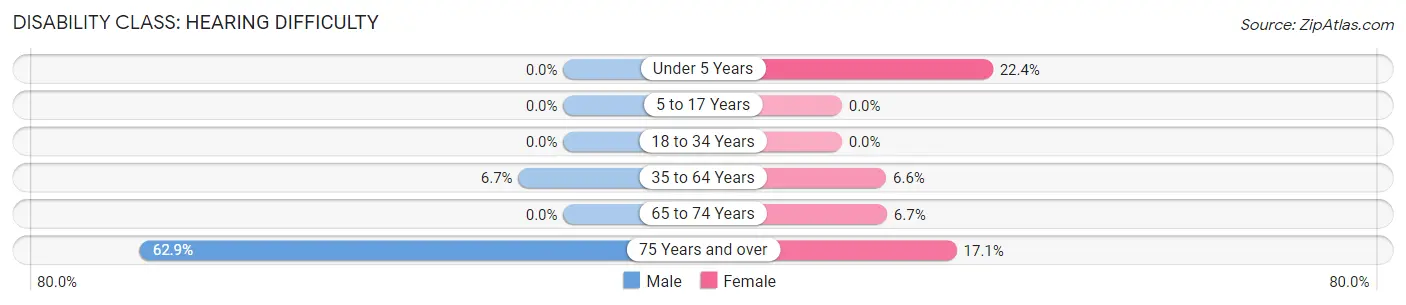
| Age Bracket | Male | Female |
| Under 5 Years | 0 (0.0%) | 26 (22.4%) |
| 5 to 17 Years | 0 (0.0%) | 0 (0.0%) |
| 18 to 34 Years | 0 (0.0%) | 0 (0.0%) |
| 35 to 64 Years | 33 (6.7%) | 29 (6.6%) |
| 65 to 74 Years | 0 (0.0%) | 15 (6.7%) |
| 75 Years and over | 61 (62.9%) | 15 (17.1%) |
Disability Class: Vision Difficulty
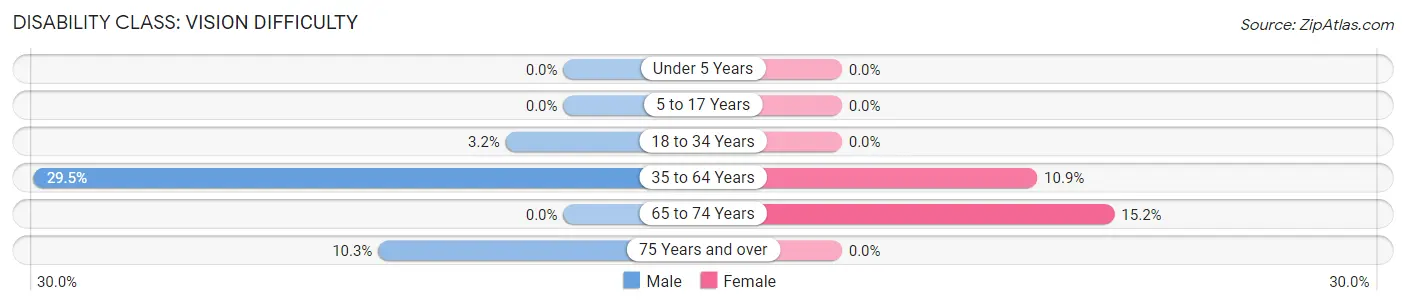
| Age Bracket | Male | Female |
| Under 5 Years | 0 (0.0%) | 0 (0.0%) |
| 5 to 17 Years | 0 (0.0%) | 0 (0.0%) |
| 18 to 34 Years | 11 (3.2%) | 0 (0.0%) |
| 35 to 64 Years | 146 (29.5%) | 48 (10.9%) |
| 65 to 74 Years | 0 (0.0%) | 34 (15.2%) |
| 75 Years and over | 10 (10.3%) | 0 (0.0%) |
Disability Class: Cognitive Difficulty
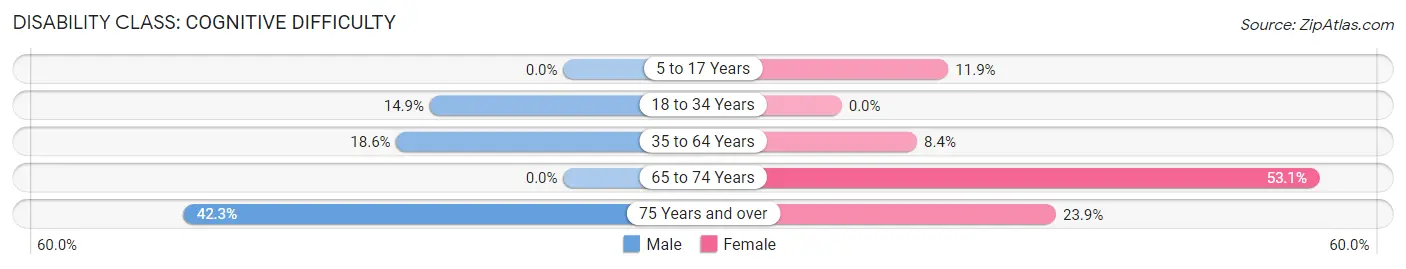
| Age Bracket | Male | Female |
| 5 to 17 Years | 0 (0.0%) | 45 (11.9%) |
| 18 to 34 Years | 51 (14.9%) | 0 (0.0%) |
| 35 to 64 Years | 92 (18.6%) | 37 (8.4%) |
| 65 to 74 Years | 0 (0.0%) | 119 (53.1%) |
| 75 Years and over | 41 (42.3%) | 21 (23.9%) |
Disability Class: Ambulatory Difficulty
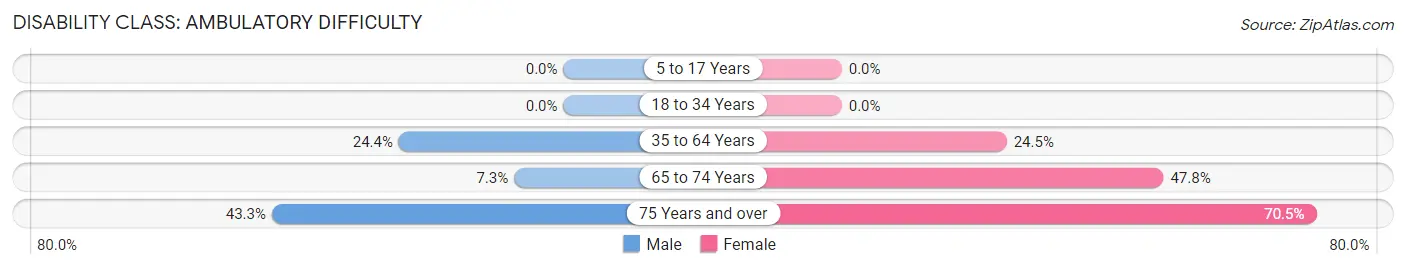
| Age Bracket | Male | Female |
| 5 to 17 Years | 0 (0.0%) | 0 (0.0%) |
| 18 to 34 Years | 0 (0.0%) | 0 (0.0%) |
| 35 to 64 Years | 121 (24.4%) | 108 (24.5%) |
| 65 to 74 Years | 9 (7.3%) | 107 (47.8%) |
| 75 Years and over | 42 (43.3%) | 62 (70.5%) |
Disability Class: Self-Care Difficulty
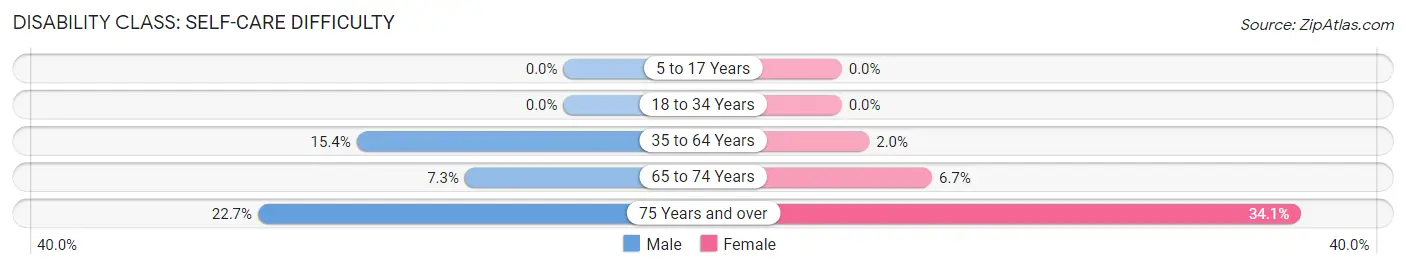
| Age Bracket | Male | Female |
| 5 to 17 Years | 0 (0.0%) | 0 (0.0%) |
| 18 to 34 Years | 0 (0.0%) | 0 (0.0%) |
| 35 to 64 Years | 76 (15.3%) | 9 (2.0%) |
| 65 to 74 Years | 9 (7.3%) | 15 (6.7%) |
| 75 Years and over | 22 (22.7%) | 30 (34.1%) |
Technology Access in Ava
Computing Device Access in Ava
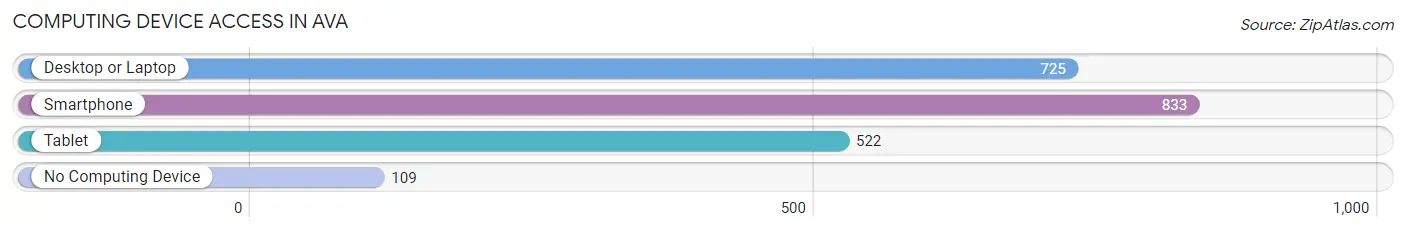
| Device Type | # Households | % Households |
| Desktop or Laptop | 725 | 66.7% |
| Smartphone | 833 | 76.6% |
| Tablet | 522 | 48.0% |
| No Computing Device | 109 | 10.0% |
| Total | 1,087 | 100.0% |
Internet Access in Ava
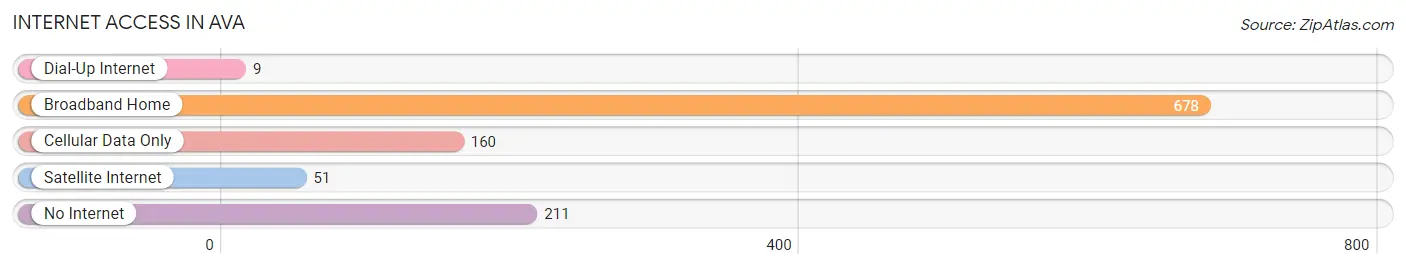
| Internet Type | # Households | % Households |
| Dial-Up Internet | 9 | 0.8% |
| Broadband Home | 678 | 62.4% |
| Cellular Data Only | 160 | 14.7% |
| Satellite Internet | 51 | 4.7% |
| No Internet | 211 | 19.4% |
| Total | 1,087 | 100.0% |
Ava Summary
Ava, Missouri is a small city located in the Ozark Mountains of south-central Missouri. It is the county seat of Douglas County and is situated in the heart of the Ozark National Scenic Riverways. The city has a population of approximately 3,000 people and is located about 90 miles south of Springfield, Missouri.
Geography
Ava is located in the Ozark Mountains of south-central Missouri. The city is situated in the heart of the Ozark National Scenic Riverways, which is a protected area of rivers, streams, and forests. The city is surrounded by rolling hills and is located in a valley between two mountain ranges. The city is located at an elevation of 1,000 feet and is situated on the banks of the North Fork River.
The climate in Ava is humid subtropical, with hot summers and mild winters. The average annual temperature is around 60 degrees Fahrenheit, with an average high of around 80 degrees in the summer and an average low of around 40 degrees in the winter. The average annual precipitation is around 40 inches.
Economy
Ava’s economy is largely based on agriculture and tourism. The city is home to several farms and ranches, and the surrounding area is known for its cattle and dairy production. The city is also home to several small businesses, including restaurants, retail stores, and service providers.
Tourism is an important part of the local economy. The city is home to several attractions, including the Ozark National Scenic Riverways, which is a protected area of rivers, streams, and forests. The city is also home to several historic sites, including the Ava Courthouse, which was built in 1871.
Demographics
As of the 2010 census, Ava had a population of 3,000 people. The racial makeup of the city was 97.2% White, 0.7% African American, 0.3% Native American, 0.2% Asian, 0.1% Pacific Islander, 0.3% from other races, and 1.3% from two or more races. Hispanic or Latino of any race were 1.3% of the population.
The median income for a household in Ava was $30,000, and the median income for a family was $35,000. The per capita income for the city was $15,000. About 17.5% of the population was below the poverty line.
Conclusion
Ava, Missouri is a small city located in the Ozark Mountains of south-central Missouri. It is the county seat of Douglas County and is situated in the heart of the Ozark National Scenic Riverways. The city has a population of approximately 3,000 people and is located about 90 miles south of Springfield, Missouri. The economy of Ava is largely based on agriculture and tourism, and the city is home to several attractions, including the Ozark National Scenic Riverways. The racial makeup of the city is predominantly White, with a small percentage of African American, Native American, Asian, and Pacific Islander residents. The median income for a household in Ava is $30,000, and the per capita income for the city is $15,000.
Common Questions
What is Per Capita Income in Ava?
Per Capita income in Ava is $24,280.
What is the Median Family Income in Ava?
Median Family Income in Ava is $59,513.
What is the Median Household income in Ava?
Median Household Income in Ava is $43,969.
What is Income or Wage Gap in Ava?
Income or Wage Gap in Ava is 25.8%.
Women in Ava earn 74.2 cents for every dollar earned by a man.
What is Inequality or Gini Index in Ava?
Inequality or Gini Index in Ava is 0.48.
What is the Total Population of Ava?
Total Population of Ava is 2,933.
What is the Total Male Population of Ava?
Total Male Population of Ava is 1,413.
What is the Total Female Population of Ava?
Total Female Population of Ava is 1,520.
What is the Ratio of Males per 100 Females in Ava?
There are 92.96 Males per 100 Females in Ava.
What is the Ratio of Females per 100 Males in Ava?
There are 107.57 Females per 100 Males in Ava.
What is the Median Population Age in Ava?
Median Population Age in Ava is 38.8 Years.
What is the Average Family Size in Ava
Average Family Size in Ava is 3.3 People.
What is the Average Household Size in Ava
Average Household Size in Ava is 2.6 People.
How Large is the Labor Force in Ava?
There are 1,130 People in the Labor Forcein in Ava.
What is the Percentage of People in the Labor Force in Ava?
52.0% of People are in the Labor Force in Ava.
What is the Unemployment Rate in Ava?
Unemployment Rate in Ava is 8.5%.