Augusta, MO Map & Demographics
Augusta Map
Augusta Overview
$43,581
PER CAPITA INCOME
$104,083
AVG FAMILY INCOME
$98,393
AVG HOUSEHOLD INCOME
63.7%
WAGE / INCOME GAP [ % ]
36.3¢/ $1
WAGE / INCOME GAP [ $ ]
0.38
INEQUALITY / GINI INDEX
290
TOTAL POPULATION
130
MALE POPULATION
160
FEMALE POPULATION
81.25
MALES / 100 FEMALES
123.08
FEMALES / 100 MALES
51.2
MEDIAN AGE
2.8
AVG FAMILY SIZE
2.4
AVG HOUSEHOLD SIZE
138
LABOR FORCE [ PEOPLE ]
60.5%
PERCENT IN LABOR FORCE
2.2%
UNEMPLOYMENT RATE
Augusta Zip Codes
Augusta Area Codes
Income in Augusta
Income Overview in Augusta
Per Capita Income in Augusta is $43,581, while median incomes of families and households are $104,083 and $98,393 respectively.
| Characteristic | Number | Measure |
| Per Capita Income | 290 | $43,581 |
| Median Family Income | 87 | $104,083 |
| Mean Family Income | 87 | $118,583 |
| Median Household Income | 123 | $98,393 |
| Mean Household Income | 123 | $102,306 |
| Income Deficit | 87 | $0 |
| Wage / Income Gap (%) | 290 | 63.74% |
| Wage / Income Gap ($) | 290 | 36.26¢ per $1 |
| Gini / Inequality Index | 290 | 0.38 |
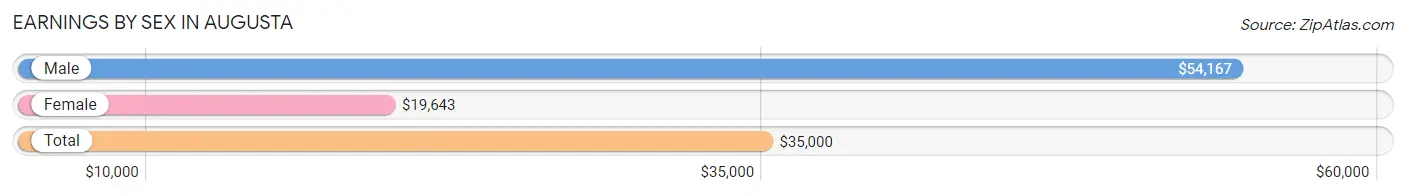
Earnings by Sex in Augusta
Average Earnings in Augusta are $35,000, $54,167 for men and $19,643 for women, a difference of 63.7%.
| Sex | Number | Average Earnings |
| Male | 74 (43.0%) | $54,167 |
| Female | 98 (57.0%) | $19,643 |
| Total | 172 (100.0%) | $35,000 |
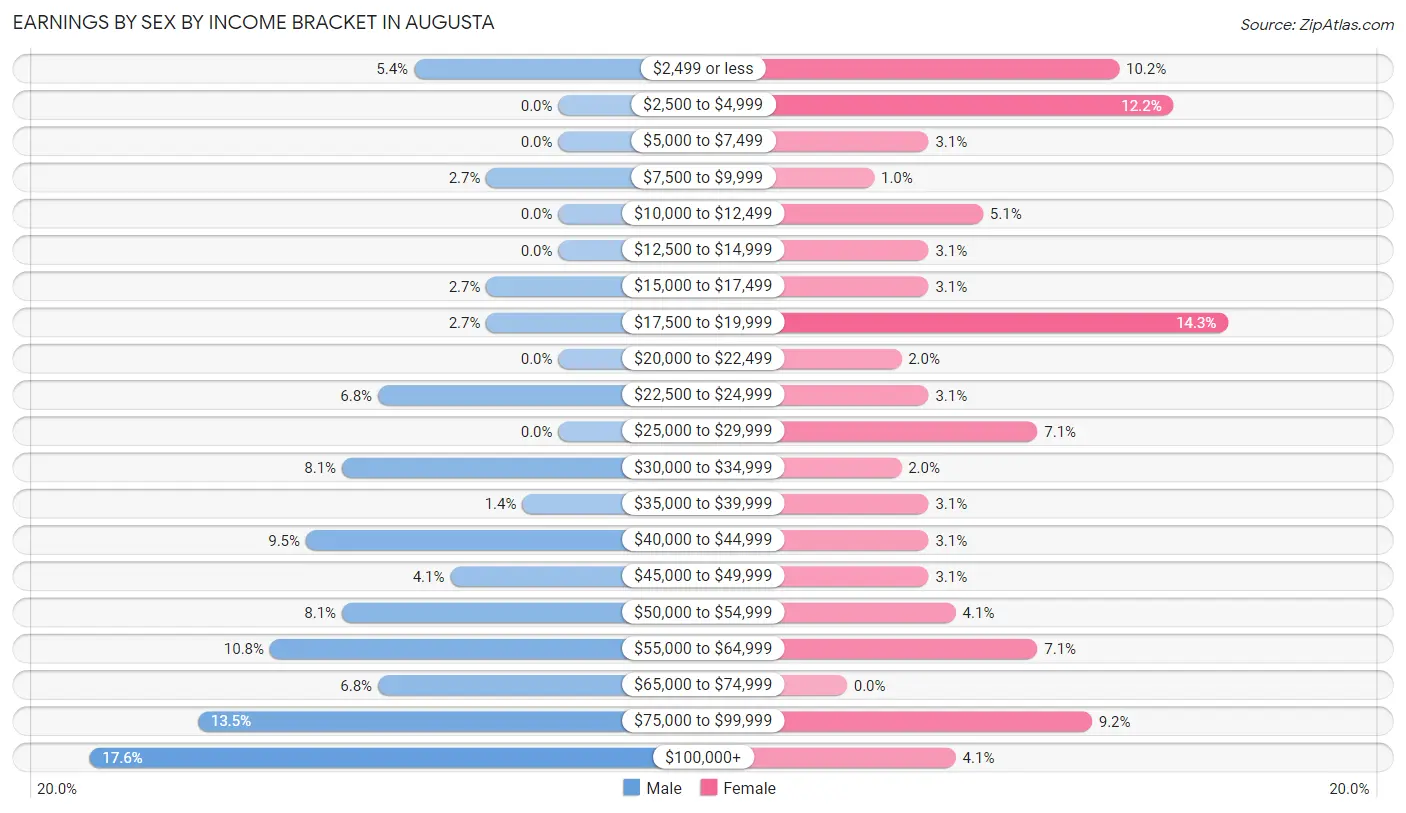
Earnings by Sex by Income Bracket in Augusta
The most common earnings brackets in Augusta are $100,000+ for men (13 | 17.6%) and $17,500 to $19,999 for women (14 | 14.3%).
| Income | Male | Female |
| $2,499 or less | 4 (5.4%) | 10 (10.2%) |
| $2,500 to $4,999 | 0 (0.0%) | 12 (12.2%) |
| $5,000 to $7,499 | 0 (0.0%) | 3 (3.1%) |
| $7,500 to $9,999 | 2 (2.7%) | 1 (1.0%) |
| $10,000 to $12,499 | 0 (0.0%) | 5 (5.1%) |
| $12,500 to $14,999 | 0 (0.0%) | 3 (3.1%) |
| $15,000 to $17,499 | 2 (2.7%) | 3 (3.1%) |
| $17,500 to $19,999 | 2 (2.7%) | 14 (14.3%) |
| $20,000 to $22,499 | 0 (0.0%) | 2 (2.0%) |
| $22,500 to $24,999 | 5 (6.8%) | 3 (3.1%) |
| $25,000 to $29,999 | 0 (0.0%) | 7 (7.1%) |
| $30,000 to $34,999 | 6 (8.1%) | 2 (2.0%) |
| $35,000 to $39,999 | 1 (1.3%) | 3 (3.1%) |
| $40,000 to $44,999 | 7 (9.5%) | 3 (3.1%) |
| $45,000 to $49,999 | 3 (4.1%) | 3 (3.1%) |
| $50,000 to $54,999 | 6 (8.1%) | 4 (4.1%) |
| $55,000 to $64,999 | 8 (10.8%) | 7 (7.1%) |
| $65,000 to $74,999 | 5 (6.8%) | 0 (0.0%) |
| $75,000 to $99,999 | 10 (13.5%) | 9 (9.2%) |
| $100,000+ | 13 (17.6%) | 4 (4.1%) |
| Total | 74 (100.0%) | 98 (100.0%) |
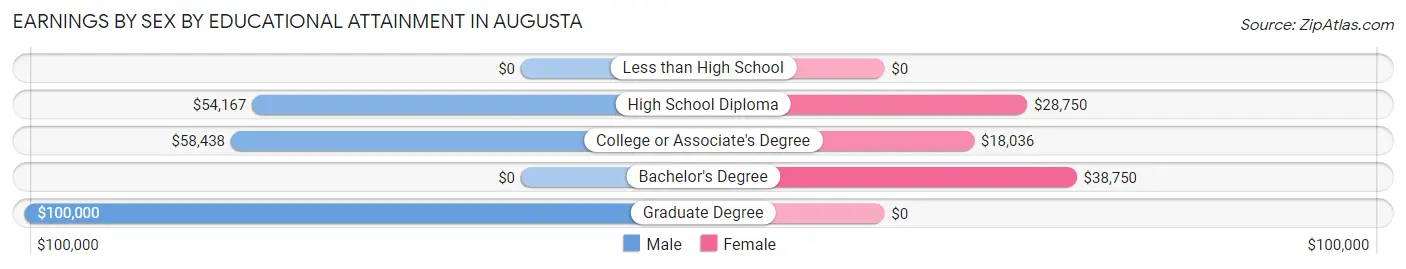
Earnings by Sex by Educational Attainment in Augusta
Average earnings in Augusta are $56,250 for men and $20,000 for women, a difference of 64.4%. Men with an educational attainment of graduate degree enjoy the highest average annual earnings of $100,000, while those with high school diploma education earn the least with $54,167. Women with an educational attainment of bachelor's degree earn the most with the average annual earnings of $38,750, while those with college or associate's degree education have the smallest earnings of $18,036.
| Educational Attainment | Male Income | Female Income |
| Less than High School | - | - |
| High School Diploma | $54,167 | $28,750 |
| College or Associate's Degree | $58,438 | $18,036 |
| Bachelor's Degree | - | - |
| Graduate Degree | $100,000 | $0 |
| Total | $56,250 | $20,000 |
Family Income in Augusta
Family Income Brackets in Augusta
According to the Augusta family income data, there are 41 families falling into the $100,000 to $149,999 income range, which is the most common income bracket and makes up 47.1% of all families.
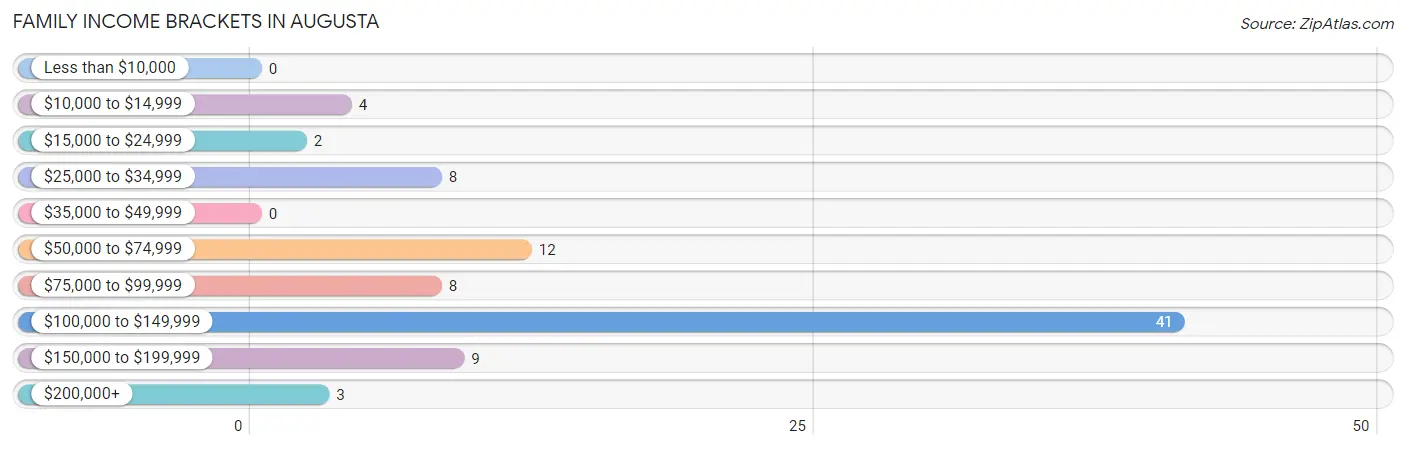
| Income Bracket | # Families | % Families |
| Less than $10,000 | 0 | 0.0% |
| $10,000 to $14,999 | 4 | 4.6% |
| $15,000 to $24,999 | 2 | 2.3% |
| $25,000 to $34,999 | 8 | 9.2% |
| $35,000 to $49,999 | 0 | 0.0% |
| $50,000 to $74,999 | 12 | 13.8% |
| $75,000 to $99,999 | 8 | 9.2% |
| $100,000 to $149,999 | 41 | 47.1% |
| $150,000 to $199,999 | 9 | 10.3% |
| $200,000+ | 3 | 3.4% |
Family Income by Famaliy Size in Augusta
4-person families (14 | 16.1%) account for the highest median family income in Augusta with $138,750 per family, while 2-person families (44 | 50.6%) have the highest median income of $51,750 per family member.
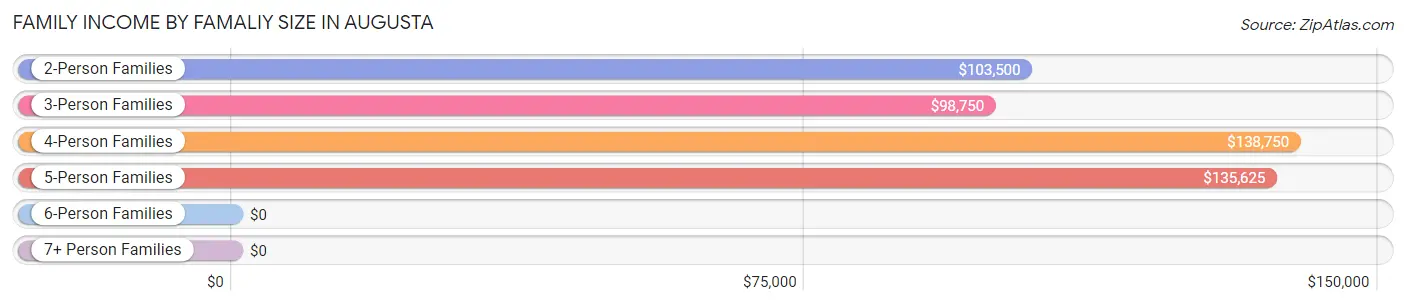
| Income Bracket | # Families | Median Income |
| 2-Person Families | 44 (50.6%) | $103,500 |
| 3-Person Families | 21 (24.1%) | $98,750 |
| 4-Person Families | 14 (16.1%) | $138,750 |
| 5-Person Families | 6 (6.9%) | $135,625 |
| 6-Person Families | 2 (2.3%) | $0 |
| 7+ Person Families | 0 (0.0%) | $0 |
| Total | 87 (100.0%) | $104,083 |
Family Income by Number of Earners in Augusta
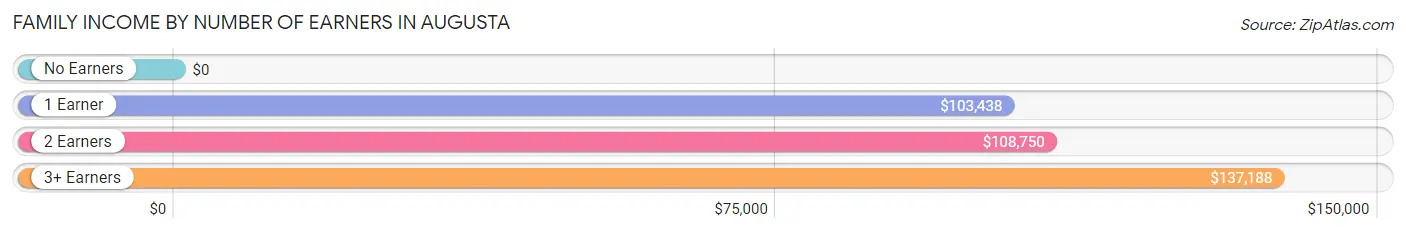
| Number of Earners | # Families | Median Income |
| No Earners | 7 (8.1%) | $0 |
| 1 Earner | 23 (26.4%) | $103,438 |
| 2 Earners | 46 (52.9%) | $108,750 |
| 3+ Earners | 11 (12.6%) | $137,188 |
| Total | 87 (100.0%) | $104,083 |
Household Income in Augusta
Household Income Brackets in Augusta
With 43 households falling in the category, the $100,000 to $149,999 income range is the most frequent in Augusta, accounting for 35.0% of all households.
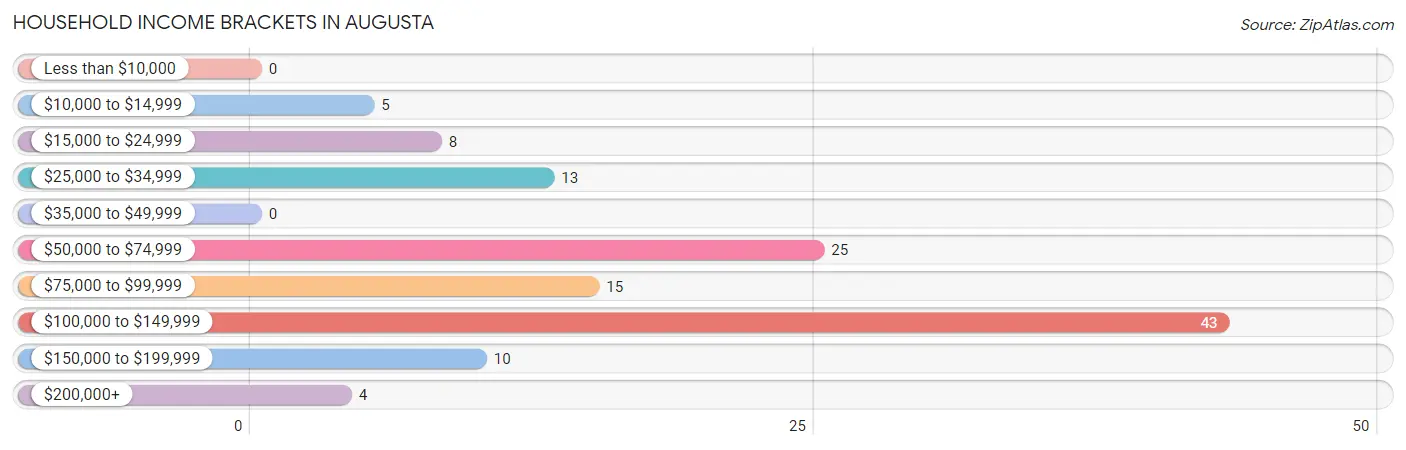
| Income Bracket | # Households | % Households |
| Less than $10,000 | 0 | 0.0% |
| $10,000 to $14,999 | 5 | 4.1% |
| $15,000 to $24,999 | 8 | 6.5% |
| $25,000 to $34,999 | 13 | 10.6% |
| $35,000 to $49,999 | 0 | 0.0% |
| $50,000 to $74,999 | 25 | 20.3% |
| $75,000 to $99,999 | 15 | 12.2% |
| $100,000 to $149,999 | 43 | 35.0% |
| $150,000 to $199,999 | 10 | 8.1% |
| $200,000+ | 4 | 3.3% |
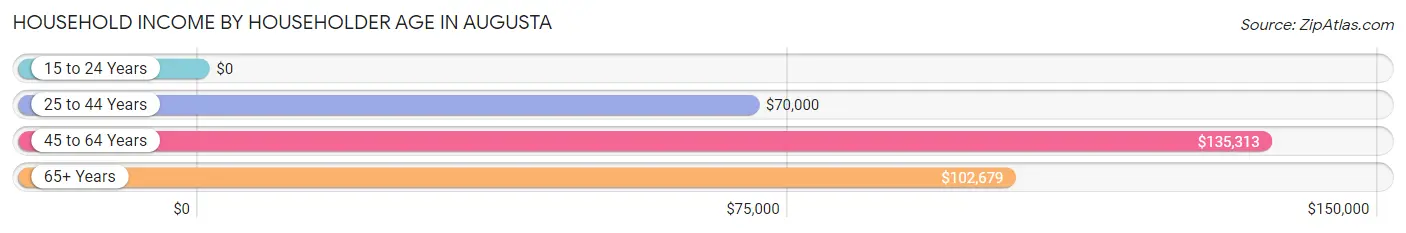
Household Income by Householder Age in Augusta
The median household income in Augusta is $98,393, with the highest median household income of $135,313 found in the 45 to 64 years age bracket for the primary householder. A total of 45 households (36.6%) fall into this category.
| Income Bracket | # Households | Median Income |
| 15 to 24 Years | 0 (0.0%) | $0 |
| 25 to 44 Years | 28 (22.8%) | $70,000 |
| 45 to 64 Years | 45 (36.6%) | $135,313 |
| 65+ Years | 50 (40.6%) | $102,679 |
| Total | 123 (100.0%) | $98,393 |
Poverty in Augusta
Income Below Poverty by Sex and Age in Augusta
With 3.8% poverty level for males and 3.7% for females among the residents of Augusta, 5 year old males and 75 year old and over females are the most vulnerable to poverty, with 1 males (33.3%) and 1 females (11.1%) in their respective age groups living below the poverty level.
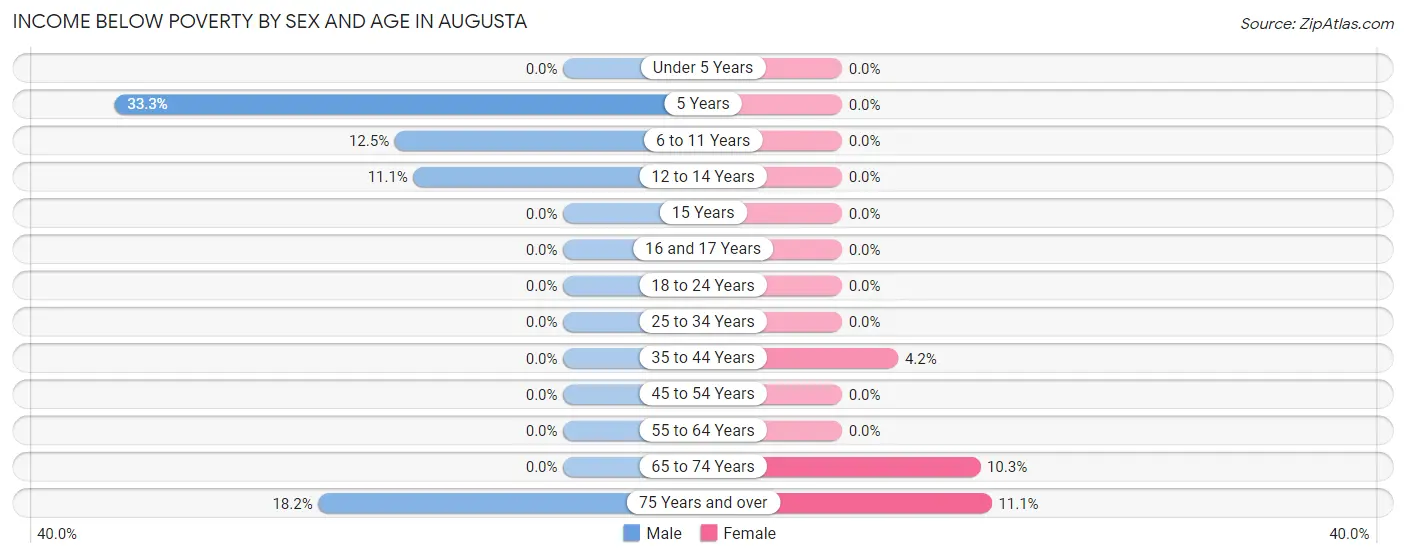
| Age Bracket | Male | Female |
| Under 5 Years | 0 (0.0%) | 0 (0.0%) |
| 5 Years | 1 (33.3%) | 0 (0.0%) |
| 6 to 11 Years | 1 (12.5%) | 0 (0.0%) |
| 12 to 14 Years | 1 (11.1%) | 0 (0.0%) |
| 15 Years | 0 (0.0%) | 0 (0.0%) |
| 16 and 17 Years | 0 (0.0%) | 0 (0.0%) |
| 18 to 24 Years | 0 (0.0%) | 0 (0.0%) |
| 25 to 34 Years | 0 (0.0%) | 0 (0.0%) |
| 35 to 44 Years | 0 (0.0%) | 1 (4.2%) |
| 45 to 54 Years | 0 (0.0%) | 0 (0.0%) |
| 55 to 64 Years | 0 (0.0%) | 0 (0.0%) |
| 65 to 74 Years | 0 (0.0%) | 4 (10.3%) |
| 75 Years and over | 2 (18.2%) | 1 (11.1%) |
| Total | 5 (3.8%) | 6 (3.7%) |
Income Above Poverty by Sex and Age in Augusta
According to the poverty statistics in Augusta, males aged under 5 years and females aged under 5 years are the age groups that are most secure financially, with 100.0% of males and 100.0% of females in these age groups living above the poverty line.
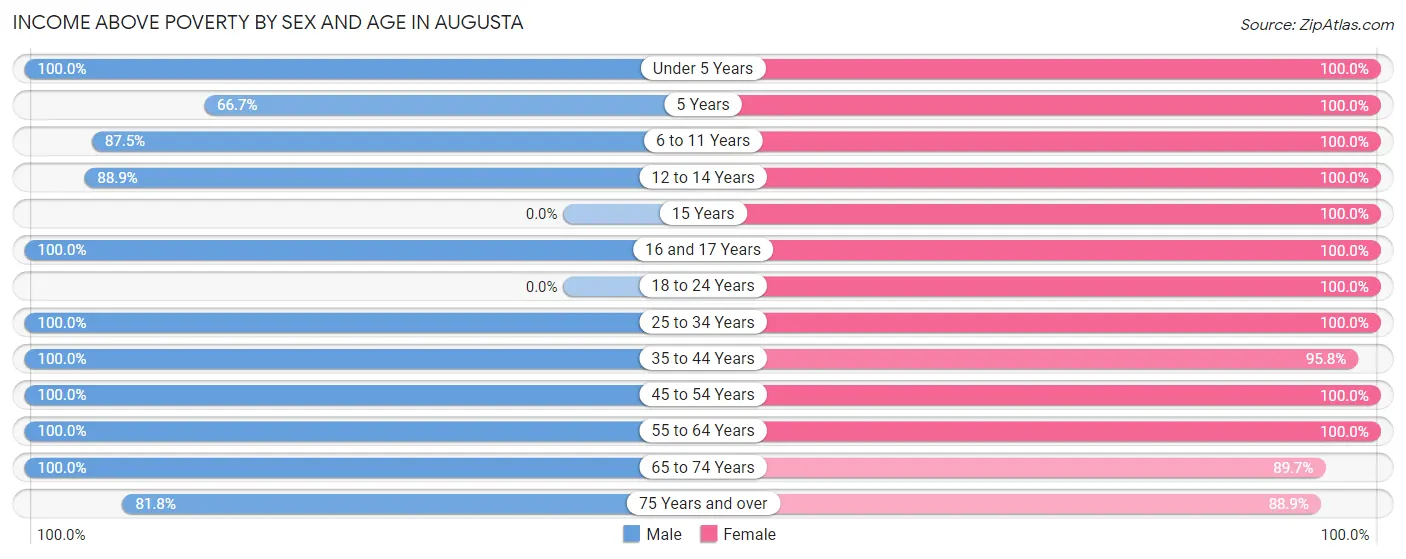
| Age Bracket | Male | Female |
| Under 5 Years | 4 (100.0%) | 3 (100.0%) |
| 5 Years | 2 (66.7%) | 1 (100.0%) |
| 6 to 11 Years | 7 (87.5%) | 16 (100.0%) |
| 12 to 14 Years | 8 (88.9%) | 13 (100.0%) |
| 15 Years | 0 (0.0%) | 5 (100.0%) |
| 16 and 17 Years | 4 (100.0%) | 1 (100.0%) |
| 18 to 24 Years | 0 (0.0%) | 4 (100.0%) |
| 25 to 34 Years | 13 (100.0%) | 11 (100.0%) |
| 35 to 44 Years | 9 (100.0%) | 23 (95.8%) |
| 45 to 54 Years | 28 (100.0%) | 19 (100.0%) |
| 55 to 64 Years | 17 (100.0%) | 15 (100.0%) |
| 65 to 74 Years | 24 (100.0%) | 35 (89.7%) |
| 75 Years and over | 9 (81.8%) | 8 (88.9%) |
| Total | 125 (96.2%) | 154 (96.3%) |
Income Below Poverty Among Married-Couple Families in Augusta
The poverty statistics for married-couple families in Augusta show that 3.8% or 3 of the total 79 families live below the poverty line. Families with no children have the highest poverty rate of 5.9%, comprising of 3 families. On the other hand, families with 1 or 2 children have the lowest poverty rate of 0.0%, which includes 0 families.
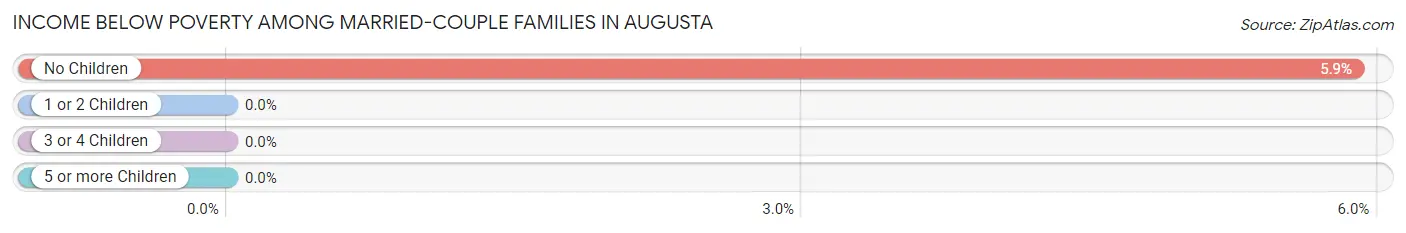
| Children | Above Poverty | Below Poverty |
| No Children | 48 (94.1%) | 3 (5.9%) |
| 1 or 2 Children | 24 (100.0%) | 0 (0.0%) |
| 3 or 4 Children | 4 (100.0%) | 0 (0.0%) |
| 5 or more Children | 0 (0.0%) | 0 (0.0%) |
| Total | 76 (96.2%) | 3 (3.8%) |
Income Below Poverty Among Single-Parent Households in Augusta

| Children | Single Father | Single Mother |
| No Children | 0 (0.0%) | 0 (0.0%) |
| 1 or 2 Children | 0 (0.0%) | 0 (0.0%) |
| 3 or 4 Children | 0 (0.0%) | 1 (50.0%) |
| 5 or more Children | 0 (0.0%) | 0 (0.0%) |
| Total | 0 (0.0%) | 1 (14.3%) |
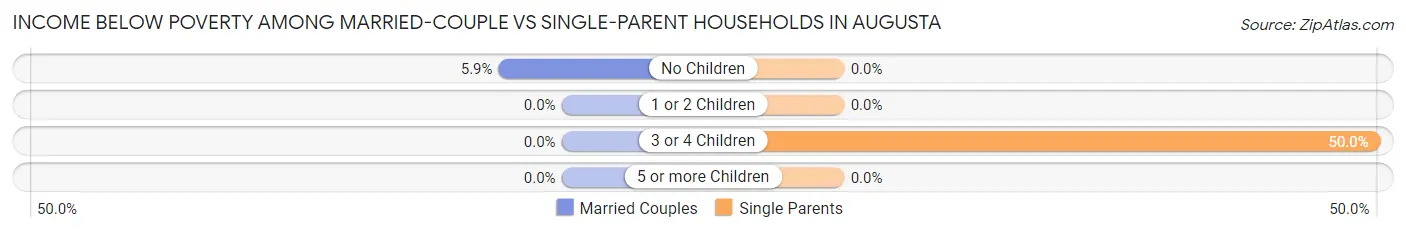
Income Below Poverty Among Married-Couple vs Single-Parent Households in Augusta
The poverty data for Augusta shows that 3 of the married-couple family households (3.8%) and 1 of the single-parent households (12.5%) are living below the poverty level. Within the married-couple family households, those with no children have the highest poverty rate, with 3 households (5.9%) falling below the poverty line. Among the single-parent households, those with 3 or 4 children have the highest poverty rate, with 1 household (50.0%) living below poverty.
| Children | Married-Couple Families | Single-Parent Households |
| No Children | 3 (5.9%) | 0 (0.0%) |
| 1 or 2 Children | 0 (0.0%) | 0 (0.0%) |
| 3 or 4 Children | 0 (0.0%) | 1 (50.0%) |
| 5 or more Children | 0 (0.0%) | 0 (0.0%) |
| Total | 3 (3.8%) | 1 (12.5%) |
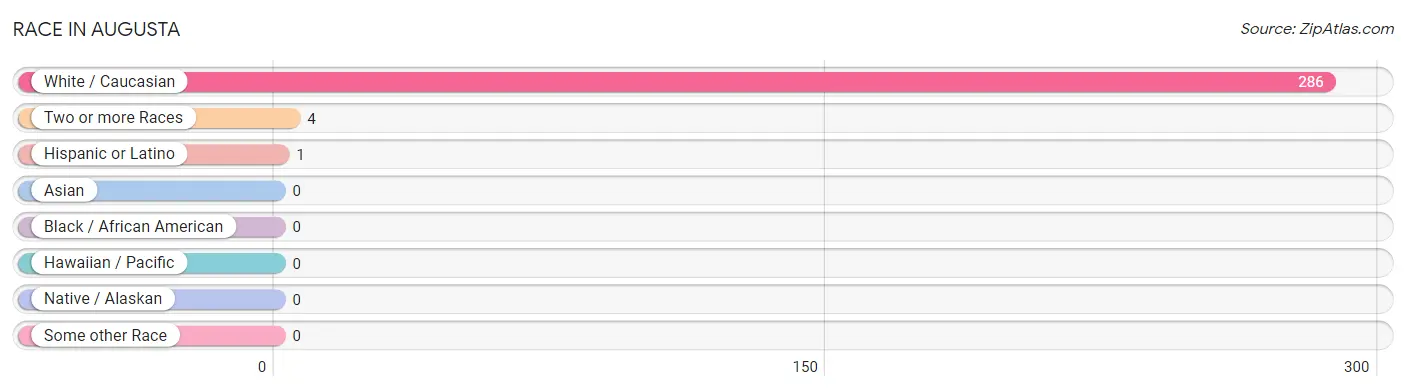
Race in Augusta
The most populous races in Augusta are White / Caucasian (286 | 98.6%), Two or more Races (4 | 1.4%), and Hispanic or Latino (1 | 0.3%).
| Race | # Population | % Population |
| Asian | 0 | 0.0% |
| Black / African American | 0 | 0.0% |
| Hawaiian / Pacific | 0 | 0.0% |
| Hispanic or Latino | 1 | 0.3% |
| Native / Alaskan | 0 | 0.0% |
| White / Caucasian | 286 | 98.6% |
| Two or more Races | 4 | 1.4% |
| Some other Race | 0 | 0.0% |
| Total | 290 | 100.0% |
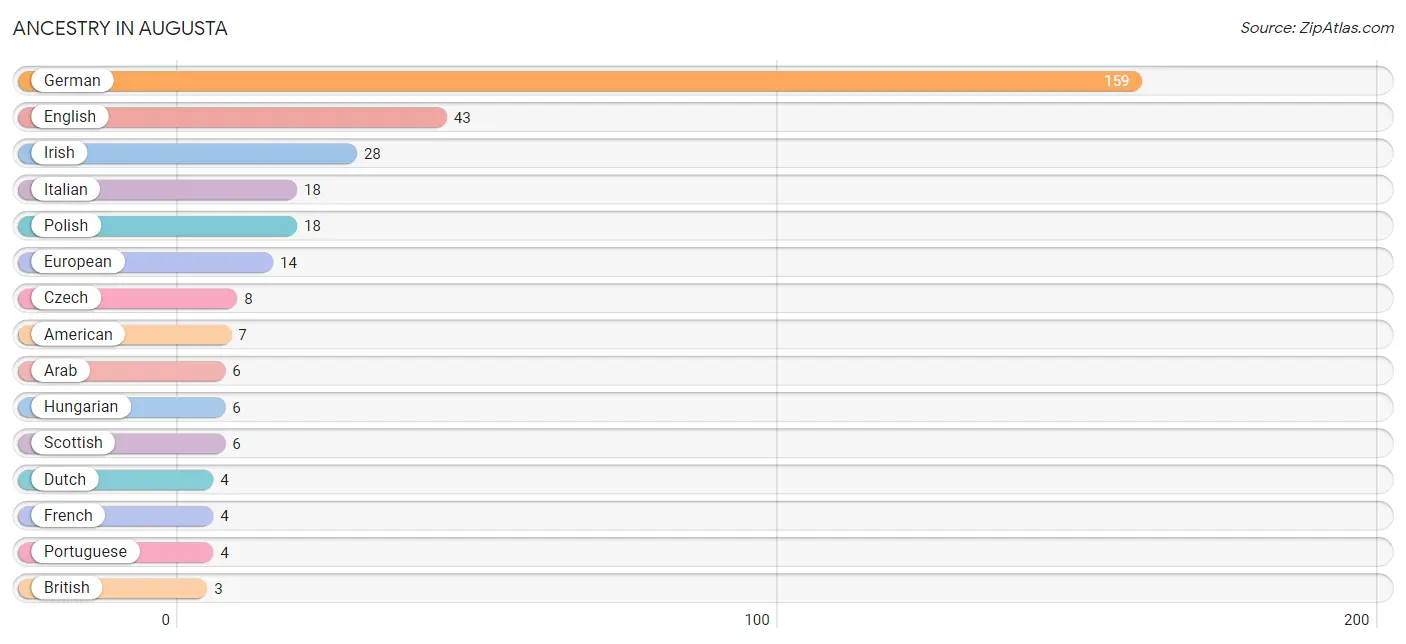
Ancestry in Augusta
The most populous ancestries reported in Augusta are German (159 | 54.8%), English (43 | 14.8%), Irish (28 | 9.7%), Italian (18 | 6.2%), and Polish (18 | 6.2%), together accounting for 91.7% of all Augusta residents.
| Ancestry | # Population | % Population |
| African | 1 | 0.3% |
| American | 7 | 2.4% |
| Arab | 6 | 2.1% |
| Bhutanese | 1 | 0.3% |
| British | 3 | 1.0% |
| Canadian | 1 | 0.3% |
| Czech | 8 | 2.8% |
| Dutch | 4 | 1.4% |
| English | 43 | 14.8% |
| European | 14 | 4.8% |
| French | 4 | 1.4% |
| German | 159 | 54.8% |
| Greek | 1 | 0.3% |
| Hungarian | 6 | 2.1% |
| Irish | 28 | 9.7% |
| Italian | 18 | 6.2% |
| Norwegian | 2 | 0.7% |
| Polish | 18 | 6.2% |
| Portuguese | 4 | 1.4% |
| Scandinavian | 1 | 0.3% |
| Scottish | 6 | 2.1% |
| Spanish | 1 | 0.3% |
| Subsaharan African | 1 | 0.3% | View All 23 Rows |
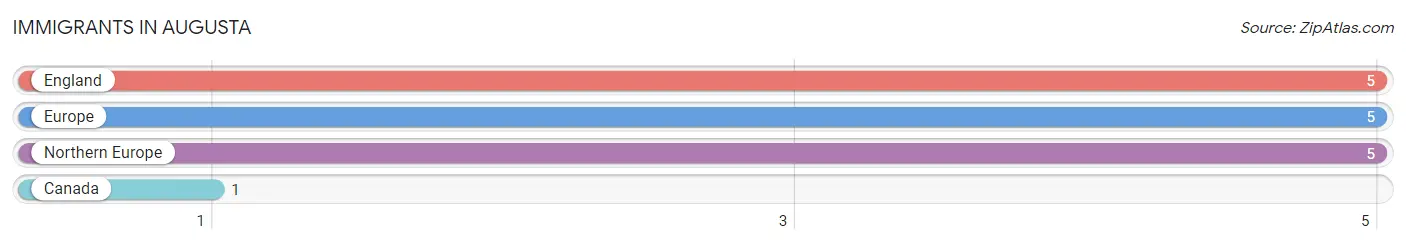
Immigrants in Augusta
The most numerous immigrant groups reported in Augusta came from England (5 | 1.7%), Europe (5 | 1.7%), Northern Europe (5 | 1.7%), and Canada (1 | 0.3%), together accounting for 5.5% of all Augusta residents.
| Immigration Origin | # Population | % Population |
| Canada | 1 | 0.3% |
| England | 5 | 1.7% |
| Europe | 5 | 1.7% |
| Northern Europe | 5 | 1.7% | View All 4 Rows |
Sex and Age in Augusta
Sex and Age in Augusta
The most populous age groups in Augusta are 50 to 54 Years (20 | 15.4%) for men and 70 to 74 Years (29 | 18.1%) for women.
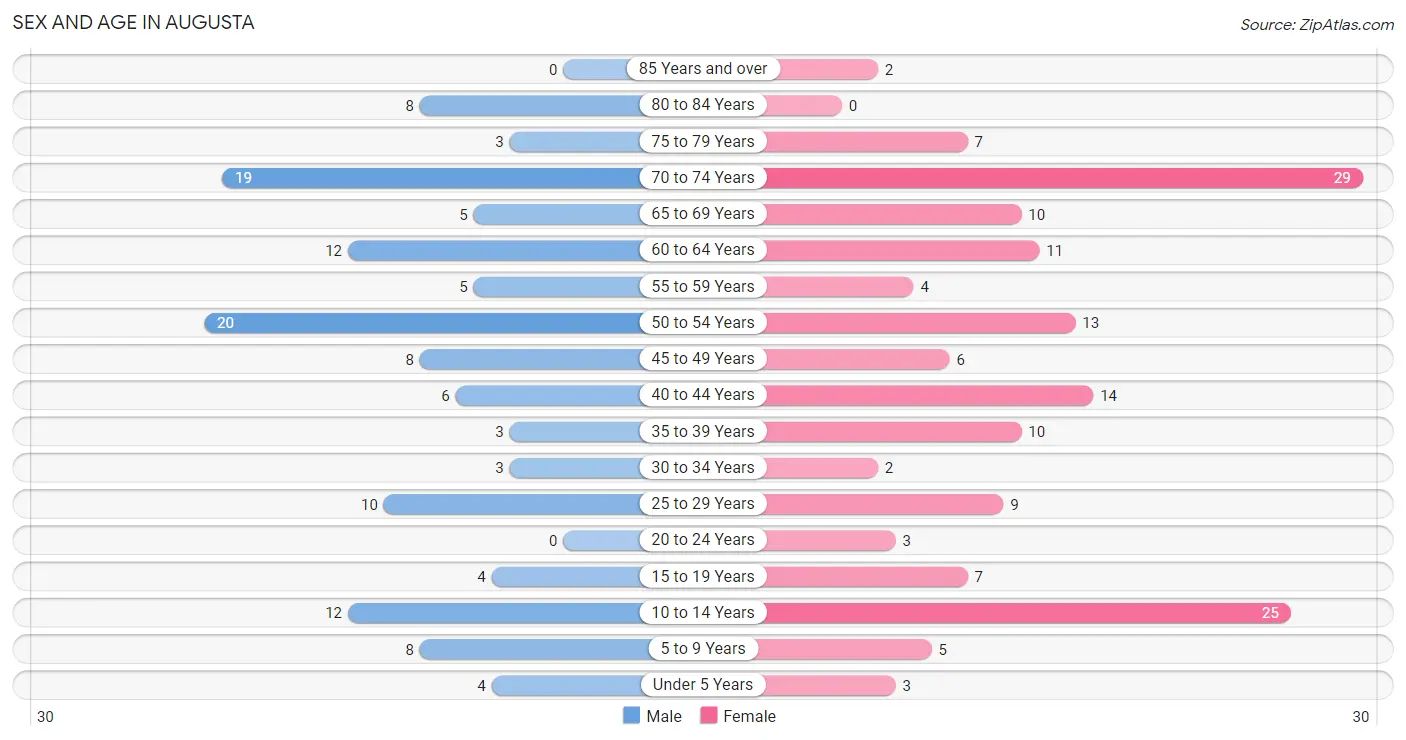
| Age Bracket | Male | Female |
| Under 5 Years | 4 (3.1%) | 3 (1.9%) |
| 5 to 9 Years | 8 (6.1%) | 5 (3.1%) |
| 10 to 14 Years | 12 (9.2%) | 25 (15.6%) |
| 15 to 19 Years | 4 (3.1%) | 7 (4.4%) |
| 20 to 24 Years | 0 (0.0%) | 3 (1.9%) |
| 25 to 29 Years | 10 (7.7%) | 9 (5.6%) |
| 30 to 34 Years | 3 (2.3%) | 2 (1.3%) |
| 35 to 39 Years | 3 (2.3%) | 10 (6.2%) |
| 40 to 44 Years | 6 (4.6%) | 14 (8.7%) |
| 45 to 49 Years | 8 (6.1%) | 6 (3.7%) |
| 50 to 54 Years | 20 (15.4%) | 13 (8.1%) |
| 55 to 59 Years | 5 (3.8%) | 4 (2.5%) |
| 60 to 64 Years | 12 (9.2%) | 11 (6.9%) |
| 65 to 69 Years | 5 (3.8%) | 10 (6.2%) |
| 70 to 74 Years | 19 (14.6%) | 29 (18.1%) |
| 75 to 79 Years | 3 (2.3%) | 7 (4.4%) |
| 80 to 84 Years | 8 (6.1%) | 0 (0.0%) |
| 85 Years and over | 0 (0.0%) | 2 (1.3%) |
| Total | 130 (100.0%) | 160 (100.0%) |
Families and Households in Augusta
Median Family Size in Augusta
The median family size in Augusta is 2.84 persons per family, with single male/father families (1 | 1.1%) accounting for the largest median family size of 5 persons per family. On the other hand, married-couple families (79 | 90.8%) represent the smallest median family size with 2.72 persons per family.
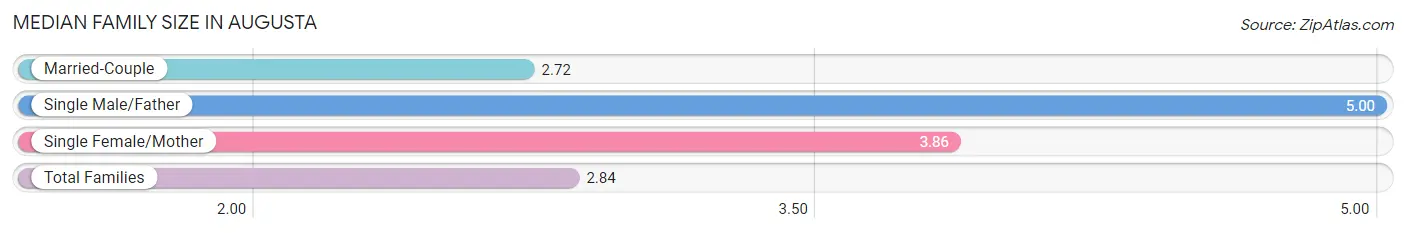
| Family Type | # Families | Family Size |
| Married-Couple | 79 (90.8%) | 2.72 |
| Single Male/Father | 1 (1.1%) | 5.00 |
| Single Female/Mother | 7 (8.1%) | 3.86 |
| Total Families | 87 (100.0%) | 2.84 |
Median Household Size in Augusta
The median household size in Augusta is 2.36 persons per household, with single male/father households (1 | 0.8%) accounting for the largest median household size of 5 persons per household. non-family households (36 | 29.3%) represent the smallest median household size with 1.19 persons per household.
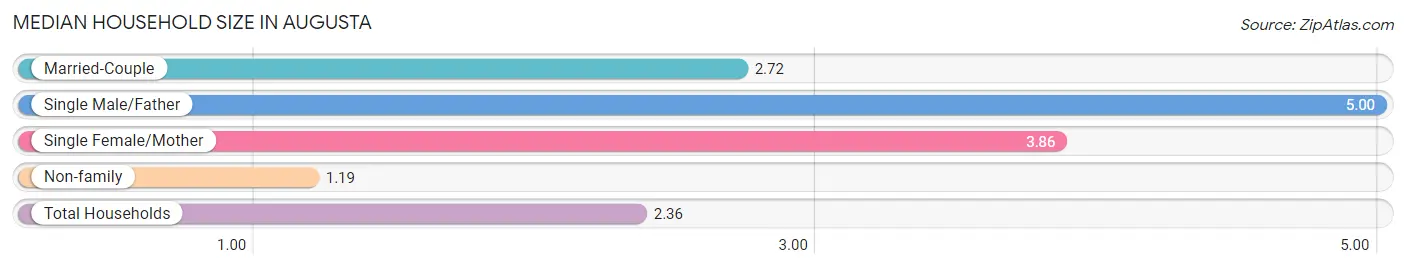
| Household Type | # Households | Household Size |
| Married-Couple | 79 (64.2%) | 2.72 |
| Single Male/Father | 1 (0.8%) | 5.00 |
| Single Female/Mother | 7 (5.7%) | 3.86 |
| Non-family | 36 (29.3%) | 1.19 |
| Total Households | 123 (100.0%) | 2.36 |
Household Size by Marriage Status in Augusta
Out of a total of 123 households in Augusta, 87 (70.7%) are family households, while 36 (29.3%) are nonfamily households. The most numerous type of family households are 2-person households, comprising 44, and the most common type of nonfamily households are 1-person households, comprising 28.
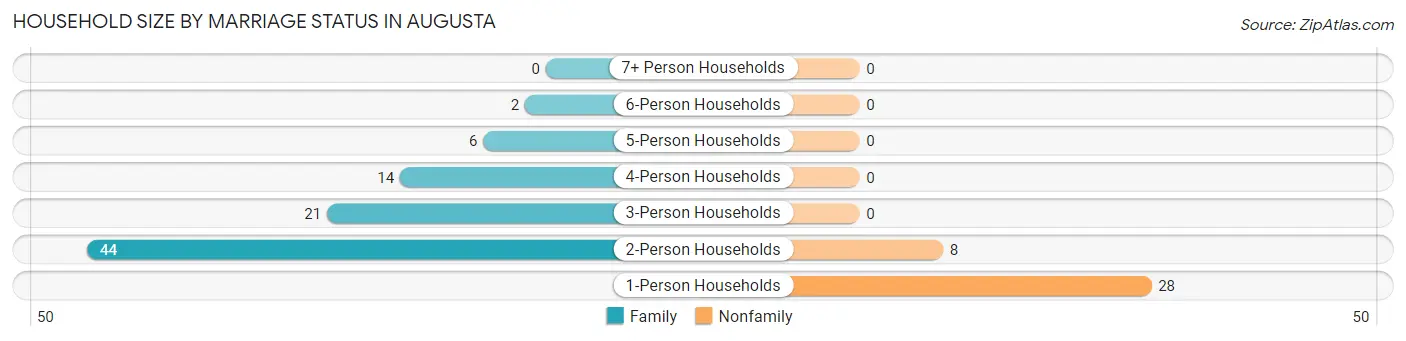
| Household Size | Family Households | Nonfamily Households |
| 1-Person Households | - | 28 (22.8%) |
| 2-Person Households | 44 (35.8%) | 8 (6.5%) |
| 3-Person Households | 21 (17.1%) | 0 (0.0%) |
| 4-Person Households | 14 (11.4%) | 0 (0.0%) |
| 5-Person Households | 6 (4.9%) | 0 (0.0%) |
| 6-Person Households | 2 (1.6%) | 0 (0.0%) |
| 7+ Person Households | 0 (0.0%) | 0 (0.0%) |
| Total | 87 (70.7%) | 36 (29.3%) |
Female Fertility in Augusta
Fertility by Age in Augusta
Average fertility rate in Augusta is 58.0 births per 1,000 women. Women in the age bracket of 20 to 34 years have the highest fertility rate with 214.0 births per 1,000 women. Women in the age bracket of 20 to 34 years acount for 100.0% of all women with births.
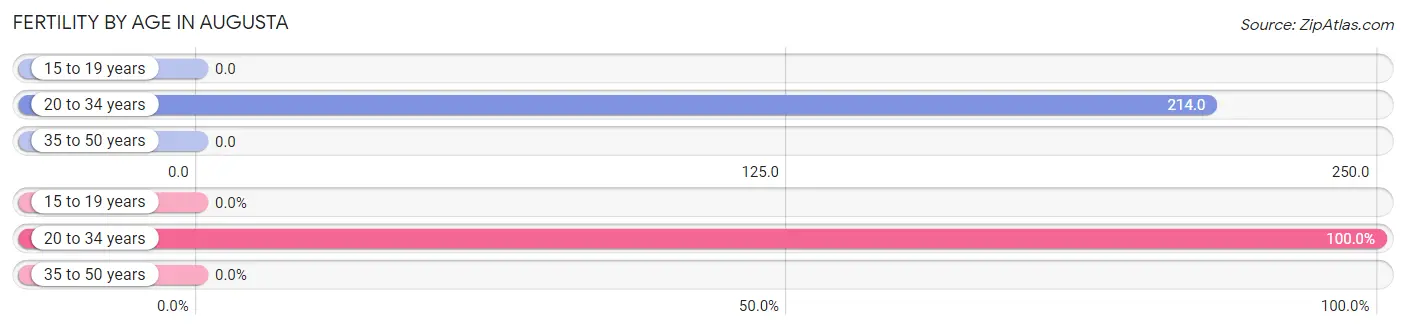
| Age Bracket | Women with Births | Births / 1,000 Women |
| 15 to 19 years | 0 (0.0%) | 0.0 |
| 20 to 34 years | 3 (100.0%) | 214.0 |
| 35 to 50 years | 0 (0.0%) | 0.0 |
| Total | 3 (100.0%) | 58.0 |
Fertility by Age by Marriage Status in Augusta
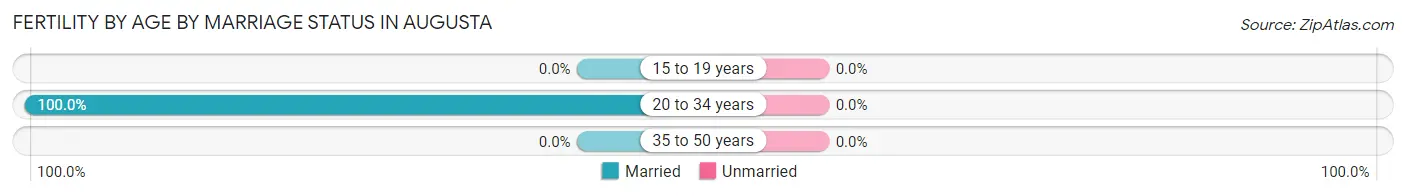
| Age Bracket | Married | Unmarried |
| 15 to 19 years | 0 (0.0%) | 0 (0.0%) |
| 20 to 34 years | 3 (100.0%) | 0 (0.0%) |
| 35 to 50 years | 0 (0.0%) | 0 (0.0%) |
| Total | 3 (100.0%) | 0 (0.0%) |
Fertility by Education in Augusta
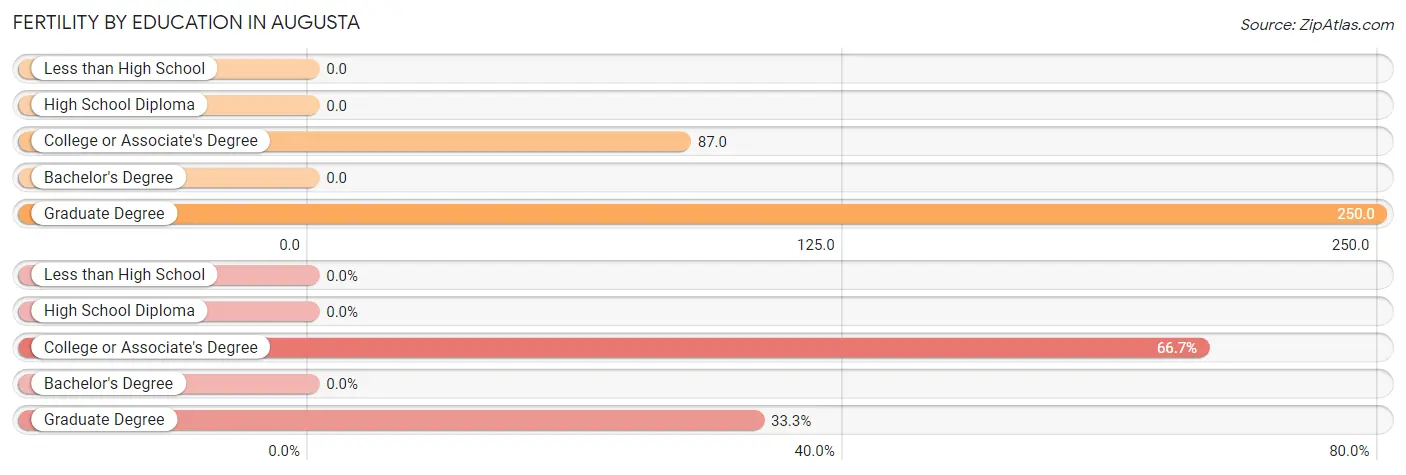
| Educational Attainment | Women with Births | Births / 1,000 Women |
| Less than High School | 0 (0.0%) | 0.0 |
| High School Diploma | 0 (0.0%) | 0.0 |
| College or Associate's Degree | 2 (66.7%) | 87.0 |
| Bachelor's Degree | 0 (0.0%) | 0.0 |
| Graduate Degree | 1 (33.3%) | 250.0 |
| Total | 3 (100.0%) | 58.0 |
Fertility by Education by Marriage Status in Augusta
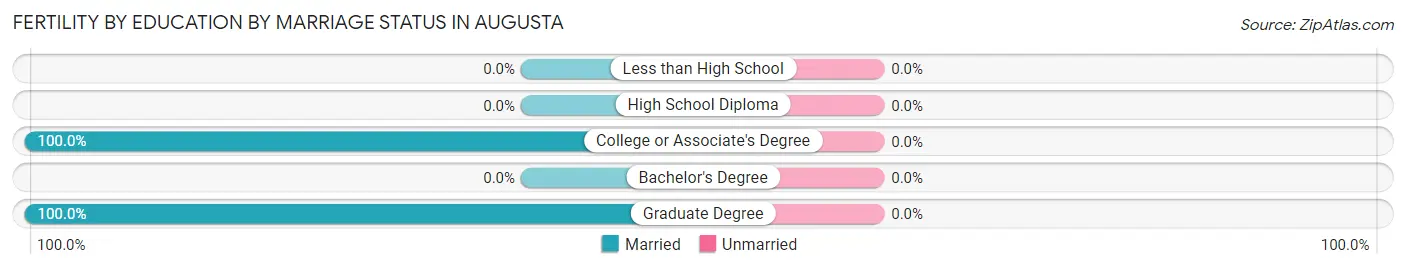
| Educational Attainment | Married | Unmarried |
| Less than High School | 0 (0.0%) | 0 (0.0%) |
| High School Diploma | 0 (0.0%) | 0 (0.0%) |
| College or Associate's Degree | 2 (100.0%) | 0 (0.0%) |
| Bachelor's Degree | 0 (0.0%) | 0 (0.0%) |
| Graduate Degree | 1 (100.0%) | 0 (0.0%) |
| Total | 3 (100.0%) | 0 (0.0%) |
Employment Characteristics in Augusta
Employment by Class of Employer in Augusta
Among the 133 employed individuals in Augusta, private company employees (95 | 71.4%), self-employed (not incorporated) (13 | 9.8%), and local government employees (10 | 7.5%) make up the most common classes of employment.
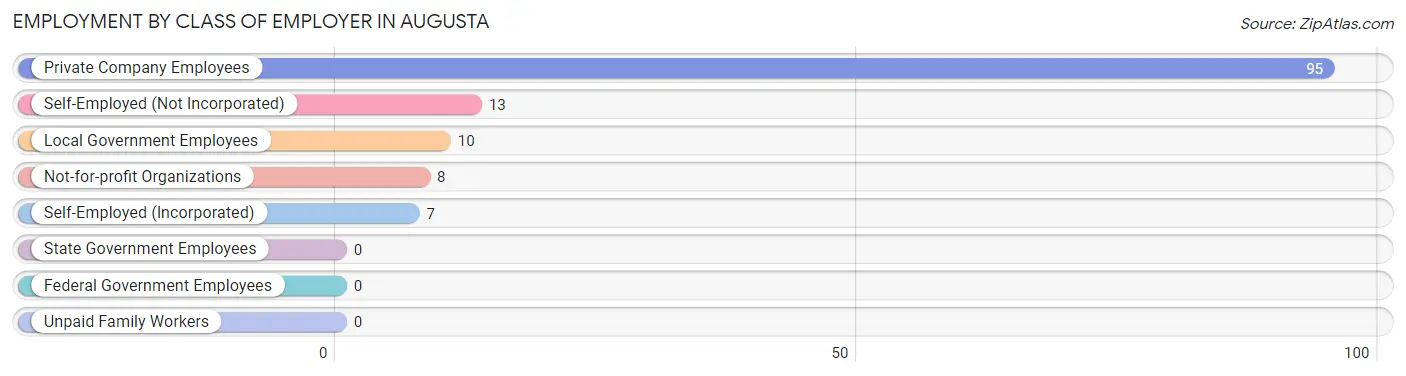
| Employer Class | # Employees | % Employees |
| Private Company Employees | 95 | 71.4% |
| Self-Employed (Incorporated) | 7 | 5.3% |
| Self-Employed (Not Incorporated) | 13 | 9.8% |
| Not-for-profit Organizations | 8 | 6.0% |
| Local Government Employees | 10 | 7.5% |
| State Government Employees | 0 | 0.0% |
| Federal Government Employees | 0 | 0.0% |
| Unpaid Family Workers | 0 | 0.0% |
| Total | 133 | 100.0% |
Employment Status by Age in Augusta
According to the labor force statistics for Augusta, out of the total population over 16 years of age (228), 60.5% or 138 individuals are in the labor force, with 2.2% or 3 of them unemployed. The age group with the highest labor force participation rate is 16 to 19 years, with 100.0% or 6 individuals in the labor force. Within the labor force, the 16 to 19 years age range has the highest percentage of unemployed individuals, with 33.3% or 2 of them being unemployed.
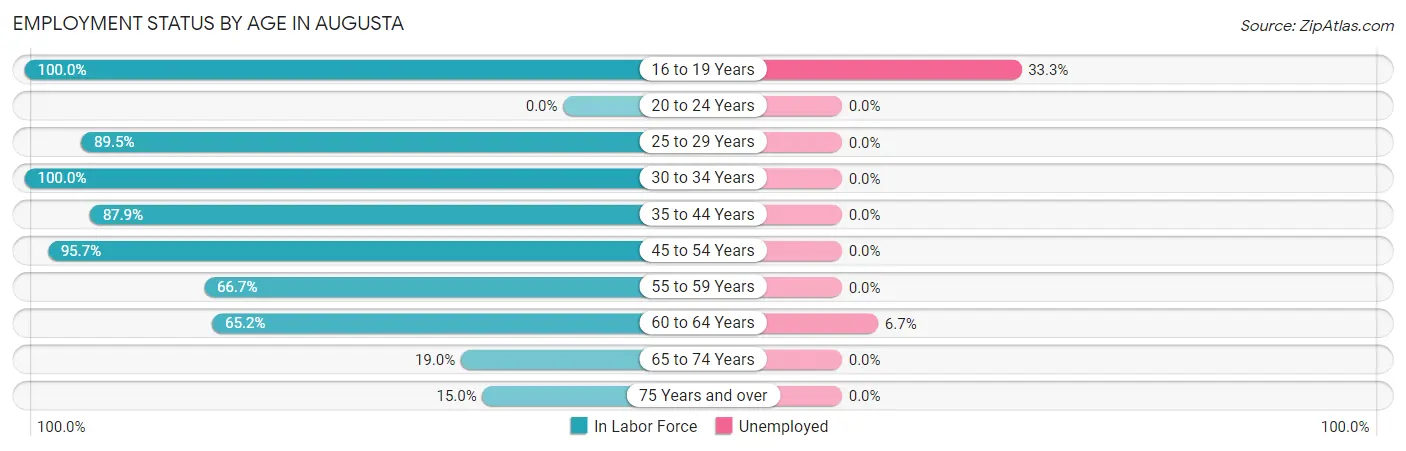
| Age Bracket | In Labor Force | Unemployed |
| 16 to 19 Years | 6 (100.0%) | 2 (33.3%) |
| 20 to 24 Years | 0 (0.0%) | 0 (0.0%) |
| 25 to 29 Years | 17 (89.5%) | 0 (0.0%) |
| 30 to 34 Years | 5 (100.0%) | 0 (0.0%) |
| 35 to 44 Years | 29 (87.9%) | 0 (0.0%) |
| 45 to 54 Years | 45 (95.7%) | 0 (0.0%) |
| 55 to 59 Years | 6 (66.7%) | 0 (0.0%) |
| 60 to 64 Years | 15 (65.2%) | 1 (6.7%) |
| 65 to 74 Years | 12 (19.0%) | 0 (0.0%) |
| 75 Years and over | 3 (15.0%) | 0 (0.0%) |
| Total | 138 (60.5%) | 3 (2.2%) |
Employment Status by Educational Attainment in Augusta
According to labor force statistics for Augusta, 86.0% of individuals (117) out of the total population between 25 and 64 years of age (136) are in the labor force, with 0.9% or 1 of them being unemployed. The group with the highest labor force participation rate are those with the educational attainment of less than high school, with 100.0% or 2 individuals in the labor force. Within the labor force, individuals with bachelor's degree or higher education have the highest percentage of unemployment, with 2.6% or 1 of them being unemployed.
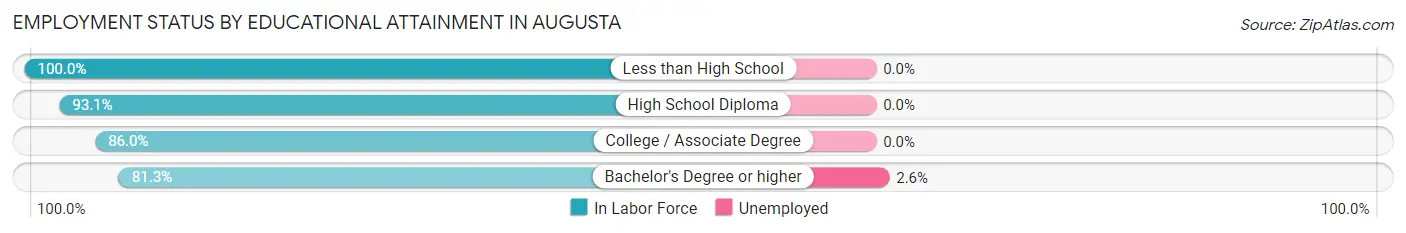
| Educational Attainment | In Labor Force | Unemployed |
| Less than High School | 2 (100.0%) | 0 (0.0%) |
| High School Diploma | 27 (93.1%) | 0 (0.0%) |
| College / Associate Degree | 49 (86.0%) | 0 (0.0%) |
| Bachelor's Degree or higher | 39 (81.3%) | 1 (2.6%) |
| Total | 117 (86.0%) | 1 (0.9%) |
Employment Occupations by Sex in Augusta
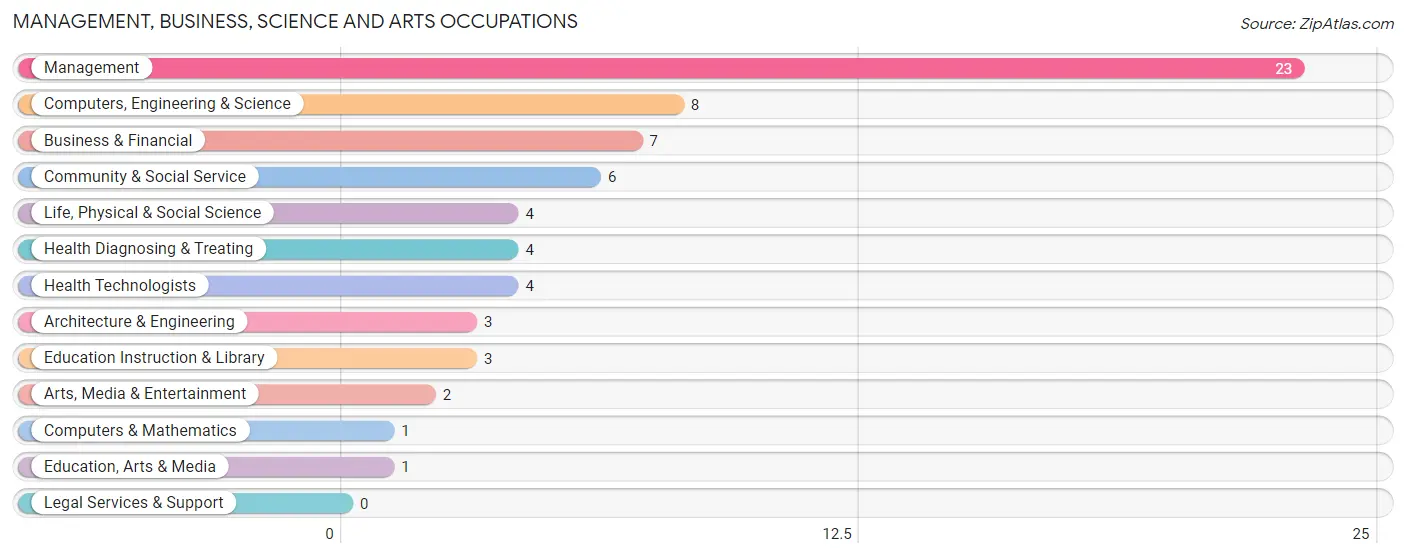
Management, Business, Science and Arts Occupations
The most common Management, Business, Science and Arts occupations in Augusta are Management (23 | 17.0%), Computers, Engineering & Science (8 | 5.9%), Business & Financial (7 | 5.2%), Community & Social Service (6 | 4.4%), and Life, Physical & Social Science (4 | 3.0%).
Management, Business, Science and Arts Occupations by Sex
Within the Management, Business, Science and Arts occupations in Augusta, the most male-oriented occupations are Architecture & Engineering (100.0%), Life, Physical & Social Science (100.0%), and Computers, Engineering & Science (87.5%), while the most female-oriented occupations are Computers & Mathematics (100.0%), Education, Arts & Media (100.0%), and Health Diagnosing & Treating (100.0%).
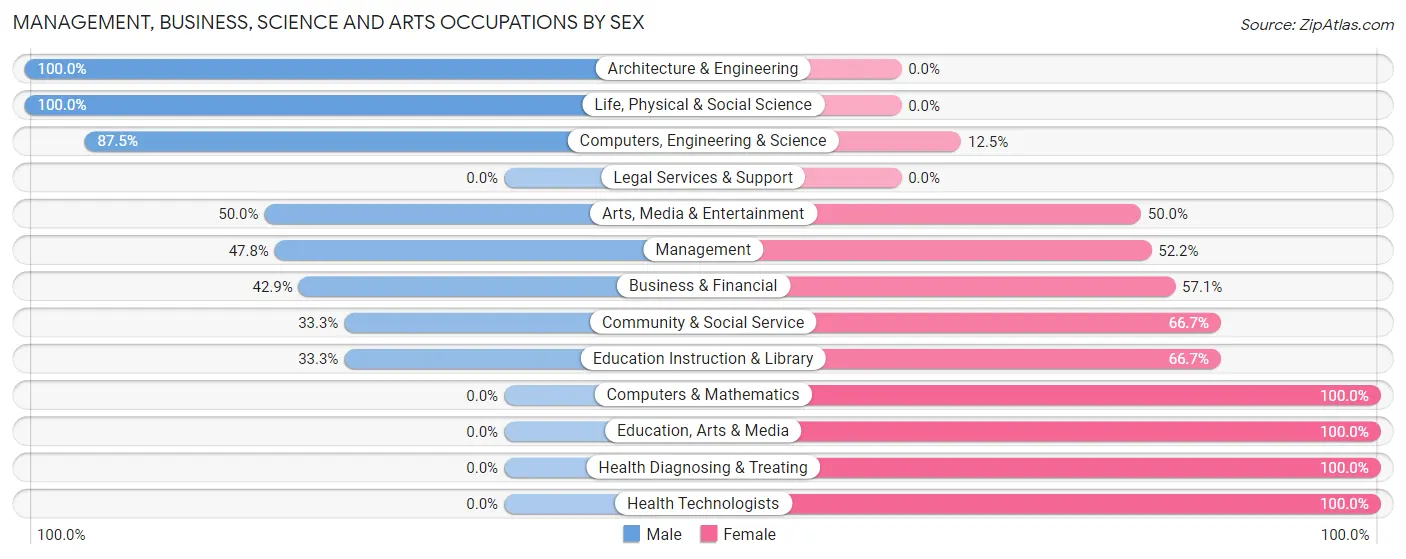
| Occupation | Male | Female |
| Management | 11 (47.8%) | 12 (52.2%) |
| Business & Financial | 3 (42.9%) | 4 (57.1%) |
| Computers, Engineering & Science | 7 (87.5%) | 1 (12.5%) |
| Computers & Mathematics | 0 (0.0%) | 1 (100.0%) |
| Architecture & Engineering | 3 (100.0%) | 0 (0.0%) |
| Life, Physical & Social Science | 4 (100.0%) | 0 (0.0%) |
| Community & Social Service | 2 (33.3%) | 4 (66.7%) |
| Education, Arts & Media | 0 (0.0%) | 1 (100.0%) |
| Legal Services & Support | 0 (0.0%) | 0 (0.0%) |
| Education Instruction & Library | 1 (33.3%) | 2 (66.7%) |
| Arts, Media & Entertainment | 1 (50.0%) | 1 (50.0%) |
| Health Diagnosing & Treating | 0 (0.0%) | 4 (100.0%) |
| Health Technologists | 0 (0.0%) | 4 (100.0%) |
| Total (Category) | 23 (47.9%) | 25 (52.1%) |
| Total (Overall) | 67 (49.6%) | 68 (50.4%) |
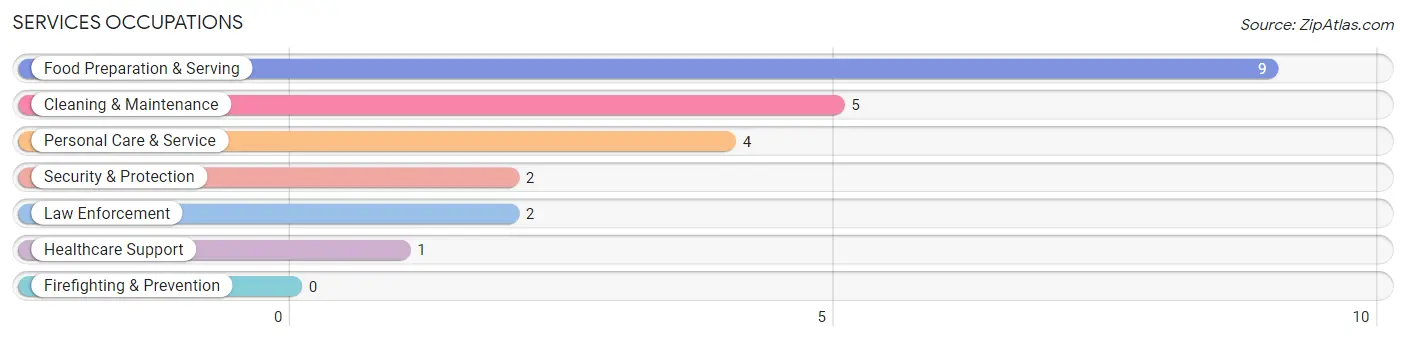
Services Occupations
The most common Services occupations in Augusta are Food Preparation & Serving (9 | 6.7%), Cleaning & Maintenance (5 | 3.7%), Personal Care & Service (4 | 3.0%), Security & Protection (2 | 1.5%), and Law Enforcement (2 | 1.5%).
Services Occupations by Sex
Within the Services occupations in Augusta, the most male-oriented occupations are Security & Protection (100.0%), Law Enforcement (100.0%), and Cleaning & Maintenance (100.0%), while the most female-oriented occupations are Healthcare Support (100.0%), Personal Care & Service (100.0%), and Food Preparation & Serving (77.8%).
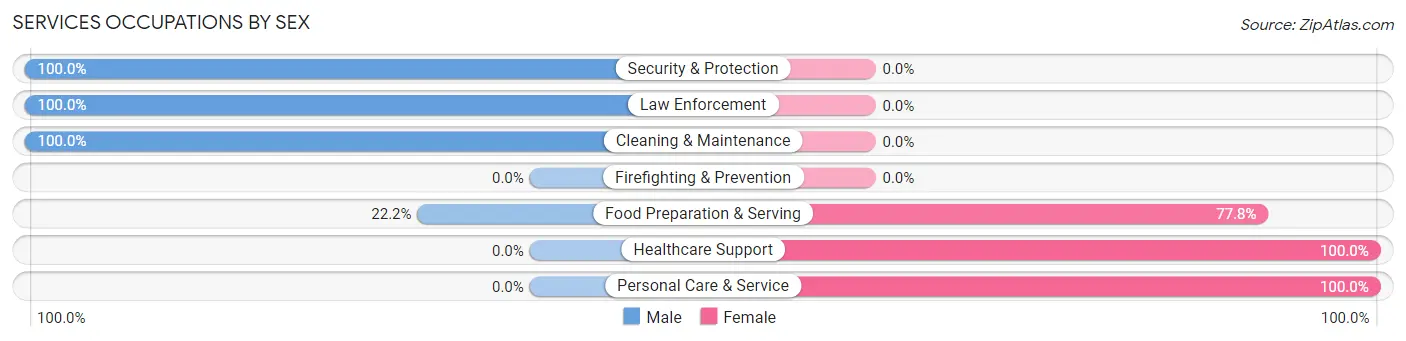
| Occupation | Male | Female |
| Healthcare Support | 0 (0.0%) | 1 (100.0%) |
| Security & Protection | 2 (100.0%) | 0 (0.0%) |
| Firefighting & Prevention | 0 (0.0%) | 0 (0.0%) |
| Law Enforcement | 2 (100.0%) | 0 (0.0%) |
| Food Preparation & Serving | 2 (22.2%) | 7 (77.8%) |
| Cleaning & Maintenance | 5 (100.0%) | 0 (0.0%) |
| Personal Care & Service | 0 (0.0%) | 4 (100.0%) |
| Total (Category) | 9 (42.9%) | 12 (57.1%) |
| Total (Overall) | 67 (49.6%) | 68 (50.4%) |
Sales and Office Occupations
The most common Sales and Office occupations in Augusta are Office & Administration (22 | 16.3%), and Sales & Related (9 | 6.7%).
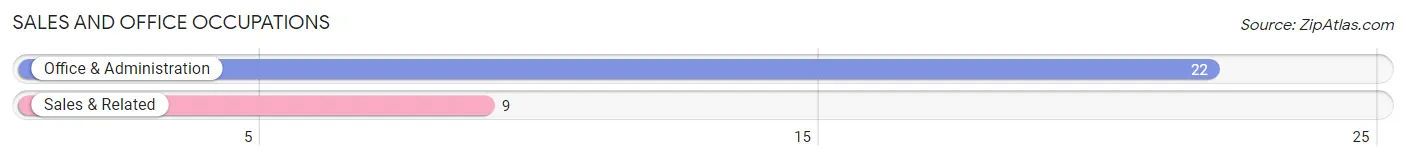
Sales and Office Occupations by Sex
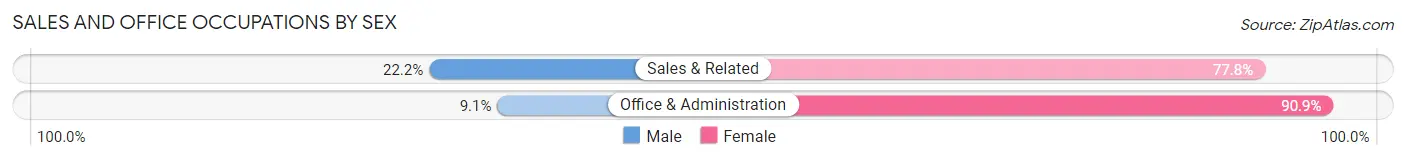
| Occupation | Male | Female |
| Sales & Related | 2 (22.2%) | 7 (77.8%) |
| Office & Administration | 2 (9.1%) | 20 (90.9%) |
| Total (Category) | 4 (12.9%) | 27 (87.1%) |
| Total (Overall) | 67 (49.6%) | 68 (50.4%) |
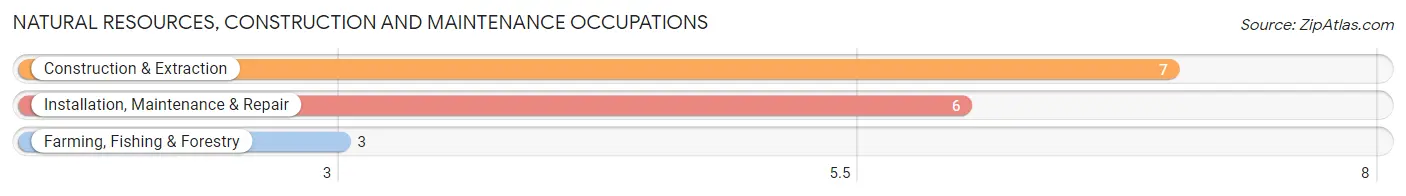
Natural Resources, Construction and Maintenance Occupations
The most common Natural Resources, Construction and Maintenance occupations in Augusta are Construction & Extraction (7 | 5.2%), Installation, Maintenance & Repair (6 | 4.4%), and Farming, Fishing & Forestry (3 | 2.2%).
Natural Resources, Construction and Maintenance Occupations by Sex
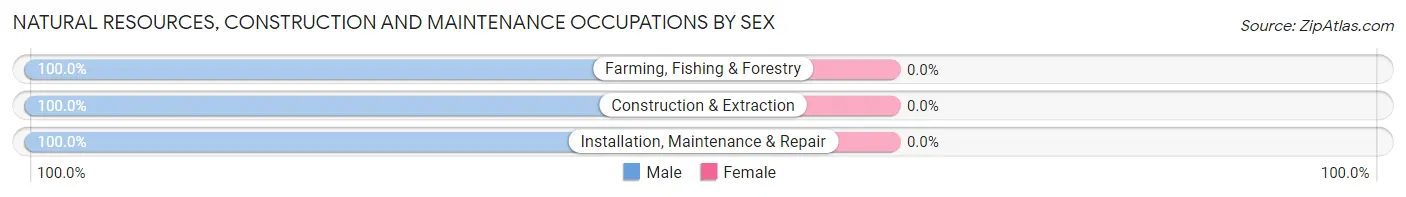
| Occupation | Male | Female |
| Farming, Fishing & Forestry | 3 (100.0%) | 0 (0.0%) |
| Construction & Extraction | 7 (100.0%) | 0 (0.0%) |
| Installation, Maintenance & Repair | 6 (100.0%) | 0 (0.0%) |
| Total (Category) | 16 (100.0%) | 0 (0.0%) |
| Total (Overall) | 67 (49.6%) | 68 (50.4%) |
Production, Transportation and Moving Occupations
The most common Production, Transportation and Moving occupations in Augusta are Material Moving (9 | 6.7%), Production (7 | 5.2%), and Transportation (3 | 2.2%).
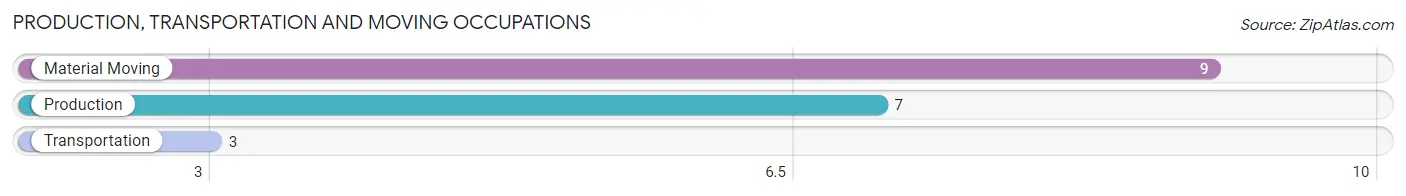
Production, Transportation and Moving Occupations by Sex
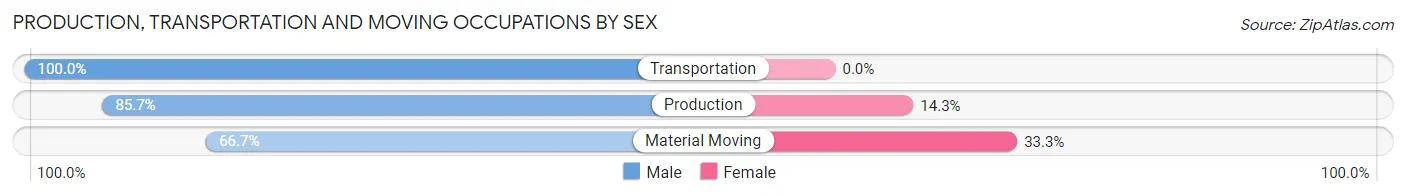
| Occupation | Male | Female |
| Production | 6 (85.7%) | 1 (14.3%) |
| Transportation | 3 (100.0%) | 0 (0.0%) |
| Material Moving | 6 (66.7%) | 3 (33.3%) |
| Total (Category) | 15 (78.9%) | 4 (21.0%) |
| Total (Overall) | 67 (49.6%) | 68 (50.4%) |
Employment Industries by Sex in Augusta
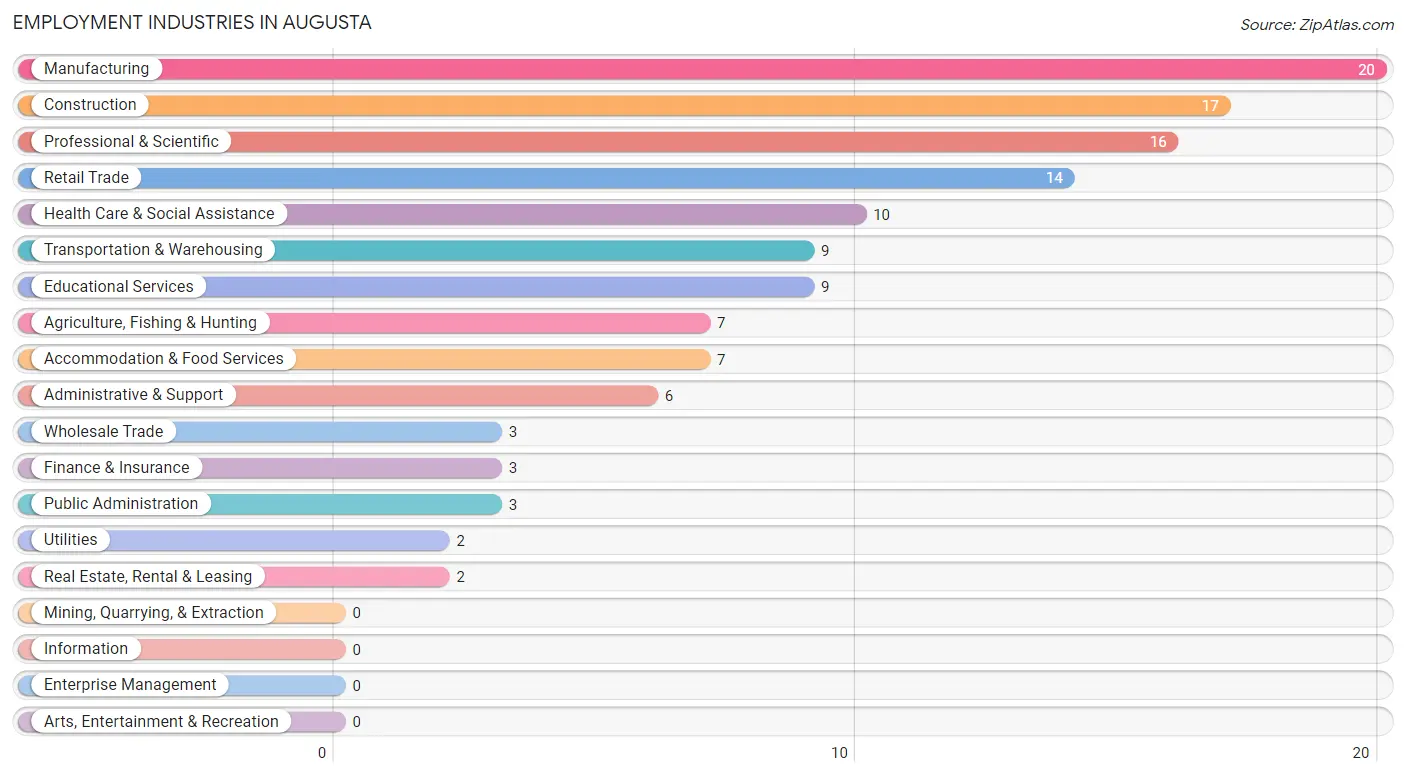
Employment Industries in Augusta
The major employment industries in Augusta include Manufacturing (20 | 14.8%), Construction (17 | 12.6%), Professional & Scientific (16 | 11.8%), Retail Trade (14 | 10.4%), and Health Care & Social Assistance (10 | 7.4%).
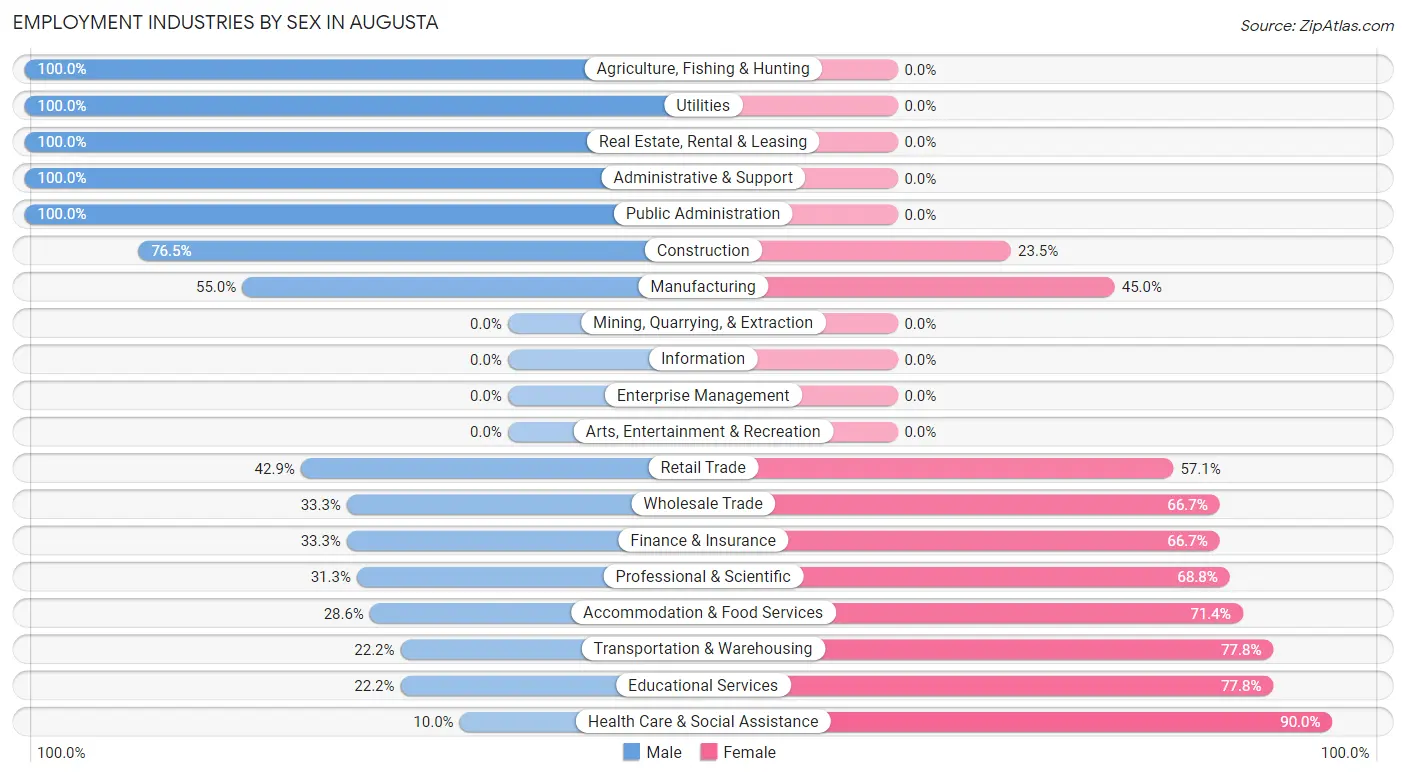
Employment Industries by Sex in Augusta
The Augusta industries that see more men than women are Agriculture, Fishing & Hunting (100.0%), Utilities (100.0%), and Real Estate, Rental & Leasing (100.0%), whereas the industries that tend to have a higher number of women are Health Care & Social Assistance (90.0%), Transportation & Warehousing (77.8%), and Educational Services (77.8%).
| Industry | Male | Female |
| Agriculture, Fishing & Hunting | 7 (100.0%) | 0 (0.0%) |
| Mining, Quarrying, & Extraction | 0 (0.0%) | 0 (0.0%) |
| Construction | 13 (76.5%) | 4 (23.5%) |
| Manufacturing | 11 (55.0%) | 9 (45.0%) |
| Wholesale Trade | 1 (33.3%) | 2 (66.7%) |
| Retail Trade | 6 (42.9%) | 8 (57.1%) |
| Transportation & Warehousing | 2 (22.2%) | 7 (77.8%) |
| Utilities | 2 (100.0%) | 0 (0.0%) |
| Information | 0 (0.0%) | 0 (0.0%) |
| Finance & Insurance | 1 (33.3%) | 2 (66.7%) |
| Real Estate, Rental & Leasing | 2 (100.0%) | 0 (0.0%) |
| Professional & Scientific | 5 (31.2%) | 11 (68.8%) |
| Enterprise Management | 0 (0.0%) | 0 (0.0%) |
| Administrative & Support | 6 (100.0%) | 0 (0.0%) |
| Educational Services | 2 (22.2%) | 7 (77.8%) |
| Health Care & Social Assistance | 1 (10.0%) | 9 (90.0%) |
| Arts, Entertainment & Recreation | 0 (0.0%) | 0 (0.0%) |
| Accommodation & Food Services | 2 (28.6%) | 5 (71.4%) |
| Public Administration | 3 (100.0%) | 0 (0.0%) |
| Total | 67 (49.6%) | 68 (50.4%) |
Education in Augusta
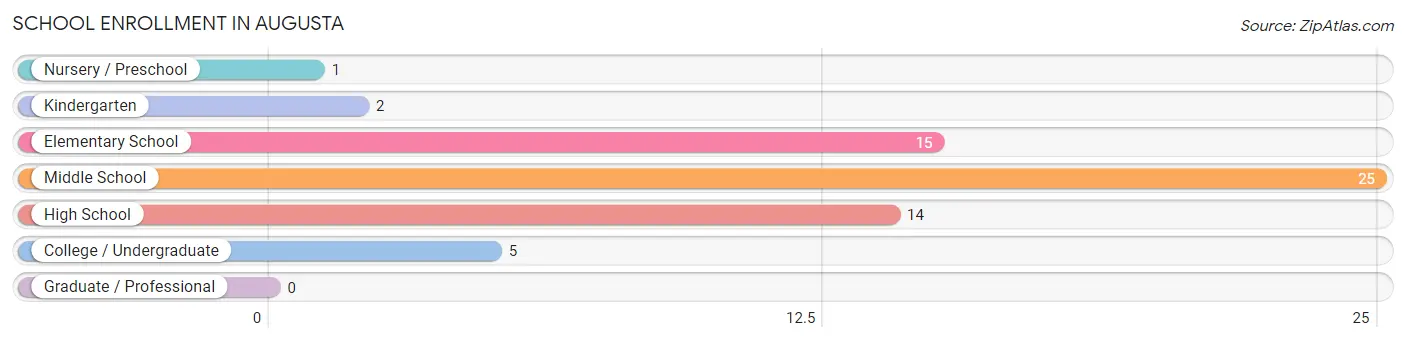
School Enrollment in Augusta
The most common levels of schooling among the 62 students in Augusta are middle school (25 | 40.3%), elementary school (15 | 24.2%), and high school (14 | 22.6%).
| School Level | # Students | % Students |
| Nursery / Preschool | 1 | 1.6% |
| Kindergarten | 2 | 3.2% |
| Elementary School | 15 | 24.2% |
| Middle School | 25 | 40.3% |
| High School | 14 | 22.6% |
| College / Undergraduate | 5 | 8.1% |
| Graduate / Professional | 0 | 0.0% |
| Total | 62 | 100.0% |
School Enrollment by Age by Funding Source in Augusta
Out of a total of 62 students who are enrolled in schools in Augusta, 7 (11.3%) attend a private institution, while the remaining 55 (88.7%) are enrolled in public schools. The age group of 20 to 24 year olds has the highest likelihood of being enrolled in private schools, with 1 (33.3% in the age bracket) enrolled. Conversely, the age group of 15 to 17 year olds has the lowest likelihood of being enrolled in a private school, with 8 (100.0% in the age bracket) attending a public institution.
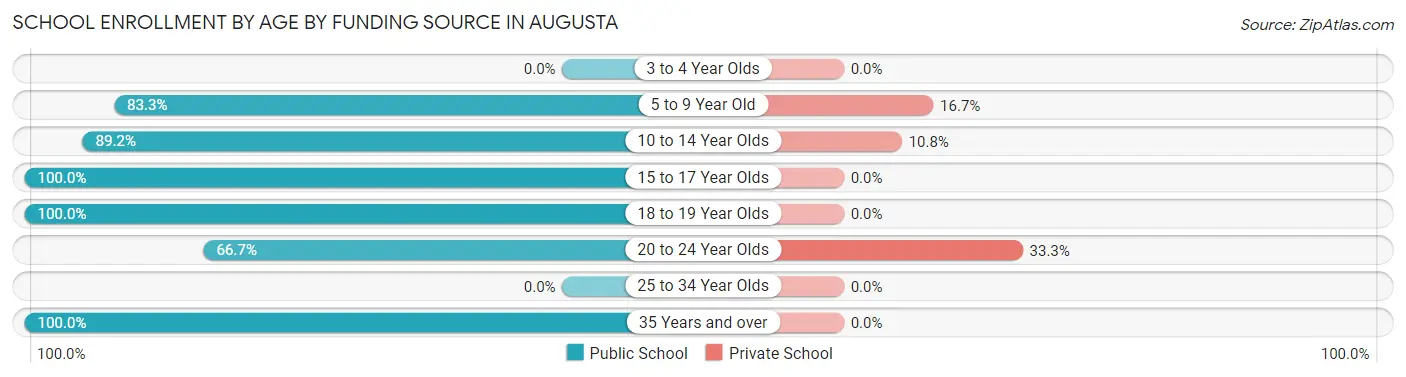
| Age Bracket | Public School | Private School |
| 3 to 4 Year Olds | 0 (0.0%) | 0 (0.0%) |
| 5 to 9 Year Old | 10 (83.3%) | 2 (16.7%) |
| 10 to 14 Year Olds | 33 (89.2%) | 4 (10.8%) |
| 15 to 17 Year Olds | 8 (100.0%) | 0 (0.0%) |
| 18 to 19 Year Olds | 1 (100.0%) | 0 (0.0%) |
| 20 to 24 Year Olds | 2 (66.7%) | 1 (33.3%) |
| 25 to 34 Year Olds | 0 (0.0%) | 0 (0.0%) |
| 35 Years and over | 1 (100.0%) | 0 (0.0%) |
| Total | 55 (88.7%) | 7 (11.3%) |
Educational Attainment by Field of Study in Augusta
Business (27 | 39.7%), education (15 | 22.1%), science & technology (5 | 7.3%), engineering (4 | 5.9%), and liberal arts & history (4 | 5.9%) are the most common fields of study among 68 individuals in Augusta who have obtained a bachelor's degree or higher.
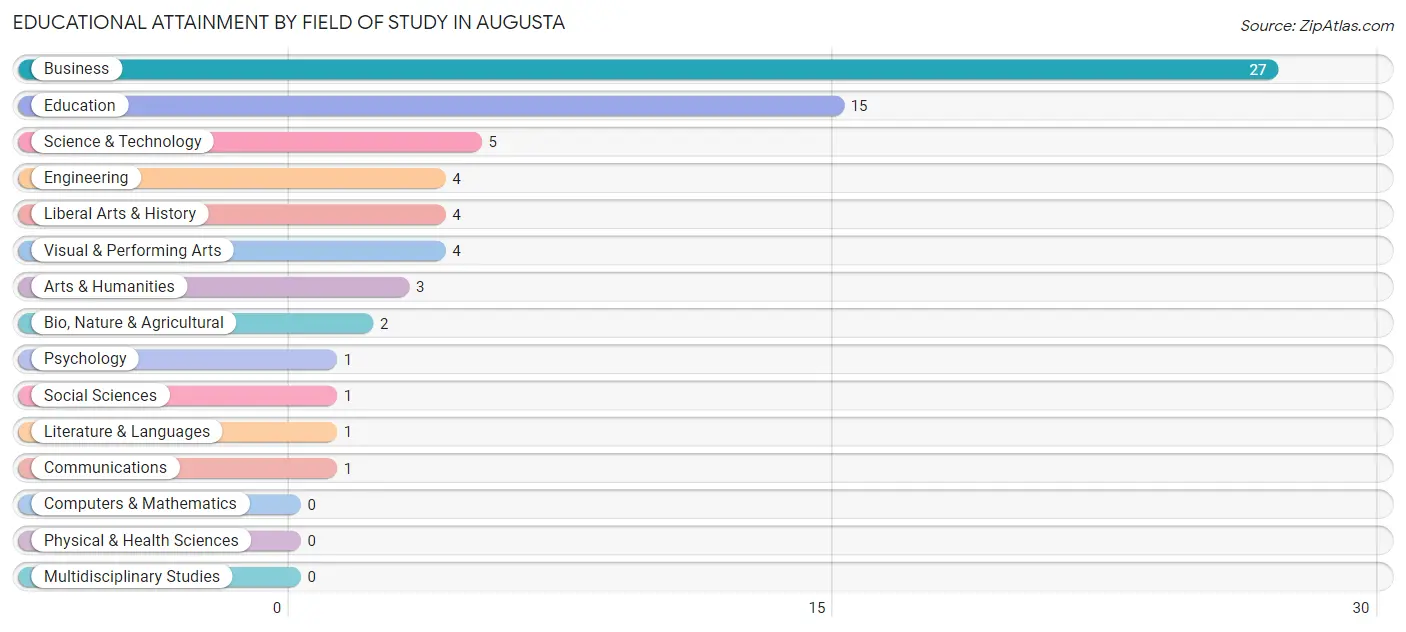
| Field of Study | # Graduates | % Graduates |
| Computers & Mathematics | 0 | 0.0% |
| Bio, Nature & Agricultural | 2 | 2.9% |
| Physical & Health Sciences | 0 | 0.0% |
| Psychology | 1 | 1.5% |
| Social Sciences | 1 | 1.5% |
| Engineering | 4 | 5.9% |
| Multidisciplinary Studies | 0 | 0.0% |
| Science & Technology | 5 | 7.3% |
| Business | 27 | 39.7% |
| Education | 15 | 22.1% |
| Literature & Languages | 1 | 1.5% |
| Liberal Arts & History | 4 | 5.9% |
| Visual & Performing Arts | 4 | 5.9% |
| Communications | 1 | 1.5% |
| Arts & Humanities | 3 | 4.4% |
| Total | 68 | 100.0% |
Transportation & Commute in Augusta
Vehicle Availability by Sex in Augusta
The most prevalent vehicle ownership categories in Augusta are males with 2 vehicles (33, accounting for 49.2%) and females with 2 vehicles (26, making up 50.0%).
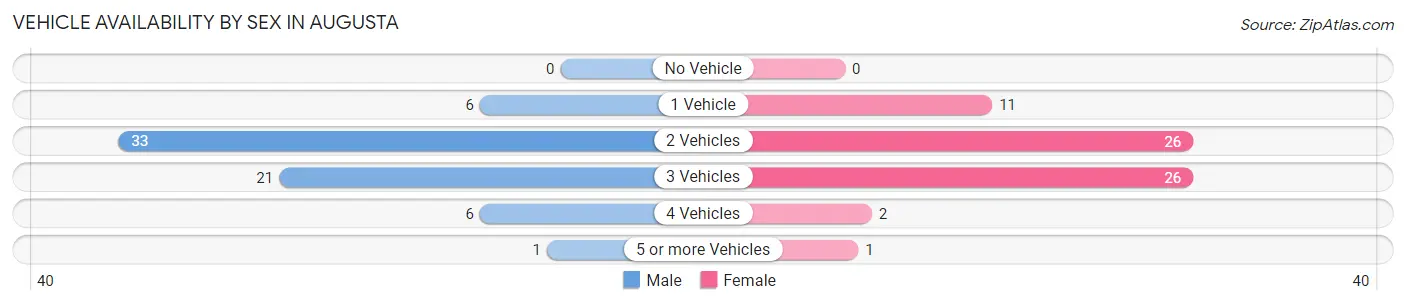
| Vehicles Available | Male | Female |
| No Vehicle | 0 (0.0%) | 0 (0.0%) |
| 1 Vehicle | 6 (9.0%) | 11 (16.7%) |
| 2 Vehicles | 33 (49.2%) | 26 (39.4%) |
| 3 Vehicles | 21 (31.3%) | 26 (39.4%) |
| 4 Vehicles | 6 (9.0%) | 2 (3.0%) |
| 5 or more Vehicles | 1 (1.5%) | 1 (1.5%) |
| Total | 67 (100.0%) | 66 (100.0%) |
Commute Time in Augusta
The most frequently occuring commute durations in Augusta are 60 to 89 minutes (24 commuters, 20.7%), 45 to 59 minutes (20 commuters, 17.2%), and 20 to 24 minutes (13 commuters, 11.2%).
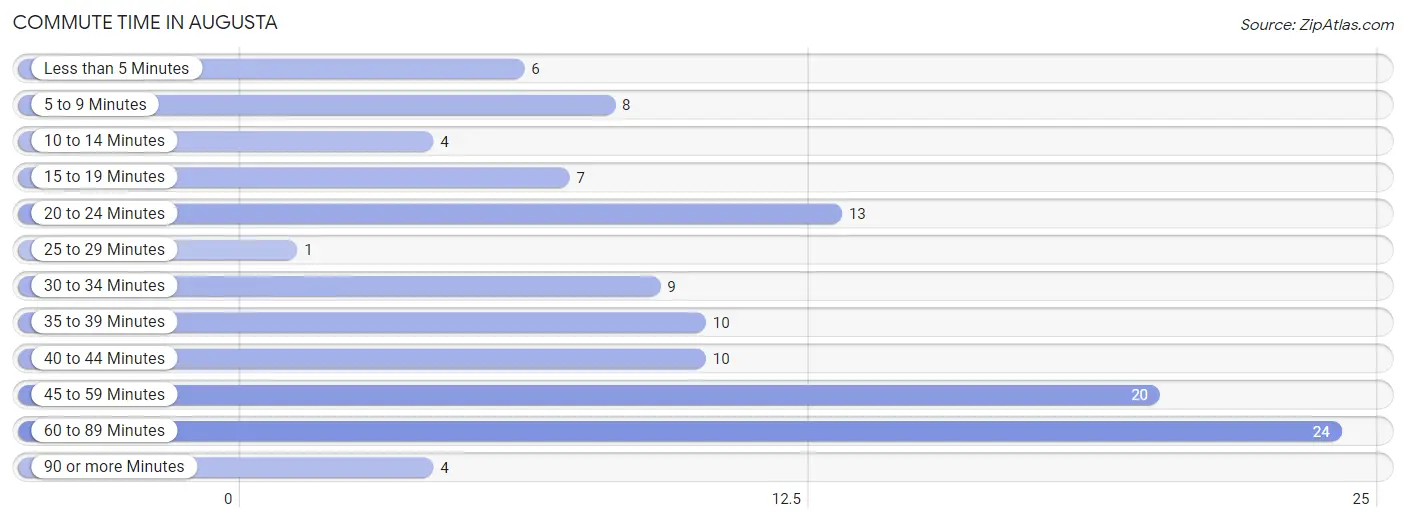
| Commute Time | # Commuters | % Commuters |
| Less than 5 Minutes | 6 | 5.2% |
| 5 to 9 Minutes | 8 | 6.9% |
| 10 to 14 Minutes | 4 | 3.5% |
| 15 to 19 Minutes | 7 | 6.0% |
| 20 to 24 Minutes | 13 | 11.2% |
| 25 to 29 Minutes | 1 | 0.9% |
| 30 to 34 Minutes | 9 | 7.8% |
| 35 to 39 Minutes | 10 | 8.6% |
| 40 to 44 Minutes | 10 | 8.6% |
| 45 to 59 Minutes | 20 | 17.2% |
| 60 to 89 Minutes | 24 | 20.7% |
| 90 or more Minutes | 4 | 3.5% |
Commute Time by Sex in Augusta
The most common commute times in Augusta are 60 to 89 minutes (18 commuters, 28.1%) for males and 5 to 9 minutes (8 commuters, 15.4%) for females.
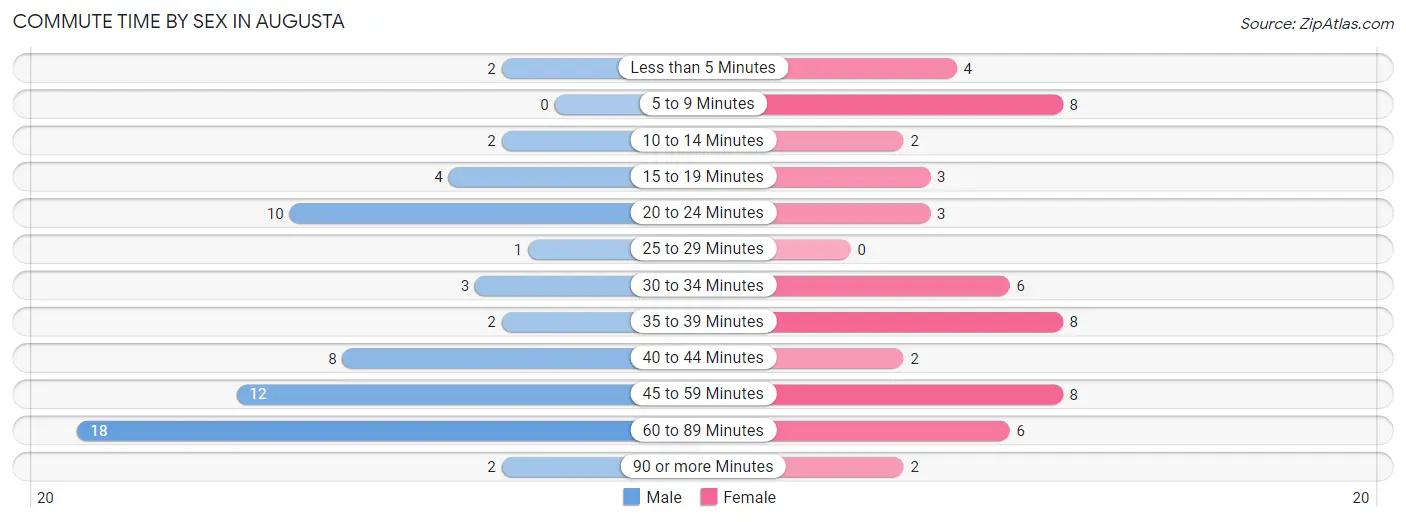
| Commute Time | Male | Female |
| Less than 5 Minutes | 2 (3.1%) | 4 (7.7%) |
| 5 to 9 Minutes | 0 (0.0%) | 8 (15.4%) |
| 10 to 14 Minutes | 2 (3.1%) | 2 (3.8%) |
| 15 to 19 Minutes | 4 (6.2%) | 3 (5.8%) |
| 20 to 24 Minutes | 10 (15.6%) | 3 (5.8%) |
| 25 to 29 Minutes | 1 (1.6%) | 0 (0.0%) |
| 30 to 34 Minutes | 3 (4.7%) | 6 (11.5%) |
| 35 to 39 Minutes | 2 (3.1%) | 8 (15.4%) |
| 40 to 44 Minutes | 8 (12.5%) | 2 (3.8%) |
| 45 to 59 Minutes | 12 (18.8%) | 8 (15.4%) |
| 60 to 89 Minutes | 18 (28.1%) | 6 (11.5%) |
| 90 or more Minutes | 2 (3.1%) | 2 (3.8%) |
Time of Departure to Work by Sex in Augusta
The most frequent times of departure to work in Augusta are 6:00 AM to 6:29 AM (13, 20.3%) for males and 7:00 AM to 7:29 AM (12, 23.1%) for females.
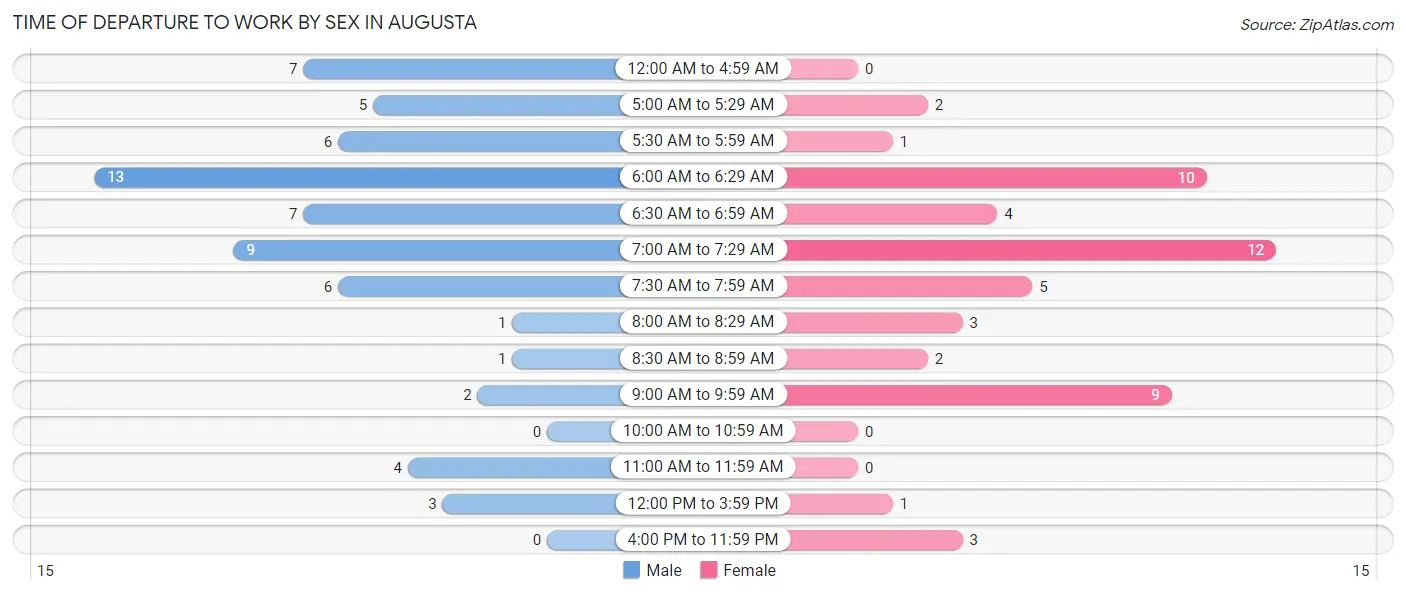
| Time of Departure | Male | Female |
| 12:00 AM to 4:59 AM | 7 (10.9%) | 0 (0.0%) |
| 5:00 AM to 5:29 AM | 5 (7.8%) | 2 (3.8%) |
| 5:30 AM to 5:59 AM | 6 (9.4%) | 1 (1.9%) |
| 6:00 AM to 6:29 AM | 13 (20.3%) | 10 (19.2%) |
| 6:30 AM to 6:59 AM | 7 (10.9%) | 4 (7.7%) |
| 7:00 AM to 7:29 AM | 9 (14.1%) | 12 (23.1%) |
| 7:30 AM to 7:59 AM | 6 (9.4%) | 5 (9.6%) |
| 8:00 AM to 8:29 AM | 1 (1.6%) | 3 (5.8%) |
| 8:30 AM to 8:59 AM | 1 (1.6%) | 2 (3.8%) |
| 9:00 AM to 9:59 AM | 2 (3.1%) | 9 (17.3%) |
| 10:00 AM to 10:59 AM | 0 (0.0%) | 0 (0.0%) |
| 11:00 AM to 11:59 AM | 4 (6.2%) | 0 (0.0%) |
| 12:00 PM to 3:59 PM | 3 (4.7%) | 1 (1.9%) |
| 4:00 PM to 11:59 PM | 0 (0.0%) | 3 (5.8%) |
| Total | 64 (100.0%) | 52 (100.0%) |
Housing Occupancy in Augusta
Occupancy by Ownership in Augusta
Of the total 123 dwellings in Augusta, owner-occupied units account for 112 (91.1%), while renter-occupied units make up 11 (8.9%).
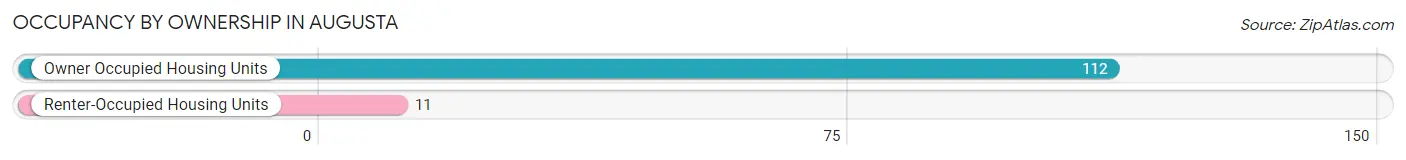
| Occupancy | # Housing Units | % Housing Units |
| Owner Occupied Housing Units | 112 | 91.1% |
| Renter-Occupied Housing Units | 11 | 8.9% |
| Total Occupied Housing Units | 123 | 100.0% |
Occupancy by Household Size in Augusta
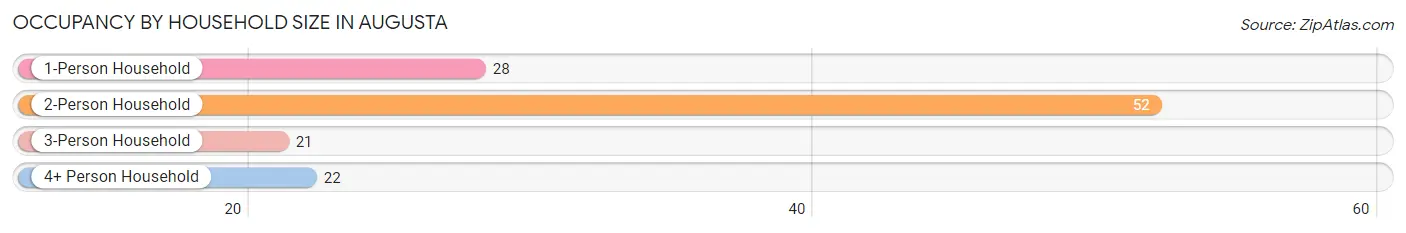
| Household Size | # Housing Units | % Housing Units |
| 1-Person Household | 28 | 22.8% |
| 2-Person Household | 52 | 42.3% |
| 3-Person Household | 21 | 17.1% |
| 4+ Person Household | 22 | 17.9% |
| Total Housing Units | 123 | 100.0% |
Occupancy by Ownership by Household Size in Augusta
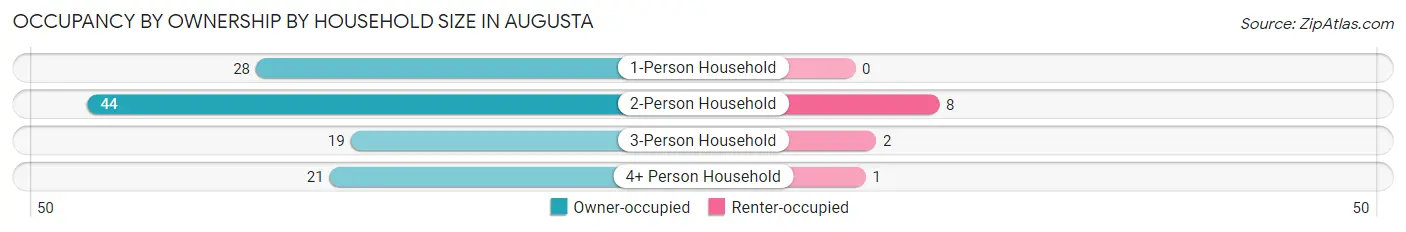
| Household Size | Owner-occupied | Renter-occupied |
| 1-Person Household | 28 (100.0%) | 0 (0.0%) |
| 2-Person Household | 44 (84.6%) | 8 (15.4%) |
| 3-Person Household | 19 (90.5%) | 2 (9.5%) |
| 4+ Person Household | 21 (95.5%) | 1 (4.5%) |
| Total Housing Units | 112 (91.1%) | 11 (8.9%) |
Occupancy by Educational Attainment in Augusta
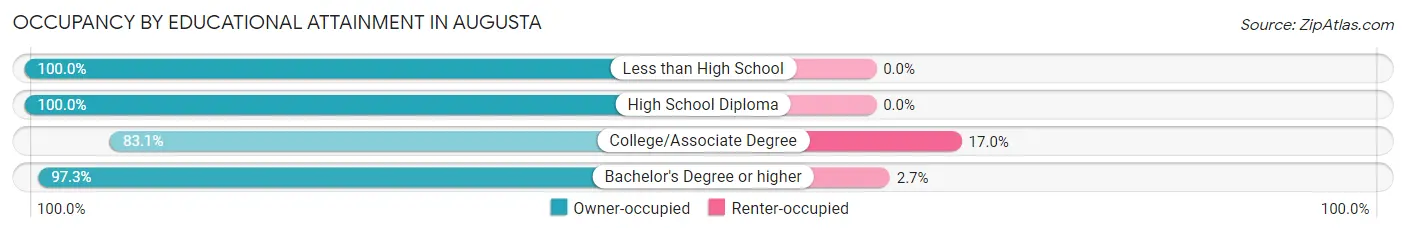
| Household Size | Owner-occupied | Renter-occupied |
| Less than High School | 2 (100.0%) | 0 (0.0%) |
| High School Diploma | 25 (100.0%) | 0 (0.0%) |
| College/Associate Degree | 49 (83.1%) | 10 (17.0%) |
| Bachelor's Degree or higher | 36 (97.3%) | 1 (2.7%) |
Occupancy by Age of Householder in Augusta
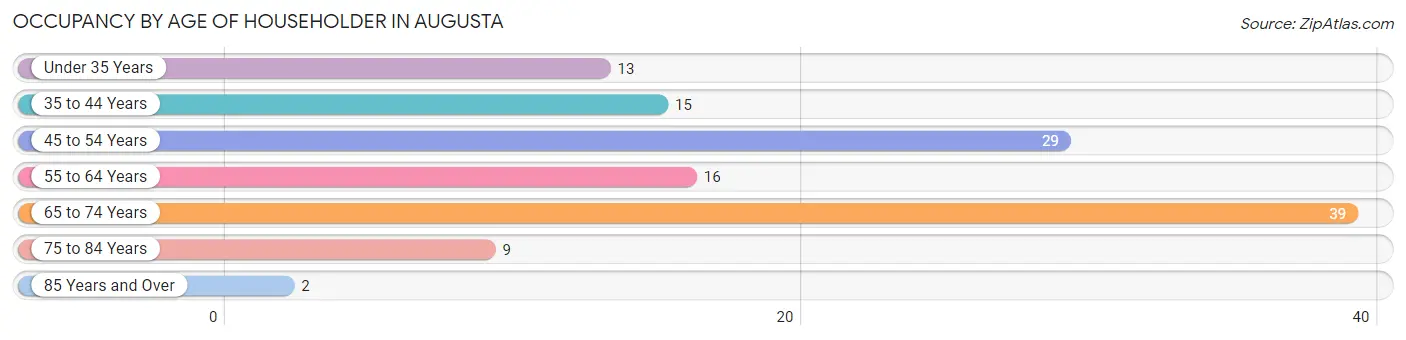
| Age Bracket | # Households | % Households |
| Under 35 Years | 13 | 10.6% |
| 35 to 44 Years | 15 | 12.2% |
| 45 to 54 Years | 29 | 23.6% |
| 55 to 64 Years | 16 | 13.0% |
| 65 to 74 Years | 39 | 31.7% |
| 75 to 84 Years | 9 | 7.3% |
| 85 Years and Over | 2 | 1.6% |
| Total | 123 | 100.0% |
Housing Finances in Augusta
Median Income by Occupancy in Augusta
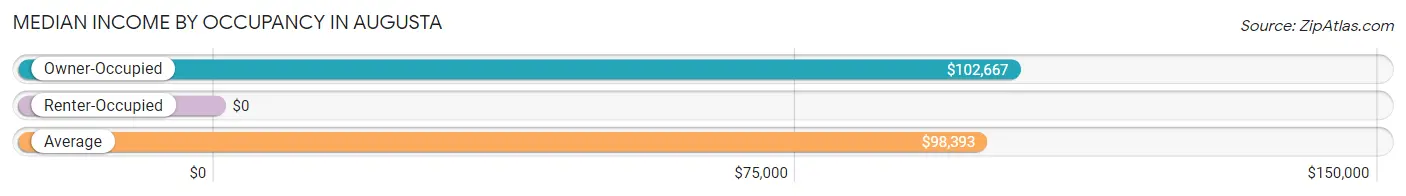
| Occupancy Type | # Households | Median Income |
| Owner-Occupied | 112 (91.1%) | $102,667 |
| Renter-Occupied | 11 (8.9%) | $0 |
| Average | 123 (100.0%) | $98,393 |
Occupancy by Householder Income Bracket in Augusta
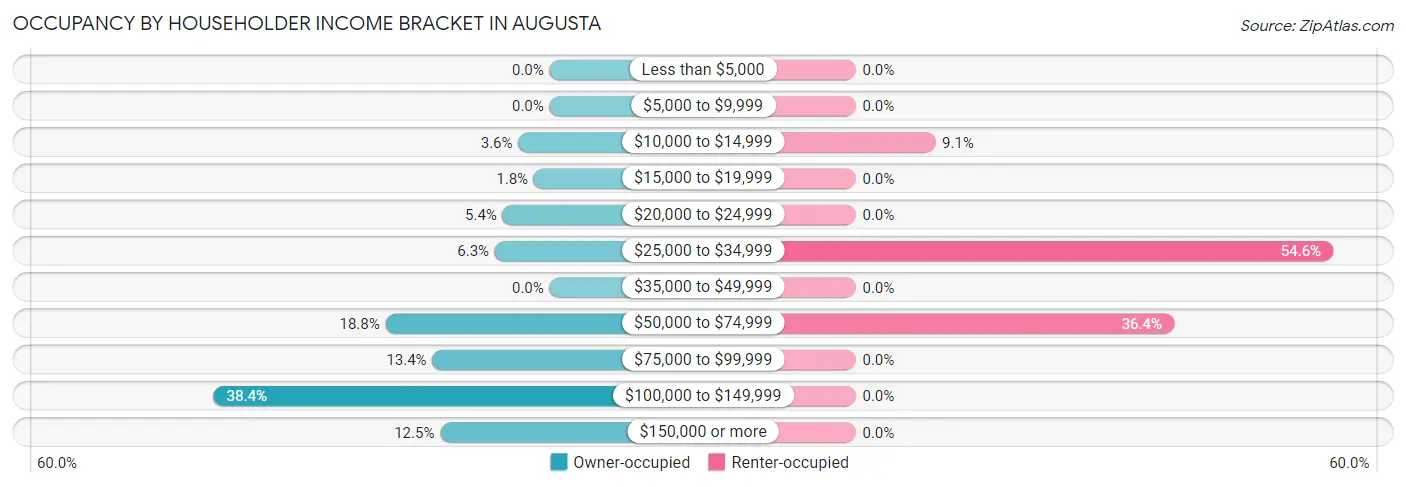
| Income Bracket | Owner-occupied | Renter-occupied |
| Less than $5,000 | 0 (0.0%) | 0 (0.0%) |
| $5,000 to $9,999 | 0 (0.0%) | 0 (0.0%) |
| $10,000 to $14,999 | 4 (3.6%) | 1 (9.1%) |
| $15,000 to $19,999 | 2 (1.8%) | 0 (0.0%) |
| $20,000 to $24,999 | 6 (5.4%) | 0 (0.0%) |
| $25,000 to $34,999 | 7 (6.2%) | 6 (54.5%) |
| $35,000 to $49,999 | 0 (0.0%) | 0 (0.0%) |
| $50,000 to $74,999 | 21 (18.8%) | 4 (36.4%) |
| $75,000 to $99,999 | 15 (13.4%) | 0 (0.0%) |
| $100,000 to $149,999 | 43 (38.4%) | 0 (0.0%) |
| $150,000 or more | 14 (12.5%) | 0 (0.0%) |
| Total | 112 (100.0%) | 11 (100.0%) |
Monthly Housing Cost Tiers in Augusta
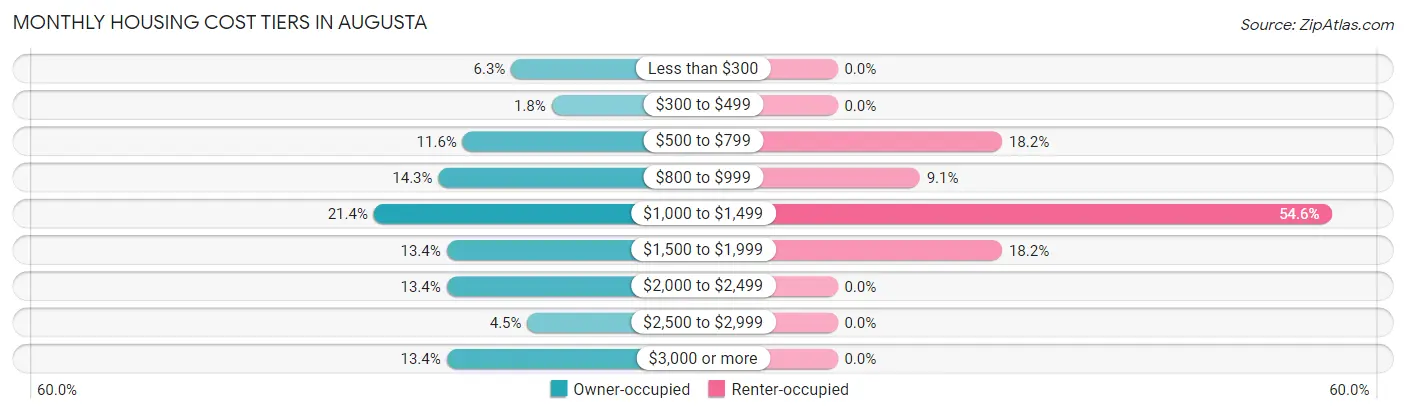
| Monthly Cost | Owner-occupied | Renter-occupied |
| Less than $300 | 7 (6.2%) | 0 (0.0%) |
| $300 to $499 | 2 (1.8%) | 0 (0.0%) |
| $500 to $799 | 13 (11.6%) | 2 (18.2%) |
| $800 to $999 | 16 (14.3%) | 1 (9.1%) |
| $1,000 to $1,499 | 24 (21.4%) | 6 (54.5%) |
| $1,500 to $1,999 | 15 (13.4%) | 2 (18.2%) |
| $2,000 to $2,499 | 15 (13.4%) | 0 (0.0%) |
| $2,500 to $2,999 | 5 (4.5%) | 0 (0.0%) |
| $3,000 or more | 15 (13.4%) | 0 (0.0%) |
| Total | 112 (100.0%) | 11 (100.0%) |
Physical Housing Characteristics in Augusta
Housing Structures in Augusta
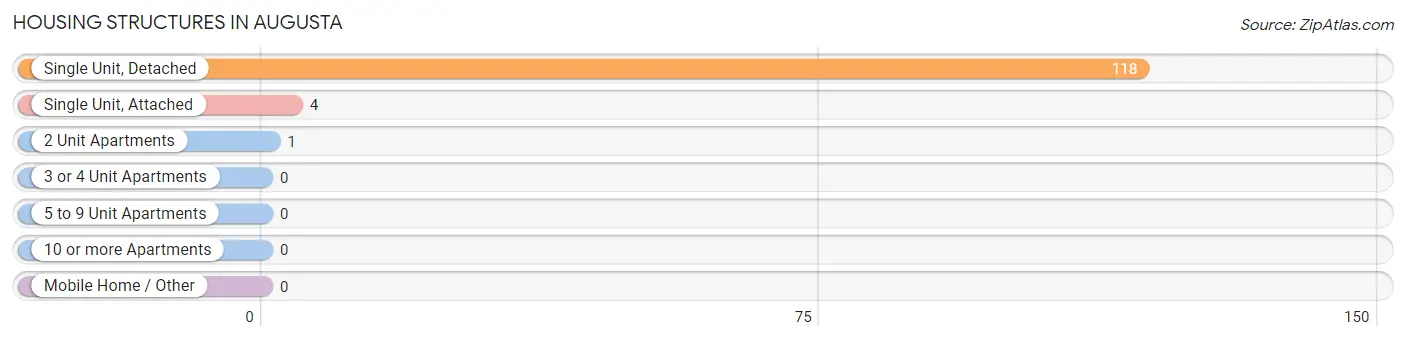
| Structure Type | # Housing Units | % Housing Units |
| Single Unit, Detached | 118 | 95.9% |
| Single Unit, Attached | 4 | 3.3% |
| 2 Unit Apartments | 1 | 0.8% |
| 3 or 4 Unit Apartments | 0 | 0.0% |
| 5 to 9 Unit Apartments | 0 | 0.0% |
| 10 or more Apartments | 0 | 0.0% |
| Mobile Home / Other | 0 | 0.0% |
| Total | 123 | 100.0% |
Housing Structures by Occupancy in Augusta
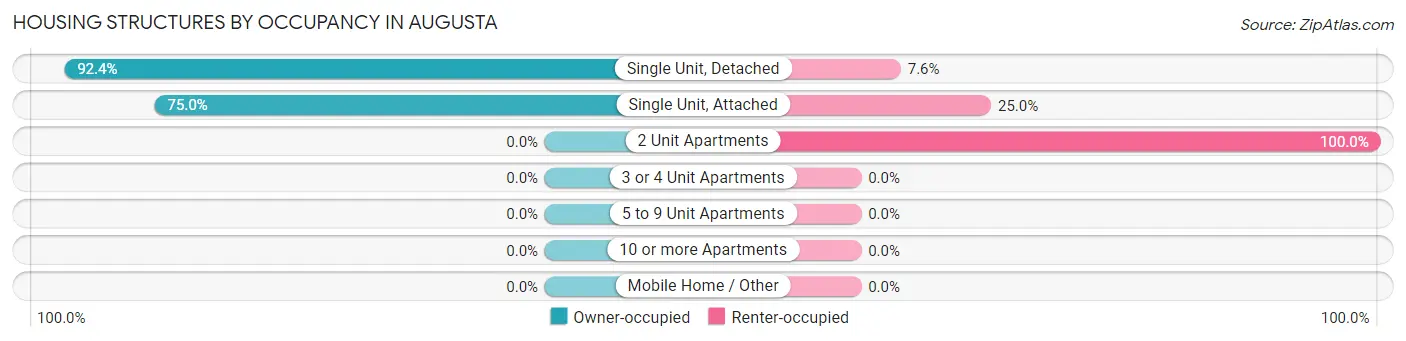
| Structure Type | Owner-occupied | Renter-occupied |
| Single Unit, Detached | 109 (92.4%) | 9 (7.6%) |
| Single Unit, Attached | 3 (75.0%) | 1 (25.0%) |
| 2 Unit Apartments | 0 (0.0%) | 1 (100.0%) |
| 3 or 4 Unit Apartments | 0 (0.0%) | 0 (0.0%) |
| 5 to 9 Unit Apartments | 0 (0.0%) | 0 (0.0%) |
| 10 or more Apartments | 0 (0.0%) | 0 (0.0%) |
| Mobile Home / Other | 0 (0.0%) | 0 (0.0%) |
| Total | 112 (91.1%) | 11 (8.9%) |
Housing Structures by Number of Rooms in Augusta
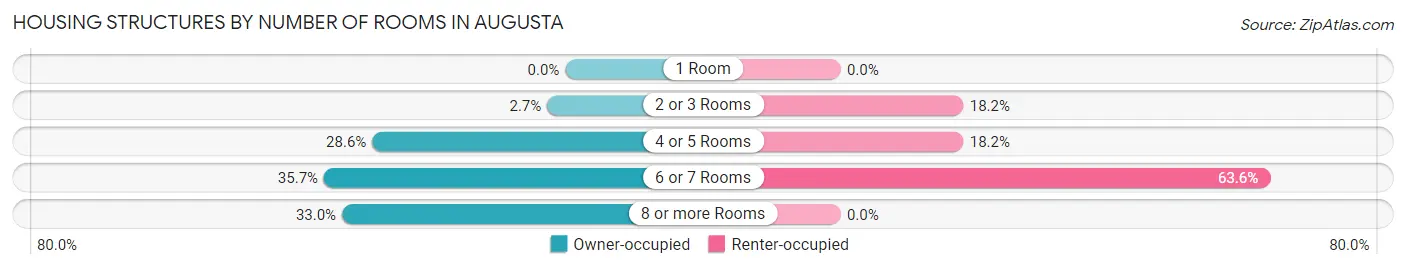
| Number of Rooms | Owner-occupied | Renter-occupied |
| 1 Room | 0 (0.0%) | 0 (0.0%) |
| 2 or 3 Rooms | 3 (2.7%) | 2 (18.2%) |
| 4 or 5 Rooms | 32 (28.6%) | 2 (18.2%) |
| 6 or 7 Rooms | 40 (35.7%) | 7 (63.6%) |
| 8 or more Rooms | 37 (33.0%) | 0 (0.0%) |
| Total | 112 (100.0%) | 11 (100.0%) |
Housing Structure by Heating Type in Augusta
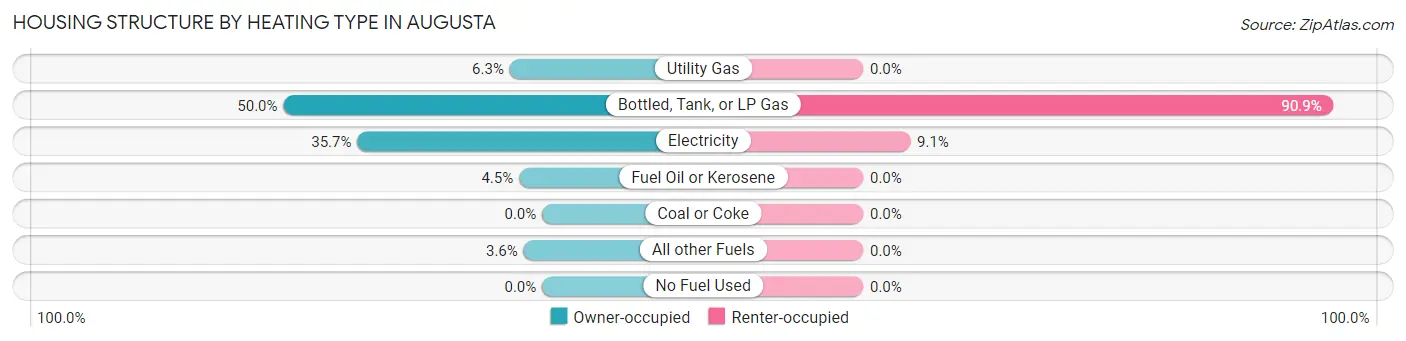
| Heating Type | Owner-occupied | Renter-occupied |
| Utility Gas | 7 (6.2%) | 0 (0.0%) |
| Bottled, Tank, or LP Gas | 56 (50.0%) | 10 (90.9%) |
| Electricity | 40 (35.7%) | 1 (9.1%) |
| Fuel Oil or Kerosene | 5 (4.5%) | 0 (0.0%) |
| Coal or Coke | 0 (0.0%) | 0 (0.0%) |
| All other Fuels | 4 (3.6%) | 0 (0.0%) |
| No Fuel Used | 0 (0.0%) | 0 (0.0%) |
| Total | 112 (100.0%) | 11 (100.0%) |
Household Vehicle Usage in Augusta
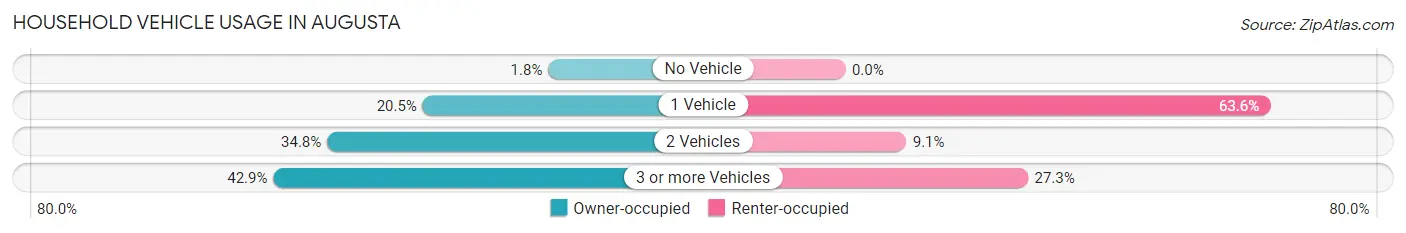
| Vehicles per Household | Owner-occupied | Renter-occupied |
| No Vehicle | 2 (1.8%) | 0 (0.0%) |
| 1 Vehicle | 23 (20.5%) | 7 (63.6%) |
| 2 Vehicles | 39 (34.8%) | 1 (9.1%) |
| 3 or more Vehicles | 48 (42.9%) | 3 (27.3%) |
| Total | 112 (100.0%) | 11 (100.0%) |
Real Estate & Mortgages in Augusta
Real Estate and Mortgage Overview in Augusta
| Characteristic | Without Mortgage | With Mortgage |
| Housing Units | 28 | 84 |
| Median Property Value | $200,000 | $342,900 |
| Median Household Income | $60,000 | $11 |
| Monthly Housing Costs | $571 | $15 |
| Real Estate Taxes | $2,100 | $0 |
Property Value by Mortgage Status in Augusta
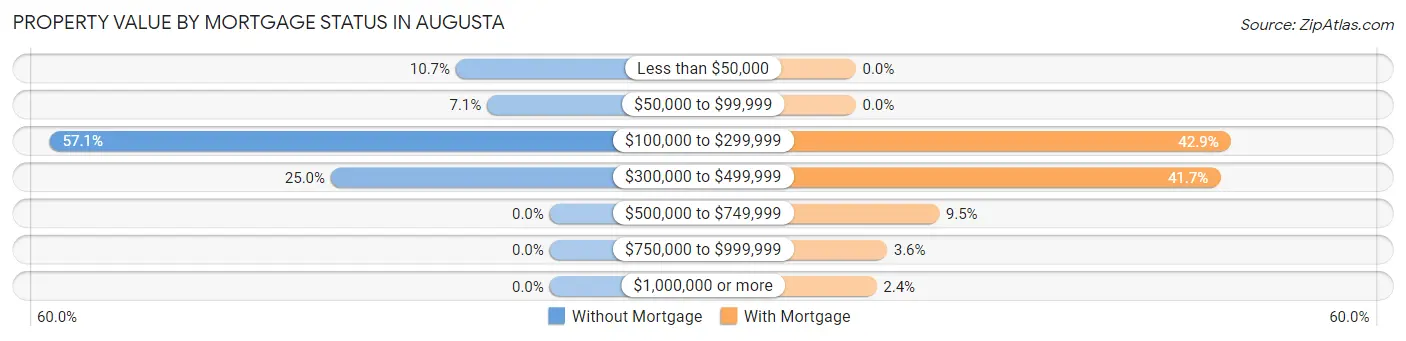
| Property Value | Without Mortgage | With Mortgage |
| Less than $50,000 | 3 (10.7%) | 0 (0.0%) |
| $50,000 to $99,999 | 2 (7.1%) | 0 (0.0%) |
| $100,000 to $299,999 | 16 (57.1%) | 36 (42.9%) |
| $300,000 to $499,999 | 7 (25.0%) | 35 (41.7%) |
| $500,000 to $749,999 | 0 (0.0%) | 8 (9.5%) |
| $750,000 to $999,999 | 0 (0.0%) | 3 (3.6%) |
| $1,000,000 or more | 0 (0.0%) | 2 (2.4%) |
| Total | 28 (100.0%) | 84 (100.0%) |
Household Income by Mortgage Status in Augusta
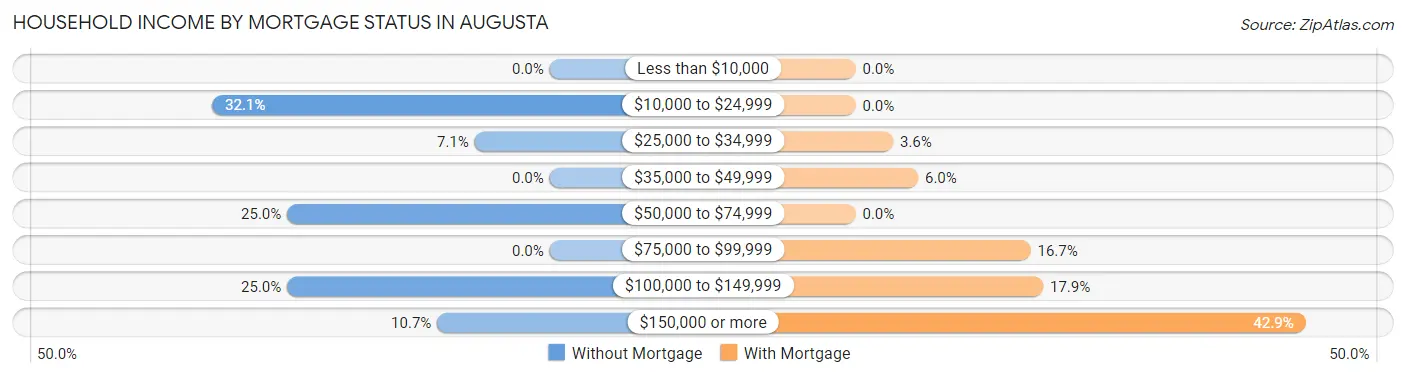
| Household Income | Without Mortgage | With Mortgage |
| Less than $10,000 | 0 (0.0%) | 0 (0.0%) |
| $10,000 to $24,999 | 9 (32.1%) | 0 (0.0%) |
| $25,000 to $34,999 | 2 (7.1%) | 3 (3.6%) |
| $35,000 to $49,999 | 0 (0.0%) | 5 (5.9%) |
| $50,000 to $74,999 | 7 (25.0%) | 0 (0.0%) |
| $75,000 to $99,999 | 0 (0.0%) | 14 (16.7%) |
| $100,000 to $149,999 | 7 (25.0%) | 15 (17.9%) |
| $150,000 or more | 3 (10.7%) | 36 (42.9%) |
| Total | 28 (100.0%) | 84 (100.0%) |
Property Value to Household Income Ratio in Augusta
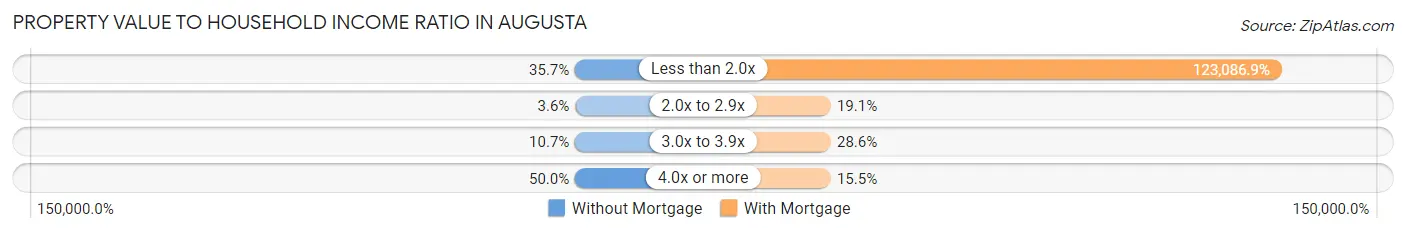
| Value-to-Income Ratio | Without Mortgage | With Mortgage |
| Less than 2.0x | 10 (35.7%) | 103,393 (123,086.9%) |
| 2.0x to 2.9x | 1 (3.6%) | 16 (19.1%) |
| 3.0x to 3.9x | 3 (10.7%) | 24 (28.6%) |
| 4.0x or more | 14 (50.0%) | 13 (15.5%) |
| Total | 28 (100.0%) | 84 (100.0%) |
Real Estate Taxes by Mortgage Status in Augusta
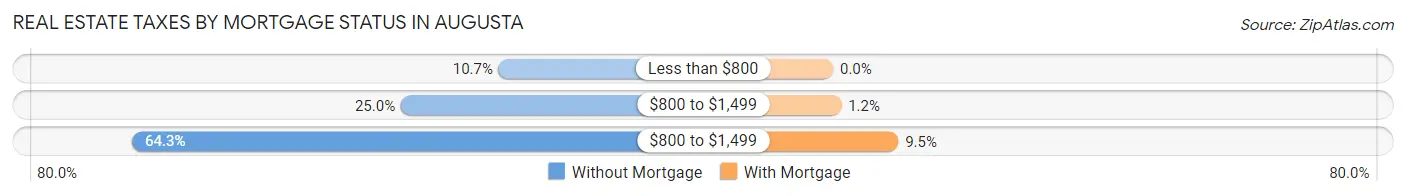
| Property Taxes | Without Mortgage | With Mortgage |
| Less than $800 | 3 (10.7%) | 0 (0.0%) |
| $800 to $1,499 | 7 (25.0%) | 1 (1.2%) |
| $800 to $1,499 | 18 (64.3%) | 8 (9.5%) |
| Total | 28 (100.0%) | 84 (100.0%) |
Health & Disability in Augusta
Health Insurance Coverage by Age in Augusta
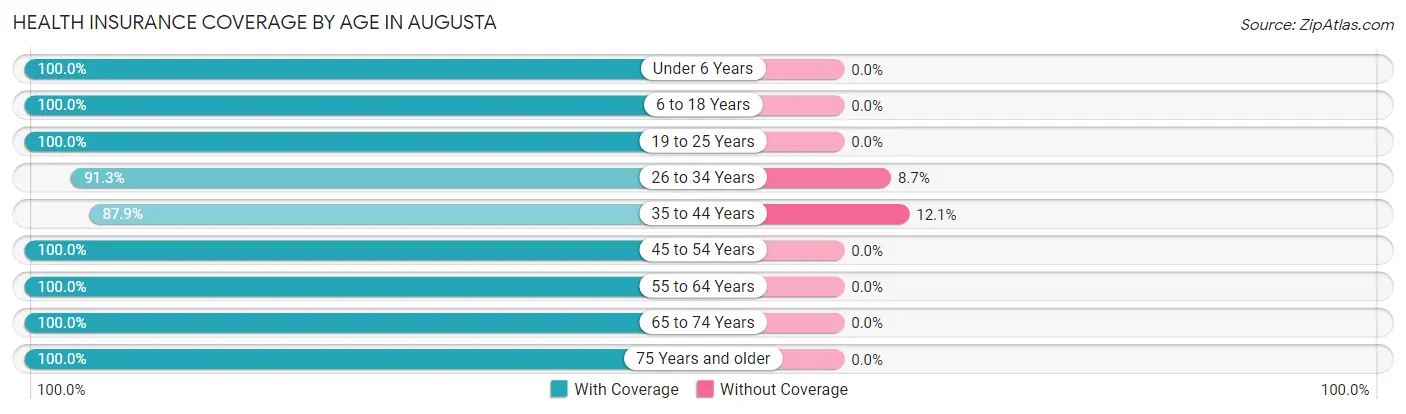
| Age Bracket | With Coverage | Without Coverage |
| Under 6 Years | 11 (100.0%) | 0 (0.0%) |
| 6 to 18 Years | 57 (100.0%) | 0 (0.0%) |
| 19 to 25 Years | 4 (100.0%) | 0 (0.0%) |
| 26 to 34 Years | 21 (91.3%) | 2 (8.7%) |
| 35 to 44 Years | 29 (87.9%) | 4 (12.1%) |
| 45 to 54 Years | 47 (100.0%) | 0 (0.0%) |
| 55 to 64 Years | 32 (100.0%) | 0 (0.0%) |
| 65 to 74 Years | 63 (100.0%) | 0 (0.0%) |
| 75 Years and older | 20 (100.0%) | 0 (0.0%) |
| Total | 284 (97.9%) | 6 (2.1%) |
Health Insurance Coverage by Citizenship Status in Augusta
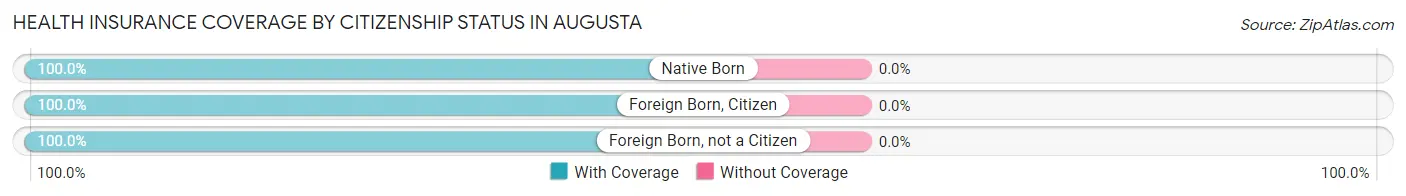
| Citizenship Status | With Coverage | Without Coverage |
| Native Born | 11 (100.0%) | 0 (0.0%) |
| Foreign Born, Citizen | 57 (100.0%) | 0 (0.0%) |
| Foreign Born, not a Citizen | 4 (100.0%) | 0 (0.0%) |
Health Insurance Coverage by Household Income in Augusta
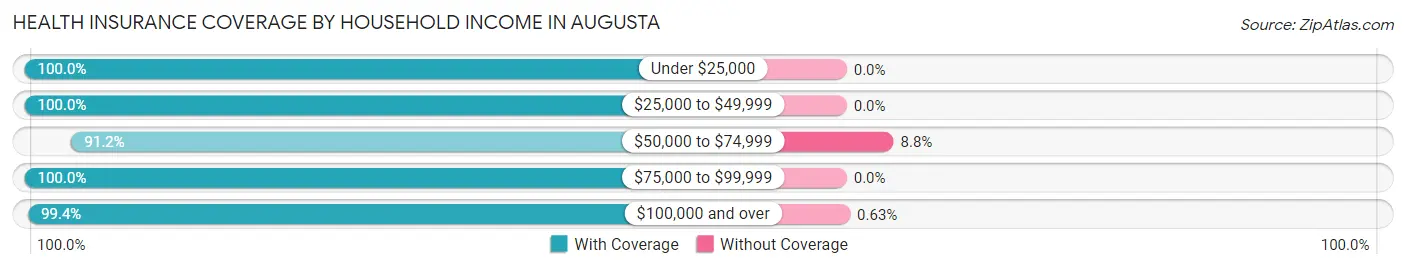
| Household Income | With Coverage | Without Coverage |
| Under $25,000 | 20 (100.0%) | 0 (0.0%) |
| $25,000 to $49,999 | 23 (100.0%) | 0 (0.0%) |
| $50,000 to $74,999 | 52 (91.2%) | 5 (8.8%) |
| $75,000 to $99,999 | 32 (100.0%) | 0 (0.0%) |
| $100,000 and over | 157 (99.4%) | 1 (0.6%) |
Public vs Private Health Insurance Coverage by Age in Augusta
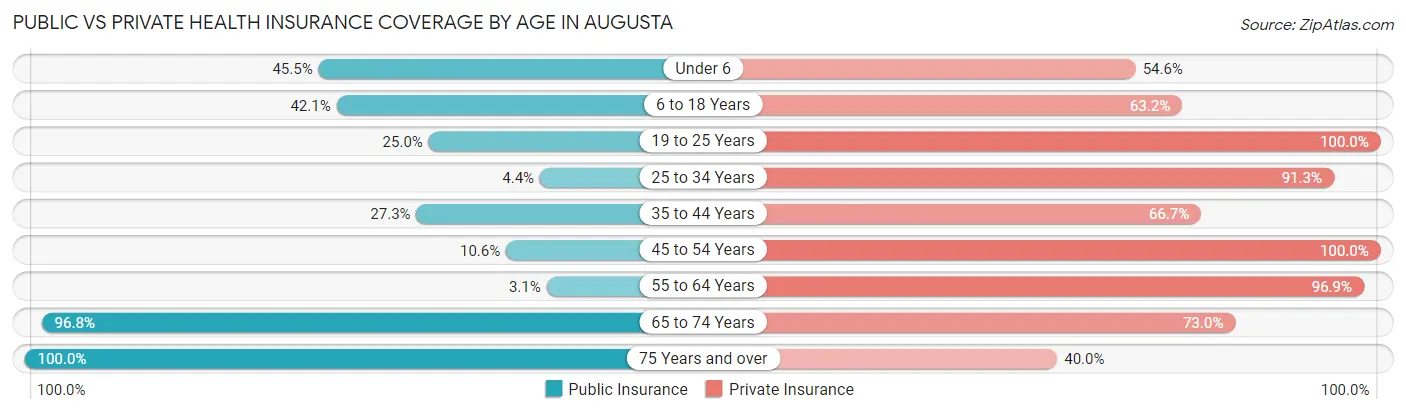
| Age Bracket | Public Insurance | Private Insurance |
| Under 6 | 5 (45.5%) | 6 (54.5%) |
| 6 to 18 Years | 24 (42.1%) | 36 (63.2%) |
| 19 to 25 Years | 1 (25.0%) | 4 (100.0%) |
| 25 to 34 Years | 1 (4.3%) | 21 (91.3%) |
| 35 to 44 Years | 9 (27.3%) | 22 (66.7%) |
| 45 to 54 Years | 5 (10.6%) | 47 (100.0%) |
| 55 to 64 Years | 1 (3.1%) | 31 (96.9%) |
| 65 to 74 Years | 61 (96.8%) | 46 (73.0%) |
| 75 Years and over | 20 (100.0%) | 8 (40.0%) |
| Total | 127 (43.8%) | 221 (76.2%) |
Disability Status by Sex by Age in Augusta
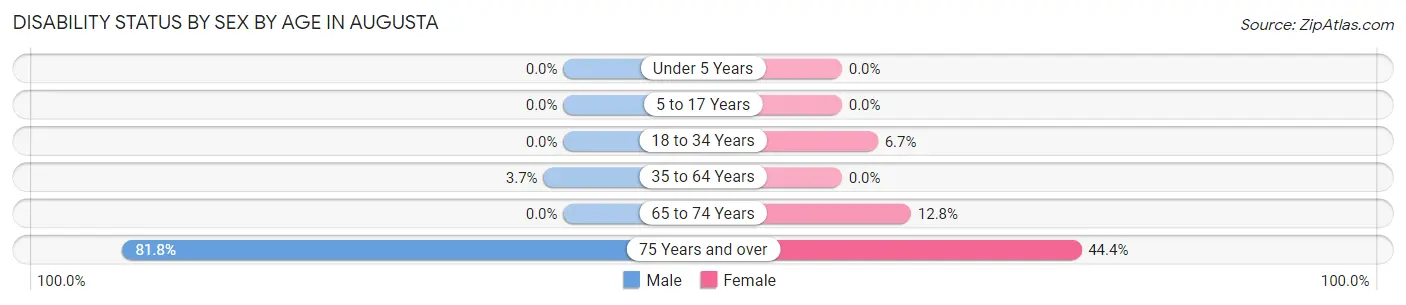
| Age Bracket | Male | Female |
| Under 5 Years | 0 (0.0%) | 0 (0.0%) |
| 5 to 17 Years | 0 (0.0%) | 0 (0.0%) |
| 18 to 34 Years | 0 (0.0%) | 1 (6.7%) |
| 35 to 64 Years | 2 (3.7%) | 0 (0.0%) |
| 65 to 74 Years | 0 (0.0%) | 5 (12.8%) |
| 75 Years and over | 9 (81.8%) | 4 (44.4%) |
Disability Class by Sex by Age in Augusta
Disability Class: Hearing Difficulty
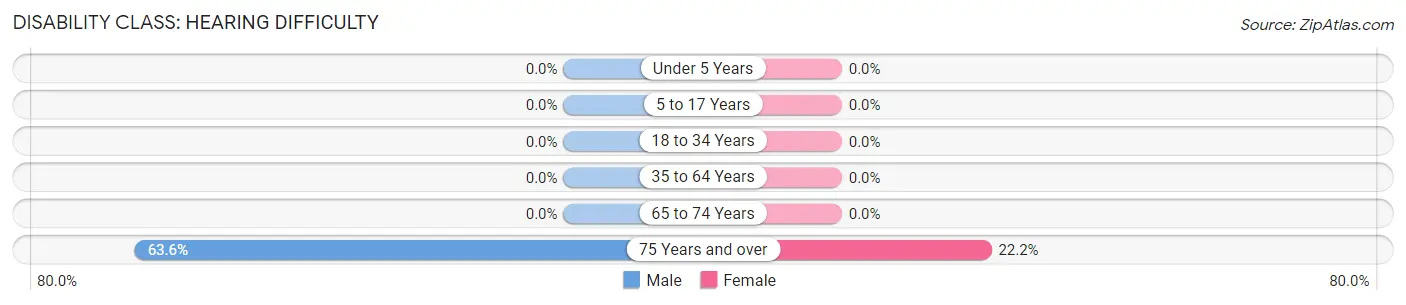
| Age Bracket | Male | Female |
| Under 5 Years | 0 (0.0%) | 0 (0.0%) |
| 5 to 17 Years | 0 (0.0%) | 0 (0.0%) |
| 18 to 34 Years | 0 (0.0%) | 0 (0.0%) |
| 35 to 64 Years | 0 (0.0%) | 0 (0.0%) |
| 65 to 74 Years | 0 (0.0%) | 0 (0.0%) |
| 75 Years and over | 7 (63.6%) | 2 (22.2%) |
Disability Class: Vision Difficulty
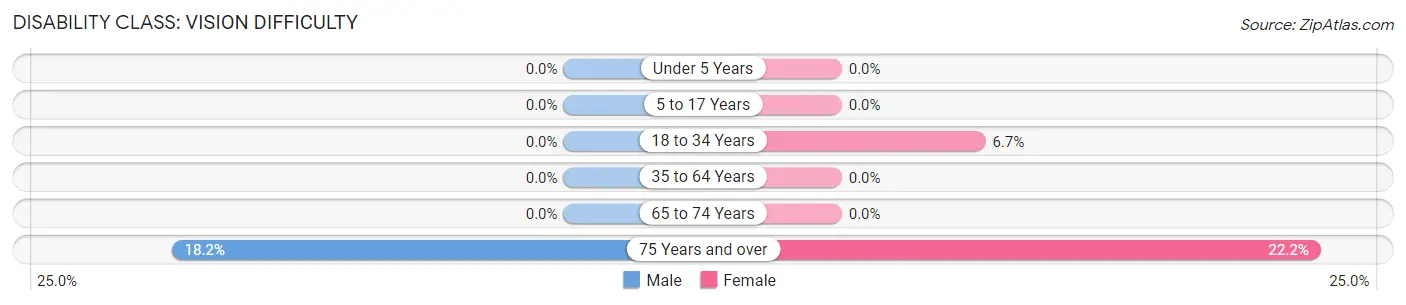
| Age Bracket | Male | Female |
| Under 5 Years | 0 (0.0%) | 0 (0.0%) |
| 5 to 17 Years | 0 (0.0%) | 0 (0.0%) |
| 18 to 34 Years | 0 (0.0%) | 1 (6.7%) |
| 35 to 64 Years | 0 (0.0%) | 0 (0.0%) |
| 65 to 74 Years | 0 (0.0%) | 0 (0.0%) |
| 75 Years and over | 2 (18.2%) | 2 (22.2%) |
Disability Class: Cognitive Difficulty
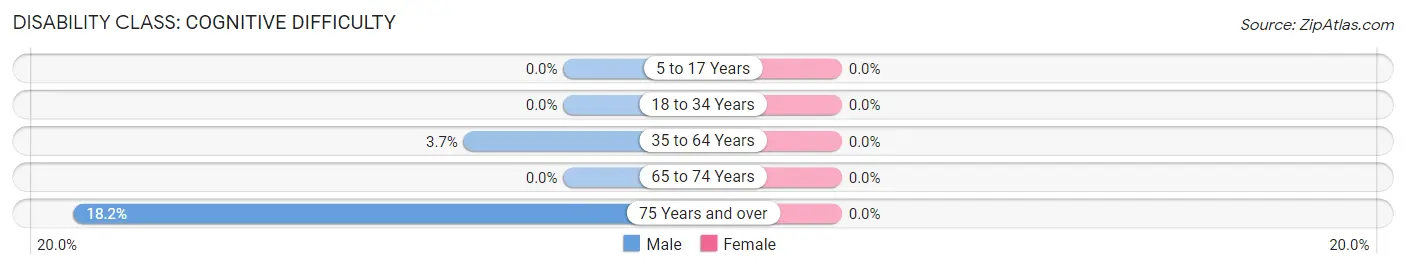
| Age Bracket | Male | Female |
| 5 to 17 Years | 0 (0.0%) | 0 (0.0%) |
| 18 to 34 Years | 0 (0.0%) | 0 (0.0%) |
| 35 to 64 Years | 2 (3.7%) | 0 (0.0%) |
| 65 to 74 Years | 0 (0.0%) | 0 (0.0%) |
| 75 Years and over | 2 (18.2%) | 0 (0.0%) |
Disability Class: Ambulatory Difficulty
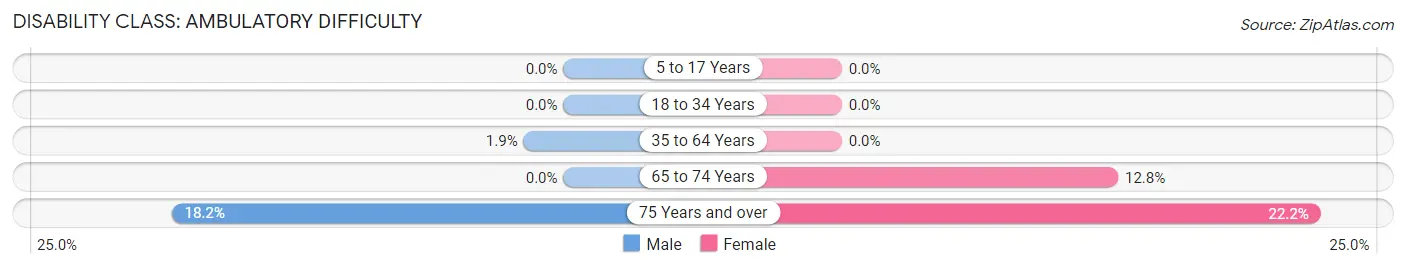
| Age Bracket | Male | Female |
| 5 to 17 Years | 0 (0.0%) | 0 (0.0%) |
| 18 to 34 Years | 0 (0.0%) | 0 (0.0%) |
| 35 to 64 Years | 1 (1.8%) | 0 (0.0%) |
| 65 to 74 Years | 0 (0.0%) | 5 (12.8%) |
| 75 Years and over | 2 (18.2%) | 2 (22.2%) |
Disability Class: Self-Care Difficulty
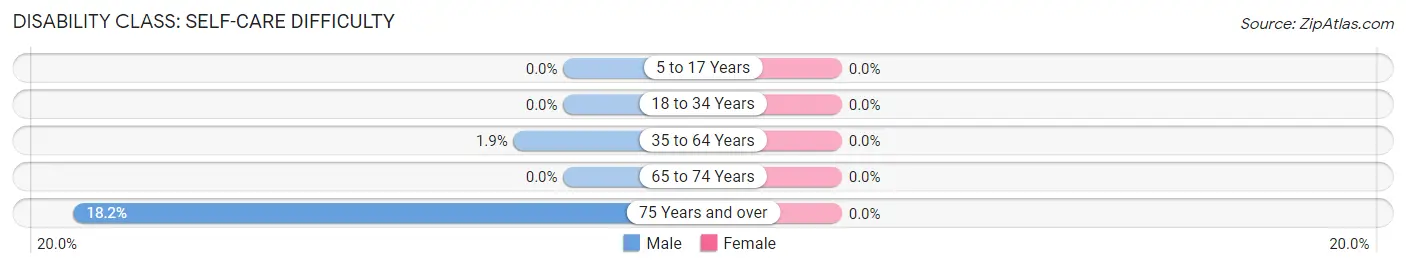
| Age Bracket | Male | Female |
| 5 to 17 Years | 0 (0.0%) | 0 (0.0%) |
| 18 to 34 Years | 0 (0.0%) | 0 (0.0%) |
| 35 to 64 Years | 1 (1.8%) | 0 (0.0%) |
| 65 to 74 Years | 0 (0.0%) | 0 (0.0%) |
| 75 Years and over | 2 (18.2%) | 0 (0.0%) |
Technology Access in Augusta
Computing Device Access in Augusta
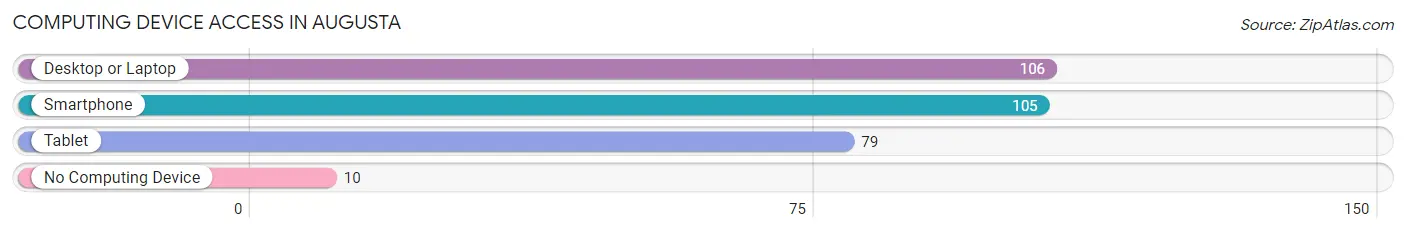
| Device Type | # Households | % Households |
| Desktop or Laptop | 106 | 86.2% |
| Smartphone | 105 | 85.4% |
| Tablet | 79 | 64.2% |
| No Computing Device | 10 | 8.1% |
| Total | 123 | 100.0% |
Internet Access in Augusta
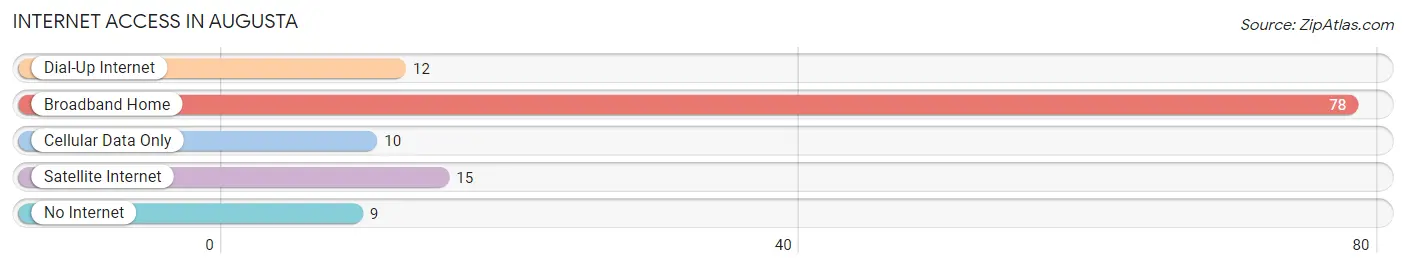
| Internet Type | # Households | % Households |
| Dial-Up Internet | 12 | 9.8% |
| Broadband Home | 78 | 63.4% |
| Cellular Data Only | 10 | 8.1% |
| Satellite Internet | 15 | 12.2% |
| No Internet | 9 | 7.3% |
| Total | 123 | 100.0% |
Augusta Summary
Augusta, Missouri is a small town located in St. Charles County, Missouri, United States. It is situated on the Missouri River, approximately 25 miles northwest of St. Louis. The town was founded in 1819 and is the oldest town in St. Charles County.
Augusta is a small town with a population of 1,845 people as of the 2010 census. The town is located in the Missouri River Valley, and is surrounded by rolling hills and farmland. The town is home to a variety of businesses, including a grocery store, a hardware store, a bank, a post office, and several restaurants.
Augusta is a rural community with a strong agricultural heritage. The town is home to several farms, including a dairy farm, a beef cattle farm, and a horse farm. The town is also home to a variety of small businesses, including a winery, a brewery, and a distillery.
Augusta is located in the St. Charles County School District. The town is home to two elementary schools, Augusta Elementary and Augusta Middle School. The town is also home to a high school, Augusta High School.
Augusta is a small town with a rich history. The town was founded in 1819 by a group of settlers from Augusta, Georgia. The town was named after the city in Georgia, and the settlers brought with them a variety of traditions and customs from their home state. The town was an important stop on the Missouri River, and was a major trading center for the area.
Augusta is a small town with a strong sense of community. The town is home to a variety of organizations and events, including the Augusta Lions Club, the Augusta Historical Society, and the Augusta Arts Council. The town also hosts a variety of festivals and events throughout the year, including the Augusta Music Festival, the Augusta Arts Festival, and the Augusta Wine Festival.
Augusta is a small town with a strong economy. The town is home to a variety of businesses, including a grocery store, a hardware store, a bank, a post office, and several restaurants. The town is also home to a variety of small businesses, including a winery, a brewery, and a distillery. The town is also home to a variety of manufacturing businesses, including a furniture factory, a printing company, and a plastics factory.
Augusta is a small town with a diverse population. The town is home to a variety of ethnic and racial groups, including African Americans, Hispanics, Asians, and Native Americans. The town is also home to a variety of religious groups, including Catholics, Protestants, and Jews.
Augusta is a small town with a rich history and a strong sense of community. The town is home to a variety of businesses, organizations, and events, and is a great place to live and work. The town is a great place to raise a family, and is a great place to visit.
Common Questions
What is Per Capita Income in Augusta?
Per Capita income in Augusta is $43,581.
What is the Median Family Income in Augusta?
Median Family Income in Augusta is $104,083.
What is the Median Household income in Augusta?
Median Household Income in Augusta is $98,393.
What is Income or Wage Gap in Augusta?
Income or Wage Gap in Augusta is 63.7%.
Women in Augusta earn 36.3 cents for every dollar earned by a man.
What is Inequality or Gini Index in Augusta?
Inequality or Gini Index in Augusta is 0.38.
What is the Total Population of Augusta?
Total Population of Augusta is 290.
What is the Total Male Population of Augusta?
Total Male Population of Augusta is 130.
What is the Total Female Population of Augusta?
Total Female Population of Augusta is 160.
What is the Ratio of Males per 100 Females in Augusta?
There are 81.25 Males per 100 Females in Augusta.
What is the Ratio of Females per 100 Males in Augusta?
There are 123.08 Females per 100 Males in Augusta.
What is the Median Population Age in Augusta?
Median Population Age in Augusta is 51.2 Years.
What is the Average Family Size in Augusta
Average Family Size in Augusta is 2.8 People.
What is the Average Household Size in Augusta
Average Household Size in Augusta is 2.4 People.
How Large is the Labor Force in Augusta?
There are 138 People in the Labor Forcein in Augusta.
What is the Percentage of People in the Labor Force in Augusta?
60.5% of People are in the Labor Force in Augusta.
What is the Unemployment Rate in Augusta?
Unemployment Rate in Augusta is 2.2%.