Anderson, MO Map & Demographics
Anderson Map
Anderson Overview
$19,684
PER CAPITA INCOME
$54,457
AVG FAMILY INCOME
$47,500
AVG HOUSEHOLD INCOME
32.5%
WAGE / INCOME GAP [ % ]
67.5¢/ $1
WAGE / INCOME GAP [ $ ]
$11,409
FAMILY INCOME DEFICIT
0.42
INEQUALITY / GINI INDEX
2,561
TOTAL POPULATION
1,271
MALE POPULATION
1,290
FEMALE POPULATION
98.53
MALES / 100 FEMALES
101.49
FEMALES / 100 MALES
33.2
MEDIAN AGE
3.1
AVG FAMILY SIZE
2.9
AVG HOUSEHOLD SIZE
1,044
LABOR FORCE [ PEOPLE ]
55.3%
PERCENT IN LABOR FORCE
2.6%
UNEMPLOYMENT RATE
Anderson Zip Codes
Anderson Area Codes
Income in Anderson
Income Overview in Anderson
Per Capita Income in Anderson is $19,684, while median incomes of families and households are $54,457 and $47,500 respectively.
| Characteristic | Number | Measure |
| Per Capita Income | 2,561 | $19,684 |
| Median Family Income | 686 | $54,457 |
| Mean Family Income | 686 | $61,077 |
| Median Household Income | 866 | $47,500 |
| Mean Household Income | 866 | $57,231 |
| Income Deficit | 686 | $11,409 |
| Wage / Income Gap (%) | 2,561 | 32.53% |
| Wage / Income Gap ($) | 2,561 | 67.47¢ per $1 |
| Gini / Inequality Index | 2,561 | 0.42 |
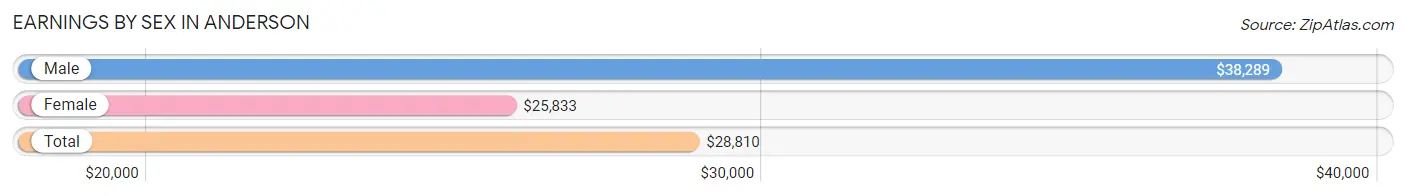
Earnings by Sex in Anderson
Average Earnings in Anderson are $28,810, $38,289 for men and $25,833 for women, a difference of 32.5%.
| Sex | Number | Average Earnings |
| Male | 516 (48.9%) | $38,289 |
| Female | 540 (51.1%) | $25,833 |
| Total | 1,056 (100.0%) | $28,810 |
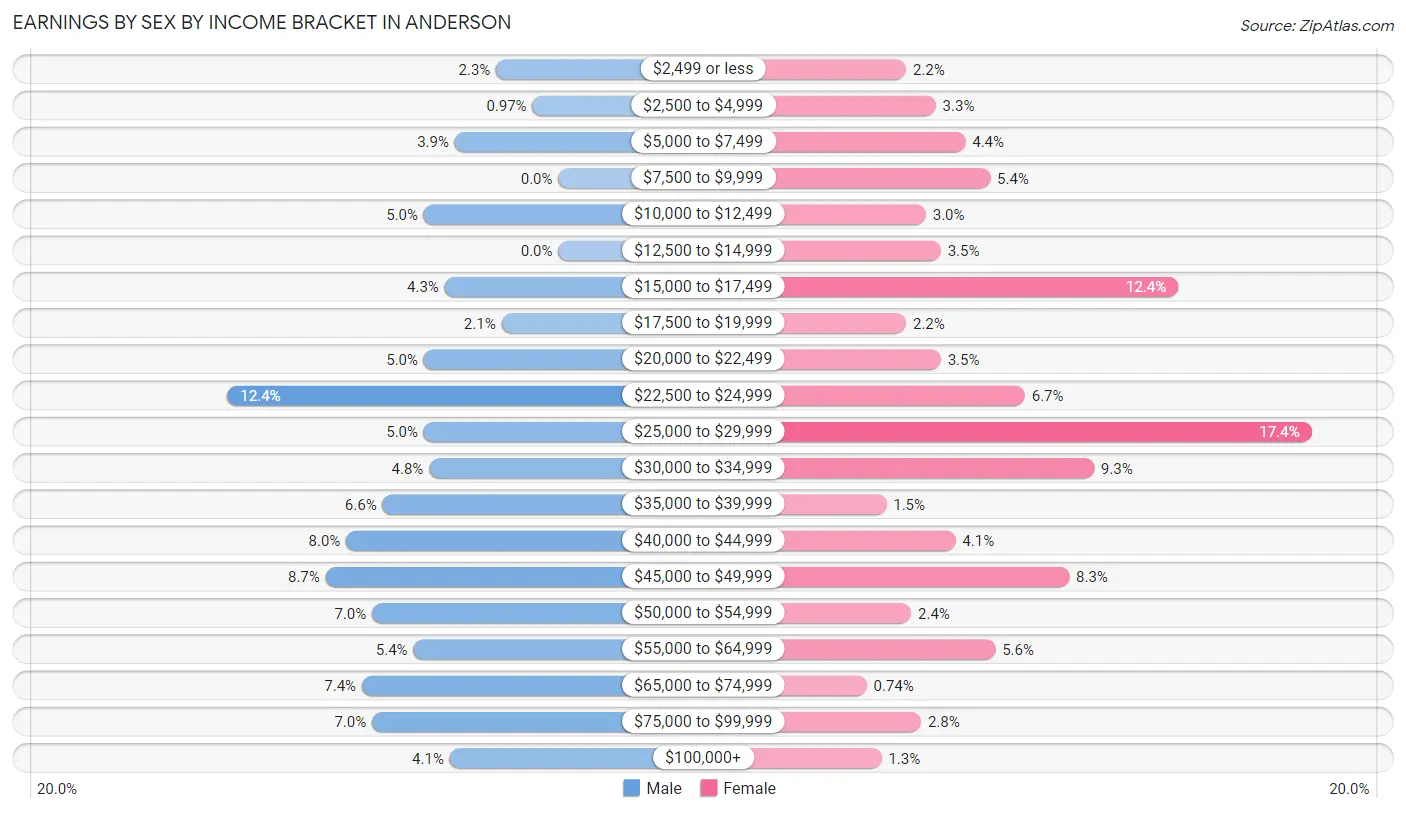
Earnings by Sex by Income Bracket in Anderson
The most common earnings brackets in Anderson are $22,500 to $24,999 for men (64 | 12.4%) and $25,000 to $29,999 for women (94 | 17.4%).
| Income | Male | Female |
| $2,499 or less | 12 (2.3%) | 12 (2.2%) |
| $2,500 to $4,999 | 5 (1.0%) | 18 (3.3%) |
| $5,000 to $7,499 | 20 (3.9%) | 24 (4.4%) |
| $7,500 to $9,999 | 0 (0.0%) | 29 (5.4%) |
| $10,000 to $12,499 | 26 (5.0%) | 16 (3.0%) |
| $12,500 to $14,999 | 0 (0.0%) | 19 (3.5%) |
| $15,000 to $17,499 | 22 (4.3%) | 67 (12.4%) |
| $17,500 to $19,999 | 11 (2.1%) | 12 (2.2%) |
| $20,000 to $22,499 | 26 (5.0%) | 19 (3.5%) |
| $22,500 to $24,999 | 64 (12.4%) | 36 (6.7%) |
| $25,000 to $29,999 | 26 (5.0%) | 94 (17.4%) |
| $30,000 to $34,999 | 25 (4.8%) | 50 (9.3%) |
| $35,000 to $39,999 | 34 (6.6%) | 8 (1.5%) |
| $40,000 to $44,999 | 41 (8.0%) | 22 (4.1%) |
| $45,000 to $49,999 | 45 (8.7%) | 45 (8.3%) |
| $50,000 to $54,999 | 36 (7.0%) | 13 (2.4%) |
| $55,000 to $64,999 | 28 (5.4%) | 30 (5.6%) |
| $65,000 to $74,999 | 38 (7.4%) | 4 (0.7%) |
| $75,000 to $99,999 | 36 (7.0%) | 15 (2.8%) |
| $100,000+ | 21 (4.1%) | 7 (1.3%) |
| Total | 516 (100.0%) | 540 (100.0%) |
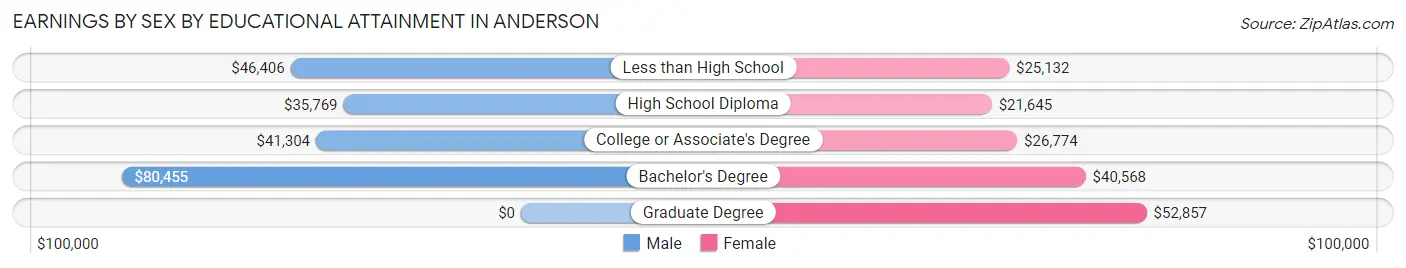
Earnings by Sex by Educational Attainment in Anderson
Average earnings in Anderson are $44,338 for men and $25,972 for women, a difference of 41.4%. Men with an educational attainment of bachelor's degree enjoy the highest average annual earnings of $80,455, while those with high school diploma education earn the least with $35,769. Women with an educational attainment of graduate degree earn the most with the average annual earnings of $52,857, while those with high school diploma education have the smallest earnings of $21,645.
| Educational Attainment | Male Income | Female Income |
| Less than High School | $46,406 | $25,132 |
| High School Diploma | $35,769 | $21,645 |
| College or Associate's Degree | $41,304 | $26,774 |
| Bachelor's Degree | $80,455 | $40,568 |
| Graduate Degree | - | - |
| Total | $44,338 | $25,972 |
Family Income in Anderson
Family Income Brackets in Anderson
According to the Anderson family income data, there are 134 families falling into the $75,000 to $99,999 income range, which is the most common income bracket and makes up 19.5% of all families.
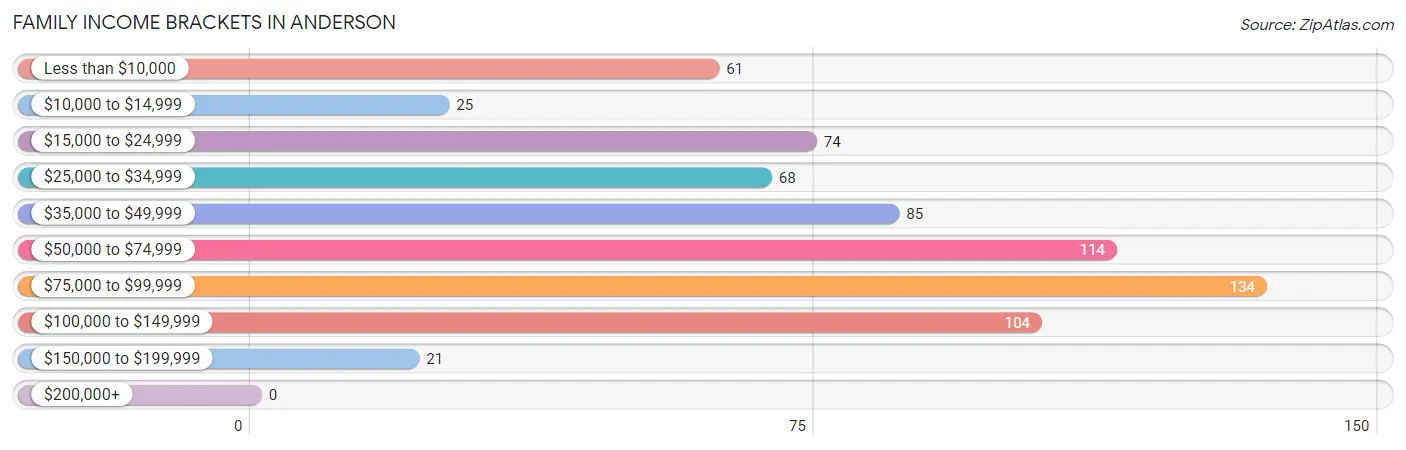
| Income Bracket | # Families | % Families |
| Less than $10,000 | 61 | 8.9% |
| $10,000 to $14,999 | 25 | 3.6% |
| $15,000 to $24,999 | 74 | 10.8% |
| $25,000 to $34,999 | 68 | 9.9% |
| $35,000 to $49,999 | 85 | 12.4% |
| $50,000 to $74,999 | 114 | 16.6% |
| $75,000 to $99,999 | 134 | 19.5% |
| $100,000 to $149,999 | 104 | 15.2% |
| $150,000 to $199,999 | 21 | 3.1% |
| $200,000+ | 0 | 0.0% |
Family Income by Famaliy Size in Anderson
5-person families (63 | 9.2%) account for the highest median family income in Anderson with $105,156 per family, while 2-person families (278 | 40.5%) have the highest median income of $22,768 per family member.
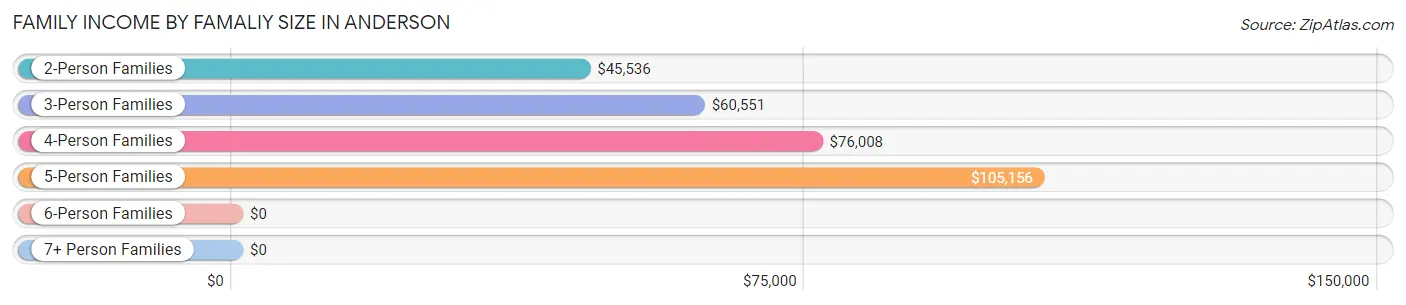
| Income Bracket | # Families | Median Income |
| 2-Person Families | 278 (40.5%) | $45,536 |
| 3-Person Families | 183 (26.7%) | $60,551 |
| 4-Person Families | 127 (18.5%) | $76,008 |
| 5-Person Families | 63 (9.2%) | $105,156 |
| 6-Person Families | 17 (2.5%) | $0 |
| 7+ Person Families | 18 (2.6%) | $0 |
| Total | 686 (100.0%) | $54,457 |
Family Income by Number of Earners in Anderson
The median family income in Anderson is $54,457, with families comprising 3+ earners (37) having the highest median family income of $125,139, while families with no earners (134) have the lowest median family income of $18,875, accounting for 5.4% and 19.5% of families, respectively.
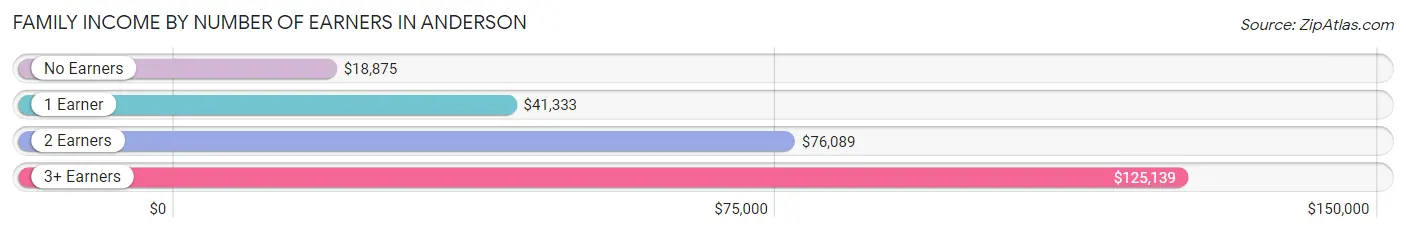
| Number of Earners | # Families | Median Income |
| No Earners | 134 (19.5%) | $18,875 |
| 1 Earner | 302 (44.0%) | $41,333 |
| 2 Earners | 213 (31.0%) | $76,089 |
| 3+ Earners | 37 (5.4%) | $125,139 |
| Total | 686 (100.0%) | $54,457 |
Household Income in Anderson
Household Income Brackets in Anderson
With 138 households falling in the category, the $35,000 to $49,999 income range is the most frequent in Anderson, accounting for 15.9% of all households.
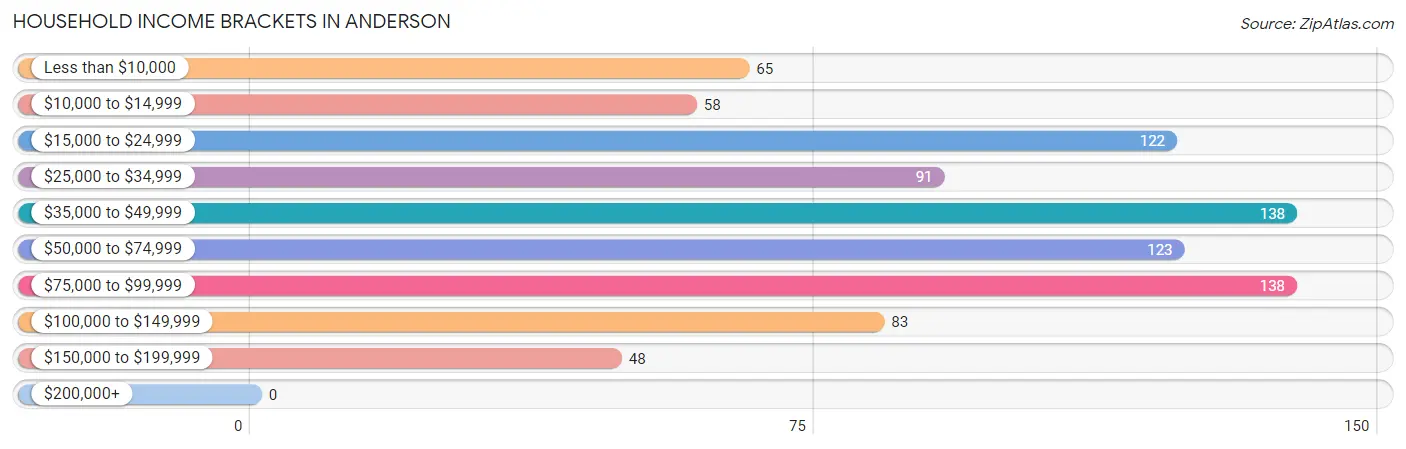
| Income Bracket | # Households | % Households |
| Less than $10,000 | 65 | 7.5% |
| $10,000 to $14,999 | 58 | 6.7% |
| $15,000 to $24,999 | 122 | 14.1% |
| $25,000 to $34,999 | 91 | 10.5% |
| $35,000 to $49,999 | 138 | 15.9% |
| $50,000 to $74,999 | 123 | 14.2% |
| $75,000 to $99,999 | 138 | 15.9% |
| $100,000 to $149,999 | 83 | 9.6% |
| $150,000 to $199,999 | 48 | 5.5% |
| $200,000+ | 0 | 0.0% |
Household Income by Householder Age in Anderson
The median household income in Anderson is $47,500, with the highest median household income of $49,861 found in the 25 to 44 years age bracket for the primary householder. A total of 384 households (44.3%) fall into this category. Meanwhile, the 15 to 24 years age bracket for the primary householder has the lowest median household income of $2,499, with 27 households (3.1%) in this group.
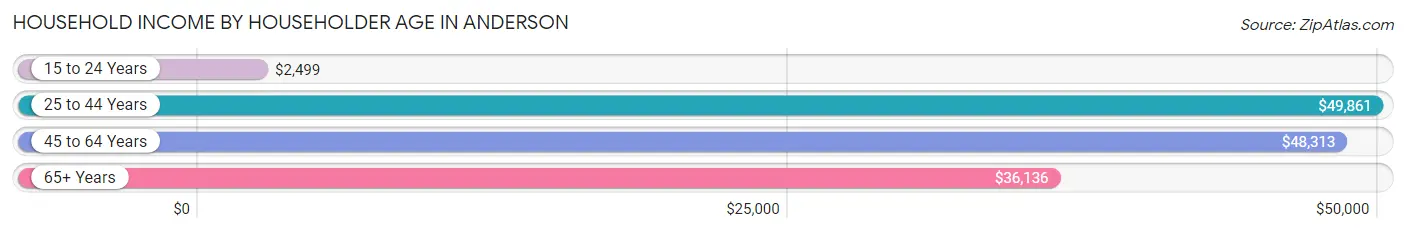
| Income Bracket | # Households | Median Income |
| 15 to 24 Years | 27 (3.1%) | $2,499 |
| 25 to 44 Years | 384 (44.3%) | $49,861 |
| 45 to 64 Years | 305 (35.2%) | $48,313 |
| 65+ Years | 150 (17.3%) | $36,136 |
| Total | 866 (100.0%) | $47,500 |
Poverty in Anderson
Income Below Poverty by Sex and Age in Anderson
With 26.6% poverty level for males and 25.8% for females among the residents of Anderson, 16 and 17 year old males and under 5 year old females are the most vulnerable to poverty, with 24 males (58.5%) and 54 females (58.7%) in their respective age groups living below the poverty level.
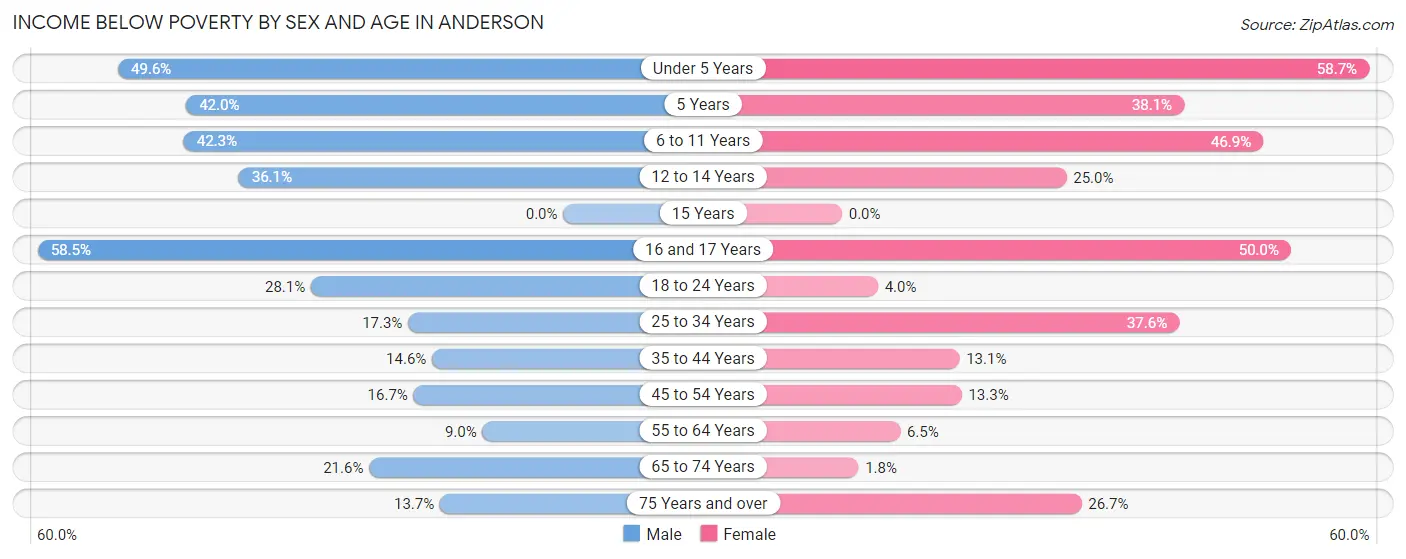
| Age Bracket | Male | Female |
| Under 5 Years | 62 (49.6%) | 54 (58.7%) |
| 5 Years | 21 (42.0%) | 8 (38.1%) |
| 6 to 11 Years | 41 (42.3%) | 76 (46.9%) |
| 12 to 14 Years | 30 (36.1%) | 3 (25.0%) |
| 15 Years | 0 (0.0%) | 0 (0.0%) |
| 16 and 17 Years | 24 (58.5%) | 3 (50.0%) |
| 18 to 24 Years | 43 (28.1%) | 1 (4.0%) |
| 25 to 34 Years | 42 (17.3%) | 104 (37.6%) |
| 35 to 44 Years | 13 (14.6%) | 17 (13.1%) |
| 45 to 54 Years | 19 (16.7%) | 32 (13.3%) |
| 55 to 64 Years | 9 (9.0%) | 7 (6.5%) |
| 65 to 74 Years | 16 (21.6%) | 2 (1.8%) |
| 75 Years and over | 7 (13.7%) | 8 (26.7%) |
| Total | 327 (26.6%) | 315 (25.8%) |
Income Above Poverty by Sex and Age in Anderson
According to the poverty statistics in Anderson, males aged 15 years and females aged 15 years are the age groups that are most secure financially, with 100.0% of males and 100.0% of females in these age groups living above the poverty line.
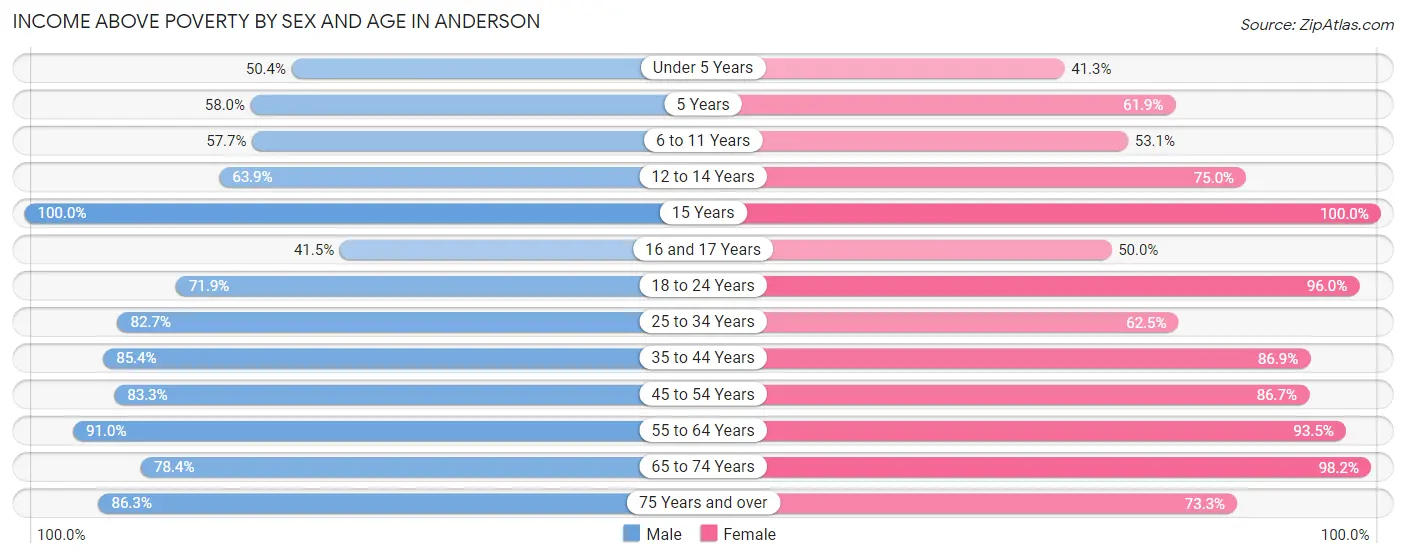
| Age Bracket | Male | Female |
| Under 5 Years | 63 (50.4%) | 38 (41.3%) |
| 5 Years | 29 (58.0%) | 13 (61.9%) |
| 6 to 11 Years | 56 (57.7%) | 86 (53.1%) |
| 12 to 14 Years | 53 (63.9%) | 9 (75.0%) |
| 15 Years | 11 (100.0%) | 11 (100.0%) |
| 16 and 17 Years | 17 (41.5%) | 3 (50.0%) |
| 18 to 24 Years | 110 (71.9%) | 24 (96.0%) |
| 25 to 34 Years | 201 (82.7%) | 173 (62.5%) |
| 35 to 44 Years | 76 (85.4%) | 113 (86.9%) |
| 45 to 54 Years | 95 (83.3%) | 208 (86.7%) |
| 55 to 64 Years | 91 (91.0%) | 101 (93.5%) |
| 65 to 74 Years | 58 (78.4%) | 107 (98.2%) |
| 75 Years and over | 44 (86.3%) | 22 (73.3%) |
| Total | 904 (73.4%) | 908 (74.2%) |
Income Below Poverty Among Married-Couple Families in Anderson
The poverty statistics for married-couple families in Anderson show that 12.5% or 53 of the total 425 families live below the poverty line. Families with 5 or more children have the highest poverty rate of 100.0%, comprising of 14 families. On the other hand, families with 1 or 2 children have the lowest poverty rate of 0.8%, which includes 1 families.
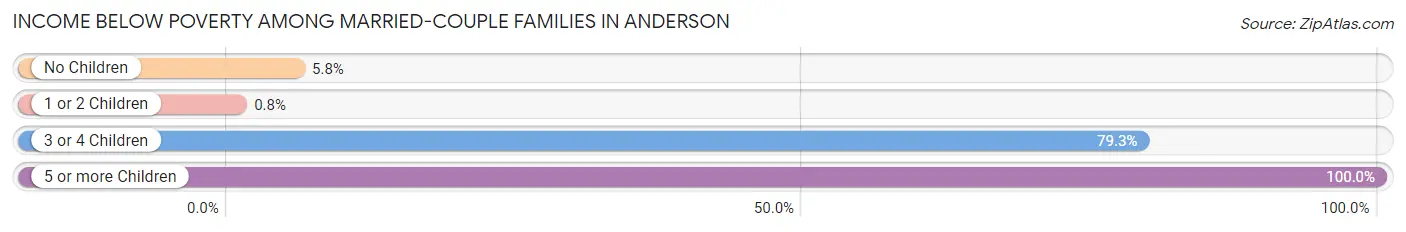
| Children | Above Poverty | Below Poverty |
| No Children | 242 (94.2%) | 15 (5.8%) |
| 1 or 2 Children | 124 (99.2%) | 1 (0.8%) |
| 3 or 4 Children | 6 (20.7%) | 23 (79.3%) |
| 5 or more Children | 0 (0.0%) | 14 (100.0%) |
| Total | 372 (87.5%) | 53 (12.5%) |
Income Below Poverty Among Single-Parent Households in Anderson
According to the poverty data in Anderson, 26.1% or 23 single-father households and 43.9% or 76 single-mother households are living below the poverty line. Among single-father households, those with no children have the highest poverty rate, with 17 households (100.0%) experiencing poverty. Likewise, among single-mother households, those with 1 or 2 children have the highest poverty rate, with 56 households (60.2%) falling below the poverty line.
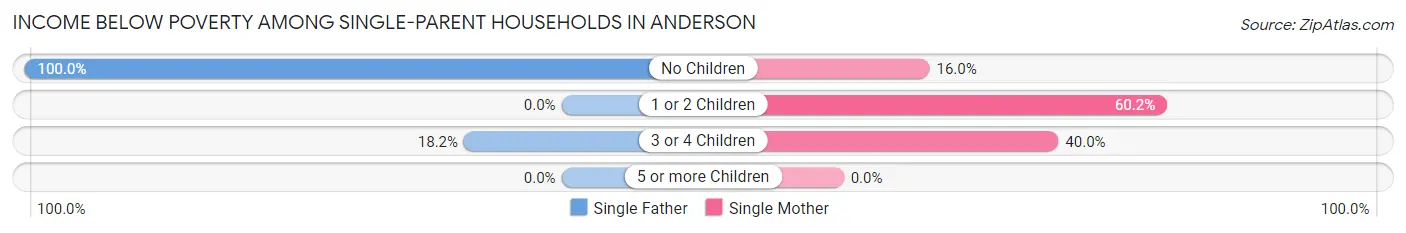
| Children | Single Father | Single Mother |
| No Children | 17 (100.0%) | 8 (16.0%) |
| 1 or 2 Children | 0 (0.0%) | 56 (60.2%) |
| 3 or 4 Children | 6 (18.2%) | 12 (40.0%) |
| 5 or more Children | 0 (0.0%) | 0 (0.0%) |
| Total | 23 (26.1%) | 76 (43.9%) |
Income Below Poverty Among Married-Couple vs Single-Parent Households in Anderson
The poverty data for Anderson shows that 53 of the married-couple family households (12.5%) and 99 of the single-parent households (37.9%) are living below the poverty level. Within the married-couple family households, those with 5 or more children have the highest poverty rate, with 14 households (100.0%) falling below the poverty line. Among the single-parent households, those with 1 or 2 children have the highest poverty rate, with 56 household (42.7%) living below poverty.
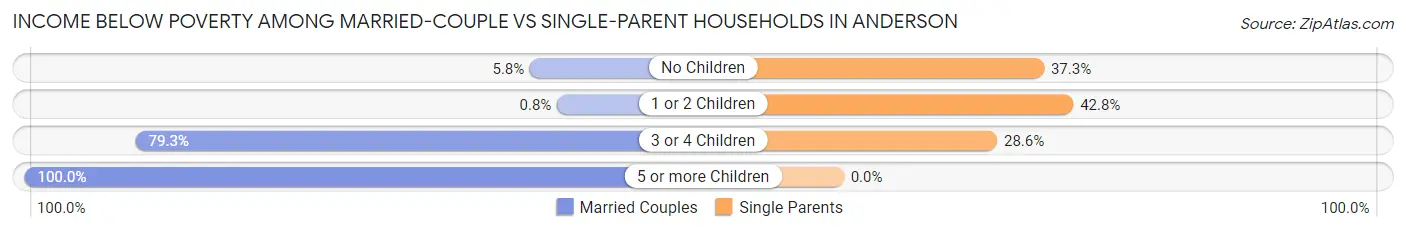
| Children | Married-Couple Families | Single-Parent Households |
| No Children | 15 (5.8%) | 25 (37.3%) |
| 1 or 2 Children | 1 (0.8%) | 56 (42.7%) |
| 3 or 4 Children | 23 (79.3%) | 18 (28.6%) |
| 5 or more Children | 14 (100.0%) | 0 (0.0%) |
| Total | 53 (12.5%) | 99 (37.9%) |
Race in Anderson
The most populous races in Anderson are White / Caucasian (1,808 | 70.6%), Hispanic or Latino (351 | 13.7%), and Two or more Races (339 | 13.2%).
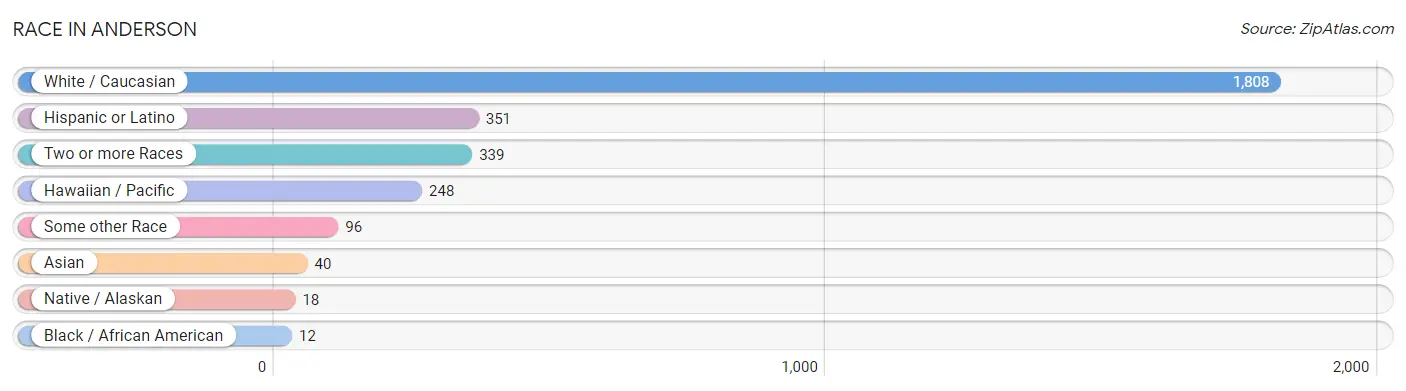
| Race | # Population | % Population |
| Asian | 40 | 1.6% |
| Black / African American | 12 | 0.5% |
| Hawaiian / Pacific | 248 | 9.7% |
| Hispanic or Latino | 351 | 13.7% |
| Native / Alaskan | 18 | 0.7% |
| White / Caucasian | 1,808 | 70.6% |
| Two or more Races | 339 | 13.2% |
| Some other Race | 96 | 3.7% |
| Total | 2,561 | 100.0% |
Ancestry in Anderson
The most populous ancestries reported in Anderson are Irish (214 | 8.4%), German (197 | 7.7%), Mexican (192 | 7.5%), English (157 | 6.1%), and Central American (81 | 3.2%), together accounting for 32.8% of all Anderson residents.
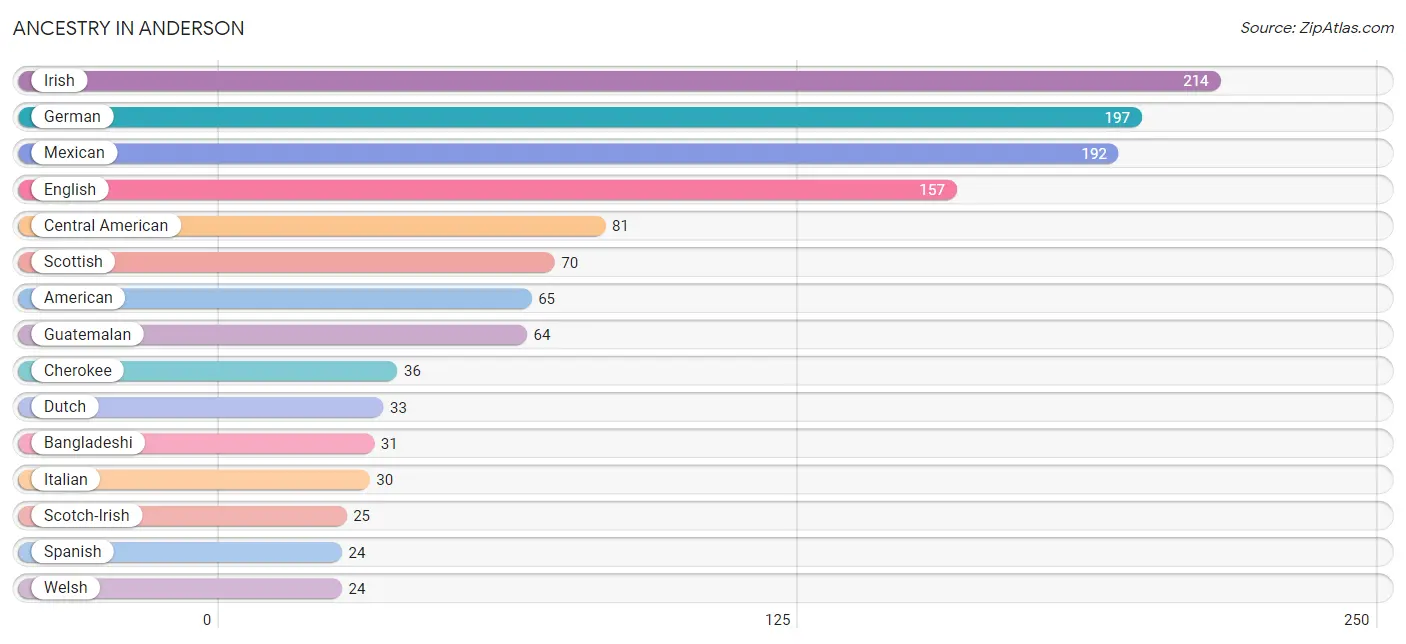
| Ancestry | # Population | % Population |
| American | 65 | 2.5% |
| Arab | 4 | 0.2% |
| Bangladeshi | 31 | 1.2% |
| Bhutanese | 21 | 0.8% |
| British | 1 | 0.0% |
| Central American | 81 | 3.2% |
| Central American Indian | 3 | 0.1% |
| Cherokee | 36 | 1.4% |
| Choctaw | 6 | 0.2% |
| Cuban | 3 | 0.1% |
| Czech | 4 | 0.2% |
| Czechoslovakian | 19 | 0.7% |
| Dutch | 33 | 1.3% |
| Egyptian | 4 | 0.2% |
| English | 157 | 6.1% |
| French | 16 | 0.6% |
| French Canadian | 21 | 0.8% |
| German | 197 | 7.7% |
| Guatemalan | 64 | 2.5% |
| Honduran | 17 | 0.7% |
| Irish | 214 | 8.4% |
| Italian | 30 | 1.2% |
| Mexican | 192 | 7.5% |
| Northern European | 7 | 0.3% |
| Norwegian | 13 | 0.5% |
| Ottawa | 3 | 0.1% |
| Polish | 8 | 0.3% |
| Scotch-Irish | 25 | 1.0% |
| Scottish | 70 | 2.7% |
| Spanish | 24 | 0.9% |
| Sri Lankan | 9 | 0.4% |
| Swedish | 10 | 0.4% |
| Swiss | 4 | 0.2% |
| Welsh | 24 | 0.9% |
| West Indian | 3 | 0.1% | View All 35 Rows |
Immigrants in Anderson
The most numerous immigrant groups reported in Anderson came from Micronesia (202 | 7.9%), Oceania (202 | 7.9%), Latin America (158 | 6.2%), Central America (155 | 6.0%), and Mexico (78 | 3.0%), together accounting for 31.0% of all Anderson residents.
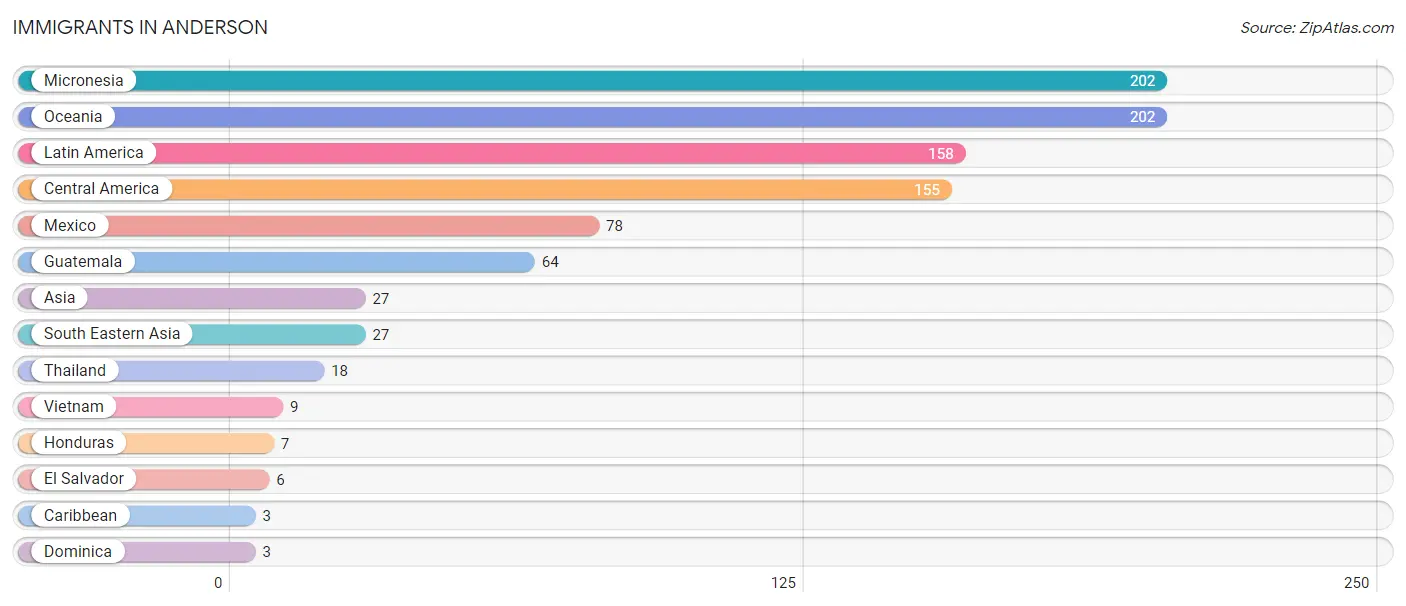
| Immigration Origin | # Population | % Population |
| Asia | 27 | 1.1% |
| Caribbean | 3 | 0.1% |
| Central America | 155 | 6.0% |
| Dominica | 3 | 0.1% |
| El Salvador | 6 | 0.2% |
| Guatemala | 64 | 2.5% |
| Honduras | 7 | 0.3% |
| Latin America | 158 | 6.2% |
| Mexico | 78 | 3.0% |
| Micronesia | 202 | 7.9% |
| Oceania | 202 | 7.9% |
| South Eastern Asia | 27 | 1.1% |
| Thailand | 18 | 0.7% |
| Vietnam | 9 | 0.4% | View All 14 Rows |
Sex and Age in Anderson
Sex and Age in Anderson
The most populous age groups in Anderson are 30 to 34 Years (181 | 14.2%) for men and 30 to 34 Years (204 | 15.8%) for women.
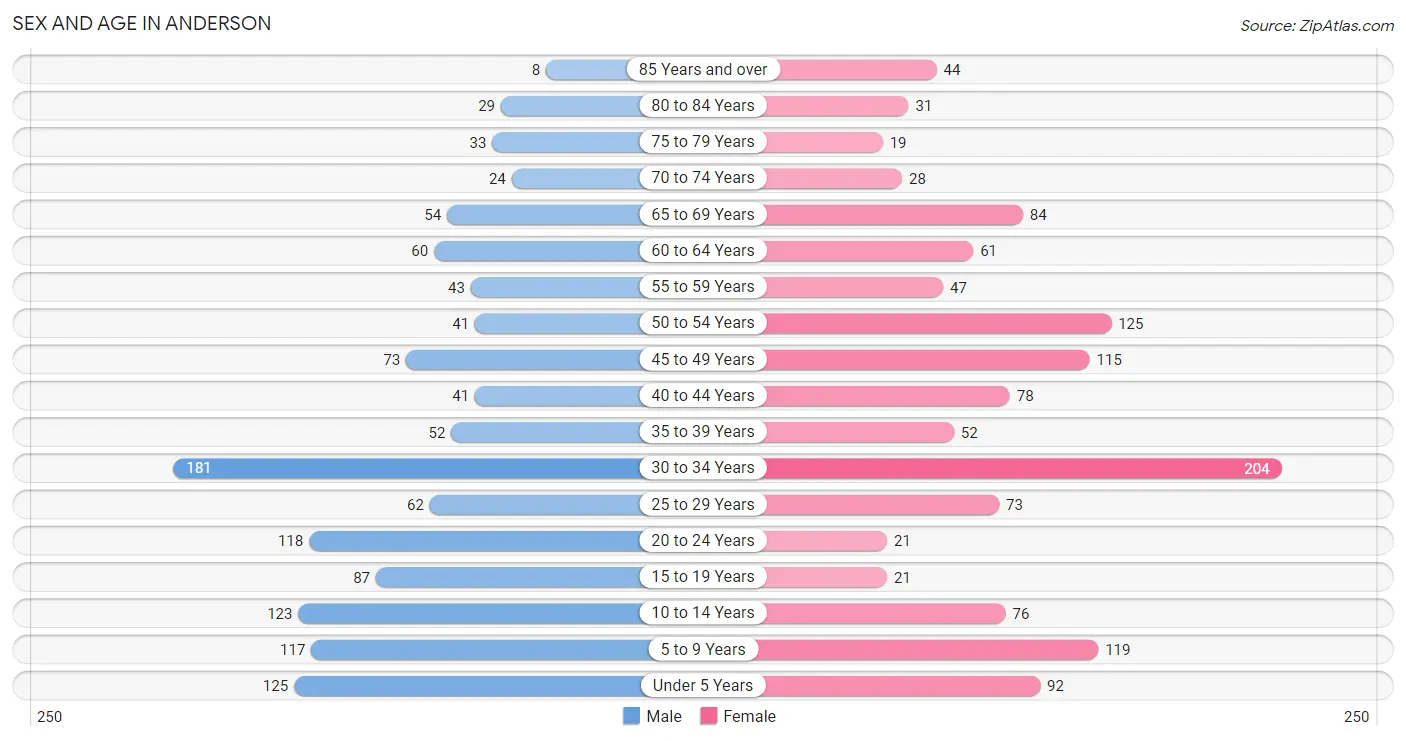
| Age Bracket | Male | Female |
| Under 5 Years | 125 (9.8%) | 92 (7.1%) |
| 5 to 9 Years | 117 (9.2%) | 119 (9.2%) |
| 10 to 14 Years | 123 (9.7%) | 76 (5.9%) |
| 15 to 19 Years | 87 (6.9%) | 21 (1.6%) |
| 20 to 24 Years | 118 (9.3%) | 21 (1.6%) |
| 25 to 29 Years | 62 (4.9%) | 73 (5.7%) |
| 30 to 34 Years | 181 (14.2%) | 204 (15.8%) |
| 35 to 39 Years | 52 (4.1%) | 52 (4.0%) |
| 40 to 44 Years | 41 (3.2%) | 78 (6.0%) |
| 45 to 49 Years | 73 (5.7%) | 115 (8.9%) |
| 50 to 54 Years | 41 (3.2%) | 125 (9.7%) |
| 55 to 59 Years | 43 (3.4%) | 47 (3.6%) |
| 60 to 64 Years | 60 (4.7%) | 61 (4.7%) |
| 65 to 69 Years | 54 (4.3%) | 84 (6.5%) |
| 70 to 74 Years | 24 (1.9%) | 28 (2.2%) |
| 75 to 79 Years | 33 (2.6%) | 19 (1.5%) |
| 80 to 84 Years | 29 (2.3%) | 31 (2.4%) |
| 85 Years and over | 8 (0.6%) | 44 (3.4%) |
| Total | 1,271 (100.0%) | 1,290 (100.0%) |
Families and Households in Anderson
Median Family Size in Anderson
The median family size in Anderson is 3.14 persons per family, with married-couple families (425 | 62.0%) accounting for the largest median family size of 3.37 persons per family. On the other hand, single female/mother families (173 | 25.2%) represent the smallest median family size with 2.53 persons per family.
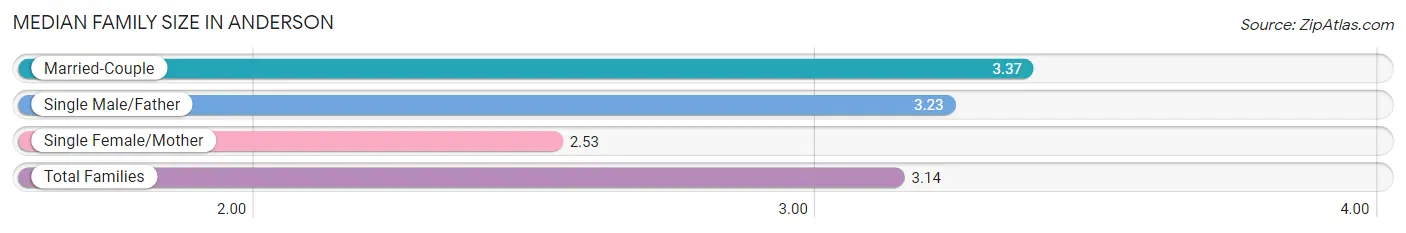
| Family Type | # Families | Family Size |
| Married-Couple | 425 (62.0%) | 3.37 |
| Single Male/Father | 88 (12.8%) | 3.23 |
| Single Female/Mother | 173 (25.2%) | 2.53 |
| Total Families | 686 (100.0%) | 3.14 |
Median Household Size in Anderson
The median household size in Anderson is 2.85 persons per household, with single male/father households (88 | 10.2%) accounting for the largest median household size of 3.61 persons per household. non-family households (180 | 20.8%) represent the smallest median household size with 1.41 persons per household.
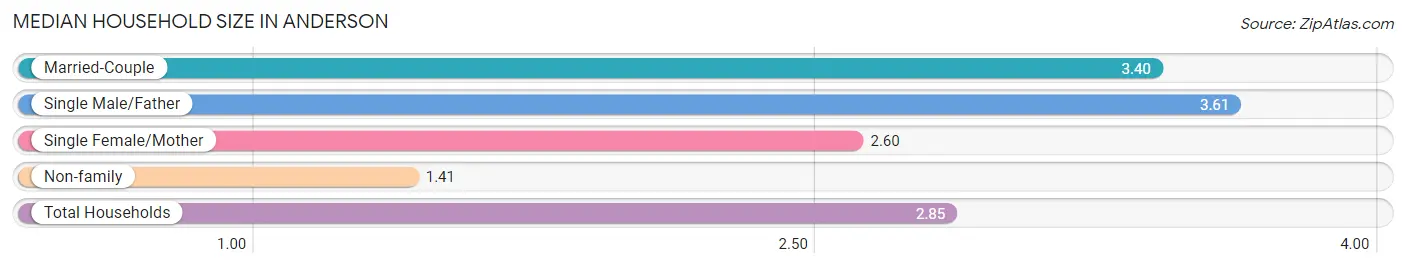
| Household Type | # Households | Household Size |
| Married-Couple | 425 (49.1%) | 3.40 |
| Single Male/Father | 88 (10.2%) | 3.61 |
| Single Female/Mother | 173 (20.0%) | 2.60 |
| Non-family | 180 (20.8%) | 1.41 |
| Total Households | 866 (100.0%) | 2.85 |
Household Size by Marriage Status in Anderson
Out of a total of 866 households in Anderson, 686 (79.2%) are family households, while 180 (20.8%) are nonfamily households. The most numerous type of family households are 2-person households, comprising 263, and the most common type of nonfamily households are 1-person households, comprising 124.
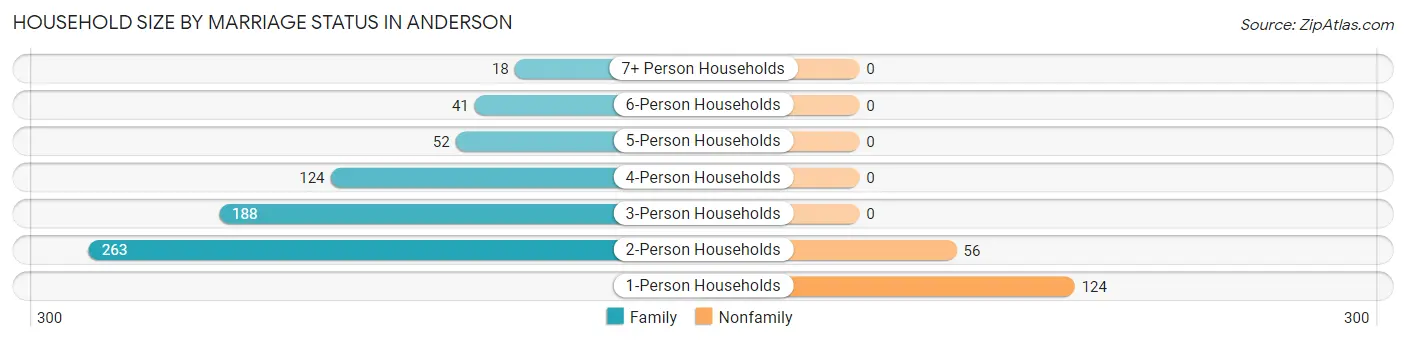
| Household Size | Family Households | Nonfamily Households |
| 1-Person Households | - | 124 (14.3%) |
| 2-Person Households | 263 (30.4%) | 56 (6.5%) |
| 3-Person Households | 188 (21.7%) | 0 (0.0%) |
| 4-Person Households | 124 (14.3%) | 0 (0.0%) |
| 5-Person Households | 52 (6.0%) | 0 (0.0%) |
| 6-Person Households | 41 (4.7%) | 0 (0.0%) |
| 7+ Person Households | 18 (2.1%) | 0 (0.0%) |
| Total | 686 (79.2%) | 180 (20.8%) |
Female Fertility in Anderson
Fertility by Age in Anderson
Average fertility rate in Anderson is 20.0 births per 1,000 women. Women in the age bracket of 20 to 34 years have the highest fertility rate with 40.0 births per 1,000 women. Women in the age bracket of 20 to 34 years acount for 100.0% of all women with births.
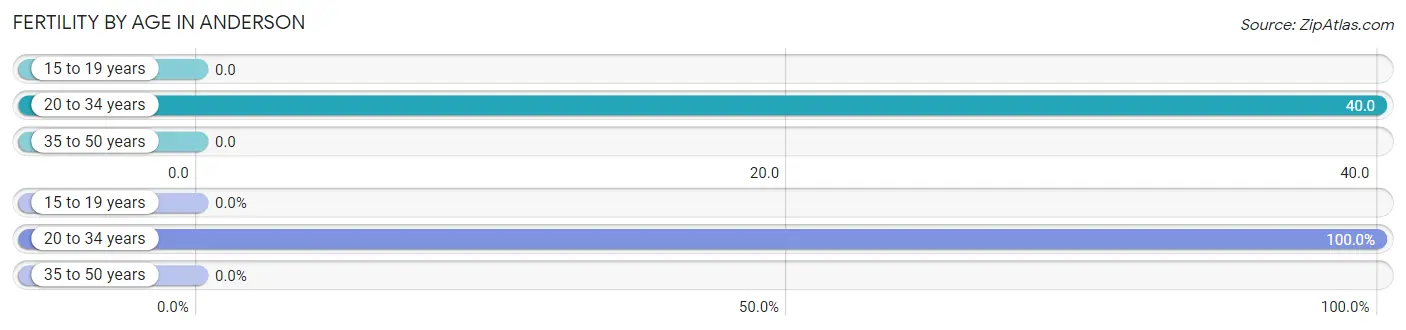
| Age Bracket | Women with Births | Births / 1,000 Women |
| 15 to 19 years | 0 (0.0%) | 0.0 |
| 20 to 34 years | 12 (100.0%) | 40.0 |
| 35 to 50 years | 0 (0.0%) | 0.0 |
| Total | 12 (100.0%) | 20.0 |
Fertility by Age by Marriage Status in Anderson
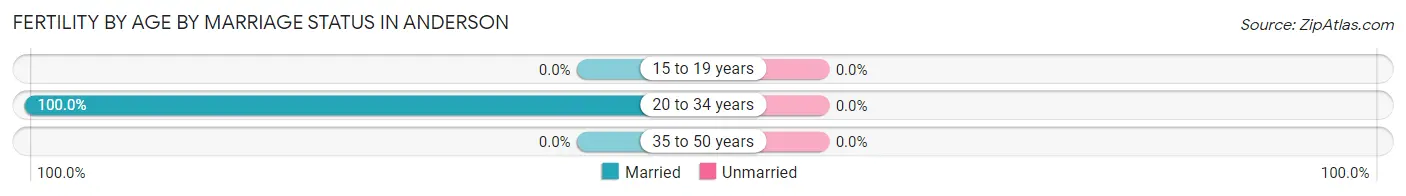
| Age Bracket | Married | Unmarried |
| 15 to 19 years | 0 (0.0%) | 0 (0.0%) |
| 20 to 34 years | 12 (100.0%) | 0 (0.0%) |
| 35 to 50 years | 0 (0.0%) | 0 (0.0%) |
| Total | 12 (100.0%) | 0 (0.0%) |
Fertility by Education in Anderson
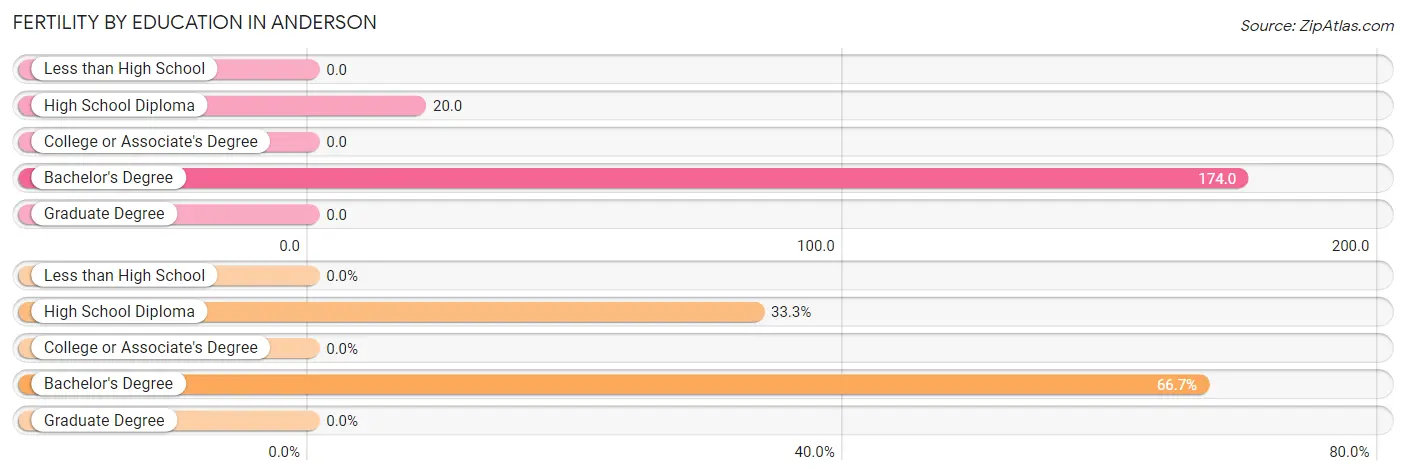
| Educational Attainment | Women with Births | Births / 1,000 Women |
| Less than High School | 0 (0.0%) | 0.0 |
| High School Diploma | 4 (33.3%) | 20.0 |
| College or Associate's Degree | 0 (0.0%) | 0.0 |
| Bachelor's Degree | 8 (66.7%) | 174.0 |
| Graduate Degree | 0 (0.0%) | 0.0 |
| Total | 12 (100.0%) | 20.0 |
Fertility by Education by Marriage Status in Anderson
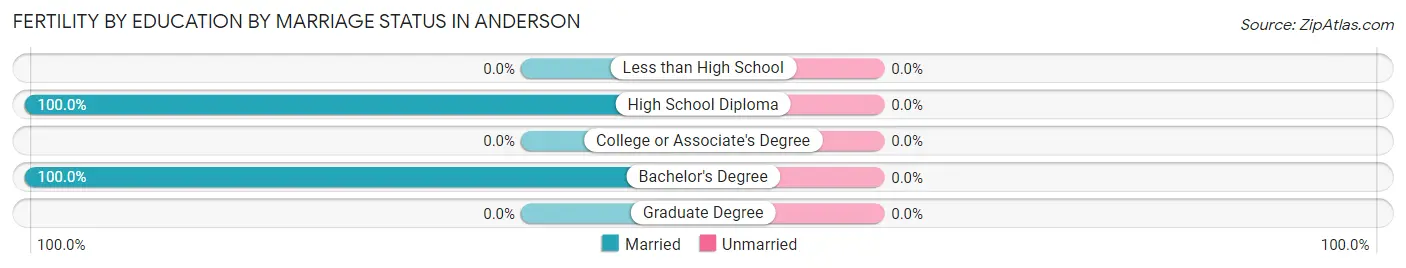
| Educational Attainment | Married | Unmarried |
| Less than High School | 0 (0.0%) | 0 (0.0%) |
| High School Diploma | 4 (100.0%) | 0 (0.0%) |
| College or Associate's Degree | 0 (0.0%) | 0 (0.0%) |
| Bachelor's Degree | 8 (100.0%) | 0 (0.0%) |
| Graduate Degree | 0 (0.0%) | 0 (0.0%) |
| Total | 12 (100.0%) | 0 (0.0%) |
Employment Characteristics in Anderson
Employment by Class of Employer in Anderson
Among the 1,003 employed individuals in Anderson, private company employees (780 | 77.8%), not-for-profit organizations (102 | 10.2%), and self-employed (not incorporated) (47 | 4.7%) make up the most common classes of employment.
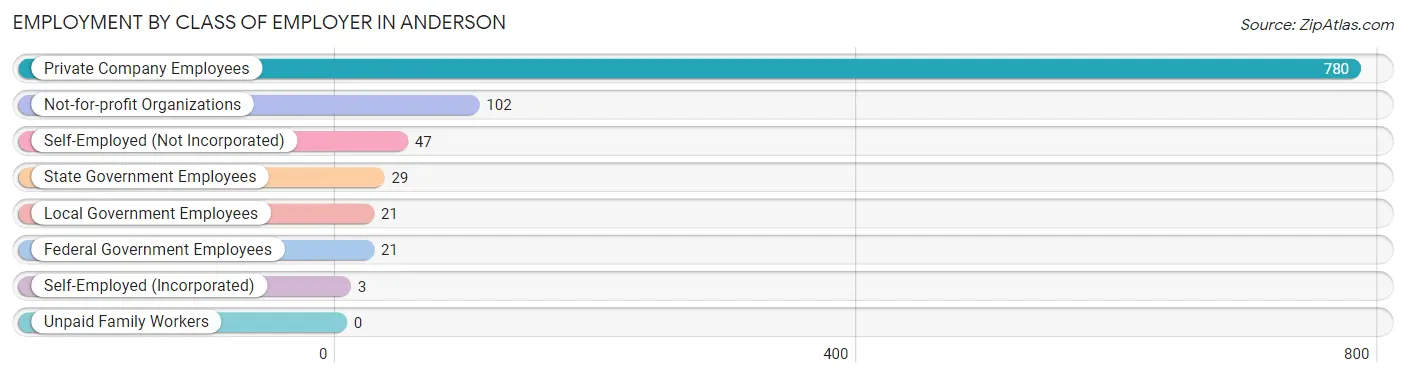
| Employer Class | # Employees | % Employees |
| Private Company Employees | 780 | 77.8% |
| Self-Employed (Incorporated) | 3 | 0.3% |
| Self-Employed (Not Incorporated) | 47 | 4.7% |
| Not-for-profit Organizations | 102 | 10.2% |
| Local Government Employees | 21 | 2.1% |
| State Government Employees | 29 | 2.9% |
| Federal Government Employees | 21 | 2.1% |
| Unpaid Family Workers | 0 | 0.0% |
| Total | 1,003 | 100.0% |
Employment Status by Age in Anderson
According to the labor force statistics for Anderson, out of the total population over 16 years of age (1,887), 55.3% or 1,044 individuals are in the labor force, with 2.6% or 27 of them unemployed. The age group with the highest labor force participation rate is 55 to 59 years, with 80.0% or 72 individuals in the labor force. Within the labor force, the 16 to 19 years age range has the highest percentage of unemployed individuals, with 26.3% or 10 of them being unemployed.
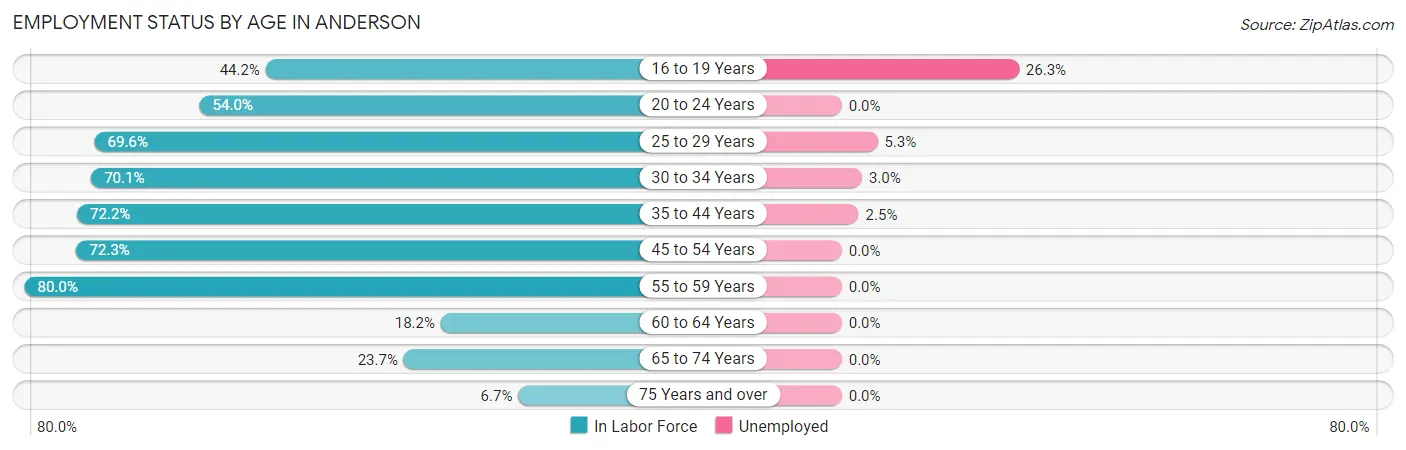
| Age Bracket | In Labor Force | Unemployed |
| 16 to 19 Years | 38 (44.2%) | 10 (26.3%) |
| 20 to 24 Years | 75 (54.0%) | 0 (0.0%) |
| 25 to 29 Years | 94 (69.6%) | 5 (5.3%) |
| 30 to 34 Years | 270 (70.1%) | 8 (3.0%) |
| 35 to 44 Years | 161 (72.2%) | 4 (2.5%) |
| 45 to 54 Years | 256 (72.3%) | 0 (0.0%) |
| 55 to 59 Years | 72 (80.0%) | 0 (0.0%) |
| 60 to 64 Years | 22 (18.2%) | 0 (0.0%) |
| 65 to 74 Years | 45 (23.7%) | 0 (0.0%) |
| 75 Years and over | 11 (6.7%) | 0 (0.0%) |
| Total | 1,044 (55.3%) | 27 (2.6%) |
Employment Status by Educational Attainment in Anderson
According to labor force statistics for Anderson, 66.9% of individuals (875) out of the total population between 25 and 64 years of age (1,308) are in the labor force, with 2.0% or 18 of them being unemployed. The group with the highest labor force participation rate are those with the educational attainment of bachelor's degree or higher, with 84.4% or 103 individuals in the labor force. Within the labor force, individuals with high school diploma education have the highest percentage of unemployment, with 4.4% or 17 of them being unemployed.
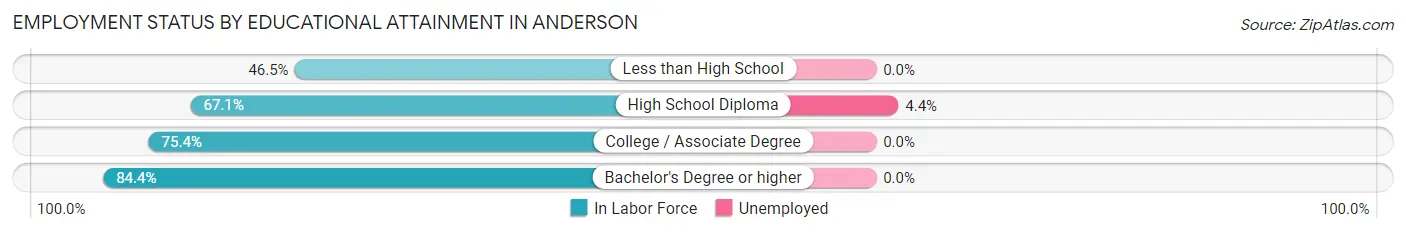
| Educational Attainment | In Labor Force | Unemployed |
| Less than High School | 121 (46.5%) | 0 (0.0%) |
| High School Diploma | 384 (67.1%) | 25 (4.4%) |
| College / Associate Degree | 267 (75.4%) | 0 (0.0%) |
| Bachelor's Degree or higher | 103 (84.4%) | 0 (0.0%) |
| Total | 875 (66.9%) | 26 (2.0%) |
Employment Occupations by Sex in Anderson
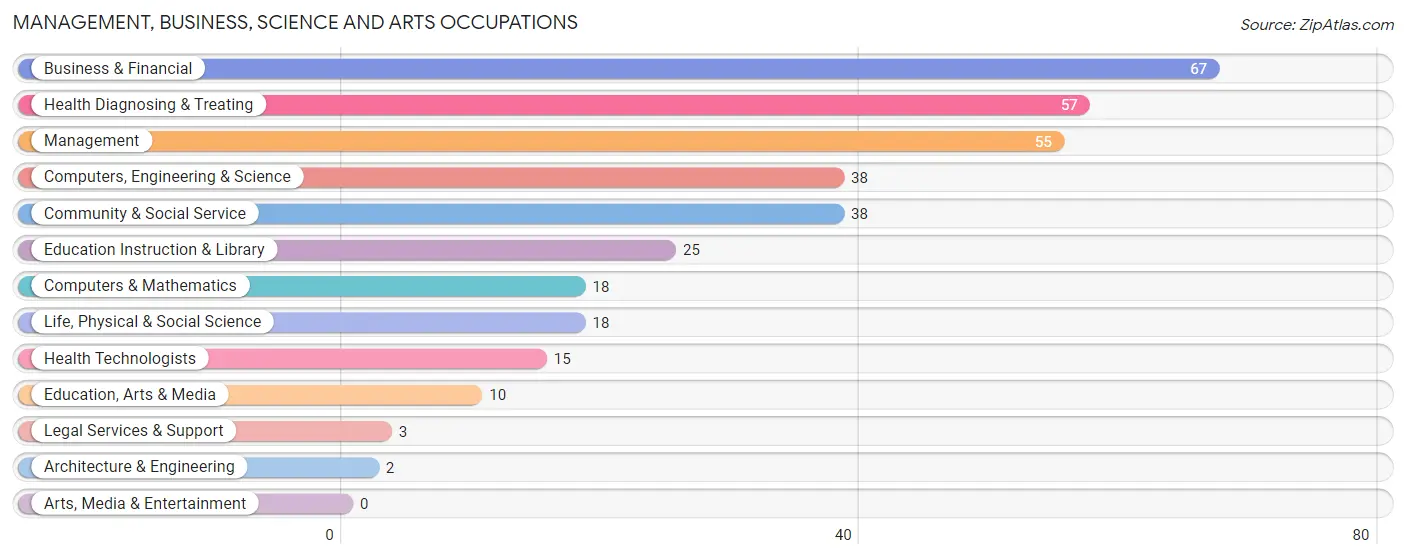
Management, Business, Science and Arts Occupations
The most common Management, Business, Science and Arts occupations in Anderson are Business & Financial (67 | 6.7%), Health Diagnosing & Treating (57 | 5.7%), Management (55 | 5.5%), Computers, Engineering & Science (38 | 3.8%), and Community & Social Service (38 | 3.8%).
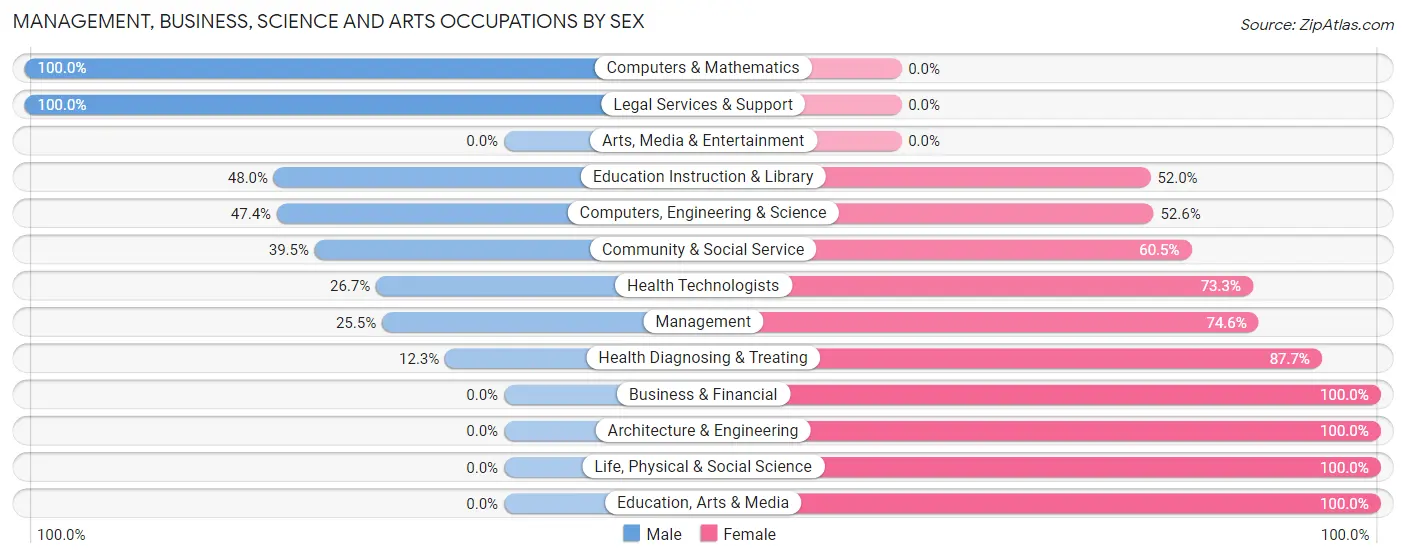
Management, Business, Science and Arts Occupations by Sex
Within the Management, Business, Science and Arts occupations in Anderson, the most male-oriented occupations are Computers & Mathematics (100.0%), Legal Services & Support (100.0%), and Education Instruction & Library (48.0%), while the most female-oriented occupations are Business & Financial (100.0%), Architecture & Engineering (100.0%), and Life, Physical & Social Science (100.0%).
| Occupation | Male | Female |
| Management | 14 (25.5%) | 41 (74.6%) |
| Business & Financial | 0 (0.0%) | 67 (100.0%) |
| Computers, Engineering & Science | 18 (47.4%) | 20 (52.6%) |
| Computers & Mathematics | 18 (100.0%) | 0 (0.0%) |
| Architecture & Engineering | 0 (0.0%) | 2 (100.0%) |
| Life, Physical & Social Science | 0 (0.0%) | 18 (100.0%) |
| Community & Social Service | 15 (39.5%) | 23 (60.5%) |
| Education, Arts & Media | 0 (0.0%) | 10 (100.0%) |
| Legal Services & Support | 3 (100.0%) | 0 (0.0%) |
| Education Instruction & Library | 12 (48.0%) | 13 (52.0%) |
| Arts, Media & Entertainment | 0 (0.0%) | 0 (0.0%) |
| Health Diagnosing & Treating | 7 (12.3%) | 50 (87.7%) |
| Health Technologists | 4 (26.7%) | 11 (73.3%) |
| Total (Category) | 54 (21.2%) | 201 (78.8%) |
| Total (Overall) | 475 (47.2%) | 532 (52.8%) |
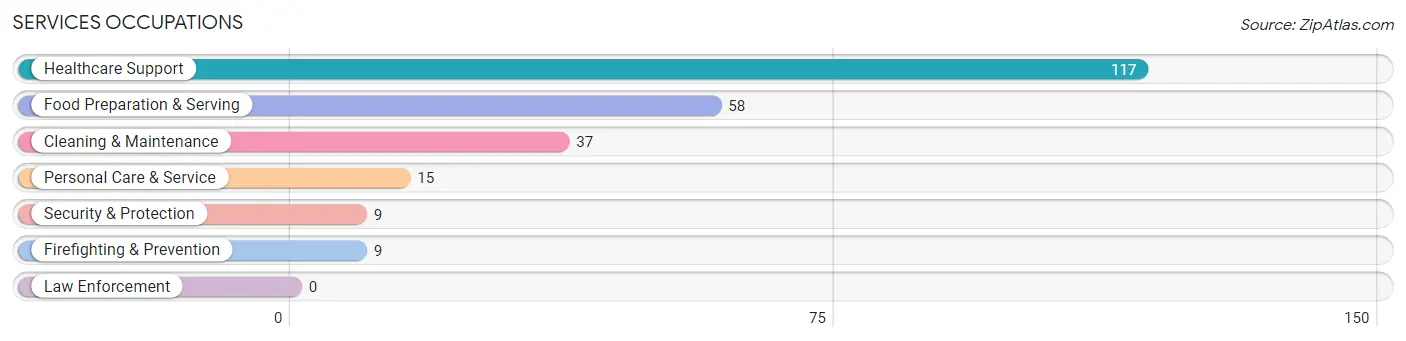
Services Occupations
The most common Services occupations in Anderson are Healthcare Support (117 | 11.6%), Food Preparation & Serving (58 | 5.8%), Cleaning & Maintenance (37 | 3.7%), Personal Care & Service (15 | 1.5%), and Security & Protection (9 | 0.9%).
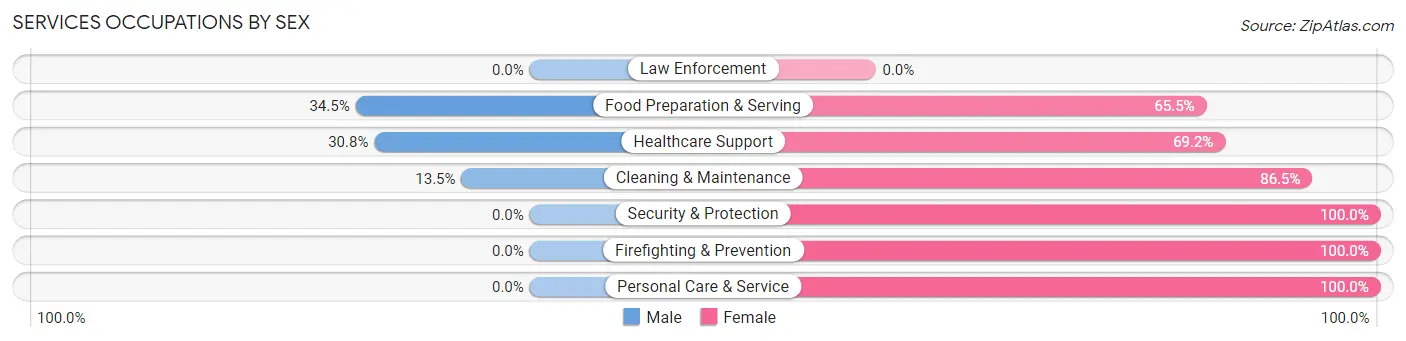
Services Occupations by Sex
Within the Services occupations in Anderson, the most male-oriented occupations are Food Preparation & Serving (34.5%), Healthcare Support (30.8%), and Cleaning & Maintenance (13.5%), while the most female-oriented occupations are Security & Protection (100.0%), Firefighting & Prevention (100.0%), and Personal Care & Service (100.0%).
| Occupation | Male | Female |
| Healthcare Support | 36 (30.8%) | 81 (69.2%) |
| Security & Protection | 0 (0.0%) | 9 (100.0%) |
| Firefighting & Prevention | 0 (0.0%) | 9 (100.0%) |
| Law Enforcement | 0 (0.0%) | 0 (0.0%) |
| Food Preparation & Serving | 20 (34.5%) | 38 (65.5%) |
| Cleaning & Maintenance | 5 (13.5%) | 32 (86.5%) |
| Personal Care & Service | 0 (0.0%) | 15 (100.0%) |
| Total (Category) | 61 (25.9%) | 175 (74.2%) |
| Total (Overall) | 475 (47.2%) | 532 (52.8%) |
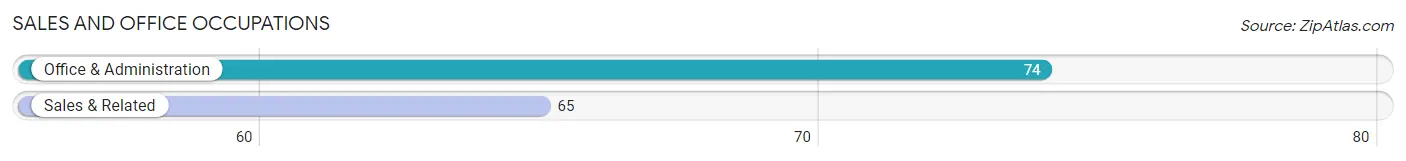
Sales and Office Occupations
The most common Sales and Office occupations in Anderson are Office & Administration (74 | 7.3%), and Sales & Related (65 | 6.5%).
Sales and Office Occupations by Sex
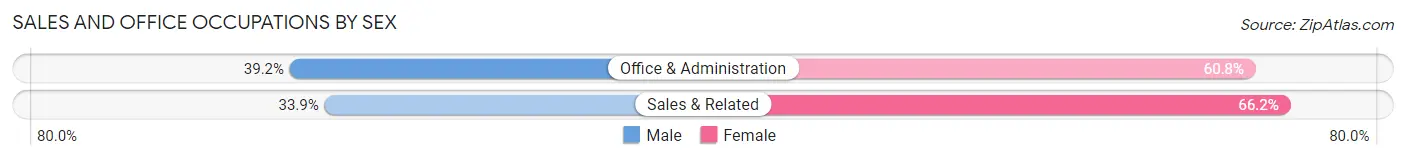
| Occupation | Male | Female |
| Sales & Related | 22 (33.9%) | 43 (66.1%) |
| Office & Administration | 29 (39.2%) | 45 (60.8%) |
| Total (Category) | 51 (36.7%) | 88 (63.3%) |
| Total (Overall) | 475 (47.2%) | 532 (52.8%) |
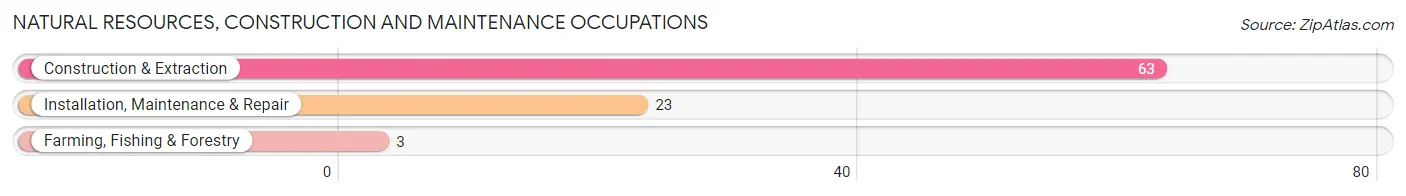
Natural Resources, Construction and Maintenance Occupations
The most common Natural Resources, Construction and Maintenance occupations in Anderson are Construction & Extraction (63 | 6.3%), Installation, Maintenance & Repair (23 | 2.3%), and Farming, Fishing & Forestry (3 | 0.3%).
Natural Resources, Construction and Maintenance Occupations by Sex
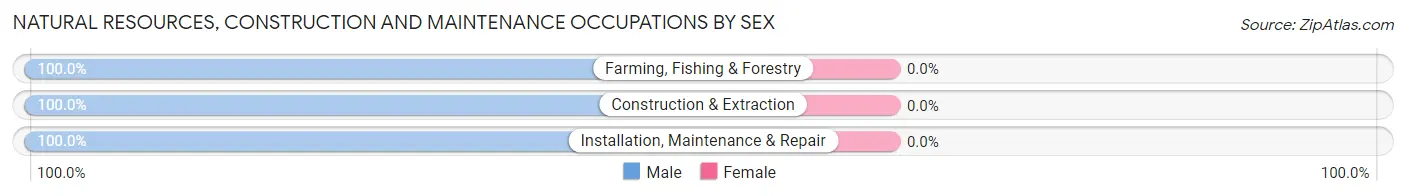
| Occupation | Male | Female |
| Farming, Fishing & Forestry | 3 (100.0%) | 0 (0.0%) |
| Construction & Extraction | 63 (100.0%) | 0 (0.0%) |
| Installation, Maintenance & Repair | 23 (100.0%) | 0 (0.0%) |
| Total (Category) | 89 (100.0%) | 0 (0.0%) |
| Total (Overall) | 475 (47.2%) | 532 (52.8%) |
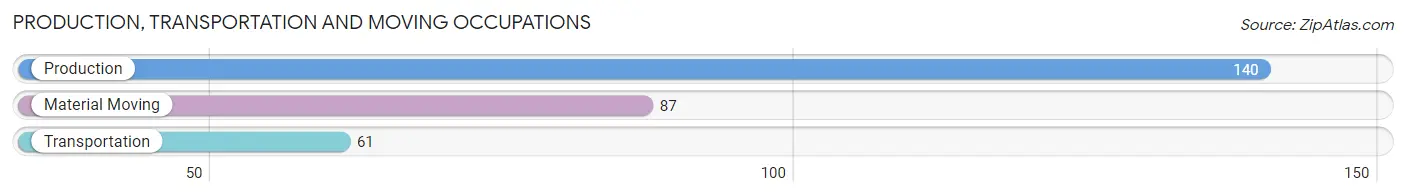
Production, Transportation and Moving Occupations
The most common Production, Transportation and Moving occupations in Anderson are Production (140 | 13.9%), Material Moving (87 | 8.6%), and Transportation (61 | 6.1%).
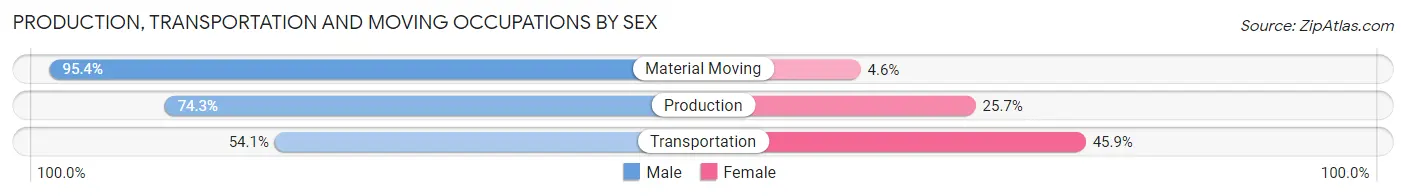
Production, Transportation and Moving Occupations by Sex
| Occupation | Male | Female |
| Production | 104 (74.3%) | 36 (25.7%) |
| Transportation | 33 (54.1%) | 28 (45.9%) |
| Material Moving | 83 (95.4%) | 4 (4.6%) |
| Total (Category) | 220 (76.4%) | 68 (23.6%) |
| Total (Overall) | 475 (47.2%) | 532 (52.8%) |
Employment Industries by Sex in Anderson
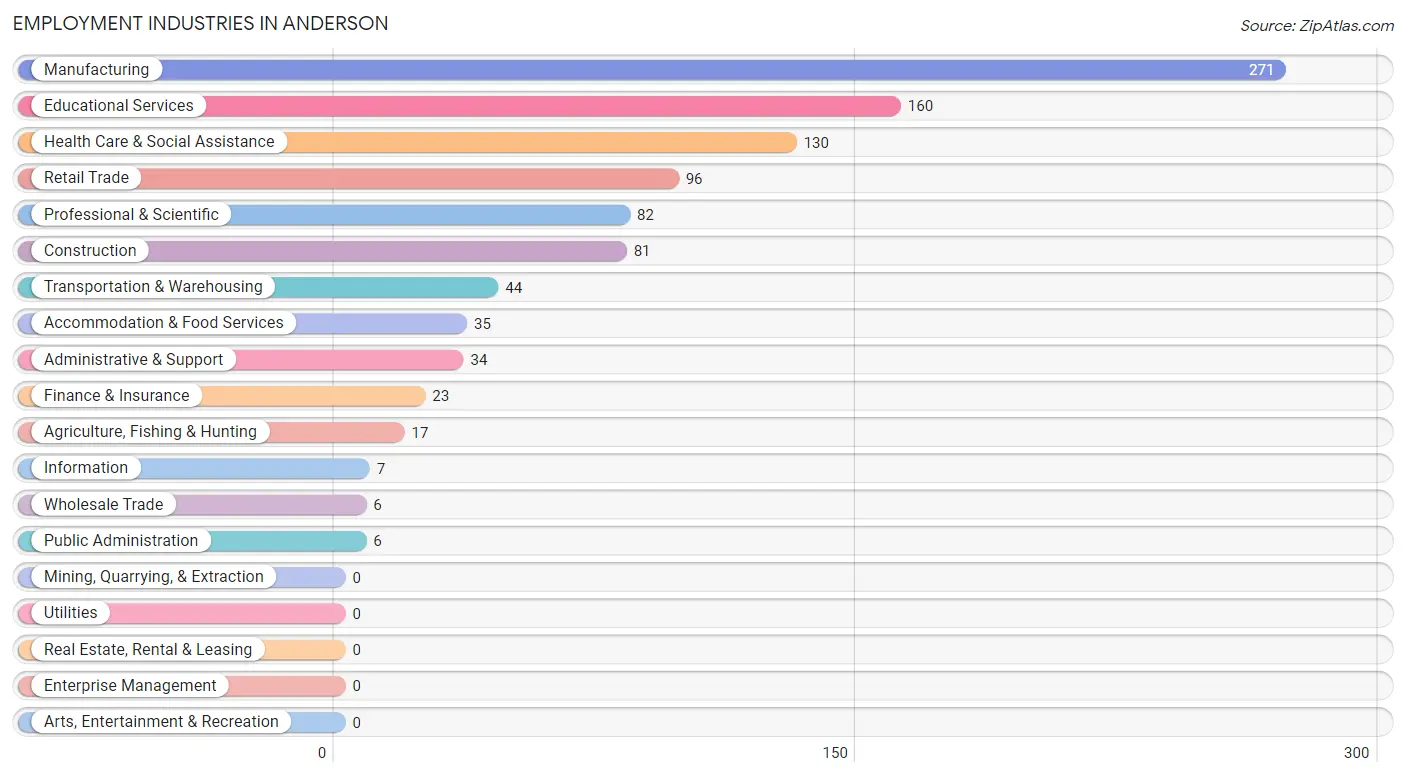
Employment Industries in Anderson
The major employment industries in Anderson include Manufacturing (271 | 26.9%), Educational Services (160 | 15.9%), Health Care & Social Assistance (130 | 12.9%), Retail Trade (96 | 9.5%), and Professional & Scientific (82 | 8.1%).
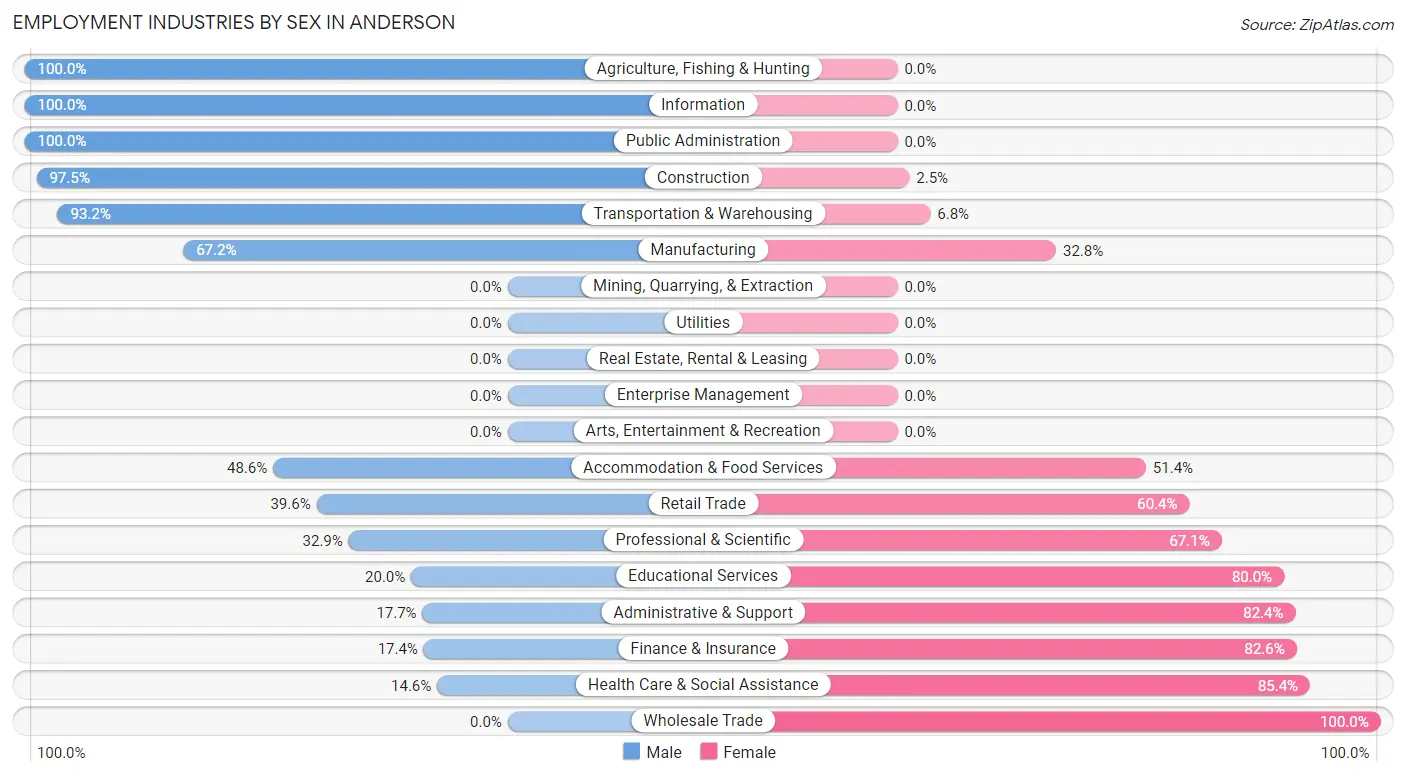
Employment Industries by Sex in Anderson
The Anderson industries that see more men than women are Agriculture, Fishing & Hunting (100.0%), Information (100.0%), and Public Administration (100.0%), whereas the industries that tend to have a higher number of women are Wholesale Trade (100.0%), Health Care & Social Assistance (85.4%), and Finance & Insurance (82.6%).
| Industry | Male | Female |
| Agriculture, Fishing & Hunting | 17 (100.0%) | 0 (0.0%) |
| Mining, Quarrying, & Extraction | 0 (0.0%) | 0 (0.0%) |
| Construction | 79 (97.5%) | 2 (2.5%) |
| Manufacturing | 182 (67.2%) | 89 (32.8%) |
| Wholesale Trade | 0 (0.0%) | 6 (100.0%) |
| Retail Trade | 38 (39.6%) | 58 (60.4%) |
| Transportation & Warehousing | 41 (93.2%) | 3 (6.8%) |
| Utilities | 0 (0.0%) | 0 (0.0%) |
| Information | 7 (100.0%) | 0 (0.0%) |
| Finance & Insurance | 4 (17.4%) | 19 (82.6%) |
| Real Estate, Rental & Leasing | 0 (0.0%) | 0 (0.0%) |
| Professional & Scientific | 27 (32.9%) | 55 (67.1%) |
| Enterprise Management | 0 (0.0%) | 0 (0.0%) |
| Administrative & Support | 6 (17.6%) | 28 (82.4%) |
| Educational Services | 32 (20.0%) | 128 (80.0%) |
| Health Care & Social Assistance | 19 (14.6%) | 111 (85.4%) |
| Arts, Entertainment & Recreation | 0 (0.0%) | 0 (0.0%) |
| Accommodation & Food Services | 17 (48.6%) | 18 (51.4%) |
| Public Administration | 6 (100.0%) | 0 (0.0%) |
| Total | 475 (47.2%) | 532 (52.8%) |
Education in Anderson
School Enrollment in Anderson
The most common levels of schooling among the 594 students in Anderson are elementary school (151 | 25.4%), middle school (131 | 22.1%), and high school (95 | 16.0%).
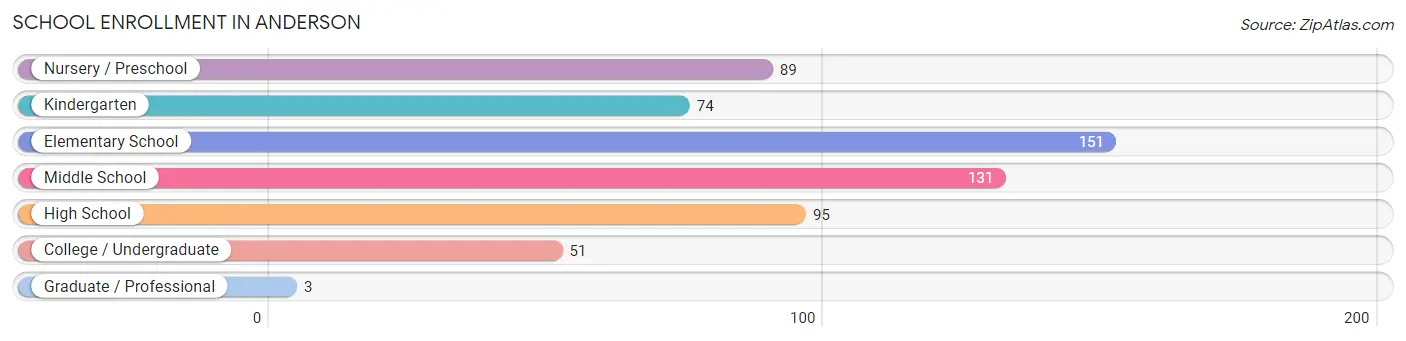
| School Level | # Students | % Students |
| Nursery / Preschool | 89 | 15.0% |
| Kindergarten | 74 | 12.5% |
| Elementary School | 151 | 25.4% |
| Middle School | 131 | 22.1% |
| High School | 95 | 16.0% |
| College / Undergraduate | 51 | 8.6% |
| Graduate / Professional | 3 | 0.5% |
| Total | 594 | 100.0% |
School Enrollment by Age by Funding Source in Anderson
Out of a total of 594 students who are enrolled in schools in Anderson, 27 (4.5%) attend a private institution, while the remaining 567 (95.5%) are enrolled in public schools. The age group of 20 to 24 year olds has the highest likelihood of being enrolled in private schools, with 11 (47.8% in the age bracket) enrolled. Conversely, the age group of 5 to 9 year old has the lowest likelihood of being enrolled in a private school, with 224 (100.0% in the age bracket) attending a public institution.
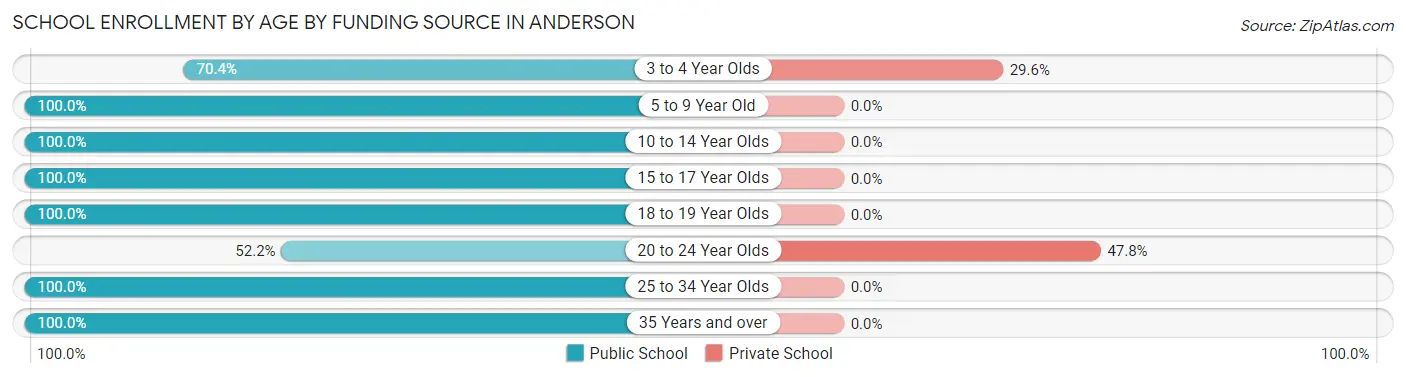
| Age Bracket | Public School | Private School |
| 3 to 4 Year Olds | 38 (70.4%) | 16 (29.6%) |
| 5 to 9 Year Old | 224 (100.0%) | 0 (0.0%) |
| 10 to 14 Year Olds | 199 (100.0%) | 0 (0.0%) |
| 15 to 17 Year Olds | 52 (100.0%) | 0 (0.0%) |
| 18 to 19 Year Olds | 16 (100.0%) | 0 (0.0%) |
| 20 to 24 Year Olds | 12 (52.2%) | 11 (47.8%) |
| 25 to 34 Year Olds | 12 (100.0%) | 0 (0.0%) |
| 35 Years and over | 14 (100.0%) | 0 (0.0%) |
| Total | 567 (95.5%) | 27 (4.5%) |
Educational Attainment by Field of Study in Anderson
Education (57 | 27.5%), bio, nature & agricultural (31 | 15.0%), business (31 | 15.0%), arts & humanities (25 | 12.1%), and science & technology (12 | 5.8%) are the most common fields of study among 207 individuals in Anderson who have obtained a bachelor's degree or higher.
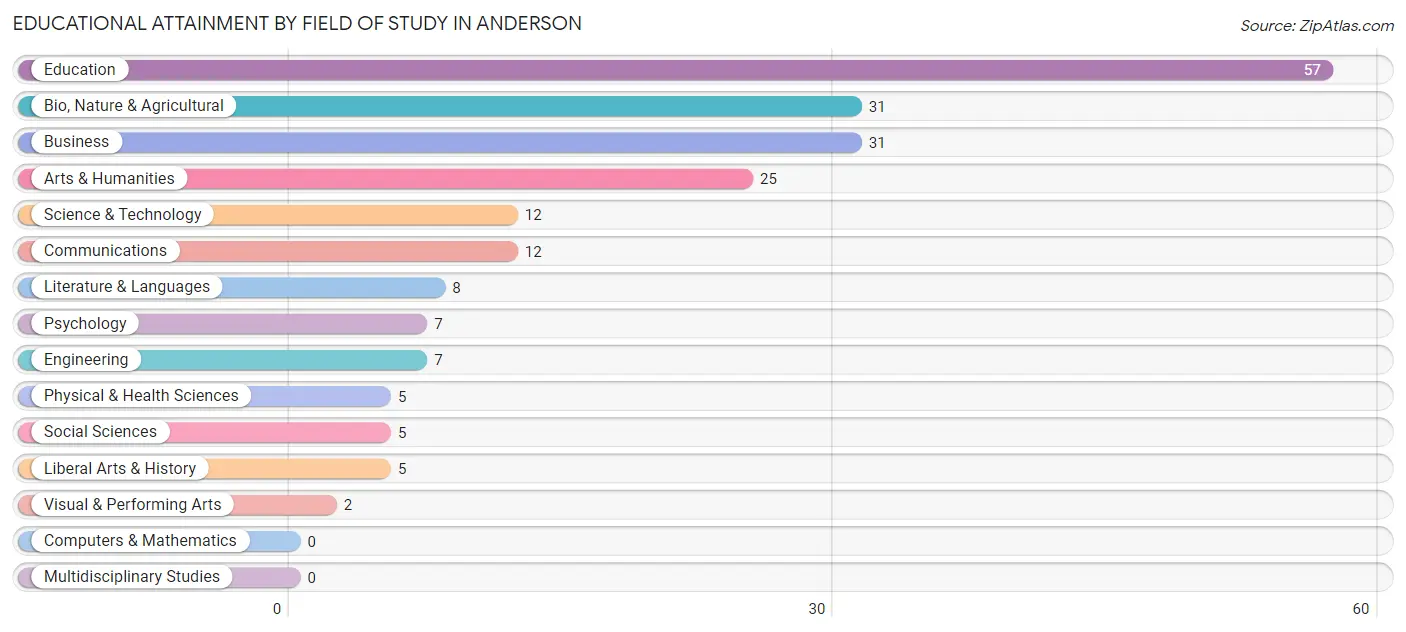
| Field of Study | # Graduates | % Graduates |
| Computers & Mathematics | 0 | 0.0% |
| Bio, Nature & Agricultural | 31 | 15.0% |
| Physical & Health Sciences | 5 | 2.4% |
| Psychology | 7 | 3.4% |
| Social Sciences | 5 | 2.4% |
| Engineering | 7 | 3.4% |
| Multidisciplinary Studies | 0 | 0.0% |
| Science & Technology | 12 | 5.8% |
| Business | 31 | 15.0% |
| Education | 57 | 27.5% |
| Literature & Languages | 8 | 3.9% |
| Liberal Arts & History | 5 | 2.4% |
| Visual & Performing Arts | 2 | 1.0% |
| Communications | 12 | 5.8% |
| Arts & Humanities | 25 | 12.1% |
| Total | 207 | 100.0% |
Transportation & Commute in Anderson
Vehicle Availability by Sex in Anderson
The most prevalent vehicle ownership categories in Anderson are males with 2 vehicles (211, accounting for 43.5%) and females with 2 vehicles (161, making up 40.7%).
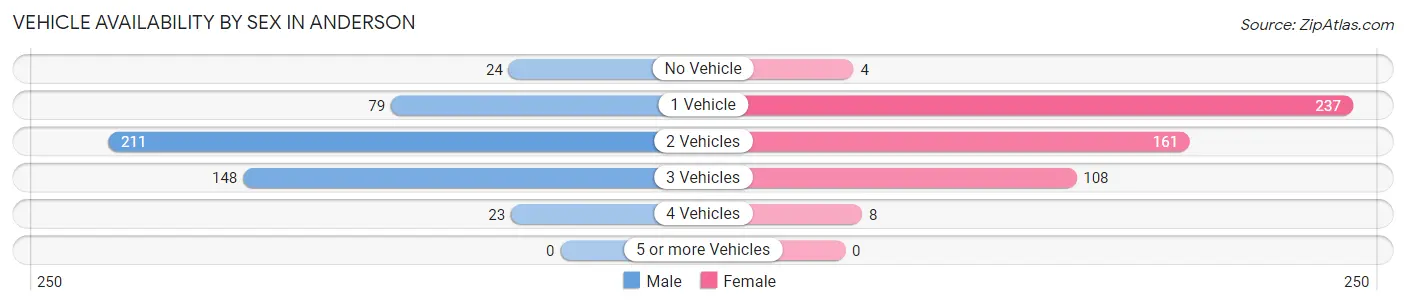
| Vehicles Available | Male | Female |
| No Vehicle | 24 (5.0%) | 4 (0.8%) |
| 1 Vehicle | 79 (16.3%) | 237 (45.8%) |
| 2 Vehicles | 211 (43.5%) | 161 (31.1%) |
| 3 Vehicles | 148 (30.5%) | 108 (20.8%) |
| 4 Vehicles | 23 (4.7%) | 8 (1.5%) |
| 5 or more Vehicles | 0 (0.0%) | 0 (0.0%) |
| Total | 485 (100.0%) | 518 (100.0%) |
Commute Time in Anderson
The most frequently occuring commute durations in Anderson are 5 to 9 minutes (182 commuters, 19.1%), 30 to 34 minutes (166 commuters, 17.4%), and 25 to 29 minutes (115 commuters, 12.1%).
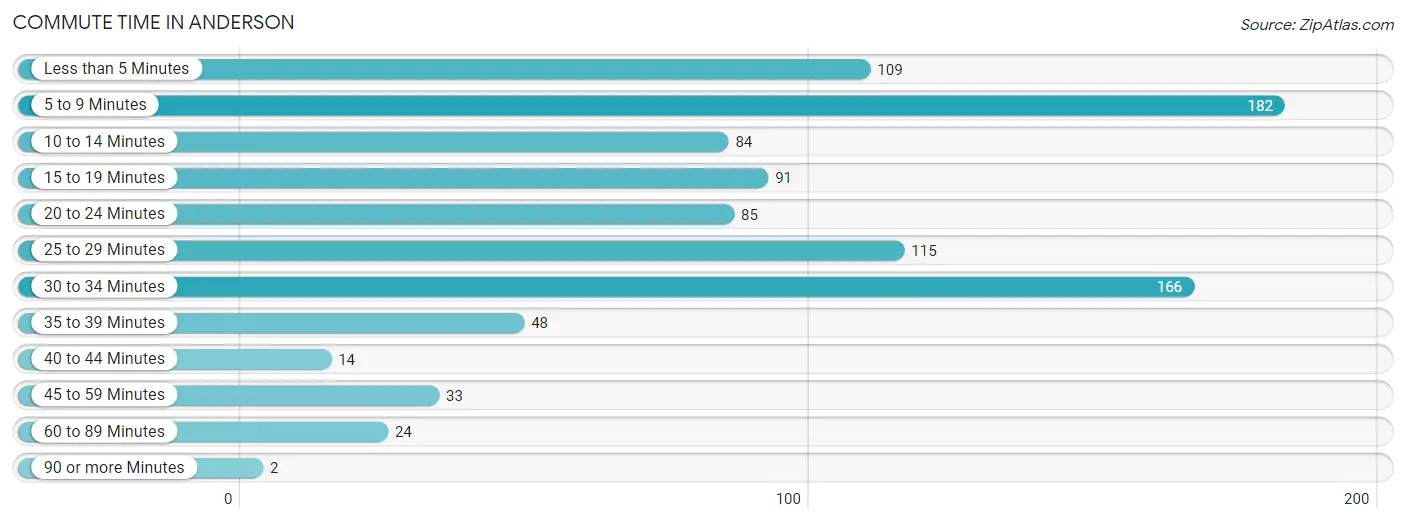
| Commute Time | # Commuters | % Commuters |
| Less than 5 Minutes | 109 | 11.4% |
| 5 to 9 Minutes | 182 | 19.1% |
| 10 to 14 Minutes | 84 | 8.8% |
| 15 to 19 Minutes | 91 | 9.6% |
| 20 to 24 Minutes | 85 | 8.9% |
| 25 to 29 Minutes | 115 | 12.1% |
| 30 to 34 Minutes | 166 | 17.4% |
| 35 to 39 Minutes | 48 | 5.0% |
| 40 to 44 Minutes | 14 | 1.5% |
| 45 to 59 Minutes | 33 | 3.5% |
| 60 to 89 Minutes | 24 | 2.5% |
| 90 or more Minutes | 2 | 0.2% |
Commute Time by Sex in Anderson
The most common commute times in Anderson are 10 to 14 minutes (70 commuters, 15.2%) for males and 30 to 34 minutes (119 commuters, 24.2%) for females.
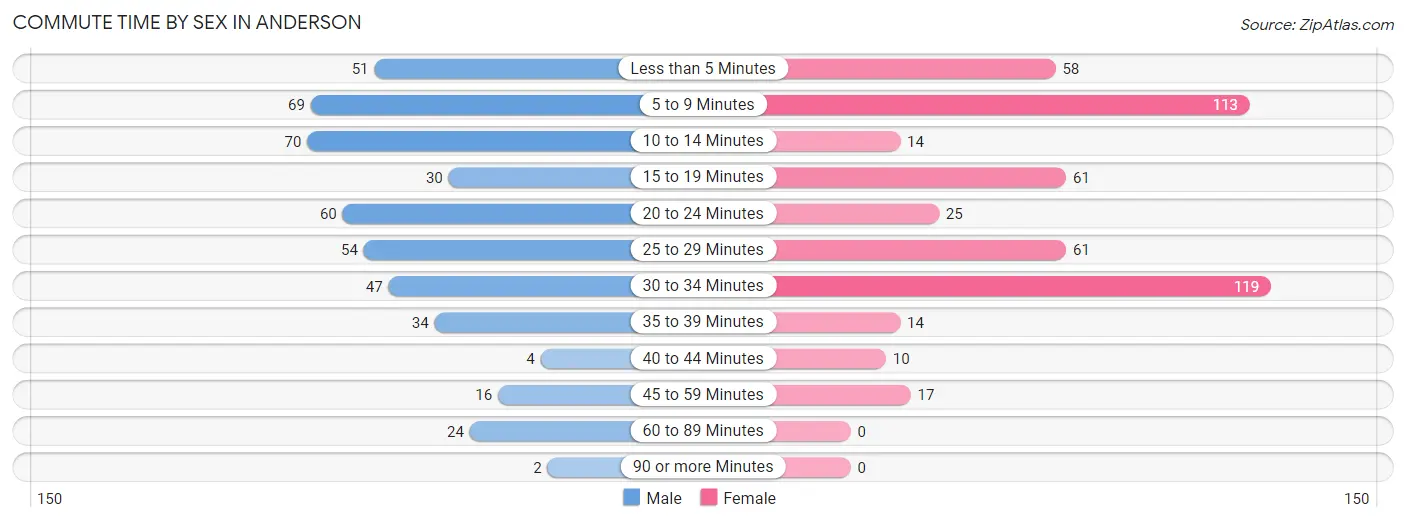
| Commute Time | Male | Female |
| Less than 5 Minutes | 51 (11.1%) | 58 (11.8%) |
| 5 to 9 Minutes | 69 (15.0%) | 113 (23.0%) |
| 10 to 14 Minutes | 70 (15.2%) | 14 (2.9%) |
| 15 to 19 Minutes | 30 (6.5%) | 61 (12.4%) |
| 20 to 24 Minutes | 60 (13.0%) | 25 (5.1%) |
| 25 to 29 Minutes | 54 (11.7%) | 61 (12.4%) |
| 30 to 34 Minutes | 47 (10.2%) | 119 (24.2%) |
| 35 to 39 Minutes | 34 (7.4%) | 14 (2.9%) |
| 40 to 44 Minutes | 4 (0.9%) | 10 (2.0%) |
| 45 to 59 Minutes | 16 (3.5%) | 17 (3.5%) |
| 60 to 89 Minutes | 24 (5.2%) | 0 (0.0%) |
| 90 or more Minutes | 2 (0.4%) | 0 (0.0%) |
Time of Departure to Work by Sex in Anderson
The most frequent times of departure to work in Anderson are 6:00 AM to 6:29 AM (85, 18.4%) for males and 6:00 AM to 6:29 AM (87, 17.7%) for females.
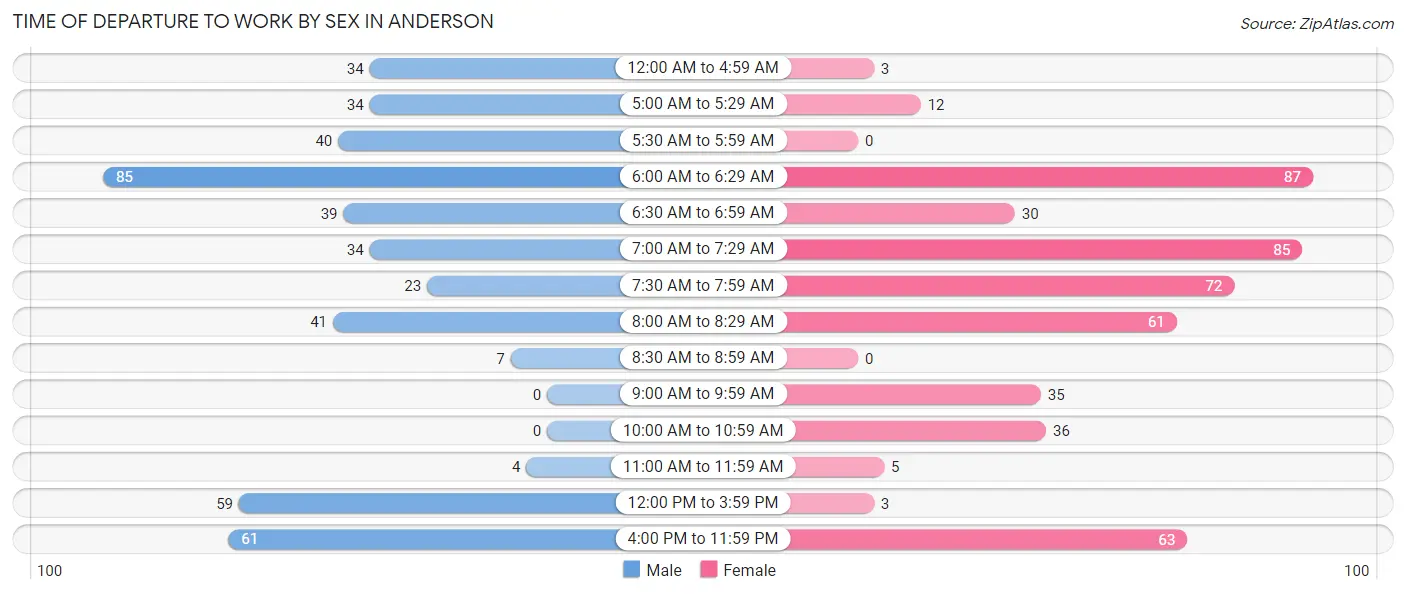
| Time of Departure | Male | Female |
| 12:00 AM to 4:59 AM | 34 (7.4%) | 3 (0.6%) |
| 5:00 AM to 5:29 AM | 34 (7.4%) | 12 (2.4%) |
| 5:30 AM to 5:59 AM | 40 (8.7%) | 0 (0.0%) |
| 6:00 AM to 6:29 AM | 85 (18.4%) | 87 (17.7%) |
| 6:30 AM to 6:59 AM | 39 (8.5%) | 30 (6.1%) |
| 7:00 AM to 7:29 AM | 34 (7.4%) | 85 (17.3%) |
| 7:30 AM to 7:59 AM | 23 (5.0%) | 72 (14.6%) |
| 8:00 AM to 8:29 AM | 41 (8.9%) | 61 (12.4%) |
| 8:30 AM to 8:59 AM | 7 (1.5%) | 0 (0.0%) |
| 9:00 AM to 9:59 AM | 0 (0.0%) | 35 (7.1%) |
| 10:00 AM to 10:59 AM | 0 (0.0%) | 36 (7.3%) |
| 11:00 AM to 11:59 AM | 4 (0.9%) | 5 (1.0%) |
| 12:00 PM to 3:59 PM | 59 (12.8%) | 3 (0.6%) |
| 4:00 PM to 11:59 PM | 61 (13.2%) | 63 (12.8%) |
| Total | 461 (100.0%) | 492 (100.0%) |
Housing Occupancy in Anderson
Occupancy by Ownership in Anderson
Of the total 866 dwellings in Anderson, owner-occupied units account for 402 (46.4%), while renter-occupied units make up 464 (53.6%).
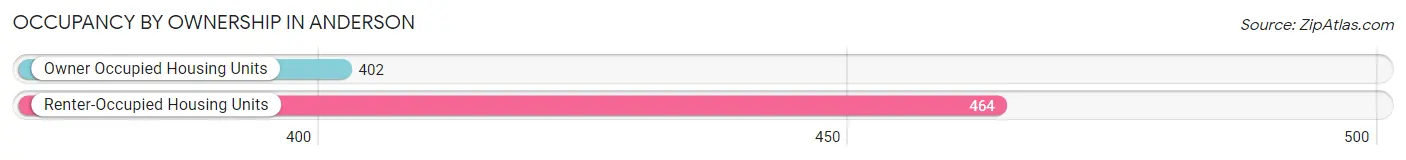
| Occupancy | # Housing Units | % Housing Units |
| Owner Occupied Housing Units | 402 | 46.4% |
| Renter-Occupied Housing Units | 464 | 53.6% |
| Total Occupied Housing Units | 866 | 100.0% |
Occupancy by Household Size in Anderson
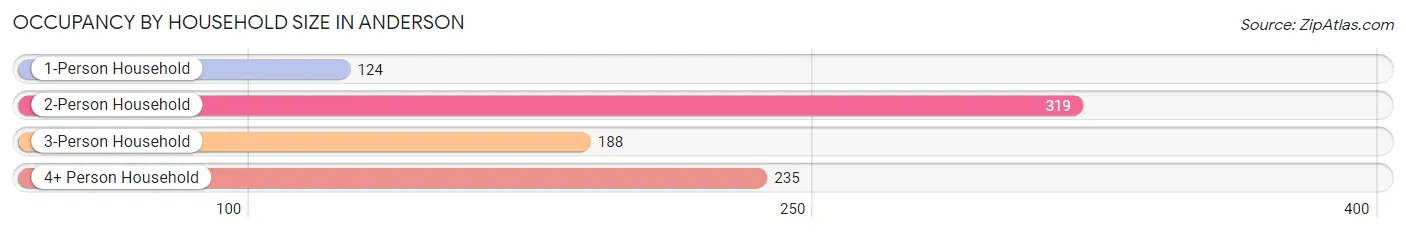
| Household Size | # Housing Units | % Housing Units |
| 1-Person Household | 124 | 14.3% |
| 2-Person Household | 319 | 36.8% |
| 3-Person Household | 188 | 21.7% |
| 4+ Person Household | 235 | 27.1% |
| Total Housing Units | 866 | 100.0% |
Occupancy by Ownership by Household Size in Anderson
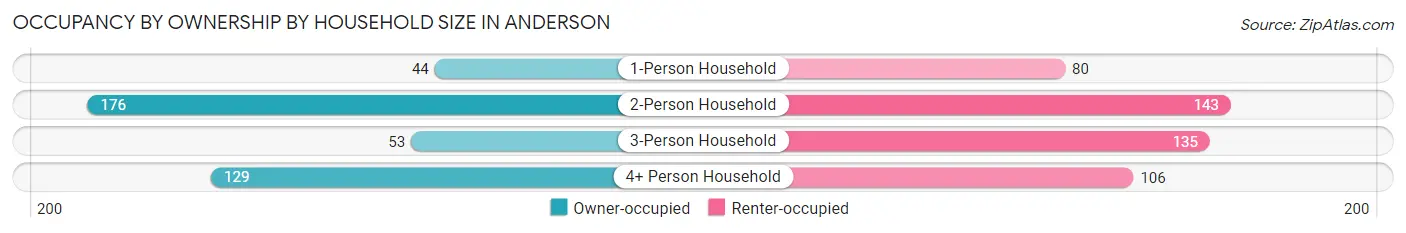
| Household Size | Owner-occupied | Renter-occupied |
| 1-Person Household | 44 (35.5%) | 80 (64.5%) |
| 2-Person Household | 176 (55.2%) | 143 (44.8%) |
| 3-Person Household | 53 (28.2%) | 135 (71.8%) |
| 4+ Person Household | 129 (54.9%) | 106 (45.1%) |
| Total Housing Units | 402 (46.4%) | 464 (53.6%) |
Occupancy by Educational Attainment in Anderson
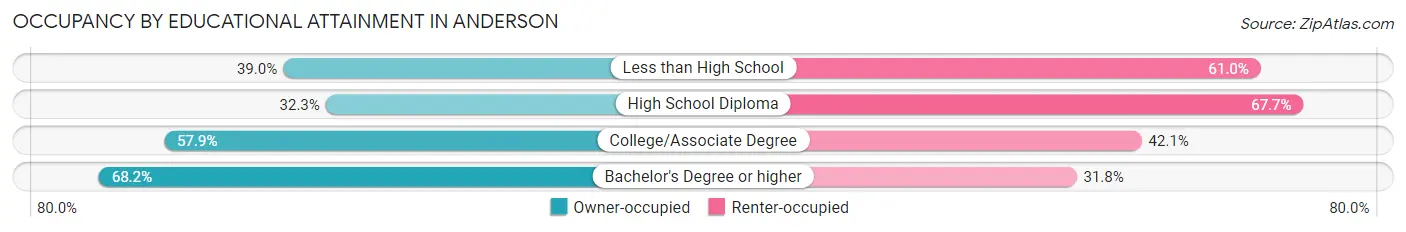
| Household Size | Owner-occupied | Renter-occupied |
| Less than High School | 64 (39.0%) | 100 (61.0%) |
| High School Diploma | 100 (32.3%) | 210 (67.7%) |
| College/Associate Degree | 165 (57.9%) | 120 (42.1%) |
| Bachelor's Degree or higher | 73 (68.2%) | 34 (31.8%) |
Occupancy by Age of Householder in Anderson
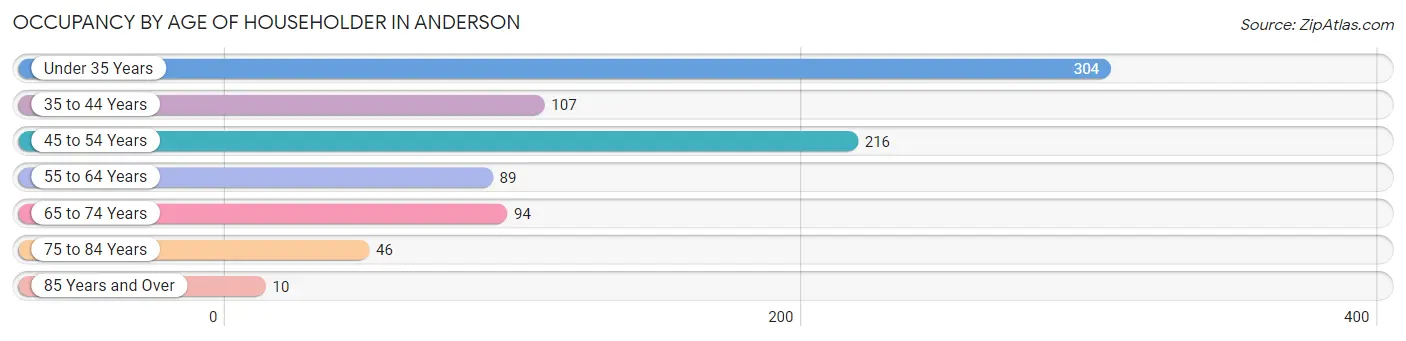
| Age Bracket | # Households | % Households |
| Under 35 Years | 304 | 35.1% |
| 35 to 44 Years | 107 | 12.4% |
| 45 to 54 Years | 216 | 24.9% |
| 55 to 64 Years | 89 | 10.3% |
| 65 to 74 Years | 94 | 10.8% |
| 75 to 84 Years | 46 | 5.3% |
| 85 Years and Over | 10 | 1.1% |
| Total | 866 | 100.0% |
Housing Finances in Anderson
Median Income by Occupancy in Anderson
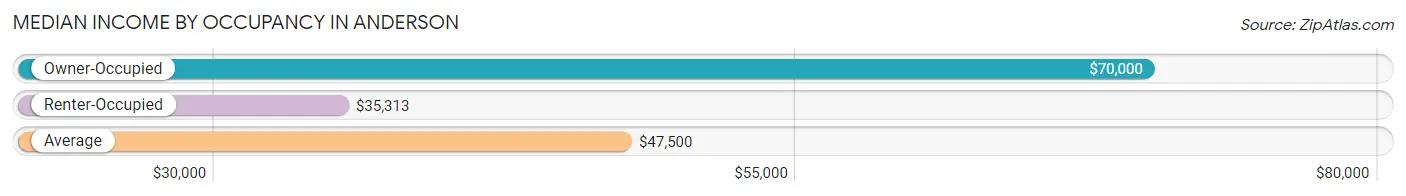
| Occupancy Type | # Households | Median Income |
| Owner-Occupied | 402 (46.4%) | $70,000 |
| Renter-Occupied | 464 (53.6%) | $35,313 |
| Average | 866 (100.0%) | $47,500 |
Occupancy by Householder Income Bracket in Anderson
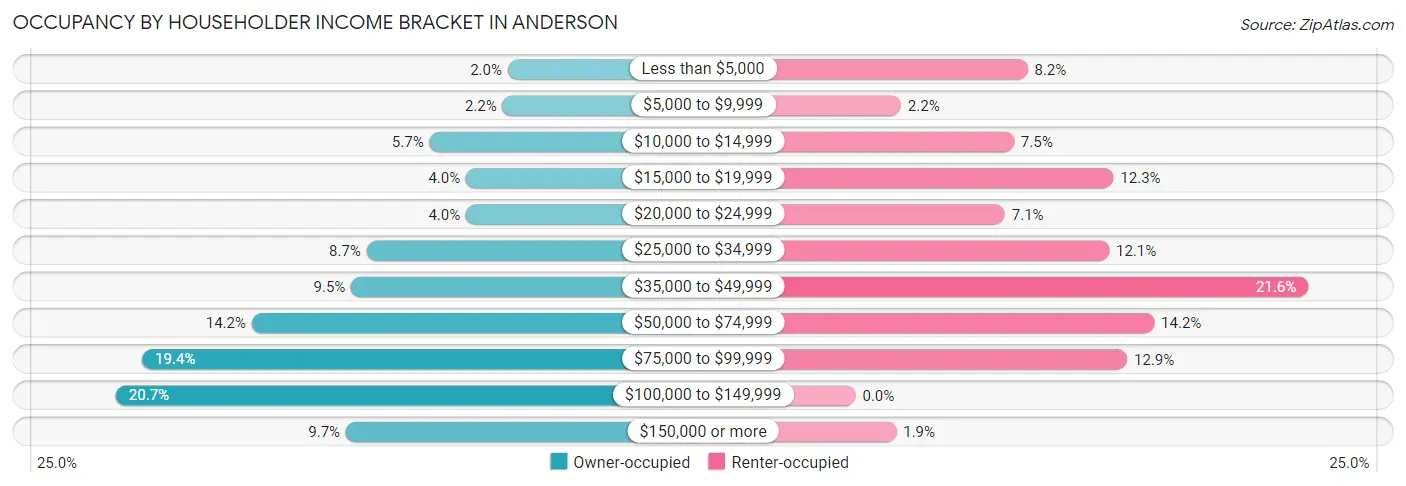
| Income Bracket | Owner-occupied | Renter-occupied |
| Less than $5,000 | 8 (2.0%) | 38 (8.2%) |
| $5,000 to $9,999 | 9 (2.2%) | 10 (2.2%) |
| $10,000 to $14,999 | 23 (5.7%) | 35 (7.5%) |
| $15,000 to $19,999 | 16 (4.0%) | 57 (12.3%) |
| $20,000 to $24,999 | 16 (4.0%) | 33 (7.1%) |
| $25,000 to $34,999 | 35 (8.7%) | 56 (12.1%) |
| $35,000 to $49,999 | 38 (9.5%) | 100 (21.5%) |
| $50,000 to $74,999 | 57 (14.2%) | 66 (14.2%) |
| $75,000 to $99,999 | 78 (19.4%) | 60 (12.9%) |
| $100,000 to $149,999 | 83 (20.6%) | 0 (0.0%) |
| $150,000 or more | 39 (9.7%) | 9 (1.9%) |
| Total | 402 (100.0%) | 464 (100.0%) |
Monthly Housing Cost Tiers in Anderson
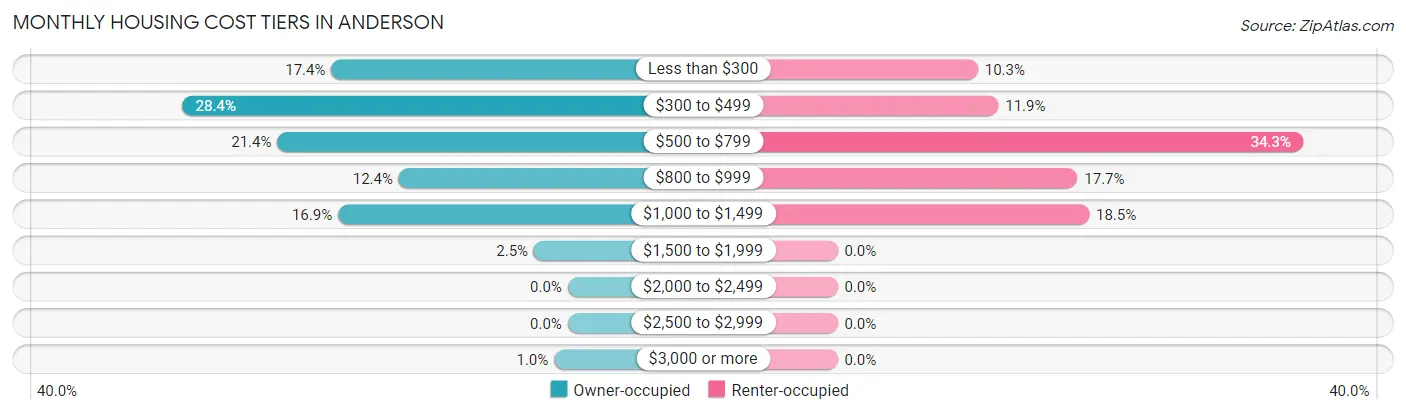
| Monthly Cost | Owner-occupied | Renter-occupied |
| Less than $300 | 70 (17.4%) | 48 (10.3%) |
| $300 to $499 | 114 (28.4%) | 55 (11.8%) |
| $500 to $799 | 86 (21.4%) | 159 (34.3%) |
| $800 to $999 | 50 (12.4%) | 82 (17.7%) |
| $1,000 to $1,499 | 68 (16.9%) | 86 (18.5%) |
| $1,500 to $1,999 | 10 (2.5%) | 0 (0.0%) |
| $2,000 to $2,499 | 0 (0.0%) | 0 (0.0%) |
| $2,500 to $2,999 | 0 (0.0%) | 0 (0.0%) |
| $3,000 or more | 4 (1.0%) | 0 (0.0%) |
| Total | 402 (100.0%) | 464 (100.0%) |
Physical Housing Characteristics in Anderson
Housing Structures in Anderson
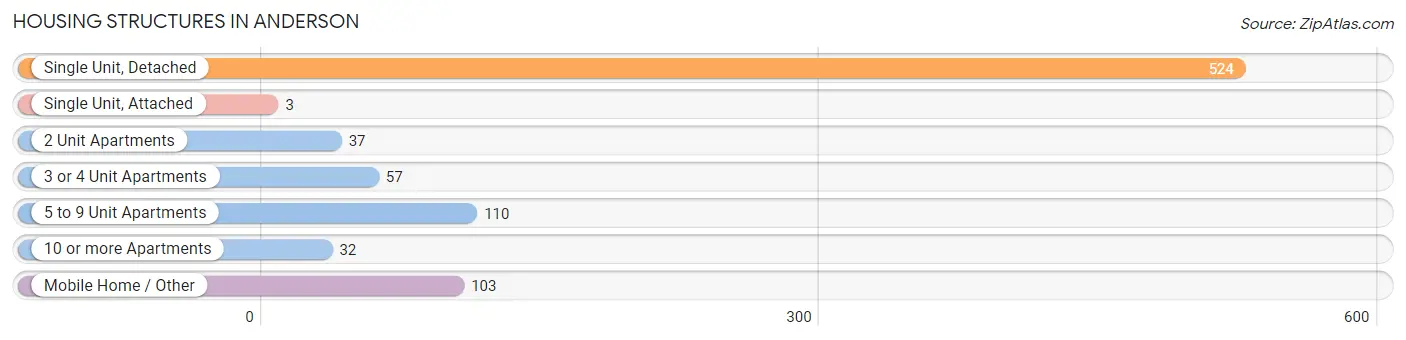
| Structure Type | # Housing Units | % Housing Units |
| Single Unit, Detached | 524 | 60.5% |
| Single Unit, Attached | 3 | 0.4% |
| 2 Unit Apartments | 37 | 4.3% |
| 3 or 4 Unit Apartments | 57 | 6.6% |
| 5 to 9 Unit Apartments | 110 | 12.7% |
| 10 or more Apartments | 32 | 3.7% |
| Mobile Home / Other | 103 | 11.9% |
| Total | 866 | 100.0% |
Housing Structures by Occupancy in Anderson
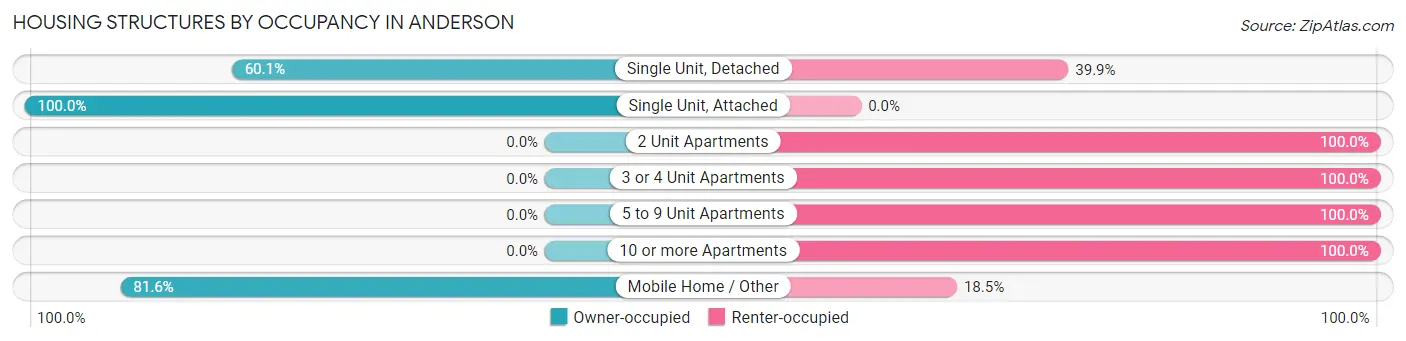
| Structure Type | Owner-occupied | Renter-occupied |
| Single Unit, Detached | 315 (60.1%) | 209 (39.9%) |
| Single Unit, Attached | 3 (100.0%) | 0 (0.0%) |
| 2 Unit Apartments | 0 (0.0%) | 37 (100.0%) |
| 3 or 4 Unit Apartments | 0 (0.0%) | 57 (100.0%) |
| 5 to 9 Unit Apartments | 0 (0.0%) | 110 (100.0%) |
| 10 or more Apartments | 0 (0.0%) | 32 (100.0%) |
| Mobile Home / Other | 84 (81.6%) | 19 (18.4%) |
| Total | 402 (46.4%) | 464 (53.6%) |
Housing Structures by Number of Rooms in Anderson
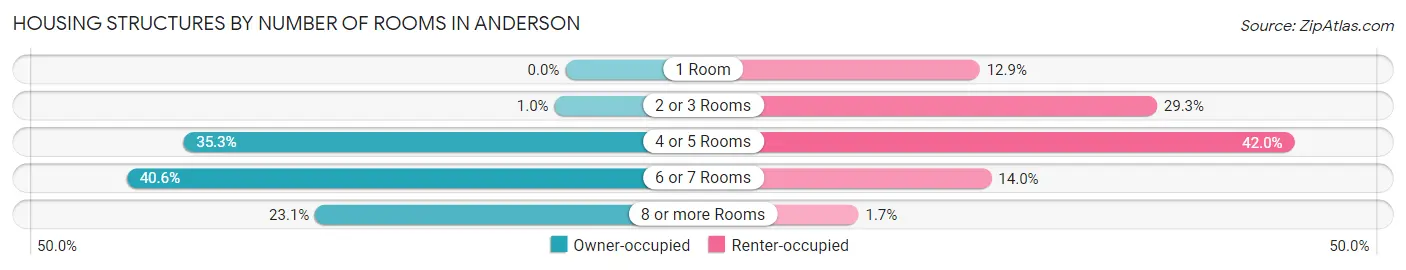
| Number of Rooms | Owner-occupied | Renter-occupied |
| 1 Room | 0 (0.0%) | 60 (12.9%) |
| 2 or 3 Rooms | 4 (1.0%) | 136 (29.3%) |
| 4 or 5 Rooms | 142 (35.3%) | 195 (42.0%) |
| 6 or 7 Rooms | 163 (40.6%) | 65 (14.0%) |
| 8 or more Rooms | 93 (23.1%) | 8 (1.7%) |
| Total | 402 (100.0%) | 464 (100.0%) |
Housing Structure by Heating Type in Anderson
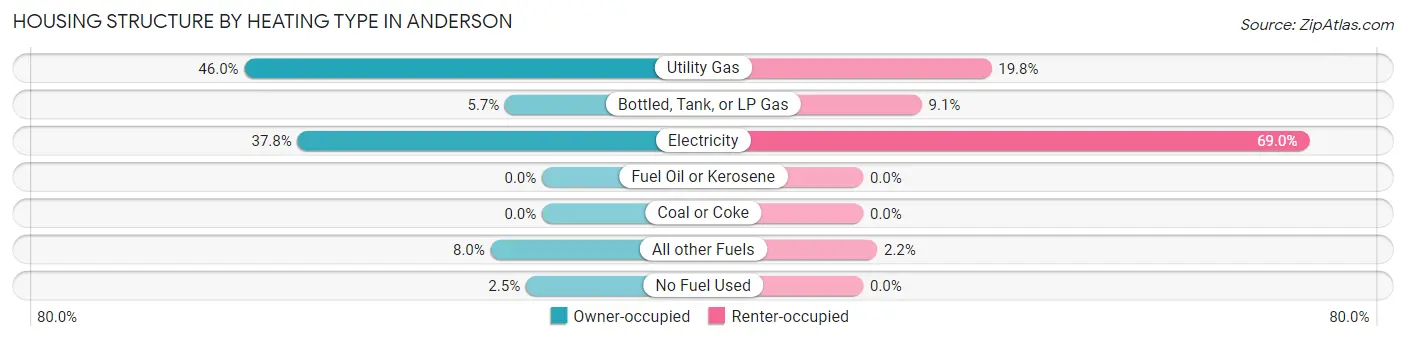
| Heating Type | Owner-occupied | Renter-occupied |
| Utility Gas | 185 (46.0%) | 92 (19.8%) |
| Bottled, Tank, or LP Gas | 23 (5.7%) | 42 (9.0%) |
| Electricity | 152 (37.8%) | 320 (69.0%) |
| Fuel Oil or Kerosene | 0 (0.0%) | 0 (0.0%) |
| Coal or Coke | 0 (0.0%) | 0 (0.0%) |
| All other Fuels | 32 (8.0%) | 10 (2.2%) |
| No Fuel Used | 10 (2.5%) | 0 (0.0%) |
| Total | 402 (100.0%) | 464 (100.0%) |
Household Vehicle Usage in Anderson
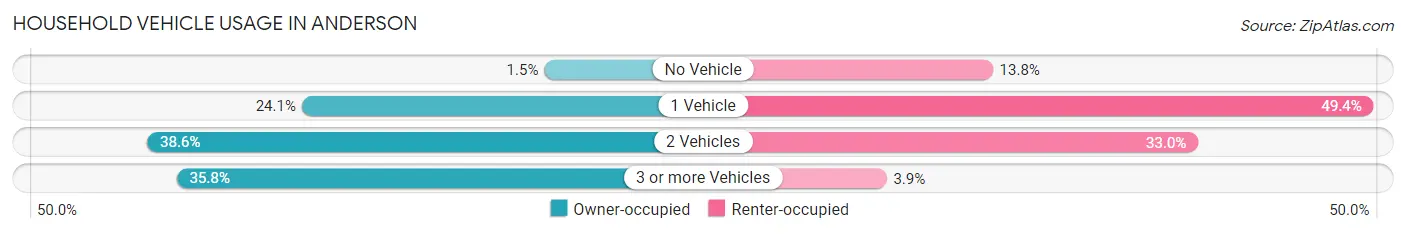
| Vehicles per Household | Owner-occupied | Renter-occupied |
| No Vehicle | 6 (1.5%) | 64 (13.8%) |
| 1 Vehicle | 97 (24.1%) | 229 (49.3%) |
| 2 Vehicles | 155 (38.6%) | 153 (33.0%) |
| 3 or more Vehicles | 144 (35.8%) | 18 (3.9%) |
| Total | 402 (100.0%) | 464 (100.0%) |
Real Estate & Mortgages in Anderson
Real Estate and Mortgage Overview in Anderson
| Characteristic | Without Mortgage | With Mortgage |
| Housing Units | 220 | 182 |
| Median Property Value | $86,300 | $106,100 |
| Median Household Income | $53,611 | $34 |
| Monthly Housing Costs | $350 | $4 |
| Real Estate Taxes | $453 | $8 |
Property Value by Mortgage Status in Anderson
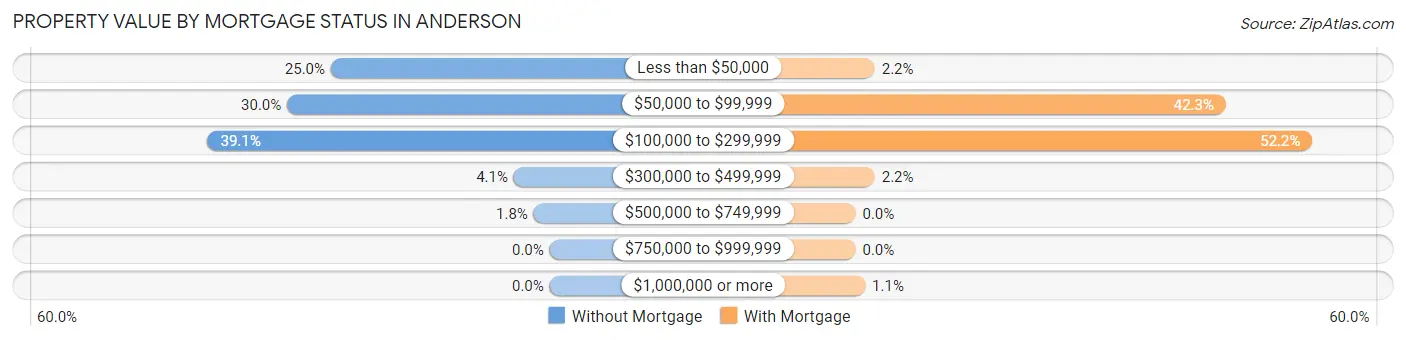
| Property Value | Without Mortgage | With Mortgage |
| Less than $50,000 | 55 (25.0%) | 4 (2.2%) |
| $50,000 to $99,999 | 66 (30.0%) | 77 (42.3%) |
| $100,000 to $299,999 | 86 (39.1%) | 95 (52.2%) |
| $300,000 to $499,999 | 9 (4.1%) | 4 (2.2%) |
| $500,000 to $749,999 | 4 (1.8%) | 0 (0.0%) |
| $750,000 to $999,999 | 0 (0.0%) | 0 (0.0%) |
| $1,000,000 or more | 0 (0.0%) | 2 (1.1%) |
| Total | 220 (100.0%) | 182 (100.0%) |
Household Income by Mortgage Status in Anderson
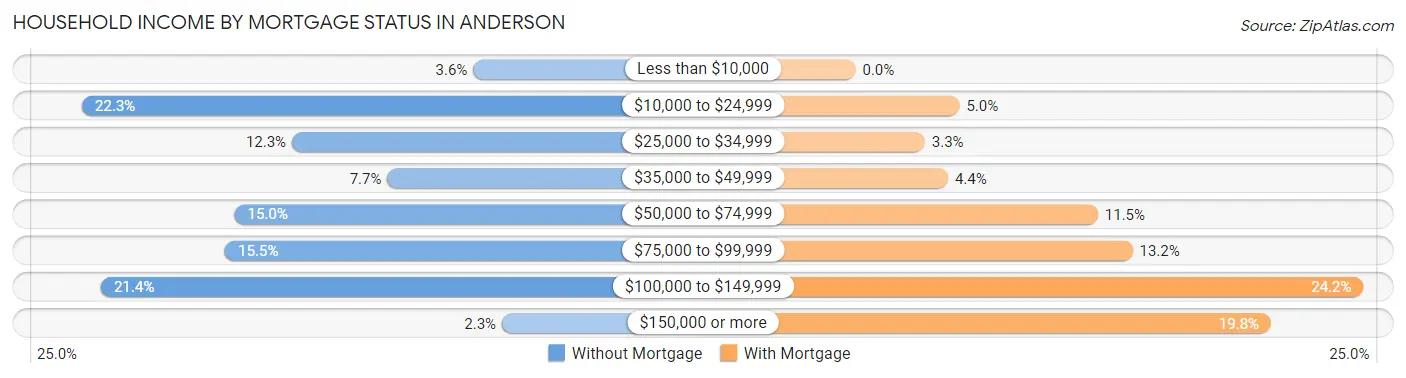
| Household Income | Without Mortgage | With Mortgage |
| Less than $10,000 | 8 (3.6%) | 0 (0.0%) |
| $10,000 to $24,999 | 49 (22.3%) | 9 (5.0%) |
| $25,000 to $34,999 | 27 (12.3%) | 6 (3.3%) |
| $35,000 to $49,999 | 17 (7.7%) | 8 (4.4%) |
| $50,000 to $74,999 | 33 (15.0%) | 21 (11.5%) |
| $75,000 to $99,999 | 34 (15.4%) | 24 (13.2%) |
| $100,000 to $149,999 | 47 (21.4%) | 44 (24.2%) |
| $150,000 or more | 5 (2.3%) | 36 (19.8%) |
| Total | 220 (100.0%) | 182 (100.0%) |
Property Value to Household Income Ratio in Anderson
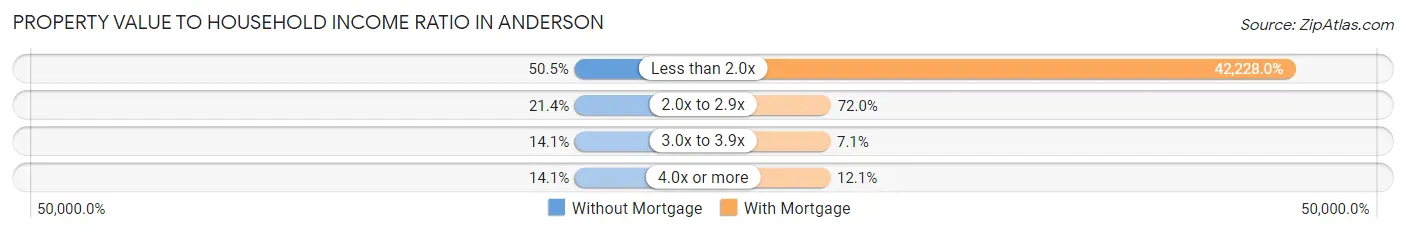
| Value-to-Income Ratio | Without Mortgage | With Mortgage |
| Less than 2.0x | 111 (50.4%) | 76,855 (42,228.0%) |
| 2.0x to 2.9x | 47 (21.4%) | 131 (72.0%) |
| 3.0x to 3.9x | 31 (14.1%) | 13 (7.1%) |
| 4.0x or more | 31 (14.1%) | 22 (12.1%) |
| Total | 220 (100.0%) | 182 (100.0%) |
Real Estate Taxes by Mortgage Status in Anderson
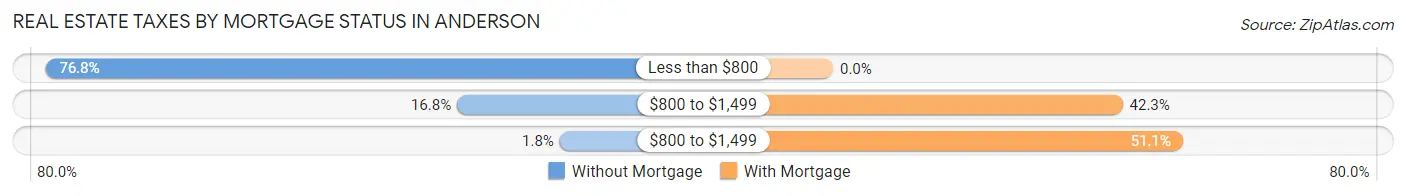
| Property Taxes | Without Mortgage | With Mortgage |
| Less than $800 | 169 (76.8%) | 0 (0.0%) |
| $800 to $1,499 | 37 (16.8%) | 77 (42.3%) |
| $800 to $1,499 | 4 (1.8%) | 93 (51.1%) |
| Total | 220 (100.0%) | 182 (100.0%) |
Health & Disability in Anderson
Health Insurance Coverage by Age in Anderson
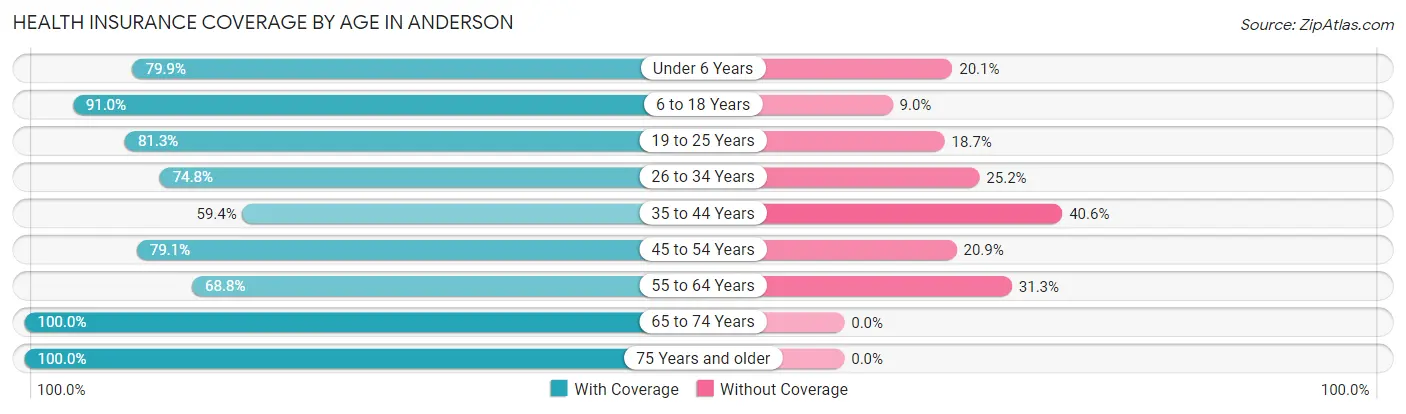
| Age Bracket | With Coverage | Without Coverage |
| Under 6 Years | 230 (79.9%) | 58 (20.1%) |
| 6 to 18 Years | 404 (91.0%) | 40 (9.0%) |
| 19 to 25 Years | 152 (81.3%) | 35 (18.7%) |
| 26 to 34 Years | 374 (74.8%) | 126 (25.2%) |
| 35 to 44 Years | 130 (59.4%) | 89 (40.6%) |
| 45 to 54 Years | 272 (79.1%) | 72 (20.9%) |
| 55 to 64 Years | 143 (68.8%) | 65 (31.2%) |
| 65 to 74 Years | 183 (100.0%) | 0 (0.0%) |
| 75 Years and older | 81 (100.0%) | 0 (0.0%) |
| Total | 1,969 (80.2%) | 485 (19.8%) |
Health Insurance Coverage by Citizenship Status in Anderson
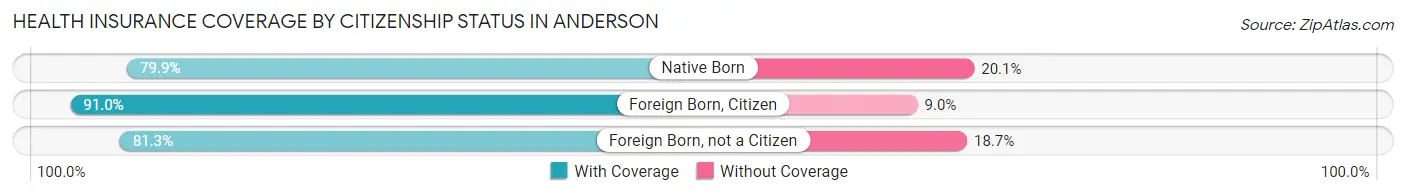
| Citizenship Status | With Coverage | Without Coverage |
| Native Born | 230 (79.9%) | 58 (20.1%) |
| Foreign Born, Citizen | 404 (91.0%) | 40 (9.0%) |
| Foreign Born, not a Citizen | 152 (81.3%) | 35 (18.7%) |
Health Insurance Coverage by Household Income in Anderson
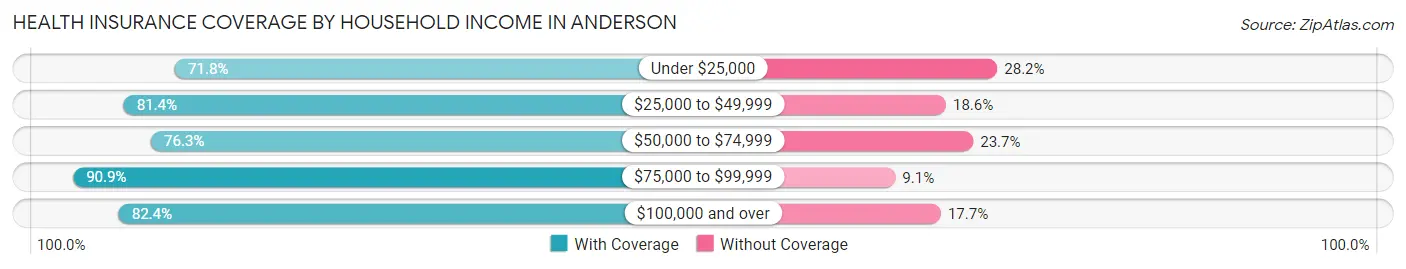
| Household Income | With Coverage | Without Coverage |
| Under $25,000 | 402 (71.8%) | 158 (28.2%) |
| $25,000 to $49,999 | 495 (81.4%) | 113 (18.6%) |
| $50,000 to $74,999 | 309 (76.3%) | 96 (23.7%) |
| $75,000 to $99,999 | 399 (90.9%) | 40 (9.1%) |
| $100,000 and over | 364 (82.4%) | 78 (17.6%) |
Public vs Private Health Insurance Coverage by Age in Anderson
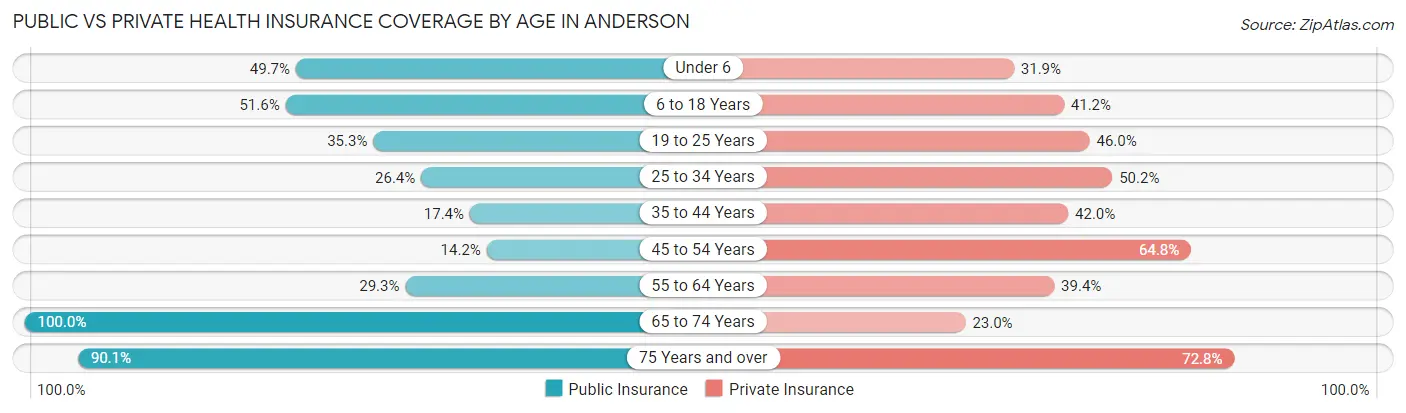
| Age Bracket | Public Insurance | Private Insurance |
| Under 6 | 143 (49.6%) | 92 (31.9%) |
| 6 to 18 Years | 229 (51.6%) | 183 (41.2%) |
| 19 to 25 Years | 66 (35.3%) | 86 (46.0%) |
| 25 to 34 Years | 132 (26.4%) | 251 (50.2%) |
| 35 to 44 Years | 38 (17.3%) | 92 (42.0%) |
| 45 to 54 Years | 49 (14.2%) | 223 (64.8%) |
| 55 to 64 Years | 61 (29.3%) | 82 (39.4%) |
| 65 to 74 Years | 183 (100.0%) | 42 (23.0%) |
| 75 Years and over | 73 (90.1%) | 59 (72.8%) |
| Total | 974 (39.7%) | 1,110 (45.2%) |
Disability Status by Sex by Age in Anderson
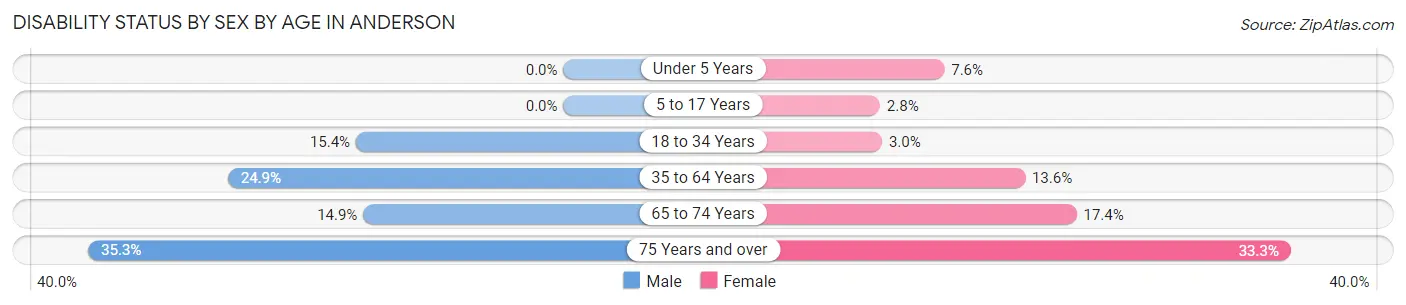
| Age Bracket | Male | Female |
| Under 5 Years | 0 (0.0%) | 7 (7.6%) |
| 5 to 17 Years | 0 (0.0%) | 6 (2.8%) |
| 18 to 34 Years | 61 (15.4%) | 9 (3.0%) |
| 35 to 64 Years | 73 (24.9%) | 65 (13.6%) |
| 65 to 74 Years | 11 (14.9%) | 19 (17.4%) |
| 75 Years and over | 18 (35.3%) | 10 (33.3%) |
Disability Class by Sex by Age in Anderson
Disability Class: Hearing Difficulty
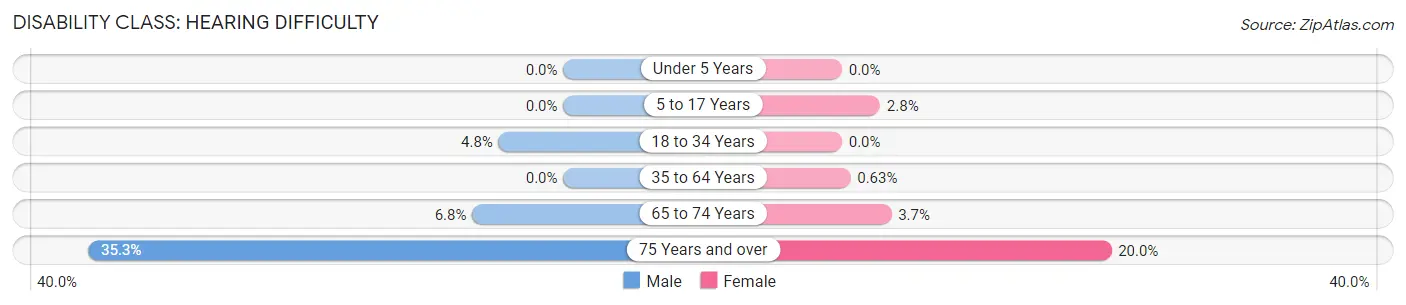
| Age Bracket | Male | Female |
| Under 5 Years | 0 (0.0%) | 0 (0.0%) |
| 5 to 17 Years | 0 (0.0%) | 6 (2.8%) |
| 18 to 34 Years | 19 (4.8%) | 0 (0.0%) |
| 35 to 64 Years | 0 (0.0%) | 3 (0.6%) |
| 65 to 74 Years | 5 (6.8%) | 4 (3.7%) |
| 75 Years and over | 18 (35.3%) | 6 (20.0%) |
Disability Class: Vision Difficulty
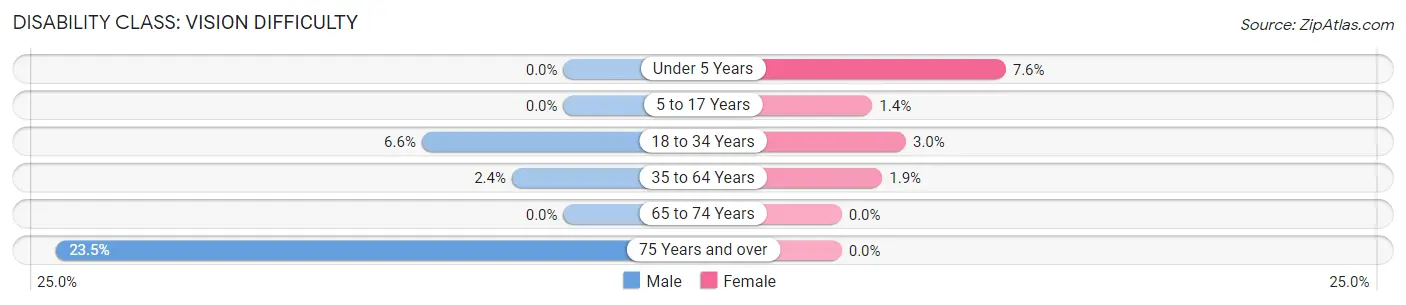
| Age Bracket | Male | Female |
| Under 5 Years | 0 (0.0%) | 7 (7.6%) |
| 5 to 17 Years | 0 (0.0%) | 3 (1.4%) |
| 18 to 34 Years | 26 (6.6%) | 9 (3.0%) |
| 35 to 64 Years | 7 (2.4%) | 9 (1.9%) |
| 65 to 74 Years | 0 (0.0%) | 0 (0.0%) |
| 75 Years and over | 12 (23.5%) | 0 (0.0%) |
Disability Class: Cognitive Difficulty
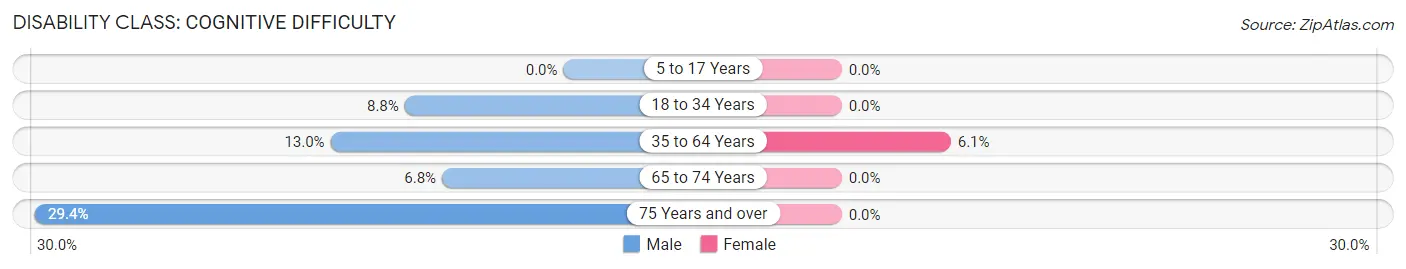
| Age Bracket | Male | Female |
| 5 to 17 Years | 0 (0.0%) | 0 (0.0%) |
| 18 to 34 Years | 35 (8.8%) | 0 (0.0%) |
| 35 to 64 Years | 38 (13.0%) | 29 (6.1%) |
| 65 to 74 Years | 5 (6.8%) | 0 (0.0%) |
| 75 Years and over | 15 (29.4%) | 0 (0.0%) |
Disability Class: Ambulatory Difficulty
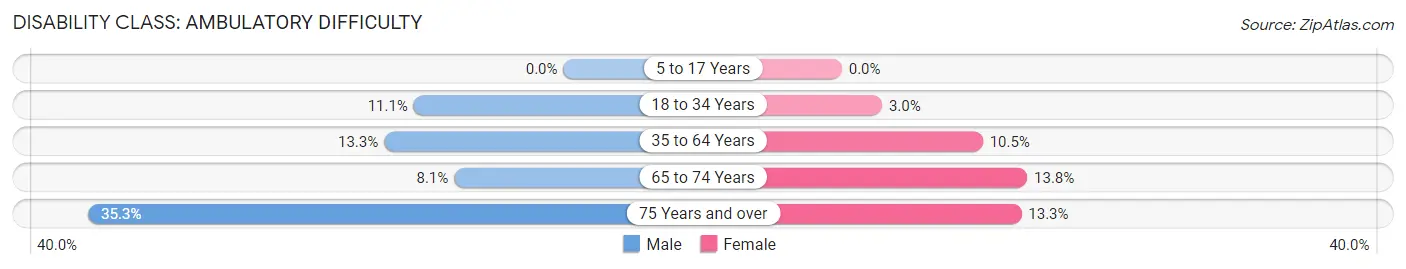
| Age Bracket | Male | Female |
| 5 to 17 Years | 0 (0.0%) | 0 (0.0%) |
| 18 to 34 Years | 44 (11.1%) | 9 (3.0%) |
| 35 to 64 Years | 39 (13.3%) | 50 (10.5%) |
| 65 to 74 Years | 6 (8.1%) | 15 (13.8%) |
| 75 Years and over | 18 (35.3%) | 4 (13.3%) |
Disability Class: Self-Care Difficulty
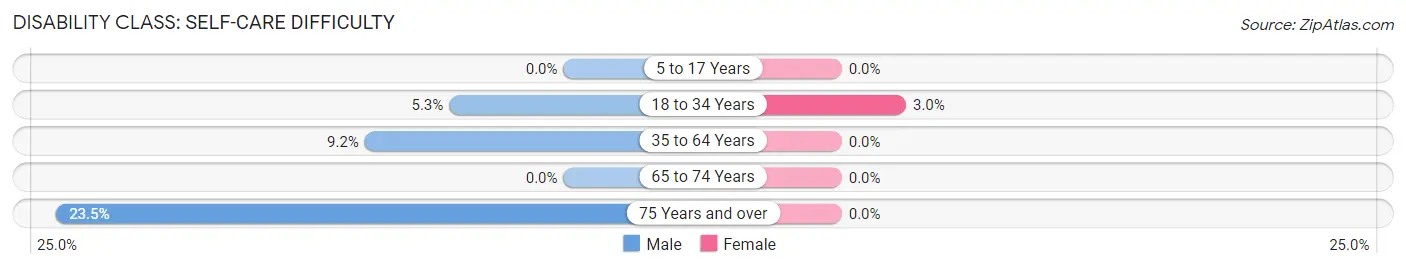
| Age Bracket | Male | Female |
| 5 to 17 Years | 0 (0.0%) | 0 (0.0%) |
| 18 to 34 Years | 21 (5.3%) | 9 (3.0%) |
| 35 to 64 Years | 27 (9.2%) | 0 (0.0%) |
| 65 to 74 Years | 0 (0.0%) | 0 (0.0%) |
| 75 Years and over | 12 (23.5%) | 0 (0.0%) |
Technology Access in Anderson
Computing Device Access in Anderson
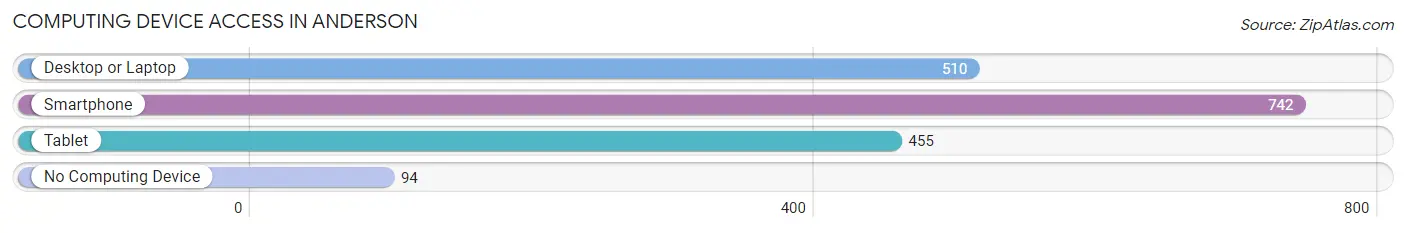
| Device Type | # Households | % Households |
| Desktop or Laptop | 510 | 58.9% |
| Smartphone | 742 | 85.7% |
| Tablet | 455 | 52.5% |
| No Computing Device | 94 | 10.8% |
| Total | 866 | 100.0% |
Internet Access in Anderson
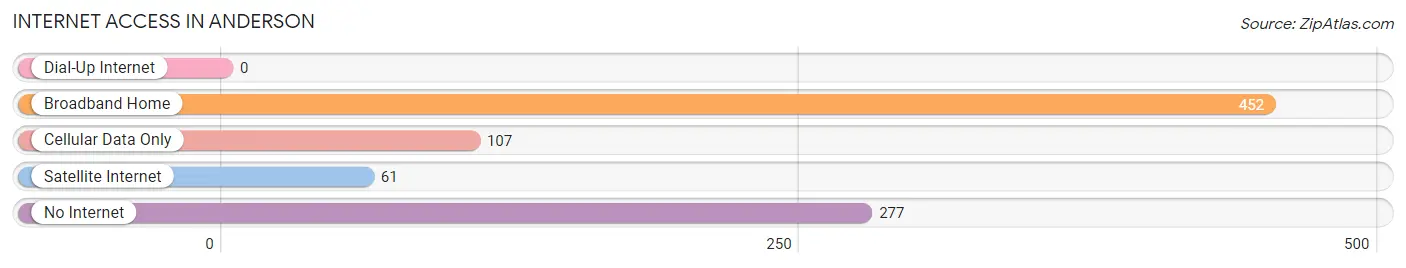
| Internet Type | # Households | % Households |
| Dial-Up Internet | 0 | 0.0% |
| Broadband Home | 452 | 52.2% |
| Cellular Data Only | 107 | 12.4% |
| Satellite Internet | 61 | 7.0% |
| No Internet | 277 | 32.0% |
| Total | 866 | 100.0% |
Anderson Summary
Anderson, Missouri is a small town located in McDonald County in the southwestern corner of the state. It is situated on the banks of the Elk River, and is surrounded by rolling hills and wooded areas. The town was founded in 1883 and has a population of approximately 1,000 people.
History
The area that is now Anderson was first settled in the early 1800s by a group of settlers from Tennessee. The town was originally known as “Andersonville” and was named after the first settler, William Anderson. The town was officially incorporated in 1883 and was named after the Anderson family.
The town grew slowly but steadily over the years, and by the early 1900s it had become a thriving community. The town was home to several businesses, including a general store, a blacksmith shop, a hotel, and a sawmill. The town also had a school, a post office, and a church.
In the early 1900s, the town was a popular destination for tourists, who came to enjoy the scenic beauty of the area. The town was also known for its excellent fishing and hunting opportunities.
Geography
Anderson is located in the southwestern corner of Missouri, in McDonald County. It is situated on the banks of the Elk River, and is surrounded by rolling hills and wooded areas. The town is located approximately 30 miles from the Arkansas border.
The climate in Anderson is generally mild, with hot summers and cold winters. The average temperature in the summer is around 80 degrees Fahrenheit, and the average temperature in the winter is around 40 degrees Fahrenheit.
Economy
The economy of Anderson is largely based on agriculture. The town is home to several farms, which produce a variety of crops, including corn, soybeans, wheat, and hay. The town also has several small businesses, including a general store, a hardware store, and a restaurant.
The town is also home to a small manufacturing plant, which produces a variety of products, including furniture and clothing.
Demographics
As of the 2010 census, the population of Anderson was 1,000 people. The racial makeup of the town was 97.2% White, 0.7% African American, 0.3% Native American, 0.2% Asian, and 1.6% from other races. The median household income in Anderson was $31,250, and the median family income was $37,500.
Conclusion
Anderson, Missouri is a small town located in McDonald County in the southwestern corner of the state. It was founded in 1883 and has a population of approximately 1,000 people. The town is largely based on agriculture, and is home to several small businesses. The town is also known for its scenic beauty and excellent fishing and hunting opportunities.
Common Questions
What is Per Capita Income in Anderson?
Per Capita income in Anderson is $19,684.
What is the Median Family Income in Anderson?
Median Family Income in Anderson is $54,457.
What is the Median Household income in Anderson?
Median Household Income in Anderson is $47,500.
What is Income or Wage Gap in Anderson?
Income or Wage Gap in Anderson is 32.5%.
Women in Anderson earn 67.5 cents for every dollar earned by a man.
What is Family Income Deficit in Anderson?
Family Income Deficit in Anderson is $11,409.
Families that are below poverty line in Anderson earn $11,409 less on average than the poverty threshold level.
What is Inequality or Gini Index in Anderson?
Inequality or Gini Index in Anderson is 0.42.
What is the Total Population of Anderson?
Total Population of Anderson is 2,561.
What is the Total Male Population of Anderson?
Total Male Population of Anderson is 1,271.
What is the Total Female Population of Anderson?
Total Female Population of Anderson is 1,290.
What is the Ratio of Males per 100 Females in Anderson?
There are 98.53 Males per 100 Females in Anderson.
What is the Ratio of Females per 100 Males in Anderson?
There are 101.49 Females per 100 Males in Anderson.
What is the Median Population Age in Anderson?
Median Population Age in Anderson is 33.2 Years.
What is the Average Family Size in Anderson
Average Family Size in Anderson is 3.1 People.
What is the Average Household Size in Anderson
Average Household Size in Anderson is 2.9 People.
How Large is the Labor Force in Anderson?
There are 1,044 People in the Labor Forcein in Anderson.
What is the Percentage of People in the Labor Force in Anderson?
55.3% of People are in the Labor Force in Anderson.
What is the Unemployment Rate in Anderson?
Unemployment Rate in Anderson is 2.6%.