Adrian, MO Map & Demographics
Adrian Map
Adrian Overview
$25,021
PER CAPITA INCOME
$75,781
AVG FAMILY INCOME
$46,957
AVG HOUSEHOLD INCOME
38.3%
WAGE / INCOME GAP [ % ]
61.7¢/ $1
WAGE / INCOME GAP [ $ ]
0.40
INEQUALITY / GINI INDEX
2,021
TOTAL POPULATION
897
MALE POPULATION
1,124
FEMALE POPULATION
79.80
MALES / 100 FEMALES
125.31
FEMALES / 100 MALES
39.0
MEDIAN AGE
3.2
AVG FAMILY SIZE
2.5
AVG HOUSEHOLD SIZE
969
LABOR FORCE [ PEOPLE ]
61.5%
PERCENT IN LABOR FORCE
11.3%
UNEMPLOYMENT RATE
Adrian Zip Codes
Adrian Area Codes
Income in Adrian
Income Overview in Adrian
Per Capita Income in Adrian is $25,021, while median incomes of families and households are $75,781 and $46,957 respectively.
| Characteristic | Number | Measure |
| Per Capita Income | 2,021 | $25,021 |
| Median Family Income | 469 | $75,781 |
| Mean Family Income | 469 | $75,663 |
| Median Household Income | 798 | $46,957 |
| Mean Household Income | 798 | $57,902 |
| Income Deficit | 469 | $0 |
| Wage / Income Gap (%) | 2,021 | 38.33% |
| Wage / Income Gap ($) | 2,021 | 61.67¢ per $1 |
| Gini / Inequality Index | 2,021 | 0.40 |
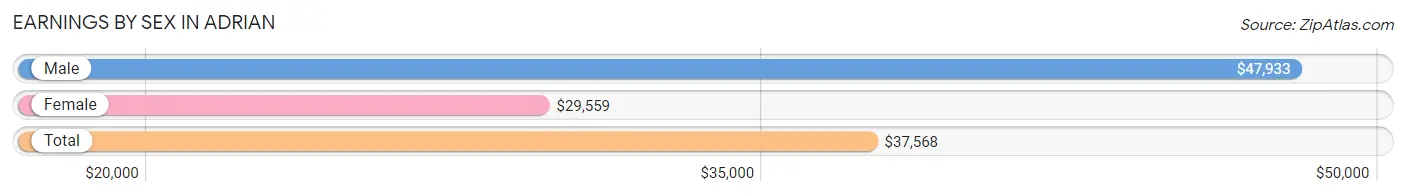
Earnings by Sex in Adrian
Average Earnings in Adrian are $37,568, $47,933 for men and $29,559 for women, a difference of 38.3%.
| Sex | Number | Average Earnings |
| Male | 424 (43.6%) | $47,933 |
| Female | 548 (56.4%) | $29,559 |
| Total | 972 (100.0%) | $37,568 |
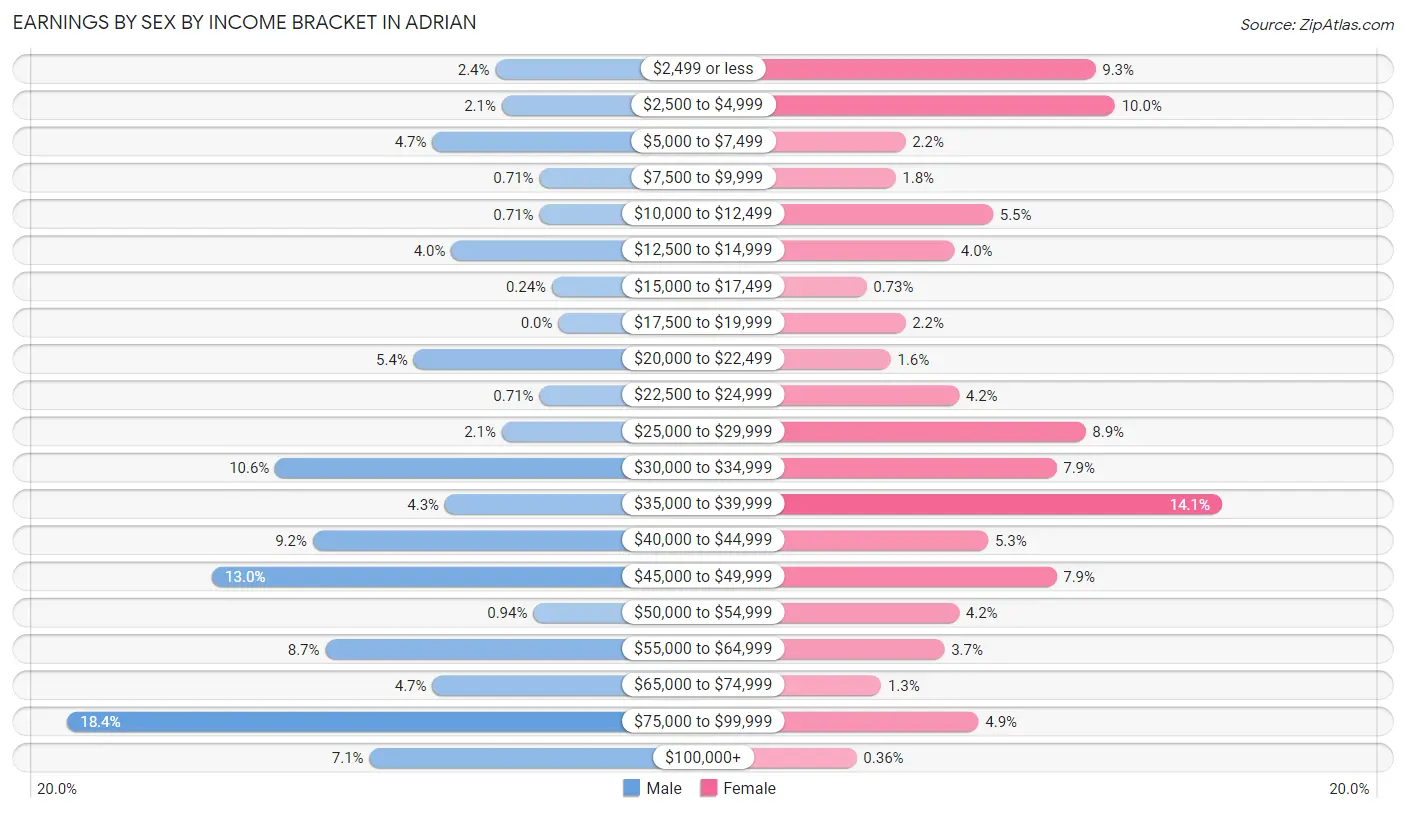
Earnings by Sex by Income Bracket in Adrian
The most common earnings brackets in Adrian are $75,000 to $99,999 for men (78 | 18.4%) and $35,000 to $39,999 for women (77 | 14.1%).
| Income | Male | Female |
| $2,499 or less | 10 (2.4%) | 51 (9.3%) |
| $2,500 to $4,999 | 9 (2.1%) | 55 (10.0%) |
| $5,000 to $7,499 | 20 (4.7%) | 12 (2.2%) |
| $7,500 to $9,999 | 3 (0.7%) | 10 (1.8%) |
| $10,000 to $12,499 | 3 (0.7%) | 30 (5.5%) |
| $12,500 to $14,999 | 17 (4.0%) | 22 (4.0%) |
| $15,000 to $17,499 | 1 (0.2%) | 4 (0.7%) |
| $17,500 to $19,999 | 0 (0.0%) | 12 (2.2%) |
| $20,000 to $22,499 | 23 (5.4%) | 9 (1.6%) |
| $22,500 to $24,999 | 3 (0.7%) | 23 (4.2%) |
| $25,000 to $29,999 | 9 (2.1%) | 49 (8.9%) |
| $30,000 to $34,999 | 45 (10.6%) | 43 (7.9%) |
| $35,000 to $39,999 | 18 (4.3%) | 77 (14.1%) |
| $40,000 to $44,999 | 39 (9.2%) | 29 (5.3%) |
| $45,000 to $49,999 | 55 (13.0%) | 43 (7.9%) |
| $50,000 to $54,999 | 4 (0.9%) | 23 (4.2%) |
| $55,000 to $64,999 | 37 (8.7%) | 20 (3.6%) |
| $65,000 to $74,999 | 20 (4.7%) | 7 (1.3%) |
| $75,000 to $99,999 | 78 (18.4%) | 27 (4.9%) |
| $100,000+ | 30 (7.1%) | 2 (0.4%) |
| Total | 424 (100.0%) | 548 (100.0%) |
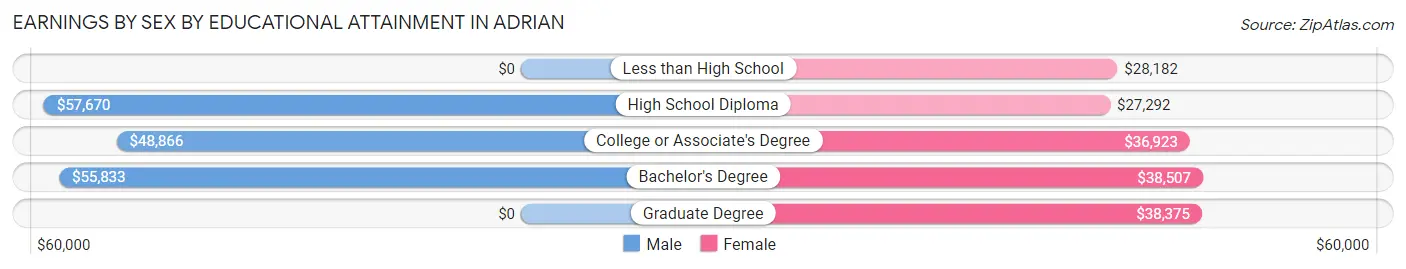
Earnings by Sex by Educational Attainment in Adrian
Average earnings in Adrian are $49,183 for men and $36,000 for women, a difference of 26.8%. Men with an educational attainment of high school diploma enjoy the highest average annual earnings of $57,670, while those with college or associate's degree education earn the least with $48,866. Women with an educational attainment of bachelor's degree earn the most with the average annual earnings of $38,507, while those with high school diploma education have the smallest earnings of $27,292.
| Educational Attainment | Male Income | Female Income |
| Less than High School | - | - |
| High School Diploma | $57,670 | $27,292 |
| College or Associate's Degree | $48,866 | $36,923 |
| Bachelor's Degree | $55,833 | $38,507 |
| Graduate Degree | - | - |
| Total | $49,183 | $36,000 |
Family Income in Adrian
Family Income Brackets in Adrian
According to the Adrian family income data, there are 156 families falling into the $75,000 to $99,999 income range, which is the most common income bracket and makes up 33.3% of all families. Conversely, the $150,000 to $199,999 income bracket is the least frequent group with only 7 families (1.5%) belonging to this category.
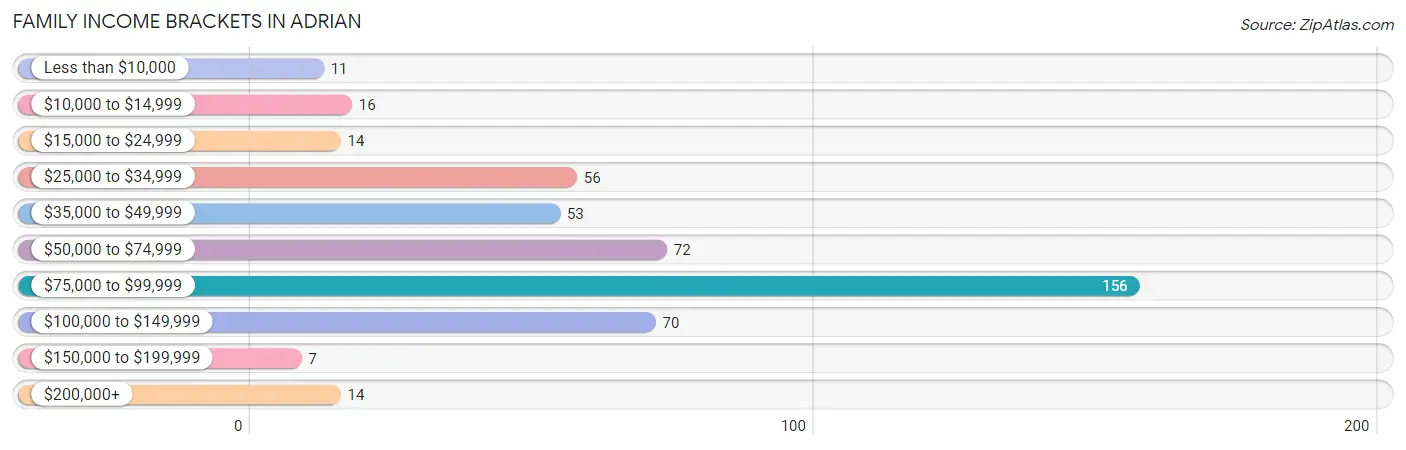
| Income Bracket | # Families | % Families |
| Less than $10,000 | 11 | 2.3% |
| $10,000 to $14,999 | 16 | 3.4% |
| $15,000 to $24,999 | 14 | 3.0% |
| $25,000 to $34,999 | 56 | 11.9% |
| $35,000 to $49,999 | 53 | 11.3% |
| $50,000 to $74,999 | 72 | 15.4% |
| $75,000 to $99,999 | 156 | 33.3% |
| $100,000 to $149,999 | 70 | 14.9% |
| $150,000 to $199,999 | 7 | 1.5% |
| $200,000+ | 14 | 3.0% |
Family Income by Famaliy Size in Adrian
4-person families (69 | 14.7%) account for the highest median family income in Adrian with $97,583 per family, while 2-person families (243 | 51.8%) have the highest median income of $32,188 per family member.
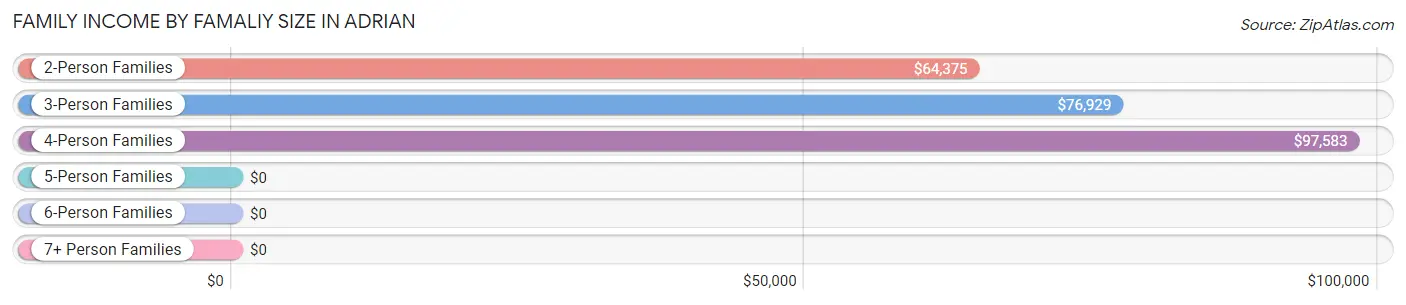
| Income Bracket | # Families | Median Income |
| 2-Person Families | 243 (51.8%) | $64,375 |
| 3-Person Families | 108 (23.0%) | $76,929 |
| 4-Person Families | 69 (14.7%) | $97,583 |
| 5-Person Families | 35 (7.5%) | $0 |
| 6-Person Families | 0 (0.0%) | $0 |
| 7+ Person Families | 14 (3.0%) | $0 |
| Total | 469 (100.0%) | $75,781 |
Family Income by Number of Earners in Adrian
The median family income in Adrian is $75,781, with families comprising 3+ earners (38) having the highest median family income of $146,136, while families with no earners (59) have the lowest median family income of $36,250, accounting for 8.1% and 12.6% of families, respectively.
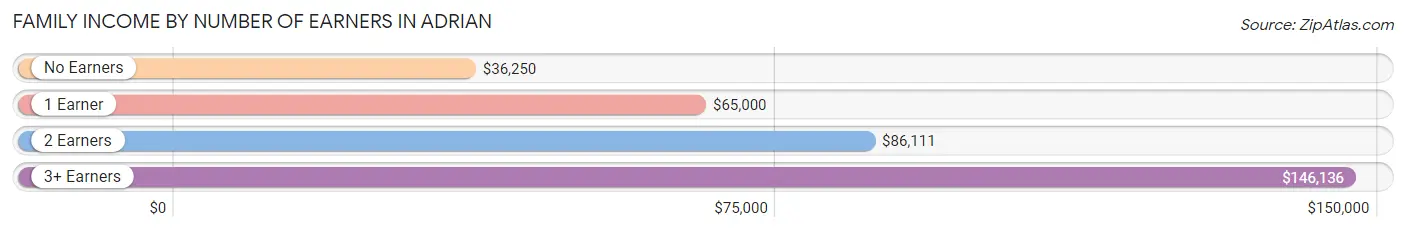
| Number of Earners | # Families | Median Income |
| No Earners | 59 (12.6%) | $36,250 |
| 1 Earner | 202 (43.1%) | $65,000 |
| 2 Earners | 170 (36.2%) | $86,111 |
| 3+ Earners | 38 (8.1%) | $146,136 |
| Total | 469 (100.0%) | $75,781 |
Household Income in Adrian
Household Income Brackets in Adrian
With 134 households falling in the category, the $75,000 to $99,999 income range is the most frequent in Adrian, accounting for 16.8% of all households. In contrast, only 7 households (0.9%) fall into the $150,000 to $199,999 income bracket, making it the least populous group.
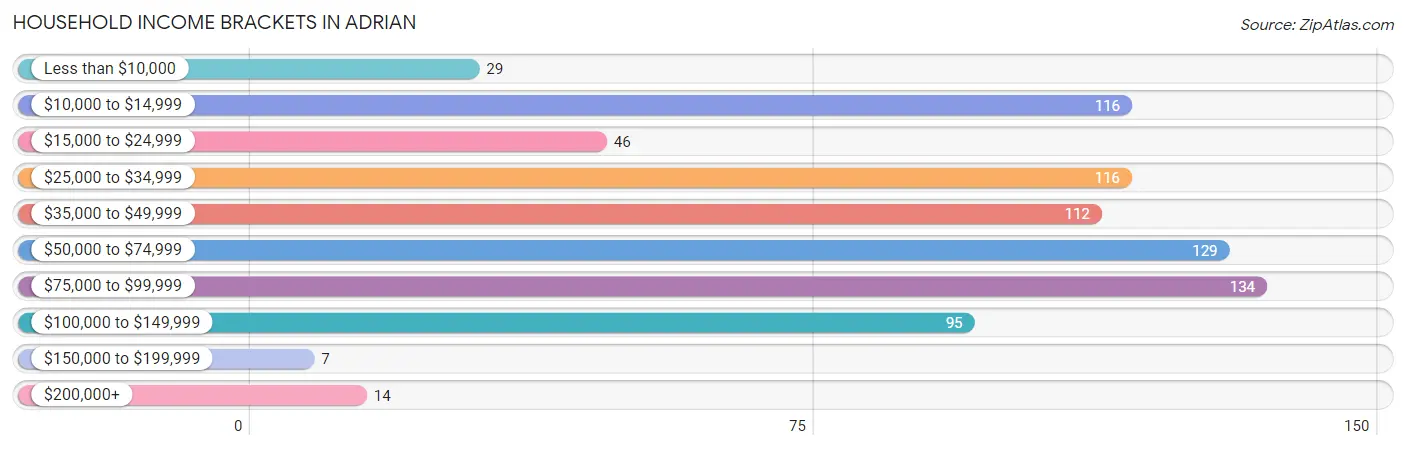
| Income Bracket | # Households | % Households |
| Less than $10,000 | 29 | 3.6% |
| $10,000 to $14,999 | 116 | 14.5% |
| $15,000 to $24,999 | 46 | 5.8% |
| $25,000 to $34,999 | 116 | 14.5% |
| $35,000 to $49,999 | 112 | 14.0% |
| $50,000 to $74,999 | 129 | 16.2% |
| $75,000 to $99,999 | 134 | 16.8% |
| $100,000 to $149,999 | 95 | 11.9% |
| $150,000 to $199,999 | 7 | 0.9% |
| $200,000+ | 14 | 1.8% |
Household Income by Householder Age in Adrian
The median household income in Adrian is $46,957, with the highest median household income of $59,297 found in the 25 to 44 years age bracket for the primary householder. A total of 259 households (32.5%) fall into this category. Meanwhile, the 65+ years age bracket for the primary householder has the lowest median household income of $26,591, with 222 households (27.8%) in this group.
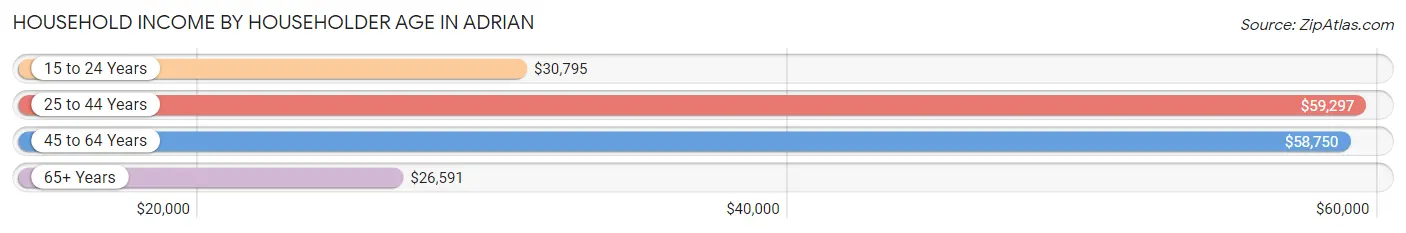
| Income Bracket | # Households | Median Income |
| 15 to 24 Years | 21 (2.6%) | $30,795 |
| 25 to 44 Years | 259 (32.5%) | $59,297 |
| 45 to 64 Years | 296 (37.1%) | $58,750 |
| 65+ Years | 222 (27.8%) | $26,591 |
| Total | 798 (100.0%) | $46,957 |
Poverty in Adrian
Income Below Poverty by Sex and Age in Adrian
With 25.2% poverty level for males and 16.8% for females among the residents of Adrian, 5 year old males and 15 year old females are the most vulnerable to poverty, with 8 males (100.0%) and 10 females (38.5%) in their respective age groups living below the poverty level.
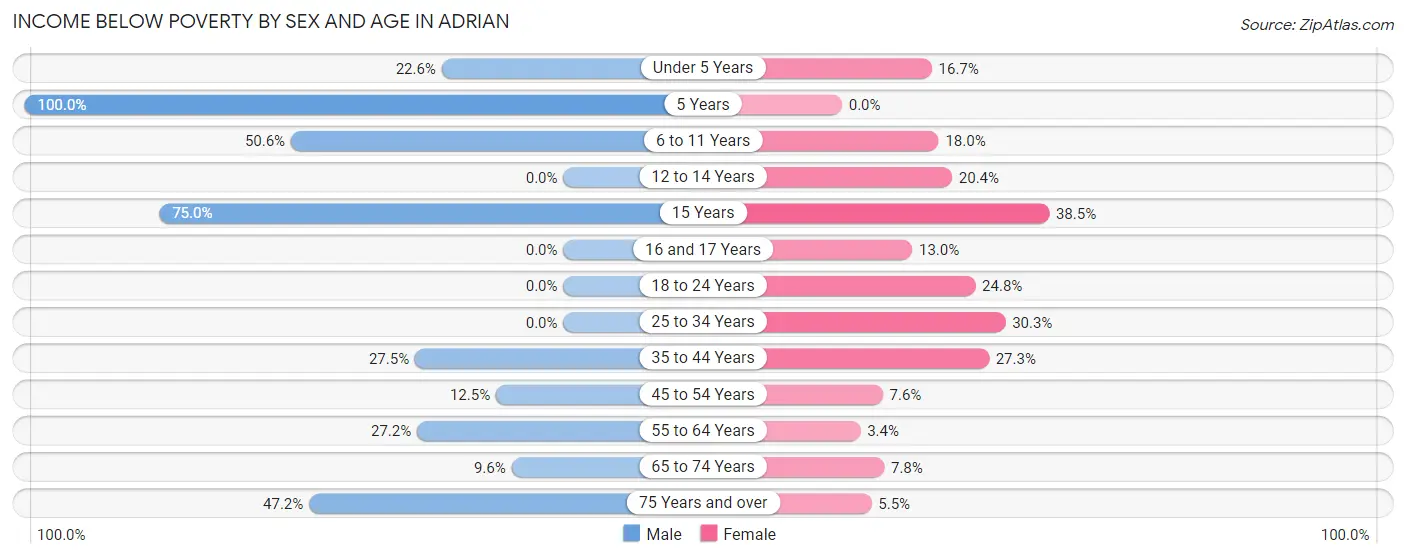
| Age Bracket | Male | Female |
| Under 5 Years | 14 (22.6%) | 9 (16.7%) |
| 5 Years | 8 (100.0%) | 0 (0.0%) |
| 6 to 11 Years | 45 (50.6%) | 14 (17.9%) |
| 12 to 14 Years | 0 (0.0%) | 19 (20.4%) |
| 15 Years | 12 (75.0%) | 10 (38.5%) |
| 16 and 17 Years | 0 (0.0%) | 6 (13.0%) |
| 18 to 24 Years | 0 (0.0%) | 25 (24.7%) |
| 25 to 34 Years | 0 (0.0%) | 37 (30.3%) |
| 35 to 44 Years | 38 (27.5%) | 39 (27.3%) |
| 45 to 54 Years | 9 (12.5%) | 10 (7.6%) |
| 55 to 64 Years | 44 (27.2%) | 4 (3.4%) |
| 65 to 74 Years | 5 (9.6%) | 8 (7.8%) |
| 75 Years and over | 42 (47.2%) | 5 (5.5%) |
| Total | 217 (25.2%) | 186 (16.8%) |
Income Above Poverty by Sex and Age in Adrian
According to the poverty statistics in Adrian, males aged 12 to 14 years and females aged 55 to 64 years are the age groups that are most secure financially, with 100.0% of males and 96.6% of females in these age groups living above the poverty line.
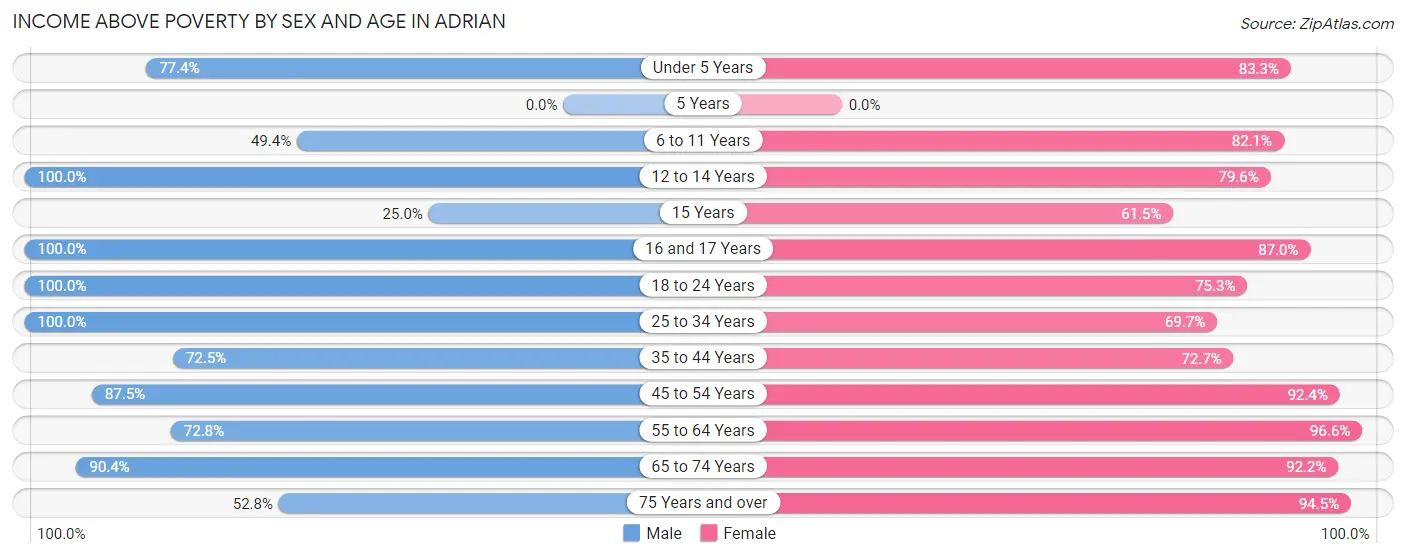
| Age Bracket | Male | Female |
| Under 5 Years | 48 (77.4%) | 45 (83.3%) |
| 5 Years | 0 (0.0%) | 0 (0.0%) |
| 6 to 11 Years | 44 (49.4%) | 64 (82.1%) |
| 12 to 14 Years | 13 (100.0%) | 74 (79.6%) |
| 15 Years | 4 (25.0%) | 16 (61.5%) |
| 16 and 17 Years | 4 (100.0%) | 40 (87.0%) |
| 18 to 24 Years | 78 (100.0%) | 76 (75.2%) |
| 25 to 34 Years | 79 (100.0%) | 85 (69.7%) |
| 35 to 44 Years | 100 (72.5%) | 104 (72.7%) |
| 45 to 54 Years | 63 (87.5%) | 122 (92.4%) |
| 55 to 64 Years | 118 (72.8%) | 113 (96.6%) |
| 65 to 74 Years | 47 (90.4%) | 94 (92.2%) |
| 75 Years and over | 47 (52.8%) | 86 (94.5%) |
| Total | 645 (74.8%) | 919 (83.2%) |
Income Below Poverty Among Married-Couple Families in Adrian
The poverty statistics for married-couple families in Adrian show that 7.2% or 20 of the total 276 families live below the poverty line. Families with 3 or 4 children have the highest poverty rate of 59.1%, comprising of 13 families. On the other hand, families with no children have the lowest poverty rate of 2.2%, which includes 4 families.
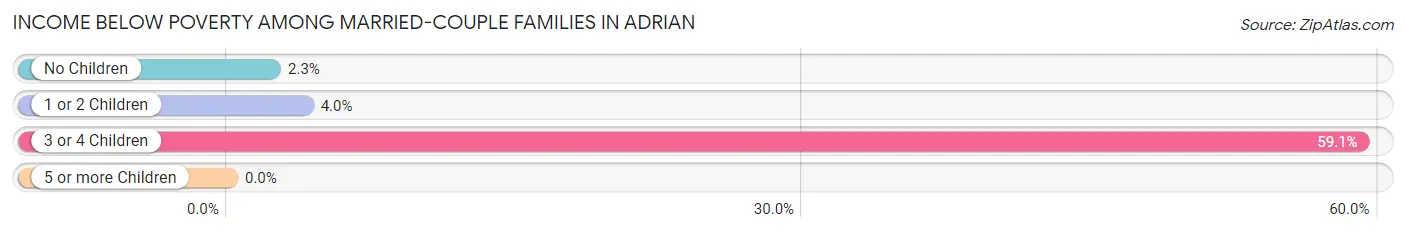
| Children | Above Poverty | Below Poverty |
| No Children | 174 (97.8%) | 4 (2.2%) |
| 1 or 2 Children | 73 (96.1%) | 3 (4.0%) |
| 3 or 4 Children | 9 (40.9%) | 13 (59.1%) |
| 5 or more Children | 0 (0.0%) | 0 (0.0%) |
| Total | 256 (92.7%) | 20 (7.2%) |
Income Below Poverty Among Single-Parent Households in Adrian
According to the poverty data in Adrian, 5.1% or 3 single-father households and 24.6% or 33 single-mother households are living below the poverty line. Among single-father households, those with 1 or 2 children have the highest poverty rate, with 3 households (6.8%) experiencing poverty. Likewise, among single-mother households, those with 5 or more children have the highest poverty rate, with 14 households (100.0%) falling below the poverty line.
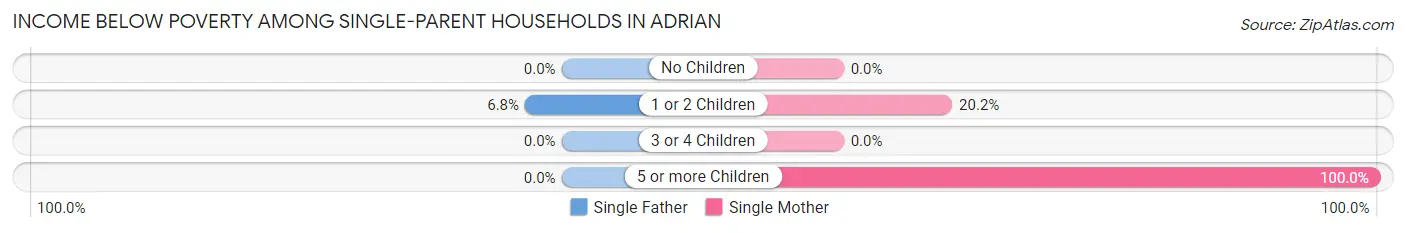
| Children | Single Father | Single Mother |
| No Children | 0 (0.0%) | 0 (0.0%) |
| 1 or 2 Children | 3 (6.8%) | 19 (20.2%) |
| 3 or 4 Children | 0 (0.0%) | 0 (0.0%) |
| 5 or more Children | 0 (0.0%) | 14 (100.0%) |
| Total | 3 (5.1%) | 33 (24.6%) |
Income Below Poverty Among Married-Couple vs Single-Parent Households in Adrian
The poverty data for Adrian shows that 20 of the married-couple family households (7.2%) and 36 of the single-parent households (18.6%) are living below the poverty level. Within the married-couple family households, those with 3 or 4 children have the highest poverty rate, with 13 households (59.1%) falling below the poverty line. Among the single-parent households, those with 5 or more children have the highest poverty rate, with 14 household (100.0%) living below poverty.
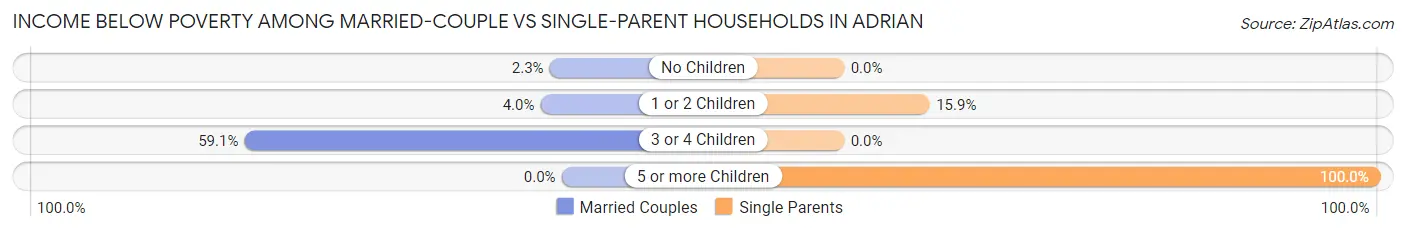
| Children | Married-Couple Families | Single-Parent Households |
| No Children | 4 (2.2%) | 0 (0.0%) |
| 1 or 2 Children | 3 (4.0%) | 22 (15.9%) |
| 3 or 4 Children | 13 (59.1%) | 0 (0.0%) |
| 5 or more Children | 0 (0.0%) | 14 (100.0%) |
| Total | 20 (7.2%) | 36 (18.6%) |
Race in Adrian
The most populous races in Adrian are White / Caucasian (1,819 | 90.0%), Two or more Races (104 | 5.1%), and Black / African American (88 | 4.3%).
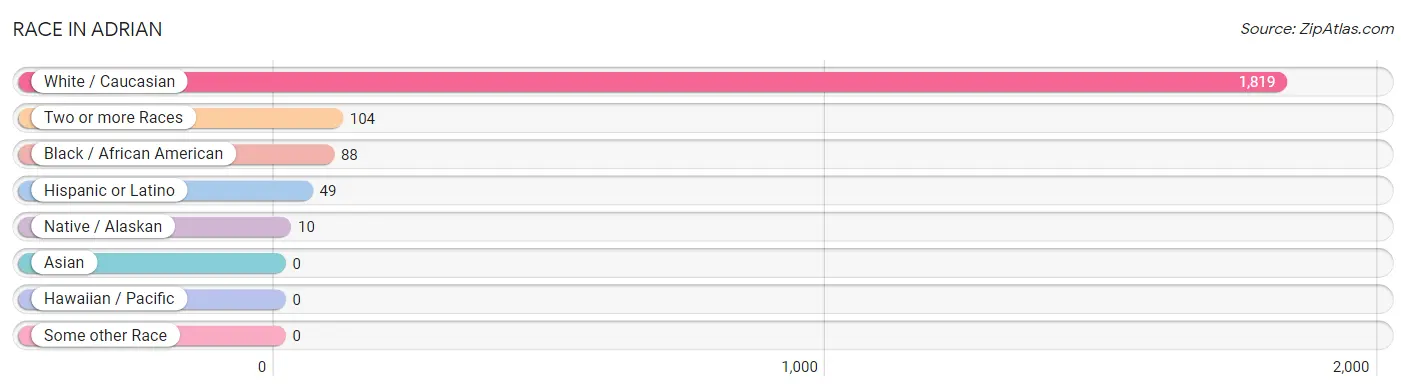
| Race | # Population | % Population |
| Asian | 0 | 0.0% |
| Black / African American | 88 | 4.3% |
| Hawaiian / Pacific | 0 | 0.0% |
| Hispanic or Latino | 49 | 2.4% |
| Native / Alaskan | 10 | 0.5% |
| White / Caucasian | 1,819 | 90.0% |
| Two or more Races | 104 | 5.1% |
| Some other Race | 0 | 0.0% |
| Total | 2,021 | 100.0% |
Ancestry in Adrian
The most populous ancestries reported in Adrian are German (393 | 19.5%), English (341 | 16.9%), American (201 | 10.0%), Irish (153 | 7.6%), and Dutch (93 | 4.6%), together accounting for 58.4% of all Adrian residents.
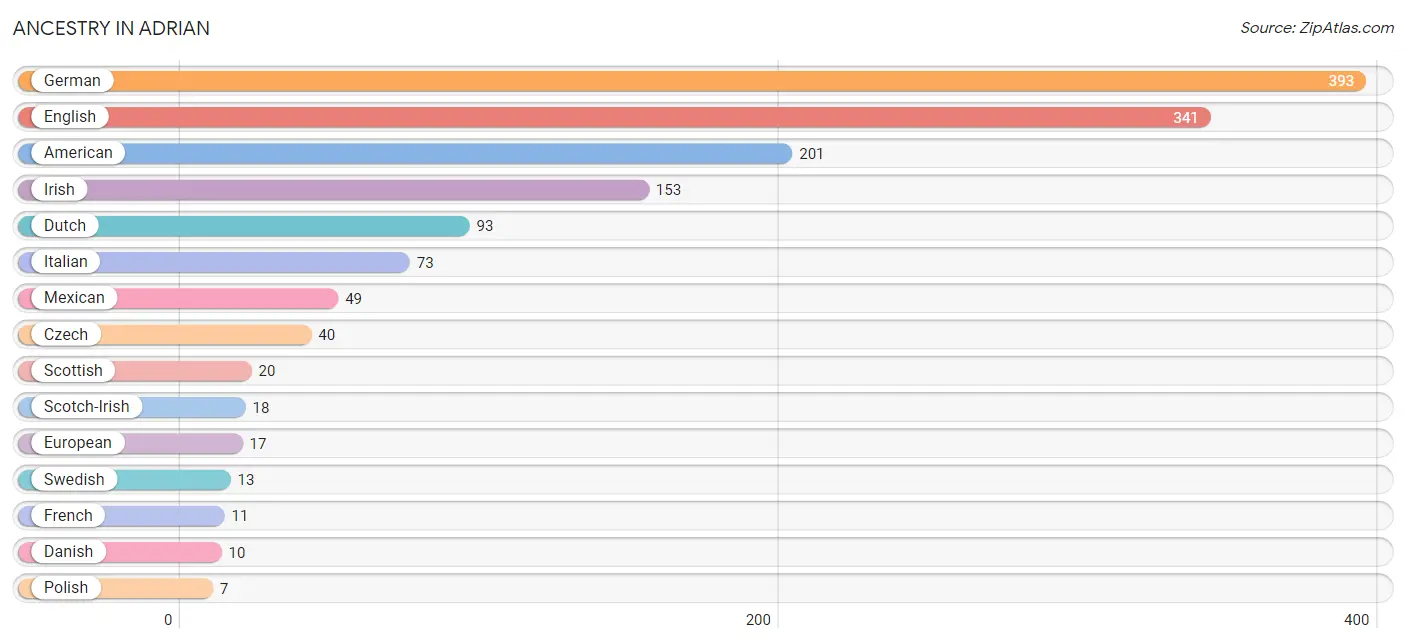
| Ancestry | # Population | % Population |
| American | 201 | 10.0% |
| Bhutanese | 2 | 0.1% |
| British | 4 | 0.2% |
| Czech | 40 | 2.0% |
| Danish | 10 | 0.5% |
| Dutch | 93 | 4.6% |
| English | 341 | 16.9% |
| European | 17 | 0.8% |
| French | 11 | 0.5% |
| German | 393 | 19.5% |
| Irish | 153 | 7.6% |
| Italian | 73 | 3.6% |
| Mexican | 49 | 2.4% |
| Norwegian | 2 | 0.1% |
| Polish | 7 | 0.4% |
| Russian | 4 | 0.2% |
| Scotch-Irish | 18 | 0.9% |
| Scottish | 20 | 1.0% |
| Sioux | 7 | 0.4% |
| Swedish | 13 | 0.6% |
| Swiss | 1 | 0.1% |
| Welsh | 2 | 0.1% | View All 22 Rows |
Immigrants in Adrian

| Immigration Origin | # Population | % Population | View All 0 Rows |
Sex and Age in Adrian
Sex and Age in Adrian
The most populous age groups in Adrian are 55 to 59 Years (124 | 13.8%) for men and 10 to 14 Years (128 | 11.4%) for women.
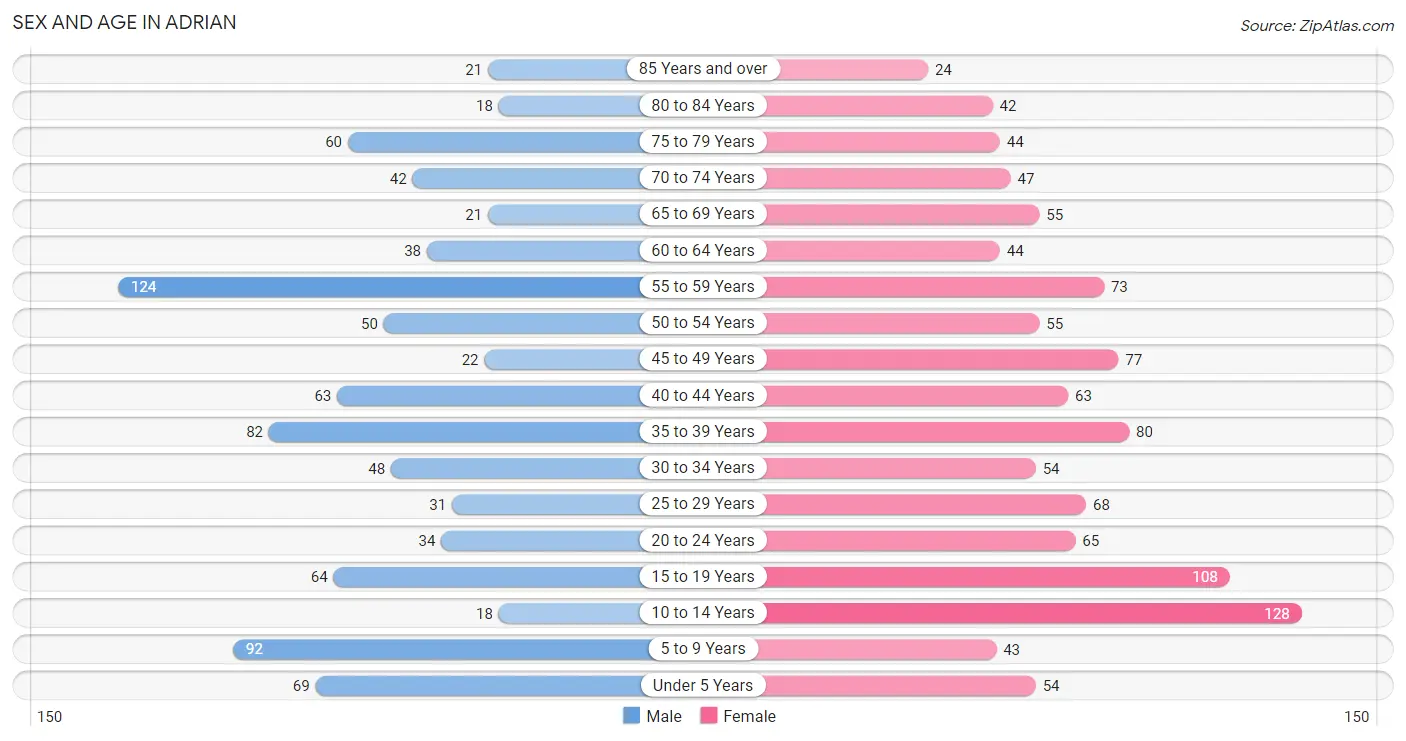
| Age Bracket | Male | Female |
| Under 5 Years | 69 (7.7%) | 54 (4.8%) |
| 5 to 9 Years | 92 (10.3%) | 43 (3.8%) |
| 10 to 14 Years | 18 (2.0%) | 128 (11.4%) |
| 15 to 19 Years | 64 (7.1%) | 108 (9.6%) |
| 20 to 24 Years | 34 (3.8%) | 65 (5.8%) |
| 25 to 29 Years | 31 (3.5%) | 68 (6.0%) |
| 30 to 34 Years | 48 (5.3%) | 54 (4.8%) |
| 35 to 39 Years | 82 (9.1%) | 80 (7.1%) |
| 40 to 44 Years | 63 (7.0%) | 63 (5.6%) |
| 45 to 49 Years | 22 (2.5%) | 77 (6.9%) |
| 50 to 54 Years | 50 (5.6%) | 55 (4.9%) |
| 55 to 59 Years | 124 (13.8%) | 73 (6.5%) |
| 60 to 64 Years | 38 (4.2%) | 44 (3.9%) |
| 65 to 69 Years | 21 (2.3%) | 55 (4.9%) |
| 70 to 74 Years | 42 (4.7%) | 47 (4.2%) |
| 75 to 79 Years | 60 (6.7%) | 44 (3.9%) |
| 80 to 84 Years | 18 (2.0%) | 42 (3.7%) |
| 85 Years and over | 21 (2.3%) | 24 (2.1%) |
| Total | 897 (100.0%) | 1,124 (100.0%) |
Families and Households in Adrian
Median Family Size in Adrian
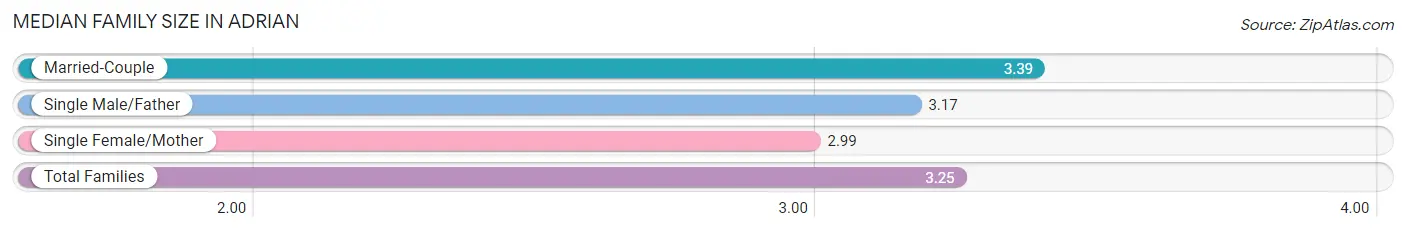
The median family size in Adrian is 3.25 persons per family, with married-couple families (276 | 58.9%) accounting for the largest median family size of 3.39 persons per family. On the other hand, single female/mother families (134 | 28.6%) represent the smallest median family size with 2.99 persons per family.
| Family Type | # Families | Family Size |
| Married-Couple | 276 (58.9%) | 3.39 |
| Single Male/Father | 59 (12.6%) | 3.17 |
| Single Female/Mother | 134 (28.6%) | 2.99 |
| Total Families | 469 (100.0%) | 3.25 |
Median Household Size in Adrian
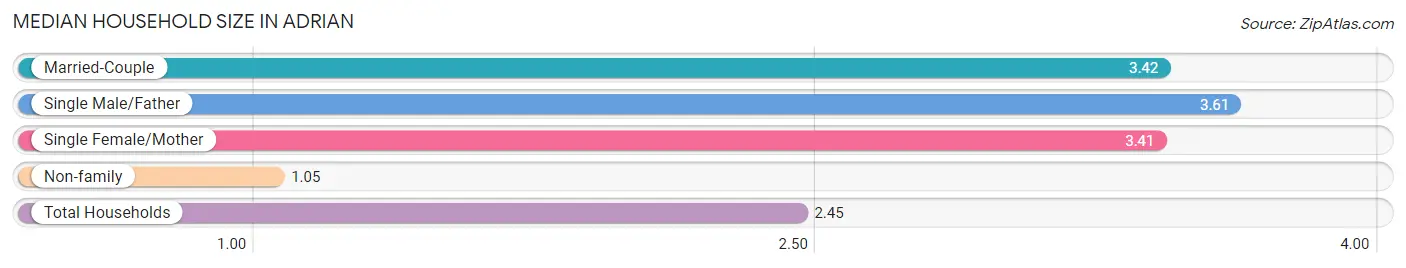
The median household size in Adrian is 2.45 persons per household, with single male/father households (59 | 7.4%) accounting for the largest median household size of 3.61 persons per household. non-family households (329 | 41.2%) represent the smallest median household size with 1.05 persons per household.
| Household Type | # Households | Household Size |
| Married-Couple | 276 (34.6%) | 3.42 |
| Single Male/Father | 59 (7.4%) | 3.61 |
| Single Female/Mother | 134 (16.8%) | 3.41 |
| Non-family | 329 (41.2%) | 1.05 |
| Total Households | 798 (100.0%) | 2.45 |
Household Size by Marriage Status in Adrian
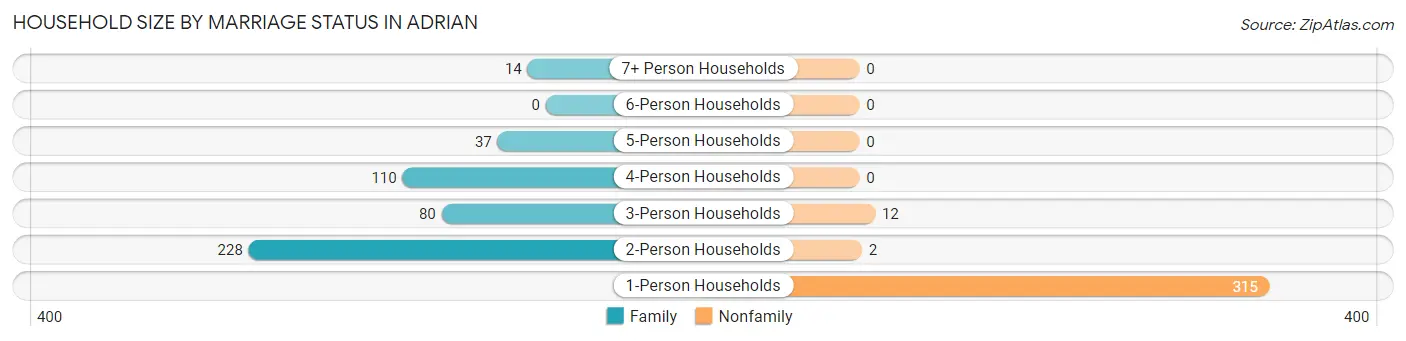
Out of a total of 798 households in Adrian, 469 (58.8%) are family households, while 329 (41.2%) are nonfamily households. The most numerous type of family households are 2-person households, comprising 228, and the most common type of nonfamily households are 1-person households, comprising 315.
| Household Size | Family Households | Nonfamily Households |
| 1-Person Households | - | 315 (39.5%) |
| 2-Person Households | 228 (28.6%) | 2 (0.3%) |
| 3-Person Households | 80 (10.0%) | 12 (1.5%) |
| 4-Person Households | 110 (13.8%) | 0 (0.0%) |
| 5-Person Households | 37 (4.6%) | 0 (0.0%) |
| 6-Person Households | 0 (0.0%) | 0 (0.0%) |
| 7+ Person Households | 14 (1.8%) | 0 (0.0%) |
| Total | 469 (58.8%) | 329 (41.2%) |
Female Fertility in Adrian
Fertility by Age in Adrian
Average fertility rate in Adrian is 43.0 births per 1,000 women. Women in the age bracket of 20 to 34 years have the highest fertility rate with 118.0 births per 1,000 women. Women in the age bracket of 20 to 34 years acount for 100.0% of all women with births.
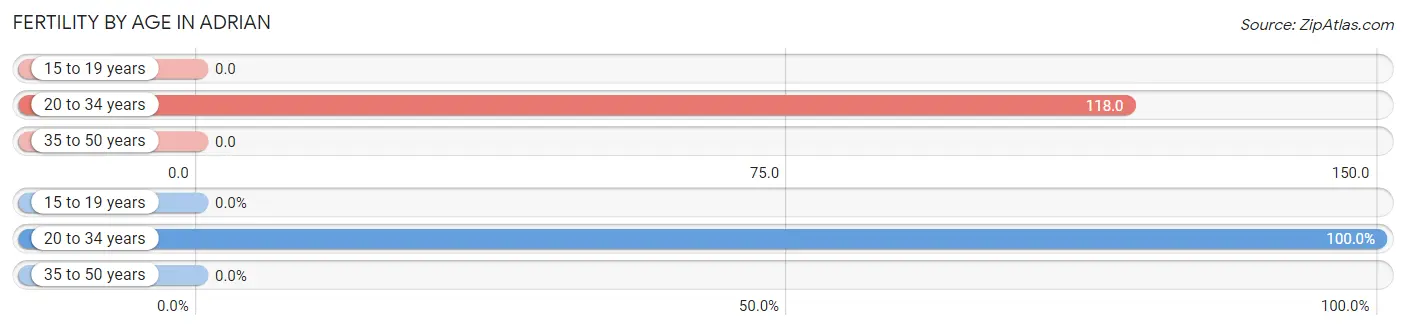
| Age Bracket | Women with Births | Births / 1,000 Women |
| 15 to 19 years | 0 (0.0%) | 0.0 |
| 20 to 34 years | 22 (100.0%) | 118.0 |
| 35 to 50 years | 0 (0.0%) | 0.0 |
| Total | 22 (100.0%) | 43.0 |
Fertility by Age by Marriage Status in Adrian
22.7% of women with births (22) in Adrian are married. The highest percentage of unmarried women with births falls into 20 to 34 years age bracket with 77.3% of them unmarried at the time of birth, while the lowest percentage of unmarried women with births belong to 20 to 34 years age bracket with 77.3% of them unmarried.
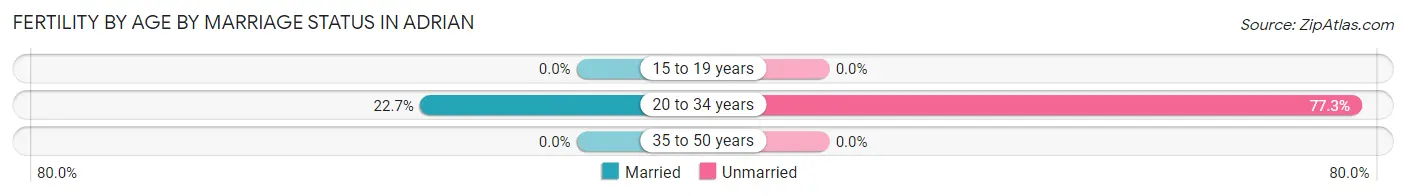
| Age Bracket | Married | Unmarried |
| 15 to 19 years | 0 (0.0%) | 0 (0.0%) |
| 20 to 34 years | 5 (22.7%) | 17 (77.3%) |
| 35 to 50 years | 0 (0.0%) | 0 (0.0%) |
| Total | 5 (22.7%) | 17 (77.3%) |
Fertility by Education in Adrian
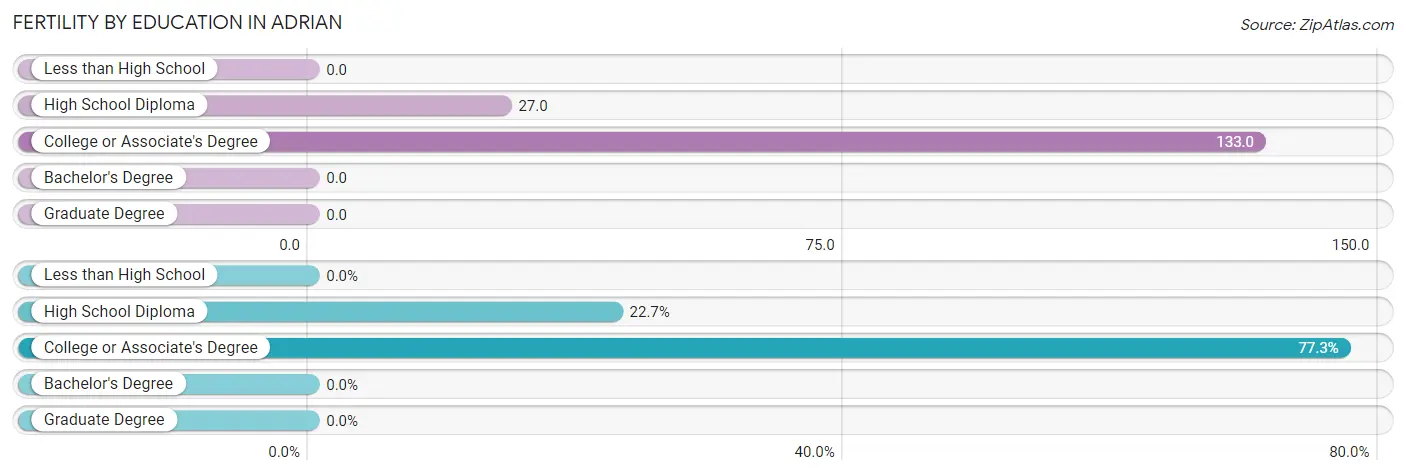
| Educational Attainment | Women with Births | Births / 1,000 Women |
| Less than High School | 0 (0.0%) | 0.0 |
| High School Diploma | 5 (22.7%) | 27.0 |
| College or Associate's Degree | 17 (77.3%) | 133.0 |
| Bachelor's Degree | 0 (0.0%) | 0.0 |
| Graduate Degree | 0 (0.0%) | 0.0 |
| Total | 22 (100.0%) | 43.0 |
Fertility by Education by Marriage Status in Adrian
77.3% of women with births in Adrian are unmarried. Women with the educational attainment of high school diploma are most likely to be married with 100.0% of them married at childbirth, while women with the educational attainment of college or associate's degree are least likely to be married with 100.0% of them unmarried at childbirth.
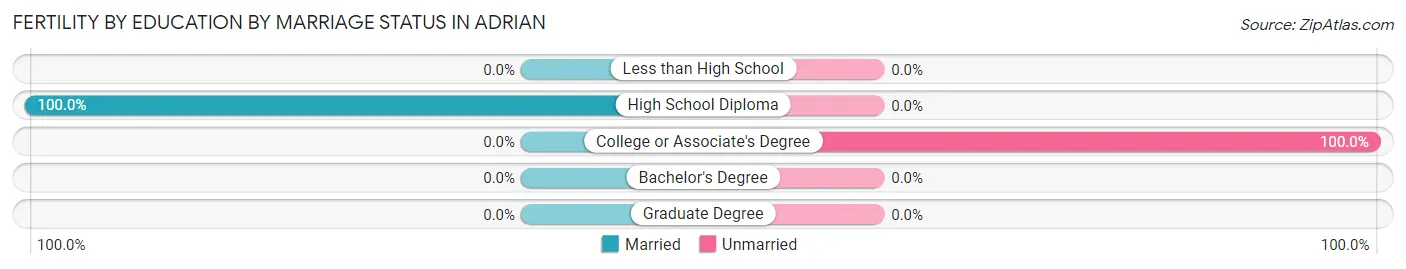
| Educational Attainment | Married | Unmarried |
| Less than High School | 0 (0.0%) | 0 (0.0%) |
| High School Diploma | 5 (100.0%) | 0 (0.0%) |
| College or Associate's Degree | 0 (0.0%) | 17 (100.0%) |
| Bachelor's Degree | 0 (0.0%) | 0 (0.0%) |
| Graduate Degree | 0 (0.0%) | 0 (0.0%) |
| Total | 5 (22.7%) | 17 (77.3%) |
Employment Characteristics in Adrian
Employment by Class of Employer in Adrian
Among the 830 employed individuals in Adrian, private company employees (580 | 69.9%), not-for-profit organizations (81 | 9.8%), and local government employees (73 | 8.8%) make up the most common classes of employment.
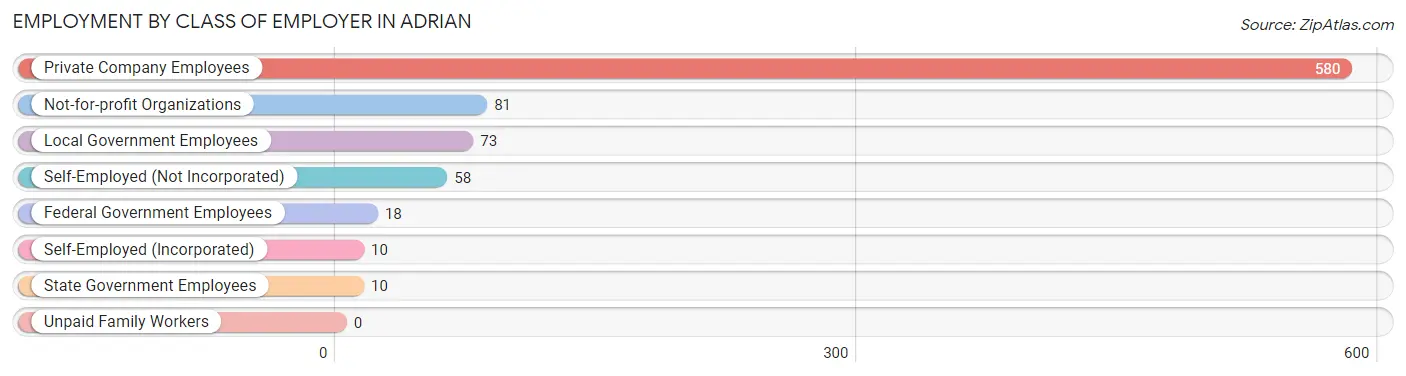
| Employer Class | # Employees | % Employees |
| Private Company Employees | 580 | 69.9% |
| Self-Employed (Incorporated) | 10 | 1.2% |
| Self-Employed (Not Incorporated) | 58 | 7.0% |
| Not-for-profit Organizations | 81 | 9.8% |
| Local Government Employees | 73 | 8.8% |
| State Government Employees | 10 | 1.2% |
| Federal Government Employees | 18 | 2.2% |
| Unpaid Family Workers | 0 | 0.0% |
| Total | 830 | 100.0% |
Employment Status by Age in Adrian
According to the labor force statistics for Adrian, out of the total population over 16 years of age (1,575), 61.5% or 969 individuals are in the labor force, with 11.3% or 109 of them unemployed. The age group with the highest labor force participation rate is 20 to 24 years, with 97.0% or 96 individuals in the labor force. Within the labor force, the 16 to 19 years age range has the highest percentage of unemployed individuals, with 27.7% or 18 of them being unemployed.
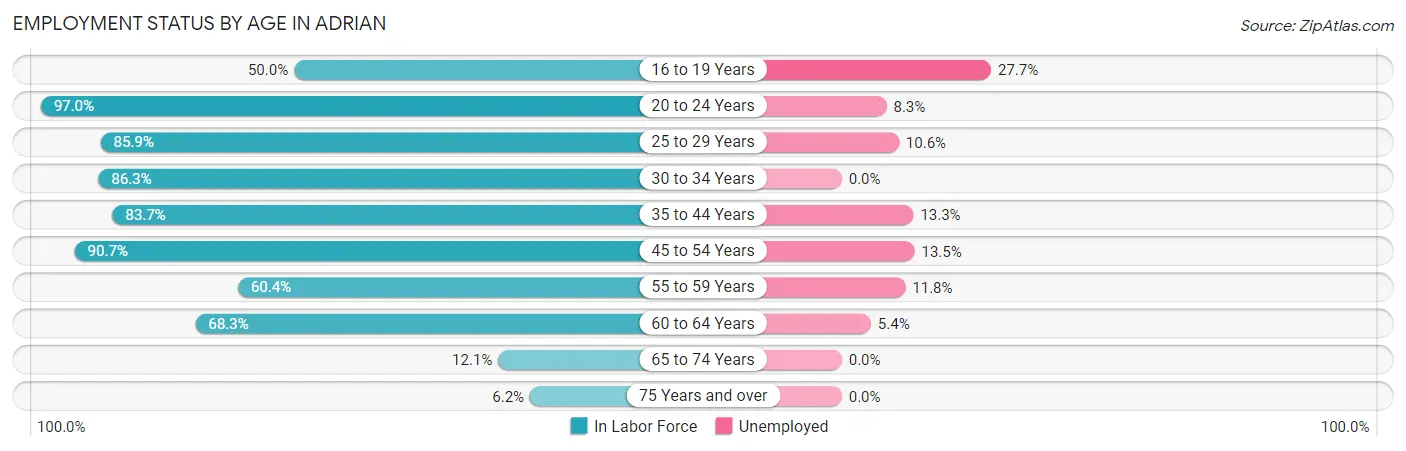
| Age Bracket | In Labor Force | Unemployed |
| 16 to 19 Years | 65 (50.0%) | 18 (27.7%) |
| 20 to 24 Years | 96 (97.0%) | 8 (8.3%) |
| 25 to 29 Years | 85 (85.9%) | 9 (10.6%) |
| 30 to 34 Years | 88 (86.3%) | 0 (0.0%) |
| 35 to 44 Years | 241 (83.7%) | 32 (13.3%) |
| 45 to 54 Years | 185 (90.7%) | 25 (13.5%) |
| 55 to 59 Years | 119 (60.4%) | 14 (11.8%) |
| 60 to 64 Years | 56 (68.3%) | 3 (5.4%) |
| 65 to 74 Years | 20 (12.1%) | 0 (0.0%) |
| 75 Years and over | 13 (6.2%) | 0 (0.0%) |
| Total | 969 (61.5%) | 109 (11.3%) |
Employment Status by Educational Attainment in Adrian
According to labor force statistics for Adrian, 79.6% of individuals (774) out of the total population between 25 and 64 years of age (972) are in the labor force, with 10.7% or 83 of them being unemployed. The group with the highest labor force participation rate are those with the educational attainment of college / associate degree, with 87.7% or 242 individuals in the labor force. Within the labor force, individuals with high school diploma education have the highest percentage of unemployment, with 19.7% or 66 of them being unemployed.
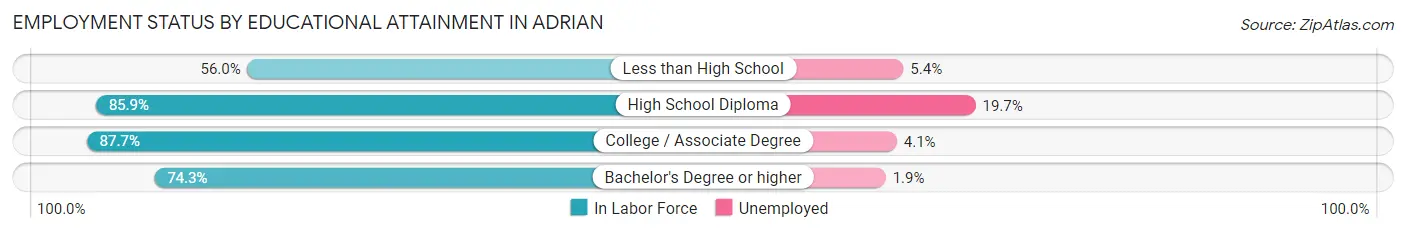
| Educational Attainment | In Labor Force | Unemployed |
| Less than High School | 93 (56.0%) | 9 (5.4%) |
| High School Diploma | 335 (85.9%) | 77 (19.7%) |
| College / Associate Degree | 242 (87.7%) | 11 (4.1%) |
| Bachelor's Degree or higher | 104 (74.3%) | 3 (1.9%) |
| Total | 774 (79.6%) | 104 (10.7%) |
Employment Occupations by Sex in Adrian
Management, Business, Science and Arts Occupations
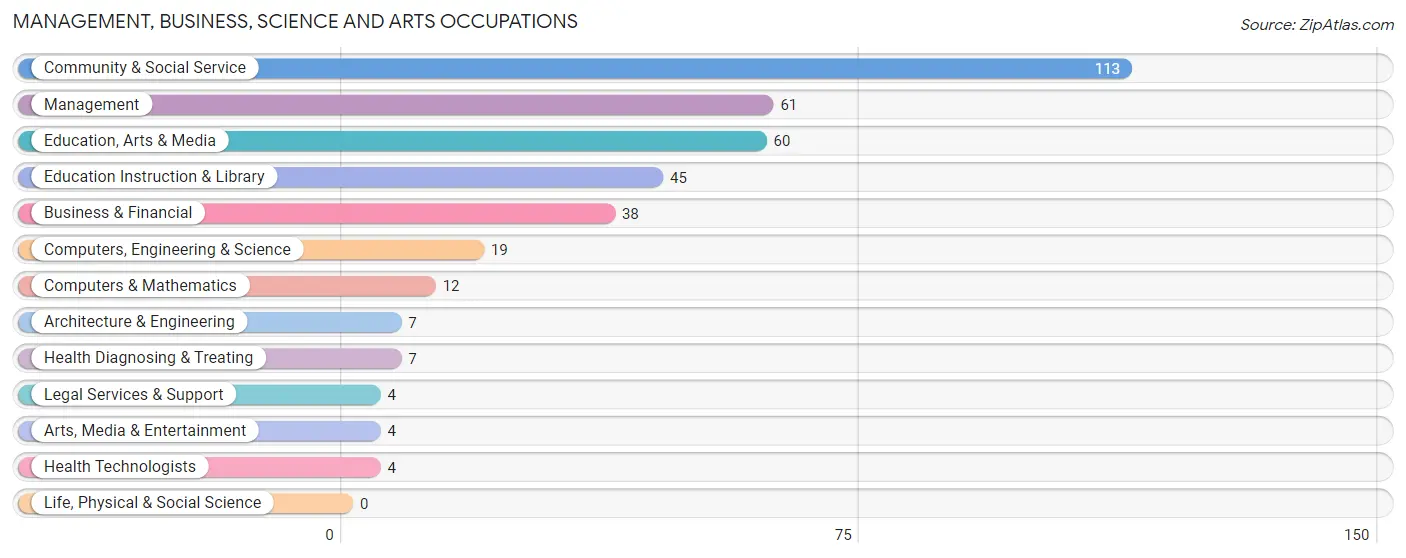
The most common Management, Business, Science and Arts occupations in Adrian are Community & Social Service (113 | 13.2%), Management (61 | 7.1%), Education, Arts & Media (60 | 7.0%), Education Instruction & Library (45 | 5.2%), and Business & Financial (38 | 4.4%).
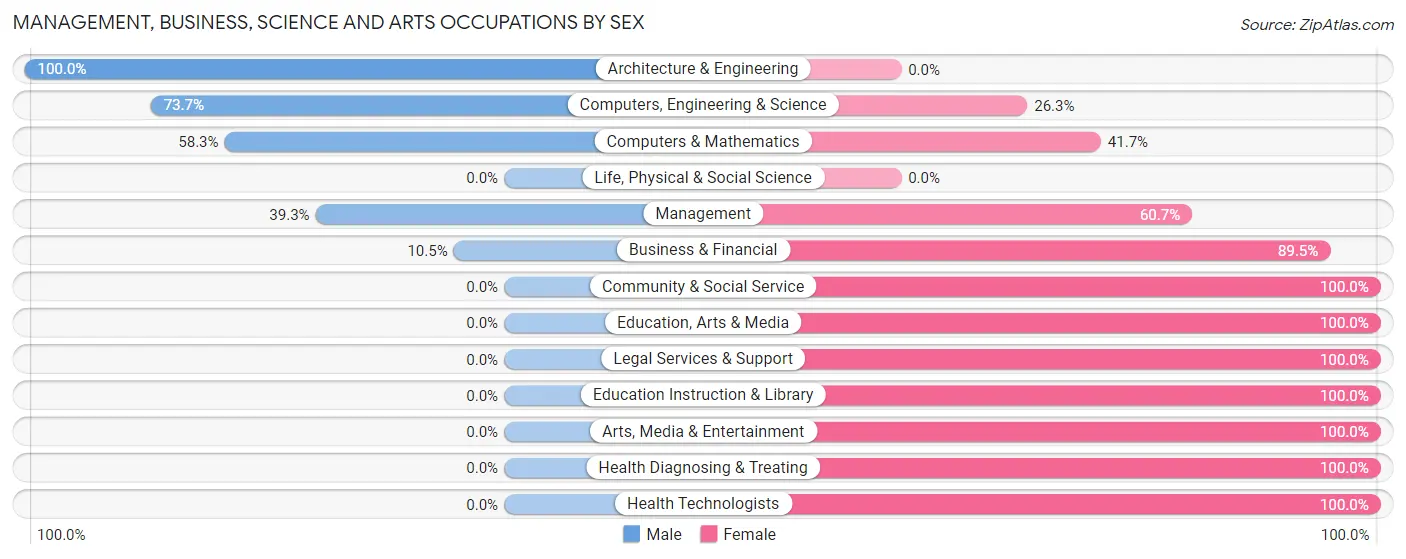
Management, Business, Science and Arts Occupations by Sex
Within the Management, Business, Science and Arts occupations in Adrian, the most male-oriented occupations are Architecture & Engineering (100.0%), Computers, Engineering & Science (73.7%), and Computers & Mathematics (58.3%), while the most female-oriented occupations are Community & Social Service (100.0%), Education, Arts & Media (100.0%), and Legal Services & Support (100.0%).
| Occupation | Male | Female |
| Management | 24 (39.3%) | 37 (60.7%) |
| Business & Financial | 4 (10.5%) | 34 (89.5%) |
| Computers, Engineering & Science | 14 (73.7%) | 5 (26.3%) |
| Computers & Mathematics | 7 (58.3%) | 5 (41.7%) |
| Architecture & Engineering | 7 (100.0%) | 0 (0.0%) |
| Life, Physical & Social Science | 0 (0.0%) | 0 (0.0%) |
| Community & Social Service | 0 (0.0%) | 113 (100.0%) |
| Education, Arts & Media | 0 (0.0%) | 60 (100.0%) |
| Legal Services & Support | 0 (0.0%) | 4 (100.0%) |
| Education Instruction & Library | 0 (0.0%) | 45 (100.0%) |
| Arts, Media & Entertainment | 0 (0.0%) | 4 (100.0%) |
| Health Diagnosing & Treating | 0 (0.0%) | 7 (100.0%) |
| Health Technologists | 0 (0.0%) | 4 (100.0%) |
| Total (Category) | 42 (17.6%) | 196 (82.4%) |
| Total (Overall) | 357 (41.6%) | 502 (58.4%) |
Services Occupations
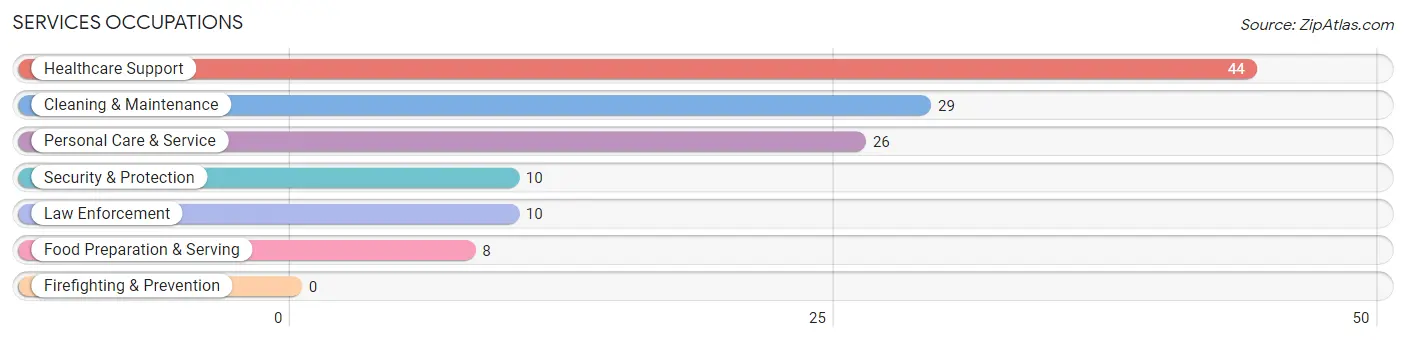
The most common Services occupations in Adrian are Healthcare Support (44 | 5.1%), Cleaning & Maintenance (29 | 3.4%), Personal Care & Service (26 | 3.0%), Security & Protection (10 | 1.2%), and Law Enforcement (10 | 1.2%).
Services Occupations by Sex
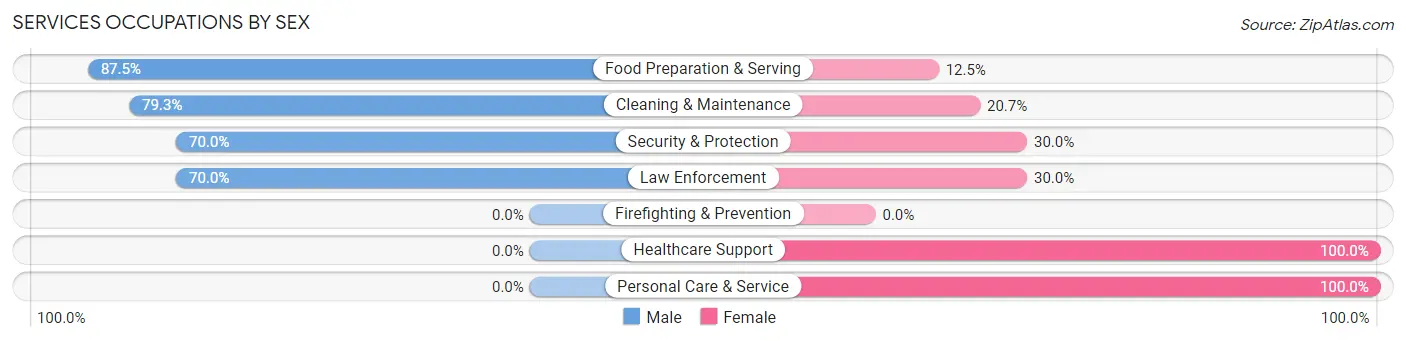
Within the Services occupations in Adrian, the most male-oriented occupations are Food Preparation & Serving (87.5%), Cleaning & Maintenance (79.3%), and Security & Protection (70.0%), while the most female-oriented occupations are Healthcare Support (100.0%), Personal Care & Service (100.0%), and Security & Protection (30.0%).
| Occupation | Male | Female |
| Healthcare Support | 0 (0.0%) | 44 (100.0%) |
| Security & Protection | 7 (70.0%) | 3 (30.0%) |
| Firefighting & Prevention | 0 (0.0%) | 0 (0.0%) |
| Law Enforcement | 7 (70.0%) | 3 (30.0%) |
| Food Preparation & Serving | 7 (87.5%) | 1 (12.5%) |
| Cleaning & Maintenance | 23 (79.3%) | 6 (20.7%) |
| Personal Care & Service | 0 (0.0%) | 26 (100.0%) |
| Total (Category) | 37 (31.6%) | 80 (68.4%) |
| Total (Overall) | 357 (41.6%) | 502 (58.4%) |
Sales and Office Occupations
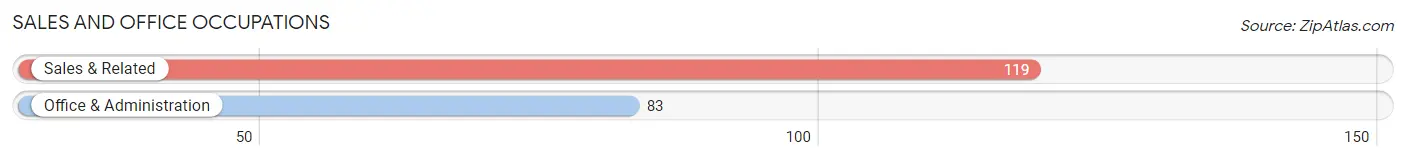
The most common Sales and Office occupations in Adrian are Sales & Related (119 | 13.9%), and Office & Administration (83 | 9.7%).
Sales and Office Occupations by Sex
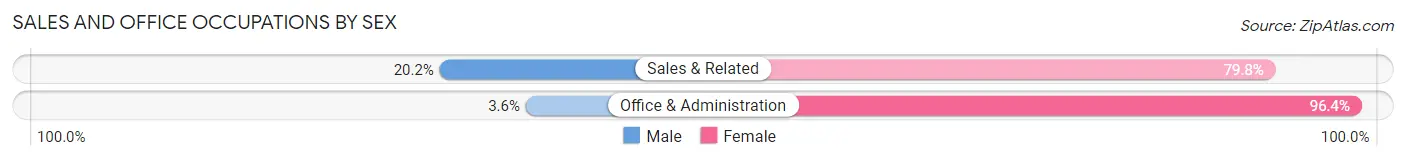
| Occupation | Male | Female |
| Sales & Related | 24 (20.2%) | 95 (79.8%) |
| Office & Administration | 3 (3.6%) | 80 (96.4%) |
| Total (Category) | 27 (13.4%) | 175 (86.6%) |
| Total (Overall) | 357 (41.6%) | 502 (58.4%) |
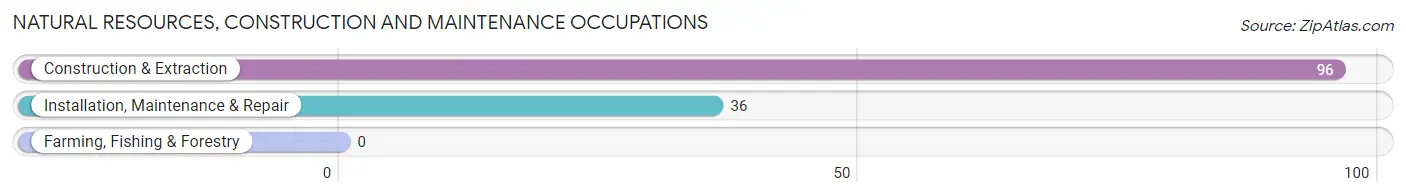
Natural Resources, Construction and Maintenance Occupations
The most common Natural Resources, Construction and Maintenance occupations in Adrian are Construction & Extraction (96 | 11.2%), and Installation, Maintenance & Repair (36 | 4.2%).
Natural Resources, Construction and Maintenance Occupations by Sex
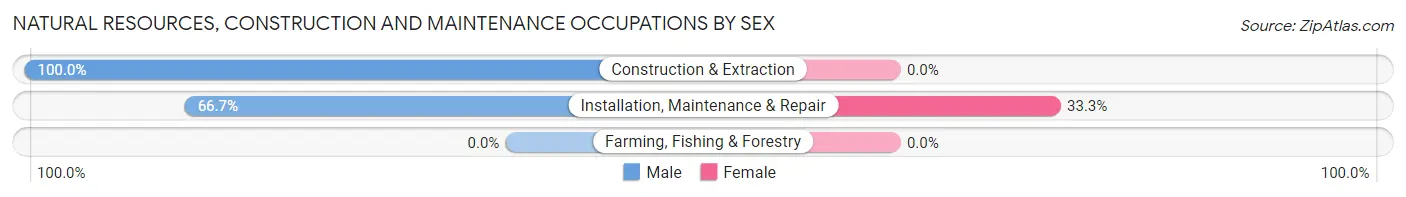
| Occupation | Male | Female |
| Farming, Fishing & Forestry | 0 (0.0%) | 0 (0.0%) |
| Construction & Extraction | 96 (100.0%) | 0 (0.0%) |
| Installation, Maintenance & Repair | 24 (66.7%) | 12 (33.3%) |
| Total (Category) | 120 (90.9%) | 12 (9.1%) |
| Total (Overall) | 357 (41.6%) | 502 (58.4%) |
Production, Transportation and Moving Occupations
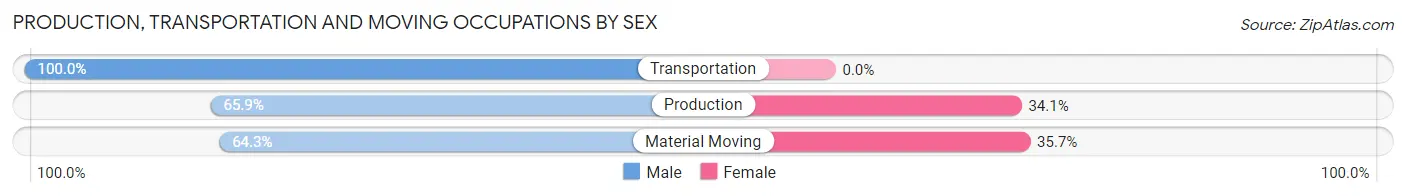
The most common Production, Transportation and Moving occupations in Adrian are Production (85 | 9.9%), Transportation (57 | 6.6%), and Material Moving (28 | 3.3%).
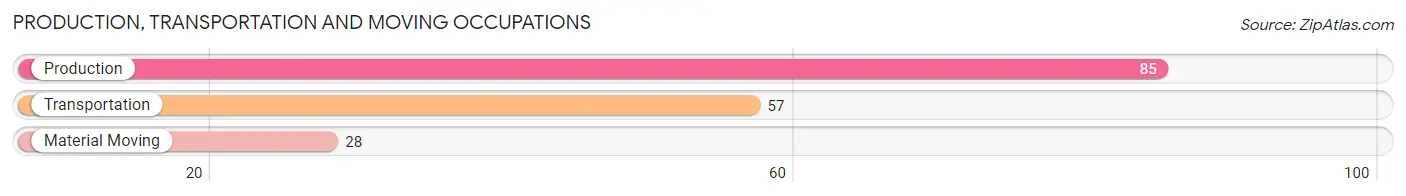
Production, Transportation and Moving Occupations by Sex
| Occupation | Male | Female |
| Production | 56 (65.9%) | 29 (34.1%) |
| Transportation | 57 (100.0%) | 0 (0.0%) |
| Material Moving | 18 (64.3%) | 10 (35.7%) |
| Total (Category) | 131 (77.1%) | 39 (22.9%) |
| Total (Overall) | 357 (41.6%) | 502 (58.4%) |
Employment Industries by Sex in Adrian
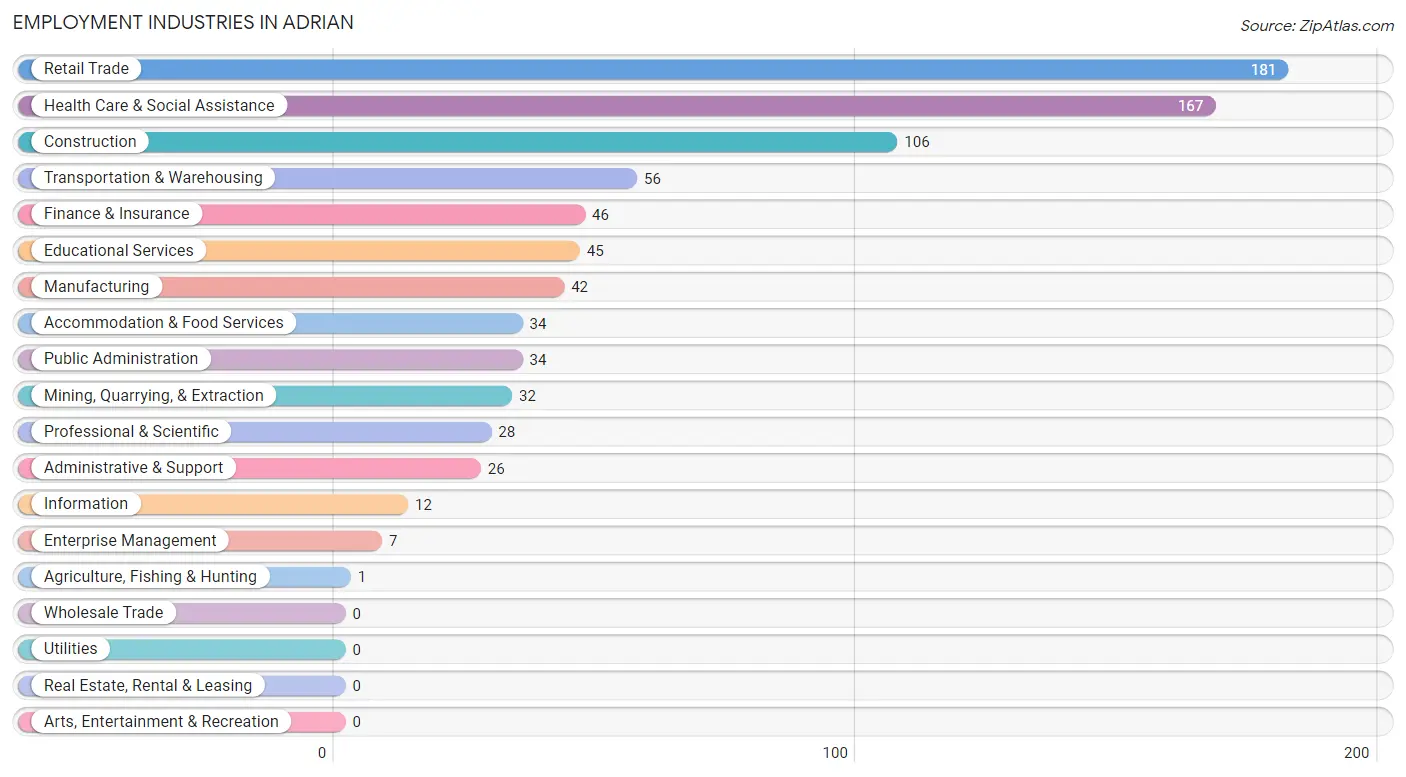
Employment Industries in Adrian
The major employment industries in Adrian include Retail Trade (181 | 21.1%), Health Care & Social Assistance (167 | 19.4%), Construction (106 | 12.3%), Transportation & Warehousing (56 | 6.5%), and Finance & Insurance (46 | 5.4%).
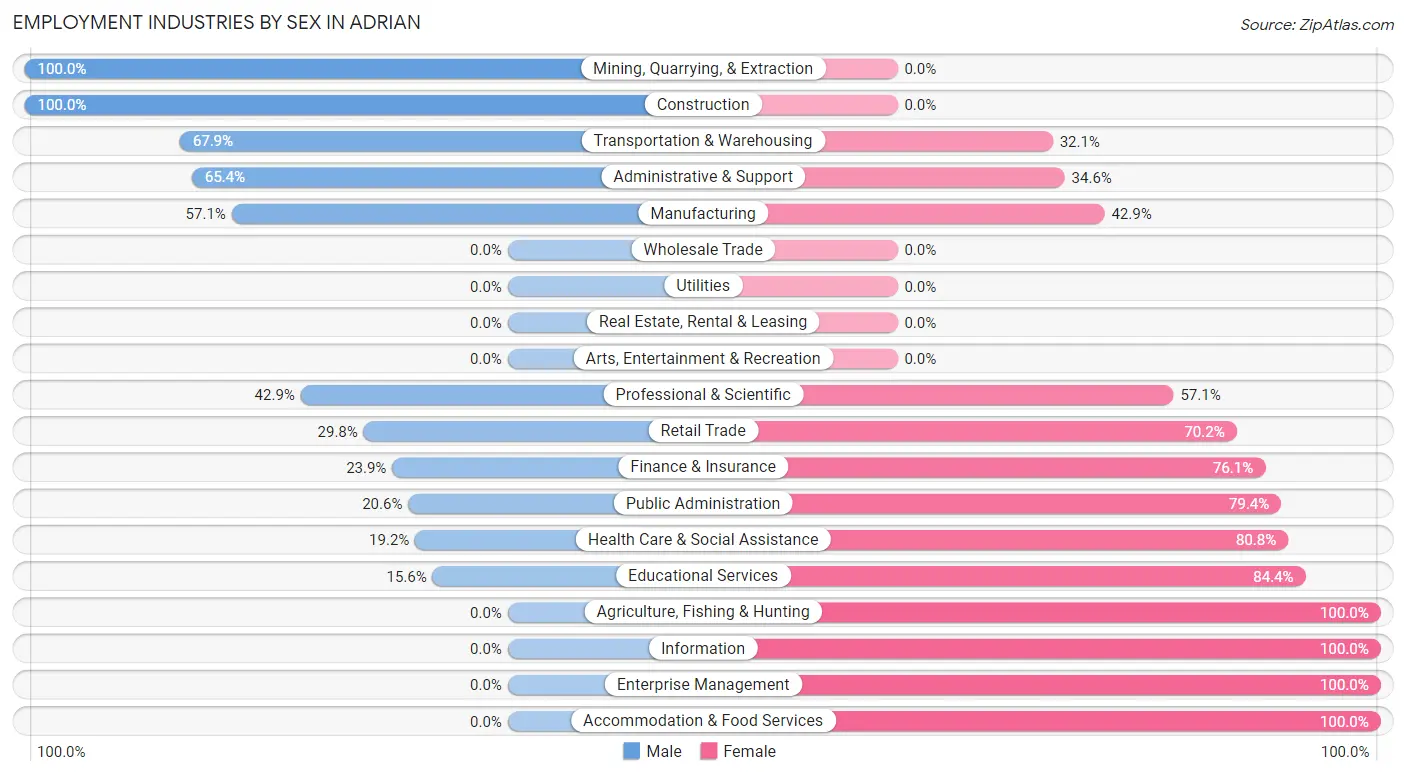
Employment Industries by Sex in Adrian
The Adrian industries that see more men than women are Mining, Quarrying, & Extraction (100.0%), Construction (100.0%), and Transportation & Warehousing (67.9%), whereas the industries that tend to have a higher number of women are Agriculture, Fishing & Hunting (100.0%), Information (100.0%), and Enterprise Management (100.0%).
| Industry | Male | Female |
| Agriculture, Fishing & Hunting | 0 (0.0%) | 1 (100.0%) |
| Mining, Quarrying, & Extraction | 32 (100.0%) | 0 (0.0%) |
| Construction | 106 (100.0%) | 0 (0.0%) |
| Manufacturing | 24 (57.1%) | 18 (42.9%) |
| Wholesale Trade | 0 (0.0%) | 0 (0.0%) |
| Retail Trade | 54 (29.8%) | 127 (70.2%) |
| Transportation & Warehousing | 38 (67.9%) | 18 (32.1%) |
| Utilities | 0 (0.0%) | 0 (0.0%) |
| Information | 0 (0.0%) | 12 (100.0%) |
| Finance & Insurance | 11 (23.9%) | 35 (76.1%) |
| Real Estate, Rental & Leasing | 0 (0.0%) | 0 (0.0%) |
| Professional & Scientific | 12 (42.9%) | 16 (57.1%) |
| Enterprise Management | 0 (0.0%) | 7 (100.0%) |
| Administrative & Support | 17 (65.4%) | 9 (34.6%) |
| Educational Services | 7 (15.6%) | 38 (84.4%) |
| Health Care & Social Assistance | 32 (19.2%) | 135 (80.8%) |
| Arts, Entertainment & Recreation | 0 (0.0%) | 0 (0.0%) |
| Accommodation & Food Services | 0 (0.0%) | 34 (100.0%) |
| Public Administration | 7 (20.6%) | 27 (79.4%) |
| Total | 357 (41.6%) | 502 (58.4%) |
Education in Adrian
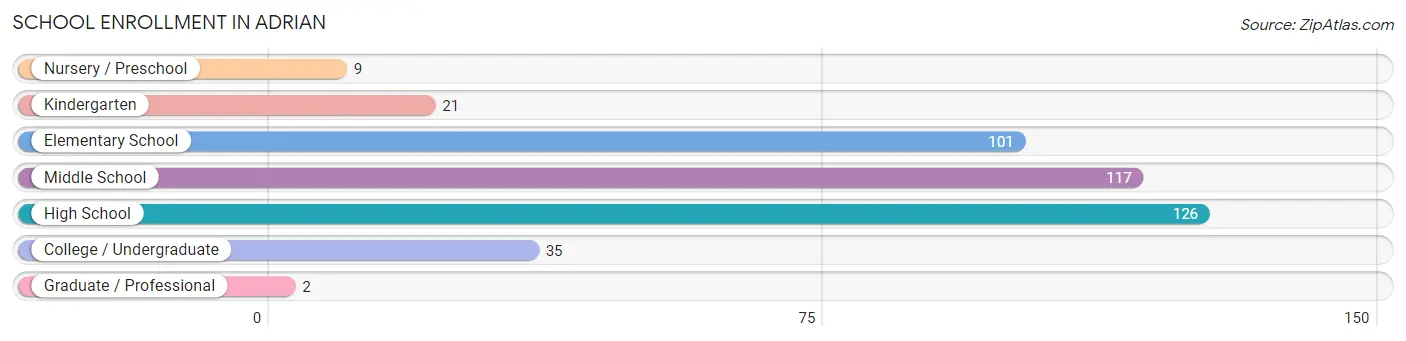
School Enrollment in Adrian
The most common levels of schooling among the 411 students in Adrian are high school (126 | 30.7%), middle school (117 | 28.5%), and elementary school (101 | 24.6%).
| School Level | # Students | % Students |
| Nursery / Preschool | 9 | 2.2% |
| Kindergarten | 21 | 5.1% |
| Elementary School | 101 | 24.6% |
| Middle School | 117 | 28.5% |
| High School | 126 | 30.7% |
| College / Undergraduate | 35 | 8.5% |
| Graduate / Professional | 2 | 0.5% |
| Total | 411 | 100.0% |
School Enrollment by Age by Funding Source in Adrian
Out of a total of 411 students who are enrolled in schools in Adrian, 12 (2.9%) attend a private institution, while the remaining 399 (97.1%) are enrolled in public schools. The age group of 18 to 19 year olds has the highest likelihood of being enrolled in private schools, with 9 (17.0% in the age bracket) enrolled. Conversely, the age group of 3 to 4 year olds has the lowest likelihood of being enrolled in a private school, with 9 (100.0% in the age bracket) attending a public institution.
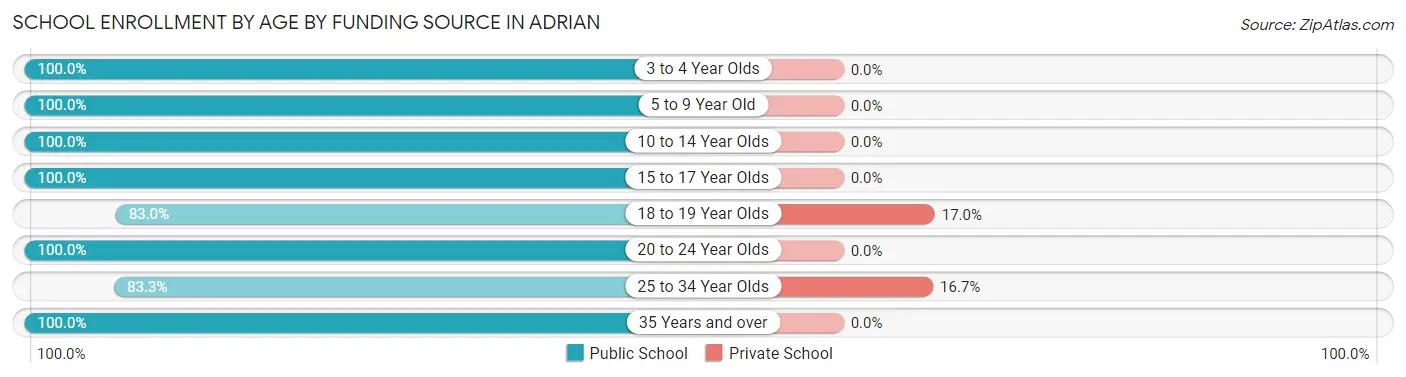
| Age Bracket | Public School | Private School |
| 3 to 4 Year Olds | 9 (100.0%) | 0 (0.0%) |
| 5 to 9 Year Old | 108 (100.0%) | 0 (0.0%) |
| 10 to 14 Year Olds | 133 (100.0%) | 0 (0.0%) |
| 15 to 17 Year Olds | 80 (100.0%) | 0 (0.0%) |
| 18 to 19 Year Olds | 44 (83.0%) | 9 (17.0%) |
| 20 to 24 Year Olds | 5 (100.0%) | 0 (0.0%) |
| 25 to 34 Year Olds | 15 (83.3%) | 3 (16.7%) |
| 35 Years and over | 5 (100.0%) | 0 (0.0%) |
| Total | 399 (97.1%) | 12 (2.9%) |
Educational Attainment by Field of Study in Adrian
Arts & humanities (64 | 29.9%), education (59 | 27.6%), business (17 | 7.9%), computers & mathematics (15 | 7.0%), and science & technology (14 | 6.5%) are the most common fields of study among 214 individuals in Adrian who have obtained a bachelor's degree or higher.
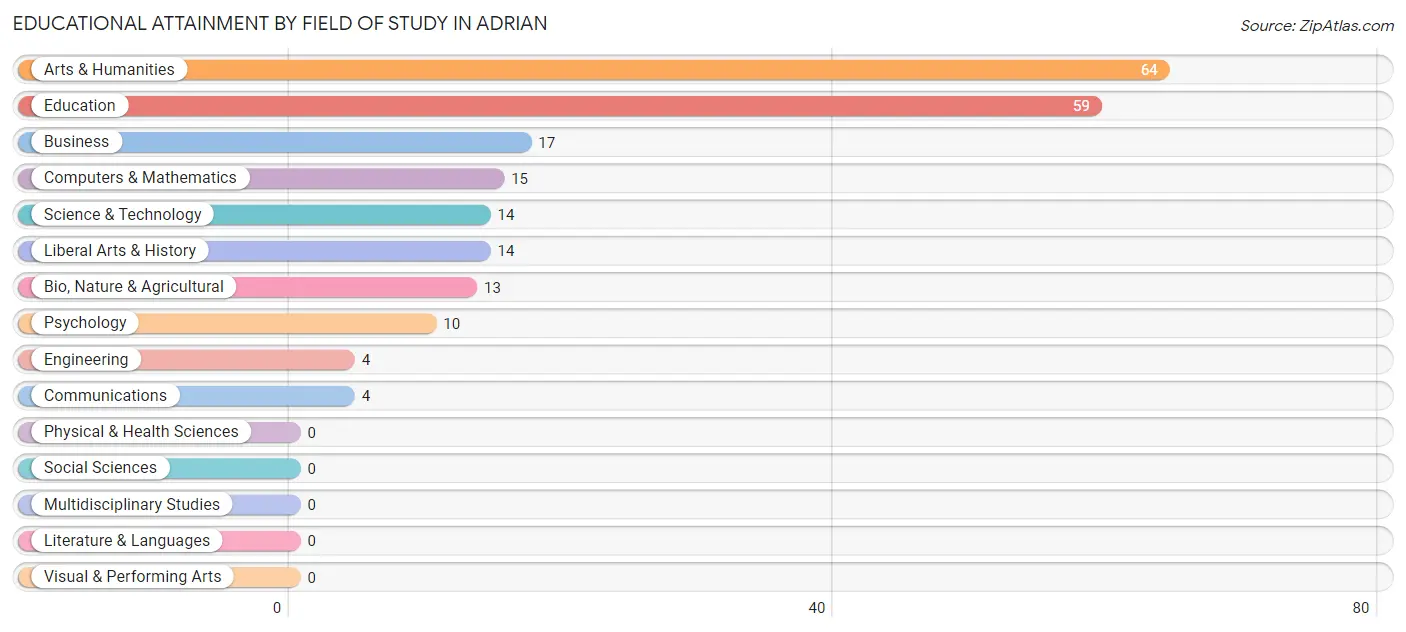
| Field of Study | # Graduates | % Graduates |
| Computers & Mathematics | 15 | 7.0% |
| Bio, Nature & Agricultural | 13 | 6.1% |
| Physical & Health Sciences | 0 | 0.0% |
| Psychology | 10 | 4.7% |
| Social Sciences | 0 | 0.0% |
| Engineering | 4 | 1.9% |
| Multidisciplinary Studies | 0 | 0.0% |
| Science & Technology | 14 | 6.5% |
| Business | 17 | 7.9% |
| Education | 59 | 27.6% |
| Literature & Languages | 0 | 0.0% |
| Liberal Arts & History | 14 | 6.5% |
| Visual & Performing Arts | 0 | 0.0% |
| Communications | 4 | 1.9% |
| Arts & Humanities | 64 | 29.9% |
| Total | 214 | 100.0% |
Transportation & Commute in Adrian
Vehicle Availability by Sex in Adrian
The most prevalent vehicle ownership categories in Adrian are males with 2 vehicles (186, accounting for 52.4%) and females with 2 vehicles (207, making up 39.4%).
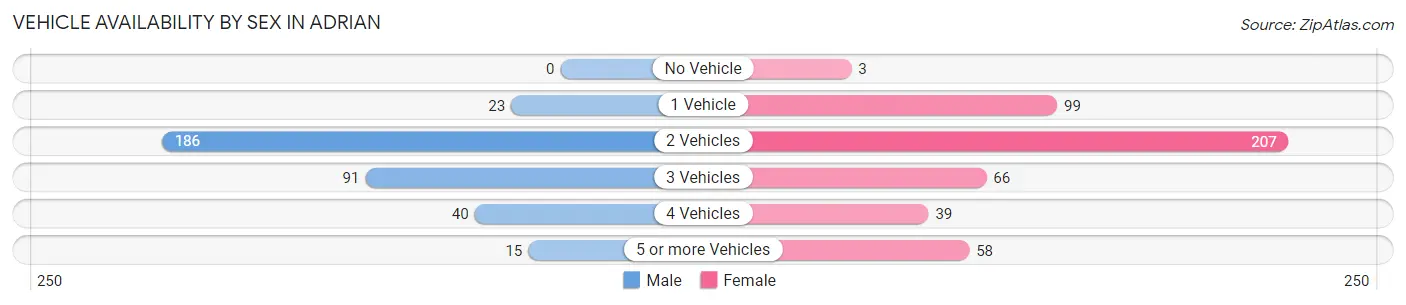
| Vehicles Available | Male | Female |
| No Vehicle | 0 (0.0%) | 3 (0.6%) |
| 1 Vehicle | 23 (6.5%) | 99 (21.0%) |
| 2 Vehicles | 186 (52.4%) | 207 (43.9%) |
| 3 Vehicles | 91 (25.6%) | 66 (14.0%) |
| 4 Vehicles | 40 (11.3%) | 39 (8.3%) |
| 5 or more Vehicles | 15 (4.2%) | 58 (12.3%) |
| Total | 355 (100.0%) | 472 (100.0%) |
Commute Time in Adrian
The most frequently occuring commute durations in Adrian are 60 to 89 minutes (119 commuters, 15.9%), 15 to 19 minutes (112 commuters, 14.9%), and 45 to 59 minutes (88 commuters, 11.7%).
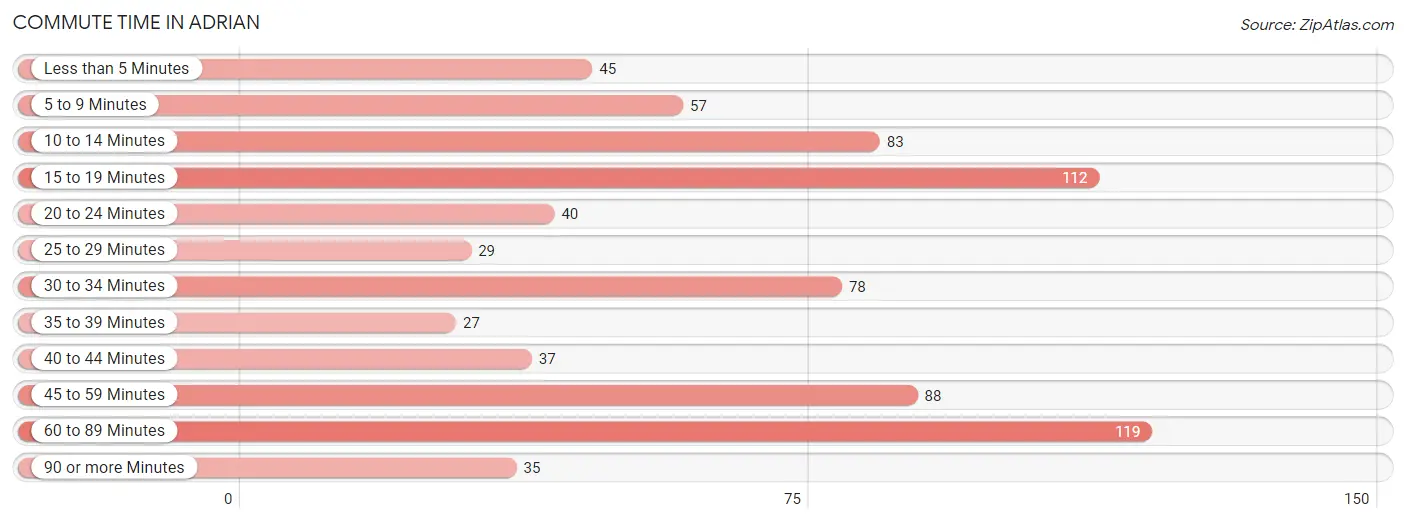
| Commute Time | # Commuters | % Commuters |
| Less than 5 Minutes | 45 | 6.0% |
| 5 to 9 Minutes | 57 | 7.6% |
| 10 to 14 Minutes | 83 | 11.1% |
| 15 to 19 Minutes | 112 | 14.9% |
| 20 to 24 Minutes | 40 | 5.3% |
| 25 to 29 Minutes | 29 | 3.9% |
| 30 to 34 Minutes | 78 | 10.4% |
| 35 to 39 Minutes | 27 | 3.6% |
| 40 to 44 Minutes | 37 | 4.9% |
| 45 to 59 Minutes | 88 | 11.7% |
| 60 to 89 Minutes | 119 | 15.9% |
| 90 or more Minutes | 35 | 4.7% |
Commute Time by Sex in Adrian
The most common commute times in Adrian are 60 to 89 minutes (104 commuters, 30.9%) for males and 15 to 19 minutes (109 commuters, 26.4%) for females.
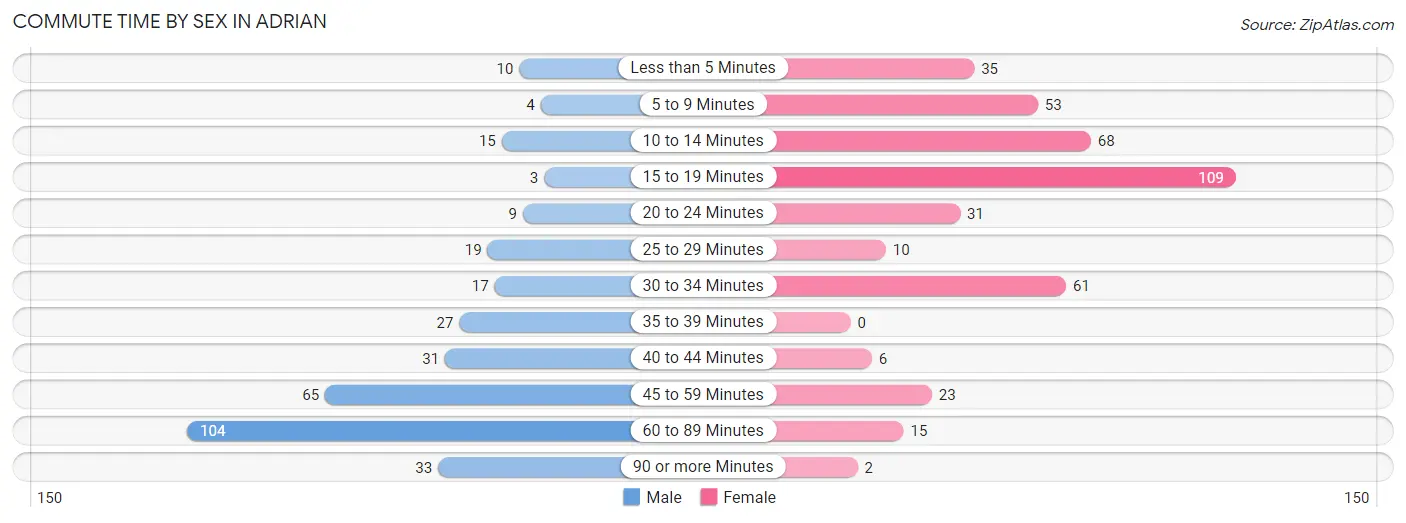
| Commute Time | Male | Female |
| Less than 5 Minutes | 10 (3.0%) | 35 (8.5%) |
| 5 to 9 Minutes | 4 (1.2%) | 53 (12.8%) |
| 10 to 14 Minutes | 15 (4.4%) | 68 (16.5%) |
| 15 to 19 Minutes | 3 (0.9%) | 109 (26.4%) |
| 20 to 24 Minutes | 9 (2.7%) | 31 (7.5%) |
| 25 to 29 Minutes | 19 (5.6%) | 10 (2.4%) |
| 30 to 34 Minutes | 17 (5.0%) | 61 (14.8%) |
| 35 to 39 Minutes | 27 (8.0%) | 0 (0.0%) |
| 40 to 44 Minutes | 31 (9.2%) | 6 (1.5%) |
| 45 to 59 Minutes | 65 (19.3%) | 23 (5.6%) |
| 60 to 89 Minutes | 104 (30.9%) | 15 (3.6%) |
| 90 or more Minutes | 33 (9.8%) | 2 (0.5%) |
Time of Departure to Work by Sex in Adrian
The most frequent times of departure to work in Adrian are 12:00 AM to 4:59 AM (107, 31.8%) for males and 8:00 AM to 8:29 AM (114, 27.6%) for females.
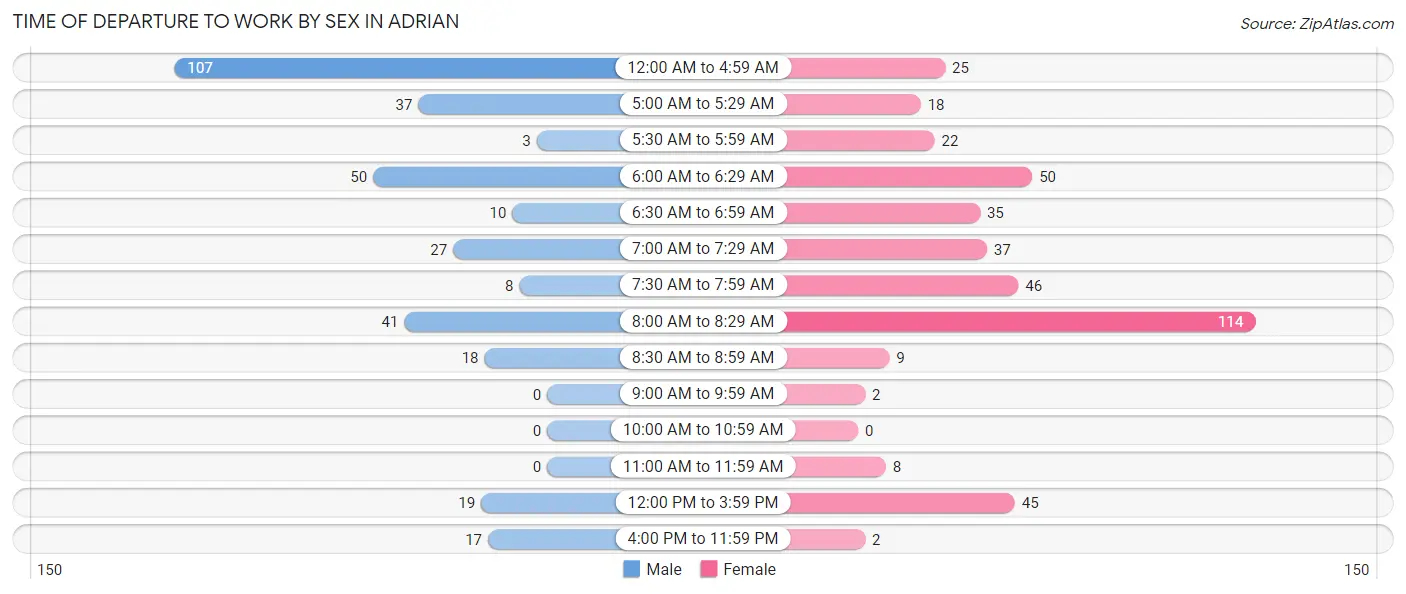
| Time of Departure | Male | Female |
| 12:00 AM to 4:59 AM | 107 (31.8%) | 25 (6.0%) |
| 5:00 AM to 5:29 AM | 37 (11.0%) | 18 (4.4%) |
| 5:30 AM to 5:59 AM | 3 (0.9%) | 22 (5.3%) |
| 6:00 AM to 6:29 AM | 50 (14.8%) | 50 (12.1%) |
| 6:30 AM to 6:59 AM | 10 (3.0%) | 35 (8.5%) |
| 7:00 AM to 7:29 AM | 27 (8.0%) | 37 (9.0%) |
| 7:30 AM to 7:59 AM | 8 (2.4%) | 46 (11.1%) |
| 8:00 AM to 8:29 AM | 41 (12.2%) | 114 (27.6%) |
| 8:30 AM to 8:59 AM | 18 (5.3%) | 9 (2.2%) |
| 9:00 AM to 9:59 AM | 0 (0.0%) | 2 (0.5%) |
| 10:00 AM to 10:59 AM | 0 (0.0%) | 0 (0.0%) |
| 11:00 AM to 11:59 AM | 0 (0.0%) | 8 (1.9%) |
| 12:00 PM to 3:59 PM | 19 (5.6%) | 45 (10.9%) |
| 4:00 PM to 11:59 PM | 17 (5.0%) | 2 (0.5%) |
| Total | 337 (100.0%) | 413 (100.0%) |
Housing Occupancy in Adrian
Occupancy by Ownership in Adrian
Of the total 798 dwellings in Adrian, owner-occupied units account for 488 (61.2%), while renter-occupied units make up 310 (38.9%).
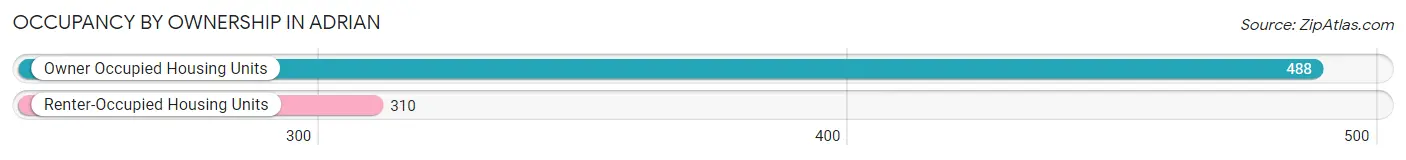
| Occupancy | # Housing Units | % Housing Units |
| Owner Occupied Housing Units | 488 | 61.2% |
| Renter-Occupied Housing Units | 310 | 38.9% |
| Total Occupied Housing Units | 798 | 100.0% |
Occupancy by Household Size in Adrian
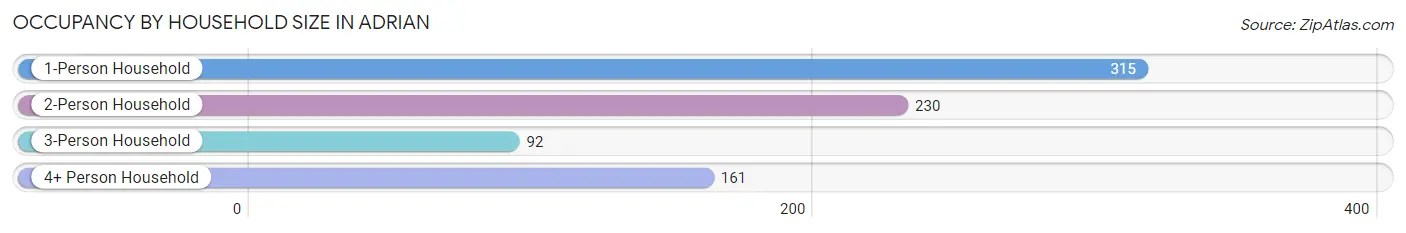
| Household Size | # Housing Units | % Housing Units |
| 1-Person Household | 315 | 39.5% |
| 2-Person Household | 230 | 28.8% |
| 3-Person Household | 92 | 11.5% |
| 4+ Person Household | 161 | 20.2% |
| Total Housing Units | 798 | 100.0% |
Occupancy by Ownership by Household Size in Adrian
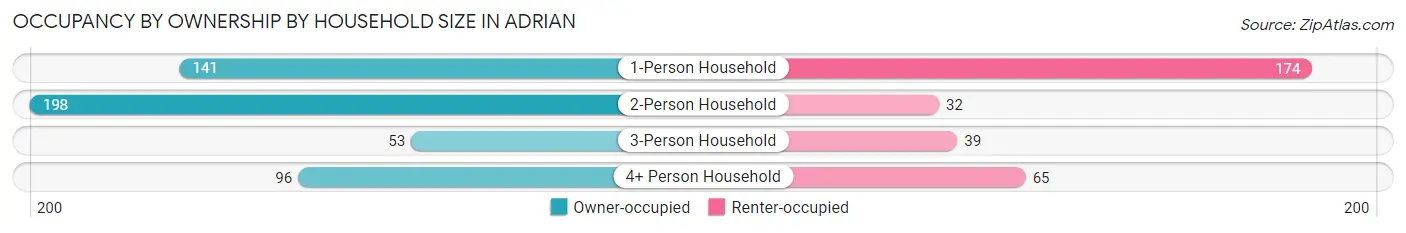
| Household Size | Owner-occupied | Renter-occupied |
| 1-Person Household | 141 (44.8%) | 174 (55.2%) |
| 2-Person Household | 198 (86.1%) | 32 (13.9%) |
| 3-Person Household | 53 (57.6%) | 39 (42.4%) |
| 4+ Person Household | 96 (59.6%) | 65 (40.4%) |
| Total Housing Units | 488 (61.2%) | 310 (38.9%) |
Occupancy by Educational Attainment in Adrian
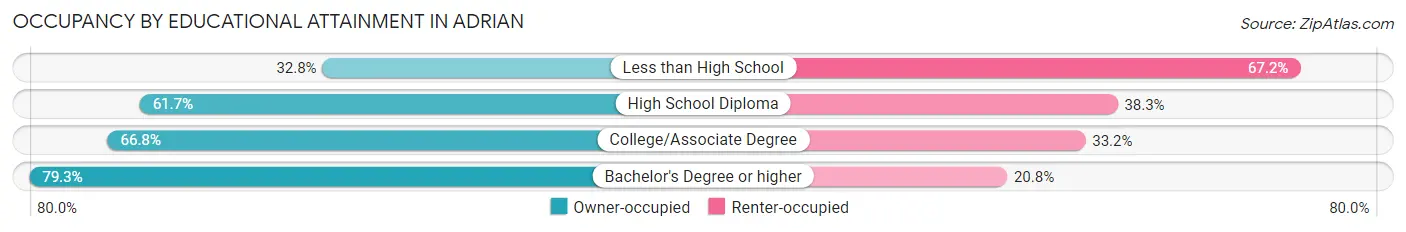
| Household Size | Owner-occupied | Renter-occupied |
| Less than High School | 38 (32.8%) | 78 (67.2%) |
| High School Diploma | 229 (61.7%) | 142 (38.3%) |
| College/Associate Degree | 137 (66.8%) | 68 (33.2%) |
| Bachelor's Degree or higher | 84 (79.2%) | 22 (20.7%) |
Occupancy by Age of Householder in Adrian
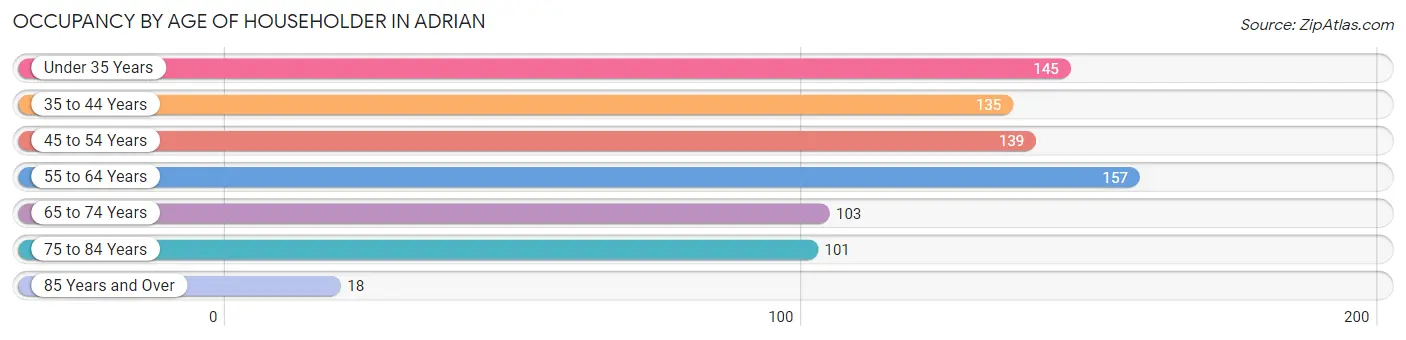
| Age Bracket | # Households | % Households |
| Under 35 Years | 145 | 18.2% |
| 35 to 44 Years | 135 | 16.9% |
| 45 to 54 Years | 139 | 17.4% |
| 55 to 64 Years | 157 | 19.7% |
| 65 to 74 Years | 103 | 12.9% |
| 75 to 84 Years | 101 | 12.7% |
| 85 Years and Over | 18 | 2.3% |
| Total | 798 | 100.0% |
Housing Finances in Adrian
Median Income by Occupancy in Adrian
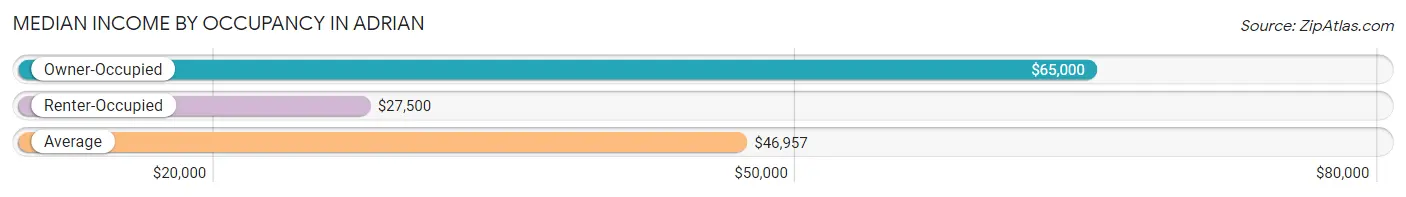
| Occupancy Type | # Households | Median Income |
| Owner-Occupied | 488 (61.2%) | $65,000 |
| Renter-Occupied | 310 (38.9%) | $27,500 |
| Average | 798 (100.0%) | $46,957 |
Occupancy by Householder Income Bracket in Adrian
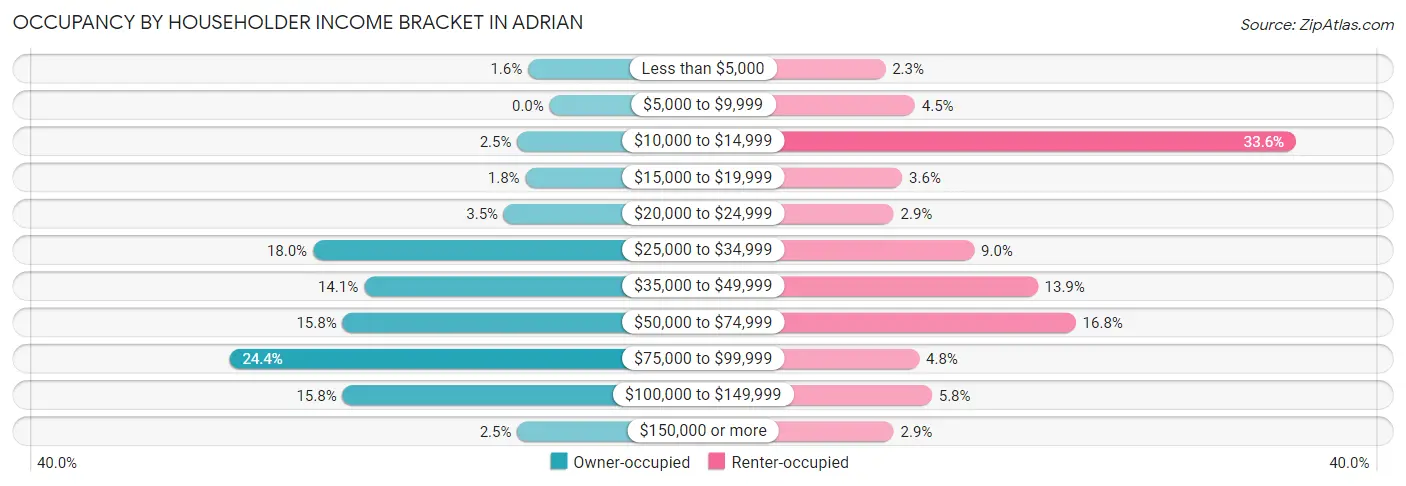
| Income Bracket | Owner-occupied | Renter-occupied |
| Less than $5,000 | 8 (1.6%) | 7 (2.3%) |
| $5,000 to $9,999 | 0 (0.0%) | 14 (4.5%) |
| $10,000 to $14,999 | 12 (2.5%) | 104 (33.6%) |
| $15,000 to $19,999 | 9 (1.8%) | 11 (3.5%) |
| $20,000 to $24,999 | 17 (3.5%) | 9 (2.9%) |
| $25,000 to $34,999 | 88 (18.0%) | 28 (9.0%) |
| $35,000 to $49,999 | 69 (14.1%) | 43 (13.9%) |
| $50,000 to $74,999 | 77 (15.8%) | 52 (16.8%) |
| $75,000 to $99,999 | 119 (24.4%) | 15 (4.8%) |
| $100,000 to $149,999 | 77 (15.8%) | 18 (5.8%) |
| $150,000 or more | 12 (2.5%) | 9 (2.9%) |
| Total | 488 (100.0%) | 310 (100.0%) |
Monthly Housing Cost Tiers in Adrian
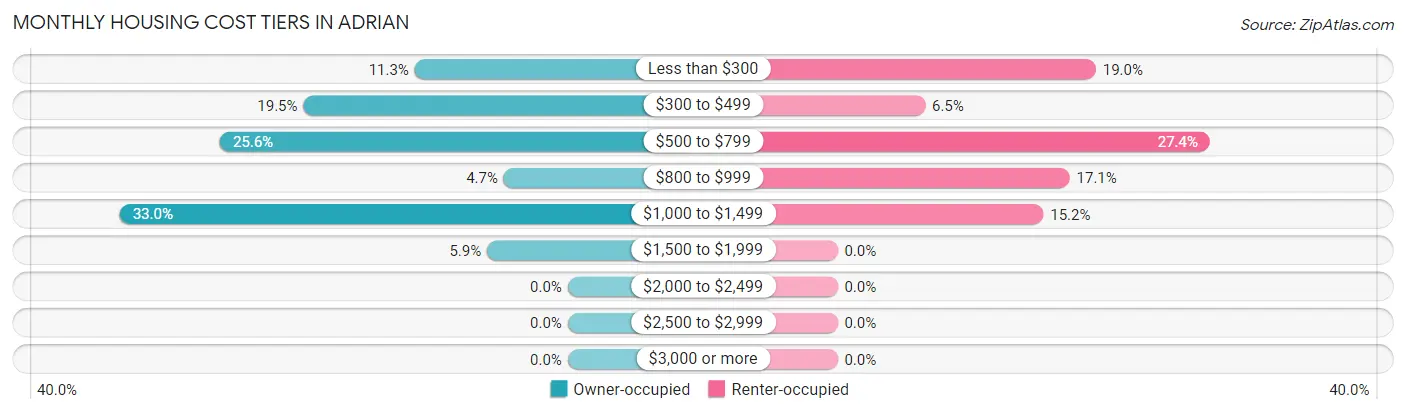
| Monthly Cost | Owner-occupied | Renter-occupied |
| Less than $300 | 55 (11.3%) | 59 (19.0%) |
| $300 to $499 | 95 (19.5%) | 20 (6.5%) |
| $500 to $799 | 125 (25.6%) | 85 (27.4%) |
| $800 to $999 | 23 (4.7%) | 53 (17.1%) |
| $1,000 to $1,499 | 161 (33.0%) | 47 (15.2%) |
| $1,500 to $1,999 | 29 (5.9%) | 0 (0.0%) |
| $2,000 to $2,499 | 0 (0.0%) | 0 (0.0%) |
| $2,500 to $2,999 | 0 (0.0%) | 0 (0.0%) |
| $3,000 or more | 0 (0.0%) | 0 (0.0%) |
| Total | 488 (100.0%) | 310 (100.0%) |
Physical Housing Characteristics in Adrian
Housing Structures in Adrian
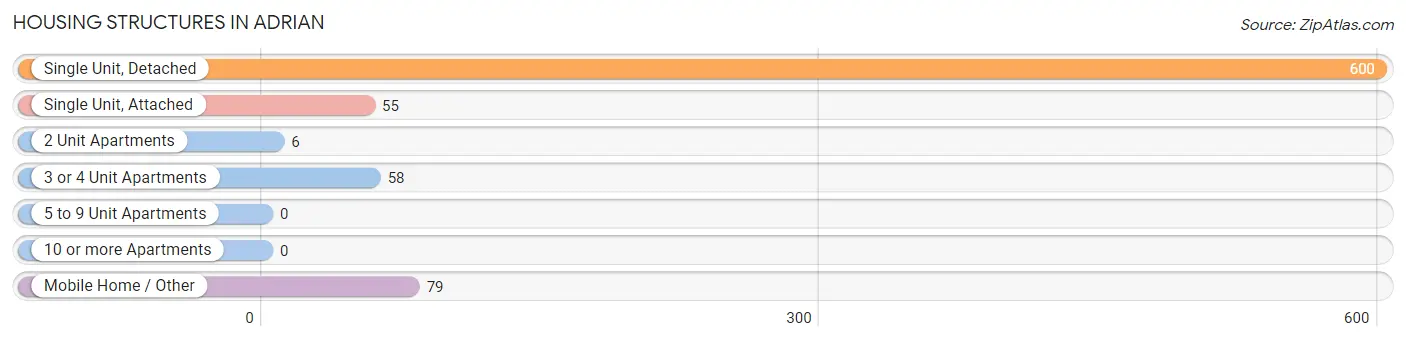
| Structure Type | # Housing Units | % Housing Units |
| Single Unit, Detached | 600 | 75.2% |
| Single Unit, Attached | 55 | 6.9% |
| 2 Unit Apartments | 6 | 0.7% |
| 3 or 4 Unit Apartments | 58 | 7.3% |
| 5 to 9 Unit Apartments | 0 | 0.0% |
| 10 or more Apartments | 0 | 0.0% |
| Mobile Home / Other | 79 | 9.9% |
| Total | 798 | 100.0% |
Housing Structures by Occupancy in Adrian
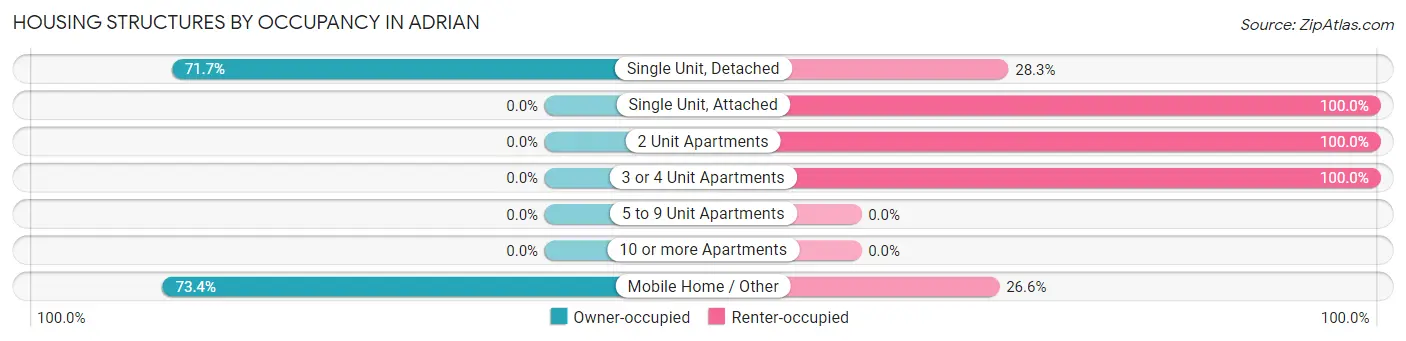
| Structure Type | Owner-occupied | Renter-occupied |
| Single Unit, Detached | 430 (71.7%) | 170 (28.3%) |
| Single Unit, Attached | 0 (0.0%) | 55 (100.0%) |
| 2 Unit Apartments | 0 (0.0%) | 6 (100.0%) |
| 3 or 4 Unit Apartments | 0 (0.0%) | 58 (100.0%) |
| 5 to 9 Unit Apartments | 0 (0.0%) | 0 (0.0%) |
| 10 or more Apartments | 0 (0.0%) | 0 (0.0%) |
| Mobile Home / Other | 58 (73.4%) | 21 (26.6%) |
| Total | 488 (61.2%) | 310 (38.9%) |
Housing Structures by Number of Rooms in Adrian
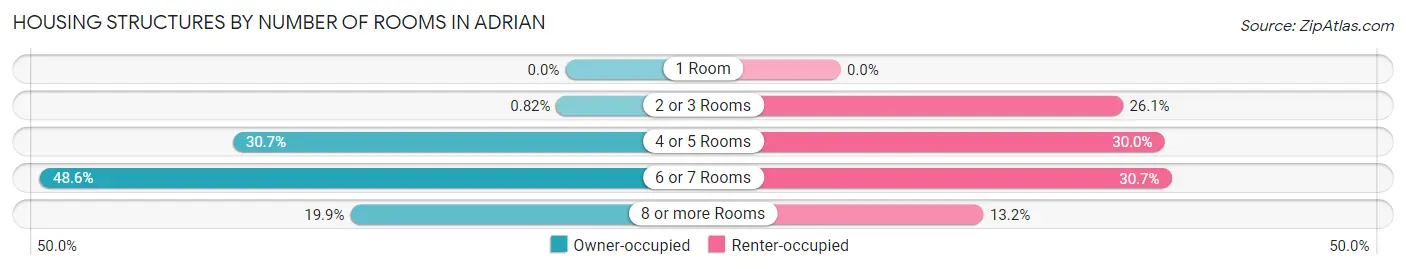
| Number of Rooms | Owner-occupied | Renter-occupied |
| 1 Room | 0 (0.0%) | 0 (0.0%) |
| 2 or 3 Rooms | 4 (0.8%) | 81 (26.1%) |
| 4 or 5 Rooms | 150 (30.7%) | 93 (30.0%) |
| 6 or 7 Rooms | 237 (48.6%) | 95 (30.6%) |
| 8 or more Rooms | 97 (19.9%) | 41 (13.2%) |
| Total | 488 (100.0%) | 310 (100.0%) |
Housing Structure by Heating Type in Adrian
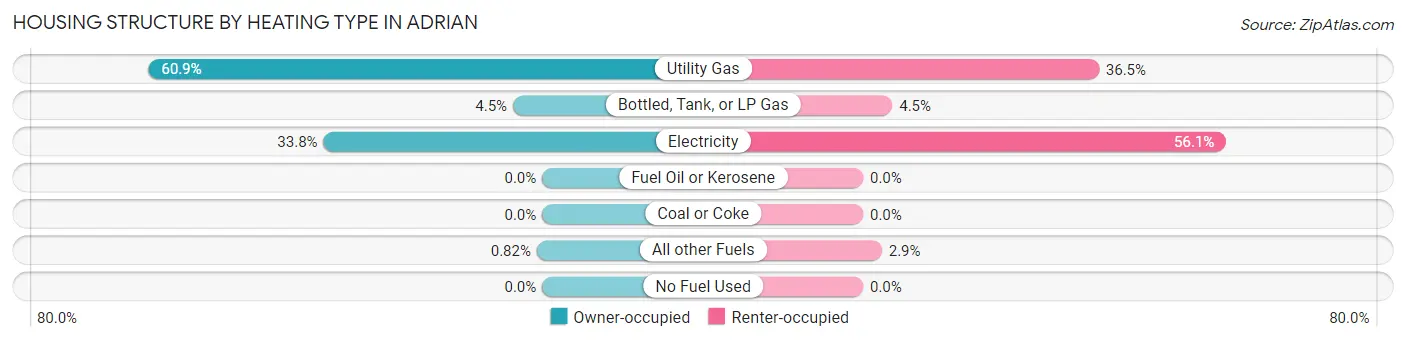
| Heating Type | Owner-occupied | Renter-occupied |
| Utility Gas | 297 (60.9%) | 113 (36.4%) |
| Bottled, Tank, or LP Gas | 22 (4.5%) | 14 (4.5%) |
| Electricity | 165 (33.8%) | 174 (56.1%) |
| Fuel Oil or Kerosene | 0 (0.0%) | 0 (0.0%) |
| Coal or Coke | 0 (0.0%) | 0 (0.0%) |
| All other Fuels | 4 (0.8%) | 9 (2.9%) |
| No Fuel Used | 0 (0.0%) | 0 (0.0%) |
| Total | 488 (100.0%) | 310 (100.0%) |
Household Vehicle Usage in Adrian
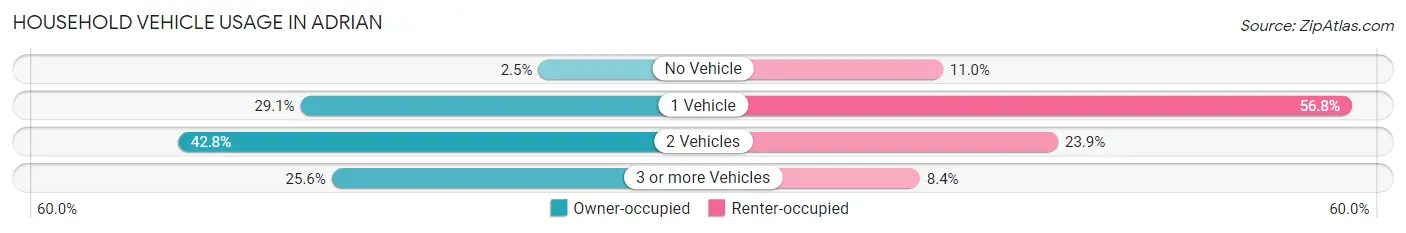
| Vehicles per Household | Owner-occupied | Renter-occupied |
| No Vehicle | 12 (2.5%) | 34 (11.0%) |
| 1 Vehicle | 142 (29.1%) | 176 (56.8%) |
| 2 Vehicles | 209 (42.8%) | 74 (23.9%) |
| 3 or more Vehicles | 125 (25.6%) | 26 (8.4%) |
| Total | 488 (100.0%) | 310 (100.0%) |
Real Estate & Mortgages in Adrian
Real Estate and Mortgage Overview in Adrian
| Characteristic | Without Mortgage | With Mortgage |
| Housing Units | 197 | 291 |
| Median Property Value | $106,900 | $145,200 |
| Median Household Income | $60,096 | $10 |
| Monthly Housing Costs | $417 | $0 |
| Real Estate Taxes | $841 | $7 |
Property Value by Mortgage Status in Adrian
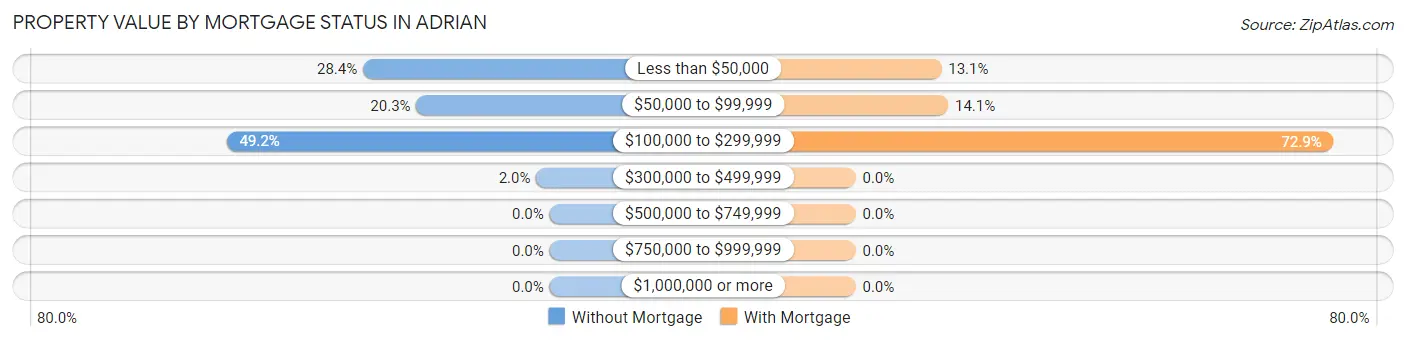
| Property Value | Without Mortgage | With Mortgage |
| Less than $50,000 | 56 (28.4%) | 38 (13.1%) |
| $50,000 to $99,999 | 40 (20.3%) | 41 (14.1%) |
| $100,000 to $299,999 | 97 (49.2%) | 212 (72.9%) |
| $300,000 to $499,999 | 4 (2.0%) | 0 (0.0%) |
| $500,000 to $749,999 | 0 (0.0%) | 0 (0.0%) |
| $750,000 to $999,999 | 0 (0.0%) | 0 (0.0%) |
| $1,000,000 or more | 0 (0.0%) | 0 (0.0%) |
| Total | 197 (100.0%) | 291 (100.0%) |
Household Income by Mortgage Status in Adrian
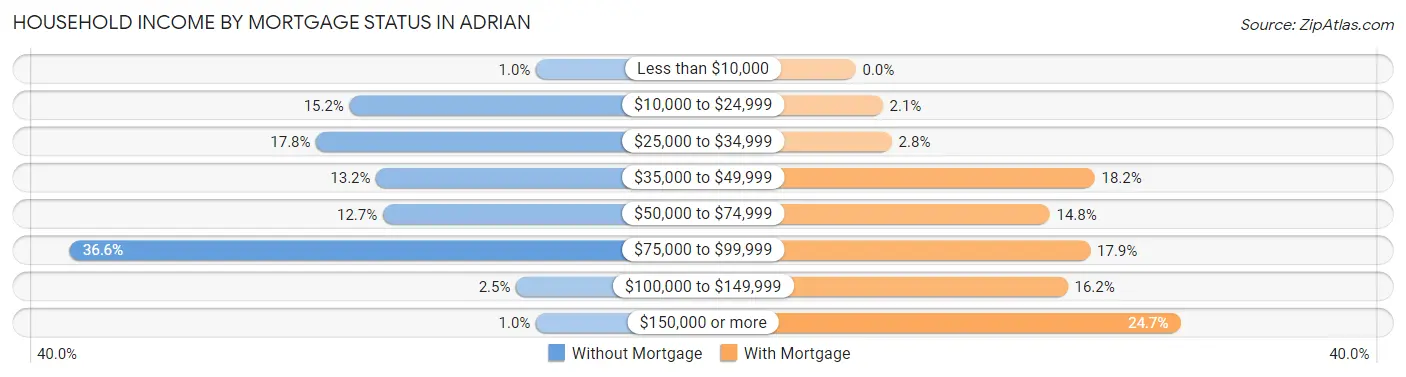
| Household Income | Without Mortgage | With Mortgage |
| Less than $10,000 | 2 (1.0%) | 0 (0.0%) |
| $10,000 to $24,999 | 30 (15.2%) | 6 (2.1%) |
| $25,000 to $34,999 | 35 (17.8%) | 8 (2.8%) |
| $35,000 to $49,999 | 26 (13.2%) | 53 (18.2%) |
| $50,000 to $74,999 | 25 (12.7%) | 43 (14.8%) |
| $75,000 to $99,999 | 72 (36.5%) | 52 (17.9%) |
| $100,000 to $149,999 | 5 (2.5%) | 47 (16.2%) |
| $150,000 or more | 2 (1.0%) | 72 (24.7%) |
| Total | 197 (100.0%) | 291 (100.0%) |
Property Value to Household Income Ratio in Adrian
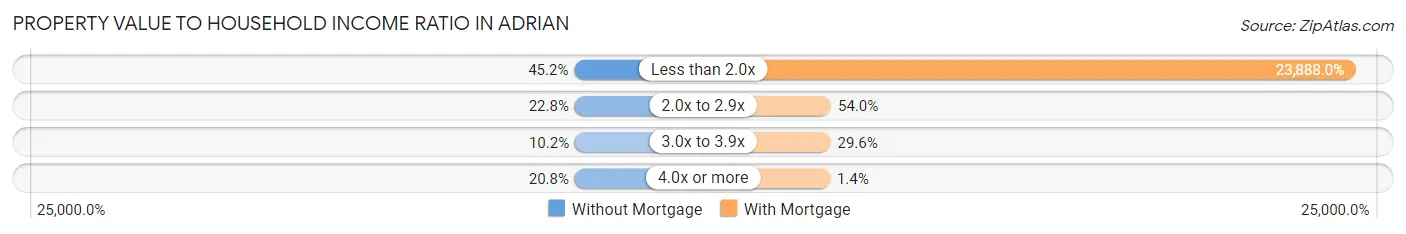
| Value-to-Income Ratio | Without Mortgage | With Mortgage |
| Less than 2.0x | 89 (45.2%) | 69,514 (23,888.0%) |
| 2.0x to 2.9x | 45 (22.8%) | 157 (53.9%) |
| 3.0x to 3.9x | 20 (10.2%) | 86 (29.5%) |
| 4.0x or more | 41 (20.8%) | 4 (1.4%) |
| Total | 197 (100.0%) | 291 (100.0%) |
Real Estate Taxes by Mortgage Status in Adrian
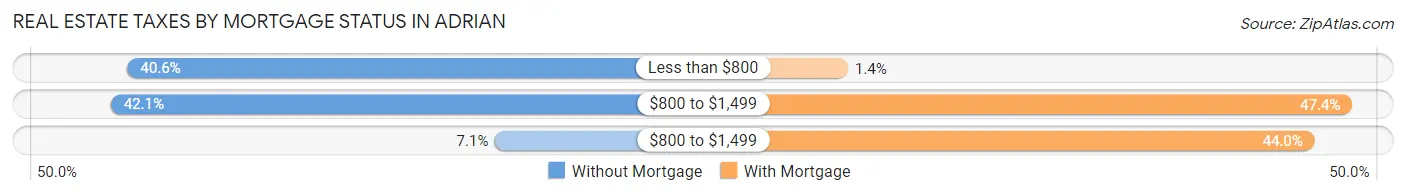
| Property Taxes | Without Mortgage | With Mortgage |
| Less than $800 | 80 (40.6%) | 4 (1.4%) |
| $800 to $1,499 | 83 (42.1%) | 138 (47.4%) |
| $800 to $1,499 | 14 (7.1%) | 128 (44.0%) |
| Total | 197 (100.0%) | 291 (100.0%) |
Health & Disability in Adrian
Health Insurance Coverage by Age in Adrian
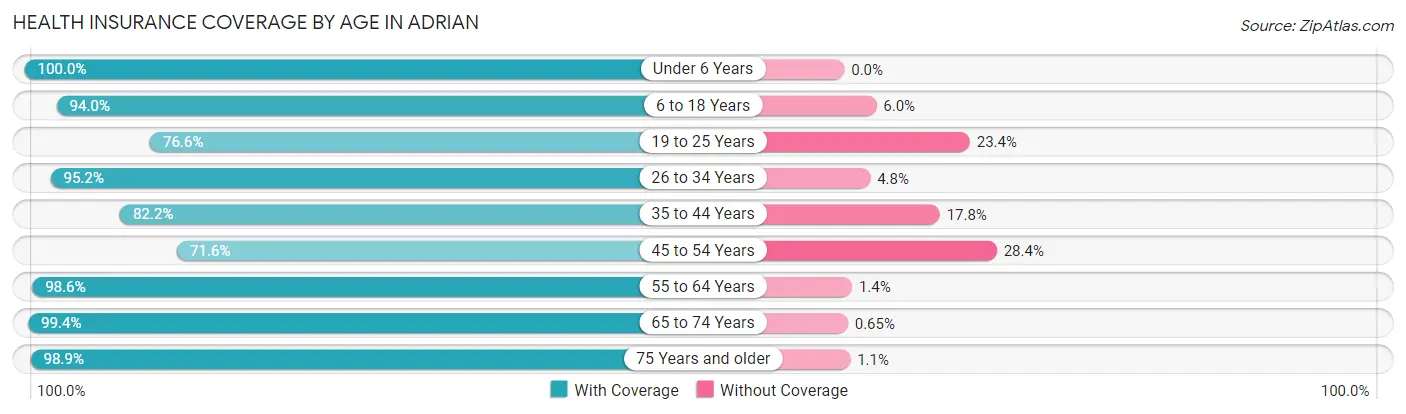
| Age Bracket | With Coverage | Without Coverage |
| Under 6 Years | 131 (100.0%) | 0 (0.0%) |
| 6 to 18 Years | 393 (94.0%) | 25 (6.0%) |
| 19 to 25 Years | 108 (76.6%) | 33 (23.4%) |
| 26 to 34 Years | 177 (95.2%) | 9 (4.8%) |
| 35 to 44 Years | 231 (82.2%) | 50 (17.8%) |
| 45 to 54 Years | 146 (71.6%) | 58 (28.4%) |
| 55 to 64 Years | 275 (98.6%) | 4 (1.4%) |
| 65 to 74 Years | 153 (99.4%) | 1 (0.6%) |
| 75 Years and older | 178 (98.9%) | 2 (1.1%) |
| Total | 1,792 (90.8%) | 182 (9.2%) |
Health Insurance Coverage by Citizenship Status in Adrian
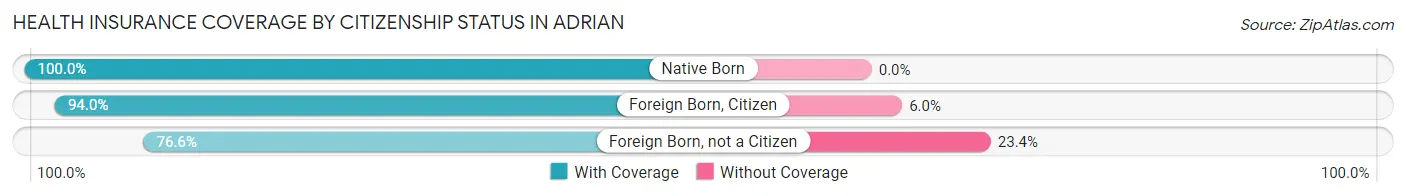
| Citizenship Status | With Coverage | Without Coverage |
| Native Born | 131 (100.0%) | 0 (0.0%) |
| Foreign Born, Citizen | 393 (94.0%) | 25 (6.0%) |
| Foreign Born, not a Citizen | 108 (76.6%) | 33 (23.4%) |
Health Insurance Coverage by Household Income in Adrian
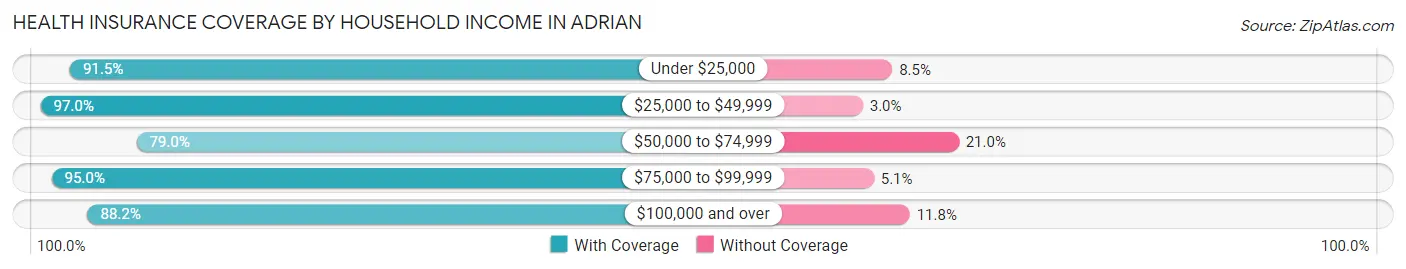
| Household Income | With Coverage | Without Coverage |
| Under $25,000 | 258 (91.5%) | 24 (8.5%) |
| $25,000 to $49,999 | 454 (97.0%) | 14 (3.0%) |
| $50,000 to $74,999 | 260 (79.0%) | 69 (21.0%) |
| $75,000 to $99,999 | 432 (95.0%) | 23 (5.1%) |
| $100,000 and over | 374 (88.2%) | 50 (11.8%) |
Public vs Private Health Insurance Coverage by Age in Adrian
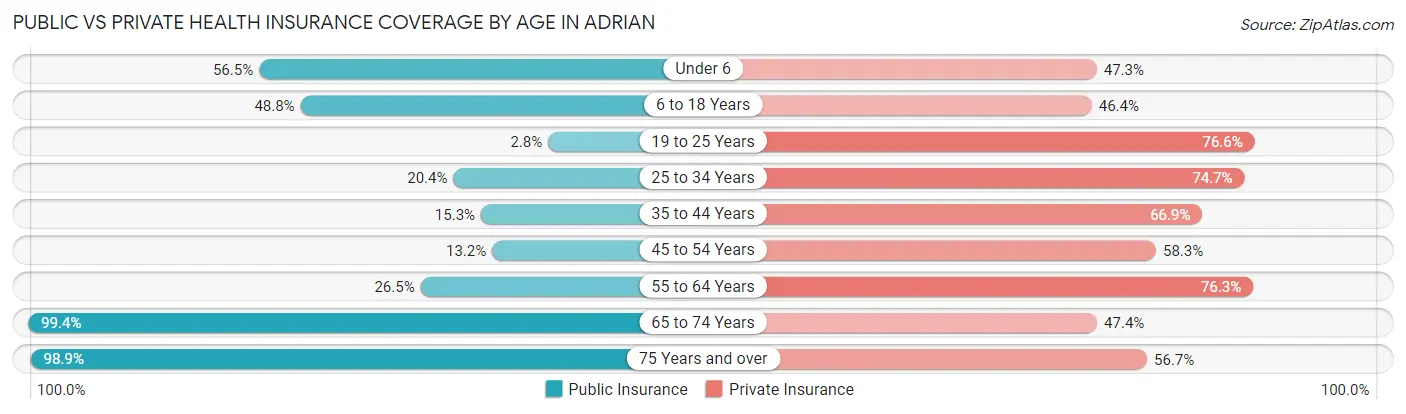
| Age Bracket | Public Insurance | Private Insurance |
| Under 6 | 74 (56.5%) | 62 (47.3%) |
| 6 to 18 Years | 204 (48.8%) | 194 (46.4%) |
| 19 to 25 Years | 4 (2.8%) | 108 (76.6%) |
| 25 to 34 Years | 38 (20.4%) | 139 (74.7%) |
| 35 to 44 Years | 43 (15.3%) | 188 (66.9%) |
| 45 to 54 Years | 27 (13.2%) | 119 (58.3%) |
| 55 to 64 Years | 74 (26.5%) | 213 (76.3%) |
| 65 to 74 Years | 153 (99.4%) | 73 (47.4%) |
| 75 Years and over | 178 (98.9%) | 102 (56.7%) |
| Total | 795 (40.3%) | 1,198 (60.7%) |
Disability Status by Sex by Age in Adrian
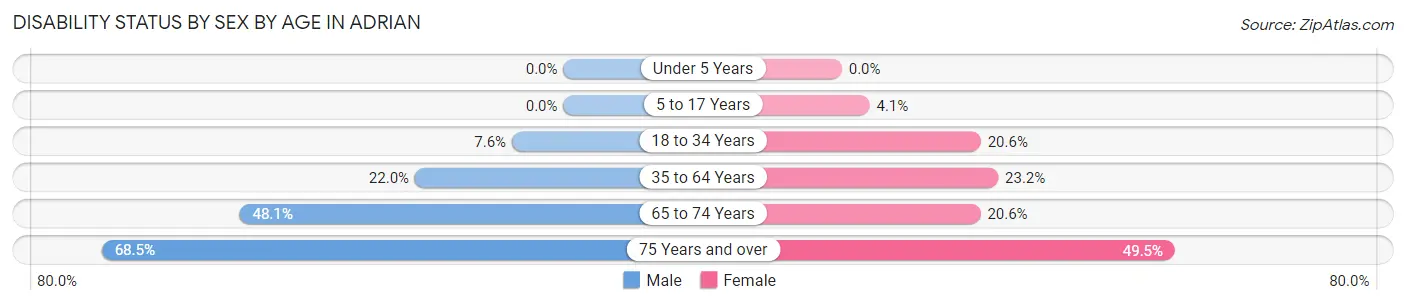
| Age Bracket | Male | Female |
| Under 5 Years | 0 (0.0%) | 0 (0.0%) |
| 5 to 17 Years | 0 (0.0%) | 10 (4.1%) |
| 18 to 34 Years | 12 (7.6%) | 46 (20.6%) |
| 35 to 64 Years | 82 (22.0%) | 91 (23.2%) |
| 65 to 74 Years | 25 (48.1%) | 21 (20.6%) |
| 75 Years and over | 61 (68.5%) | 45 (49.4%) |
Disability Class by Sex by Age in Adrian
Disability Class: Hearing Difficulty
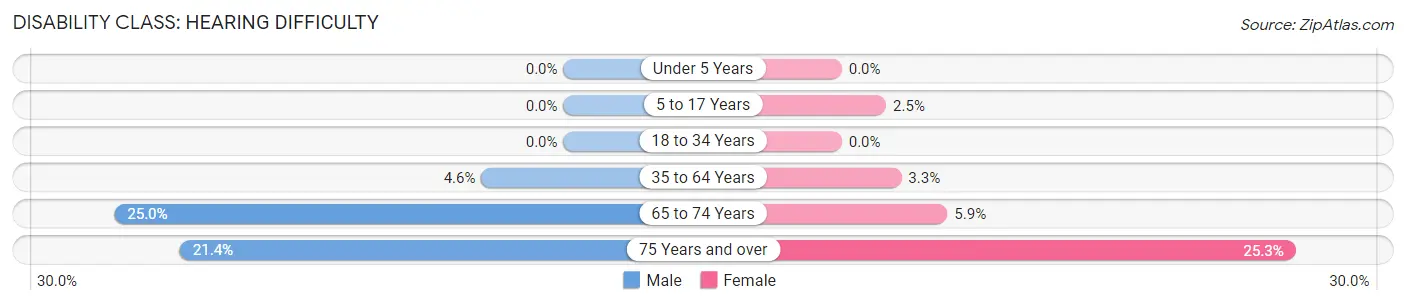
| Age Bracket | Male | Female |
| Under 5 Years | 0 (0.0%) | 0 (0.0%) |
| 5 to 17 Years | 0 (0.0%) | 6 (2.5%) |
| 18 to 34 Years | 0 (0.0%) | 0 (0.0%) |
| 35 to 64 Years | 17 (4.6%) | 13 (3.3%) |
| 65 to 74 Years | 13 (25.0%) | 6 (5.9%) |
| 75 Years and over | 19 (21.3%) | 23 (25.3%) |
Disability Class: Vision Difficulty
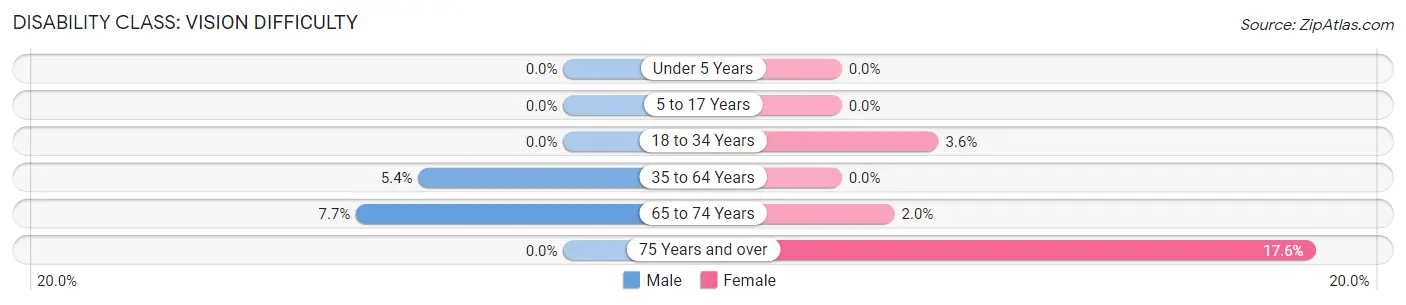
| Age Bracket | Male | Female |
| Under 5 Years | 0 (0.0%) | 0 (0.0%) |
| 5 to 17 Years | 0 (0.0%) | 0 (0.0%) |
| 18 to 34 Years | 0 (0.0%) | 8 (3.6%) |
| 35 to 64 Years | 20 (5.4%) | 0 (0.0%) |
| 65 to 74 Years | 4 (7.7%) | 2 (2.0%) |
| 75 Years and over | 0 (0.0%) | 16 (17.6%) |
Disability Class: Cognitive Difficulty
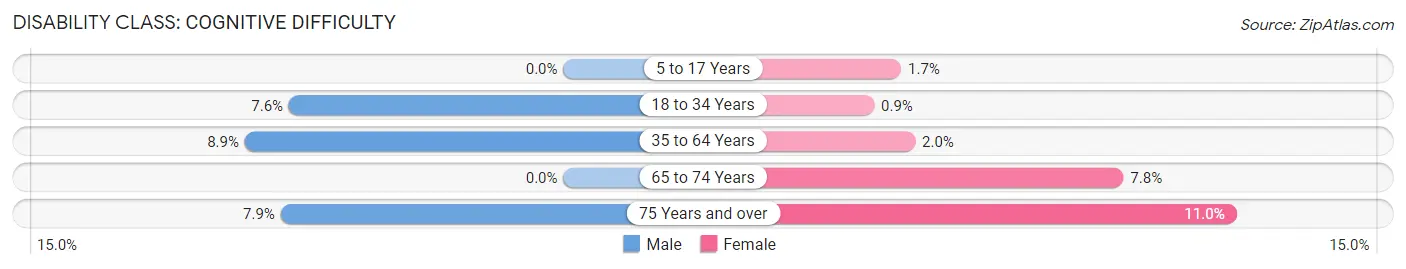
| Age Bracket | Male | Female |
| 5 to 17 Years | 0 (0.0%) | 4 (1.7%) |
| 18 to 34 Years | 12 (7.6%) | 2 (0.9%) |
| 35 to 64 Years | 33 (8.9%) | 8 (2.0%) |
| 65 to 74 Years | 0 (0.0%) | 8 (7.8%) |
| 75 Years and over | 7 (7.9%) | 10 (11.0%) |
Disability Class: Ambulatory Difficulty
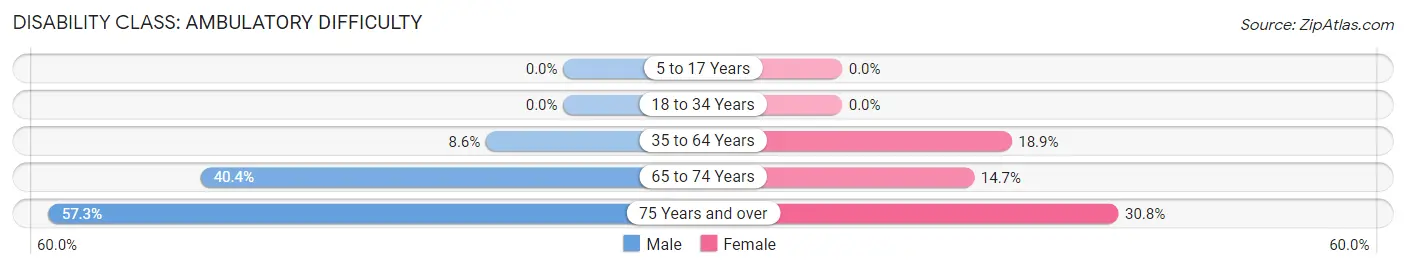
| Age Bracket | Male | Female |
| 5 to 17 Years | 0 (0.0%) | 0 (0.0%) |
| 18 to 34 Years | 0 (0.0%) | 0 (0.0%) |
| 35 to 64 Years | 32 (8.6%) | 74 (18.9%) |
| 65 to 74 Years | 21 (40.4%) | 15 (14.7%) |
| 75 Years and over | 51 (57.3%) | 28 (30.8%) |
Disability Class: Self-Care Difficulty
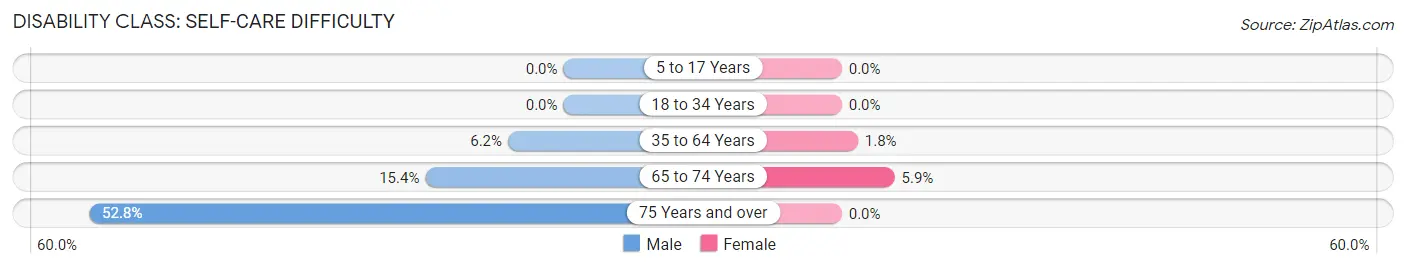
| Age Bracket | Male | Female |
| 5 to 17 Years | 0 (0.0%) | 0 (0.0%) |
| 18 to 34 Years | 0 (0.0%) | 0 (0.0%) |
| 35 to 64 Years | 23 (6.2%) | 7 (1.8%) |
| 65 to 74 Years | 8 (15.4%) | 6 (5.9%) |
| 75 Years and over | 47 (52.8%) | 0 (0.0%) |
Technology Access in Adrian
Computing Device Access in Adrian
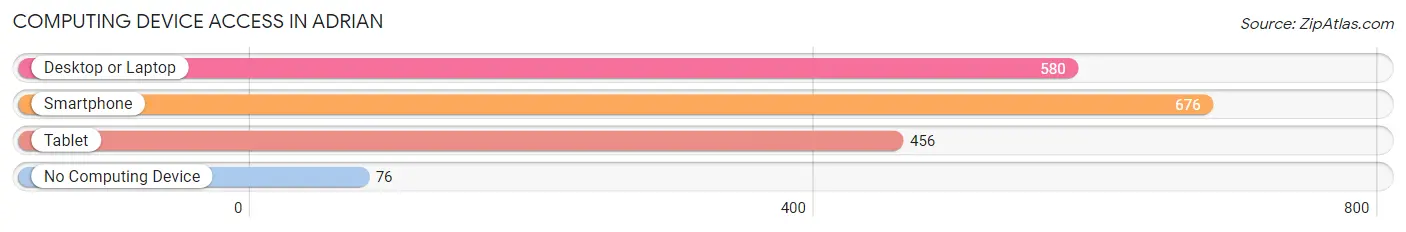
| Device Type | # Households | % Households |
| Desktop or Laptop | 580 | 72.7% |
| Smartphone | 676 | 84.7% |
| Tablet | 456 | 57.1% |
| No Computing Device | 76 | 9.5% |
| Total | 798 | 100.0% |
Internet Access in Adrian
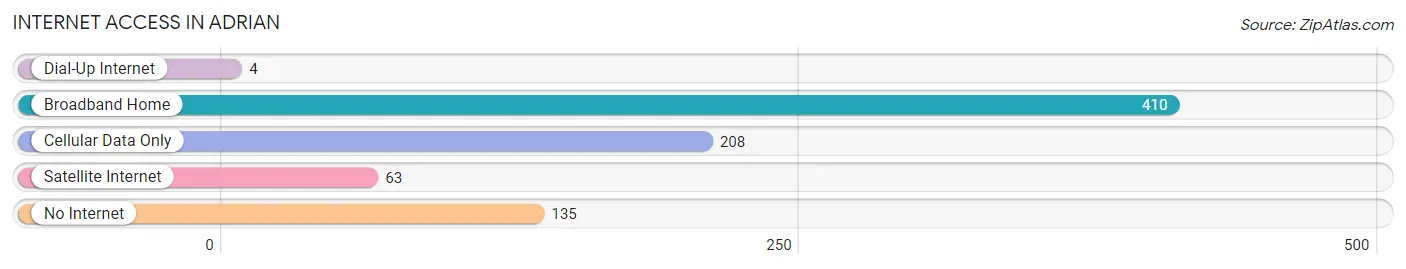
| Internet Type | # Households | % Households |
| Dial-Up Internet | 4 | 0.5% |
| Broadband Home | 410 | 51.4% |
| Cellular Data Only | 208 | 26.1% |
| Satellite Internet | 63 | 7.9% |
| No Internet | 135 | 16.9% |
| Total | 798 | 100.0% |
Adrian Summary
Adrian, Missouri is a small town located in Bates County, Missouri. It is situated in the southwestern corner of the state, approximately 40 miles south of Kansas City. The town was founded in 1871 and has a population of approximately 1,500 people.
History
Adrian was founded in 1871 by a group of settlers from the nearby town of Butler. The town was named after the first settler, Adrian B. Smith. Smith was a veteran of the Civil War and had served in the Union Army. He was also a prominent businessman in the area and was instrumental in the development of the town.
The town grew quickly and by the early 1900s, it had become a thriving community. It was home to several businesses, including a bank, a hotel, a general store, a blacksmith shop, and a post office. The town also had a school, a church, and a library.
In the early 1900s, the town was a major stop on the Missouri Pacific Railroad. This allowed the town to become a hub for trade and commerce. The railroad also brought in new settlers and businesses, which helped to further grow the town.
Geography
Adrian is located in the southwestern corner of Missouri, approximately 40 miles south of Kansas City. It is situated in the Ozark Plateau region of the state, which is characterized by rolling hills and forests. The town is located on the banks of the Marais des Cygnes River, which flows through the area.
The climate in Adrian is humid subtropical, with hot summers and mild winters. The average annual temperature is around 60 degrees Fahrenheit. The town receives an average of 40 inches of precipitation each year, with most of it falling in the spring and summer months.
Economy
Adrian’s economy is largely based on agriculture. The town is home to several farms, which produce a variety of crops, including corn, soybeans, wheat, and hay. The town also has several businesses, including a bank, a hotel, a general store, and a post office.
The town is also home to several manufacturing companies, which produce a variety of products, including furniture, clothing, and automotive parts. The town is also home to several small businesses, including restaurants, shops, and service providers.
Demographics
As of the 2010 census, the population of Adrian was 1,500. The town is predominantly white, with approximately 95% of the population being Caucasian. The town also has a small Hispanic population, with approximately 4% of the population being of Hispanic or Latino origin.
The median household income in Adrian is approximately $40,000, which is slightly lower than the national average. The town also has a higher poverty rate than the national average, with approximately 17% of the population living below the poverty line.
Conclusion
Adrian, Missouri is a small town located in Bates County, Missouri. It was founded in 1871 and has a population of approximately 1,500 people. The town’s economy is largely based on agriculture, with several farms producing a variety of crops. The town also has several businesses, including a bank, a hotel, a general store, and a post office. The town is predominantly white, with approximately 95% of the population being Caucasian. The median household income in Adrian is approximately $40,000, which is slightly lower than the national average.
Common Questions
What is Per Capita Income in Adrian?
Per Capita income in Adrian is $25,021.
What is the Median Family Income in Adrian?
Median Family Income in Adrian is $75,781.
What is the Median Household income in Adrian?
Median Household Income in Adrian is $46,957.
What is Income or Wage Gap in Adrian?
Income or Wage Gap in Adrian is 38.3%.
Women in Adrian earn 61.7 cents for every dollar earned by a man.
What is Inequality or Gini Index in Adrian?
Inequality or Gini Index in Adrian is 0.40.
What is the Total Population of Adrian?
Total Population of Adrian is 2,021.
What is the Total Male Population of Adrian?
Total Male Population of Adrian is 897.
What is the Total Female Population of Adrian?
Total Female Population of Adrian is 1,124.
What is the Ratio of Males per 100 Females in Adrian?
There are 79.80 Males per 100 Females in Adrian.
What is the Ratio of Females per 100 Males in Adrian?
There are 125.31 Females per 100 Males in Adrian.
What is the Median Population Age in Adrian?
Median Population Age in Adrian is 39.0 Years.
What is the Average Family Size in Adrian
Average Family Size in Adrian is 3.2 People.
What is the Average Household Size in Adrian
Average Household Size in Adrian is 2.5 People.
How Large is the Labor Force in Adrian?
There are 969 People in the Labor Forcein in Adrian.
What is the Percentage of People in the Labor Force in Adrian?
61.5% of People are in the Labor Force in Adrian.
What is the Unemployment Rate in Adrian?
Unemployment Rate in Adrian is 11.3%.