Zip Codes with the Highest Percentage of Population with a Degree in Computers and Mathematics in Livonia, MI
RELATED REPORTS & OPTIONS
Computers and Mathematics
Livonia
Compare Zip Codes
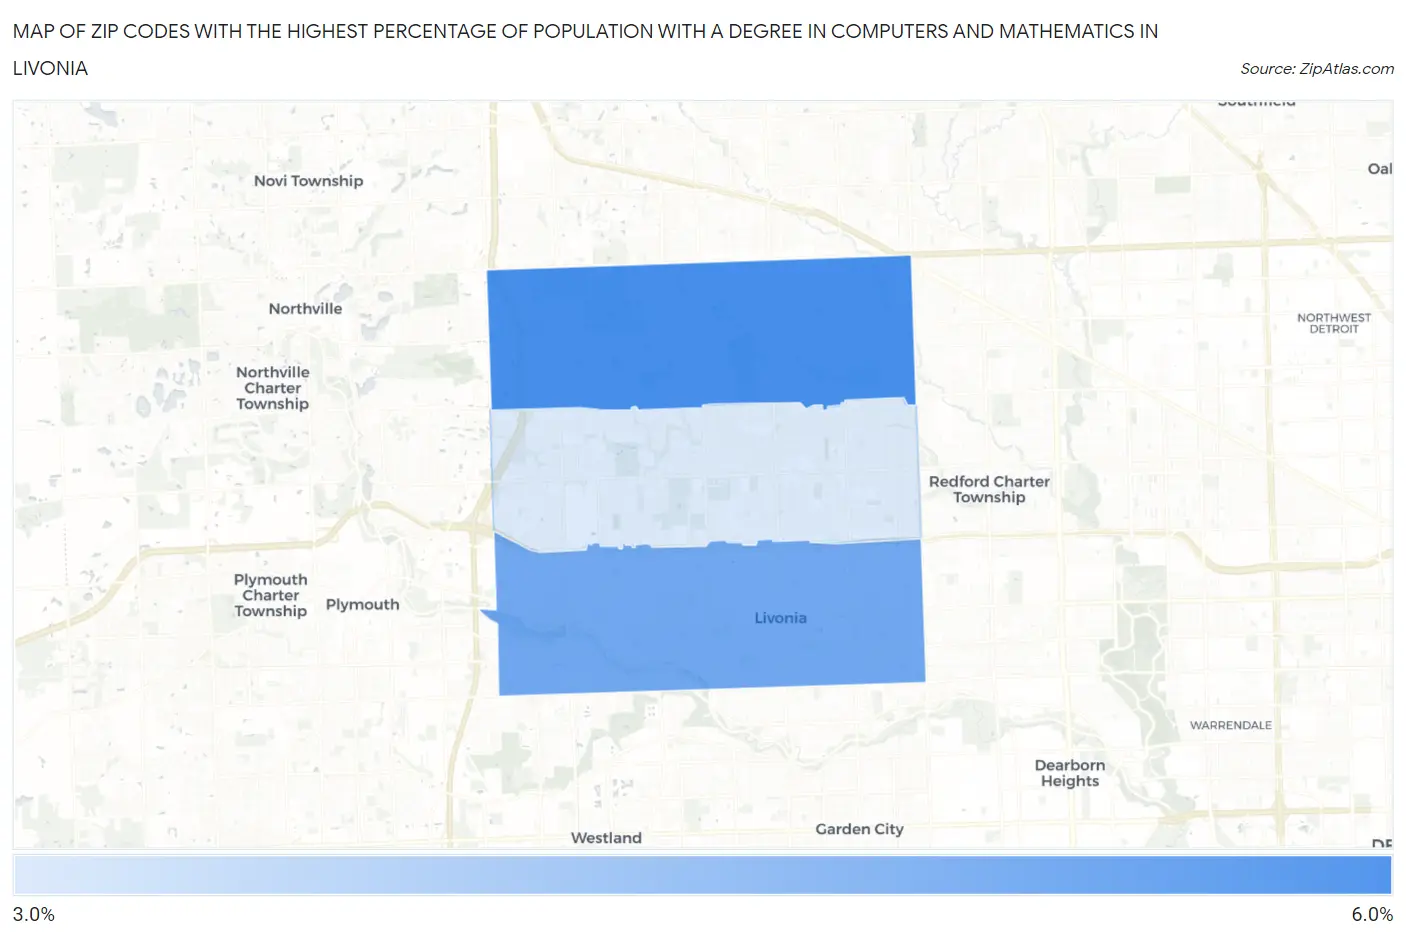
Map of Zip Codes with the Highest Percentage of Population with a Degree in Computers and Mathematics in Livonia
3.9%
5.2%
Zip Codes with the Highest Percentage of Population with a Degree in Computers and Mathematics in Livonia, MI
| Zip Code | % Graduates | vs State | vs National | |
| 1. | 48152 | 5.2% | 4.2%(+0.965)#200 | 4.9%(+0.302)#7,001 |
| 2. | 48150 | 4.8% | 4.2%(+0.598)#241 | 4.9%(-0.065)#7,904 |
| 3. | 48154 | 3.9% | 4.2%(-0.354)#351 | 4.9%(-1.02)#10,873 |
1
Common Questions
What are the Top Zip Codes with the Highest Percentage of Population with a Degree in Computers and Mathematics in Livonia, MI?
Top Zip Codes with the Highest Percentage of Population with a Degree in Computers and Mathematics in Livonia, MI are:
What zip code has the Highest Percentage of Population with a Degree in Computers and Mathematics in Livonia, MI?
48152 has the Highest Percentage of Population with a Degree in Computers and Mathematics in Livonia, MI with 5.2%.
What is the Percentage of Population with a Degree in Computers and Mathematics in Livonia, MI?
Percentage of Population with a Degree in Computers and Mathematics in Livonia is 4.5%.
What is the Percentage of Population with a Degree in Computers and Mathematics in Michigan?
Percentage of Population with a Degree in Computers and Mathematics in Michigan is 4.2%.
What is the Percentage of Population with a Degree in Computers and Mathematics in the United States?
Percentage of Population with a Degree in Computers and Mathematics in the United States is 4.9%.