Zip Codes with the Highest Percentage of Population Employed in Legal Services & Support in Livonia, MI
RELATED REPORTS & OPTIONS
Legal Services & Support
Livonia
Compare Zip Codes
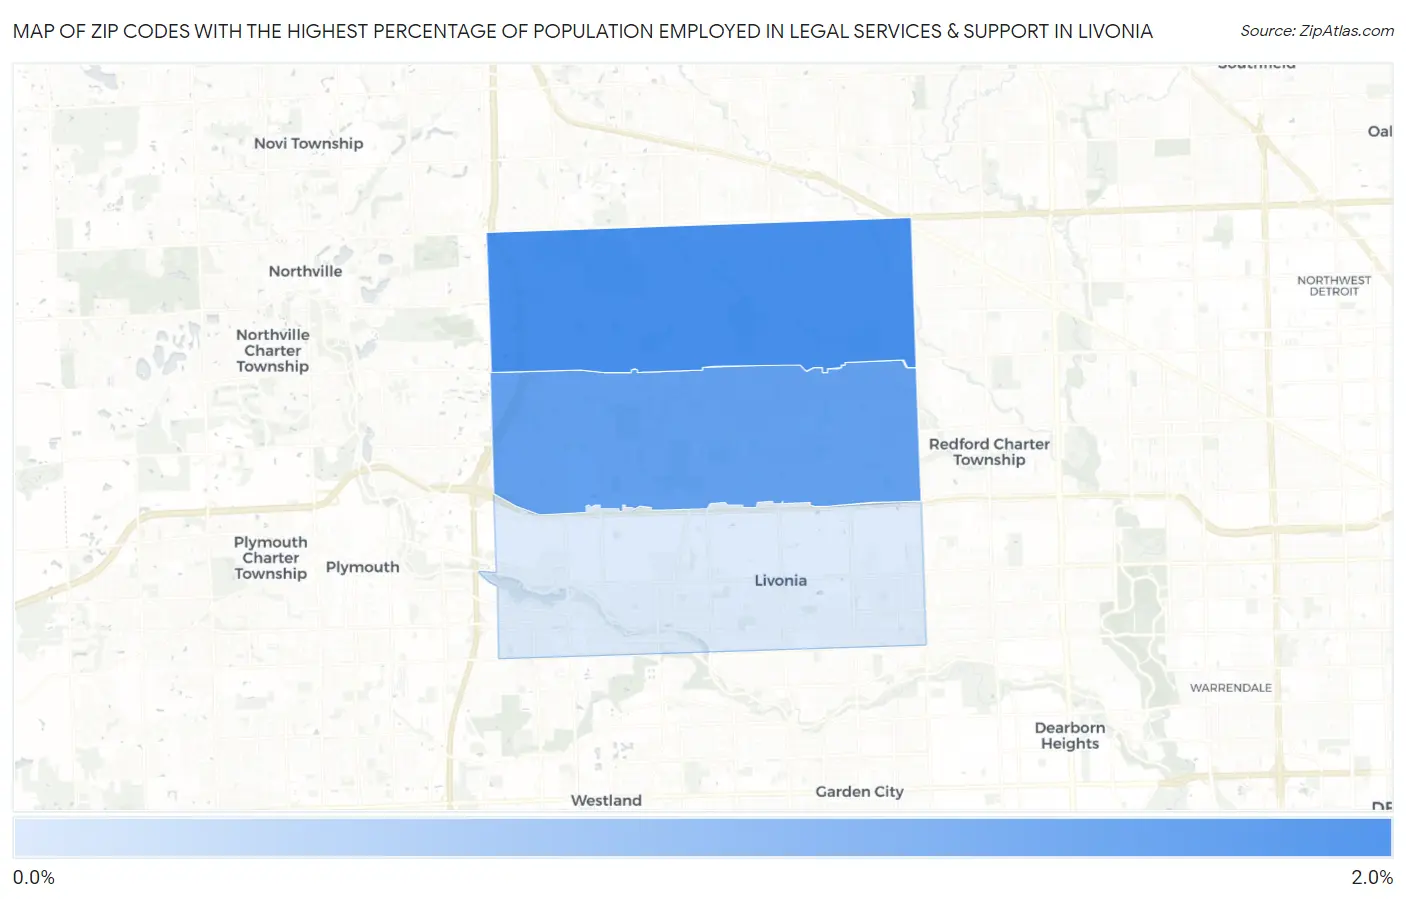
Map of Zip Codes with the Highest Percentage of Population Employed in Legal Services & Support in Livonia
0.26%
1.5%
Zip Codes with the Highest Percentage of Population Employed in Legal Services & Support in Livonia, MI
| Zip Code | % Employed | vs State | vs National | |
| 1. | 48152 | 1.5% | 0.89%(+0.619)#109 | 1.2%(+0.321)#5,032 |
| 2. | 48154 | 1.3% | 0.89%(+0.386)#134 | 1.2%(+0.088)#6,090 |
| 3. | 48150 | 0.26% | 0.89%(-0.626)#512 | 1.2%(-0.924)#15,519 |
1
Common Questions
What are the Top Zip Codes with the Highest Percentage of Population Employed in Legal Services & Support in Livonia, MI?
Top Zip Codes with the Highest Percentage of Population Employed in Legal Services & Support in Livonia, MI are:
What zip code has the Highest Percentage of Population Employed in Legal Services & Support in Livonia, MI?
48152 has the Highest Percentage of Population Employed in Legal Services & Support in Livonia, MI with 1.5%.
What is the Percentage of Population Employed in Legal Services & Support in Livonia, MI?
Percentage of Population Employed in Legal Services & Support in Livonia is 1.0%.
What is the Percentage of Population Employed in Legal Services & Support in Michigan?
Percentage of Population Employed in Legal Services & Support in Michigan is 0.89%.
What is the Percentage of Population Employed in Legal Services & Support in the United States?
Percentage of Population Employed in Legal Services & Support in the United States is 1.2%.