Zip Codes with the Highest Percentage of Population Employed in Legal Services & Support in Clarkston, MI
RELATED REPORTS & OPTIONS
Legal Services & Support
Clarkston
Compare Zip Codes
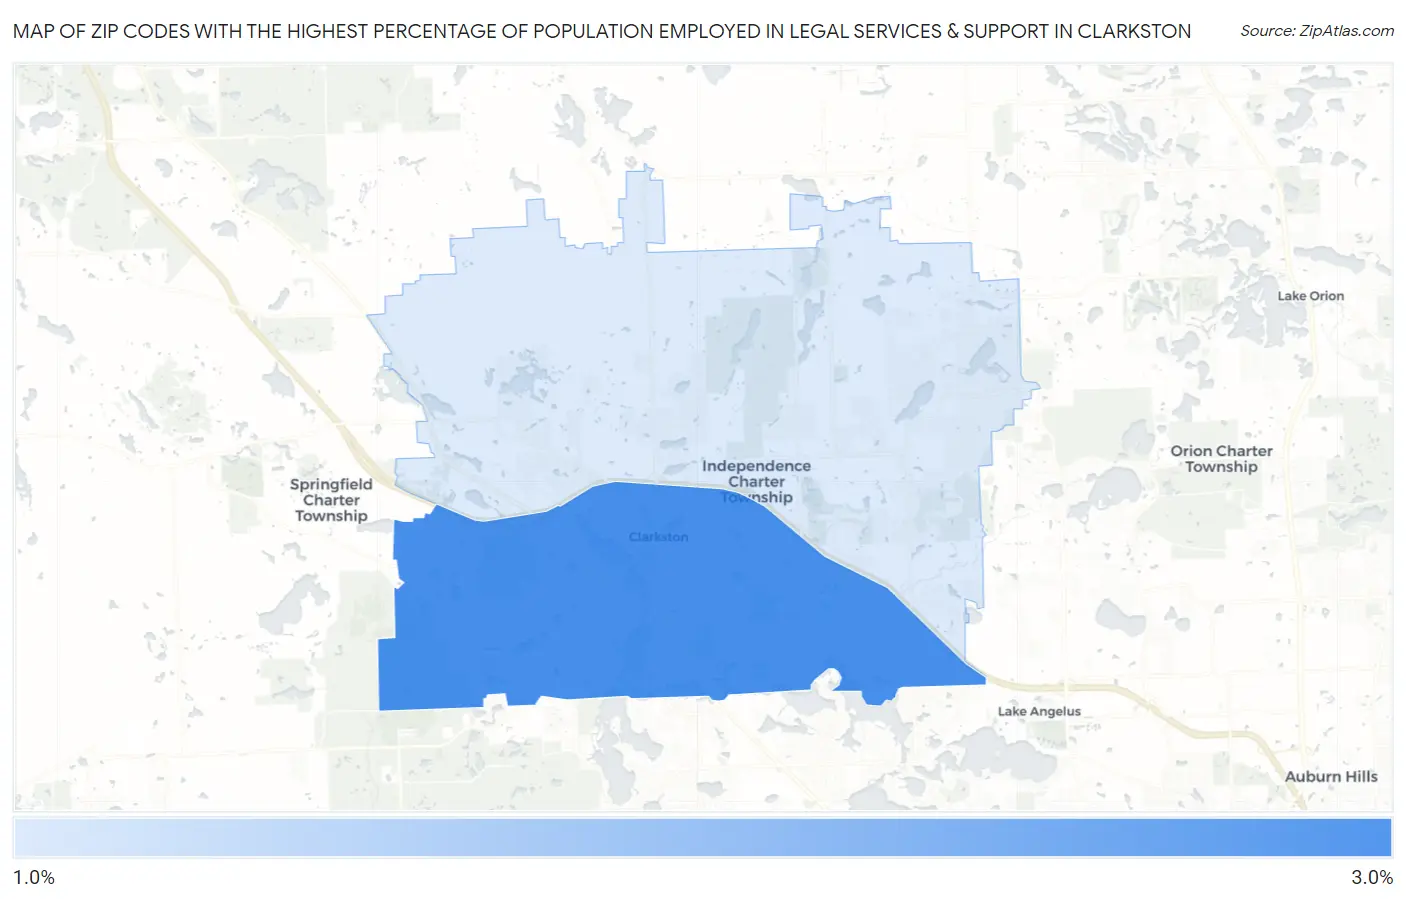
Map of Zip Codes with the Highest Percentage of Population Employed in Legal Services & Support in Clarkston
1.5%
2.6%
Zip Codes with the Highest Percentage of Population Employed in Legal Services & Support in Clarkston, MI
| Zip Code | % Employed | vs State | vs National | |
| 1. | 48346 | 2.6% | 0.89%(+1.70)#33 | 1.2%(+1.40)#2,374 |
| 2. | 48348 | 1.5% | 0.89%(+0.606)#111 | 1.2%(+0.307)#5,082 |
1
Common Questions
What are the Top Zip Codes with the Highest Percentage of Population Employed in Legal Services & Support in Clarkston, MI?
Top Zip Codes with the Highest Percentage of Population Employed in Legal Services & Support in Clarkston, MI are:
What zip code has the Highest Percentage of Population Employed in Legal Services & Support in Clarkston, MI?
48346 has the Highest Percentage of Population Employed in Legal Services & Support in Clarkston, MI with 2.6%.
What is the Percentage of Population Employed in Legal Services & Support in Michigan?
Percentage of Population Employed in Legal Services & Support in Michigan is 0.89%.
What is the Percentage of Population Employed in Legal Services & Support in the United States?
Percentage of Population Employed in Legal Services & Support in the United States is 1.2%.