Zip Codes with the Highest Percentage of Population Employed in Arts, Entertainment & Recreation in Detroit, MI
RELATED REPORTS & OPTIONS
Arts, Entertainment & Recreation
Detroit
Compare Zip Codes
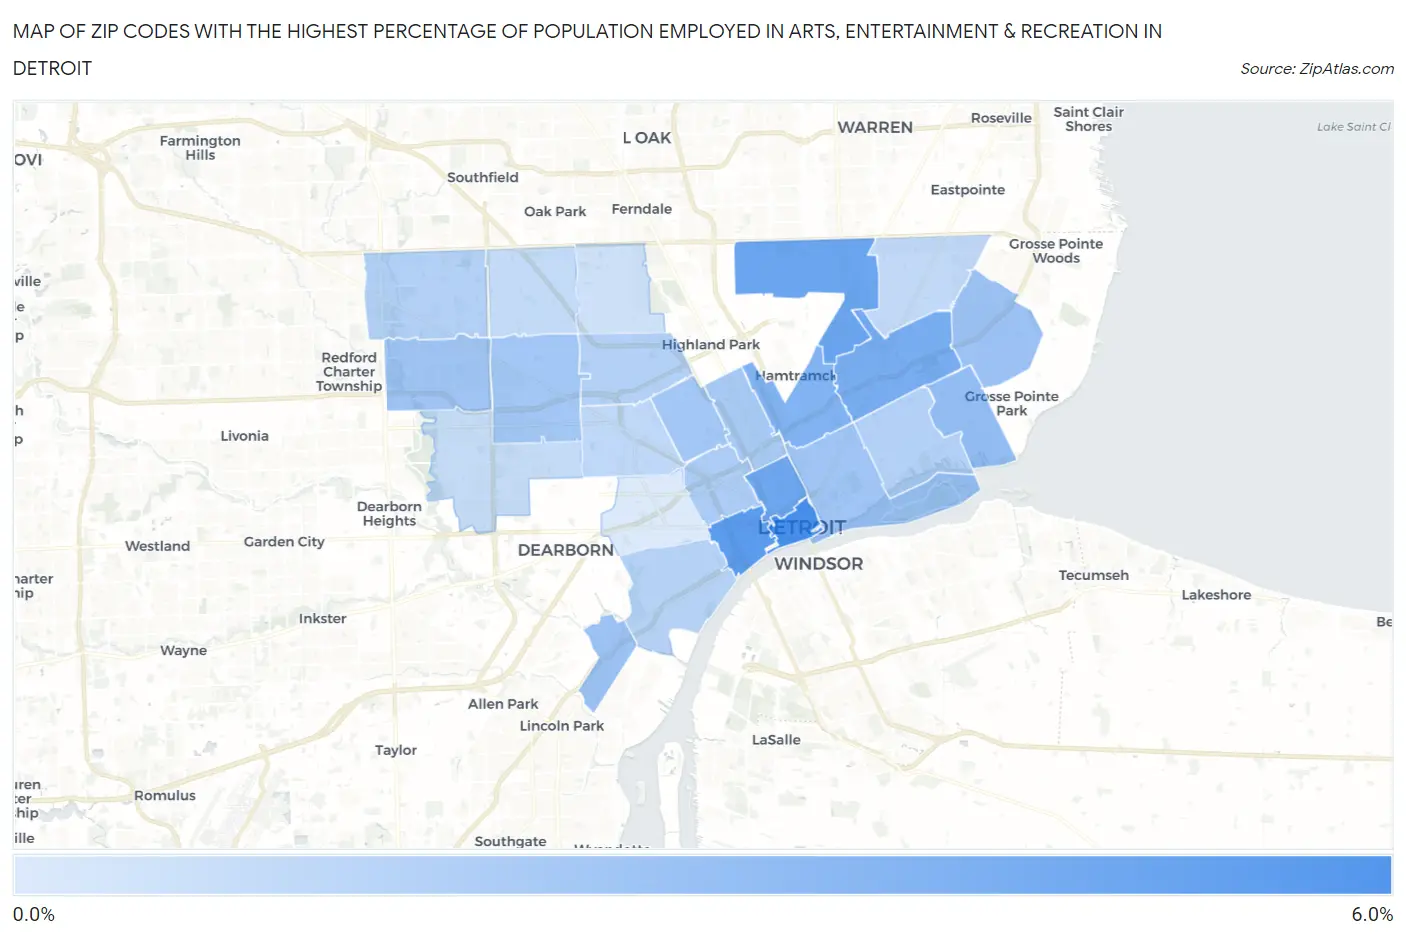
Map of Zip Codes with the Highest Percentage of Population Employed in Arts, Entertainment & Recreation in Detroit
0.0%
6.0%
Zip Codes with the Highest Percentage of Population Employed in Arts, Entertainment & Recreation in Detroit, MI
| Zip Code | % Employed | vs State | vs National | |
| 1. | 48226 | 5.1% | 1.8%(+3.32)#62 | 2.1%(+3.02)#2,205 |
| 2. | 48216 | 4.6% | 1.8%(+2.82)#74 | 2.1%(+2.52)#2,626 |
| 3. | 48234 | 4.1% | 1.8%(+2.29)#88 | 2.1%(+1.99)#3,236 |
| 4. | 48201 | 4.0% | 1.8%(+2.19)#91 | 2.1%(+1.89)#3,374 |
| 5. | 48213 | 3.8% | 1.8%(+1.97)#102 | 2.1%(+1.67)#3,702 |
| 6. | 48211 | 3.5% | 1.8%(+1.70)#113 | 2.1%(+1.40)#4,172 |
| 7. | 48215 | 3.0% | 1.8%(+1.16)#152 | 2.1%(+0.867)#5,502 |
| 8. | 48217 | 2.7% | 1.8%(+0.958)#176 | 2.1%(+0.662)#6,214 |
| 9. | 48224 | 2.7% | 1.8%(+0.900)#186 | 2.1%(+0.603)#6,411 |
| 10. | 48207 | 2.6% | 1.8%(+0.794)#193 | 2.1%(+0.497)#6,833 |
| 11. | 48223 | 2.5% | 1.8%(+0.755)#199 | 2.1%(+0.459)#6,996 |
| 12. | 48206 | 2.5% | 1.8%(+0.743)#201 | 2.1%(+0.447)#7,050 |
| 13. | 48227 | 2.5% | 1.8%(+0.697)#207 | 2.1%(+0.401)#7,245 |
| 14. | 48202 | 2.4% | 1.8%(+0.595)#227 | 2.1%(+0.299)#7,730 |
| 15. | 48208 | 2.2% | 1.8%(+0.459)#256 | 2.1%(+0.163)#8,402 |
| 16. | 48219 | 2.1% | 1.8%(+0.295)#287 | 2.1%(-0.001)#9,317 |
| 17. | 48238 | 2.1% | 1.8%(+0.270)#297 | 2.1%(-0.026)#9,456 |
| 18. | 48214 | 2.0% | 1.8%(+0.244)#302 | 2.1%(-0.052)#9,599 |
| 19. | 48209 | 2.0% | 1.8%(+0.183)#320 | 2.1%(-0.113)#9,957 |
| 20. | 48204 | 1.8% | 1.8%(-0.035)#379 | 2.1%(-0.331)#11,360 |
| 21. | 48205 | 1.7% | 1.8%(-0.089)#397 | 2.1%(-0.385)#11,745 |
| 22. | 48235 | 1.6% | 1.8%(-0.177)#428 | 2.1%(-0.474)#12,400 |
| 23. | 48228 | 1.5% | 1.8%(-0.245)#448 | 2.1%(-0.541)#12,946 |
| 24. | 48221 | 1.3% | 1.8%(-0.482)#528 | 2.1%(-0.778)#14,690 |
| 25. | 48210 | 0.91% | 1.8%(-0.872)#632 | 2.1%(-1.17)#17,579 |
1
Common Questions
What are the Top 10 Zip Codes with the Highest Percentage of Population Employed in Arts, Entertainment & Recreation in Detroit, MI?
Top 10 Zip Codes with the Highest Percentage of Population Employed in Arts, Entertainment & Recreation in Detroit, MI are:
What zip code has the Highest Percentage of Population Employed in Arts, Entertainment & Recreation in Detroit, MI?
48226 has the Highest Percentage of Population Employed in Arts, Entertainment & Recreation in Detroit, MI with 5.1%.
What is the Percentage of Population Employed in Arts, Entertainment & Recreation in Detroit, MI?
Percentage of Population Employed in Arts, Entertainment & Recreation in Detroit is 2.3%.
What is the Percentage of Population Employed in Arts, Entertainment & Recreation in Michigan?
Percentage of Population Employed in Arts, Entertainment & Recreation in Michigan is 1.8%.
What is the Percentage of Population Employed in Arts, Entertainment & Recreation in the United States?
Percentage of Population Employed in Arts, Entertainment & Recreation in the United States is 2.1%.