Zip Codes with the Highest Percentage of Population Employed in Food Preparation & Serving in Waldorf, MD
RELATED REPORTS & OPTIONS
Food Preparation & Serving
Waldorf
Compare Zip Codes
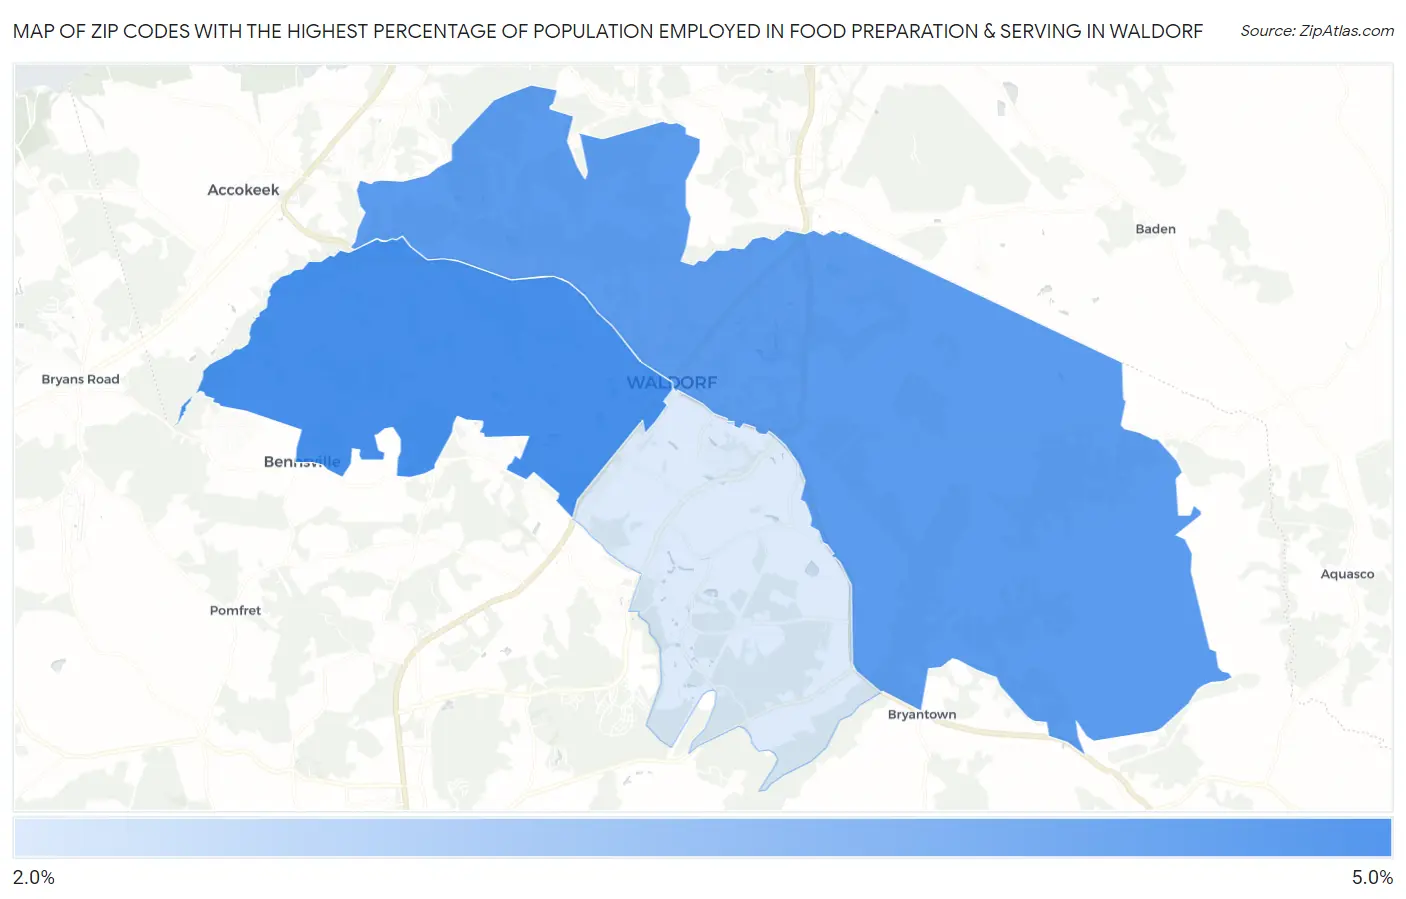
Map of Zip Codes with the Highest Percentage of Population Employed in Food Preparation & Serving in Waldorf
2.4%
4.6%
Zip Codes with the Highest Percentage of Population Employed in Food Preparation & Serving in Waldorf, MD
| Zip Code | % Employed | vs State | vs National | |
| 1. | 20603 | 4.6% | 4.4%(+0.217)#168 | 5.3%(-0.688)#14,607 |
| 2. | 20601 | 4.3% | 4.4%(-0.043)#186 | 5.3%(-0.948)#15,713 |
| 3. | 20602 | 2.4% | 4.4%(-1.98)#320 | 5.3%(-2.89)#23,468 |
1
Common Questions
What are the Top Zip Codes with the Highest Percentage of Population Employed in Food Preparation & Serving in Waldorf, MD?
Top Zip Codes with the Highest Percentage of Population Employed in Food Preparation & Serving in Waldorf, MD are:
What zip code has the Highest Percentage of Population Employed in Food Preparation & Serving in Waldorf, MD?
20603 has the Highest Percentage of Population Employed in Food Preparation & Serving in Waldorf, MD with 4.6%.
What is the Percentage of Population Employed in Food Preparation & Serving in Waldorf, MD?
Percentage of Population Employed in Food Preparation & Serving in Waldorf is 3.6%.
What is the Percentage of Population Employed in Food Preparation & Serving in Maryland?
Percentage of Population Employed in Food Preparation & Serving in Maryland is 4.4%.
What is the Percentage of Population Employed in Food Preparation & Serving in the United States?
Percentage of Population Employed in Food Preparation & Serving in the United States is 5.3%.