Zip Codes with the Highest Percentage of Population Employed in Food Preparation & Serving in Upper Marlboro, MD
RELATED REPORTS & OPTIONS
Food Preparation & Serving
Upper Marlboro
Compare Zip Codes
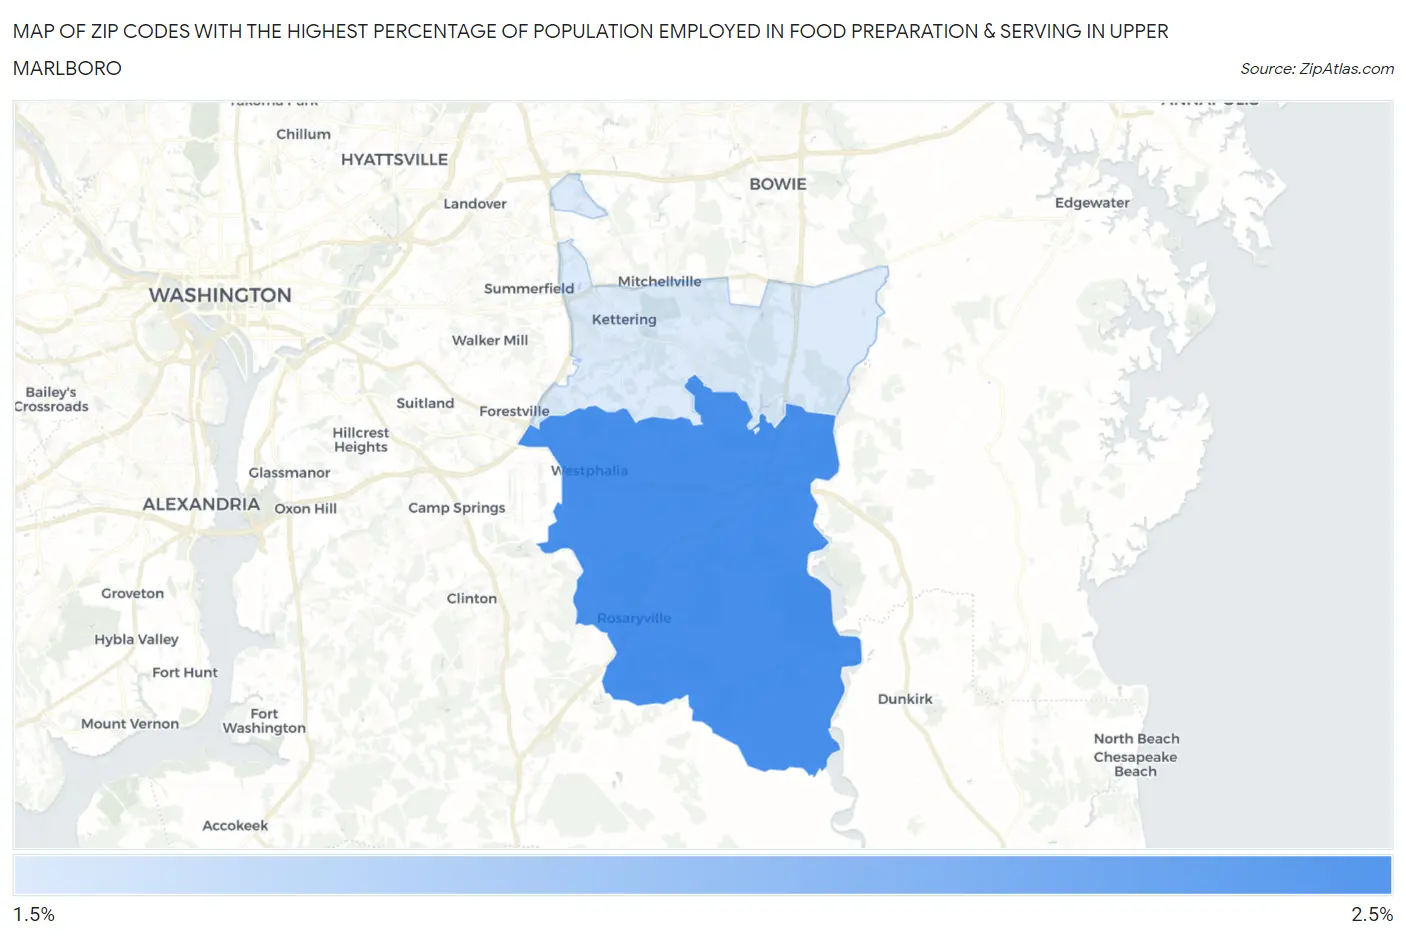
Map of Zip Codes with the Highest Percentage of Population Employed in Food Preparation & Serving in Upper Marlboro
1.8%
2.1%
Zip Codes with the Highest Percentage of Population Employed in Food Preparation & Serving in Upper Marlboro, MD
| Zip Code | % Employed | vs State | vs National | |
| 1. | 20772 | 2.1% | 4.4%(-2.27)#335 | 5.3%(-3.18)#24,370 |
| 2. | 20774 | 1.8% | 4.4%(-2.56)#350 | 5.3%(-3.47)#25,226 |
1
Common Questions
What are the Top Zip Codes with the Highest Percentage of Population Employed in Food Preparation & Serving in Upper Marlboro, MD?
Top Zip Codes with the Highest Percentage of Population Employed in Food Preparation & Serving in Upper Marlboro, MD are:
What zip code has the Highest Percentage of Population Employed in Food Preparation & Serving in Upper Marlboro, MD?
20772 has the Highest Percentage of Population Employed in Food Preparation & Serving in Upper Marlboro, MD with 2.1%.
What is the Percentage of Population Employed in Food Preparation & Serving in Upper Marlboro, MD?
Percentage of Population Employed in Food Preparation & Serving in Upper Marlboro is 1.9%.
What is the Percentage of Population Employed in Food Preparation & Serving in Maryland?
Percentage of Population Employed in Food Preparation & Serving in Maryland is 4.4%.
What is the Percentage of Population Employed in Food Preparation & Serving in the United States?
Percentage of Population Employed in Food Preparation & Serving in the United States is 5.3%.