Zip Codes with the Highest Percentage of Population Employed in Security & Protection in Ellicott City, MD
RELATED REPORTS & OPTIONS
Security & Protection
Ellicott City
Compare Zip Codes
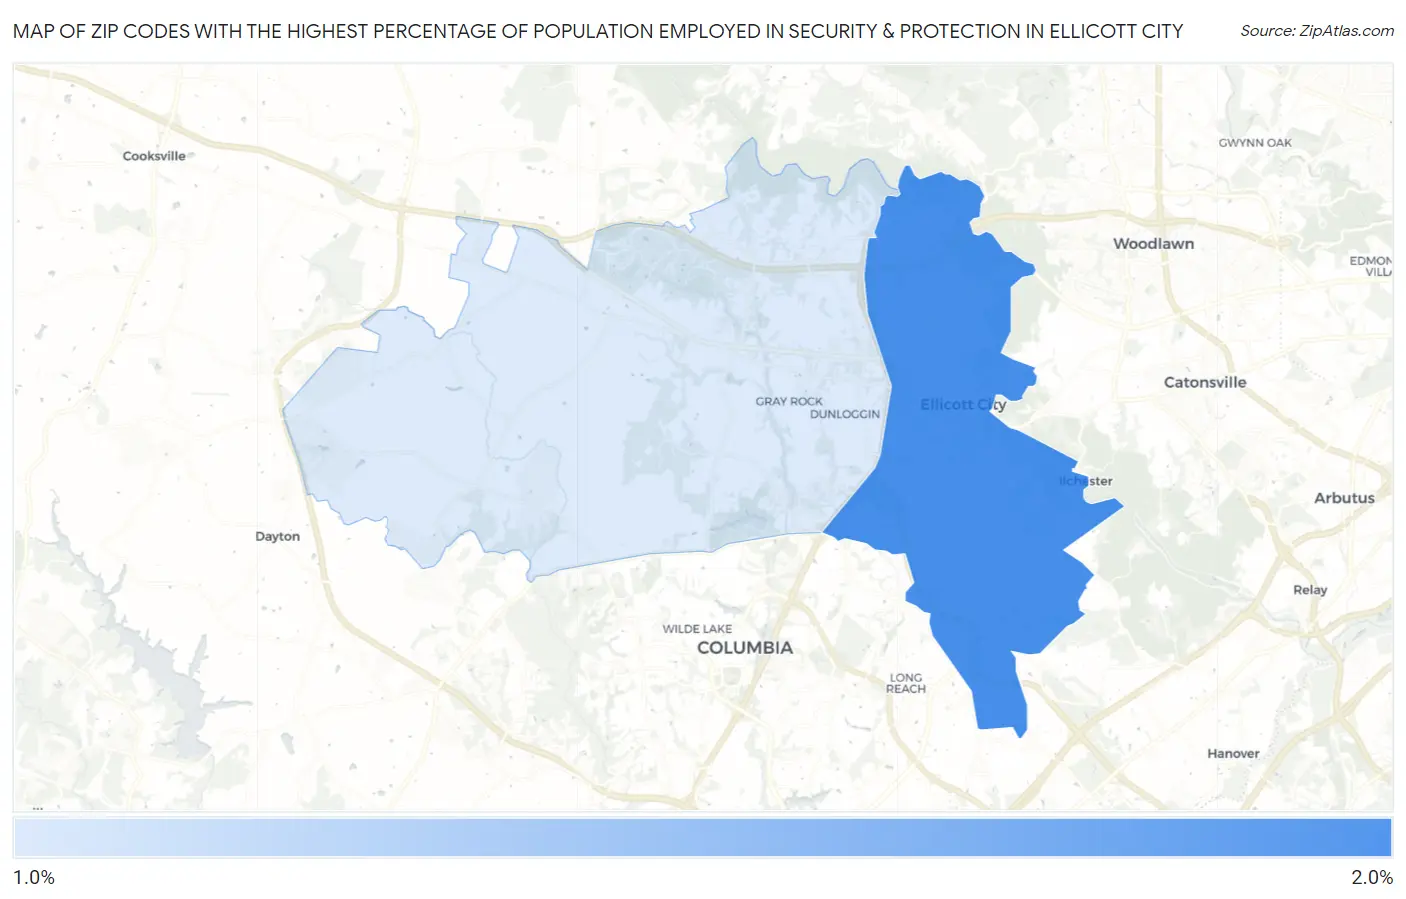
Map of Zip Codes with the Highest Percentage of Population Employed in Security & Protection in Ellicott City
1.5%
1.8%
Zip Codes with the Highest Percentage of Population Employed in Security & Protection in Ellicott City, MD
| Zip Code | % Employed | vs State | vs National | |
| 1. | 21043 | 1.8% | 2.8%(-0.956)#270 | 2.1%(-0.307)#13,631 |
| 2. | 21042 | 1.5% | 2.8%(-1.34)#300 | 2.1%(-0.692)#16,519 |
1
Common Questions
What are the Top Zip Codes with the Highest Percentage of Population Employed in Security & Protection in Ellicott City, MD?
Top Zip Codes with the Highest Percentage of Population Employed in Security & Protection in Ellicott City, MD are:
What zip code has the Highest Percentage of Population Employed in Security & Protection in Ellicott City, MD?
21043 has the Highest Percentage of Population Employed in Security & Protection in Ellicott City, MD with 1.8%.
What is the Percentage of Population Employed in Security & Protection in Ellicott City, MD?
Percentage of Population Employed in Security & Protection in Ellicott City is 1.7%.
What is the Percentage of Population Employed in Security & Protection in Maryland?
Percentage of Population Employed in Security & Protection in Maryland is 2.8%.
What is the Percentage of Population Employed in Security & Protection in the United States?
Percentage of Population Employed in Security & Protection in the United States is 2.1%.