Zip Codes with the Highest Percentage of Families with Income Above $100,000 in Worcester, MA
RELATED REPORTS & OPTIONS
Family Income | $100k+
Worcester
Compare Zip Codes
Map of Zip Codes with the Highest Percentage of Families with Income Above $100,000 in Worcester
11.4%
54.3%
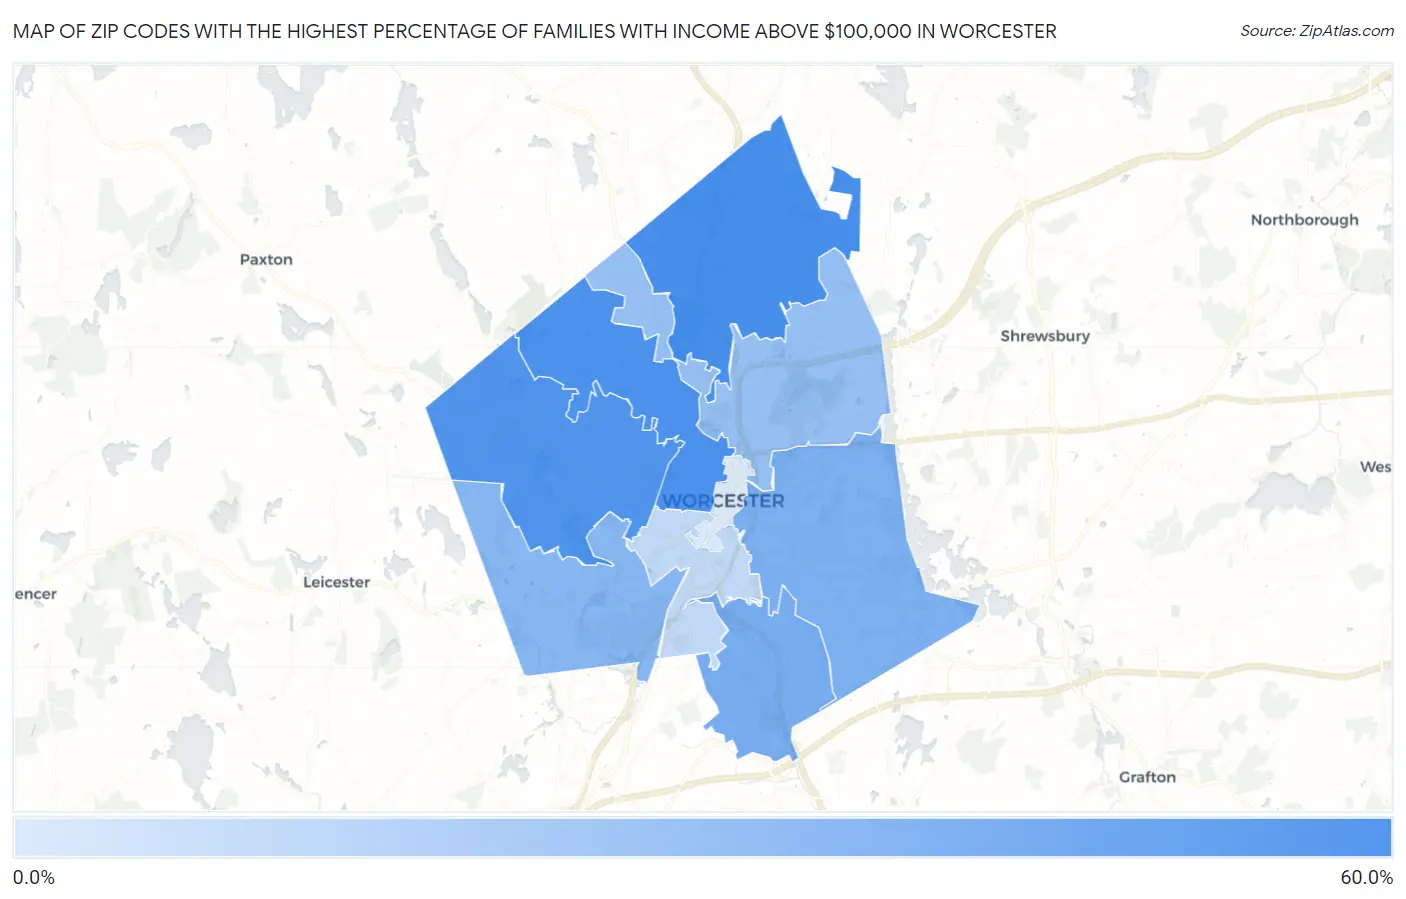
Zip Codes with the Highest Percentage of Families with Income Above $100,000 in Worcester, MA
| Zip Code | Families with Income > $100k | vs State | vs National | |
| 1. | 01606 | 54.3% | 59.5%(-5.20)#340 | 46.1%(+8.20)#7,061 |
| 2. | 01609 | 52.6% | 59.5%(-6.90)#357 | 46.1%(+6.50)#7,703 |
| 3. | 01602 | 51.5% | 59.5%(-8.00)#364 | 46.1%(+5.40)#8,200 |
| 4. | 01607 | 38.9% | 59.5%(-20.6)#455 | 46.1%(-7.20)#15,157 |
| 5. | 01604 | 37.6% | 59.5%(-21.9)#464 | 46.1%(-8.50)#16,033 |
| 6. | 01603 | 34.4% | 59.5%(-25.1)#475 | 46.1%(-11.7)#18,303 |
| 7. | 01605 | 30.3% | 59.5%(-29.2)#489 | 46.1%(-15.8)#21,186 |
| 8. | 01610 | 18.2% | 59.5%(-41.3)#514 | 46.1%(-27.9)#27,985 |
| 9. | 01608 | 11.4% | 59.5%(-48.1)#519 | 46.1%(-34.7)#30,073 |
1
Common Questions
What are the Top 5 Zip Codes with the Highest Percentage of Families with Income Above $100,000 in Worcester, MA?
Top 5 Zip Codes with the Highest Percentage of Families with Income Above $100,000 in Worcester, MA are:
What zip code has the Highest Percentage of Families with Income Above $100,000 in Worcester, MA?
01606 has the Highest Percentage of Families with Income Above $100,000 in Worcester, MA with 54.3%.
What is the Percentage of Families with Income Above $100,000 in Worcester, MA?
Percentage of Families with Income Above $100,000 in Worcester is 38.9%.
What is the Percentage of Families with Income Above $100,000 in Massachusetts?
Percentage of Families with Income Above $100,000 in Massachusetts is 59.5%.
What is the Percentage of Families with Income Above $100,000 in the United States?
Percentage of Families with Income Above $100,000 in the United States is 46.1%.