Zip Codes with the Highest Percentage of Population Employed in Food Preparation & Serving in Worcester, MA
RELATED REPORTS & OPTIONS
Food Preparation & Serving
Worcester
Compare Zip Codes
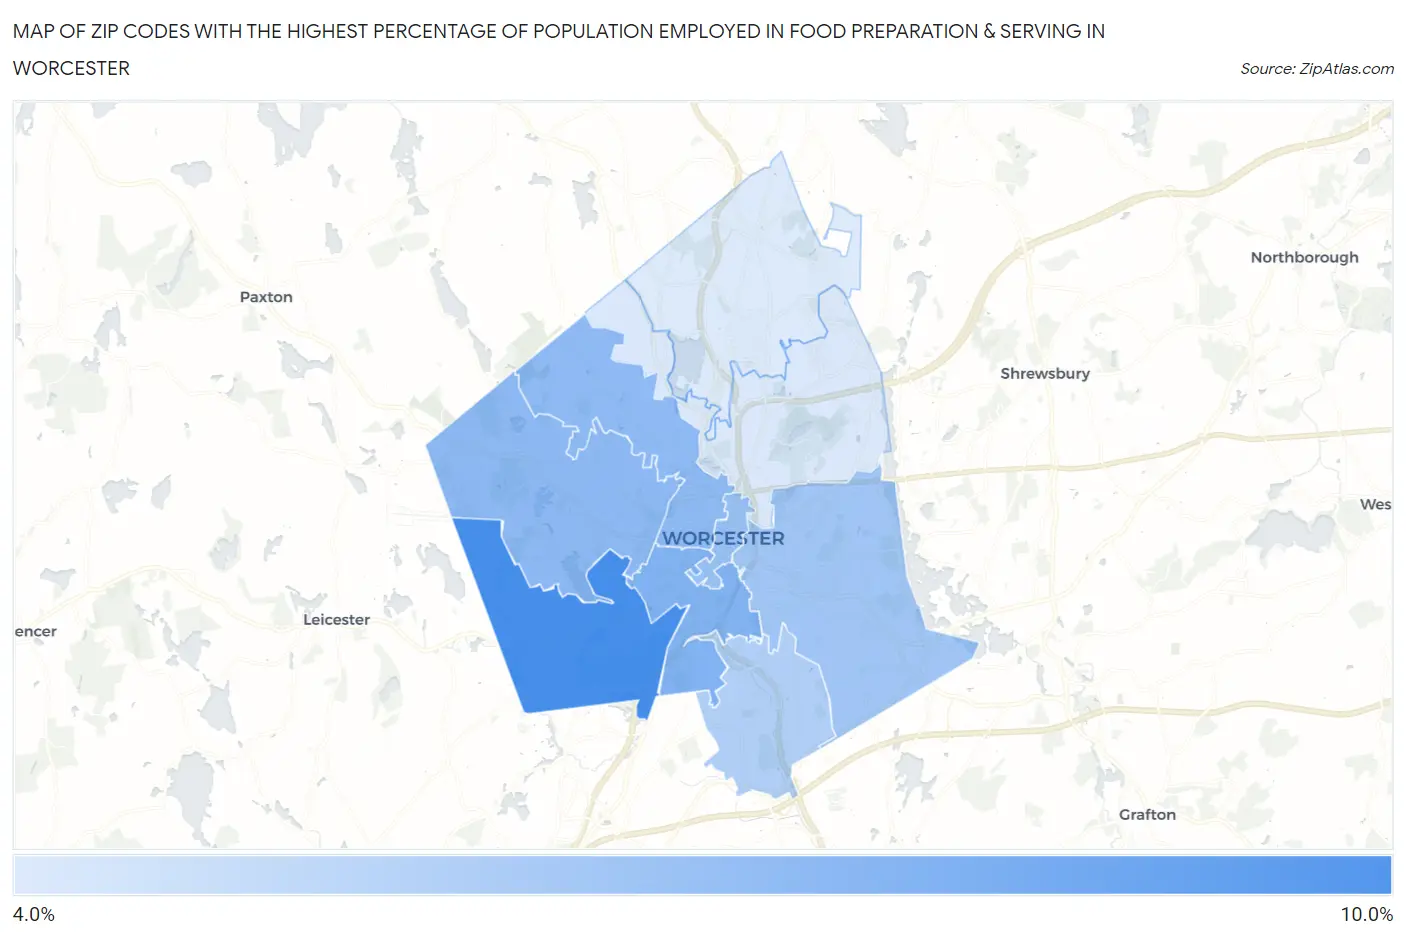
Map of Zip Codes with the Highest Percentage of Population Employed in Food Preparation & Serving in Worcester
4.2%
8.2%
Zip Codes with the Highest Percentage of Population Employed in Food Preparation & Serving in Worcester, MA
| Zip Code | % Employed | vs State | vs National | |
| 1. | 01603 | 8.2% | 4.6%(+3.62)#39 | 5.3%(+2.94)#4,396 |
| 2. | 01610 | 6.7% | 4.6%(+2.07)#81 | 5.3%(+1.39)#7,398 |
| 3. | 01602 | 6.3% | 4.6%(+1.74)#94 | 5.3%(+1.06)#8,279 |
| 4. | 01609 | 6.3% | 4.6%(+1.69)#100 | 5.3%(+1.02)#8,420 |
| 5. | 01608 | 6.0% | 4.6%(+1.44)#111 | 5.3%(+0.762)#9,180 |
| 6. | 01604 | 5.8% | 4.6%(+1.19)#129 | 5.3%(+0.518)#10,025 |
| 7. | 01607 | 5.3% | 4.6%(+0.707)#153 | 5.3%(+0.031)#11,699 |
| 8. | 01605 | 4.3% | 4.6%(-0.351)#243 | 5.3%(-1.03)#16,062 |
| 9. | 01606 | 4.2% | 4.6%(-0.443)#251 | 5.3%(-1.12)#16,435 |
1
Common Questions
What are the Top 5 Zip Codes with the Highest Percentage of Population Employed in Food Preparation & Serving in Worcester, MA?
Top 5 Zip Codes with the Highest Percentage of Population Employed in Food Preparation & Serving in Worcester, MA are:
What zip code has the Highest Percentage of Population Employed in Food Preparation & Serving in Worcester, MA?
01603 has the Highest Percentage of Population Employed in Food Preparation & Serving in Worcester, MA with 8.2%.
What is the Percentage of Population Employed in Food Preparation & Serving in Worcester, MA?
Percentage of Population Employed in Food Preparation & Serving in Worcester is 5.9%.
What is the Percentage of Population Employed in Food Preparation & Serving in Massachusetts?
Percentage of Population Employed in Food Preparation & Serving in Massachusetts is 4.6%.
What is the Percentage of Population Employed in Food Preparation & Serving in the United States?
Percentage of Population Employed in Food Preparation & Serving in the United States is 5.3%.