Zip Codes with the Highest Percentage of Population with a Degree in Arts and Humanities in Lowell, MA
RELATED REPORTS & OPTIONS
Arts and Humanities
Lowell
Compare Zip Codes
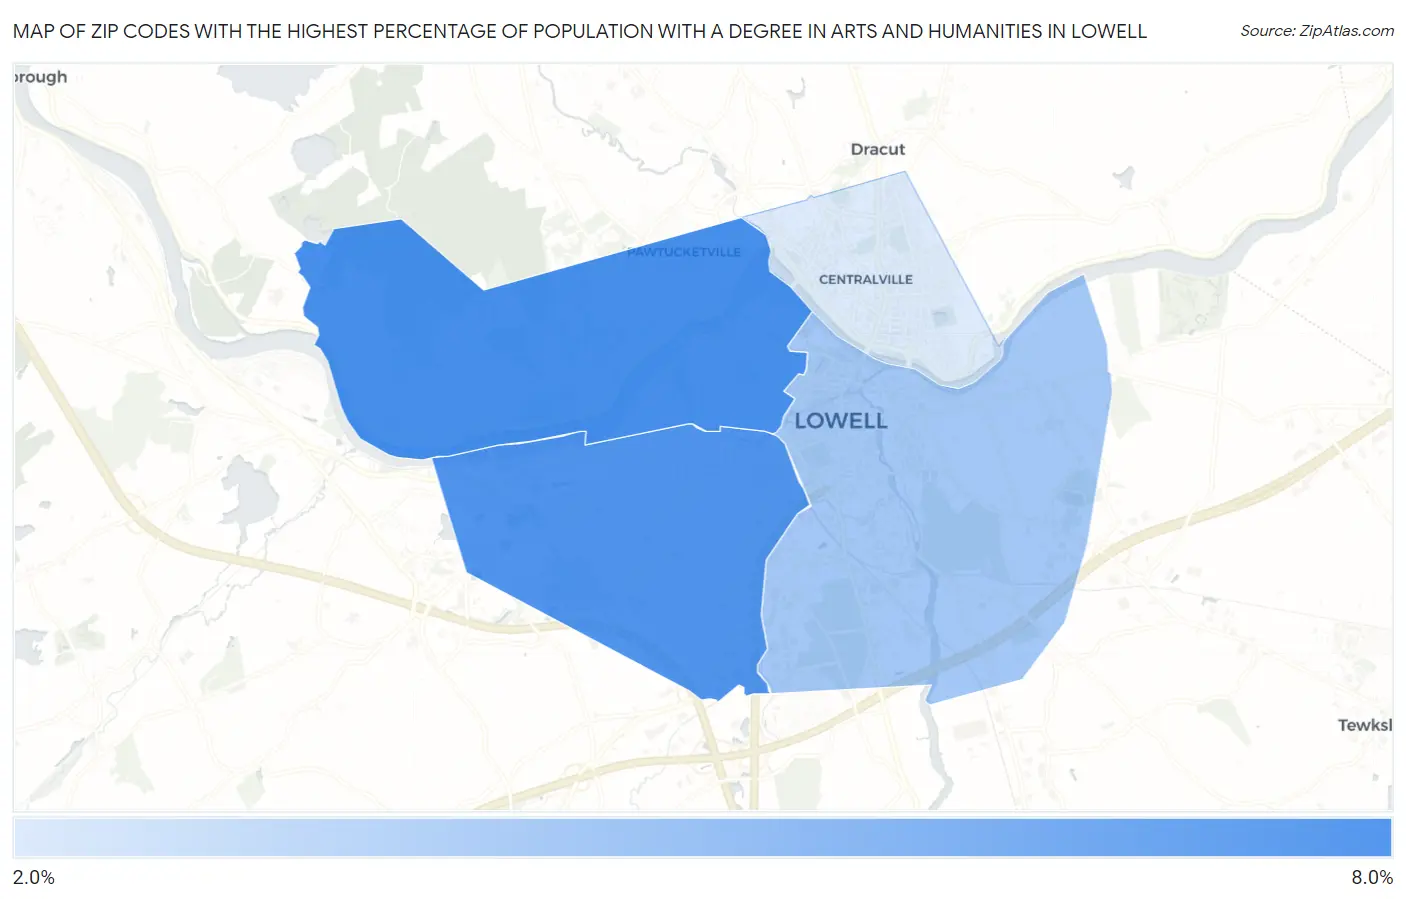
Map of Zip Codes with the Highest Percentage of Population with a Degree in Arts and Humanities in Lowell
2.3%
6.4%
Zip Codes with the Highest Percentage of Population with a Degree in Arts and Humanities in Lowell, MA
| Zip Code | % Graduates | vs State | vs National | |
| 1. | 01854 | 6.4% | 5.2%(+1.20)#175 | 6.0%(+0.364)#13,635 |
| 2. | 01851 | 6.2% | 5.2%(+1.02)#182 | 6.0%(+0.182)#14,157 |
| 3. | 01852 | 3.9% | 5.2%(-1.30)#356 | 6.0%(-2.14)#20,700 |
| 4. | 01850 | 2.3% | 5.2%(-2.85)#441 | 6.0%(-3.69)#23,910 |
1
Common Questions
What are the Top 3 Zip Codes with the Highest Percentage of Population with a Degree in Arts and Humanities in Lowell, MA?
Top 3 Zip Codes with the Highest Percentage of Population with a Degree in Arts and Humanities in Lowell, MA are:
What zip code has the Highest Percentage of Population with a Degree in Arts and Humanities in Lowell, MA?
01854 has the Highest Percentage of Population with a Degree in Arts and Humanities in Lowell, MA with 6.4%.
What is the Percentage of Population with a Degree in Arts and Humanities in Lowell, MA?
Percentage of Population with a Degree in Arts and Humanities in Lowell is 5.0%.
What is the Percentage of Population with a Degree in Arts and Humanities in Massachusetts?
Percentage of Population with a Degree in Arts and Humanities in Massachusetts is 5.2%.
What is the Percentage of Population with a Degree in Arts and Humanities in the United States?
Percentage of Population with a Degree in Arts and Humanities in the United States is 6.0%.