Yugoslavian vs Mongolian In Labor Force | Age 20-24
COMPARE
Yugoslavian
Mongolian
In Labor Force | Age 20-24
In Labor Force | Age 20-24 Comparison
Yugoslavians
Mongolians
78.0%
IN LABOR FORCE | AGE 20-24
100.0/ 100
METRIC RATING
23rd/ 347
METRIC RANK
73.3%
IN LABOR FORCE | AGE 20-24
0.2/ 100
METRIC RATING
276th/ 347
METRIC RANK
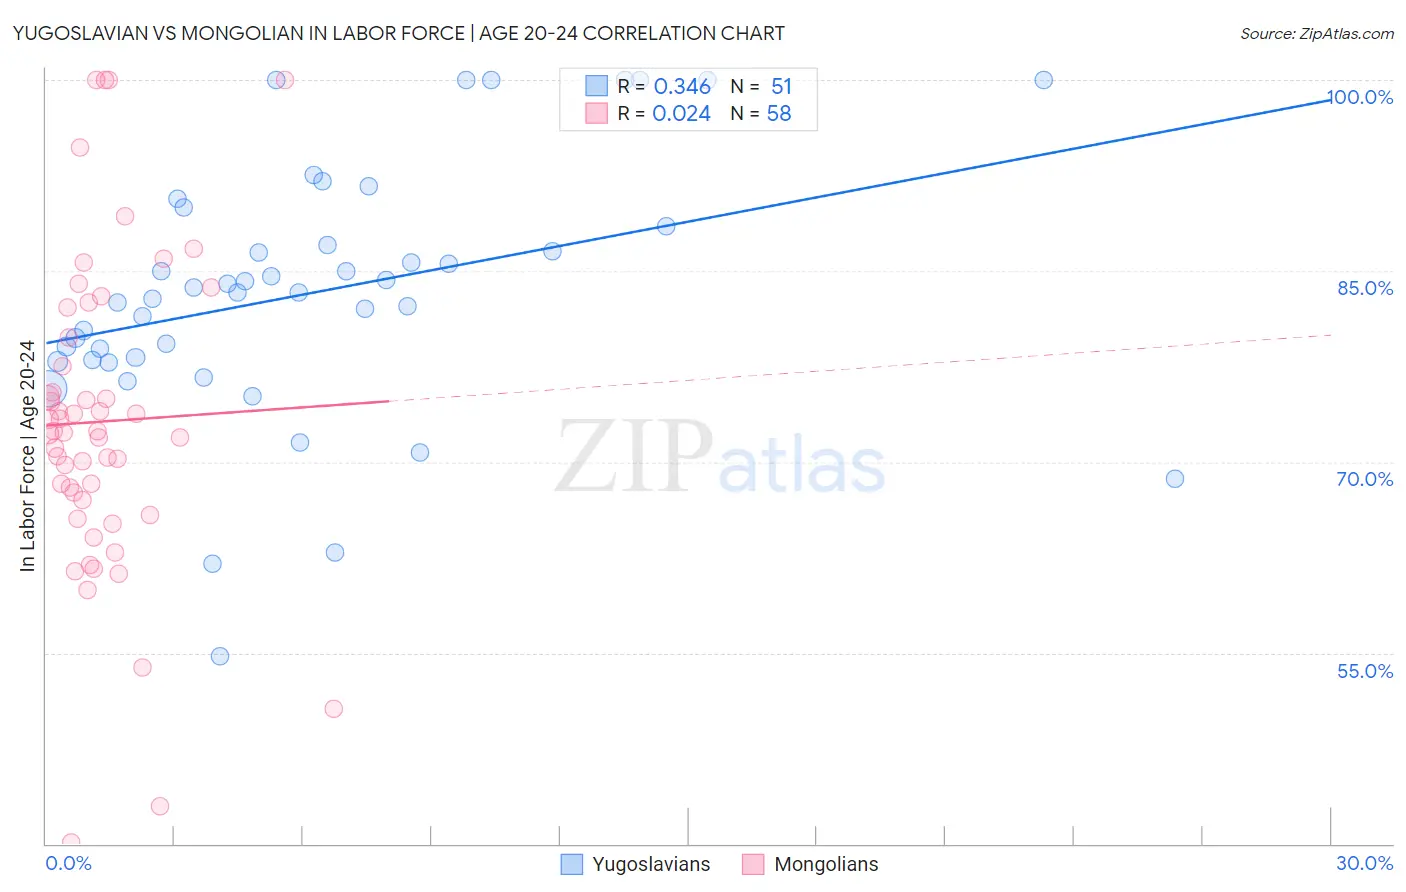
Yugoslavian vs Mongolian In Labor Force | Age 20-24 Correlation Chart
The statistical analysis conducted on geographies consisting of 285,583,037 people shows a mild positive correlation between the proportion of Yugoslavians and labor force participation rate among population between the ages 20 and 24 in the United States with a correlation coefficient (R) of 0.346 and weighted average of 78.0%. Similarly, the statistical analysis conducted on geographies consisting of 140,358,526 people shows no correlation between the proportion of Mongolians and labor force participation rate among population between the ages 20 and 24 in the United States with a correlation coefficient (R) of 0.024 and weighted average of 73.3%, a difference of 6.3%.
In Labor Force | Age 20-24 Correlation Summary
| Measurement | Yugoslavian | Mongolian |
| Minimum | 54.7% | 40.1% |
| Maximum | 100.0% | 100.0% |
| Range | 45.3% | 59.9% |
| Mean | 83.3% | 73.2% |
| Median | 83.3% | 72.4% |
| Interquartile 25% (IQ1) | 78.0% | 67.0% |
| Interquartile 75% (IQ3) | 88.5% | 79.7% |
| Interquartile Range (IQR) | 10.5% | 12.8% |
| Standard Deviation (Sample) | 10.0% | 12.5% |
| Standard Deviation (Population) | 9.9% | 12.4% |
Similar Demographics by In Labor Force | Age 20-24
Demographics Similar to Yugoslavians by In Labor Force | Age 20-24
In terms of in labor force | age 20-24, the demographic groups most similar to Yugoslavians are Liberian (78.0%, a difference of 0.0%), Pennsylvania German (78.0%, a difference of 0.010%), Tlingit-Haida (77.9%, a difference of 0.040%), Tongan (77.9%, a difference of 0.060%), and Puget Sound Salish (78.0%, a difference of 0.070%).
| Demographics | Rating | Rank | In Labor Force | Age 20-24 |
| Dutch | 100.0 /100 | #16 | Exceptional 78.4% |
| Cape Verdeans | 100.0 /100 | #17 | Exceptional 78.3% |
| Immigrants | Bosnia and Herzegovina | 100.0 /100 | #18 | Exceptional 78.1% |
| Bangladeshis | 100.0 /100 | #19 | Exceptional 78.1% |
| French Canadians | 100.0 /100 | #20 | Exceptional 78.1% |
| Puget Sound Salish | 100.0 /100 | #21 | Exceptional 78.0% |
| Pennsylvania Germans | 100.0 /100 | #22 | Exceptional 78.0% |
| Yugoslavians | 100.0 /100 | #23 | Exceptional 78.0% |
| Liberians | 100.0 /100 | #24 | Exceptional 78.0% |
| Tlingit-Haida | 100.0 /100 | #25 | Exceptional 77.9% |
| Tongans | 100.0 /100 | #26 | Exceptional 77.9% |
| Immigrants | Micronesia | 100.0 /100 | #27 | Exceptional 77.8% |
| Belgians | 100.0 /100 | #28 | Exceptional 77.8% |
| Slovaks | 100.0 /100 | #29 | Exceptional 77.7% |
| Swiss | 100.0 /100 | #30 | Exceptional 77.7% |
Demographics Similar to Mongolians by In Labor Force | Age 20-24
In terms of in labor force | age 20-24, the demographic groups most similar to Mongolians are Immigrants from South America (73.3%, a difference of 0.010%), Immigrants from Malaysia (73.3%, a difference of 0.010%), Cypriot (73.3%, a difference of 0.030%), Venezuelan (73.3%, a difference of 0.030%), and Immigrants from Colombia (73.4%, a difference of 0.070%).
| Demographics | Rating | Rank | In Labor Force | Age 20-24 |
| Colombians | 0.3 /100 | #269 | Tragic 73.5% |
| Immigrants | Russia | 0.3 /100 | #270 | Tragic 73.5% |
| Immigrants | Indonesia | 0.3 /100 | #271 | Tragic 73.4% |
| Belizeans | 0.3 /100 | #272 | Tragic 73.4% |
| Cheyenne | 0.2 /100 | #273 | Tragic 73.4% |
| Immigrants | Colombia | 0.2 /100 | #274 | Tragic 73.4% |
| Immigrants | South America | 0.2 /100 | #275 | Tragic 73.3% |
| Mongolians | 0.2 /100 | #276 | Tragic 73.3% |
| Immigrants | Malaysia | 0.2 /100 | #277 | Tragic 73.3% |
| Cypriots | 0.2 /100 | #278 | Tragic 73.3% |
| Venezuelans | 0.2 /100 | #279 | Tragic 73.3% |
| Bahamians | 0.1 /100 | #280 | Tragic 73.3% |
| Immigrants | Venezuela | 0.1 /100 | #281 | Tragic 73.2% |
| Immigrants | Spain | 0.1 /100 | #282 | Tragic 73.2% |
| Immigrants | Bahamas | 0.1 /100 | #283 | Tragic 73.2% |