Immigrants from Belgium vs Mongolian In Labor Force | Age 20-24
COMPARE
Immigrants from Belgium
Mongolian
In Labor Force | Age 20-24
In Labor Force | Age 20-24 Comparison
Immigrants from Belgium
Mongolians
73.9%
IN LABOR FORCE | AGE 20-24
1.3/ 100
METRIC RATING
250th/ 347
METRIC RANK
73.3%
IN LABOR FORCE | AGE 20-24
0.2/ 100
METRIC RATING
276th/ 347
METRIC RANK
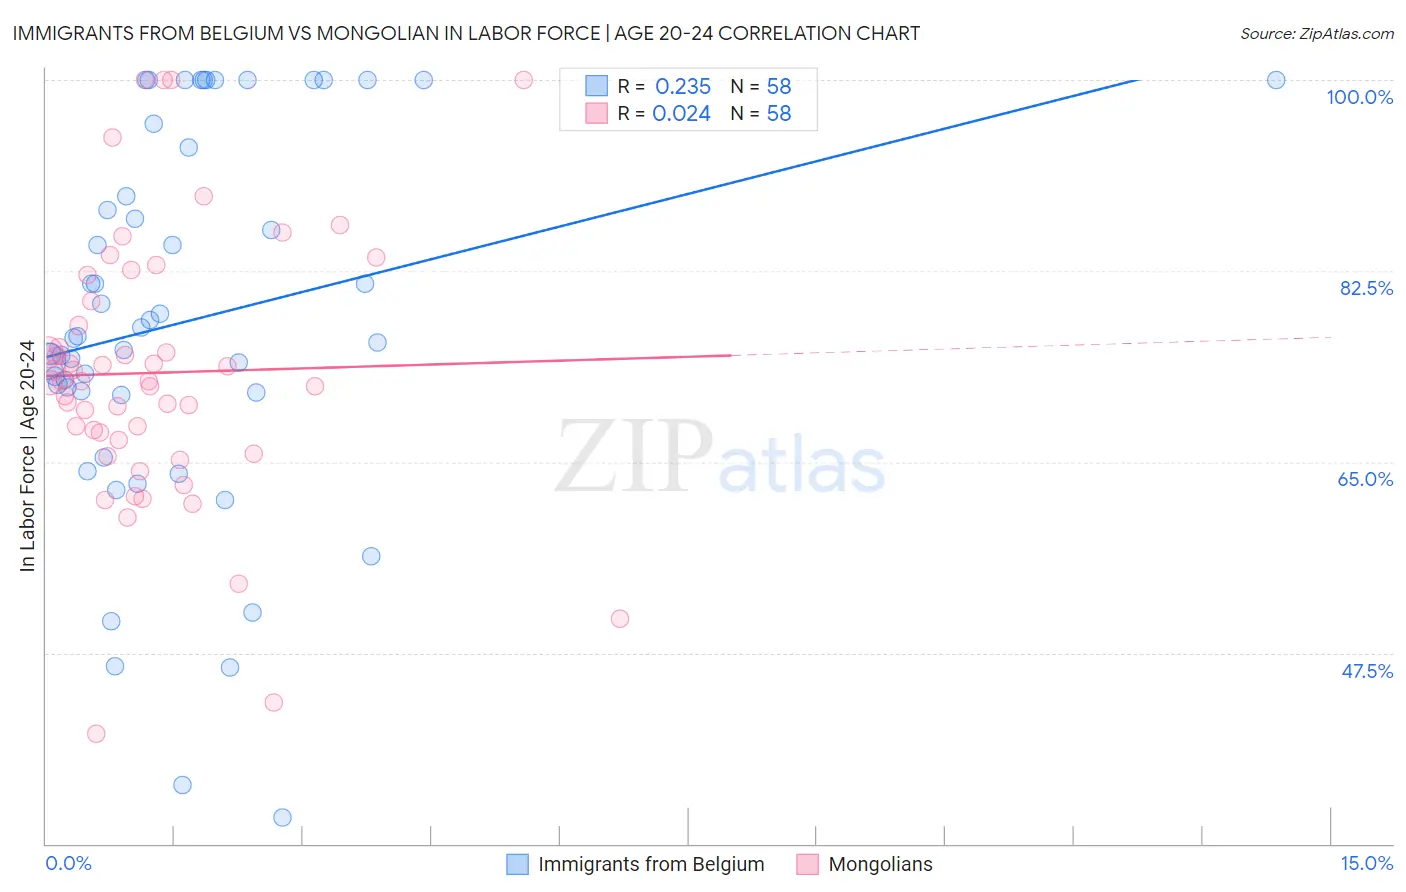
Immigrants from Belgium vs Mongolian In Labor Force | Age 20-24 Correlation Chart
The statistical analysis conducted on geographies consisting of 146,712,766 people shows a weak positive correlation between the proportion of Immigrants from Belgium and labor force participation rate among population between the ages 20 and 24 in the United States with a correlation coefficient (R) of 0.235 and weighted average of 73.9%. Similarly, the statistical analysis conducted on geographies consisting of 140,358,526 people shows no correlation between the proportion of Mongolians and labor force participation rate among population between the ages 20 and 24 in the United States with a correlation coefficient (R) of 0.024 and weighted average of 73.3%, a difference of 0.70%.
In Labor Force | Age 20-24 Correlation Summary
| Measurement | Immigrants from Belgium | Mongolian |
| Minimum | 32.4% | 40.1% |
| Maximum | 100.0% | 100.0% |
| Range | 67.6% | 59.9% |
| Mean | 77.9% | 73.2% |
| Median | 76.4% | 72.4% |
| Interquartile 25% (IQ1) | 71.4% | 67.0% |
| Interquartile 75% (IQ3) | 93.8% | 79.7% |
| Interquartile Range (IQR) | 22.4% | 12.8% |
| Standard Deviation (Sample) | 17.2% | 12.5% |
| Standard Deviation (Population) | 17.1% | 12.4% |
Similar Demographics by In Labor Force | Age 20-24
Demographics Similar to Immigrants from Belgium by In Labor Force | Age 20-24
In terms of in labor force | age 20-24, the demographic groups most similar to Immigrants from Belgium are Black/African American (73.9%, a difference of 0.0%), Immigrants from Egypt (73.8%, a difference of 0.020%), Immigrants from Kazakhstan (73.8%, a difference of 0.040%), Immigrants from Saudi Arabia (73.9%, a difference of 0.050%), and Colville (73.9%, a difference of 0.060%).
| Demographics | Rating | Rank | In Labor Force | Age 20-24 |
| Immigrants | Syria | 1.9 /100 | #243 | Tragic 74.0% |
| Immigrants | South Central Asia | 1.9 /100 | #244 | Tragic 74.0% |
| Turks | 1.8 /100 | #245 | Tragic 73.9% |
| Immigrants | Panama | 1.6 /100 | #246 | Tragic 73.9% |
| Colville | 1.5 /100 | #247 | Tragic 73.9% |
| Immigrants | Saudi Arabia | 1.5 /100 | #248 | Tragic 73.9% |
| Blacks/African Americans | 1.3 /100 | #249 | Tragic 73.9% |
| Immigrants | Belgium | 1.3 /100 | #250 | Tragic 73.9% |
| Immigrants | Egypt | 1.2 /100 | #251 | Tragic 73.8% |
| Immigrants | Kazakhstan | 1.1 /100 | #252 | Tragic 73.8% |
| Arapaho | 1.0 /100 | #253 | Tragic 73.8% |
| Ute | 1.0 /100 | #254 | Tragic 73.8% |
| Immigrants | Pakistan | 0.9 /100 | #255 | Tragic 73.8% |
| Spanish American Indians | 0.8 /100 | #256 | Tragic 73.7% |
| Paraguayans | 0.8 /100 | #257 | Tragic 73.7% |
Demographics Similar to Mongolians by In Labor Force | Age 20-24
In terms of in labor force | age 20-24, the demographic groups most similar to Mongolians are Immigrants from South America (73.3%, a difference of 0.010%), Immigrants from Malaysia (73.3%, a difference of 0.010%), Cypriot (73.3%, a difference of 0.030%), Venezuelan (73.3%, a difference of 0.030%), and Immigrants from Colombia (73.4%, a difference of 0.070%).
| Demographics | Rating | Rank | In Labor Force | Age 20-24 |
| Colombians | 0.3 /100 | #269 | Tragic 73.5% |
| Immigrants | Russia | 0.3 /100 | #270 | Tragic 73.5% |
| Immigrants | Indonesia | 0.3 /100 | #271 | Tragic 73.4% |
| Belizeans | 0.3 /100 | #272 | Tragic 73.4% |
| Cheyenne | 0.2 /100 | #273 | Tragic 73.4% |
| Immigrants | Colombia | 0.2 /100 | #274 | Tragic 73.4% |
| Immigrants | South America | 0.2 /100 | #275 | Tragic 73.3% |
| Mongolians | 0.2 /100 | #276 | Tragic 73.3% |
| Immigrants | Malaysia | 0.2 /100 | #277 | Tragic 73.3% |
| Cypriots | 0.2 /100 | #278 | Tragic 73.3% |
| Venezuelans | 0.2 /100 | #279 | Tragic 73.3% |
| Bahamians | 0.1 /100 | #280 | Tragic 73.3% |
| Immigrants | Venezuela | 0.1 /100 | #281 | Tragic 73.2% |
| Immigrants | Spain | 0.1 /100 | #282 | Tragic 73.2% |
| Immigrants | Bahamas | 0.1 /100 | #283 | Tragic 73.2% |